Embed Size (px)
Citation preview

Technische Universitat Berlin TKNTelecommunication
Networks Group
Scheduling of heterogeneous datastreams in the downlink of a dynamic
OFDM-FDMA wireless cell
Magisterarbeitam Fachgebiet Telekommunikationsnetze
Prof. Dr.-Ing. A. WoliszInstitut fur Telekommunikationssysteme
Fakultat IV Elektrotechnik und InformatikTechnische Universitat Berlin
vorgelegt vonStefan Valentin
am9. September 2004
Betreuer: Prof. Dr.-Ing. A. WoliszDipl.-Ing. J. Groß
Stefan ValentinMatrikelnummer: 187594Dolziger Straße10247 Berlin


Abstract
Abstract
In this thesis the performance of a combined link- and physical layer optimizationapproach [21] is studied for the downlink of a wireless OFDM-FDMA transmissionsystem. This is done by discrete event simulation assuming a heterogeneous traf-fic load scenario, where Web-pages and MPEG-4 coded VBR video streams aretransmitted simultaneously using the related transport layer protocols TCP andUDP. For the transmission of a Web-page performance increases of up to 100%were found.
Based on this optimization approach a new scheduling scheme for the hetero-geneous traffic load scenario is proposed. It provides the adaption of the bit-ratesof the transmitted video streams to the estimated load of the wireless system. Inthe performance study it is shown, that with a high proportion of video traffic inthe cell this approach accelerates the downlink of a Web-page by up to 33% on theaverage.
Zusammenfassung
In dieser Magisterarbeit wird die Leistung eines Optimierungsverfahrens fur dendrahtlosen Empfang von Datenstromen unter Voraussetzung des OFDM-FDMAUbertragungsverfahrens untersucht. Dabei handelt es sich um einen kombiniertenAnsatz der Informationen aus der Bitubertragungs- und der Sicherungsschichtberucksichtigt. Die Untersuchung erfolgt fur ein Szenario mit heterogener Verkehrs-last in dem die gleichzeitige Ubertragung von Web-Seiten, mithilfe des TCP Pro-tokolls, und von MPEG-4 kodierten Video-Stromen, uber UDP, angenommen wird.Fur dieses Szenario konnen fur die Ubertragung einer Web-seite mit dem kom-binierten Ansatz Leistungsgewinne von bis zu 100% erreicht werden.
Basierend auf dem o.g. Ansatz wird im Anschluss an dessen Untersuchungein neues scheduling- Verfahren fur heterogene Verkehrslasten vorgestellt. Diesesermoglicht die Adaption der Bit-raten der ubertragenen Video-Strome an die ge-schatzte Last. Die Untersuchung des Verfahrens zeigt, dass fur Szenarien mithohem Anteil an Video-Stromen die Ubertragung einer Web-Seite im Durchschnittum bis zu 33% beschleunigt werden kann.
III

Abstract
IV

Contents
1 Introduction 1
2 Basics of wireless communication 4
2.1 Introduction to cellular wireless systems . . . . . . . . . . . . . . . 5
2.2 Radio channel . . . . . . . . . . . . . . . . . . . . . . . . . . . . . . 6
2.3 Multi-carrier modulation and OFDM . . . . . . . . . . . . . . . . . 8
2.4 Adaptive modulation . . . . . . . . . . . . . . . . . . . . . . . . . . 10
2.5 Multiple access schemes . . . . . . . . . . . . . . . . . . . . . . . . 12
3 Heterogeneous traffic streams 14
3.1 Internet transport layer protocols . . . . . . . . . . . . . . . . . . . 14
3.2 Heterogeneous application layer traffic . . . . . . . . . . . . . . . . 17
4 Dynamic scheduling in wireless networks 22
4.1 Introduction . . . . . . . . . . . . . . . . . . . . . . . . . . . . . . . 22
4.2 Related work . . . . . . . . . . . . . . . . . . . . . . . . . . . . . . 24
4.3 Problem description . . . . . . . . . . . . . . . . . . . . . . . . . . . 26
4.4 Analysis of the investigated dynamic scheduling schemes . . . . . . 28
4.4.1 Dynamic subcarrier assignment . . . . . . . . . . . . . . . . 28
4.4.2 Dynamic subcarrier allocation . . . . . . . . . . . . . . . . . 30
4.4.3 Video queue management . . . . . . . . . . . . . . . . . . . 31
5 Performance study of dynamic OFDM-FDMA 34
5.1 Considered system and scenario . . . . . . . . . . . . . . . . . . . . 35
5.2 Simulation framework . . . . . . . . . . . . . . . . . . . . . . . . . 35
5.3 Timing structure and encapsulation . . . . . . . . . . . . . . . . . . 37
5.4 Transmission metrics . . . . . . . . . . . . . . . . . . . . . . . . . . 37
5.4.1 HTTP transmission metrics . . . . . . . . . . . . . . . . . . 37
5.4.2 MPEG-4 video transmission metrics . . . . . . . . . . . . . . 38
5.5 Parameterization . . . . . . . . . . . . . . . . . . . . . . . . . . . . 39
5.5.1 Scenario independent parameters . . . . . . . . . . . . . . . 40
5.5.2 Parameters for the OFDM-FDMA performance study . . . . 40
5.6 Results for heterogeneous traffic streams . . . . . . . . . . . . . . . 41
5.7 Interpretation . . . . . . . . . . . . . . . . . . . . . . . . . . . . . . 44
V

Contents
6 Adaptive video queue management 466.1 Basic idea . . . . . . . . . . . . . . . . . . . . . . . . . . . . . . . . 466.2 Optimization approach . . . . . . . . . . . . . . . . . . . . . . . . . 47
7 Performance study of the proposed queue management method 527.1 Methodology . . . . . . . . . . . . . . . . . . . . . . . . . . . . . . 527.2 Parameters for the VQM performance study . . . . . . . . . . . . . 537.3 Analysis for a fixed number of HTTP traffic streams . . . . . . . . 54
7.3.1 Results for dynamic OFDM-FDMA . . . . . . . . . . . . . . 547.3.2 Results for static OFDM-FDMA . . . . . . . . . . . . . . . 577.3.3 Results for semi-dynamic OFDM-FDMA . . . . . . . . . . . 627.3.4 Interpretation . . . . . . . . . . . . . . . . . . . . . . . . . . 65
7.4 Analysis for varying numbers of HTTP traffic streams . . . . . . . . 677.4.1 Comparison of the simple VQM to the adaptive VQM . . . . 677.4.2 Comparison of the semantic VQM to the adaptive VQM . . 707.4.3 Interpretation . . . . . . . . . . . . . . . . . . . . . . . . . . 72
8 Conclusions and future work 74
A Scenario independent parameters 77
B Acronyms 79
C Bibliography 87
VI

List of Figures
2.1 Cellular frequency usage concept . . . . . . . . . . . . . . . . . . . 5
2.2 Example setup of a single cell with J = 7 WTs . . . . . . . . . . . . 6
2.3 Example CNR behavior of a frequency selective and time variantradio channel . . . . . . . . . . . . . . . . . . . . . . . . . . . . . . 7
2.4 Illustration of the power spectrum of three OFDM subcarriers . . . 9
2.5 Basic structure of the OFDM transmission . . . . . . . . . . . . . . 10
2.6 Symbol error probability and example SNR modulation ranges asapplied for a maximum acceptable Ps of 0.01 . . . . . . . . . . . . . 11
2.7 Static multiple access schemes with an OFDM system for 3 WTs . . 13
2.8 Dynamic multiple access schemes with an OFDM system for 3 WTs 13
3.1 Size of the congestion window with TCPs slow-start . . . . . . . . . 15
3.2 Example of HTTP v1.0 transactions . . . . . . . . . . . . . . . . . 18
3.3 Example bit-rate of a WWW transmission . . . . . . . . . . . . . . 19
3.4 Intra-frame coding process . . . . . . . . . . . . . . . . . . . . . . . 20
3.5 Prediction methods as applied in MPEG-4 and the resulting framerelationships . . . . . . . . . . . . . . . . . . . . . . . . . . . . . . . 20
3.6 Sequence of 12 element GOPs in a MPEG coded video stream . . . 20
3.7 Example bit-rate of a high-motion video stream . . . . . . . . . . . 21
4.1 Sources of variability and the related layers . . . . . . . . . . . . . . 26
4.2 Dynamic OFDM-FDMA schemes for 3 WTs . . . . . . . . . . . . . 29
4.3 Algorithm of the simple VQM . . . . . . . . . . . . . . . . . . . . . 31
4.4 Algorithm of the semantic VQM . . . . . . . . . . . . . . . . . . . . 33
5.1 Example setup of the considered cellular system . . . . . . . . . . . 35
5.2 Basic structure of the applied discrete event simulator . . . . . . . . 36
5.3 Average bit-rate of HTTP WTs for different OFDM-FDMA schemes 42
5.4 Average Web-page transmission time for different OFDM-FDMAschemes . . . . . . . . . . . . . . . . . . . . . . . . . . . . . . . . . 43
5.5 Standard deviation of the Web-page transmission time for differentOFDM-FDMA schemes . . . . . . . . . . . . . . . . . . . . . . . . . 43
5.6 DIV for different OFDM-FDMA schemes . . . . . . . . . . . . . . . 44
5.7 Maximum gains achieved with dynamic and semi-dynamic OFDM-FDMA . . . . . . . . . . . . . . . . . . . . . . . . . . . . . . . . . . 45
VII

List of Figures
6.1 Basic algorithm of the adaptive VQM . . . . . . . . . . . . . . . . . 496.2 Algorithm of the adaptive video filter . . . . . . . . . . . . . . . . . 496.3 The selection of α considering HTTP and video metrics . . . . . . . 50
7.1 Average bit-rate of HTTP WTs for different VQM with dynamicOFDM-FDMA . . . . . . . . . . . . . . . . . . . . . . . . . . . . . 54
7.2 Average Web-page transmission time for different VQM with dy-namic OFDM-FDMA . . . . . . . . . . . . . . . . . . . . . . . . . . 55
7.3 Standard deviation of the Web-page transmission time for differentVQM with dynamic OFDM-FDMA . . . . . . . . . . . . . . . . . . 55
7.4 DIV for different VQM with dynamic OFDM-FDMA . . . . . . . . 567.5 Video packet loss rates for different VQM with dynamic OFDM-
FDMA . . . . . . . . . . . . . . . . . . . . . . . . . . . . . . . . . . 577.6 Average bit-rate of HTTP WTs for different VQM with static OFDM-
FDMA . . . . . . . . . . . . . . . . . . . . . . . . . . . . . . . . . . 587.7 Average Web-page transmission time for different VQM with static
OFDM-FDMA . . . . . . . . . . . . . . . . . . . . . . . . . . . . . 587.8 Standard deviation of the Web-page transmission time for different
VQM with static OFDM-FDMA . . . . . . . . . . . . . . . . . . . . 597.9 DIV for different VQM with static OFDM-FDMA . . . . . . . . . . 597.10 Video packet loss rates for different VQM with static OFDM-FDMA 607.11 Average number of removed packets per WT with adaptive VQM
for two OFDM-FDMA schemes . . . . . . . . . . . . . . . . . . . . 617.12 Average number of TCP timeouts for different OFDM-FDMA schemes 627.13 Average bit-rate of HTTP WTs for different VQM with semi-dynamic
OFDM-FDMA . . . . . . . . . . . . . . . . . . . . . . . . . . . . . 637.14 Average Web-page transmission time for different VQM with semi-
dynamic OFDM-FDMA . . . . . . . . . . . . . . . . . . . . . . . . 637.15 Standard deviation of the Web-page transmission time for different
VQM with semi-dynamic OFDM-FDMA . . . . . . . . . . . . . . . 647.16 DIV for different VQM with semi-dynamic OFDM-FDMA . . . . . 647.17 Video packet loss rates for different VQM with semi-dynamic OFDM-
FDMA . . . . . . . . . . . . . . . . . . . . . . . . . . . . . . . . . . 657.18 Maximum gains achieved with the adaptive VQM versus the simple
VQM for a constant Jh . . . . . . . . . . . . . . . . . . . . . . . . . 667.19 HTTP bit-rate gain achieved with adaptive for different Jr . . . . . 687.20 Web-page transmission time gain, adaptive vs. simple VQM for
different Jr . . . . . . . . . . . . . . . . . . . . . . . . . . . . . . . 687.21 Web-page transmission time standard deviation gain, adaptive vs.
simple VQM for different Jr . . . . . . . . . . . . . . . . . . . . . . 697.22 DIV gain, adaptive vs. simple VQM for different Jr . . . . . . . . . 697.23 DIV for different VQM and dynamic OFDM-FDMA for Jr = 1/4 . 697.24 HTTP bit-rate gain, adaptive vs. semantic VQM for different Jr . . 707.25 Web-page transmission time gain, adaptive vs. semantic VQM for
different Jr . . . . . . . . . . . . . . . . . . . . . . . . . . . . . . . 71
VIII

List of Figures
7.26 Web-page transmission time standard deviation gain, adaptive vs.semantic VQM for different Jr . . . . . . . . . . . . . . . . . . . . . 71
7.27 DIV gain, adaptive vs. semantic VQM for different Jr . . . . . . . . 717.28 Maximum gains with the adaptive VQM vs. the simple VQM and
the semantic VQM with varying Jh and Jv . . . . . . . . . . . . . . 72
IX

List of Figures
X
List of Tables
2.1 Modulation techniques and the applied CNR ranges . . . . . . . . . 12
3.1 WWW traffic model parameters and the distribution functions . . . 19
5.1 Considered HTTP transmission metrics . . . . . . . . . . . . . . . . 385.2 PSNR to MOS conversion as in [48] . . . . . . . . . . . . . . . . . . 395.3 Selection of the applied scenario independent parameters . . . . . . 415.4 Scenario parameters as applied for the OFDM-FDMA performance
study . . . . . . . . . . . . . . . . . . . . . . . . . . . . . . . . . . . 41
6.1 Basic steps of the adaptive VQM . . . . . . . . . . . . . . . . . . . 48
7.1 Scenario parameters as applied for the VQM performance studies . 54
A.1 Values of radio channel modeling parameters . . . . . . . . . . . . . 77A.2 Values of the physical layer parameters . . . . . . . . . . . . . . . . 77A.3 Timing structure of a single MAC frame . . . . . . . . . . . . . . . 78A.4 Distribution and values of the WWW traffic model . . . . . . . . . 78A.5 Applied MPEG-4 video parameters . . . . . . . . . . . . . . . . . . 78
XI

List of Tables
XII

Chapter 1
Introduction
The mobility provided by the transmission of speech and data without the need ofa cable connection has lead to the wide integration of mobile telephones and com-puters in every-days life. This has opened a wide field for research and technology,resulting in new developments such as the recently released third generation ofmobile telephone networks (UMTS) and Wireless Local Area Networks (WLAN)whose data rate converges more and more to the most widespread standard for ca-ble networks, the 100 MBps Ethernet. With the increase in transmission speed andquality, provided by these techniques new interesting services, e.g. video telephonyor the ubiquitous usage of the Internet can be provided to the mobile user.
However, all these benefits add a certain cost to the wireless system. Unlikecable connections, wireless systems suffer from a high variance of the delay andthe attenuation of the transmitted signals. As a result the transmission qualitypermanently varies over time and frequency. This effect increases with higherdata rates and mobility. In order to assure the fault-tolerant transmission, whileproviding high data rates Orthogonal Frequency Division Multiplexing (OFDM)has been developed. OFDM was designed to minimize the distortion of the signalcaused by the delay variance. The spectrum is separated into small sub-bands, theso-called subcarriers, which are placed in order to assure a high utilization of thegiven bandwidth.
However, the attenuation to the transmitted signal still varies according to thegiven speed and position of a wireless terminal (WT). As a consequence a higherror rate has to be taken into account, which will increase with the transmissionspeed. For a static system this results in the under-utilization if both, attenuationand error rate are low. This has lead to the development of channel-state depen-dent scheduling policies. Here the scheduler decides about the distribution of theresource according to the actual capacity of the wireless channel resulting fromthe actual measured Signal-to-Noise Ratio (SNR). With OFDM the SNR of eachsubcarrier regarding to a specific WT can be measured. Supposing an FrequencyDivision Multiple Access (FDMA) scheme each subcarrier can be allocated to thoseWT for which the best SNR value was detected. Recent research has shown, thatthis OFDM-FDMA approach highly increases the performance of the system [19].
In addition to the wireless channel another source of variability is the traffic
1

Chapter 1. Introduction
load. To avoid the under-utilization of the channel, here it is beneficial to allocatethe resources according to the individual bandwidth requirements of each terminal.Therefore, dynamic multiple access schemes are employed. In combination withOFDM-FDMA the dynamic multiple access scheme provides the adaption to thevarying channel as well as to fluctuations in traffic load. Using this so-calleddynamic OFDM-FDMA [24] approach high performance gains can be achievedcompared to a static scheme [21].
For the found improvements of the transmission system it is interesting whichfraction of the gain finally reaches the user level. Here the performance investiga-tion on the application layer is much closer to the users perception. For dynamicOFDM-FDMA systems this was done assuming VBR video streams [21] and Web-pages [39]. Both types of traffic have different Quality of Service (QoS) demandsto the transmission system and are typically transmitted simultaneously in packetswitched networks.
However, a performance study considering only the transmission of a single typeof data does not represent the nature of the traffic in the Internet. This has beenshown by recent measurements on Internet backbones [17], where a traffic mixturewas found. While the main proportion (up to 90%) of this mixture was related toWeb-pages, streaming media was measured to be the third most commonly usedservice.
For the application of a dynamic OFDM-FDMA system for mobile networkswith access to the Internet it is interesting how the system performs concerningthis heterogeneous nature of the traffic. This is investigated in the first perfor-mance study given in Chapter 5 of this thesis. Therefore, a traffic load scenariois considered, including both, the streaming of VBR video and the simultaneoustransmission of Web-pages. For both types of traffic the performance of severalcombinations of the dynamic OFDM-FDMA scheduling scheme is studied on theapplication layer.
The second subject of this thesis is to propose an extension to the dynamicOFDM-FDMA system: the adaptive Video Queue Management (VQM). The de-sign of this new scheme takes heterogeneous traffic into account and provides theadaption of the media streams to the varying system resources. This is knownunder the topics of dynamic QoS and adaptive filtering [65]. The basic idea of thisadaption strategy is the manipulation of the video data according to the estimatedsystem load. This scheme may be employed especially in dynamic OFDM-FDMAsystems, since it frees capacities if congestion occurs due to low channel states.While the adaptive VQM is located on the link layer, application layer related in-formation is extracted from the video streams and considered during the filteringprocess. After the approach and the algorithm of this scheme are discussed inChapter 6, the resulting performance is investigated. In Chapter 7 this is done bysimulation for several combinations of dynamic and static OFDM-FDMA schemesand for several heterogeneous traffic load scenarios. Beneath the achieved per-formance increase for the transmission of Web-pages and MPEG-4 coded videostreams a further focus is to analyze the adaption capabilities and the influence ofthe adaptive filtering to the video streams.
2
In the following chapter a short overview to the components of a wireless com-munication system is given. Chapter 3 introduces aspects of heterogeneous trafficand the related transport layer protocols. Chapter 4 includes an introduction toscheduling in wireless networks, the problem description of this thesis and a spec-ification of the dynamic OFDM-FDMA schemes. These chapters are followed bythe discussion of the proposed video queue management scheme in Chapter 6 andthe performance studies in Chapter 5 and 7.
3

Chapter 2
Basics of wireless communication
Due to the enormous growth rates of mobile telephones and mobile computersduring the last decade wireless communication systems have become more andmore important. Mobile telephones rule the market as no other communicationdevice with growth rates of over 50% per year [53]. Beneath the transmissionof speech the wireless transmission of data is now familiar to everyone who usesa mobile telephone or computer. Since the 802.11b specification for WLAN waspublished in July 1999, the wireless transmission of digital data with high speedbecame feasible for private personal communication and was widely adopted. The802.11b specification was followed by a variety of standards and implementations,e.g. the WLAN specifications 802.11a [28] and 802.11g [29] which both provide upto 5 times higher data rates than 802.11b.
The usage of the wireless channel leads to consequences which are fundamentaldifferent from the transmission of data via a cable link:
• While the delay and the attenuation the channel causes to a signal is constanton a cable link a random variation is quite normal with radio channels.
• Movement of the receivers highly increases this variability
The effects causing these problems are mostly of statistical nature and do super-pose. This complicates the design of a wireless communication system, since thevarying channel leads to high error rates (high attenuation) or under-utilization ofbandwidth (low attenuation). In Section 2.2 the influence of these effects on theradio channel and aspects of channel modeling are discussed, while in Section 2.3and Section 2.4 transmission techniques are presented which address especially theproblems of a wireless channel.
Unlike a cable connection the electromagnetic spectrum of the air is a resourcewhich is shared by all radio transmitters. For wireless communication systems thisleads to the following specifics:
• The signal of a transmitter is received by all terminals within a distinctpropagation radius (depending on the signals power loss). Connecting spe-cific terminals as with switching in cable networks is not possible in a wirelessnetwork.
4

2.1. Introduction to cellular wireless systems
• The used frequency is blocked until the transmission ends. If any othertransmitter within the propagation radius sends, both signals are distorteddue to interference.
• If more performance is needed in a cable network it can be obtained by usingmore or better cables. With wireless transmission more bandwidth is hardto obtain. Here it has to be assured by international institutions, such asthe ITU Radio Regulations Board, that no interference occurs with othersystems, e.g. with the radiotelephony of the local airport ground control.
In order to provide a good channel utilization and avoid blocking the limitedamount of shared bandwidth should be optimal distributed to the terminals. Thisproblem is discussed in Section 2.5 where multiple access schemes are introduced.Due to the highly limited amount of free capacities in the electromagnetic spec-trum [46] it is hard to obtain higher amounts of bandwidth if needed. This lead tothe development of cellular systems which will be introduced in the next section.
2.1 Introduction to cellular wireless systems
A traditional radio system uses a high powered transmitter and a tall antenna tocover a large area. For communication systems this means that each connectionallocates two carrier frequencies, one for the uplink and one for the downlink, inthis large area. With more users this will soon result into a shortage of carrierfrequencies.
In cellular systems this problem is solved by separating the covered area intosmall cells as pictured in Figure 2.1. The transmission within each cell is controlledby one access point. Given that the access point covers only a single cell it sendswith much lower power than the transmitter in a traditional system. As denotedby the letters in Figure 2.1 different frequencies are used by neighboring cells inorder to prevent interference at the cell boundaries.
Beneath the access point the wireless cell contains a varying number of J Wire-less Terminals (WTs). A wireless terminal is a device which is needed by the mobileuser to access the wireless network, e.g. a cellular telephone or a mobile computerwith a WLAN adaptor. While the position of the access point is fixed the WTs
C
F
E
B
A
G
D
......
... ...
... ...
Figure 2.1: Cellular frequency usage concept [53]: Different letters stand for dif-ferent frequencies which are reused in each set of cells.
5

Chapter 2. Basics of wireless communication
may roam in the cell. As long as one WT is located in the cell the access pointcontrols the transmission from and to the terminal via the radio channel. Thisincludes communication between the WTs within the same cell and from or toterminals located in external networks or cells. For this purpose the access pointis connected via a cable link to a wired network. An example setup of a single cellis illustrated in Figure 2.2.
Service providernetwork
Accesspoint
Cable link
Wireless
Cell
Wireless link terminals
Figure 2.2: Example setup of a single cell with J = 7 WTs
The cellular concept is fundamental for all popular terrestrial mobile telephonenetworks, for example GSM and UMTS [27]. Most WLAN implementations, e.g.the widely used 802.11b and the new 802.11g support the so-called infrastructuremode [47], which is similar to a single cell of a cellular telephone network. How-ever, here the typically application scenario is a hot spot, which means that notransparent roaming between the cells is supported.
2.2 Radio channel
Unlike wired channels which show a static and predictable behavior radio channelsare extremely random and therefore hard to analyze and model [53]. During itspropagation the electromagnetic wave suffers from several effects which are typ-ically summarized using the terms path-loss, shadowing, and fading [1]. Theseeffects and the influence to the transmission system are discussed in this section,together with aspects of channel modeling.
With wireless channels the transmission of data results into the propagationof electromagnetic waves from the sender to the receiver antenna. During thepropagation the power of the signal is attenuated. This deterministic effect isknown as path loss [1]. Supposing the transmission power Ptx, the received powercan be characterized by
Prx = Ptx ×K1
dα(2.1)
where K is the reference loss, which occurs over a reference distance and the pathloss exponent α characterizes how severe a distance increase attenuates the receivedsignal. Both values α and K depend highly on the chosen environment.
In addition to the loss of power terrestrial transmitted electromagnetic wavesare scattered and reflected on fixed or moving obstacles, like buildings, trees orcars. This leads to multi-path propagation, which means, that multiple versions ofthe transmitted signal reach the receiver antenna on different paths. Each version
6

2.2. Radio channel
CNR[dB]
NumberSubcarrier
Time [ms]
−100−110−120−130−140
0 10 20 30 40 50 0 20
40 60
80 100
Figure 2.3: Example CNR behavior of a frequency selective and time variant radiochannel
has a specific phase, delay (τ) and, resulting from the attenuation (a) due to pathloss, a specific amplitude. These waves, called multi-path waves superpose at thereceiver antenna to a signal which varies widely in amplitude and phase. Thiseffect is described by the term fading or small-scale fading [53]. Fading leads todrastic stochastic changes of the signal strength and is frequency selective as longas no movement occurs in the propagation environment. With movement of thesender, the receiver or the scatterer the fading becomes time variant [7]. Thereforemoving WTs result into the time and frequency variant attenuation a(f, t). Withthe noise power n this can be expressed in the Channel Gain-to-Noise Ratio (CNR)as in
G(f, t) =a2(f, t)
n2(f, t)(2.2)
which leads together with the transmission power Ptx on a specific frequency tothe SNR as in Equation 2.3.
Q(f, t) = Ptx(f, t)×G(f, t) (2.3)
The rapid variation of the CNR in time and frequency due to fading is exemplarilyshown in Figure 2.3. The frequency domain is separated into distinct sub-bandscalled subcarriers. Considering moving WTs the CNR varies independently foreach WT.
One possibility to model the stochastic nature of fading is discussed in [1].Here the time selective behavior of fading is characterized by a Jakes-like powerspectral density function, while the frequency selective fading is modeled using anexponential power delay profile.
In addition to path loss and fading further propagation phenomena, namelyreflection, diffraction (e.g. around buildings), refraction (e.g. through windows andwalls), scattering and absorption (e.g. on parks) are summarized by shadowing. Asfading shadowing influences the signal strength randomly. It can be modeled bythe use of a log normal distributed probability density function for the attenuationfactor with a mean of 0 dB and a standard deviation depending on the consideredenvironment [1]. While shadowing and path loss typically cause a time variance
7

Chapter 2. Basics of wireless communication
in the scale of a second, fading leads to the most drastic attenuation changes inthe time scale of milliseconds or even microseconds [7]. The time scale of fadingdepends highly on the WT speed. With lower speed the time the CNR roughlystays constant at a given frequency (coherence time) is longer than with higherspeed [1]. Therefore, the maximum WT speed (vmax) is an important designparameter for wireless networks. Another interesting parameter for the severenessof multi-path propagation and the resulting effects is the difference between thedelay on the longest and the shortest path
∆τ = τmax − τmin, (2.4)
which is called delay spread. The first version of the signal is typically received onthe direct path with a delay of τmin after transmission. It is followed by furtherreflections until the last reflection is received after τmax. Due to fading differentshaped signals combine at the receiver antenna. If each signal is interpreted as asequence of digital symbols, with a duration of Ts per symbol, the symbols startto overlap if ∆τ exceeds Ts. The varying delay spread causes a smearing of thesymbols, called Inter-Symbol Interference (ISI) [53], starting with the symbols ofthe direct and the longest path. With higher ∆τ in comparison to the symbol timeTs more and more symbols are affected. Since the mean values for the delay spreadcan be considered in the design of a system, the standard deviation (σ∆τ) is theinteresting parameter here to express the severeness of multi-path propagation.
2.3 Multi-carrier modulation and OFDM
As mentioned in the preceding section Inter-Symbol Interference occurs at the re-ceiver antenna if the delay-spread exceeds the symbol time. Then the receivedsymbols get more and more distorted if the unbalance between these two param-eters rises. This can be caused by strong fading in the propagation environment,resulting in high variations of ∆τ , but also smaller symbol times will lead to ISI ifthey drop below the actual ∆τ . However, with a limited bandwidth sending moresymbols within a fixed time interval is the key for the faster transmission of data.With ISI rising symbol-rates result into higher probabilities for the distortion ofsymbols, which then has to be compensated by equalization. Thus, the complexityand cost of the equalizer rises with the symbol-rate.
To provide higher data rates with practicable equalization complexity MultiCarrier Modulation (MCM) can be applied. Here a broad-band channel is sepa-rated into S narrow-band subchannels. The symbols are modulated and transmit-ted in parallel on the S carrier frequencies of the subcarriers. For the same datarate this leads to a symbol time, which is S times larger than with a Single CarrierModulation (SCM) scheme, where all symbols are sent sequentially using the fullbandwidth. The larger symbol times lower the impact of ISI significantly.
Orthogonal Frequency Division Multiplexing (OFDM) is a specific form of aMulti Carrier Modulation (MCM) scheme. First described in 1966 [8] its imple-mentation complexity became feasible during the last decade due to the progress of
8

2.3. Multi-carrier modulation and OFDM
f
fk k+1f
f
P(f)
Figure 2.4: Illustration of the power spectrum of three OFDM subcarriers
research and development in signal processing. OFDM is now widely adopted. It isapplied for digital audio [13] and video broadcasting [10] as well as for WLAN suchas IEEE 802.11a [28], IEEE 802.11g [29] and HIPERLAN/2 [12]. Furthermore it isdiscussed for new Ultra Wideband (UWB) standards for wireless personal networksin the IEEE work group 802.15.3a [49].
The primarily benefit of OFDM is the high spectral efficiency, which is achievedby the close, overlapping placement of the subcarriers. With OFDM the maximumof the power spectrum for each subcarrier is placed on the zero-crossings of theadjacent spectra. The orthogonal placement of the subcarriers requires a certaindistance (∆f) between the carrier frequencies. With the symbol time this leads toa distance of
∆f =1
Ts
. (2.5)
Since ∆f is fixed with Equation 2.5 the symbol time and therefore the baud rateis constant and equal for all the subcarriers. In Figure 2.4 the orthogonal spac-ing of the subcarrier power spectra is illustrated. The orthogonal spacing avoidscrosstalk, also known as Inter-carrier Interference (ICI), between the subcarriersand saves bandwidth since no guard bands have to be applied. Although the spec-tra do overlap no crosstalk occurs until orthogonality between the subcarriers isassured, which means, that the carrier frequencies are uncorrelated.
Analytically the power spectrum of a single subcarrier k can be given as thesinc function
P (f) = Ts sinc(πTs(f − k∆f)) (2.6)
where Ts denotes the symbol time. Before the transmission a guard interval isadded in front of each symbol to remove ISI completely. This extends the symboltime to Tb = Ts + Tg which denotes the length of the resulting so-called OFDM-block. In Figure 2.5 the structure of an OFDM transmitter is illustrated. Pertransmission cycle S ×M Bits are modulated on S symbols which are sent simul-taneously. Depending on the applied modulation technique a symbol representsM bits and has a specific shape, denoted by d(t) in the time domain. Then eachsymbol is individually filtered with a rectangular impulse response g(t) of lengthTb. In the next step the filtered symbols are modulated to S carrier frequencies,which results in
x(t) =S−1∑s=0
(ds(t) ∗ g(t))e2πjfst (2.7)
9

Chapter 2. Basics of wireless communication
dS−1
d0
g
ds
Modulation
xS M Bits
g
ds IDFT x
... ... + x
Bitstream
ej 2 f t
j 2 f te
0π
π S−1
... 1
0 1
1 0
1 0
1 0
0 1
1 1
...
=
Figure 2.5: Basic structure of the OFDM transmission on the sender side andinterpretation as the inverse DFT
for the signal for all subcarriers at the transmitters output. In the frequencydomain the rectangular pulse shape resulting from the filtering is represented bythe sinc function as in Equation 2.6. It can be shown [36], that with discrete signalprocessing (one OFDM-block is then represented by S samples) the describedfiltering and modulation process can be realized by applying the inverse DiscreteFourier Transform (DFT) on the S simultaneously processed OFDM-blocks. Atthe receivers side the inverse procedure is employed using the DFT. To lower thecalculation complexity sender and receiver are typically implemented using theFast Fourier Transform (FFT) algorithm.
Finally, this results into the following benefits which can be achieved by theemployment of OFDM:
• Low equalization complexity combined with a insignificant impact of ISI,while providing high data rates
• High spectral efficiency, no guard bands needed, while avoiding crosstalk
• Easy implementation due to the applicable FFT and the symmetric structureof sender and receiver
2.4 Adaptive modulation
The modulation technique defines how an input signal is combined with a carrierfrequency to a signal called symbol. In the context of digital data transmission theinput signal represents a bit. The number of bits which can be represented by asingle symbol depends on the modulation technique. Since higher numbers of bitsper symbol result in higher data rates the choice of the best possible modulationtechnique is important.
One criteria is the expected CNR. If the CNR drops, then the probability (Ps)of a symbol error for a certain modulation technique rises. In this case the SymbolError Probability (SEP) for higher modulation techniques starts to rise earlier
10
2.4. Adaptive modulation
0.001
0.01
0.1
−5 5 10 15 20 25 30
SNR per Symbol [dB]
0
Sym
bol E
rror
Pro
babi
lity
64 QAM16 QAM
QPSK
employed employedemployed16 QAM
modulation is employedArea where no QPSK 64 QAM
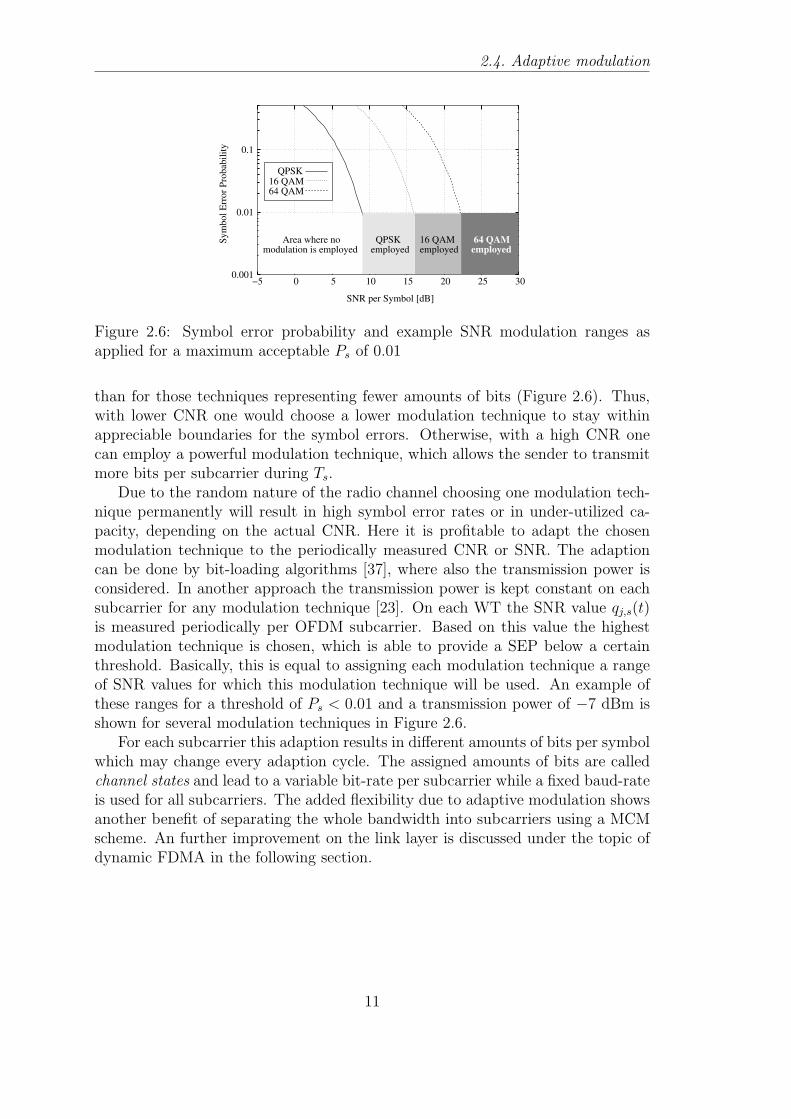
Figure 2.6: Symbol error probability and example SNR modulation ranges asapplied for a maximum acceptable Ps of 0.01
than for those techniques representing fewer amounts of bits (Figure 2.6). Thus,with lower CNR one would choose a lower modulation technique to stay withinappreciable boundaries for the symbol errors. Otherwise, with a high CNR onecan employ a powerful modulation technique, which allows the sender to transmitmore bits per subcarrier during Ts.
Due to the random nature of the radio channel choosing one modulation tech-nique permanently will result in high symbol error rates or in under-utilized ca-pacity, depending on the actual CNR. Here it is profitable to adapt the chosenmodulation technique to the periodically measured CNR or SNR. The adaptioncan be done by bit-loading algorithms [37], where also the transmission power isconsidered. In another approach the transmission power is kept constant on eachsubcarrier for any modulation technique [23]. On each WT the SNR value qj,s(t)is measured periodically per OFDM subcarrier. Based on this value the highestmodulation technique is chosen, which is able to provide a SEP below a certainthreshold. Basically, this is equal to assigning each modulation technique a rangeof SNR values for which this modulation technique will be used. An example ofthese ranges for a threshold of Ps < 0.01 and a transmission power of −7 dBm isshown for several modulation techniques in Figure 2.6.
For each subcarrier this adaption results in different amounts of bits per symbolwhich may change every adaption cycle. The assigned amounts of bits are calledchannel states and lead to a variable bit-rate per subcarrier while a fixed baud-rateis used for all subcarriers. The added flexibility due to adaptive modulation showsanother benefit of separating the whole bandwidth into subcarriers using a MCMscheme. An further improvement on the link layer is discussed under the topic ofdynamic FDMA in the following section.
11
Chapter 2. Basics of wireless communication
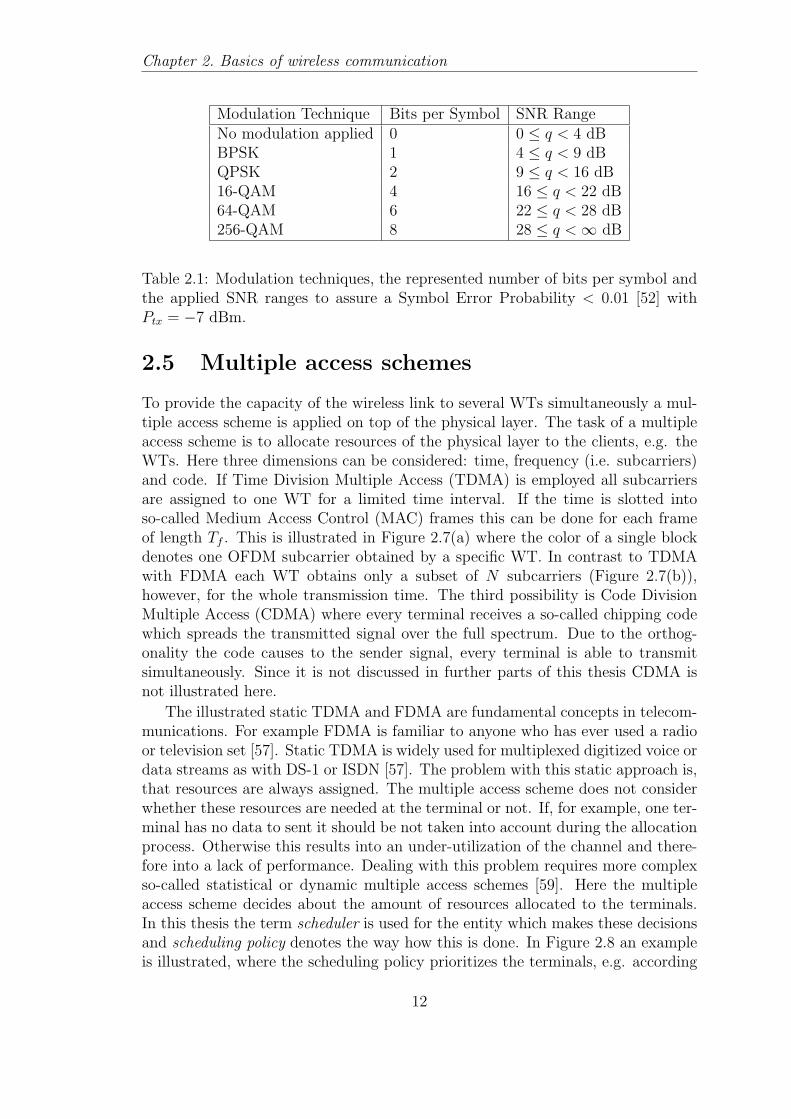
Modulation Technique Bits per Symbol SNR RangeNo modulation applied 0 0 ≤ q < 4 dBBPSK 1 4 ≤ q < 9 dBQPSK 2 9 ≤ q < 16 dB16-QAM 4 16 ≤ q < 22 dB64-QAM 6 22 ≤ q < 28 dB256-QAM 8 28 ≤ q < ∞ dB
Table 2.1: Modulation techniques, the represented number of bits per symbol andthe applied SNR ranges to assure a Symbol Error Probability < 0.01 [52] withPtx = −7 dBm.
2.5 Multiple access schemes
To provide the capacity of the wireless link to several WTs simultaneously a mul-tiple access scheme is applied on top of the physical layer. The task of a multipleaccess scheme is to allocate resources of the physical layer to the clients, e.g. theWTs. Here three dimensions can be considered: time, frequency (i.e. subcarriers)and code. If Time Division Multiple Access (TDMA) is employed all subcarriersare assigned to one WT for a limited time interval. If the time is slotted intoso-called Medium Access Control (MAC) frames this can be done for each frameof length Tf . This is illustrated in Figure 2.7(a) where the color of a single blockdenotes one OFDM subcarrier obtained by a specific WT. In contrast to TDMAwith FDMA each WT obtains only a subset of N subcarriers (Figure 2.7(b)),however, for the whole transmission time. The third possibility is Code DivisionMultiple Access (CDMA) where every terminal receives a so-called chipping codewhich spreads the transmitted signal over the full spectrum. Due to the orthog-onality the code causes to the sender signal, every terminal is able to transmitsimultaneously. Since it is not discussed in further parts of this thesis CDMA isnot illustrated here.
The illustrated static TDMA and FDMA are fundamental concepts in telecom-munications. For example FDMA is familiar to anyone who has ever used a radioor television set [57]. Static TDMA is widely used for multiplexed digitized voice ordata streams as with DS-1 or ISDN [57]. The problem with this static approach is,that resources are always assigned. The multiple access scheme does not considerwhether these resources are needed at the terminal or not. If, for example, one ter-minal has no data to sent it should be not taken into account during the allocationprocess. Otherwise this results into an under-utilization of the channel and there-fore into a lack of performance. Dealing with this problem requires more complexso-called statistical or dynamic multiple access schemes [59]. Here the multipleaccess scheme decides about the amount of resources allocated to the terminals.In this thesis the term scheduler is used for the entity which makes these decisionsand scheduling policy denotes the way how this is done. In Figure 2.8 an exampleis illustrated, where the scheduling policy prioritizes the terminals, e.g. according
12

2.5. Multiple access schemes
Time
Freq
uenc
y
Tf
Subcarrier
(a) Time Division MultipleAccess (TDMA)
Time
Freq
uenc
y
(b) Frequency Division Multi-ple Access (FDMA) withN = 2
Figure 2.7: Static multiple access schemes with an OFDM system for 3 WTs
to the amount of data to sent. With TDMA this results into the allocation ofmore time slots to the terminals with more data to sent while with FDMA higheramounts of subcarriers are received by the higher prioritized terminals. Assumingthat the prioritization is correct and the adaption cycle (e.g. every Tf ) to the vary-ing amount of sent data is sufficient the channel is optimal utilized. ComparingFigure 2.8(b) with the static multiple access schemes shows, that with FDMA theadaption leads to a combination of the TDMA and the FDMA approach. DynamicTDMA is used in combination with OFDM in the HIPERLAN/2 broadband radioaccess network [9] were a centrally scheduled scheme is employed. Centrally sched-uled means that the access point controls the assignment of resources to the WTs[9]. In the common WLAN standards 802.11a and 802.11g OFDM is combinedwith a distributed MAC approach, while also a centralized control, called pointcoordinator function or infrastructure mode, is supported on top of that [47]. Thecombination of OFDM and FDMA (OFDM-FDMA) has been widely investigated.An overview to the research in this field is given in Section 4.2.
Time
Freq
uenc
y
Tf
Subcarrier
(a) Dynamic Time DivisionMultiple Access (TDMA)
Time
Freq
uenc
y
(b) Dynamic Fre-quen-cyDivision Multiple Access(FDMA)
Figure 2.8: Dynamic multiple access schemes with an OFDM system for 3 WTs
13

Chapter 3
Heterogeneous traffic streams
The availability of the services common in the Internet is also expected by themobile user. The Internet traffic can be basically characterized as a mixture ofWeb-page related traffic and bulk-traffic, containing video or audio streams [17].This heterogeneous nature of traffic reflects which services are demanded by themain part of the users connected to the Internet.
Both types of traffic have different characteristics and different demands to thetransmission system. Especially the (near) real-time transmission of video streamsrequires high QoS levels. This has to be taken into account for the design andthe evaluation of wireless transmission systems. Furthermore, the bit-rate of thetwo traffic types, resulting from the user behavior (Web-pages) and the employedencoding scheme (streaming media) shows a fundamental different behavior. To-gether with the employed techniques on the application layer and aspects of user-behavior modeling this is discussed in Section 3.2. Due to the heterogeneous natureof the application layer traffic the two different protocols Transmission Control Pro-tocol (TCP) and User Datagram Protocol (UDP) are employed on the transportlayer. In the following section the mechanisms of these protocols are introducedand discussed in terms of their interaction with wireless networks.
3.1 Internet transport layer protocols
The TCP/IP protocol suite is the foundation of the Internet, an interconnectionof many autonomous systems [59], which may be single hosts and Local Area Net-works (LAN) or Wide Area Network (WAN) installations. To provide mobile ac-cess to the Internet TCP/IP is applied on top of wireless transmission technologies.The protocol suite consists of the Internet Protocol (IP) which provides networkoriented functions, e.g. for routing and addressing, and of the two transport proto-cols TCP and UDP including functions for end-to-end transmission control. Thefunctions and the characteristics of these two transport protocols are discussed inthis chapter.
The reliability of TCP makes it a good choice for the transmission of datawhen data integrity counts more than speed. For example this is the case for
14

3.1. Internet transport layer protocols
Con
gest
ion
win
dow
siz
e [K
Byt
es]
10
20
30
40
50
60
70
050 10 15
Number of RTT
Threshold Timeout
Figure 3.1: Size of the congestion window with TCPs slow-start and congestionavoidance algorithm versus the Round-Trip-Time (RTT)
Web-pages or the most types of files. TCP as basically defined in [31] providesa connection-oriented, reliable, byte-stream service. Data transmission with TCPrequires an initial phase for the connection establishment. For this purpose a three-way handshake is implemented, which is detailed described in [58]. To providereliability TCP includes mechanisms, which assure that the received data is passederror free, complete and in correct order to the application. Therefore, on thesender the application data is broken into chunks, the so called TCP-segments.The size of these segments is defined by TCP until a specific value, the MaximumSegment Size (MSS), is reached. The segments are extended by a 20 Byte TCP-header. For each sent segment a retransmission timer is maintained by TCP untilan acknowledgment for this segment, which is identified by a sequence number inthe TCP-header, is received. If the timer expires the segment is retransmitted.Each segment contains one checksum including the header and the data whichallows TCP to recognize errors during the whole transit (end-to-end). Erroneouspackets are discarded and not acknowledged, which causes a retransmission. Theway how the retransmission timeout values are derived from the measured round-trip-time is basically described in [34].
To avoid congestion TCP uses a combination of the so-called slow start algo-rithm and a congestion avoidance scheme on the sender side. This combinationmakes use of a sliding-window (congestion window), whose size is exemplarily illus-trated in Figure 3.1. In addition to the congestion window the size of the receiverwindow is considered. The smaller value determines how many bytes the sendersimultaneously loads to the channel.
At the beginning of the transaction a threshold is defined which is typically 64KByte [58]. If the size of the congestion window exceeds this threshold congestionavoidance is done, otherwise slow start is employed. After it was initialized withMSS the size of the congestion window rises exponential until the threshold orthe size of the receiver window is reached or a retransmission timeout occurs. InFigure 3.1 first the threshold is reached, which leads to a linear increase of thewindow size. If a timeout occurs (at RTT = 7 in the example) the algorithm
15

Chapter 3. Heterogeneous traffic streams
sets the threshold to one half of the actual congestion window size and resets thewindow size to one MSS. Then again the size of the window is adapted using slowstart. This example illustrates how TCPs flow control scheme on the sender sideadapts to the given bandwidth (slow start) and how congestion control leads tosubstantial changes of the sender bit-rate in case of a timeout.
TCPs congestion control was designed under the assumption that a packetloss is mostly caused by a buffer-overflow on the receiver side or the congestionof the medium. Even though this is the case for reliable cable links this is nottrue for wireless networks. Due to the variability of the radio channel much higherpacket loss rates are quite normal on wireless links [59]. Thus, lowering the senderbit-rate using slow-start for each retransmission timeout on a wireless link resultsin a permanent loss of performance. Instead of doing slow start TCP shouldrepeat the transmission of the erroneous packets immediately. However, typicallyTCP has no knowledge on the transmission techniques employed on lower layers,which means, that the reason for the packet loss or even the link type is notdeterminable by TCP. With the breakthrough of wireless networks in personalcommunication a lot of attention has been paid by the research community tothis problem. Many proposals were made, e.g. indirect TCP [2] or the so-calledsnooping agents [3]. However, none of them has yet been adopted by the InternetEngineering Task Force (IETF) to the TCP standard. Since their introductionin [34] the flow control mechanisms were revised and extended several times [33],several compatible versions of TCP exist. Common versions implemented in up-to-date operation systems [43] are Tahoe and New-Reno [16].
In contrast to TCP the User Datagram Protocol (UDP), which was defined in[51], is a simple, connection-less transport layer protocol. Unlike with TCP eachoutput operation, the application process performs to UDP, results into a “mes-sage” which is called UDP-datagram. The first 8 Bytes of the datagram containthe UDP-header. The header is followed by the payload, whose size per datagramis defined by the application. The UDP header contains a checksum covering theheader and the payload to provide end-to-end error recognition. Unlike TCP theUDP provides no flow control mechanisms nor reliable transmission of data. Ifan UDP checksum error is recognized, the affected datagram is silently discarded[58]. It is left to the application to recognize lost, duplicated or disordered dataor react to congestion. Since the mechanisms which provide reliable transmissionand flow control add a certain overhead to the system this lack of features is aclear advantage for the transmission of video streams with strict timing bound-aries (e.g. the “real-time” transmission of a video conference). This is illustratedby the following example: On the application server a part of a video is sendwithin an IP datagram, which gets erroneous during the transmission. AssumingTCP to be the transport protocol, this would result in an expired timer and theretransmission of the affected packet. During the time span needed for the timeoutand the retransmission the following parts of the video might be already deliveredand shown to the user. Then the player software at the receiver has no use forthe retransmitted packet anymore. This example shows, that small, predictabletransmission delays are more important for the transport of real-time videos than
16

3.2. Heterogeneous application layer traffic
reliability. Thus, on the transport layer, its simplicity makes UDP the ideal proto-col for the transmission of streaming media, especially for the considered real-timevideo streams.
Both transport protocols TCP and UDP assume the Internet Protocol (IP) [30]to be present on the underlying network layer. The TCP segment and the UDPdatagram are always encapsulated in an IP datagram which adds a header with thesize of 20 Bytes. The datagram is then passed to the lower layers, e.g. the networkcard driver. Like UDP IP provides an unreliable and connection-less service. Anyservices related to reliable data transmission are left to the encapsulated protocolsas TCP. Since IP is a network layer protocol its scope is to provide functions forthe routing, addressing and inter-operability (e.g. fragmentation) of datagrams.Although a newer version exists the actual standard in the Internet is IP Version4.
3.2 Heterogeneous application layer traffic
Analyzing the traffic structure in the Internet [17] leads to two different classesof traffic: data which is related to Web-pages and streaming media. Both typesof traffic have different demands to all layers of the transmission system. As forstreaming media data the fast transmission is the critical point, for Web-pages areliable transmission has to be guaranteed. The characteristics of heterogeneoustraffic streams and the related application layer protocols and encoding technolo-gies are discussed in this section. Furthermore aspects of modeling are considered.
For the transmission of Web-pages the Hypertext Transfer Protocol (HTTP)version 1.0 as proposed in [5] is assumed at the application layer. It is the foun-dation protocol of the World-Wide-Web (WWW) and can be used to transmitdata in the form of hypertext (e.g. HTML), plain text, images or any Internet-accessible file, which is summarized using the term Web-page in this thesis. HTTPis a transaction oriented protocol, where each transaction is independently per-formed between the HTTP client, e.g. a Web-browser, and the Web-server. Forreliability TCP is employed, where in HTTP version 1.0 for each transaction anew connection is established, which is terminated as soon as the transaction iscompleted. The stateless design avoids that the Web-server, which may servemany thousands of clients for a huge Web-site, has to store and manage the stateinformation for each HTTP connection. However, the establishment of a TCPconnection per request leads to performance inefficiencies if many small objectsare requested [40]. Therefore a persistent version of the protocol was proposedwith HTTP v1.1 [14]. In Figure 3.2 a typical example for two HTTP v1.0 trans-actions is illustrated: After the establishment of the TCP connection, which lastsone Round-Trip-Time (RTT), the Web-browser requests the transaction of a hy-pertext document. If this document is received it is interpreted. In this example areference to an image, which is not necessarily located on the Web-server requestedduring the first connection, is found and requested. Therefore, a second TCP con-nection is established to the related server. If the image transmission is completed
17

Chapter 3. Heterogeneous traffic streams
TCP connection0 x RTT: SYN
SYN
SYN
SYN
ACK
DAT
ACK
ACK
DAT
ACK3 x RTT:
for imageHTTP request
Image arrivalbegins
4 x RTT:
connectionFirst TCP
Second TCPconnection
HTTP requestfor HTML
1 x RTT:
Web−browser Web−server
DAT
DAT
received HTMLis parsed
2 x RTT:
Figure 3.2: Example of HTTP v1.0 transactions during a WWW session [40]
the TCP connection is closed and the hypertext document including the image isshown to the user.
While this structure of a Web-page request has to be considered in the HTTPapplication layer model, the key aspect is the user behavior: Finally the userdecides which Web-page is requested at which time. The user is typically not in-terested in achieving a constant bit-rate during the download of Web-pages. There-fore, the size of the requested pages, the time between them and as a consequencethe bit-rate are typically highly varying over time. Several load models have beenintroduce to represent the statistic aspects of user behavior, e.g. in [4] and [60]. Es-pecially for the evaluation HTTP v1.0 in wireless systems the Malaga traffic modelwas proposed by Reyes-Lecuona et al. in [54]. Malaga classifies the WWW trafficstructure in session- and page-levels. A session is defined as a working session ofan user downloading several Web-pages from the starting time of the Web-browseruntil its termination. With Malaga sessions are considered to be non-overlapped.On the page level one specific Web-page, containing a set of files (hypertext, im-ages, etc.) is requested and received. For the session level the WWW traffic modeldefines the parameters session-inter-time, i.e. the time between two consecutivesessions, and the number of requested Web-pages per session. For the page levelthe page-inter-time, i.e. the time between two page requests, and the page size,i.e. the total amount of downloaded information per Web-page, are given. Thedistribution functions for the parameters of the Web-model are summarized in Ta-ble 3.1. The desired traffic load on the whole system can be justified by changingthe mean of the session-inter-time and the number of WTs receiving Web-pages(Jh). The randomness of the user behavior as characterized with Malaga leads toa high variance of the data-rate. Figure 3.3 shows an example setup, representinga typical corporate environment exemplarily for a simulated time of 180 seconds.Here the high variance of the shown bit-rate is reflected by the standard deviationwhich is with σ = 283 KBps 77% of the mean (µ = 366 KBps).
18

3.2. Heterogeneous application layer traffic
Session Level Parameter Distribution FunctionSession-inter-time ExponentialPages per session Log normalPage Level Parameters Distribution FunctionPage-inter-time GammaPage Size Pareto
Table 3.1: WWW traffic model parameters and the distribution functions as de-fined in [54]
500
1000
1500
2000
2500
3000
3500
00
Time [s]20 40 60 80 100 120 140 160 180
HT
TP
stre
am b
itrat
e [K
Bps
]
Figure 3.3: Example bit-rate of a WWW transmission characterized using theMalaga model [54].
Another class of traffic which is common in the Internet are video data streams.Modern video coding methods, like MPEG-4, are taking advantage of two classesof redundancy within the video streams. At first the spatial redundancy within asingle original picture, called a video frame, is exploited using the mechanisms assummarized in Figure 3.4. This encoding process, known as intra-frame coding,leads to encoded video frames which are called I-frames. Secondly the temporalredundancy, i.e. the difference between consecutive frames of the original video,is exploited by methods like motion estimation, motion prediction or frame differ-encing, summarized by the term inter-frame coding [44].
In addition to the I-frames the inter-frame coding with MPEG-4 leads to twoframe types: P- and B-frames. Unlike the intra-frame coded I-frames, which arerelated to a single picture of the decoded video, these frames are predicted fromother frames in the MPEG-4 video stream. Like illustrated by the arrows inFigure 3.5 P-frames are predicted by the use of the previous I- or P-frame, while thebidirectional predicted B-frames are depending on the previous and the following I-or P-frame. A consequence of these prediction methods is that I-frames containingthe highest amount of information, needed for the reconstruction of the videostream, followed by the P-frames and by the B-frames, which contain the leastinformation. Thus, a single I-frame has to be transmitted using a much greaternumber of UDP-datagrams than the other two frame types.
19

Chapter 3. Heterogeneous traffic streams
Entropy Coding
Quantisation
Discrete Cosine Transformation (DCT)
8 x 8 Block
Macroblock (16 x 16 pixels)
Figure 3.4: Intra-frame coding process
I ...B P PB B B
(a) Forward predic-tion of P-frames
...B P PB B BI
(b) Bidirectionalpredictionof B-frames
Figure 3.5: Prediction methods as applied in MPEG-4 and the resulting framerelationships
The structure in which the frames are arranged is called Group of Pictures(GOP). For the GOP, which is periodic repeated in the video stream, several typesexist [15]. Common with MPEG is the 12-element GOP shown in Figure 3.6. Theshape of this structure is interesting if errors occur in the video stream, which isimportant in Section 4.4.3 when semantic video queue management schemes arediscussed.
...GOP(n) GOP(n+1)
I B B P P I P P PB B B B B B B B B B B B B BP
Figure 3.6: Sequence of 12 element GOPs in a MPEG coded video stream
In Figure 3.7 the bit-rate of a single MPEG-4 coded VBR video stream is shown.Here the standard deviation is with σ = 18 KBps 49% of the mean (µ = 37 KBps).While the mean bit-rate results from the size of the video frames, here the CommonIntermediate Format (CIF) format with 352 × 288 Pixel is assumed, the highfluctuation over time represents the entropy of the original video. Major differencesbetween consecutive frames of the original video, e.g. caused by movement orcuts, lead to higher amounts of information which have to be encoded during theinterframe coding process of MPEG. Consequently, the size of the P- and B-framesvaries. Reflecting the above mentioned variance of the original video, Variable Bit-Rate (VBR) video streams are separated into high-motion and low-motion streams.While low-motion is typical for video telephony, the shown bit-rate results from theencoding of a high-motion source, usually representing movies and sport events.
20

3.2. Heterogeneous application layer traffic
120
100
80
60
40
20
00 20 40 60 80 120100 140 160 180
Time [s]
Vid
eo s
trea
m b
itrat
e [K
Bps
]
Figure 3.7: Example bit-rate of a single MPEG-4 coded high-motion video stream
The comparison of the video and the bit-rate of a WWW transmission showssignificant differences. Although the mean bit-rate is much higher for the transmis-sion of Web-pages than with video transmission, this is not characteristic, becausethe mean bit-rate of the video stream can be easily raised by changing the framesize. More important is the difference in variance. While the standard deviationfor the VBR video is 49% of the mean bit-rate the proportion is much higher (77%)for the WWW transmission. Furthermore, the bit-rate of the VBR video variesmuch more over time than the Web-page related bit-rate. These differences haveto be taken into account if a dynamic scheduling scheme is applied. Since thescheduler has to adapt to the traffic load a high variance over time may cause sub-optimal results if the traffic load changes faster than the adaption. Furthermore,the variance of the bit-rate may cause congestion due to limited resources. Bothaspects are considered in context of dynamic scheduling in the next chapter werefundamental concepts of scheduling and adaption are discussed.
21

Chapter 4
Dynamic scheduling in wirelessnetworks
The fundamental differences between wireless and cable transmission lead to thedevelopment of scheduling schemes, which are specific for wireless networks. In thischapter the problem of scheduling and the basic concepts are introduced. After anoverview of the actual state of the research the basic problem in the focus of thisthesis is discussed. Finally, due to their relevance in this thesis, three schedulingschemes, each following a different approach, are investigated and analyzed.
4.1 Introduction
The sharing of resources is a fundamental concept of computer networks. Whetherit is the Central Processing Unit (CPU) and the memory on a single node, a hard-disk on a file-server in the LAN or a link somewhere in the Internet backbone, thesharing of a resource provides a great economical benefit and is mostly the basisfor the realization of these systems. However, the multiple access to a resourcehas to be managed. In general this is done by a scheduler, which has to decidewhich part of the shared resource is allocated to which request. In a wirelessnetwork the shared resource is the wireless channel and the requests are made bythe traffic streams, which demand bandwidth. Here the task of a scheduling policyis basically to provide the minimal queuing delay as possible, while considering thefollowing conditions:
• Capacity bounds of the wireless channel
• Contention of the Wireless Terminals (WTs) for the channel
• Fairness has to be provided to all WTs
• Given quality levels for several types of application layer traffic, the so-calledQoS, have to be assured.
22

4.1. Introduction
While all these aspects also have to be considered by a scheduling policy for wiredsystems, the time- and frequency variant nature of the wireless channel adds diffi-culties here. Due to the significant variation of the CNR (Section 2.2) the capacityboundaries of the wireless channel are typically unknown. Assuming the capacityto be constant leads to a permanently over- or underestimation, causing increasederror rates or the under-utilization of bandwidth. Furthermore, the employment ofa simple scheduling policy such as First-In-First-Out (FIFO), may cause blockingat the head of the queue if the channel states are bad. This problem was inves-tigated in an early work of Bhagwat et al. [6]. Due to bad states of the wirelesschannel the packet at the head of the queue may has to be transmitted severaltimes before it is received correctly. Using a FIFO scheduling policy other WTs ina good channel state have to wait until this packet is acknowledged. Bhagwat etal. show that channel utilization and average latency can be improved if recipientswith a good channel-state are prioritized. The found improvements demonstratethe advantage of the channel-state dependent approach.
Another aspect which has to be considered by the scheduling policy is the con-tention of the WTs for the channel. As discussed in Section 2.5 a static allocationof the channel resources, i.e. the subcarriers, would result in under-utilizationof the wireless channel and would lead to performance problems. This is a wellknown problem of telecommunication systems and is treated by various so-calleddynamic- or statistic multiple access schemes. With wireless systems here againthe variance of the channel-states have consequences for the scheduling: If thestate of a specific WT decreases, less data can be correctly received. Comparedto the WT with better channel-states this WT is lower prioritized by the channel.With channel-state dependent scheduling the lower priority propagates from thephysical layer to the scheduler on the link layer. Thus, the channel-state dependentscheduling policy has also take aspects of fairness into account.
The varying channel capacity leads to problems if a given quality level has tobe assured on the application layer. Decreasing channel-states will cause higherlatency, lower throughput and consequently a lower QoS perceived by the user.This is especially the case with soft real-time 1 traffic, e.g. real-time video or audiostreams, since here transmission delays directly lead to gaps in the continuouslytransmitted streams. To avoid the permanent reservation of bandwidth in the back-ground if application layer QoS has to be assured for streaming media, extensionsto schedulers were proposed. Due to the high demands of real-time video stream-ing, particularly video is considered for this approach. Here the varying bit-rateof the video stream is the source of variability. An early approach was formulatedby Yeadon et al. in 1996 considering the transmission of MPEG video streams ina wired network. In [65] several classes of so-called continuous media filters areapplied on special filtering nodes if congestion occurs in the network. Analyzingthe cost Yeadon et al. came to the conclusion that the complexity of these filters
1The term soft denotes that the miss of the real-time boundaries results in a quality decreasein opposite to hard real-time applications, e.g. aircraft safety control systems, where the miss ofa deadline is unacceptable [45].
23

Chapter 4. Dynamic scheduling in wireless networks
allows the application to provide QoS for MPEG video. This approach is knownunder the topic dynamic QoS. With dynamic QoS the bit-rate of the streamingmedia is adapted to the actual resources available at the system. However, withthis approach the scheduler has to consider application layer information on thelink layer.
4.2 Related work
In this section an overview to the research that was done recently in the field ofdynamic scheduling is given. Basically, the following three approaches are consid-ered:
• Channel-state dependent scheduling: adapting the scheduling policy to themeasured CNR
• Dynamic multiple access schemes: allocate resources considering traffic loadper terminal
• Adaptive filters: analyzing and filtering media streams in order to the mea-sured traffic load
For wire-less OFDM-FDMA systems the concept of channel-state dependent sche-duling has been investigated on the link layer by Gross et al. in [19]. The approachmakes use of the OFDM subcarrier states, provided by the physical layer, and en-ables the adaption of the spectral position of the subcarriers chosen per WT to thevarying CNR. For the calculation of the subcarrier assignments the Advanced Dy-namic Algorithm (ADA) was presented. The performance has been evaluated onthe link layer using discrete event simulation. It has been found, that the through-put gain due to the adaption to the varying CNR in comparison to the staticOFDM-FDMA scheme is from 30 to 40%. The subcarrier assignment approachand ADA are further discussed in Section 4.4.1. Another channel-state dependentapproach for OFDM-FDMA systems was presented in [39]. Here Le-Ngoc et al.proposed and investigated an scheduling scheme combining the channel adaptiveassignment of OFDM subcarriers and dynamic multiple access. In the performancestudy two types of application layer traffic were considered: non-real time traffic,related to WWW browsing, and soft-real time VBR video streams. Both typesof traffic were investigated separately in two homogeneous scenarios. For WWWtraffic a performance increase of 56% and for video streams of 57% in terms ofsatisfied users was found for the dynamic system.
In [50] an algorithm is shown which calculates subcarrier assignments and powercontrol in an OFDM-FDMA system. However, in contrast to the channel-state de-pendent schedulers the adaption algorithm is oriented on the individual resourcerequirements. It is a modification of Wongs algorithm, presented in [64]. Both al-gorithms follow the dynamic FDMA approach, aiming at the improvement of thepower consumption for wireless transmission. The simulation results of Pietrzyk et
24

4.2. Related work
al. show a superior performance compared to Wongs proposal and static OFDM-FDMA. Another dynamic multiple access scheme, considering the individual re-source requirements for the allocation of subcarriers in an OFDM system, wasproposed in [20]. The scheme has been studied separately and in combinationwith the above mentioned channel-state depended approach by Gross et al. Theperformance was analyzed on the application layer for the transmission of MPEG-4 coded video streams. In terms of the number of supportable WTs at a givenvideo quality level the the combined dynamic approach (channel-state dependedscheduling in combination with dynamic multiple access) outperforms the staticcase for up to 300% while 2/3 of this gain was achieved by the dynamic multipleaccess scheme. In this thesis the above mentioned combined dynamic approach iscalled dynamic OFDM-FDMA and is further discussed in Section 4.4.1 and 4.4.2.
For the transmission of soft video streams in wireless systems [41], [18] and[35] proposed extensions to wireless scheduling policies. In [41] the demands of thetransmission of multimedia to a scheduler in a wireless system is analyzed. Con-sidering the found performance gap in application layer QoS Meng et al. proposeextensions to the Idealized Weighted Fair Queueing (IWFQ) [56] scheduling policy.Here the scheduler takes application layer information of the investigated MPEG-4and H.263 video streams into account. Following this approach Klaue et al. [35]extended the scheduling policy of the dynamic OFDM-FDMA scheme by Gross etal. Here the video packets in the access point queue of a cellular OFDM-FDMAsystem are weighted according to the semantics of a MPEG video stream. Thetransmission order and the deadline of a packet are then defined by these weights.After the deadline is hit for a specific packet, it is removed by the scheduler. Thisapproach is called semantic VQM and is further analyzed in Section 4.4.3.
A similar extension to a scheduling policy is given in [18]. Francini et al.extend the Frame-Based Fair Queueing (FBFQ) scheduler with a packet dropperand a call admission control algorithm in order to provide bandwidth and delayguarantees for voice traffic. In contrast to the above mentioned extensions here thecapacity of the system is measured continuously. If low capacity is found the mediastreams are modified in order to lower the traffic load. This leads to a differentapproach also considering application layer information which is known under thetopic of dynamic QoS and adaptive filtering [26]. Here the term adaption standsfor the modification of the streams according to the traffic load. After proposed byYeadon et al. in [65] several classes of adaptive filters were investigated. In [25] amodification of the simple drop filter for MPEG coded video streams is proposed.Here the dropping is performed by considering semantic aspects and the structuralrelevance of the video frames in the stream. This filter was investigated for anend-to-end approach, where server and client control the filtering nodes within thewired network. The key of dynamic QoS is the bounded cost of the filtering andthe quality of the adaption algorithm. This was analyzed in [26] by Hemy et al.for wired networks. Here an adaption algorithm is proposed, which is performedat the client, while the filtering of MPEG video streams is done by nodes in thenetwork. Hemy et al. show, that this dynamic QoS scheme leads to significantlowering of the network load and the video frame drop rate if the wired network
25

Chapter 4. Dynamic scheduling in wireless networks
is overloaded. Furthermore, for an experimental setup the processor usage of theadaptive filter was investigated. Therefore, it was shown that the processor loadhighly depends on the bit-rate of the transmitted video.
The research in the field of dynamic scheduling is the basis for the followingchapter where the problem that is considered in this thesis is described.
4.3 Problem description
Unlike a cable link a wireless system suffers from variation of the CNR causedby effects on the radio channel. This was discussed in Chapter 2 where also thetransmission techniques OFDM and adaptive modulation were introduced whichaddress this problem on the physical layer. However, the adaption to the CNRusing adaptive modulation forwards the variation in terms of channel states tothe link layer. In Section 4.1 the channel-state dependent scheduling approachwas introduced which avoids the problem of head-of-line blocking in a queue if thestates to a specific WT are low. As discussed in Section 4.2 recent research wasdone on the algorithms and it was shown, that channel-state dependent schedulersshow good performance results on the link layer and in homogeneous applicationlayer scenarios.
Another problem which has to be considered by the scheduler is the avoidanceof under-utilization of the channel resources. This has been discussed in Section2.5 and 4.1 of this thesis under the topic of dynamic multiple access. Dynamicmultiple access is based on the adaption of the scheduling policy according tothe variance of the traffic load. Although this concept is not specific for wirelessnetworks its application is useful due to the highly limited resources if the channelis in a low state. In Section 4.2 several proposals for dynamic schedulers in wirelesssystems were presented. If this dynamic multiple access scheme is combined with achannel-state depended approach the scheduler considers two sources of variability:the channel variation on the physical layer and the variation of the traffic load,resulting from the upper (transport and application) layers. To both sources thescheduling policy can be adapted. This aspect is illustrated in Figure 4.1.
In this thesis the performance of a combined dynamic scheduling approach,called dynamic OFDM-FDMA is studied on the application layer of a wireless sys-tem. This is done assuming heterogeneous traffic load to be present which consists
Scheduler Link layer
Physical layer
Upper layersTraffic bit−rate
Channel states
Figure 4.1: Sources of variability and the related layers
26

4.3. Problem description
of data that is related to Web-pages and VBR video streams. As mentioned inSection 4.2 these two types of traffic have been studied separately in combinationwith dynamic schedulers. However, this has not been done so far for the simulta-neous transmission of Web-pages and video streams. In Chapter 5 of this thesisit is shown how dynamic and static scheduled OFDM-FDMA systems perform ifheterogeneous traffic is assumed.
This traffic scenario is much closer to the traffic flows found on Internet back-bones [17], than the separate consideration of Web- or video streams. Furthermore,this traffic mixture is interesting due to the totally different behavior shown byWeb-page and VBR video streams. As discussed in Section 3.2 the transmission ofWeb-pages leads to much higher variances of the bit-rate than the transmission ofvideo streams. However, the encoding process of video streams results into heavyfluctuations of the bit-rate over time. Furthermore, both parts of the heteroge-neous traffic have totally different claims to the transmission system. In contrastto the transmission of video streams, where the video quality directly depends onthe transmission delay, the transmission of Web-pages is not time critical from theapplication point of view. However, here the reliability in terms of an error-freereception counts. This is reflected by the transport layer protocols, which areapplied for both stream types. The transmission of Web-pages is based on TCPwhich provides reliable transmission regardless to the transmission delay. Further-more, TCPs flow control adapts the sending rate in order to avoid congestion.In contrast to TCP the UDP, as applied for the video transmission, includes noflow control. If it is demanded by the sender application, as much bandwidth asprovided by the lower layers is used. As a result in heterogeneous traffic scenariosUDP streams tend to rule out TCP under high load situations [42].
The employment of adaptive filtering in such high load situations was studiedfor wired networks (Section 4.2). Here advantages in terms of lowering networkload and increasing transmission quality were found. As mentioned in Section4.2, with streaming media adaptive filtering can be applied. For wireless systemsthe adaptive filtering has not been employed for high load scenarios. In theseapproaches the support of more users or QoS guarantees was aimed. Thus, inChapter 6 of this thesis an adaptive filtering scheme, called adaptive Video QueueManagement (VQM), is proposed. Adaptive VQM provides the adaption of thevideo stream bit-rate to the estimated traffic load. The objective of adaptive VQMis to avoid congestion in the system, while still assuring high quality for the filteredvideo (in Section 5.4.2 it is discussed what “high quality” means). Therefore, aload-estimator is combined with a filter, which considers semantic elements in thevideo streams. In wireless networks the adaptive VQM can be applied on the accesspoint in order to prevent and handle high load situations, e.g. if many WTs arerequesting video streams. For the dynamic OFDM-FDMA system the performanceof this approach is evaluated in Chapter 7. Assuming heterogeneous traffic, perscenario two aspects are of particular interest: At first, the amount of capacitywhich can be provided by the adaptive VQM to all WTs in the cell. Secondly, itis important how this “freed” capacity is then distributed according to the streamtypes. Precisely, what benefit can be found for the transmission of a Web-page
27

Chapter 4. Dynamic scheduling in wireless networks
compared to the gain for the send video streams. Furthermore, the applied filtershould do not decrease the video quality. Thus, the effect of the filtering to thevideo quality is analyzed more detailed.
4.4 Analysis of the investigated dynamic sche-
duling schemes
Three dynamic scheduling schemes which are the basis of the investigated dynamicOFDM-FDMA system considered in this thesis are discussed in this section. Thisincludes the dynamic subcarrier assignment and the dynamic subcarrier allocationas both proposed by Gross et al. in [19] and [20]. The dynamic subcarrier assign-ment scheme makes use of the ADA to calculate subcarrier assignments in orderto the channel-states. The dynamic subcarrier allocation is a dynamic FDMAscheme, which allocates the number of subcarriers per WT based on the queuelengths and is combined with the dynamic assignment scheme to dynamic OFDM-FDMA. An example of the two dynamic schemes is shown in Figure 4.2 where thecolor of a single block denotes one subcarrier obtained by a specific WT for theduration of Tf .
With the dynamic subcarrier assignment each of the three WTs receives thesame number of subcarriers (N = 2) per Tf but their position in the frequencydomain varies. In comparison to static OFDM-FDMA this flexible choice of thesubcarrier assignments enables adaption to the varying CNR. The dynamic sub-carrier assignment algorithm can choose for each WT those subcarriers with thehighest CNR and therefore, due to adaptive modulation, with the highest amountof Bits per symbol.
Combining the dynamic assignment with the dynamic allocation of subcarriersleads to the modification of N , as shown in Figure 4.2(b). This enables anotheradaption technique: With the dynamic subcarrier allocation N is adapted to thetraffic load. If the size of all outstanding packets in the access point queue for aspecific WT is high then more subcarriers will be allocated to this WT.
In addition to the scheduling schemes which adapt the spectral position andthe amount of the OFDM subcarrier per WT two VQM schemes are analyzed inthis section. At first a simple FIFO approach is discussed. Secondly the semanticVQM as proposed by Klaue et al. in [35] is analyzed. The characteristics of thesetwo VQM have been considered during the development of the adaptive VQM.
4.4.1 Dynamic subcarrier assignment
As discussed in Section 2.2 the effects on the radio channel lead to a varying CNRover time and frequency (G(f, t)). In an OFDM system the given bandwidthis separated into subcarriers. Therefore, the resulting CNR per subcarrier (s)
28

4.4. Analysis of the investigated dynamic scheduling schemes
Time
Freq
uenc
y
Subcarrier
Tf
(a) Dynamic subcarrier assign-ment with N = 2
Time
Freq
uenc
y
(b) Dynamic assignment anddynamic allocation of sub-carriers
Figure 4.2: Dynamic OFDM-FDMA schemes for 3 WTs
regarding to a specific WT (j) can be given by gj,s(t) as in Equation 4.1.
gj,s(t) =a2
j,s
n2j,s
(4.1)
For all S subcarriers regarding to all J WTs the CNR-matrix G(t) of dimensionJ × S can be derived from the G(f, t) which was given in Equation 2.2:
G(t) =
g1,1(t) g1,2(t) · · · g1,S(t)g2,1(t) g2,2(t) · · · g2,S(t)
......
...gJ,1(t) gJ,2(t) · · · gJ,S(t)
(4.2)
If the time is slotted into MAC frames of length Tf this leads to one G(t) per
Tf . By multiplying each value of G(t) with the applied transmission power Ptx
that is constant for all the subcarriers during the whole transmission, the matrixQ(t) is obtained containing the SNR values for the transmission towards all JWTs on all S subcarriers. From Q(t) the adaptive modulation scheme derives theapplied modulation technique, which results to a number of bits (m) representedby a symbol of the chosen modulation alphabet. (The procedure was described inSection 2.4.) Since the resulting m called the subcarrier state is specific for theconsidered WT and subcarrier all mj,s can be expressed by the J×S matrix M(t).The CNR-matrix is then used by the ADA-algorithm to calculate the subcarrierassignment for each WT for the next downlink phase (t + 1). This means that themeasured CNR values in G(t) may be outdated if the subcarrier assignments areapplied. This problem is discussed under the topic of realistic channel knowledgein [22].
In this thesis the ADA as proposed in [19] is considered for the dynamic as-signment of subcarriers. ADA makes use of priorities for each WT. For each WT aweight value (w) is calculated where a single weight value for the specific WT j is
29

Chapter 4. Dynamic scheduling in wireless networks
obtained by the sum of the channel gain values of the i WTs with a lower prioritythan j:
wj,s(t) =∑∀i
gi,s(t). (4.3)
After the calculation of the weights for all J WTs the assignment algorithm selectsthe subcarriers with the highest possible weight ratio, defined by
gi,s(t)
wi,s(t). (4.4)
This is done N times for each WT, starting with the WT which received thehighest priority. Therefore each WT obtains N subcarriers, where to the WTswith higher priorities better subcarriers are assigned. Finally the priorities arerotated to provide fairness.
ADA provides a heuristic and not the optimal solution for the subcarrier assign-ment as the well known Hungarian algorithm [38]. However, the optimal solutioncan not be obtained the acceptable timing bound that is smaller than Tf . In [19]it was shown that the throughput gain achieved with solution provided by ADAis most only 5% off from the optimal solution.
4.4.2 Dynamic subcarrier allocation
For the description of the dynamic subcarrier assignment scheme it was supposedthat a constant number of subcarriers (N) is given to each WT during the assign-ment procedure. As discussed in Section 2.5 static multiple access schemes are farfrom being optimal.
Considering static FDMA each WT receives N subcarriers per downlink phaseregardless of data has to be send to a WT or not. If, for example, no data is sendto i WTs for a downlink phase i × N subcarriers are not utilized. In contrast, adynamic FDMA scheme then allocates these i×N subcarriers to those WTs whichhave to receive data. This will clearly result in an improvement of the throughputrates to these WTs.
In the OFDM-FDMA system investigated in thesis the dynamic subcarrierallocation scheme as proposed in [20] is considered. It provides the adaption tothe varying traffic load by measuring the queue length (dj), i.e. the sum of all thepacket sizes in the access point queue, for a single WT. The dynamic allocationscheme then compares the obtained dj values to the sum of all dj and calculatesthe amount of subcarriers allocated per WT (sj) as given in Equation 4.5.
sj(t) = 1 +
⌊(S − Ja)
dj(t)∑∀J dj(t)
+ 0.5
⌋(4.5)
Since prior to this allocation that is derived from the queue lengths each WTwhich has data to receive during the next downlink phase whose sum is denotedby Ja obtains one subcarrier. Thus, only S − Ja subcarriers can be weighted inEquation 4.5. The allocation is done once per MAC frame before the downlinkphase starts, for which the achieved subcarrier allocations are applied.
30

4.4. Analysis of the investigated dynamic scheduling schemes
4.4.3 Video queue management
In general the term Video Queue Management (VQM) is used to describe a numberof functions employed on queues, which contain packets of video stream data. Itis supposed that these queues are located at the access point and even in scenar-ios with heterogeneous traffic the access point knows which queues contain videopackets. Furthermore the VQM on the access point is able to extract parametersfrom these packets which have semantic relevance for the related video stream. Forexample, with an MPEG coded video stream this may be the type of the videoframe which is (partially) included in an UDP datagram. Extracting this infor-mation the VQM on the access point knows whether this UDP datagram and therelated IP datagram belongs to an I-,P- or B-frame and may adapt its schedulingpolicy in order to this information. In context of a VQM the scheduling policydecides which priority is given to the transmission of a particular video packet.
A simple form is a FIFO scheduling policy where the access point transmitsthe packets in order of the reception. This is the basic approach of the firstVQM introduced here: the simple VQM. The only function which distinguishesthe simple VQM from the plain FIFO queue is the removal of packets related tooutdated video frames. This function is the consequence of the strict boundaries forthe transmission delay on the downlink if videos in real-time application scenarios,e.g. video conferences, are considered. If the transmission delay exceeds 180ms thedistorting effect of acoustic echoes becomes annoying to the user [62]. Furthermore,time lags in the video stream may become noticeable since the video decoder has towait until all packets per video frame have arrived. For the prevention of problemsdue to boundless transmission delays it is assumed that video frames (or parts ofthem) which are received later than a given global deadline (D) are not decodedat the receiver anymore. Therefore, the simple VQM may remove video packetswhose transmission delay exceeds D. Because the VQM is located at the accesspoint, i.e. between sender and receiver, it has no knowledge about the absoluteend-to-end transmission delay of a packet. Thus, the value for D has to be muchsmaller than the overall acceptable transmission delay of 180ms. In this thesisD = 100ms is chosen which is quite pessimistic. The simple approach of this VQMcan be formalized as in Figure 4.3. Considering a single packet with the sending
Next packet
init
calculate Lp
false truepL < 1
Remove packet
Figure 4.3: Algorithm of the simple VQM as performed independently for eachqueue
31
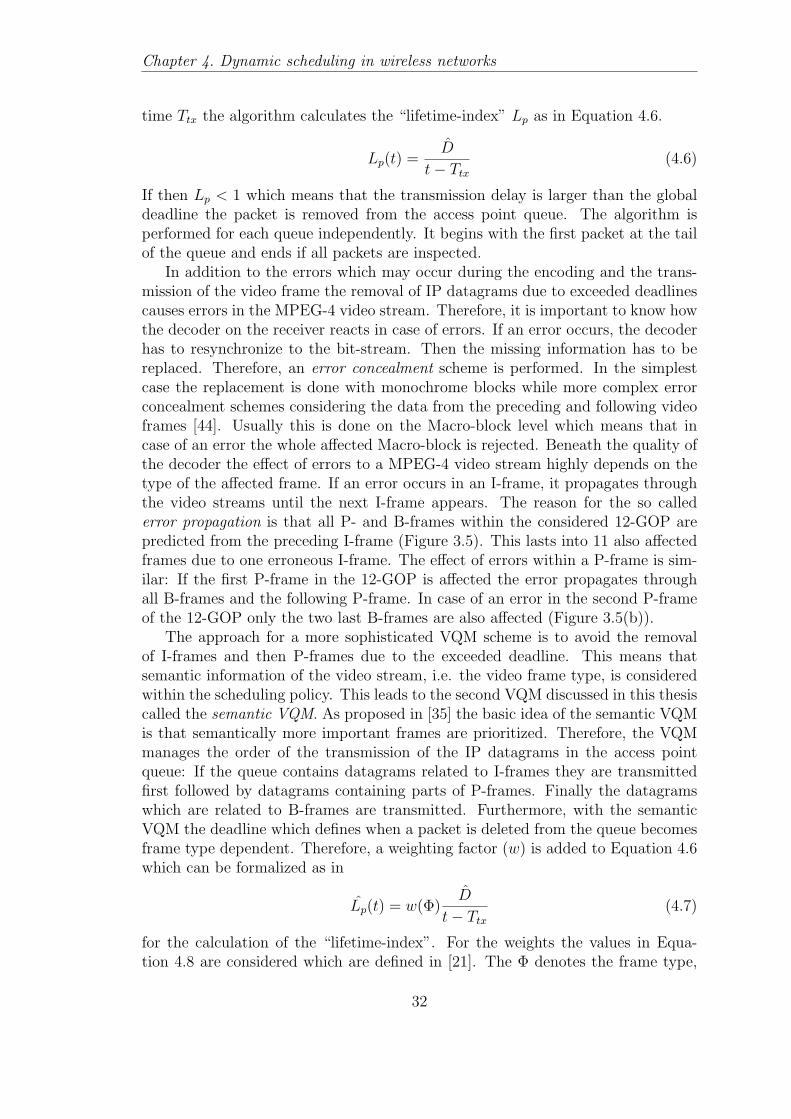
Chapter 4. Dynamic scheduling in wireless networks
time Ttx the algorithm calculates the “lifetime-index” Lp as in Equation 4.6.
Lp(t) =D
t− Ttx
(4.6)
If then Lp < 1 which means that the transmission delay is larger than the globaldeadline the packet is removed from the access point queue. The algorithm isperformed for each queue independently. It begins with the first packet at the tailof the queue and ends if all packets are inspected.
In addition to the errors which may occur during the encoding and the trans-mission of the video frame the removal of IP datagrams due to exceeded deadlinescauses errors in the MPEG-4 video stream. Therefore, it is important to know howthe decoder on the receiver reacts in case of errors. If an error occurs, the decoderhas to resynchronize to the bit-stream. Then the missing information has to bereplaced. Therefore, an error concealment scheme is performed. In the simplestcase the replacement is done with monochrome blocks while more complex errorconcealment schemes considering the data from the preceding and following videoframes [44]. Usually this is done on the Macro-block level which means that incase of an error the whole affected Macro-block is rejected. Beneath the quality ofthe decoder the effect of errors to a MPEG-4 video stream highly depends on thetype of the affected frame. If an error occurs in an I-frame, it propagates throughthe video streams until the next I-frame appears. The reason for the so callederror propagation is that all P- and B-frames within the considered 12-GOP arepredicted from the preceding I-frame (Figure 3.5). This lasts into 11 also affectedframes due to one erroneous I-frame. The effect of errors within a P-frame is sim-ilar: If the first P-frame in the 12-GOP is affected the error propagates throughall B-frames and the following P-frame. In case of an error in the second P-frameof the 12-GOP only the two last B-frames are also affected (Figure 3.5(b)).
The approach for a more sophisticated VQM scheme is to avoid the removalof I-frames and then P-frames due to the exceeded deadline. This means thatsemantic information of the video stream, i.e. the video frame type, is consideredwithin the scheduling policy. This leads to the second VQM discussed in this thesiscalled the semantic VQM. As proposed in [35] the basic idea of the semantic VQMis that semantically more important frames are prioritized. Therefore, the VQMmanages the order of the transmission of the IP datagrams in the access pointqueue: If the queue contains datagrams related to I-frames they are transmittedfirst followed by datagrams containing parts of P-frames. Finally the datagramswhich are related to B-frames are transmitted. Furthermore, with the semanticVQM the deadline which defines when a packet is deleted from the queue becomesframe type dependent. Therefore, a weighting factor (w) is added to Equation 4.6which can be formalized as in
Lp(t) = w(Φ)D
t− Ttx
(4.7)
for the calculation of the “lifetime-index”. For the weights the values in Equa-tion 4.8 are considered which are defined in [21]. The Φ denotes the frame type,
32

4.4. Analysis of the investigated dynamic scheduling schemes
which is extracted from the considered packet.
w(Φ) =
1, Φ = I frame0.75, Φ = P frame0.5, Φ = B frame
(4.8)
This means, that P-frame related packets are dropped 25% and B-frame packetsare dropped 50% earlier than I-frame packets. Therefore capacity for I- and P-frames is provided by the deletion of packets related to B-frames. Since B-framesare no prediction-source for other frames the errors caused by the removal of thepackets will not propagate.
The algorithm of the semantic VQM, as it is independently performed for eachaccess point queue containing video data, is illustrated in Figure 4.4: At first allvideo packets in the queue are sorted according to the type of the related videoframe. Therefore, the packets which are related to I-frames are shifted to the tail ofthe queue, followed by the packets related to P- and B-frames. Then basically thesame iteration over all packets in the queue as in the simple VQM starts. However,w is considered in the calculation of Lp in step 2. If the frame specific deadline
for a packet is hit (Lp < 1), it is dropped during step 3. The algorithm ends ifthe head of the queue is reached. Although this algorithm is performed once perdownlink phase in the considered system this is not essential. The more infrequentexecution would decrease the calculational overhead caused by the semantic VQMto the access point. However, this would also lower the adaption capabilities ofthe scheme to the actual queue content.
The two discussed VQM schemes are the building blocks and the yardstick forthe VQM scheme proposed in Chapter 6. A newly developed VQM should clearlyoutperform both of them. This is investigated in the performance study in Chapter7.
pL < 1
Remove packet
calculate Lp
Next packet
Sort queue (frame type)init
(1)
truefalse
(3)
(2)
^
Figure 4.4: Algorithm of the semantic VQM as performed independently for eachqueue
33

Chapter 5
Performance study of dynamicOFDM-FDMA
In recent research the performance of the dynamic OFDM-FDMA approach wasinvestigated on the link layer and on the application layer where a homogeneoustraffic scenario with video streams was considered. On the link layer throughputgains vs. the static OFDM-FDMA scheme were found from 30 to 40% [20]. Forthe video stream scenario a gain of up to 300% in terms of supportable WTs at agiven quality level was achieved [20].
The performance study in this chapter now investigates which portion of thebenefit achieved by the improvement on the link layer reaches the applicationlayer if heterogeneous traffic is considered. Therefore, a number of WTs requestingWeb-pages is assumed while the other part of the WTs is receiving video streamsat the same time. Three combinations of the dynamic scheduling schemes areinvestigated:
• Static OFDM-FDMA: static subcarrier assignment and static subcarrier al-location, the spectral position and the number of the subcarriers a single WTobtains (N) are fixed
• Semi-dynamic OFDM-FDMA: dyn-amic sub-carrier assign-ment and staticsub-carrier alloc-ation, N is fixed
• Dynamic OFDM-FDMA: dynamic subcarrier assignment and dynamic sub-carrier allocation
In order to reflect the users perception the performance is measured on the ap-plication layer. Thus, separate metrics for the transmission of Web-pages andvideo streams are applied which are introduced in Section 5.4. Furthermore, theinvestigated scenario and the chosen parameters have to be discussed.
Additionally, this chapter gives a short overview to the simulation frameworkand to the resulting timing and encapsulation structure which is relevant for thewhole thesis.
34

5.1. Considered system and scenario
5.1 Considered system and scenario
For the performance studies in this thesis a single wireless cell as described inSection 2.1 is considered. The cell has a radius of R and contains one access pointand J wireless terminals. While the position of the access point is fixed the WTsare moving with a maximum speed of vmax. The access point which is connectedto the Internet via a cable link, forwards data between application servers locatedin the Internet and the WTs using a wireless OFDM link. Furthermore, variouscombinations of the dynamic scheduling schemes as described in Section 4.4 areapplied.
For all simulations heterogeneous traffic is assumed. Thus, the WTs are re-questing two different types of application layer data from the servers: Jh terminalsare requesting Web-pages using the HTTP and the TCP protocol and to Jv WTsMPEG-4 coded video streams are transmitted by the use of UDP. In Figure 5.1an example setup of the considered system is illustrated, different colors for theservers and the WTs denote different types of application layer data. From setupto setup the amount of HTTP and video receiving WTs is varied. However, duringthe simulation of a single setup the application type of a specific WT is fixed.
In this thesis only the downlink transmission of data from the access point tothe WTs is considered. The time is slotted into so-called MAC frames of lengthTf . It is supposed that the subcarrier assignments and allocations are calculatedonce per Tf .
Servers inthe Internet
TerminalsAccessPoint
HTTP
Video
Wired link
Wireless
Cell
OFDM link
Figure 5.1: Example setup of the considered cellular system
5.2 Simulation framework
All results presented in the performance studies were obtained via discrete eventsimulation. Figure 5.2 shows the structure of the simulated system and illustrateshow the modules are interconnected.
The system consists of application servers, the access point and the wirelessterminals. Each application server module consists basically of a traffic generatorand a transport protocol submodule. 1 Depending on the type of the sent traffic
1The employed IP modules are not shown here. Since point-to-point connections are assumedin the simulator, IP does nothing more than adding 20 Bytes of overhead per transport layerpacket.
35

Chapter 5. Performance study of dynamic OFDM-FDMA
this is either a WWW traffic generator, according to the Malaga WWW trafficmodel (Section 3.2) combined with a TCP submodule or an video traffic modeland a UDP submodule. The video traffic generator is based on trace-files whichwere produced using MPEG-4 coded high-motion VBR video streams. From theserver modules messages are sent to the queues which are located at the accesspoint. While different types of traffic use different queues, one queue for each WTis assumed. The modules for the queues, the application servers and for the WTsare replicated according to the chosen numbers of video and WWW terminals.
Beneath the queues the basic functions of the access point can be divided intotwo modules. In the channel module the CNR is generated considering the effectswhich were discussed in Section 2.2. From the CNR the channel states are derivedusing the adaptive modulation scheme as described in Section 2.4 while a constanttransmission power is assumed. The channel states are then sent to the schedulermodule. It contains three submodules where the subcarrier assignments (AS), theallocation of subcarriers (AL) and the VQM are performed. Several submodulescan be used, containing e.g. static or dynamic algorithms. According to the resultsof the submodules for the used subcarriers (AS), the number of subcarriers (AL)or the index of the removed video packets (VQM) the scheduler interacts withthe queues. This interaction and calculation process is done cyclic every Tf and isfollowed by the transmission of the message at the head of each queue. This is donesimultaneous to the J WT modules where the messages are received, processed(according to the used transport protocol) and statistics for the measured valuesare calculated.
In addition to the above mentioned modules, for all simulations a link layermodel is supposed which basically provides MAC-frame encapsulation, error-cod-ing and signaling. It is detailed described and analyzed in [22] and [23]. Sinceit does not affect the studies presented in this thesis, it is not shown and notdiscussed here. The simulator was implemented using the OMNeT++ discreteevent simulation framework [61] while the transport layer protocols the IP-suitefor OMNeT++ [63], developed at the university of Karlsruhe was integrated.
Jh
Jv Jv
Jh
Accesspoint
Applicationserver
Wirelessterminal
WWW
TCP
generatortraffic
TCP
statistics
J
...
... ...
......AS VQMAL
Scheduler
Channel
UDP UDP
statisticsVideo
trace−filesVideo
WWW
Figure 5.2: Basic structure of the applied discrete event simulator
36

5.3. Timing structure and encapsulation
5.3 Timing structure and encapsulation
The delays considered in the simulated system are summarized in this section.
If a WT demands a video stream, a request is sent to the video server. Since nouplink is considered in the system model the request is sent directly from the accesspoint to the video server for which a duration of Ti is needed. After a service delayTh at the video server, e.g. for encoding or hard-disc seeking purposes, the firstpart of the MPEG-4 coded video is send within an UDP datagram. Dependingon the size of the transmitted video frame the UDP datagram may contain a fullvideo frame or a part of it. After the encapsulation the resulting IP datagram issent via the wired link to the access point were it is queued for the duration of Tq.
Depending on the results of the adaptive modulation a specific part of theIP datagram can be sent to the WT during Tf . This part is modulated and theresulting symbols are transmitted simultaneously on the OFDM subcarriers via thewireless link. The transmission of the whole encapsulated IP datagram lasts Tw.As a simplification it is not assumed that the decapsulation and data processing,e.g. the decoding of the received video frame causes any delays on the WT. Thus,the delays which occur during the transmission can be summarized as follows:
RTT = 2× Ti + Th + Tq + Tw. (5.1)
For the request and the transmission of a Web-page the timing structure is thesame. However, since TCP is employed on the whole transmission path the wholeWeb-page or parts of it are encapsulated within a TCP segment.
5.4 Transmission metrics
In this section the metrics which are investigated in all performance studies are de-fined. Although in the considered system the queuing delay at the access point (Tq)is the critical factor the transmission quality the user perceives at the applicationlayer is what finally counts. This leads to two types of application layer metrics,considered separately for the transmission of Web-pages and MPEG-4 video.
5.4.1 HTTP transmission metrics
In order to measure the performance provided by the transmission system to thoseWTs receiving Web-pages the metrics as listed in Table 5.1 are considered. In[40] Menasce et al. came to the conclusion that latency and throughput are thetwo most important performance metrics for Web-systems. These two classes areconsidered for the metrics for the HTTP transmission in the simulated system.The throughput is measured in Bits per second (Bps) on the application layerof each WT separately. To get closer to the users perception then the latencyof a requested Web-page is monitored by measuring the transmission time of asingle page. The faster a Web-page is received and displayed, the more the user
37

Chapter 5. Performance study of dynamic OFDM-FDMA
HTTP Metric Unit of MeasurementTCP bit-rate Bits per second [Bps]Web-page transmission time Seconds [s]Standard deviation of theWeb-page transmission time Seconds [s]
Table 5.1: Considered HTTP transmission metrics
is satisfied with the transmission system. 2 Furthermore, the transmission delayof a Web-page should be predictable for the user. This is the fewer the case, thehigher the delay varies. This variation is represented by the standard deviation(σ) of the Web-page transmission time.
For the presentation in the performance studies the results obtained for all Jh
WTs during the whole simulation time are averaged over Jh. In addition to themean values the variance of the results was investigated for 95% confidence. Dueto their small size (typically less than 0.5% of the plotted value) no confidenceintervals are shown in the diagrams given in the performance studies.
5.4.2 MPEG-4 video transmission metrics
During the transmission the video is continuously decoded and shown to the user.Since then the users subjective impression of the video quality is what finallycounts in this thesis the measurement of video quality is based on a user-preceptiveapproach.
Typically a subjective evaluation has to be done by tests, where humans haveto watch and grade the video, which are time intensive and costly. Here a differentapproach is used: With the Distortion In Interval (DIV) metric, as proposed in[35], the subjective impression of an user can be mapped to an objective metric.The DIV metric is based on the Mean Opinion Score (MOS), which is standard forthe subjective rating of still pictures [32]. By the use of Table 5.2 [48] the subjectivemetric MOS can be derived from the objective Peak Signal-to-Noise Ratio (PSNR),which is widely used for the evaluation of picture quality [55]. Therewith, the MOSfor a single picture of the decoded video can be obtained by calculating its PSNRvalue.
PSNR(a, b) = 20 log2k − 1
MSE(a, b)(5.2)
This is done by the use of Equation 5.2 where the decoded video frames a and bare compared. Here MSE denotes the mean square error between the two framesand k the color depth of the video in bits. The result of Equation 5.2 is given indB. The frame a denotes the video frame in prior to the transmission. Frame b isthe encoded, transmitted (and maybe damaged) and decoded video frame. If a is
2Here it is assumed, that the program on the application layer e.g. the Web-browser does notcauses any delays.
38

5.5. Parameterization
assumed to have always a high PSNR the comparison shows the influence of thetransmission errors.
PSNR [dB] MOS grade Video quality> 37 5 Excellent31− 37 4 Good25− 31 3 Fair20− 25 2 Poor< 20 1 Bad
Table 5.2: PSNR to MOS conversion as in [48]
To obtain one value for the quality of a large number of still pictures, as ina video stream, the simplest approach would be to obtain one MOS value pervideo frame and then calculate the mean. However, this straight-forward approachusually gives no adequate reflection of the users impression. For example: If thefirst seconds of the video are lost during the transmission and the quality of framesreceived and decoded during the following larger time interval is excellent, a goodMOS value is obtained on the average. This will clearly not match the subjectiveuser impression. To avoid the false estimation as performed by time-averagingmetrics the DIV counts the number of transmitted video frames with a lower MOSgrade than before the transmission process. This is done for a given time window,which is shifted over the whole MOS vector.
In this thesis the threshold of 20% lost frames for the time interval of 20 seconds,as both defined in [21], is considered. Results for the DIV higher than the thresholdare considered to lead to an unacceptable decrease of the video quality. In the DIVplots presented in the performance studies this is indicated by a horizontal line atthe 20% mark. Although this is a very stringent metric, its representation of thegrade of distortion caused by the transmission system is closer to the perceptionof the user than time-averaging metrics [35].
In addition to the DIV the packet loss rates for the transmitted video streamsare considered in the performance studies. This is done separately for each videoframe type. Compared to the DIV this illustrates the effect of error-propagationthrough the video stream. Furthermore it shows, whether the correct packets areremoved by the filter of the VQMs.
For both video metrics the average over the number of video receiving WTs isshown in the performance studies.
5.5 Parameterization
In this section the chosen values for the parameters considered during the simula-tion are presented. At first the scenario independent parameters are shown. Theseparameters were left constant for all simulations which were calculated within thescope of this thesis. Secondly the values for those parameters are listed, which are
39

Chapter 5. Performance study of dynamic OFDM-FDMA
chosen for the performance study of the dynamic OFDM-FDMA schemes in thischapter.
5.5.1 Scenario independent parameters
In Table 5.3 a selection of the applied parameters is shown, which were left constantduring the whole simulation. The full set of the scenario independent parametersis shown in Appendix A.
The table starts at the lowest simulated layer the radio channel. As discussedin Section 2.2, the maximum speed and the delay spread have significant effects tothe system due to the resulting fading and ISI. While the given speed is comparableto walking, the chosen value for the cell radius and the standard deviation of thedelay spread represent an indoor environment [1]. On the physical layer S = 48subcarriers are simulated in the 5.2 GHz band. Furthermore the bandwidth, thesymbol time Ts and the transmission power are given. These values were chosenaccording to the IEEE 802.11a WLAN standard [28]. For the delay spread thestandard deviation is given. Since mean values can be considered in the designof the system, the variation is the interesting parameter here. Since Ts is nearly27 times higher than the standard deviation of the delay spread no significantdistortion due to ISI has to be assumed. The SEP threshold Ps defines the SNRboundaries for the applied modulation techniques during the adaptive modulation.This value has been chosen from [53]. The length of the MAC frame Tf correspondsto HIPERLAN/2 [11], while the length of the downlink phase field results fromthe link layer model which was proposed in [23]. The maximum size of the TCPsegments represents the maximum amount of data which is sent within a singlesegment. Due to the length of the data field in a frame of the very commonEthernet (IEEE 802.3) this is typical sent to 1460 Bytes. On the application layer,the session-inter-time defines the time between two consecutive WWW sessions.Although, this parameter is defined by the Malaga WWW traffic model [54] itsvalue is not given. For this thesis it was chosen in order to provide considerabletraffic load. If the session-inter-time is set to 0 s the resulting traffic could beinterpreted a single (much longer) session. The MPEG-4 stream parameter resultfrom the decoding of 180 s of a video in the CIF format with the size of 352 ×288 Pixel per video frame.
5.5.2 Parameters for the OFDM-FDMA performance stu-dy
For the traffic load model heterogeneous traffic is considered: Here a fixed numberof WTs (Jh) receives Web-pages, while a number of WTs (Jv) simultaneouslyreceives MPEG-4 coded VBR video streams. For each scenario and OFDM-FDMAscheme a series is recorded by varying Jv from 0 to Jmax − Jh. Since with staticsubcarrier allocation the number of subcarriers one WT obtains is N = S/J , themaximum amount of WTs is chosen in order to provide at least one subcarrier perWT. Table 5.4 lists those parameters which are specific for this performance study.
40

5.6. Results for heterogeneous traffic streams
Channel/Scenario parameter Chosen valueCell radius (R) 100 mMaximum speed of the WTs (vmax) 1 m/sDelay spread standard deviation (σ∆τ) 0.15 µsPhysical layer parameter Chosen valueTotal bandwidth (B) 16.25 MHz in the 5.2 GHz bandNumber of subcarriers (S) 48Max. transmit power/subcarrier (Ptx) 0.2 mW (−7 dBm)Symbol time (Ts) 4 µsSEP threshold (Ps) 0.01MAC timing parameter Chosen valueMAC frame time (Tf ) 2ms (500 Symbols)Downlink phase, payload field time 0.968ms (242 Symbols)Transport layer parameter Chosen valueTCP Maximum segment size 1460 BytesWWW Traffic model parameter Chosen valueSession-inter-time µ = 3 sMPEG-4 video stream parameter Chosen valueMean bit-rate 951 KBpsVideo duration 4500 frames, i.e. 180 s
Table 5.3: Selection of the applied scenario independent parameters
Since the focus of this performance study is not to investigate the VQM sche-mes, as proposed in Section 4.4.3 and Chapter 6, the simple VQM is applied forall the simulations of the heterogeneous scenario.
Scenario Parameter ValueMaximum amount of WTs per cell (Jmax) 48No. WWW receiving WTs per cell (Jh) 12No. video receiving WTs per cell (Jv) varied: [0 : 36]
Table 5.4: Scenario parameters as applied for the OFDM-FDMA performancestudy
5.6 Results for heterogeneous traffic streams
The following results are obtained for the heterogeneous scenario where in addi-tion to the 12 WTs which receive HTTP, a variable amount of video receivingWTs (Jv) is considered. Since with higher amounts of Jv the limited amount ofsubcarriers has to be distributed to more and more WTs generally the averagebit-rate decreases (Figure 5.3) for all considered OFDM-FDMA schemes. The
41

Chapter 5. Performance study of dynamic OFDM-FDMA
highest gain for the bit-rate versus the static scheme is 80%, achieved for Jv = 36.The maximum gain can be found for the dynamic assignment which is with 55%much higher than the 25% obtained with the dynamic allocation. For Jv ≥ 24the gain achieved with the full dynamic approach decreases while it rises slightlyfor the semi-dynamic approach. The absolute values show the low capacity, whichremains on the application layer. For Jv = 0 the Web-pages are sent to each of the12 WTs with 166 KBps on the average, while this value decreases until 98 KBpsare reached (Jv = 48).
40000
60000
80000
100000
120000
140000
160000
180000
0 4 8 12 16 20 24 28 32 36
Avg
. HT
TP
Thr
ough
put [
Bps
]
Number of Video receiving WTs (Jv)
Static OFDM-FDMA Semi-dynamic OFDM-FDMA Dynamic OFDM-FDMA
Figure 5.3: Average bit-rate of HTTP receiving WTs for different OFDM-FDMAschemes in a heterogeneous traffic load scenario
In Figure 5.4 the average transmission time of a Web-page per WT is shown.Due to the higher contention for the channel resource it rises with Jv. On theaverage the dynamic OFDM-FDMA scheme leads to the fastest transmission of aWeb-page, followed by the semi-dynamic and by the static scheme. The maximumvalue is achieved at Jv = 36 for the static case. It is 100% higher than the valueobtained for the dynamic OFDM-FDMA, where the component achieved with thedynamic assignment is 84%. As for the bit-rate a decrease of the performance gainachieved with dynamic allocation starting at Jv = 24 shows up.
While the standard deviation of the page transmission time (Figure 5.5) ba-sically shows the same qualitative behavior as the page transmission time, thehighest gains are achieved for this metric. Here the maximum benefit achievedat Jv = 36 for dynamic OFDM-FDMA is 215%, while 161% are achieved by thedynamic assignment. The gain achieved with the dynamic allocation of subcarriersclearly slopes for Jv ≥ 24.
The investigation of the DIV metric, which expresses the amount of distortioncaused by the transmission system to the video stream, is interesting since it showsthe effect of the choice of the OFDM-FDMA scheme has to the video quality. InFigure 5.6 the positive impact is significant for the DIV results obtained withdynamic OFDM-FDMA for low numbers of video receiving WTs. For example,for Jv = 4 the DIV is 37% lower with the dynamic approach and 25% lower withsemi-dynamic OFDM-FDMA. If Jv rises, the DIV also rises for all transmissionschemes. The horizontal line represents the upper boundary for the DIV. It marks
42

5.6. Results for heterogeneous traffic streams
2
3
4
5
6
7
8
9
10
0 4 8 12 16 20 24 28 32 36A
vg. P
age
Tra
nsm
issi
on T
ime
[s]
Number of Video receiving WTs (Jv)
Static OFDM-FDMA Semi-dynamic OFDM-FDMA Dynamic OFDM-FDMA
Figure 5.4: Average transmission time per Web-page for different OFDM-FDMAschemes in a heterogeneous traffic load scenario
0
1
2
3
4
5
6
7
0 4 8 12 16 20 24 28 32 36
σ Pa
ge T
rans
mis
sion
Tim
e [s
]
Number of Video receiving WTs (Jv)
Static OFDM-FDMA Semi-dynamic OFDM-FDMA Dynamic OFDM-FDMA
Figure 5.5: Standard deviation of the transmission time per Web-page for differentOFDM-FDMA schemes in a heterogeneous traffic load scenario
the level of 20%, since larger DIV values result in an unacceptable video quality[21]. While for static OFDM-FDMA all results stay above this line, the upperboundary is reached at Jv = 8 for the semi-dynamic and at Jv = 17 for thedynamic approach.
Since most of the users will give up watching the video stream, video scenarioswith permanent high DIV rates are not typical. However, with best-effort net-works as the Internet, where requests are not rejected on the transmission path,such situations may occur especially on links with low capacity. Thus, the chosenscenarios with high Jv is not unrealistic for the considered wireless system.
For the performance study in this chapter the high load can also be interpretedas any other type of VBR bulk traffic, e.g. the transmission of files or real-timeaudio streams, which is in contention to the WWW traffic.
43

Chapter 5. Performance study of dynamic OFDM-FDMA
0 10 20 30 40 50 60 70 80 90
100
4 8 12 16 20 24 28 32 36
DIV
[%]
Number of Video receiving WTs (Jv)
Static OFDM-FDMA Semi-dynamic OFDM-FDMA Dynamic OFDM-FDMA
Figure 5.6: DIV for different OFDM-FDMA schemes in a heterogeneous trafficload scenario
5.7 Interpretation
The investigation of the HTTP transmission metrics shows that static OFDM-FDMA is clearly outperformed by the dynamic assignment of subcarriers withsemi-dynamic OFDM-FDMA. The exploitation of the statistical multiplex withthe dynamic subcarrier allocation leads to an additional performance increase,achieved with dynamic OFDM-FDMA. The maximum achieved gains are comparedin section 5.7, where the highest gain of 215% is achieved for the standard deviationof the Web-page transmission time. Considering all HTTP metrics leads to theconclusion that for all HTTP metrics the maximum benefit is obtained if hightraffic load is simulated using high numbers of WTs in the cell. The major part ofthe gain is typically achieved by the dynamic subcarrier assignment. Adding thedynamic allocation the maximum is reached with the full dynamic OFDM-FDMAapproach for the highest simulated number of WTs.
However, this second aspect has to be further examined. While this is clearlypresent with the semi-dynamic OFDM-FDMA, where the gain rises with Jv, a dif-ferent behavior is shown for dynamic OFDM-FDMA: With this scheduling schemethe gain starts to sink faster from a specific point (Jv > 24) in the heterogeneousscenario. The reason for this is the decreasing amount of subcarriers which canbe assigned. As given in Equation 4.5 with dynamic assignment each WT whichhas data in its access point queue achieves at least one subcarrier. Assuming thatthis is the case for all WTs, with Jh + Jv = 24 this lasts to 12 freely allocat-able subcarriers, while with Jv = 36 no subcarrier can be allocated. The gainwhich is still achieved for the highest Jv shows that not for all WTs is data in thequeues during the whole simulation. However, according to the queue length theprobability that a WT receives data rises. Despite from the sender bit-rate thequeue length depends on the data rate on the wireless link, which is lower withless amounts of subcarriers allocated per WT. Assuming a constant bit-rate, thisleads to a vicious circle for high number of terminals: Less amounts of allocatablesubcarriers are followed by rising queue lengths which are followed again by lessamounts of allocatable subcarriers.
44

5.7. Interpretation
0
50
100
150
200
250
Bit-rate Meantransmission
time
Stddev.transmission
time
DIVM
axim
um G
ain
[%]
Dynamic OFDM-FDMA Semi-dynamic OFDM-FDMA
Figure 5.7: Maximum gains achieved with dynamic and semi-dynamic OFDM-FDMA in comparison to static OFDM-FDMA in a heterogeneous traffic load sce-nario
The influence of scheduling schemes to the video quality is expressed by the DIVrate. The comparison of the DIV rates for all the applied OFDM-FDMA schemesleads to the conclusion that for setups with small numbers of video receiving WTs,which means small load to the transmission system, dynamic OFDM-FDMA out-performs the static for up to 37% and the semi-dynamic scheme for up to 25%.Although in setups with high traffic load the DIV is slightly lowered this is not ben-eficial. Due to the high traffic load the distortion of the video is generally too highfor being acceptable for the user (DIV > 20%). As for the HTTP metrics, the DIVrate gain achieved with the dynamic subcarrier allocation decreases more clearlyfor higher traffic load than the gain achieved with semi-dynamic OFDM-FDMA.
45

Chapter 6
Adaptive video queuemanagement
In the preceding chapter it was shown, that for the heterogeneous scenario thehighest performance can be achieved with the combined dynamic OFDM-FDMAapproach. Although this adaption to the channel states and to the traffic loadleads to performance gains of up to 215% for the transmission of HTTP, thereare still problems. Especially for setups with high traffic load the high queuingdelays at the access point lead to significant drawbacks for the transmission ofdata. With heterogeneous traffic here the performance gain achieved with theimproved subcarrier allocation decreases. Although this is the case for video andHTTP especially the HTTP related data streams suffer.
In this chapter a Video Queue Management (VQM) scheme is introduced whichdirectly addresses the problems of heterogeneous traffic scenarios under high loadin combination with dynamic OFDM-FDMA. This scheme, whose basic idea isgiven in the next section, is called adaptive VQM. Its algorithms and parametersare explained in greater detail in the second section of this chapter.
6.1 Basic idea
In Section 4.4.3 the simple VQM using a FIFO scheduling policy and the seman-tic VQM, which adapts its scheduling policy according to video semantics, werediscussed. One important aspect of the semantic VQM is, that the removal ofsemantically less important parts of the video stream, e.g. B-frames, provides ad-ditionally capacity to more important parts such as I-frames. This is essential inscenarios with high traffic load, which occurs in one of the following cases:
• Many receiving WTs: As discussed in Chapter 5 the performance gainachieved with the dynamic allocation scheme drops due to the lack of sub-carriers.
• Data streams with a high bit-rate: The queue length for the affected WTs
46

6.2. Optimization approach
rises. Due to dynamic allocation these WTs receive higher amounts of sub-carriers.
• Bad channel states: Due to low subcarrier CNR only small amounts of bitscan be sent during Ts.
Since the resources of the radio channel are limited, congestion may occur whichleads to higher transmission delays, regardless which type of application layerdata is transported. Due to its strict timing boundaries (Section 4.4.3) especiallyreal-time video transmission will suffer: The rising transmission delay of the IPdatagrams, containing parts of video frames, leads to more and more datagramswhich will hit the deadline. Therefore they are discarded, either by the simple orthe semantic VQM. In this chapter a further stage of the semantic VQM, calledadaptive VQM, is introduced. The basic idea of this VQM is to free capacity inthe case of high traffic load by the preemptive removal of packets from the videoqueues. In addition to the consideration of semantic information which is extractedfrom the video packets the scheduling policy is adapted to the amount of trafficload, the system estimates. The objective of this scheme is to avoid congestion inthe access point queues, from which all types of application layer traffic will suffer.
In the following section all parts of the adaptive VQM are introduced and it isexplained how they work together. Furthermore, aspects as traffic load estimation,adaptive video filters and the related parameters and algorithms are discussed. InChapter 7 the performance of the adaptive VQM in comparison to the simple andthe semantic VQM is investigated.
6.2 Optimization approach
The adaptive VQM provides the adaption of the scheduling policy to the trafficload on the access point. To fulfill this task basically two new components areadded to the plain semantic VQM: The first has to estimate the traffic load tothe monitored system and is called system load estimator. The second component,called adaptive video filter works on the video queue under the objective to lowerthe bit-rate of the contained video stream while assuring small decreases of thevideo quality. Therefore, semantic parameters, regarding to the perceived qualityat the application layer, are considered by the filter algorithm. The steps of theadaptive VQM are listed in Table 6.1. In general the estimation of the traffic loadcan be treated as a simple accounting calculation at the access point, i.e. theamount of free resources is compared to the needed resource capacity:
Bits to transmit
Bits transmittable per Tf
(6.1)
While the upper part of the fraction always changes with VBR traffic, changesin the denominator are specific for dynamic scheduling systems. If the result ofEquation 6.1 is greater than 1 a lack of resources occurs for the considered frameof length Tf . The problem of this approach is, to decide which amount of Bits is
47

Chapter 6. Adaptive video queue management
Step VQM Component1 Video packet lifetime calculator2 Sorting of the packets according to lifetime3 Non-load-adaptive packet removal4 Traffic load estimator5 Adaptive video filter
Table 6.1: Basic steps of the adaptive VQM
considered in the upper part of the fraction. Neither the full length of the queue northe mean number of Bits send-able per Tf will produce useful results. Therefore, inthe adaptive VQM a different approach is used, which is presented in the followingdiscussion of the basic algorithm. As shown in Figure 6.1, in the first step thecalculation of the lifetime-index (Lp) is done for all video packets in the queue.This is done exactly as shown in Equation 4.7 for the plain semantic VQM. Thenall the video packets in the queue are sorted according to Lp (step 2). This assuresthat those packets with the smallest lifetime-index are sent first, considering thatfor the calculation of Lp, also the frame type is used. After the queues are sortedthe basic algorithm of the semantic VQM (Figure 4.4) is performed. This thirdstep of the adaptive VQM is called non-load-adaptive packet removal and is markedby a dashed line in Figure 6.1. During this iteration over all the packets in thequeue all packets with Lp < 1 are removed. The size of the removed packets istotalized independently for each WT to Sj(t). This value is an indirect measureof the needed capacity according to Equation 6.1. It is used during step 4 for theestimation of the traffic load. Here it is compared to the free downlink capacityof the MAC frame from the preceding downlink phase (Fj(t − 1)), as given inEquation 6.2.
Rj(t) =Sj(t)
Fj(t− 1)(6.2)
Since the VQM runs prior to the dynamic OFDM-FDMA schemes only the valuemeasured for Fj in the preceding downlink phase can be used for the comparison.The Sj(t) value already expresses the result of the traffic load to the system. IfSj(t) is high, many video packets, or those related to more important frame typesof greater size, exceed their deadline. If this is combined with a small estimateddownlink capacity (Fj(t − 1)), then additional filtering of the video queues willlower the probability of congestion and therefore, the Sj in the next cycle. Ifthe resulting load-rate Rj(t) exceeds a given threshold α, then the access point isconsidered to be overloaded and the adaptive video filter is executed.
The objective of the adaptive video filter is to free system capacity by low-ering the bit-rate of the video streams within the access point queue. For thispurpose several types of video filters, e.g. re-quantization-, low-pass- or color-to-monochrome-filters were proposed for the usage with streaming data in wirednetworks [65]. However, the complexity of these filters might be problematic forthe access point. Typically the access point has to serve many WTs and is still
48

6.2. Optimization approach
calculate Lp
pLtruefalse
< 1
pLSort queue ( )
Remove packet
calculate Sj
truefalseNext packet?
calculate R j
init
(4)
(4)
truefalseR >j α
Semantic videofilter (Iteration 1) (5)
(3)
(2)
(1)
Figure 6.1: Basic algorithm of the adaptive VQM as performed independently foreach queue
truefalseNext packet?
Remove packetRemove packet
found ?B frame
false true
truefalseB frame ?
truefalseP frame ?
trueNext packet?
false
init First IterationSecond Iteration
Figure 6.2: Algorithm of the adaptive video filter as invoked by the system loadestimator independently for each queue
49
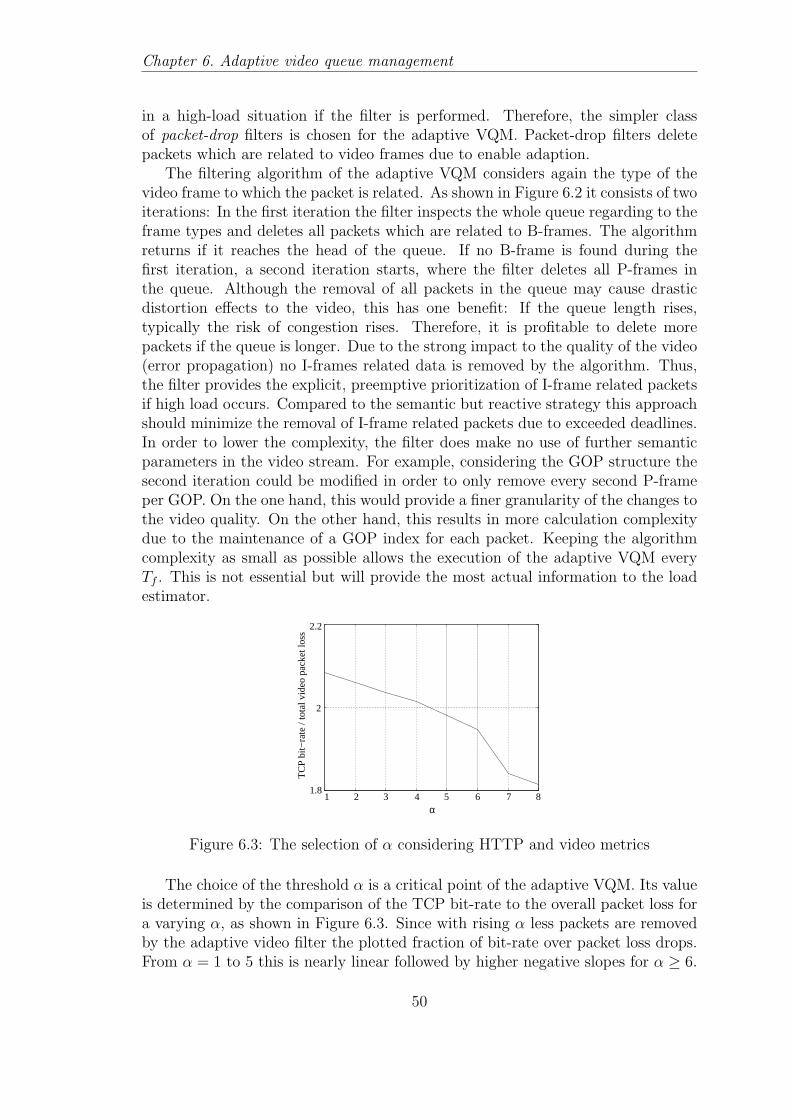
Chapter 6. Adaptive video queue management
in a high-load situation if the filter is performed. Therefore, the simpler classof packet-drop filters is chosen for the adaptive VQM. Packet-drop filters deletepackets which are related to video frames due to enable adaption.
The filtering algorithm of the adaptive VQM considers again the type of thevideo frame to which the packet is related. As shown in Figure 6.2 it consists of twoiterations: In the first iteration the filter inspects the whole queue regarding to theframe types and deletes all packets which are related to B-frames. The algorithmreturns if it reaches the head of the queue. If no B-frame is found during thefirst iteration, a second iteration starts, where the filter deletes all P-frames inthe queue. Although the removal of all packets in the queue may cause drasticdistortion effects to the video, this has one benefit: If the queue length rises,typically the risk of congestion rises. Therefore, it is profitable to delete morepackets if the queue is longer. Due to the strong impact to the quality of the video(error propagation) no I-frames related data is removed by the algorithm. Thus,the filter provides the explicit, preemptive prioritization of I-frame related packetsif high load occurs. Compared to the semantic but reactive strategy this approachshould minimize the removal of I-frame related packets due to exceeded deadlines.In order to lower the complexity, the filter does make no use of further semanticparameters in the video stream. For example, considering the GOP structure thesecond iteration could be modified in order to only remove every second P-frameper GOP. On the one hand, this would provide a finer granularity of the changes tothe video quality. On the other hand, this results in more calculation complexitydue to the maintenance of a GOP index for each packet. Keeping the algorithmcomplexity as small as possible allows the execution of the adaptive VQM everyTf . This is not essential but will provide the most actual information to the loadestimator.
1.8
2
2.2
1 2 3 4 5 6 7 8
TC
P b
it−ra
te /
tota
l vid
eo p
acke
t los
s
α
Figure 6.3: The selection of α considering HTTP and video metrics
The choice of the threshold α is a critical point of the adaptive VQM. Its valueis determined by the comparison of the TCP bit-rate to the overall packet loss fora varying α, as shown in Figure 6.3. Since with rising α less packets are removedby the adaptive video filter the plotted fraction of bit-rate over packet loss drops.From α = 1 to 5 this is nearly linear followed by higher negative slopes for α ≥ 6.
50

6.2. Optimization approach
Due to these results, obtained for a scenario with Jh = Jv = 12 and dynamicOFDM-FDMA, the value α = 5 is chosen. This value is used for all the simulatedscenarios as shown in Chapter 7 and represents not more than a heuristic one hasoptimize. However, the adaption of α is not considered in this thesis.
51

Chapter 7
Performance study of theproposed queue managementmethod
The main goal of this study is to investigate the performance of the adaptive VQM,which is designed to optimize the transmission of heterogeneous traffic. Section 5.6shows, that for this type of traffic load the highest gain can be achieved with dy-namic OFDM-FDMA. Therefore, it is of particular interest how the adaptive VQMperforms in combination with dynamic OFDM-FDMA. After the methodology ofthis investigation is discussed in the next section, the parameters for the simulatedscenarios are listed in Section 7.2. The presentation of the simulation results isseparated into two parts: At first, in Section 7.3 the performance of the adap-tive VQM is analyzed in combination with three different OFDM-FDMA schemesfor scenarios with a fixed number of HTTP receiving WTs per cell. Secondly, inSection 7.4 the combination of dynamic OFDM-FDMA and adaptive VQM is in-vestigated for scenarios with varying amounts of video and HTTP receiving WTsin the cell.
7.1 Methodology
Although in this performance study basically the same procedures and methods areapplied as introduced in Chapter 5, several differences have to be discussed. For thecombination of the adaptive VQM with dynamic OFDM-FDMA the performance isanalyzed by the use of two methods for defining the structure of the heterogeneoustraffic: At first, in Section 7.3.1, the number of Web-page receiving WTs (Jh) is leftconstant, while the amount of WTs receiving video (Jv) is increased. This methodis known from the former performance study given in Chapter 5. Therewith, thetraffic load from setup to setup increases due to the higher amount of simultaneousreceived video streams per cell. Secondly, to provide a better evaluation of theinfluence different traffic structures have to the performance of the VQM, Jv and
52

7.2. Parameters for the VQM performance study
Jh are changed from setup to setup, while the ratio
Jr =Jv
Jh
(7.1)
is fixed. For varying Jv this leads to a fixed proportion of HTTP receiving WTs percell. For example, 25% of the WTs per cell are receiving video streams if Jr = 1/4.An investigation for several Jr is done for dynamic OFDM-FDMA in Section 7.4,where the results are shown versus Jv. Since the maximum amount of WTs percell (Jmax) is limited the highest possible Jv usable per simulation is
Jv = Jmax −Jh
Jr
. (7.2)
In addition to the investigations for dynamic OFDM-FDMA, the dependency ofthe VQM from the FDMA scheme is evaluated. Therefore, the two combinationsadaptive VQM with static OFDM-FDMA (Section 7.3.2) and adaptive VQM withsemi-dynamic OFDM-FDMA (Section 7.3.3) are analyzed.
In order to evaluate the performance of the adaptive VQM the simulationresults, obtained for the adaptive VQM, are compared to those results, obtainedfor the simple and the semantic VQM. This is done for all metrics which aredefined in Section 5.4 for HTTP and video separately. For the HTTP receivingWTs, the metrics average HTTP bit-rate, average Web-page transmission timeand standard deviation of the Web-page transmission time are considered. Thequality of the MPEG-4 coded video streams is evaluated by the use of the DIVmetric. Additionally the loss rates of video related UDP packets are shown foreach MPEG frame type to illustrate the influence of the different VQM to thevideo streams.
In the investigations with constant Jh, for each of the mentioned metrics themean values, obtained for rising numbers of Jv are shown. However, no absoluteresults are shown if the VQM are analyzed for several Jr. Since here various setupsare investigated, only the performance gain, which is achieved with the adaptiveVQM in comparison to the simple VQM (Section 7.4.1) and to the semantic VQM(Section 7.4.2), is shown. This is done for rising amounts of Jv for all HTTP andvideo metrics except for the video packet loss rates.
7.2 Parameters for the VQM performance study
The chosen scenario is basically the same as for the performance study of theOFDM-FDMA schemes in Section 5.5. However, the composition of the trafficstructure is modified. In the first case Jh is set to a fixed number of 12 WTs,while Jv is varied from 1 to 36. Secondly, scenarios with varying Jh and Jv areexamined, while the ratio Jr (Equation 7.1) is constant. According to Equation 7.2Jv is raised until Jmax is reached. For example, with Jr = 1/4 every increment ofJv results in 4 additional HTTP receiving WTs, which leads to the maximum ofJv = 9 and Jh = 36. For Jr the values as listed in Table 7.1 are considered. Forall further modeling parameters the values shown in Section 5.5 are applied.
53

Chapter 7. Performance study of the proposed queue management method
Scenario Parameter ValueJmax 48Jh if constant 12Jv if Jh is constant varied [1 : 36]Jr 1/4, 1, 4
Table 7.1: Scenario parameters as applied for the VQM performance studies
7.3 Analysis for a fixed number of HTTP traffic
streams
In this section the performance of all VQM is compared in combination with thedynamic, the static and the semi-dynamic OFDM-FDMA scheme. Assuming afixed Jh, the simulation results for the simple, the semantic and the adaptiveVQM are shown versus rising Jv. The main topic of the discussion is to expose theinfluence of the different VQM methods to the Web- and video metrics, wherebythe aspects of load-adaption and filtering are considered in particular. While inthe following sections several details of the results are discussed in addition to thepresentation, a discussion considering all results is finally given in Section 7.3.4.
7.3.1 Results for dynamic OFDM-FDMA
The bit-rate of the average TCP throughput, achieved for all the Web-page receiv-ing WTs, in Figure 7.1 shows a clear benefit for the adaptive VQM. While withhigher traffic load due to higher amounts of video receiving WTs in the cell (Jv)the throughput rate strongly decreases for the simple and the semantic VQM, thedecrease is much smaller with the adaptive VQM. For the case Jv = 36, wherethe highest traffic load is produced, the adaptive VQM outperforms the semanticVQM for 24% and the simple VQM for 32% for the bit-rate.
100000
110000
120000
130000
140000
150000
160000
170000
0 4 8 12 16 20 24 28 32 36
Avg
. HT
TP
Thr
ough
put [
Bps
]
Number of Video receiving WTs (Jv)
Simple VQM Semantic VQM Adaptive, Semantic VQM
Figure 7.1: Average bit-rate of HTTP receiving WTs for different video queuemanagement methods with dynamic OFDM-FDMA
54

7.3. Analysis for a fixed number of HTTP traffic streams
2.8 3
3.2 3.4 3.6 3.8
4 4.2 4.4 4.6 4.8
0 4 8 12 16 20 24 28 32 36A
vg. P
age
Tra
nsm
issi
on T
ime
[s]
Number of Video receiving WTs (Jv)
Simple VQM Semantic VQM Adaptive, Semantic VQM
Figure 7.2: Average transmission time per Web-page for different video queuemanagement methods with dynamic OFDM-FDMA
0.4 0.6 0.8
1 1.2 1.4 1.6 1.8
2 2.2
0 4 8 12 16 20 24 28 32 36
σ Pa
ge T
rans
mis
sion
Tim
e [s
]
Number of Video receiving WTs (Jv)
Simple VQM Semantic VQM Adaptive, Semantic VQM
Figure 7.3: Standard deviation of the transmission time per Web-page for differentvideo queue management methods with dynamic OFDM-FDMA
The average transmission time per Web-page for rising Jv is shown in Fig-ure 7.2. As for the TCP throughput the adaptive VQM outperforms the otherVQM schemes. For Jv values greater than 8 the simple VQM leads to the longestpage transmission times, followed by the semantic VQM. The highest gain bythe adaptive VQM is achieved when the maximum traffic load is simulated asfor Jv = 36. Compared to the semantic VQM it is 25% lower and 33% lower incomparison to the simple VQM.
The plot of the standard deviation of the page transmission time (Figure 7.3)shows a similar quality as the page transmission time. Therefore, in case of higherJv, the standard deviation is the lowest with the adaptive VQM. For the maximumof Jv this leads to the gain for the predictability of 63% in comparison to thesemantic and of 83% in comparison to the simple VQM.
Considering the additional video filtering as performed in the adaptive VQM, itis of great interest, how this impacts the video quality. Figure 7.4 shows the averageDIV, which is a metric for the amount of distortion the transmission system causesto the video, as perceived by the user. Therefore, higher DIV values express higher
55

Chapter 7. Performance study of the proposed queue management method
0
10
20
30
40
50
60
70
80
4 8 12 16 20 24 28 32 36
DIV
[%]
Number of Video receiving WTs (Jv)
Simple VQM Semantic VQM Adaptive, Semantic VQM
Figure 7.4: DIV for different video queue management methods with dynamicOFDM-FDMA
amounts of distorted video frames. Generally for rising amounts of video receivingWTs (Jv) the DIV value rises. Compared to the simple VQM, it is interestingthat for Jv smaller than 16 the DIV is slightly higher with the semantic and theadaptive VQM (up to 2% for Jv = 4). For both schemes the results for Jv greaterthan 16 are lower and therefore better than the DIV for the simple VQM. However,here the upper boundary for the DIV of 20% [21] as marked by the horizontal lineis crossed by all the VQM. Results for the DIV higher than this threshold areconsidered to lead to an unacceptable decrease of the video quality. This leads tothe conclusion that with all VQM not more than 16 video receiving WTs can besupported. However, in cases of high load, the semantic and the adaptive VQMlead to benefits for the HTTP transmission metrics.
The video packet loss rates for the different VQM as shown in Figure 7.5 illus-trate the influence of the video filter as applied in the adaptive VQM. In Figure7.5(a) the total percentage of the lost video packets, regardless to the video frametype, is shown. Although for Jv < 26 the simple VQM leads to the smallest lossrates, compared to the other VQM schemes, more errors are caused by lost pack-ets to the semantically more important I- and P-frames (Figure 7.5(b) and 7.5(c)).This is especially the case with higher numbers of video receiving WTs, whereeven the total loss rate of the simple VQM exceeds those of the semantic andthe adaptive VQM. For example, for Jv = 36, 4% more I- and 6% more P-framerelated packets are lost with the simple VQM than with the adaptive VQM. Thebehavior of the DIV for high Jv, can be explained by comparing the B-frame lossrates of the VQM (Figure 7.5(d)). Since here the packet loss rate is up to 10%higher for the semantic approach, it is shown wherefrom the capacity to priori-tize the transmission of I- and P-frames is taken. Considering the absolute valuesshows that the most lost packets are related to B-frames. The lower DIV, whichis achieved by the adaption to the traffic load in comparison to the plain semanticVQM, can be explained by the packet loss rates for the scenarios for Jv greaterthan 24. Compared to the values obtained with the semantic VQM the percentageof the removed I- and P-frames with the adaptive VQM is lower (Figure 7.5(b) and
56

7.3. Analysis for a fixed number of HTTP traffic streams
0 5
10 15 20 25 30 35 40 45 50 55
4 8 12 16 20 24 28 32 36
Vid
eo P
acke
t Los
s [%
]
Number of Video receiving WTs (Jv)
Simple VQM Semantic VQM Adaptive, Semantic VQM
(a) Percentage of total lost video pack-ets
0 1 2 3 4 5 6 7
4 8 12 16 20 24 28 32 36
I Fra
me
Pack
et L
oss
[%]
Number of Video receiving WTs (Jv)
Simple VQM Semantic VQM Adaptive, Semantic VQM
(b) Percentage of lost video packets re-lated to I frames
0 2 4 6 8
10 12 14 16
4 8 12 16 20 24 28 32 36
P Fr
ame
Pack
et L
oss
[%]
Number of Video receiving WTs (Jv)
Simple VQM Semantic VQM Adaptive, Semantic VQM
(c) Percentage of lost video packets re-lated to P frames
0 5
10 15 20 25 30 35 40
4 8 12 16 20 24 28 32 36
B F
ram
e Pa
cket
Los
s [%
]
Number of Video receiving WTs (Jv)
Simple VQM Semantic VQM Adaptive, Semantic VQM
(d) Percentage of lost video packets re-lated to B frames
Figure 7.5: Video packet loss rates for different video queue management methodswith dynamic OFDM-FDMA
7.5(c)). Therefore, with high traffic load the preemptive removal of video packetsleads to less errors in the semantically more important frames. Due to error prop-agation a single error in an I- or P-frame affects a high number of frames withinthe video stream.
7.3.2 Results for static OFDM-FDMA
In contrast to the HTTP throughput gain, which can be achieved in combinationwith dynamic OFDM-FDMA, the employment of the adaptive or the semanticVQM in combination with static OFDM-FDMA leads to no benefit for the HTTPreceiving WTs. The results for the TCP bit-rate presented for the three examinedVQM in Figure 7.6 are basically the same.
This behavior is also presented by the results for the standard deviation andthe mean of the transmission time per Web-page. As shown in Figure 7.7 and
57

Chapter 7. Performance study of the proposed queue management method
50000 60000 70000 80000 90000
100000 110000 120000 130000 140000 150000
0 4 8 12 16 20 24 28 32 36
Avg
. HT
TP
WT
Thr
ough
put [
Bps
]
Number of Video receiving WTs (Jv)
Simple VQM Semantic VQM Adaptive, Semantic VQM
Figure 7.6: Average bit-rate of HTTP receiving WTs for different video queuemanagement methods with static OFDM-FDMA
3
4
5
6
7
8
9
10
0 4 8 12 16 20 24 28 32 36
Avg
. Pag
e T
rans
mis
sion
Tim
e [s
]
Number of Video receiving WTs (Jv)
Simple VQM Semantic VQM Adaptive, Semantic VQM
Figure 7.7: Average transmission time per Web-page for different video queuemanagement methods with static OFDM-FDMA
Figure 7.8 no gain can be achieved for the transmission of Web-pages if the semanticor the adaptive VQM is applied.
This is not the case regarding the results for the video metrics. The simulationresults obtained for the DIV (Figure 7.9), basically show the same tendency thanthe results for dynamic OFDM-FDMA: For all VQM the DIV values rise for higheramounts of video streams in the cell. Since the minimum DIV of 37% is largerthan the given threshold of 20% static OFDM-FDMA is clearly the worst choicefor this scenario, regardless which VQM is applied. In addition to the 12 HTTPreceiving WTs no video stream can be transmitted in acceptable quality. However,the behavior of the VQM in combination with static FDMA is interesting, since itshows the influence of the filtering process. The difference between the semanticand the simple VQM rises with Jv until the maximum of 6% is reached for Jv = 36.It rises slightly faster for the semantic VQM. For Jv < 16 the adaptive and thesemantic VQM results differ for up to 1% from the results for the simple VQM.In contrast to the dynamic OFDM-FDMA case, where also a slight decrease isachieved with both semantic VQM schemes, here the plain semantic VQM slightly
58

7.3. Analysis for a fixed number of HTTP traffic streams
0
1
2
3
4
5
6
7
0 4 8 12 16 20 24 28 32 36σ
Page
Tra
nsm
issi
on T
ime
[s]
Number of Video receiving WTs (Jv)
Simple VQM Semantic VQM Adaptive, Semantic VQM
Figure 7.8: Standard deviation of the transmission time per Web-page for differentvideo queue management methods with static OFDM-FDMA
30
40
50
60
70
80
90
100
4 8 12 16 20 24 28 32 36
DIV
[%]
Number of Video receiving WTs (Jv)
Simple VQM Semantic VQM Adaptive, Semantic VQM
Figure 7.9: DIV for different video queue management methods with static OFDM-FDMA
outperforms the adaptive strategy for low Jv.A further investigation is possible by taking a look at the packet loss rates in
Figure 7.10. The percentage of total lost video packets is the highest for the adap-tive VQM followed by the semantic approach. As discussed for dynamic OFDM-FDMA in section 7.3.1 higher total loss rates do not necessarily lead to higherDIV values. The packet loss rates for the semantically more important I and Pframes have to be considered in particular. The highest amount of packets relatedto I frames is lost with the simple VQM (9% for Jv = 36). The I frame loss ratesachieved with the semantic approach are much lower: Up to 6.3% of the trans-mitted video packets are lost if the semantic VQM is applied, while the adaptiveapproach results into a slightly lower packet loss of 6%.
The loss rates for the P frame related packets rise for all VQM with increasingJv. The highest loss rate of 21% and the highest slope are obtained with thesimple VQM. It is followed by the results for the adaptive VQM with a maximumP frame packet loss of 17% and by the semantic VQM, whose maximum loss isslightly lower. While the difference between the simple VQM and the other twoVQM slopes for low numbers of WTs it rises for the adaptive VQM in comparison
59

Chapter 7. Performance study of the proposed queue management method
to the plain semantic approach. Here up to 2% more P frame related packetsare lost with the adaptive VQM than with the semantic VQM. This explains thehigher DIV rate, in comparison to the semantic VQM, with the adaptive VQM forsmall Jv. Comparing the results in Figure 7.9 and Figure 7.10(c) it shows again,how the packet loss rate for the semantically important P frames affects the DIV.For higher Jv the loss rate for the simple VQM shows a higher increase than thosefor adaptive VQM. This directly results into a higher DIV increase for the simpleapproach.
The loss rate for the B frame related packets in Figure 7.10(d) show, thatthe adaptive VQM leads to the highest packet loss rate of up to 49%, which is9% higher than the loss rate, achieved with the semantic VQM. In contrast tothe combination with dynamic OFDM-FDMA, with static FDMA this offset isconstant for all Jv. Since, as for the P frames, the amount of removed packets doesnot depend on Jv, no load-adaptive removal of P and B frame related packets isperformed by the adaptive filter.
20 25 30 35 40 45 50 55 60 65 70 75
4 8 12 16 20 24 28 32 36
Vid
eo P
acke
t Los
s [%
]
Number of Video receiving WTs (Jv)
Simple VQM Semantic VQM Adaptive, Semantic VQM
(a) Percentage of total lost video pack-ets
1 2 3 4 5 6 7 8 9
10
4 8 12 16 20 24 28 32 36
I Fra
me
Pack
et L
oss
[%]
Number of Video receiving WTs (Jv)
Simple VQM Semantic VQM Adaptive, Semantic VQM
(b) Percentage of lost video packets re-lated to I frames
4 6 8
10 12 14 16 18 20 22
4 8 12 16 20 24 28 32 36
P Fr
ame
Pack
et L
oss
[%]
Number of Video receiving WTs (Jv)
Simple VQM Semantic VQM Adaptive, Semantic VQM
(c) Percentage of lost video packets re-lated to P frames
10 15 20 25 30 35 40 45 50
4 8 12 16 20 24 28 32 36
B F
ram
e Pa
cket
Los
s [%
]
Number of Video receiving WTs (Jv)
Simple VQM Semantic VQM Adaptive, Semantic VQM
(d) Percentage of lost video packets re-lated to B frames
Figure 7.10: Video packet loss rates for different video queue management methodswith static OFDM-FDMA
60

7.3. Analysis for a fixed number of HTTP traffic streams
0 500
1000 1500 2000 2500 3000 3500 4000 4500
4 8 12 16 20 24 28 32 36
Rem
oved
B F
ram
e Pa
cket
s
Number of Video receiving WTs (Jv)
Dynamic OFDM-FDMA Static OFDM-FDMA
(a) Amount of B frame related packetsremoved due to exceeded semanticdeadlines
0 200 400 600 800
1000 1200 1400 1600 1800
4 8 12 16 20 24 28 32 36
Rem
oved
P F
ram
e Pa
cket
s
Number of Video receiving WTs (Jv)
Dynamic OFDM-FDMA Static OFDM-FDMA
(b) Amount of P frame related packetsremoved during the second iterationof the adaptive filter
Figure 7.11: Average number of removed packets per WT with adaptive VQM fortwo OFDM-FDMA schemes
The reason for the higher P frame loss rates with the adaptive approach incomparison to the semantic VQM can be found by analyzing the loss rates sepa-rately for the iterations of the adaptive filter (Figure 6.2). As illustrated in figure7.11(a), with static FDMA up to 1136% more B frame related packets exceed theweighted deadline for Jv = 4 and are, therefore, removed in step 3 of the adaptiveVQM (Figure 6.1). These packets can not be considered by the adaptive filterin step 5 of the VQM. This leads to a more frequently invocation of the seconditeration of the filtering algorithm, where P frame packets are removed from thequeue. Thus, as shown in figure 7.11(b), 1428% more P frame related packets areremoved during the second iteration with static FDMA for Jv = 4, while due tothe more frequent execution of the adaptive filter this percentage rises for higherJv. This explains the high P frame packet loss rate with the adaptive approach,which results into a more drastic decrease of the video quality than the removal ofB frame related packets.
From the results for the HTTP metrics it follows that in combination withstatic OFDM-FDMA no benefit can be achieved with both semantic VQM for thetransmission of Web-pages. There, are two reasons for this: Firstly, due to thegeneral higher capacity limitation compared to dynamic OFDM-FDMA the earlierremoval of packets considering MPEG semantics leads only to a small amount offreed capacities. This leads to the discussed drawbacks for both types of trafficstreams. The second aspect is, that the obtained capacity can not be used for thetransmission of Web-pages by TCP. This can be explained by taking the averagenumber of TCP retransmission timeouts per WT into account which is shown inFigure 7.12. Here, the influence of the OFDM-FDMA scheme to TCP becomesclear. With lower capacities, which means rising Jv as well as less effective schedul-ing schemes, the amount of timeouts rises significantly. For example for Jv = 36
61

Chapter 7. Performance study of the proposed queue management method
the amount of timeouts occurring with the static scheduling is 14 times higherthan with the semi-dynamic scheme. Furthermore, it is shown that for dynamicOFDM-FDMA no timeouts occur – regardless which amount of traffic is loaded tothe system.
In Section 3.1 it has been discussed how TCP reacts if a retransmission timeoutoccurs. After the significant decrease of the bit-rate, the slow-start algorithm isperformed. Due to the halved congestion window threshold the following linearcongestion avoidance phase leads to a slower increase of the bit-rate than beforethe timeout. Considering the extended congestion avoidance phases, which becomelonger the more timeouts occur, it becomes clear why TCP is not capable to profitfrom the resources freed by the adaptive VQM if retransmission timeouts occur.
0
5
10
15
20
25
30
4 8 12 16 20 24 28 32 36
RE
XM
T ti
meo
uts
per
WT
�
Number of Video receiving WTs (Jv)
Dynamic OFDM-FDMA Semi-dynamic OFDM-FDMA Static OFDM-FDMA
Figure 7.12: Average number of TCP retransmission timeouts for 12 HTTP re-ceiving WTs for different OFDM-FDMA schemes
7.3.3 Results for semi-dynamic OFDM-FDMA
The investigation of semi-dynamic OFDM-FDMA in combination with the threeVQM leads to the same qualitative behavior of the results for the HTTP metricsas the investigation of the static FDMA scheme. Since no explicit difference be-tween the VQM can be found for the TCP throughput (Figure 7.13) and for themean and the standard deviation of the Web-page transmission time (Figure 7.14,Figure 7.15), no gain is achieved with the semantic or the adaptive VQM. Thereason for this is again the occurrence of TCP retransmission timeouts. Consid-ering Figure 7.12 for the semi-dynamic OFDM-FDMA it shows up that even lowamounts of timeouts make the capacity, freed by the VQM, unavailable to TCPrelated traffic streams. However, as known from Chapter 5, even for the WWWstreams the channel adaption leads to a general benefit compared to the staticcase.
The results for the DIV in Figure 7.16 clearly benefit from the improved sub-carrier assignment. The values are up to 37% smaller than with the static FDMAscheme (Section 5.6). Thus, up to 8 video receiving WTs can be supported at aacceptable video quality. The maximum difference of the results of both semantic
62

7.3. Analysis for a fixed number of HTTP traffic streams
80000 90000
100000 110000 120000 130000 140000 150000 160000 170000
0 4 8 12 16 20 24 28 32 36A
vg. H
TT
P W
T T
hrou
ghpu
t [B
ps]
Number of Video receiving WTs (Jv)
Simple VQM Semantic VQM Adaptive, Semantic VQM
Figure 7.13: Average bit-rate of HTTP receiving WTs for different video queuemanagement methods with semi-dynamic OFDM-FDMA
3
3.5
4
4.5
5
5.5
6
0 4 8 12 16 20 24 28 32 36
Avg
. Pag
e T
rans
mis
sion
Tim
e [s
]
Number of Video receiving WTs (Jv)
Simple VQM Semantic VQM Adaptive, Semantic VQM
Figure 7.14: Average transmission time per Web-page for different video queuemanagement methods with semi-dynamic OFDM-FDMA
VQM to the results of the simple VQM is 10% for Jv = 36. This is higher thanwith static OFDM-FDMA. Both semantic VQM approaches slightly outperformthe simple VQM for 1% on the average if Jv is small.
These small improvements for the video quality are reflected by the results forthe video packet loss rates in Figure 7.17. As with static FDMA the adaptive VQMleads to the smallest amount of lost packets related to I frames (3% for Jv = 36),while its P frame packet loss rate is up to 1% higher than the loss rate for the plainsemantic approach. Both packet loss rates for the semantic strategies increase lessfor rising Jv than those for the simple approach. In addition to the smaller absolutevalues this explains the improvement of the video quality with the adaptive andthe semantic VQM. The results for all shown B frame packet loss rates are smallerthan those for the static VQM and closer to the results for dynamic OFDM-FDMA.The highest amount of packets is removed with the semantic methods, whereby theadaptive VQM results in up to 4% more removed packets than the plain semanticapproach. It is interesting, that the slope of the adaptive VQM increases strongerfor rising Jv than the slope for the semantic VQM. This shows a slight adaption
63

Chapter 7. Performance study of the proposed queue management method
0.5
1
1.5
2
2.5
3
3.5
0 4 8 12 16 20 24 28 32 36
σ Pa
ge T
rans
mis
sion
Tim
e [s
]
Number of Video receiving WTs (Jv)
Simple VQM Semantic VQM Adaptive, Semantic VQM
Figure 7.15: Standard deviation of the transmission time per Web-page for differentvideo queue management methods with semi-dynamic OFDM-FDMA
10
20
30
40
50
60
70
80
90
4 8 12 16 20 24 28 32 36
DIV
[%]
Number of Video receiving WTs (Jv)
Simple VQM Semantic VQM Adaptive, Semantic VQM
Figure 7.16: DIV for different video queue management methods with semi-dynamic OFDM-FDMA
to the traffic load, which rises with Jv. However, this does neither provides asignificant improvement of the HTTP metrics nor an adequate increase of thevideo quality.
Although the benefit in this scenario basically results from the improved OFDM-FDMA scheme a very slight improvement is achieved for the DIV with both se-mantic VQM. Comparing the packet loss rates with those for the static FDMAscenario shows, that in this scenario adaption is performed by the load-adaptiveremoval of B frames. However, the best results are achieved with the combina-tion of adaptive VQM and dynamic OFDM-FDMA, whose performance is furtheranalyzed in Section 7.4.
64

7.3. Analysis for a fixed number of HTTP traffic streams
5 10 15 20 25 30 35 40 45 50 55 60
4 8 12 16 20 24 28 32 36
Vid
eo P
acke
t Los
s [%
]
Number of Video receiving WTs (Jv)
Simple VQM Semantic VQM Adaptive, Semantic VQM
(a) Percentage of total lost video pack-ets
0 1 2 3 4 5 6 7 8
4 8 12 16 20 24 28 32 36
I Fra
me
Pack
et L
oss
[%]
Number of Video receiving WTs (Jv)
Simple VQM Semantic VQM Adaptive, Semantic VQM
(b) Percentage of lost video packets re-lated to I frames
0 2 4 6 8
10 12 14 16
4 8 12 16 20 24 28 32 36
P Fr
ame
Pack
et L
oss
[%]
Number of Video receiving WTs (Jv)
Simple VQM Semantic VQM Adaptive, Semantic VQM
(c) Percentage of lost video packets re-lated to P frames
0 5
10 15 20 25 30 35 40 45
4 8 12 16 20 24 28 32 36
B F
ram
e Pa
cket
Los
s [%
]
Number of Video receiving WTs (Jv)
Simple VQM Semantic VQM Adaptive, Semantic VQM
(d) Percentage of lost video packets re-lated to B frames
Figure 7.17: Video packet loss rates for different video queue management methodswith semi-dynamic OFDM-FDMA
7.3.4 Interpretation
In this section the performance of the simple, the semantic and the adaptiveVQM was examined for the three OFDM-FDMA schemes. With the results forthe HTTP metrics presented for the combination of adaptive VQM and dynamicOFDM-FDMA in Section 7.3.1 and Figure 7.18 it is shown that the adaptive VQMprovides a clear benefit in cases where the Web-page receiving WTs and a highnumber of video receiving WTs are competing for the limited resources of thetransmission system. The high queuing delay in the high load scenarios leads tofalling throughput rates and rising transmission times for all the considered VQM.However, with the adaptive VQM the downgrade is much flatter than with the twonon-load-adaptive VQM which leads to gains for up to 83% for the HTTP trans-mission metrics. This is not the case if static or semi-dynamic OFDM-FDMA isemployed. In Section 7.3.2 and Section 7.3.3 no gains are achieved for the trans-mission of HTTP regardless which VQM is employed. As discussed in Section
65

Chapter 7. Performance study of the proposed queue management method
0102030405060708090
Bit-rate Mean transmissiontime
Stddev. transmissiontime
Max
imum
Gai
n [%
]Figure 7.18: Maximum gains achieved for the WWW traffic metrics with theadaptive VQM versus the simple VQM for the dynamic OFDM-FDMA schemeand a constant Jh
7.3.2 this is the result of the low transmission capabilities at the link layer. Dueto higher transmission delays the amount of video packets which hit their deadlinerises significantly (7.11(a)). These packets are removed from the access point queueand can not be considered by both semantic VQM. Therefore, in comparison to thesimple VQM the capacity gain, achieved by the adaptive filtering or the semanticremoval of video packets, is lower. As shown for the DIV metric in Figure 7.16and Figure 7.9 the slight capacity gain is utilized for the transmission of videostreams, which leads to a small DIV gain of 1% for the semi-dynamic approach.Here UDP, employed for the video transmission, outperforms TCP. Due to its flowcontrol schemes: congestion avoidance and slow-start, the TCP on the Web-serveris not capable to make use of the freed capacities within the small time scale. ThusUDP, where no flow control is implemented, utilizes these resources prior to TCP.
For the DIV rate basically no benefit was found. However, it is important thatthe adaptive and the semantic VQM do not lower the video quality significantly.Considering the DIV obtained for Jv < 16 a quality decrease of up to 2% showsup for both semantic approaches in combination with dynamic OFDM-FDMA.Although for low Jv the loss rates for I and P frame related packets are lower, theB frame packet loss rate is higher than with the simple VQM (Figure 7.5). Thisimplies that for Jv < 16 too many B frame packets are removed which results inlower quality than with the simple VQM. Therefore, the semantic weight for the Bframes, defined in Equation 4.8, is too low for this scenario. However, due to thelow DIV in this range the slight quality decrease is not perceptible for the viewer.
The video packet loss rates shown for the semi-dynamic OFDM-FDMA schemein Figure 7.17 illustrate how the adaptive VQM benefits from dynamic subcarrierassignment. While due to the high B frame packet loss rates with static OFDM-FDMA the adaption basically fails, it starts with the semi-dynamic OFDM-FDMA.
66

7.4. Analysis for varying numbers of HTTP traffic streams
7.4 Analysis for varying numbers of HTTP traf-
fic streams
In this section the combination of adaptive VQM with dynamic OFDM-FDMA isfurther examined. In order to analyze the dependency of the VQM from the traffic-load scenario, three different Jr setups with varying Jh and Jv are investigated.The results are shown versus Jv, while the maximum number of Jv depends on Jr
(Equation 7.2). Since various setups are investigated, the simulation results arepresented in a shorter form. In place of absolute values the gain of the adaptiveVQM in comparison to the other VQM schemes is shown. Although the showngains may increase for rising Jv it has to be considered that the results for allmetrics typically become worse if more video streams are “loaded” to the system.In order to investigate only the gains for acceptable video quality no results arepresented for the DIV if the threshold of 20% is exceeded.
In Section 7.4.1 the adaptive approach is compared to the simple VQM, whilein Section 7.4.2 adaptive and semantic VQM are compared. Finally, all results areconsidered in the discussion in Section 7.4.3.
7.4.1 Comparison of the simple VQM to the adaptive VQM
In Figure 7.19 the gain achieved by the adaptive VQM versus the simple approachis plotted for the TCP bit-rate of the HTTP receiving WTs. Considering theincrease of the results for rising Jv shows clearly, how the gain of the adaptive VQMdepends on the scenario, which is predetermined by Jr. The higher the amountof video streams, the higher is the achieved gain. For example, the comparison ofthe results at Jmax = 48 for Jr = 1/4 and Jr = 1 leads to the conclusion that 50%more video streams in the cell result in the additional gain of 21% for the adaptiveVQM on the average. For higher amounts of WTs the gain decreases for thosescenarios with higher proportions of Jh, starting at Jv = 8 for Jr = 1/4 and atJv = 20 for Jr = 1. This slope is not shown for the highest Jr considered, where75% of the WTs are receiving video streams. Here the gain at Jmax is with 26%only slightly higher than the gain of 25% for Jr = 1.
The high gain for the adaptive VQM versus the simple approach for the TCPthroughput is clearly reflected by the results for the Web-page transmission timemetrics, shown in Figure 7.20 and Figure 7.21. For the mean and the standarddeviation of the Web-page transmission time the gain rises for higher Jr and slopesfor the two lower Jr if Jmax is nearly reached. Although the highest gain for themean of 27% is achieved for Jr = 4 the maximum benefit of 73% for the standarddeviation of the Web-page transmission time is reached for Jr = 1.
The comparison of the DIV, obtained for the adaptive and the simple VQM,shows in Figure 7.22 how the combination of semantic weighting and the load-adaptive filtering influences the video quality. As with the investigation for a fixedJh in Section 7.3.1, here a quality decrease for low Jv shows up. This decrease ishigher for lower Jr and nearly achieves a maximum of 3% for Jr = 1/4. However,
67

Chapter 7. Performance study of the proposed queue management method
-5
0
5
10
15
20
25
30
4 8 12 16 20 24 28 32 36
Avg
. HT
TP
WT
Bit-
Rat
e G
ain
[%]
Number of Video receiving WTs (Jv)
Jr=1/4 Jr=1
Jr=4
Figure 7.19: HTTP bit-rate gain achieved with adaptive VQM compared to thesimple VQM for different Jr
-5
0
5
10
15
20
25
30
4 8 12 16 20 24 28 32 36Avg
. Pag
e T
rans
mis
sion
Tim
e G
ain
[%]
Number of Video receiving WTs (Jv)
Jr=1/4 Jr=1
Jr=4
Figure 7.20: Web-page transmission time gain achieved with adaptive VQM com-pared to the simple VQM for different Jr
the absolute values for the DIV, shown exemplarily for Jr = 1/4 in Figure 7.23,indicate only a small quality decrease with both semantic VQM, which does notaffect the DIV significantly. Since in this part of the performance study no DIVvalues larger than 20% are considered, basically no gains can be found. However,a very slight gain shows up for higher Jv with Jr = 4.
68

7.4. Analysis for varying numbers of HTTP traffic streams
-10
0
10
20
30
40
50
60
70
80
4 8 12 16 20 24 28 32 36
σ Pa
ge T
rans
mis
sion
Tim
e G
ain
[%]
Number of Video receiving WTs (Jv)
Jr=1/4 Jr=1
Jr=4
Figure 7.21: Gain for the standard deviation of the Web-page transmission timeachieved with adaptive VQM compared to the simple VQM for different Jr
-3
-2.5
-2
-1.5
-1
-0.5
0
0.5
4 8 12 16 20
DIV
Gai
n [%
]
Number of Video receiving WTs (Jv)
Jr=1/4 Jr=1
Jr=4
Figure 7.22: DIV gain achieved with adaptive VQM compared to the simple VQMfor different Jr
0 5
10 15 20 25 30 35 40 45 50
1 2 3 4 5 6 7 8 9
DIV
[%]
Number of Video receiving WTs (Jv)
Simple VQM Semantic VQM Adaptive, Semantic VQM
Figure 7.23: DIV for different video queue management methods and dynamicOFDM-FDMA for Jr = 1/4
69

Chapter 7. Performance study of the proposed queue management method
7.4.2 Comparison of the semantic VQM to the adaptiveVQM
In this section the gain achieved with the adaptive VQM versus the gain withthe semantic VQM is shown for the HTTP metrics and the DIV. One result fromSection 7.3.1 is, that the simple VQM is outperformed by the further developedsemantic VQM. Therefore, the gains presented in this section are generally lowerthan the results in comparison to the simple VQM. However, still a high benefit isshown for the HTTP metrics. For the HTTP bit-rate (Figure 7.24) gains of up to20% are achieved. The difference of 14% between the maximum achieved gains forJr = 1/4 and Jr = 4 shows, that the achieved benefit depends on the proportion ofvideo data in the queues. The gain achieved for Jr = 1 is with 1% slightly higherthan for Jr = 4. In contrast to Figure 7.19 no decrease for rising Jv is visible forJr = 1 if the adaptive VQM is compared to the plain semantic approach.
-2 0 2 4 6 8
10 12 14 16 18 20
4 8 12 16 20 24 28 32 36
Avg
. HT
TP
WT
Bit-
Rat
e G
ain
[%]
Number of Video receiving WTs (Jv)
Jr=1/4 Jr=1
Jr=4
Figure 7.24: HTTP bit-rate gain achieved with adaptive VQM compared to thesemantic VQM for different Jr
As for the TCP throughput the semantic VQM is clearly outperformed bythe adaptive approach for the Web-page transmission time. For the mean themaximum gain is 22% for Jr = 1 and 54% for the standard deviation for Jr = 4.With Jr = 1/4 for both metrics a decrease shows up for higher Jv, while a slightdecrease for Jr = 1 is visible only for the standard deviation if Jv > 20.
Although the rising gain for higher Jv is a clear benefit for the HTTP metricsthis is not true for the DIV since here the absolute results are too high for anacceptable video quality. The comparison of the DIV gains versus the semanticand the adaptive VQM in Figure 7.27 is interesting, since here the effect of theadaptive filtering is shown separately. For low Jv this leads to a DIV decrease of upto 1.5% for the adaptive strategy (Jr = Jv = 4). Due to the small absolute resultsfor the DIV, achieved for smaller Jv, the decrease in this range has no perceptibleeffect to the video. Also small gains can be found indicating that the semanticVQM is slightly outperformed by the adaptive approach. This is especially thecase for larger portions of video streams in the cell (Jr = 4) and higher Jv, wherea gain up to 1.6% can be found.
70

7.4. Analysis for varying numbers of HTTP traffic streams
-5
0
5
10
15
20
25
4 8 12 16 20 24 28 32 36Avg
. Pag
e T
rans
mis
sion
Tim
e G
ain
[%]
Number of Video receiving WTs (Jv)
Jr=1/4 Jr=1
Jr=4
Figure 7.25: Web-page transmission time gain achieved with adaptive VQM com-pared to the semantic VQM for different Jr
-10
0
10
20
30
40
50
60
4 8 12 16 20 24 28 32 36
σ Pa
ge T
rans
mis
sion
Tim
e G
ain
[%]
Number of Video receiving WTs (Jv)
Jr=1/4 Jr=1
Jr=4
Figure 7.26: Gain for the standard deviation of the Web-page transmission timeachieved with adaptive VQM compared to the semantic VQM for different Jr
-1.5
-1
-0.5
0
0.5
1
1.5
2
4 8 12 16 20
DIV
Gai
n [%
]
Number of Video receiving WTs (Jv)
Jr=1/4 Jr=1
Jr=4
Figure 7.27: DIV gain achieved with adaptive VQM compared to the semanticVQM for different Jr
71

Chapter 7. Performance study of the proposed queue management method
7.4.3 Interpretation
In this section the performance of the adaptive VQM in combination with dynamicOFDM-FDMA is investigated for varying amounts of video and HTTP receivingWTs in the cell. For the analyzed scenarios it is shown that the combination ofadaptive VQM and dynamic OFDM-FDMA clearly outperforms the simple andthe semantic VQM. The highest gains are typically achieved for high amounts ofWTs if more than 50% of the heterogeneous traffic is streaming video. For thesehigh-load scenarios the adaptive filtering provides an additional acceleration of theHTTP transmission. The maximum gains achieved with the adaptive VQM aresummarized in Figure 7.28. The highest benefit is obtained for the standard devi-ation of the Web-page transmission time, where the simple VQM is outperformedby up to 73% and the plain semantic strategy by up to 54%.
0
10
20
30
40
50
60
70
80
Bit-rate Mean transmissiontime
Stddev. transmissiontime
Max
imum
Gai
n [%
]
vs. simple VQM vs. semantic VQM
Figure 7.28: Maximum gains achieved for the WWW traffic metrics with theadaptive VQM in comparison to the simple and to the semantic VQM for scenarioswith varying Jh and Jv
In general the benefit is higher, the higher the proportion of video data com-pared to the Web-traffic is. While this is more critical for Jr < 1 in the consideredscenarios the VQM is not too sensitive. This is shown by the results obtained forthe worst considered case with Jr = 1/4, i.e. only 25% of WTs in the cell arereceiving video streams. Here the benefit which is achieved for the bit-rate bythe adaptive VQM versus the simple scheme decreases for up to 21% in compar-ison to the scenarios with higher amounts of video traffic. However, even for lowproportions of video streams in the queues benefits of up to 19% can be achieved(Figure 7.21). Although in general the gain rises for the HTTP metrics with risingnumbers of WTs, in the scenarios for Jr ≤ 1 the benefit starts to decrease froma specific Jv. Since as discussed in Section 6.2 rising traffic load stands for thedisproportion of the demanded and the available resources of the transmission sys-tem, this decrease can be explained with basically the same argumentation thanwith static OFDM-FDMA in Section 7.3.4: Due to the high traffic load, caused bymany WTs in the cell the rising queuing delays cause more video packets to hittheir deadline. These packets are removed in the basic algorithm of the adaptiveVQM and can not be considered in the further filtering process anymore. How-
72

7.4. Analysis for varying numbers of HTTP traffic streams
ever, for higher Jr the increase of traffic load does not necessarily lead to drasticgain decreases. As shown for the standard deviation of the Web-page transmissiontime for Jr = 1 also slightly higher gains are possible for scenarios with lowerpercentages of video WTs.
The influence of the adaptive filtering to the video quality is represented bythe DIV rate. In Section 7.4.1 the DIV rate resulting from the adaptive VQM iscompared to the rate achieved with the simple VQM. As for fixed Jh in Section7.3.1 a slight decrease shows up for small numbers of video streams in the cell. Thisis exemplarily shown for Jr = 1/4 in Figure 7.23, whereby the maximal decreaseof 3% results from the employment of both semantic VQM approaches. Since itoccurs in a range, where the absolute DIV rate is low, it causes no perceptibleinfluence to the video quality. As for the HTTP transmission metrics the DIVgain starts to slope from a specific Jv. The comparison of the DIV achieved withadaptive VQM versus the semantic VQM has to be considered in particular. Sincethe semantic weighting is done by both VQM here only the influence of the adaptivefiltering is shown. As presented in Figure 7.27 for low numbers of video streamsthe filter leads to a DIV decrease of up to 1%. As discussed above this does notcause drastic distortions to the video stream and is clearly justified by the benefitthe adaptive VQM achieves for the HTTP transmission metrics of up to 54%.
73

Chapter 8
Conclusions and future work
In this thesis the performance of the dynamic OFDM-FDMA scheduling schemesfor a heterogeneous traffic scenario was studied. Therefore, the simultaneous trans-mission of MPEG-4 coded VBR video streams and Web-pages was considered. InChapter 5 three different combinations of dynamic OFDM-FDMA optimizationschemes were investigated. Static OFDM-FDMA is the trivial case, where noadaption is performed. Semi-dynamic OFDM-FDMA stands for the dynamic as-signment of subcarriers according to the measured channel states. The third case,dynamic OFDM-FDMA, considers the state-dependent assignment in combinationwith a dynamic multiple access scheme. This dynamic FDMA scheme enables theadaption to the varying application traffic load. It was shown, that the dynamicOFDM-FDMA approach clearly outperforms the static and the semi-dynamic casefor the transmission of Web-pages and MPEG-4 video. With dynamic OFDM-FDMA the average transmission time of a Web-page is accelerated for up to 100%while up to 215% gain is obtained for its standard deviation. Furthermore, thesimulation results show, that with dynamic OFDM-FDMA the quality of the trans-mitted video is increased for up to 37% in comparison to the static approach. Afurther comparison of the results for the three OFDM-FDMA schemes leads to theconclusion that the main part of the benefit is achieved with the dynamic sub-carrier assignment. The gain starts to decrease for the dynamic multiple accessscheme if typically the half of the maximum number of video receiving WTs percell is reached.
For scenarios with high load of heterogeneous traffic the adaptive VQM wasdeveloped. It was proposed in Chapter 6 of this thesis. Considering applicationlayer information this scheduling policy performs the load-adaptive filtering ofvideo streams on top of the employed OFDM-FDMA schemes. Compared to thesimple FIFO approach the adaptive VQM leads to performance gains of up to33% for the mean and up to 83% for the standard deviation of the Web-pagetransmission time in addition to the gains achieved with dynamic OFDM-FDMA.This was found for scenarios with a high load of video traffic per cell.
Even though these scenarios may occur with best-effort networks as the Internetthey are not characteristic. Most of the users will give up watching the videostream due to the bad quality. However, even with lower proportions of video on
74

the over-all traffic load still acceptable results can be achieved (Section 7.4).No performance increase for the transmission of Web-pages can be achieved
if the adaptive VQM is applied on top of static or semi-dynamic OFDM-FDMA.This is also found in case of semantic VQM, proposed in [35]. A further result ofthe performance study in Chapter 7 is, that the achieved benefit for the HTTPtransmission continuously rises for increasing amounts of video streams in the cell.
High traffic load leads in general to a drastic distortion of the transmitted videostreams. Although this can be not prevented by the adaptive VQM, it is shownthat its application does not lead to perceptible quality decreases.
The investigations show further, that the semantic VQM is clearly outper-formed by the adaptive approach. For HTTP the comparison of the gains achievedwith both schemes leads to gains for the adaptive VQM of up to 20% for TCPthroughput and up to 54% for the standard deviation of the Web-page transmis-sion time. Thus, the adaptive removal of video packets is more advantageous thanthe reactive scheduling strategy of the semantic VQM.
Beside the performance, the clear modular structure of the adaptive VQM hasto be considered: The strict separation of the load estimation and the adaptive fil-ter enables the adoption for other coding technologies than MPEG-4 and simplifiesthe development of new filter algorithms.
Due to the achieved performance increase and its generic design the adaptiveVQM seems to be worth to be further investigated. For this purpose the followingaspects show up in this thesis:
• Algorithm complexity:This important factor and the resulting cost have to be considered for thedeployment of the adaptive VQM in transmission systems.
• Performance study for lowered algorithm complexity:The design of the adaptive VQM already considers the trade-off betweencalculation complexity and performance gain. With larger execution intervalsthe calculation overhead can be lowered by taking drawbacks for the adaptioninto account. It has to be examined how the adaptive VQM performs in thiscase.
• Further investigation of the contention of TCP and UDP for the capacitiesfreed by the adaptive VQM:Although this topic was raised in the performance study of the adaptiveVQM in combination with static and semi-dynamic OFDM-FDMA a moredetailed study seems to be reasonable. Its results may lead to an extensionof the VQM which directly avoids TCP retransmission timeouts.
• Improvement of the adaptive filtering algorithm:Aiming at additional performance gains – especially for lower percentagesof video traffic in the cell – or the decrease of the algorithm complexity, forthe development of new filtering algorithms two directions show up: At firstthe actual packet-drop filter can be enhanced in order to consider further
75

Chapter 8. Conclusions and future work
semantic features of the video streams. For example, considering the macro-block layer of MPEG a chess board like removal of macro-blocks could beimplemented. Secondly, new filter approaches, e.g. re-quantization- andslicing filter could lead to better results.
• Optimization of the considered parameters:This includes the semantic weights, which are only heuristics taken from [35]as well as the parameter α chosen for the load estimation. The ideal solutionwould be a self-optimizing algorithm, which adapts those parameters to theactual scenario.
Common for all investigated optimization schemes is, that additional complexityis added to the system. Thus, it has to be analyzed whether the achieved perfor-mance gain legitimates the complexity increase, considering technical and finallyeconomical metrics.
76

Appendix A
Scenario independent parameters
In the tables all the applied parameters are shown, which were left constant duringthe whole simulation. The list starts with the parameters for the radio channeland ends with those for the application layer.
Channel Modeling Parameters ValueMaximum Speed of the WTs (vmax) 1 m/sDelay spread standard deviation (σ∆τ) 0.15 µsPath loss reference loss (10 log K) 46.7 dBPath loss exponent (α) 2.4Shadowing standard deviation (σ) 5.8
Table A.1: Values of radio channel modeling parameters for an indoor environmentas defined in [1]
Physical Layer Parameters ValueTotal bandwidth (B) 16.25 MHz in the 5.2 GHz bandNumber of subcarriers (S) 48Maximum transmit power/subcarrier (Ptx) 0.2 mW (−7 dBm)Subcarrier spacing 312.5 kHzThermal noise power level (n0) −117 dBmSymbol time (Ts) 4 µsSEP threshold (Ps) 0.01
Table A.2: Values of the physical layer parameters according to the IEEE 802.11aWLAN standard [28]
77

Appendix A. Scenario independent parameters
MAC Frame Element DurationMAC frame (Tf ) 2ms (500 Symbols)Downlink- and Uplink phase 1ms (250 Symbols)Downlink phase payload field [23] 0.968ms (242 Symbols)
Table A.3: Timing structure of a single MAC frame according to HIPERLAN/2[11] and [23]
Session Level Parameter Distribution Function Distribution F. ParametersSession-inter-time Exponential µ (variable)Pages per session Log normal µ = 25.807 pages/session
σ = 78.752 pages/sessionPage Level Parameters Distribution Function Distribution F. ParametersPage-inter-time Gamma µ = 35.286 s
σ = 147.39 sPage Size Pareto α = 1.7584
β = 30458 Bytes
Table A.4: Distribution functions and values of the WWW traffic model as definedin [54] for the corporate environment
MPEG-4 Video Parameters ValueGOP 12-GOP: IBBPBBPBBPBBMean bit-rate 951 KBpsFrame size 352× 288 Pixel (CIF)Frame-rate 25 frames/sVideo length 4500 frames, i.e. 180 s
Table A.5: Applied MPEG-4 video parameters
78

Appendix B
Acronyms
16-QAM 16 Quadrature Amplitude Modulation
64-QAM 64 Quadrature Amplitude Modulation
256-QAM 256 Quadrature Amplitude Modulation
ADA Advanced Dynamic Algorithm
BPSK Binary Phase Shift Keying
CDMA Code Division Multiple Access
CPU Central Processing Unit
CIF Common Intermediate Format
CNR Channel Gain-to-Noise Ratio
DFT Discrete Fourier Transform
DIV Distortion In Interval
FBFQ Frame-Based Fair Queueing
FDMA Frequency Division Multiple Access
FFT Fast Fourier Transform
FIFO First-In-First-Out
GOP Group of Pictures
HTTP Hypertext Transfer Protocol
HTML Hypertext Mark-up Language
ICI Inter-carrier Interference
79

Appendix B. Acronyms
IEEE Institute of Electrical and Electronics Engineers, Inc.
IETF Internet Engineering Task Force
IP Internet Protocol
ISI Inter-Symbol Interference
ITU International Telecommunication Union
IWFQ Idealized Weighted Fair Queueing
LAN Local Area Networks
MAC Medium Access Control
MCM Multi Carrier Modulation
MPEG Moving Picture Experts Group
MOS Mean Opinion Score
MSS Maximum Segment Size
MTU Maximum Transmission Unit
OFDM Orthogonal Frequency Division Multiplexing
PSNR Peak Signal-to-Noise Ratio
QoS Quality of Service
QPSK Quadrature Phase Shift Keying
RTT Round-Trip-Time
SEP Symbol Error Probability
SCM Single Carrier Modulation
SNR Signal-to-Noise Ratio
TCP Transmission Control Protocol
TDMA Time Division Multiple Access
UDP User Datagram Protocol
UWB Ultra Wideband
VBR Variable Bit-Rate
VQM Video Queue Management
80

Appendix B. Acronyms
WAN Wide Area Network
WLAN Wireless Local Area Networks
WTs Wireless Terminals
WWW World-Wide-Web
81

Appendix B. Acronyms
82

Bibliography
[1] A. Aguiar and J. Gross. Wireless channel models. Technical Report TKN-03-007, Telecommunication Networks Group, April 2003.
[2] A. Bakne and B. R. Badrinath. I-TCP: indirect TCP for mobile hosts. In Proc.Fifteenth Int. Conference on Distributed Computer Systems, IEEE, pages 136–143, 1995.
[3] H. Balakrishnan, S. Seshan, and R. H. Katz. Improving reliable transportand handoff performance in cellular wireless networks. In Proc. ACM MobileComputing and Networking Conf., pages 2–11, 1995.
[4] P. Barford and M. E. Crovella. Generating represantive web workloads fornetwork and server performance evaluation. In Proc. of the ACM SIGMET-RICS ’98, 1998.
[5] T. Berners-Lee, R. Fielding, and H. Frystyk. Hypertext transfer protocol –HTTP/1.0. RFC 1945, IETF, May 1996.
[6] P. Bhagwat, P. Bhattacharya, A. Krishna, and S. Tripathi. Enhancingthroughput over wireless LANs using channel state dependent packet schedul-ing. In IEEE INFOCOM, 1994.
[7] J. Cavers. Mobile Channel Characteristics. Kluwer Academic, 2000.
[8] R. W. Chang. Synthesis of band-limited orthogonal signals for multichanneldata transmission. Bell Systems Technical Journal, 45, December 1966.
[9] ETSI. Broadband radio access networks (BRAN); HIPERLAN type 2; systemoverview. Technical Report TR 101 683, February 2000.
[10] ETSI. Digital video broadcasting (DVB); OFDM modulation for microwavedigital terrestrial television. EN 301 701, August 2000.
[11] ETSI. Broadband Radio Access Networks (BRAN); HIPERLAN Type 2; DataLink Control (DLC) Layer; Part 1: Basic Data Transport Functions, TS 101-761-1 edition, December 2001.
[12] ETSI. Broadband Radio Access Networks (BRAN); HIPERLAN Type 2; Phys-ical (PHY) Layer, TS 101-475 edition, December 2001.
83

Appendix C. Bibliography
[13] ETSI. Radio broadcasting systems; digital audio broadcasting (DAB) to mo-bile, portable and fixed receivers. EN 300 401, May 2001.
[14] R. Fielding, J. Gettys, J. Mogul, and H. Frystyk et al. Hypertext transferprotocol – HTTP/1.1. RFC 2068, IETF, January 1997.
[15] F. Fitzek, P. Seeling, M. Reisslein, and M. Rossi et al. Investigation of theGoP structure for H.26L video streams. Technical Report acticom-02-004,acticom mobile networks, December 2002.
[16] S. Floyd and T. Henderson. The NewReno modification to TCP’s fast recoveryalgorithm. RFC 2582, IETF, April 1999.
[17] C. Fraleigh, S. Moon, B. Lyles, and C. Cotton et al. Packet-level trafficmeasurements from the sprint IP backbone. IEEE Network, November 2003.
[18] A. Francini and F. M. Chiussi. A weighted fair queueing scheduler withdecoupled bandwidth and delay guarantees for the support of voice traffic. InProc. of Internet Performance Symposium (IPS), November 2001.
[19] J. Gross, H. Karl, F. Fitzek, and A. Wolisz. Comparison of heuristic andoptimal subcarrier assignment algorithms. In Proc. of the 2003 InternationalConference on Wireless Networks (ICWN’03), June 2003.
[20] J. Gross, J. Klaue, H. Karl, and A. Wolisz. Subcarrier allocation for variablebit rate video streams in wireless OFDM systems. In Proc. of VehicularTechnology Conference (VTC Fall), Florida, USA, 2003.
[21] J. Gross, J. Klaue, H. Karl, and A. Wolisz. Cross-layer optimization of OFDMtransmission systems for MPEG-4 video streaming. Computer Communica-tions, 2004.
[22] J. Gross, S. Valentin, H. Karl, and A. Wolisz. A study on the impact ofinband signaling and realistic channel knowledge for an example dynamicOFDM-FDMA system. to appear in Computer Communications, 2004.
[23] J. Gross, S. Valentin, and R. Vu. Dynamic OFDM-FDMA systems underrealistic assumptions: On the influence of channel knowledge and inband sig-naling. Technical Report TKN-04-[to appear], Telecommunication NetworksGroup, Technische Universitat Berlin, September 2004.
[24] R. Grunheid. Vielfachzugriffsverfahren fur die Multitrager-Ubertragungs-technik. Dissertation, TU Braunschweig, 2000.
[25] M. Hemy, U. Hengartner, P. Steenkiste, and T. Gross. MPEG system streamsin best-effort networks. In Proc. Packet Video ’99, New York, USA, April1999.
84

Appendix C. Bibliography
[26] M. Hemy, P. Steenkiste, and T. Gross. Evaluation of adaptive filtering ofMPEG system streams in IP networks. In Proc. IDME, 2000.
[27] International Engineering Consortium (IEC). UMTS protocols and protocoltesting, 2003.
[28] IEEE. Supplement to standard for telecommunications and information ex-change between systems – LAN/MAN Specific requirements – Part 11: Wire-less LAN MAC and PHY specifications: High speed physical layer in the 5-GHzband, P802.11a/D7.0 edition, July 1999.
[29] IEEE. IEEE Standard for Information technology – Telecommunications andinformation exchange between systems – LAN/MAN Specific requirements –Part 11: Wireless LAN MAC and PHY Layer specifications: – Amendment4: Further higher-speed physical layer extension in the 2.4 GHz band, Std802.11g, 1999 (reaff 2003) edition, 2003.
[30] University of Southern California Information Sciences Institute. Internetprotocol DARPA Internet program protocol specification. RFC 791, DARPA,September 1981.
[31] University of Southern California Information Sciences Institute. Transmissioncontrol protocol DARPA Internet program protocol specification. RFC 793,DARPA, September 1981.
[32] ITU. ITU-T Recommendation P.930 – Principles of a reference impairmentsystem for video, August 1996.
[33] V. Jacobson. Berkeley TCP evolution from 4.3-Tahoe to 4.3-Reno. In Proc.of the Eighteenth Internet Engineering Task Force, page 365, September 1990.
[34] V. Jacobson and M. J. Karels. Congestion avoidance and control. In ComputerCommunication Review, volume 18, pages 314–329, August 1988.
[35] J. Klaue, J. Gross, H. Karl, and A. Wolisz. Semantic-aware link layer schedul-ing of MPEG-4 video streams in wireless systems. In Proc. of Applicationsand Services in Wireless Networks (ASWN), Bern, Switzerland, July 2003.
[36] P. Klenner. Das OFDM Multitragerverfahren. Universitat Bremen, June 2004.
[37] B. Krongold, K. Ramchandran, and D. Jones. Computationally efficient op-timal power alloction algorithms for multicarrier communication systems. InProc. of IEEE Int. Conference on Communications (ICC), pages 1018–1022,1998.
[38] H. W. Kuhn. The hungarian method for the assignment problem. NavalResearch Logistics Quarterly 2, 1955.
85

Appendix C. Bibliography
[39] T. Le-Ngoc, N. Damji, and Y. Xu. Dynamic resource allocation for multimediaservices over OFDM downlink in cellular systems. In Proc. of Spring VehicularTechnology Conference (VTC Spring), 2004.
[40] D. A. Menasce and V. A. F. Almeida. Capacity Planning For Web Perfor-mance. Prentice Hall, Inc., Upper Saddle River, NJ, USA, first edition, 1998.
[41] X. Meng, H. Yang, and S. Lu. Application-oriented multimedia schedulingover lossy wireless networks. In Proc. of IEEE ICCCN’02, October 2002.
[42] M. Miyabayashi, N. Wakamiya, M. Murata, and H. Miyahara. MPEG-TFRCP: video transfer with TCP-friendly rate control protocol. In Proc.of IEEE Int. Conference on Communications (ICC), 2001.
[43] B. Moraru, F. Copaciu, G. Lazar, and V. Dobrota. Practical analysis ofTCP implementations: Tahoe, Reno, NewReno. In RoEduNet InternationalConference, pages 125–130, June 2003.
[44] K. N. Ngan, C. W. Yap, and K. T. Tan. Video Coding for Wireless Com-munication Systems. Signal Processing and Communications. Marcel Dekker,Inc., 2070 Madison Avenue, NY, USA, 2001.
[45] J. Nieh. The Design Implementation, and Evaluation of SMART: A Schedulerfor Multimedia Applications. Dissertation, Department of Electrical Engineer-ing, Stanford University, June 1999.
[46] NTIA Office of Spectrum Management. US frequency allocationchart. Retreived September 3, 2004 from http://www.ntia.doc.gov
/osmhome/allochrt.html.
[47] B. O’Hara and A. Petrick. IEEE 802.11 Handbook: A designers companion.IEEE Press, 1999.
[48] J.-R. Ohm. Bildsignalverarbeitung fur Multimedia-Systeme. TU Berlin, 1999.
[49] P802.15. Wireless personal networks; P802.15.3a alt PHY selection criteria.Technical Report 03/031e5, IEEE, December 2002.
[50] S. Pietrzyk and G. J. M. Janssen. Multiuser subcarrier allocation for QoSprovision in the OFDMA systems. In Proc. of IEEE Vehicular TechnologyConference Fall 2002, September 2002.
[51] J. Postel. User datagram protocol. RFC 768, ISI, August 1980.
[52] J. Proakis. Digital Communications. McGraw-Hill, 1995.
[53] T. Rappaport. Wireless Communications Principles & Practice. PrenticeHall, Inc., Upper Saddle River, NJ, USA, 1999.
86

Appendix C. Bibliography
[54] A. Reyes-Lecuona, E. Gonzalez-Parada, E. Casilari, and J. C. Casasola et al.A page-oriented WWW traffic model for wireless system simulations. In Proc.ITC 16, June 1999.
[55] M. J. Riley and I. E. G. Richardson. Digital Video Communications. ArtechHouse, 1997.
[56] R. Srikant S. Lu, V. Bharghavan. Fair scheduling in wireless packet networks.In Proc. of the ACM SIGCOMM ’97 conference on Applications, technologies,architectures, and protocols for computer communication, September 1997.
[57] W. Stallings. Data and Computer Communications. Prentice-Hall, Inc., UpperSaddle River, NJ, USA, sixth edition, 2000.
[58] W. R. Stevens. TCP/IP Illustrated Volume 1. Professional Computing Series.Addison-Wesley Longman, Inc., 1994.
[59] A. S. Tanenbaum. Computer networks. Prentice-Hall, Inc., Upper SaddleRiver, NJ, USA, third edition, 1996.
[60] D. Thie and J. Flohrer. Modellierung des Datenverkehrs von WWW-Clienten.In Proc. MMB’99, September 1999.
[61] A. Varga. OMNeT++ discrete event simulation system. Software is availableon the Internet: http://www.omnetpp.org (verified September 7, 2004), June2003. (Release 2.3).
[62] P. Vary, U. Heute, and W. Hess. Digitale Sprachsignalverarbeitung. B. G.Teubner, Stuttgart, Germany, 1998.
[63] K. Wehrle, J. Reber, D. Holzhausen, and V. Boehm et al. The OM-NeT++ Internet protocol suite. Software is available on the Internet:http://www.omnetpp.org (verified September 7, 2004), December 2001.
[64] C. Y. Wong, R. S. Cheng, K. B. Letaief, and R. D. Murch. Multiuser OFDMwith adaptive subcarrier, bit, and power allocation. IEEE Journal on SelectedAreas in Communications, 17(10), October 1999.
[65] N. Yeadon, F. Garcıa, D. Hutchison, and D. Shepherd. Continuous mediafilters for heterogeneous internetworking. In Proc. of SPIE Multimedia Com-puting and Networking (MMCN’96), San Jose, USA, January 1996.
87

Appendix C. Bibliography
88

Erklarung der Urheberschaft
Die selbststandige und eigenhandige Anfertigung der vorliegenden Magisterarbeitversichere ich an Eides statt.
Ort, Datum Unterschrift
89