Embed Size (px)
Citation preview

Scheme of Arrangement - Highlights

• BPO – Business Process Outsourcing• CAGR – Compounded Annual Growth Rate• CCI - Competition Commission of India• Cr. - Crores• CRAR - Capital Adequacy Ratio/ Capital to Risk (Weighted) Assets
Ratio• CV - Commercial Vehicle• EBITDA – Earnings Before Interest Tax Depreciation and
Amortisation• EPS - Earnings per Share• FS - Financial Services• FY – Financial Year• HCV – Heavy Commercial Vehicle• IMPAL – India Motor Parts And Accessories Ltd• JV – Joint Venture• LCV – Light Commercial Vehicle• LGF – Lakshmi General Finance• M&HCV – Medium and Heavy Commercial Vehicle• MUV – Multi Utility Vehicle• NAV – Net Asset Value• NCLT - National Company Law Tribunal
• NNPA - Net Non-Performing Assets• P.a – Per Annum• PAT – Profit After Tax• RBI – Reserve Bank of India• RoA - Return on Assets• ROCE – Return on Capital Employed• RoE - Return on Equity• Rs. - Rupees• SBIL – Sundaram BPO India Limited• SBSL – Sundaram Business Services Limited• SEBI - Securities and Exchange Board of India• SFIL - Sundaram Finance Investments Limited• SFL - Sundaram Finance Limited• SIAM - Society of Indian Automobile Manufacturers• SME - Small and Medium Enterprises
GLOSSARY
2
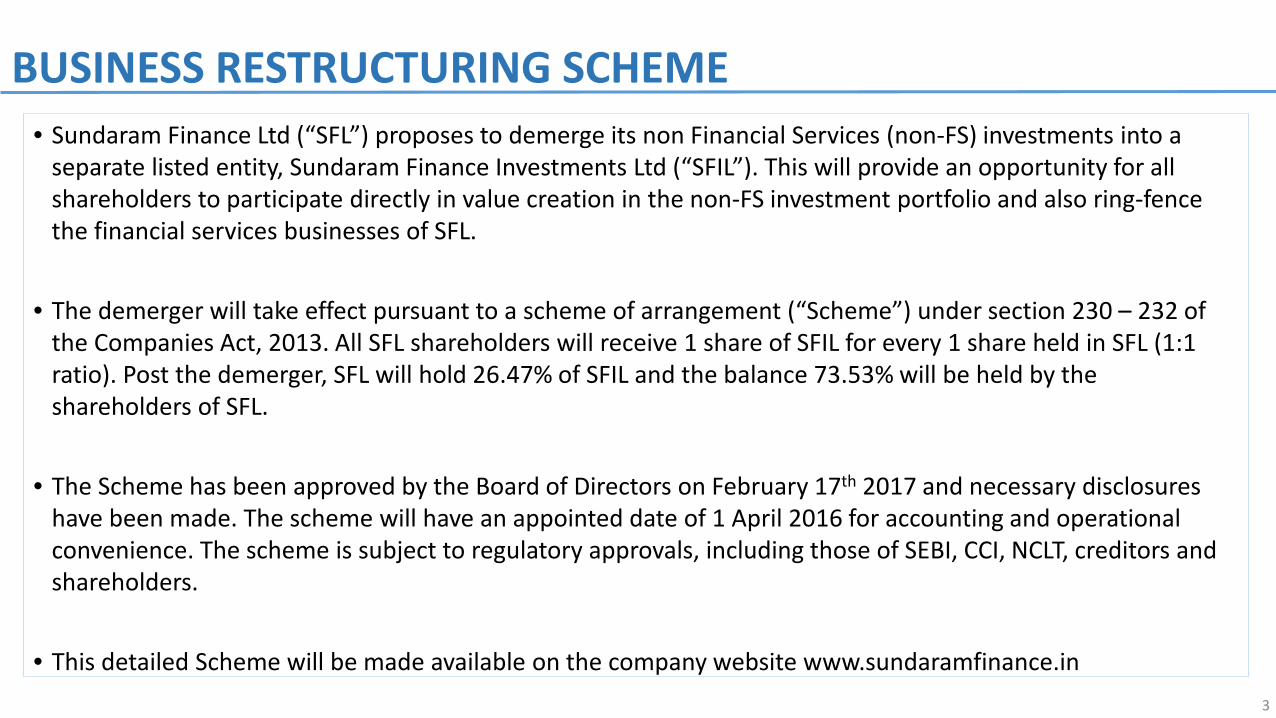
BUSINESS RESTRUCTURING SCHEME• Sundaram Finance Ltd (“SFL”) proposes to demerge its non Financial Services (non-FS) investments into a
separate listed entity, Sundaram Finance Investments Ltd (“SFIL”). This will provide an opportunity for all shareholders to participate directly in value creation in the non-FS investment portfolio and also ring-fence the financial services businesses of SFL.
• The demerger will take effect pursuant to a scheme of arrangement (“Scheme”) under section 230 – 232 of the Companies Act, 2013. All SFL shareholders will receive 1 share of SFIL for every 1 share held in SFL (1:1 ratio). Post the demerger, SFL will hold 26.47% of SFIL and the balance 73.53% will be held by the shareholders of SFL.
• The Scheme has been approved by the Board of Directors on February 17th 2017 and necessary disclosures have been made. The scheme will have an appointed date of 1 April 2016 for accounting and operational convenience. The scheme is subject to regulatory approvals, including those of SEBI, CCI, NCLT, creditors and shareholders.
• This detailed Scheme will be made available on the company website www.sundaramfinance.in3

Snapshot of Sundaram Finance Limited
Details of Scheme
Details of Non Financial Services Investments
INDEX
4

Promoters, 36.16%
Institutional Investors,
18.20%
Public, 45.64%
SNAPSHOT OF SUNDARAM FINANCE LIMITED
Key Investments*• Royal Sundaram General Insurance provides customised general insurance solutions to
individuals, families and businesses and specially designed products to SMEs and rural customers. Its Gross Written Premium for FY2016 stood at Rs. 1703 Cr.
• Sundaram Asset Management is the investment manager to Sundaram Mutual Fund. The company is one of the pioneers in the Indian fund management industry with average assets under management (mutual fund) of Rs.23,664 Cr. for FY2016
• Sundaram BNP Paribas Home Finance, a joint venture between Sundaram Finance Ltd. and BNP Paribas Group, provides home loans and loans against property to salaried and self employed customers. As on 31 March 2016, it had a loan outstanding of Rs. 7,489 Cr.
Key Investments
Shareholding PatternOverviewIncorporated in 1954, Sundaram Finance is a leading player in retail finance with presence across multiple facets of the financial services industry including vehicle finance, home finance, mutual funds, general insurance and financial services distribution. The company operates through 586 branches across the country and had 3,465 employees as of 31 March 2016. It has more than 65,000 Depositors and over 3 lakh commercial vehicle and car finance customers.As on 31 March 2016, the total Assets under Management for SFL stood at Rs. 17,895 Cr., of which commercial vehicles accounted for 51.7%, cars accounted for 32.9% and the balance comprised of construction equipment, tractors and others.
(Holdings, %)
Royal Sundaram General Insurance
Sundaram Finance Ltd.
75.9%
Sundaram Asset Management
100%
Sundaram BNP Paribas Home Finance
50.1%
Shareholding Pattern as on 31 March, 2016
(Holdings, %)
*Top 3 investments by value as on 31 March, 2016 5

Consolidated Financials (Rs. in Cr.) FY12 FY13 FY14 FY15 FY16 H1 FY17 3Yr CAGR 5Yr CAGR
Total Revenue 3,038 3,710 4,125 4,294 5,035 2,719 10.7% 15.6%
Profit after Tax 458 564 581 576 583 303 1.1% 8.4%
Net worth 2,165 2,614 3,080 3,750 4,195 4,499 17.1% 18.4%
Total Assets 18,210 22,046 23,914 25,785 28,027 29,515 8.3% 14.2%
EPS (Rs.) 41.21 50.76 52.30 51.83 52.49 27.28
NNPA 0.08% 0.38% 0.46% 0.60% 0.94% 1.2%
RoA 2.7% 2.8% 2.5% 2.3% 2.2% 2.1%
RoE 23.1% 23.6% 20.4% 16.9% 14.7% 13.9%
CRAR (Standalone) 16.3% 17.9% 18.2% 21.4% 18.4% 18.2%
KEY FINANCIALS OF SUNDARAM FINANCE LIMITED
3 Year CAGR refers to growth between FY’13 and FY’165 Year CAGR refers to growth between FY’11 and FY’16
Note: Consolidated Financials for H1 FY17 are Unaudited
6

Automotive Investments (Rs. 120.29 Cr.)
BPO Investments (Rs. 26.3 Cr.)
SUNDARAM FINANCE LIMITED - INVESTMENT PORTFOLIOSundaram Finance Limited
Financial Services Investments (Rs. 1023.96 Cr.) Non FS Investments# (Rs. 149.74 Cr.)
Royal Sundaram General Insurance (Rs. 641.48 Cr.)
Sundaram AMC (Rs. 184.87 Cr.)
Sundaram BNP Paribas Fund Services (Rs. 17.85 Cr.)
Sundaram BNP Paribas Home Finance (Rs. 151.57 Cr.)
Flometallic Dunes Oman
Sundaram Hydraulics Sundaram Clayton
Axles India Wheels India
IMPAL Turbo Energy
Transenergy Sundaram Dynacast
SBILSBSL
Other FS investments (Rs. 28.19 Cr.)
Equifax Experian
Sundaram Trustee Company
Sundaram Finance Investments
Sundaram Insurance Broking
LGF Services
Figures in brackets indicate book value of investments on SFL balance sheet as on 31 March 2016# Non FS Investments proposed for demerger. Throughout this document, non-FS investments refer to investments in these 18 companies* TVS Investments is the holding company for TVS Capital Funds, TVS Electronics
Other Investments (Rs. 3.15 Cr.)
Lucas TVS
TVS Investments*
Delphi TVS
Techtran Polylenses
Brakes India
Vishnu Forge
7
Snapshot of Sundaram Finance Limited
Details of Scheme
Details of Non Financial Services Investments
INDEX
8

RATIONALE FOR RESTRUCTURINGParticipation in Value CreationOver the years, SFL’s investments in the manufacturing and automotive sectors have not only yielded significant returns but also demonstrated a strong track record of value creation. Several of these investments have been made as a co-promoter along with TVS Group companies. SFL’s proportionate share of profits from these non-FS investments is Rs. 142.08 Cr. in FY2016The Scheme envisages issuing shares to all SFL shareholders on a 1:1 ratio and provides an opportunity for all shareholders to participate directly in value creation in the non-FS investment portfolio.
Ring FencingThe restructuring intends to ring-fence the financial services assets and businesses of the group. Non-FS investments, which have grown from Rs. 18.45 Cr. at the end of FY2006 to Rs. 149.74 Cr. at the end of FY2016 in book value terms, will be moved into SFIL pursuant to the Scheme.
Other considerationsThe current regulatory framework (RBI, SEBI, CCI, NCLT, Tax etc.) allows an opportunity to create a shareholder friendly transaction with an appointed date of 1 April 2016
9
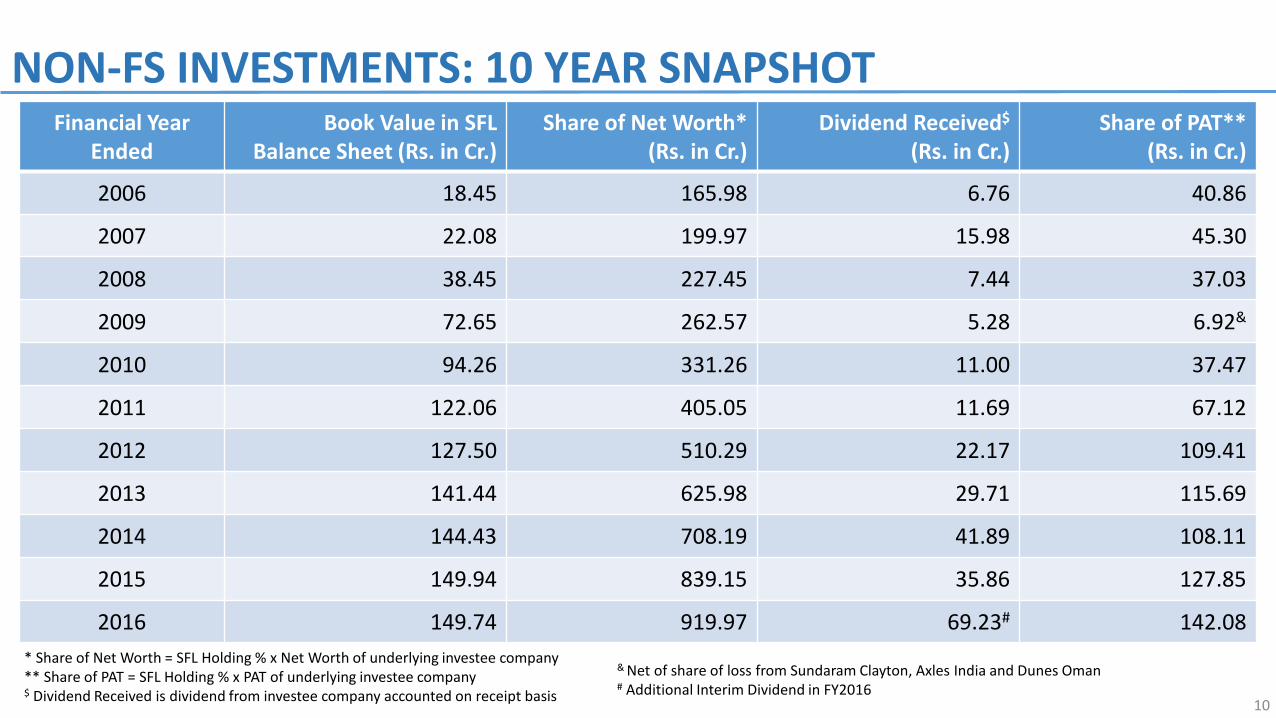
NON-FS INVESTMENTS: 10 YEAR SNAPSHOTFinancial Year
EndedBook Value in SFL
Balance Sheet (Rs. in Cr.)Share of Net Worth*
(Rs. in Cr.)Dividend Received$
(Rs. in Cr.)Share of PAT**
(Rs. in Cr.)
2006 18.45 165.98 6.76 40.86
2007 22.08 199.97 15.98 45.30
2008 38.45 227.45 7.44 37.03
2009 72.65 262.57 5.28 6.92&
2010 94.26 331.26 11.00 37.47
2011 122.06 405.05 11.69 67.12
2012 127.50 510.29 22.17 109.41
2013 141.44 625.98 29.71 115.69
2014 144.43 708.19 41.89 108.11
2015 149.94 839.15 35.86 127.85
2016 149.74 919.97 69.23# 142.08* Share of Net Worth = SFL Holding % x Net Worth of underlying investee company** Share of PAT = SFL Holding % x PAT of underlying investee company$ Dividend Received is dividend from investee company accounted on receipt basis
& Net of share of loss from Sundaram Clayton, Axles India and Dunes Oman# Additional Interim Dividend in FY2016
10
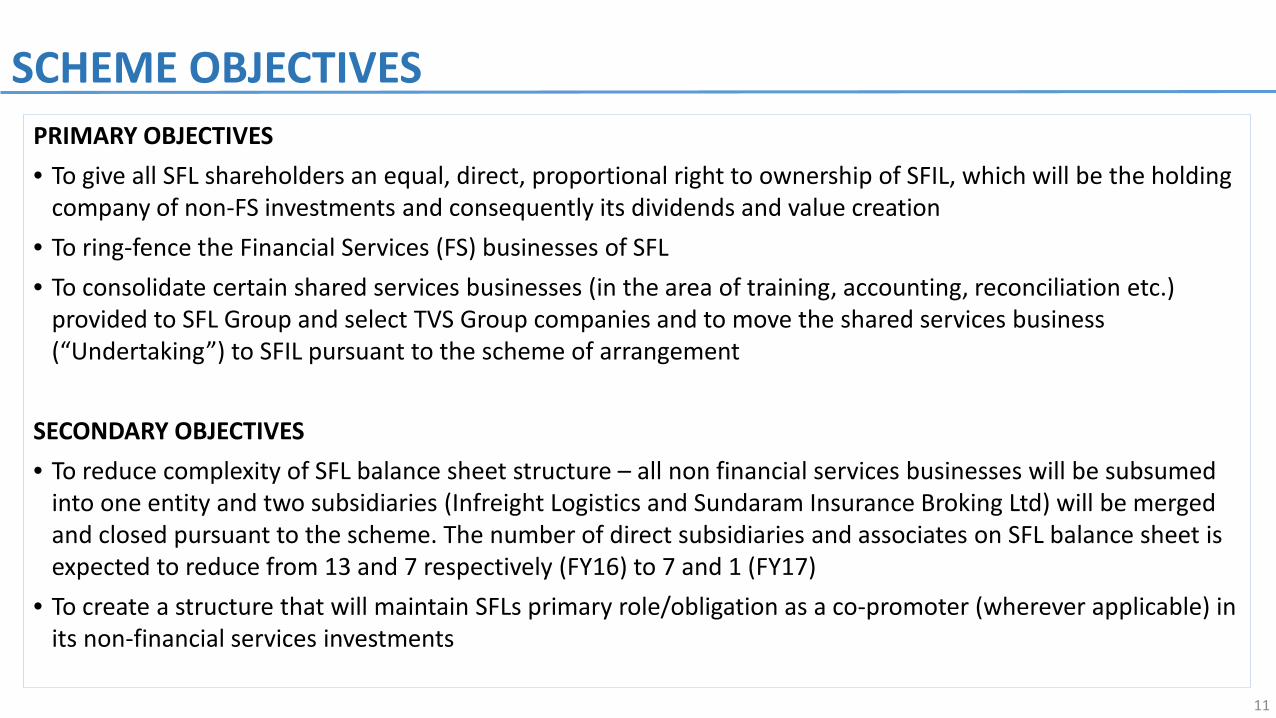
SCHEME OBJECTIVESPRIMARY OBJECTIVES• To give all SFL shareholders an equal, direct, proportional right to ownership of SFIL, which will be the holding
company of non-FS investments and consequently its dividends and value creation• To ring-fence the Financial Services (FS) businesses of SFL• To consolidate certain shared services businesses (in the area of training, accounting, reconciliation etc.)
provided to SFL Group and select TVS Group companies and to move the shared services business (“Undertaking”) to SFIL pursuant to the scheme of arrangement
SECONDARY OBJECTIVES• To reduce complexity of SFL balance sheet structure – all non financial services businesses will be subsumed
into one entity and two subsidiaries (Infreight Logistics and Sundaram Insurance Broking Ltd) will be merged and closed pursuant to the scheme. The number of direct subsidiaries and associates on SFL balance sheet is expected to reduce from 13 and 7 respectively (FY16) to 7 and 1 (FY17)
• To create a structure that will maintain SFLs primary role/obligation as a co-promoter (wherever applicable) in its non-financial services investments
11

SCHEME MECHANICS• The Board of Directors of SFL have approved and recommended a composite scheme of arrangement under sections 230
– 232 of the Companies Act, 2013. Following are the key steps involved in the process*:
• Step 1: Sundaram Insurance Broking Services Limited and Infreight Logistics Solutions Limited to merge with SFL
• Step 2: Sundaram BPO India Limited comprises of 2 divisions: (i) shared services division i.e. division catering to companies in SFL group; (ii) Third Party division. The shared services division of Sundaram BPO to be demerged into SFL
• Step 3: SFL will demerge select shared service businesses, non-FS investments, along with select real estate assets to Sundaram Finance Investments Limited
• Other Key Scheme Details
Parameter Detail
Swap ratio 1:1 to all shareholders of SFL
Appointed date April 1, 2016
Shareholding patternpost demerger
26.47% - SFL (as promoter)73.53% - All shareholders of SFL as per the swap ratio
Regulatory approvals required
SEBI, Competition Commission of India (CCI), National Company Law Tribunal (NCLT) and other regulators/ authorities as applicable
* All steps pursuant to the scheme of arrangement; Detailed information available in the Scheme 12
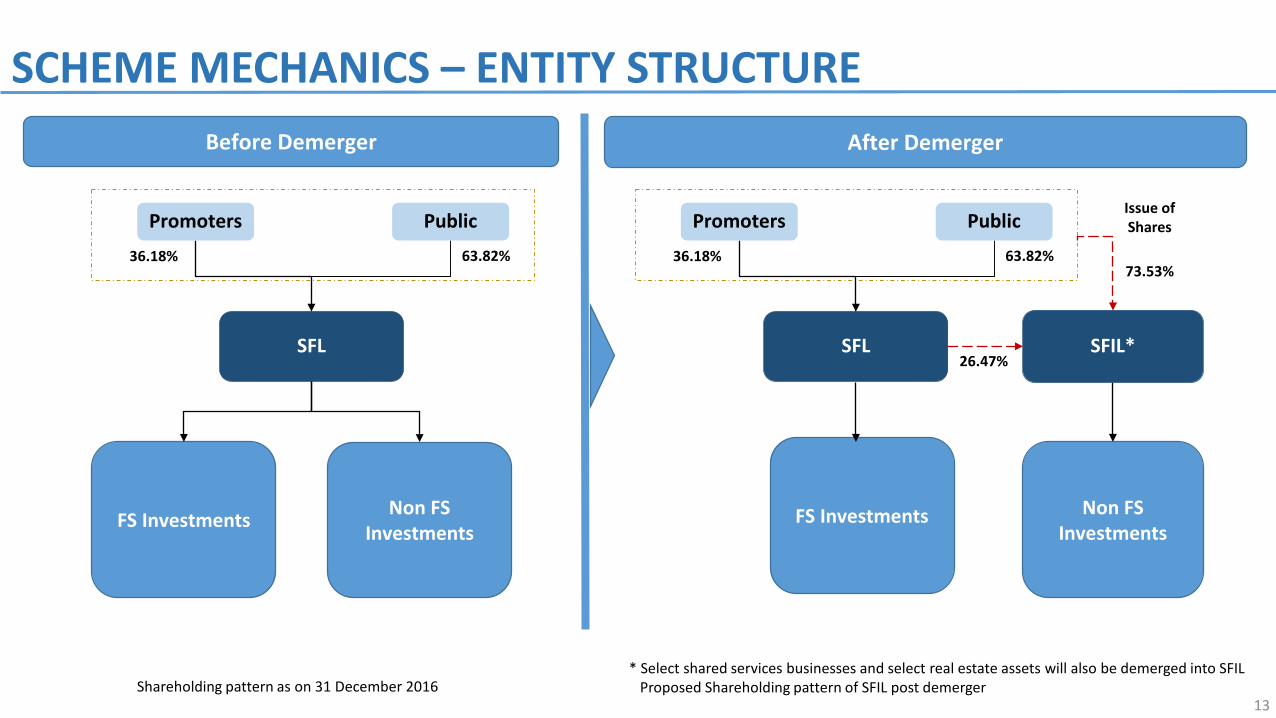
SCHEME MECHANICS – ENTITY STRUCTURE
SFL
PublicPromoters
FS Investments
63.82%
Non FS Investments
36.18%
SFL
PublicPromoters
FS Investments
63.82%
Non FS Investments
36.18%
Before Demerger After Demerger
SFIL*26.47%
73.53%
Issue of Shares
Shareholding pattern as on 31 December 2016* Select shared services businesses and select real estate assets will also be demerged into SFIL
Proposed Shareholding pattern of SFIL post demerger13

Pursuant to the scheme of arrangement, SFL assets are to be demerged into SFIL at book value (holding cost). Since the book value of investments is small relative to SFLs net worth (Rs. 150 Cr. vs Rs. 3313 Cr.), the demerger does not materially affect the balance sheet strength of SFL.
KEY METRICS OF SFL WITH AND WITHOUT NON-FS INVESTMENTS
Key Metrics FY2016 Reported FY2016 Adjusted* FY2015 Reported FY2015 Adjusted*
Net Worth (Rs. in Cr.) 3313 3112 2978 2773
Balance Sheet Size (Rs. in Cr.) 17,393 17,190 16,761 16,555
PAT (Rs. in Cr.) 477 418 454 424
Debt to Equity Ratio 3.8 4.1 4.2 4.5
Return on Equity 15.2% 14.2% 16.9% 16.5%
* Estimated figures after excluding non-financial services investments being demerged
14

Snapshot of Sundaram Finance Limited
Details of Scheme
Details of Non Financial Services Investments
INDEX
15
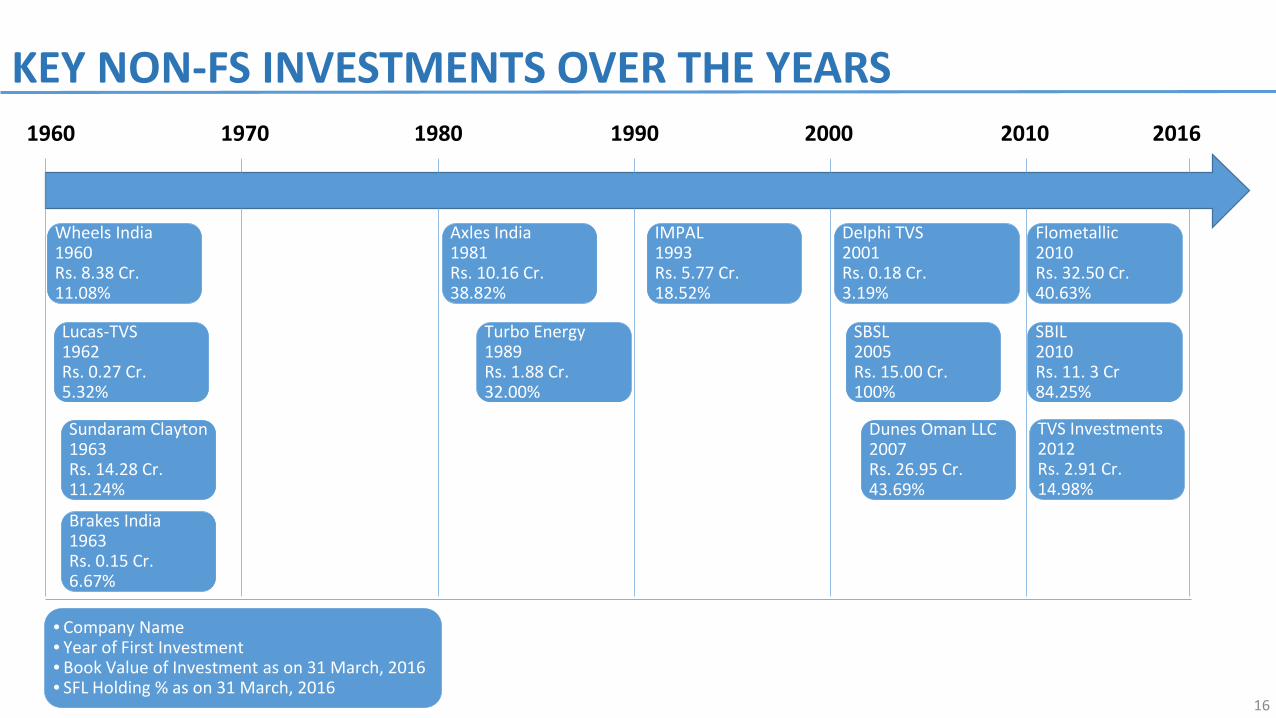
KEY NON-FS INVESTMENTS OVER THE YEARS
Wheels India1960Rs. 8.38 Cr.11.08%
1960 1970 1980 1990 2000 2010 2016
Lucas-TVS1962Rs. 0.27 Cr.5.32%
Sundaram Clayton1963Rs. 14.28 Cr.11.24%
Brakes India1963Rs. 0.15 Cr.6.67%
Axles India1981Rs. 10.16 Cr.38.82%
Turbo Energy1989Rs. 1.88 Cr.32.00%
IMPAL1993Rs. 5.77 Cr.18.52%
Delphi TVS2001Rs. 0.18 Cr.3.19%
SBSL2005Rs. 15.00 Cr.100%
Dunes Oman LLC2007Rs. 26.95 Cr.43.69%
Flometallic2010Rs. 32.50 Cr.40.63%
SBIL2010Rs. 11. 3 Cr84.25%
• Company Name• Year of First Investment• Book Value of Investment as on 31 March, 2016• SFL Holding % as on 31 March, 2016
16
TVS Investments2012Rs. 2.91 Cr.14.98%

287.40
157.60
118.04
92.64
47.91
45.22
43.10
41.21
31.91
9.03
15.06
18.78
12.08
Turbo Energy, 1.88
Sundaram Clayton, 14.28
Brakes India, 0.15
Dunes Oman LLC (FZC), 26.95
Lucas-TVS, 0.27
Wheels India, 8.38
IMPAL, 5.77
Flometallic, 32.5
Axles India, 10.16
Delphi TVS Diesel Systems, 0.18
BPO Business*, 26.3
TVS Investments, 2.91
Others, 20.00
SF Share of Net WorthCompany Name, Book Value
Total, 149.74
NON-FS INVESTMENTS SNAPSHOTNet Worth
898.14
1402.12
1770.72
212.05
900.48
408.16
232.71
101.43
82.20
282.92
16.63
125.34
44.34
6477.25
Book Value in SFL Balance Sheet as on 31 March 2016SF Share of Net Worth = SFL Holding % x Net Worth of underlying investee company as on 31 March 2016Figures for Sundaram Clayton, Brakes India, Lucas-TVS, and IMPAL are as per consolidated accounts
All Amounts in Rs. Cr.BPO business includes SBSL and SBIL
17
919.97

NON-FS INVESTMENTS SNAPSHOT
Dividend Received is dividend from investee company accounted on receipt basis for year ended 31 March 2016SF Share of PAT = SFL Holding % x PAT of the underlying investee company for the year ended 31 March 2016Figures for Sundaram Clayton, Brakes India, Lucas-TVS, and IMPAL are as per consolidated accounts
PAT
124.76
243.50
338.63
61.38
44.45
39.99
26.73
16.24
12.51
-0.49
0.05
9.45
3.96
921.17
39.92
27.37
22.57
26.82
2.36
4.43
4.95
6.60
4.86
-0.02
0.04
1.42
0.75
Turbo Energy, 5.76
Sundaram Clayton, 10.68
Brakes India, 7.57
Dunes Oman LLC (FZC), 37.45
Lucas-TVS, 0.95
Wheels India, 1.07
IMPAL, 2.93
Flometallic, 1.63
Axles India, -
Delphi TVS Diesel Systems, -
BPO Business*, -
TVS Investments, -
Others, 1.19
SF Share of PAT
18
Company Name, Dividend Received
All Amounts in Rs. Cr.* BPO business includes SBSL and SBIL
Total, 69.23 142.08

Key Highlights:
Product portfolio : Turbochargers (80.1%), Turbocharger parts (18.3%) Volume: 1.23 million turbochargers produced in FY2016 (increase of 9.8% over
FY2015) Manufacturing locations: Two locations in Tamil Nadu and one in Uttarakhand Foreign exchange earnings of Rs. 135.65 Cr. in FY2016 representing 14.7% of
operating income Key Investments:
6% in Flometallic India Pvt. Ltd. (automotive industry – foundry) 25% in ABI Showatech (automotive components)
Company website: www.turboenergy.co.in
Key Investments
Shareholding PatternOverview:Setup in 1982, Turbo Energy is a joint venture between Brakes India, Sundaram Finance and Borgwarner Turbo systems GmBH. It is engaged in manufacture of turbocharger and turbocharger parts that are used in automobile, industrial and marine segments and is currently the market leader in India.
(Holdings, %)
TURBO ENERGY PRIVATE LIMITED
Flometallic India Pvt. Ltd.
Turbo Energy Pvt. Ltd.
6%
(Holdings, %)
ABI Showatech25%
Sundaram Finance Ltd.
32.00%
Brakes India Pvt.Ltd.32.00%
Borgwarner Turbo
Systems GMBH32.61%
Others3.39%
Shareholding Pattern as on 31 March, 201619

TURBO ENERGY PRIVATE LIMITEDStandalone Financials (Rs.Crores) FY12 FY13 FY14 FY15 FY16 3Yr CAGR 5Yr CAGR
Sales 769 915 781 844 923 0.3% 6.6%
EBITDA 183 197 156 173 178 -3.4% 2.9%
Reported PAT 124 149 109 112 125 -5.8% 4.7%
Adjusted PAT 124 149 109 112 125 -5.8% 4.7%
Net Worth 472 593 681 783 896 14.7% 19.3%
Capital Employed 472 593 690 793 906 15.2% 19.6%
Debt to Equity ratio - - 0.01 0.01 0.01
ROCE 29.6% 28.1% 17.3% 15.1% 14.7%
ROE 29.5% 28% 17.1% 15.3% 14.9%
3 Year CAGR refers to growth between FY’13 and FY’165 Year CAGR refers to growth between FY’11 and FY’16
20
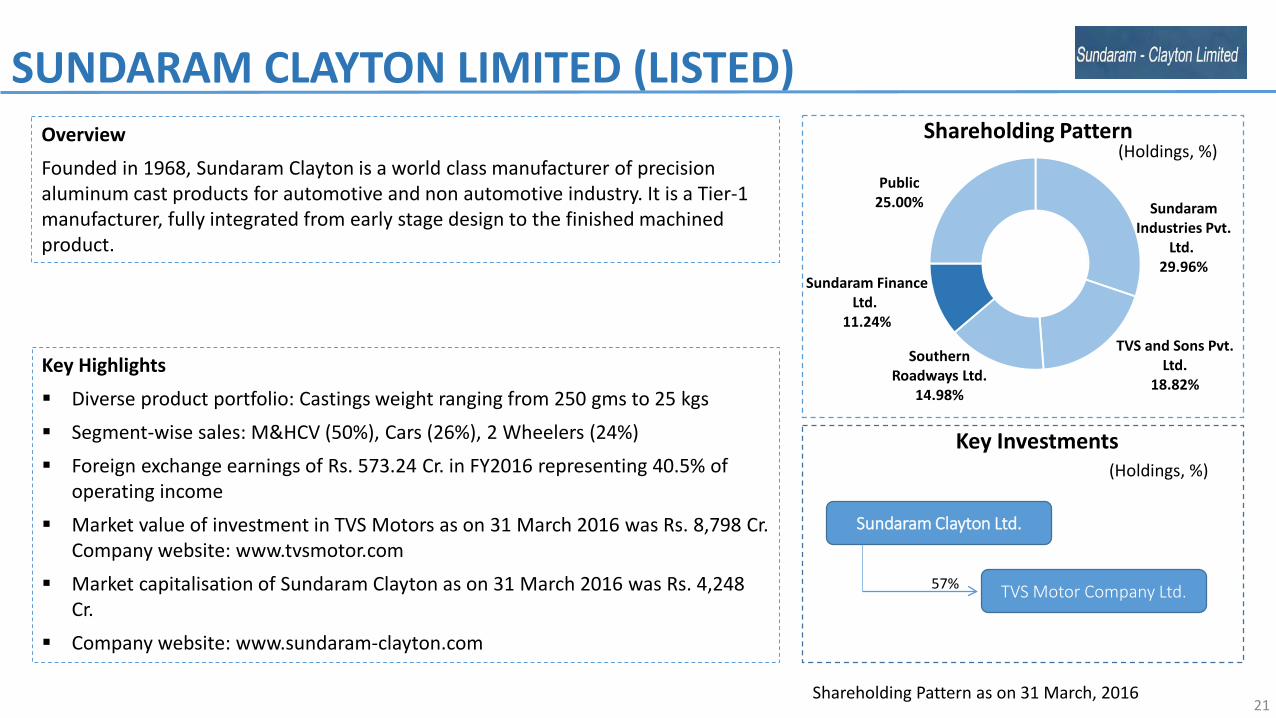
Key Highlights Diverse product portfolio: Castings weight ranging from 250 gms to 25 kgs Segment-wise sales: M&HCV (50%), Cars (26%), 2 Wheelers (24%) Foreign exchange earnings of Rs. 573.24 Cr. in FY2016 representing 40.5% of
operating income Market value of investment in TVS Motors as on 31 March 2016 was Rs. 8,798 Cr.
Company website: www.tvsmotor.com Market capitalisation of Sundaram Clayton as on 31 March 2016 was Rs. 4,248
Cr. Company website: www.sundaram-clayton.com
OverviewFounded in 1968, Sundaram Clayton is a world class manufacturer of precision aluminum cast products for automotive and non automotive industry. It is a Tier-1 manufacturer, fully integrated from early stage design to the finished machined product.
SUNDARAM CLAYTON LIMITED (LISTED)
Sundaram Industries Pvt.
Ltd., 29.96%
TVS and Sons Pvt. Ltd.
18.82%
Southern Roadways Ltd.
14.98%
Sundaram Finance Ltd.,
11.24%
Public 25.00%
Key Investments
Shareholding Pattern
TVS Motor Company Ltd.
Sundaram Clayton Ltd.
57%
(Holdings, %)
(Holdings, %)
Shareholding Pattern as on 31 March, 201621

Consolidated Financials (Rs. in Cr.) FY12 FY13 FY14 FY15 FY16 3Yr CAGR 5Yr CAGR
Sales 8,297 8,226 9,344 11,340 12,600 15.3% 11.3%
EBITDA 560 522 581 717 890 19.5% 14.9%
Reported PAT 108 186 141 212 244 9.4% 30.5%
Adjusted PAT 93* 113# 117@ 168& 239$ 28.5% 29.8%
Net Worth 699 894 1,121 1,289 1,402 16.2% 19.2%
Capital Employed 2,707 2,704 2,608 3,224 3,441 8.4% 9.9%
Debt to Equity ratio 2.40 1.66 0.97 1.16 1.04
ROCE 9% 8.2% 9% 12.6% 14.1%
ROE 14.5% 14.2% 11.6% 14% 17.8%
* Profit on sale of long term investment# Profit on sale of land and division; Insurance recovery@ Profit on sale of long term investment & land& Profit on sale of land & building$ Profit on sale of land & building; Insurance claim
3 Year CAGR refers to growth between FY’13 and FY’165 Year CAGR refers to growth between FY’11 and FY’16
SUNDARAM CLAYTON LIMITED (LISTED)
22

Key Highlights
Two main divisions – Brakes and parts (74%), and castings (18%) 14 manufacturing facilities in India with product applications for Passenger car,
Commercial vehicle , Off-road vehicle and Tractor segments Geography wise sales: 79.7% Domestic, 20.3% Exports Key investments:
Turbo Energy: Automotive components - turbochargers Dunes Oman LLC.: Automotive components – foundry
Company website: www.brakesindia.com
OverviewFounded in 1962, Brakes India Private Limited is a joint venture between the TVS Group and Lucas Industries Limited UK (a 100% subsidiary of ZF TRW). The company is the market leader in automotive braking systems in India
BRAKES INDIA PRIVATE LIMITED
Lucas Industries Ltd.
49.00%
TVS and Sons Pvt. Ltd.21.22%
Southern Roadways Ltd.
13.11%
Sundaram Industries Pvt. Ltd.
10.00%
Sundaram Finance Ltd., 6.67%
Key Investments
Shareholding Pattern
Turbo Energy Pvt. Ltd.
Brakes India Pvt. Ltd.
32%
Dunes Oman LLC51%
(Holdings, %)
(Holdings, %)
Shareholding Pattern as on 31 March, 2016 23

Standalone Financials (Rs. in Cr.) FY12 FY13 FY14 FY15 FY16 3Yr CAGR 5Yr CAGR
Sales 3,164 3,119 3,172 3,296 3,496 3.9% 6.0%
EBITDA 340 321 366 403 451 12.0% 10.6%
Reported PAT 184 170 222 248 315 22.7% 13.1%
Adjusted PAT 184 170 222 248 298* 20.5% 13.7%
Net Worth 774 889 1,035 1,200 1,402 16.4% 16.7%
Capital Employed 1,206 1,158 1,243 1,327 1,460 8% 7.7%
Debt to Equity ratio 0.56 0.30 0.20 0.11 0.04
ROCE 19.2% 16.2% 19.4% 19.8% 21.6%
ROE 25.8% 20.5% 23.1% 22.2% 22.9%
* Insurance claim received
BRAKES INDIA PRIVATE LIMITED
3 Year CAGR refers to growth between FY’13 and FY’165 Year CAGR refers to growth between FY’11 and FY’16
24

Key Highlights Foundry with a manufacturing capacity of 36,000 MT p.a serving multiple end
markets including GCC and Europe Manufacturing facilities are located within the Salalah Free Zone in Oman Select product portfolio : Caliper body, Caliper bracket, Pump housing, Bearing
housing and Bearing cap
OverviewEstablished in the year 2013, Dunes Oman LLC is headquartered in Sultanate of Oman in a free trade zone and is a Tier II manufacturer engaged in the business of manufacture of iron and steel castings for brakes, bearings etc.
THE DUNES OMAN LLC (FZC)Shareholding Pattern
(Holdings, %)
Brakes India Pvt. Ltd., 51.31%
Sundaram Finance Ltd.,
43.69%
ABI Showatech(India) Ltd., 5.00%
Shareholding Pattern as on 31 March, 2016 25

THE DUNES OMAN LLC (FZC)Standalone Financials (Rs. in Cr.) FY12 FY13 FY14 FY15 FY16 3Yr CAGR 5Yr CAGR
Sales 257 301 340 366 342 4.4% 23.9%
EBITDA 49 67 87 94 88 9.4% 29.9%
Reported PAT 37 48 70 70 61 8.3% 41.0%
Adjusted PAT 37 48 70 70 61 8.3% 41.0%
Net Worth 118 146 177 221 212 13.3% 23.3%
Capital Employed 243 229 261 253 260 4.4% 9.5%
Debt to Equity ratio 1.07 0.57 0.47 0.15 0.23
ROCE 18.7% 23.6% 30.9% 28% 24.7%
ROE 38.8% 36.7% 43.3% 34.9% 28.4%
3 Year CAGR refers to growth between FY’13 and FY’165 Year CAGR refers to growth between FY’11 and FY’16
26

TVS and Sons Pvt. Ltd.22.56%
Sundaram Industries Pvt. Ltd.22.76%
Hastham Swasthi Pvt. Ltd.9.79% Punarvasu Swasthi Pvt. Ltd.
9.79%
Southern Roadways Ltd.
7.69%
Sundaram Finance Ltd.
5.32%
Others, 22.09%
Key Highlights:
Select Product portfolio : Starters, Alternators, Small Motors 7 plants across Uttarakhand, Haryana, Maharashtra ,Tamil Nadu and Pondicherry Foreign exchange earnings of Rs. 165.66 Cr. in FY2016, representing 9.6% of
operating income Key Investments:
Lucas Indian Service Ltd. – Sales and service of - ignition coils and solenoid switches
India Nippon Electricals Ltd. (listed) – Manufacturer of ignition system parts for auto OEMs. Market Cap as on 31st March, 2016 was Rs. 414 Cr.
India Japan Lighting (held jointly with Lucas Indian Services) –Manufacturer of auto electrical products and special purpose machines
Company website: www.lucas-tvs.com
Shareholding PatternOverview:Lucas-TVS was setup in 1962 as a joint venture between Lucas Plc. UK and the TVS Group and is a leading player in Auto Electrical equipment. Its product portfolio caters to OEM, after market and non automotive customers
(Holdings, %)
Shareholding Pattern as on 31 March, 2016
Key Investments(Holdings, %)
Lucas Indian Service Ltd.
LUCAS-TVS
India Nippon Electricals Ltd.
Indo-Japan Lighting
100%
46%
30%
27
LUCAS-TVS LIMITED

LUCAS-TVS LIMITEDConsolidated Financials (Rs. in Cr.) FY12 FY13 FY14 FY15 FY16 3Yr CAGR 5Yr CAGR
Sales 1717 1703 1609 2141 2280 10.2% 9.2%
EBITDA 127 122 81 107 116 -1.8% -0.4%
Reported PAT 82 56 35 45 44 -7.3% -10.1%
Adjusted PAT 82 56 35 45 44 -7.3% -10.1%
Net Worth 591 625 648 876 900 13.0% 11.1%
Capital Employed 860 944 955 1130 1104 5.4% 8.2%
Debt to Equity ratio 0.46 0.51 0.47 0.29 0.23
ROCE 12.6% 9.1% 5.3% 6.8% 5.7%
ROE 14.7% 9.2% 5.5% 5.9% 5.0%
3 Year CAGR refers to growth between FY’13 and FY’165 Year CAGR refers to growth between FY’11 and FY’16
28

Key Highlights Product portfolio : Road wheels, Parts and Accessories of construction and
mining machinery Locations: 10 manufacturing plants spread across Tamil Nadu, Uttar Pradesh,
Maharastra, Haryana, Uttarakhand Key customers: Hyundai, Mahindra & Mahindra, Caterpillar, Toyota, Leyland Foreign exchange earnings of Rs. 390.45 Cr. in FY2016, representing 19.6% of
operating income Key Investments: Axles India – Manufacturer of axle housings Market capitalisation of Wheels India Ltd. as on 31 March 2016 was Rs. 1160 Cr. Company website: www.wheelsindia.com
OverviewSet up in 1960, Wheels India Ltd. is a joint venture between the TVS Group and Titan Europe Ltd. It is one of the largest steel wheel manufacturers in the world and is a leading supplier to automotive OEMs across CVs, Cars, Tractors and Construction Equipment segments
WHEELS INDIA LIMITED (LISTED)
Shareholding Pattern as on 31 March, 201629
Key Investments
Shareholding Pattern
Axles India Ltd.
Wheels India Ltd.
10%
(Holdings, %)
(Holdings, %)
Titan Europe Ltd.34.23%
TVS and Sons Pvt. Ltd., 20.41%
Sundaram Finance Ltd.11.08%
Southern Roadways Ltd.9.28%
Others25.00%

WHEELS INDIA LIMITED (LISTED)Consolidated Financials (Rs. in Cr.) FY12 FY13 FY14 FY15 FY16 H1 FY17* 3Yr CAGR 5Yr CAGR
Sales 2,078 1,924 1,823 1,980 2,016 1,080 1.6% 3.5%
EBITDA 173 151 148 150 173 93 4.6% 5.9%
Reported PAT 34 32 28 30 40 28 7.9% 10.2%
Adjusted PAT 34 32 28 30 40 28 7.9% 10.2%
Net Worth 240 259 364 381 408 436 16.4% 13.4%
Capital Employed 628 678 695 770 794 786 5.4% 7.7%
Debt to Equity ratio 1.61 1.62 0.91 1.02 0.95 0.80
ROCE 13.4% 11% 10% 10.1% 10.3% 11.3%
ROE 15% 12.8% 9.1% 8% 10.1% 13.1%
3 Year CAGR refers to growth between FY’13 and FY’165 Year CAGR refers to growth between FY’11 and FY’16
* H1 FY17 figures are Standalone financials
30

Key Highlights Product portfolio : engine components, brake systems, fasteners, radiators,
suspensions, axles, auto electrical, wheels, steering linkages and instrument clusters among others
IMPAL caters to over 35,000 dealers across India Key lines distributed: Wabco TVS, Sundaram Fasteners, Brakes India, Rane
Steering, Banco Products (India) Limited, Delphi TVS Diesel Systems, Finolex Cables Limited, Pricol, SKF Bearings
Market capitalisation of IMPAL as on 31 March 2016 was Rs. 559.53 Cr. Company website: www.impal.net
OverviewIncorporated in 1954, India Motor Parts and Accessories Ltd. (IMPAL) is engaged in the distribution of automobile spare parts and accessories of over 50 manufacturers. It is one of the leading third party wholesale distributors of auto components in India
IMPAL (LISTED)
Shareholding Pattern as on 31 March, 201631
Shareholding Pattern
India Motor Parts and Accessories Ltd.
Royal Sundaram General Insurance Company
10%
Key Investments
TVS and Sons Pvt. Ltd. & Other promoters
30.72%
Sundaram Finance Ltd.
18.52%
Others, 50.76%
(Holdings, %)
(Holdings, %)

IMPAL (LISTED)Consolidated Financials (Rs. in Cr.) FY12 FY13 FY14 FY15 FY16 H1 FY17* 3Yr CAGR 5Yr CAGR
Sales 501 495 512 512 502 263 0.4% 3.2%
EBITDA 42 36 37 35 31 17 -5.0% -4.4%
Reported PAT 32 27 30 31 27 13 -0.6% -1.3%
Adjusted PAT 32 27 30 31 27 13 -0.6% -1.3%
Net Worth 158 176 197 214 232 245 9.6% 11.5%
Capital Employed 174 203 212 230 245 247 6.5% 12.6%
Debt to Equity ratio 0.10 0.15 0.07 0.07 0.06 0.01
ROCE 20.9% 14.4% 14.3% 14.0% 11.2% 10.7%
ROE 22.1% 16.3% 15.8% 15.1% 12.0% 11.0%
3 Year CAGR refers to growth between FY’13 and FY’165 Year CAGR refers to growth between FY’11 and FY’16
* H1 FY17 figures are Standalone financials
32
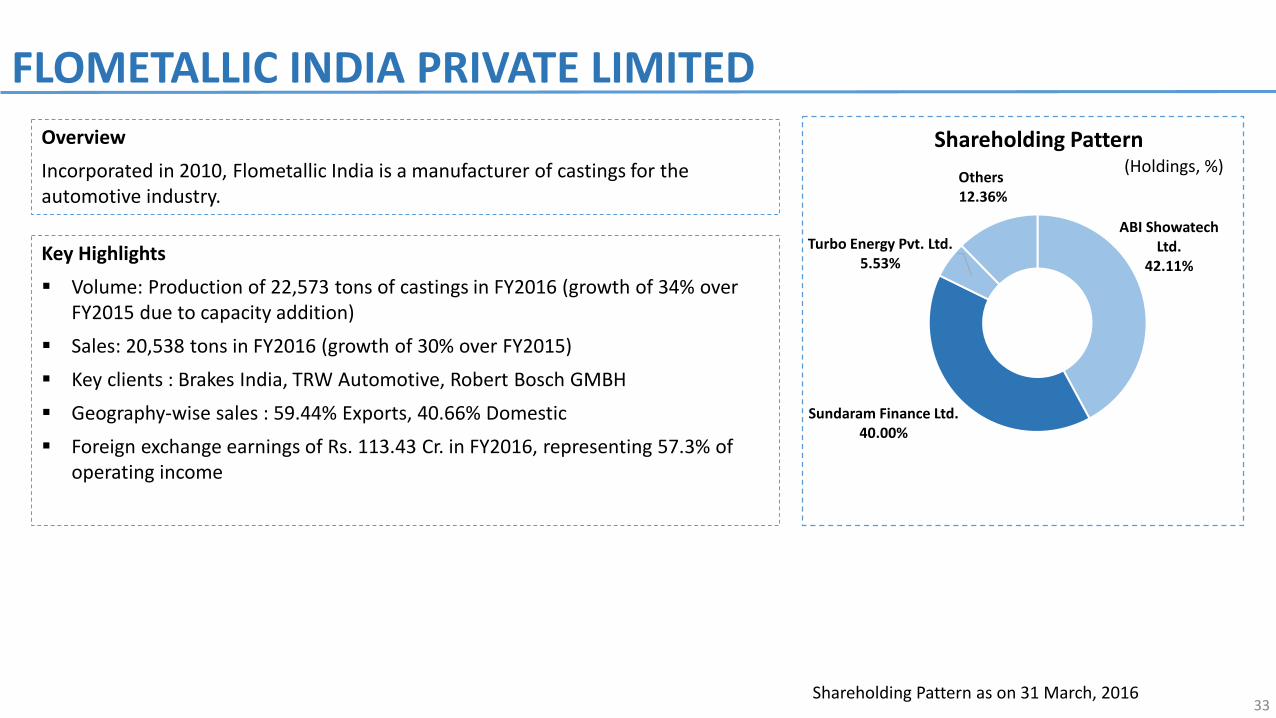
Key Highlights Volume: Production of 22,573 tons of castings in FY2016 (growth of 34% over
FY2015 due to capacity addition) Sales: 20,538 tons in FY2016 (growth of 30% over FY2015) Key clients : Brakes India, TRW Automotive, Robert Bosch GMBH Geography-wise sales : 59.44% Exports, 40.66% Domestic Foreign exchange earnings of Rs. 113.43 Cr. in FY2016, representing 57.3% of
operating income
OverviewIncorporated in 2010, Flometallic India is a manufacturer of castings for the automotive industry.
FLOMETALLIC INDIA PRIVATE LIMITED
Shareholding Pattern as on 31 March, 201633
Shareholding Pattern(Holdings, %)
ABI Showatech Ltd.
42.11%
Sundaram Finance Ltd.40.00%
Turbo Energy Pvt. Ltd.5.53%
Others, 12.36%

Standalone Financials (Rs. in Cr.) FY13 FY14 FY15 FY16 3Yr CAGR
Sales 76 126 155 198 37.7%
EBITDA 2 18 25 35 160.4%
Reported PAT -6 6 10 16 NA
Adjusted PAT -6 6 10 16 NA
Net Worth 59 65 90 101 19.7%
Capital Employed 134 129 160 187 11.7%
Debt to Equity ratio 1.27 0.98 0.78 0.85
ROCE 8.1% 9% 12%
ROE 9.9% 12.6% 17%
FLOMETALLIC INDIA PRIVATE LIMITED
3 Year CAGR refers to growth between FY’13 and FY’165 Year CAGR refers to growth between FY’11 and FY’16
34

Key Highlights Product Segments: Axle Housings for MCV and HCV Manufacturing Locations: Sriperumbudur and Cheyyar in Tamil Nadu Geography-wise Sales:
Domestic Market: 205,000 units in FY2016 (growth of 25.77% over FY2015) Export Market: 100,000 units in FY 2016 (growth of 2.04% over FY2015)
Foreign exchange earnings of Rs. 158.67 Cr. in FY2016, representing 32.1% of operating income
Company website: www.axlesindia.com
OverviewFounded in 1982, Axles India is a joint venture between Wheels India, Sundaram Finance and Dana Holding Corp., USA. Axles India is a leading manufacturer of Axle Housings for medium and heavy commercial vehicles.
AXLES INDIA LIMITED
Shareholding Pattern as on 31 March, 201635
Shareholding Pattern
Dana Holding
Corp., USA48.33%
Sundaram Finance Ltd.
38.82%
Wheels India Ltd.9.51%
Others3.34%
(Holdings, %)

Standalone Financials (Rs. in Cr.) FY12 FY13 FY14 FY15 FY16 3Yr CAGR 5Yr CAGR
Sales 515 410 330 430 494 6.4% 0.3%
EBITDA 32 22 20 24 32 12.3% 0.4%
Reported PAT 40 2 2 6 13 87.1% 24.4%
Adjusted PAT 9# 2 2 6 13 87.1% 24.4%
Net Worth 66 67 67 70 82 7.2% 18%
Capital Employed 118 105 93 88 96 -2.9% -3.5%
Debt to Equity ratio 0.78 0.57 0.38 0.26 0.17
ROCE 15.9% 6.5% 7% 9.3% 16.7%
ROE 16.9% 2.9% 2.9% 8.7% 16.5%
AXLES INDIA LIMITED
# Profit on sale of drive head division
3 Year CAGR refers to growth between FY’13 and FY’165 Year CAGR refers to growth between FY’11 and FY’16
36
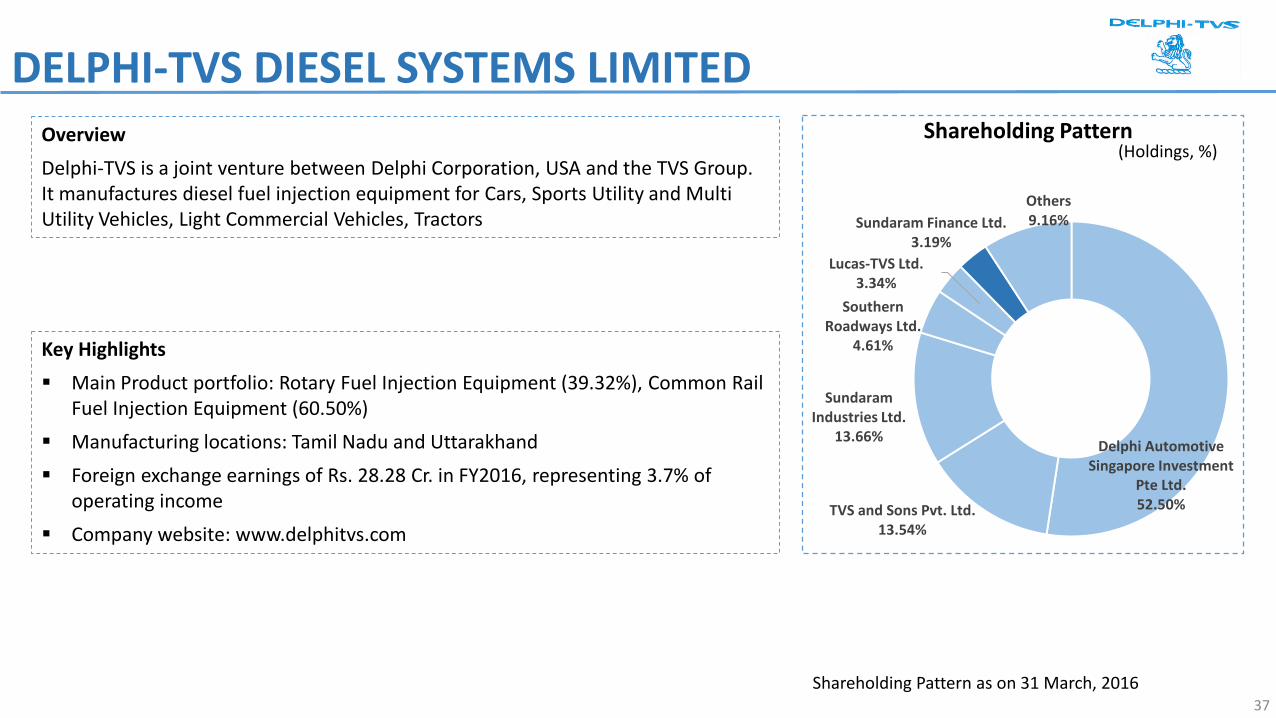
Key Highlights Main Product portfolio: Rotary Fuel Injection Equipment (39.32%), Common Rail
Fuel Injection Equipment (60.50%) Manufacturing locations: Tamil Nadu and Uttarakhand Foreign exchange earnings of Rs. 28.28 Cr. in FY2016, representing 3.7% of
operating income Company website: www.delphitvs.com
OverviewDelphi-TVS is a joint venture between Delphi Corporation, USA and the TVS Group. It manufactures diesel fuel injection equipment for Cars, Sports Utility and Multi Utility Vehicles, Light Commercial Vehicles, Tractors
DELPHI-TVS DIESEL SYSTEMS LIMITED
Shareholding Pattern as on 31 March, 201637
Shareholding Pattern(Holdings, %)
Delphi Automotive Singapore Investment
Pte Ltd.52.50%TVS and Sons Pvt. Ltd.
13.54%
Sundaram Industries Ltd.
13.66%
Southern Roadways Ltd.
4.61%
Lucas-TVS Ltd.3.34%
Sundaram Finance Ltd.3.19%
Others9.16%
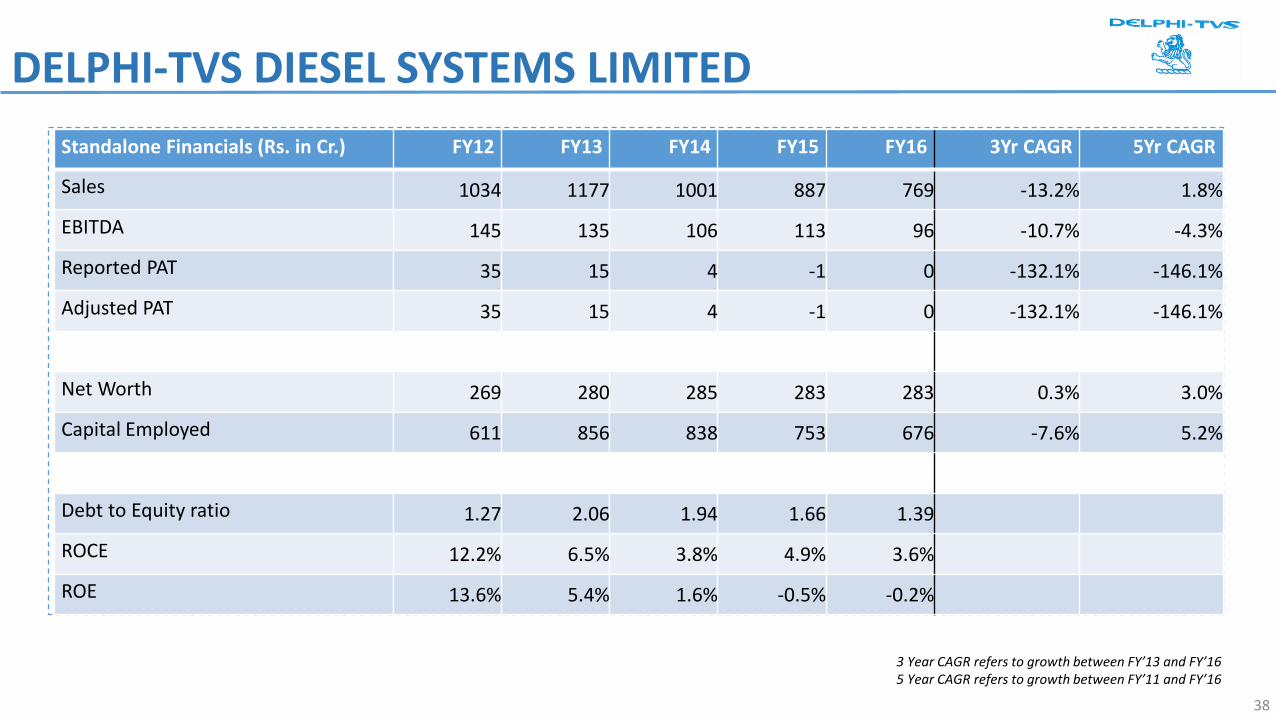
Standalone Financials (Rs. in Cr.) FY12 FY13 FY14 FY15 FY16 3Yr CAGR 5Yr CAGR
Sales 1034 1177 1001 887 769 -13.2% 1.8%
EBITDA 145 135 106 113 96 -10.7% -4.3%
Reported PAT 35 15 4 -1 0 -132.1% -146.1%
Adjusted PAT 35 15 4 -1 0 -132.1% -146.1%
Net Worth 269 280 285 283 283 0.3% 3.0%
Capital Employed 611 856 838 753 676 -7.6% 5.2%
Debt to Equity ratio 1.27 2.06 1.94 1.66 1.39
ROCE 12.2% 6.5% 3.8% 4.9% 3.6%
ROE 13.6% 5.4% 1.6% -0.5% -0.2%
3 Year CAGR refers to growth between FY’13 and FY’165 Year CAGR refers to growth between FY’11 and FY’16
DELPHI-TVS DIESEL SYSTEMS LIMITED
38

Key Highlights Geography: India, Australia, UK.
Two delivery centers in India: Chennai and Mumbai International sales offices in Australia and UK
Services Offered: Select list of services offered in key geographies: India: Finance and Accounting services, Sales and marketing support, Customer support, Finance and Accounting Australia: Superannuation Fund Administration, Mortgage Process Services, Portfolio Management Support, Accounting back-
office, Finance back-office for Hospitality Foreign Exchange earnings of Rs. 23.77 Cr. in FY2016 (Rs. 23.35 Cr. in FY2015) Company website: www.sundarambizserv.com
OverviewThe BPO business of SFL, which was setup in 2005, is conducted through two entities – Sundaram Business Services Ltd. (SBSL) andSundaram BPO India Ltd. (SBIL). Both the companies are owned 100% by SFL and its subsidiary
SBSL focuses on the International market with clients across Australia and United Kingdom (UK) SBIL focuses on the Indian market and also has a shared services division which offers services to SFL Group and select companies
in the TVS Group SBIL has grown organically and through acquisitions in the domestic BPO space - Professional Management Consultants Ltd
(2007)., Caltec Servicez Pvt. Ltd. (2012)
BPO BUSINESSES
39

SUNDARAM BUSINESS SERVICES LIMITED
Standalone Financials (Rs. in Cr.) FY12 FY13 FY14 FY15 FY16 3Yr CAGR 5Yr CAGR
Sales 27 25 21 24 24 -1.2% 1.5%
EBITDA 1.3 -0.2 -2.4 -1.0 0.6 NA NA
Reported PAT 1.0 -0.6 -2.9 -1.7 0.0 NA NA
Adjusted PAT 1.0 -0.6 -2.9 -1.7 0.0 NA NA
Net Worth 12 11 8 7 7 -16.1% -9.3%
Capital Employed 12 11 10 9 10 -3.6% -3.6%
Debt to Equity ratio - - 0.25 0.38 0.51
3 Year CAGR refers to growth between FY’13 and FY’165 Year CAGR refers to growth between FY’11 and FY’16
40

SUNDARAM BPO INDIA LIMITED
Standalone Financials (Rs. in Cr.) FY13 FY14 FY15 FY16 3Yr CAGR
Sales 11 21 20 16 13.5%
EBITDA 0.5 0.7 0.9 0.4 -3.8%
Reported PAT 0.1 0.1 0.7 0.05 -29.1%
Adjusted PAT 0.1 0.1 0.7 0.05 -29.1%
Net Worth 9 9 10 10 3.2%
Capital Employed 10 9 10 11 3.6%
Debt to Equity ratio 0.05 - - 0.07
ROCE 2.1% 1.6% 3.7% -ROE 3.1% 1.4% 7.6% 0.5%
3 Year CAGR refers to growth between FY’13 and FY’16
41
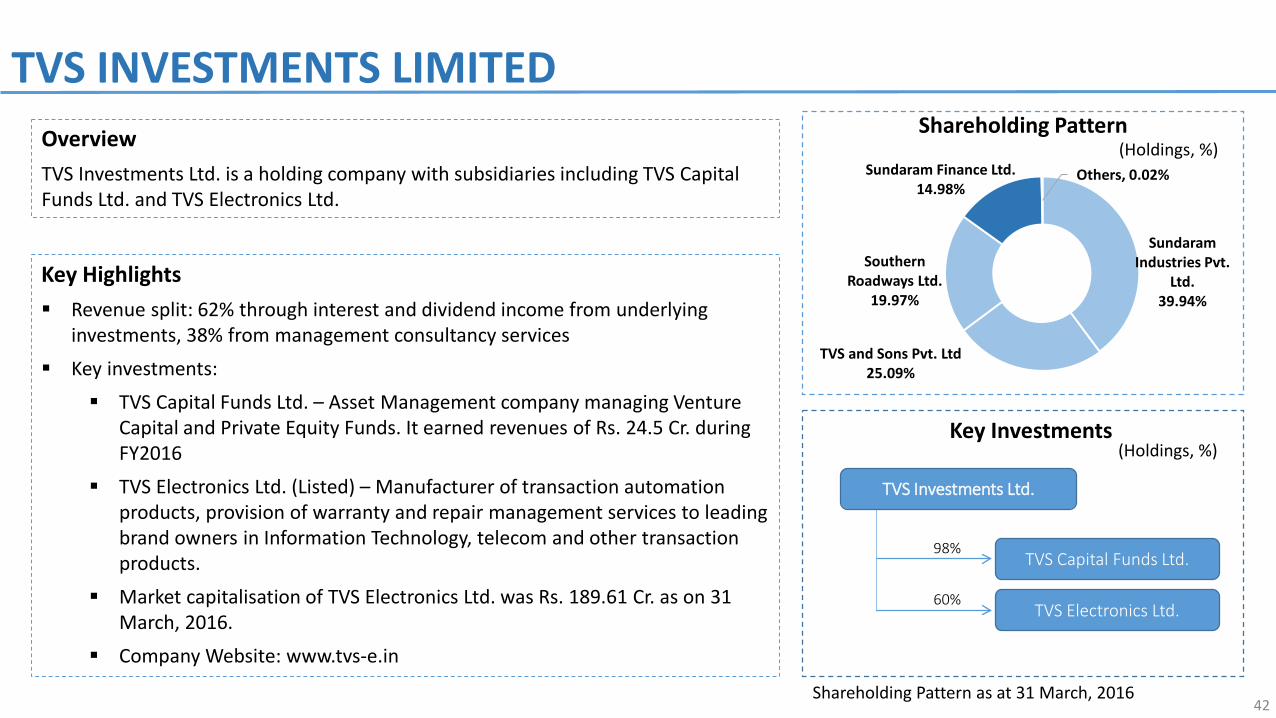
Key Highlights Revenue split: 62% through interest and dividend income from underlying
investments, 38% from management consultancy services Key investments:
TVS Capital Funds Ltd. – Asset Management company managing Venture Capital and Private Equity Funds. It earned revenues of Rs. 24.5 Cr. during FY2016
TVS Electronics Ltd. (Listed) – Manufacturer of transaction automation products, provision of warranty and repair management services to leading brand owners in Information Technology, telecom and other transaction products.
Market capitalisation of TVS Electronics Ltd. was Rs. 189.61 Cr. as on 31 March, 2016.
Company Website: www.tvs-e.in
TVS INVESTMENTS LIMITED
Shareholding Pattern as at 31 March, 2016
OverviewTVS Investments Ltd. is a holding company with subsidiaries including TVS Capital Funds Ltd. and TVS Electronics Ltd.
42
Sundaram Industries Pvt.
Ltd.39.94%
TVS and Sons Pvt. Ltd25.09%
Southern Roadways Ltd.
19.97%
Sundaram Finance Ltd.14.98%
Others, 0.02%
Shareholding Pattern
Key Investments
(Holdings, %)
(Holdings, %)
TVS Electronics Ltd.
TVS Investments Ltd.
60%
TVS Capital Funds Ltd.98%

TVS INVESTMENTS LIMITED
Consolidated Financials (Rs. Cr.) FY13 FY14 FY15 FY16 3Yr CAGR
Sales 303 275 295 617 26.7%
EBITDA 61 20 16 16 -35.7%
Reported PAT 33 5 4 9 -33.9%
Adjusted PAT 33 5 3 8 -37.9%
Net Worth 141 133 128 125 -3.9%
Capital Employed 223 210 201 184 -6.3%
Debt to Equity ratio 0.46 0.43 0.42 0.28
ROCE 5.2% 4.5% 7.5%
ROE 3.6% 2.6% 6.2%
3 Year CAGR refers to growth between FY’13 and FY’165 Year CAGR refers to growth between FY’11 and FY’16
Figures in brackets indicate negative growth
43

SCHEME ROADMAPApproval of
Draft Scheme by SFL Board
Application to Regulators
Receipt of Approvals Effective Date
Listing in Stock
Exchange
17 Feb 2017 Within 30 days of approval by Board
Within 30 days of Effective Date
Regulatory bodies from whom approvals are required Process
Stock Exchange/ Securities and Exchange Board of India (SEBI)
• Application Filing• Receive public comments on Draft Scheme
Competition Commission of India (CCI) • Application Filing
National Company Law Tribunal (NCLT)
• Application filing upon receipt of in-principle approvalfrom Stock Exchange/ SEBI
• Approval from shareholders, creditors, unsecured creditors, other relevant regulatory bodies
44

Presentation date: 20 Feb 2017
This presentation has been prepared by Sundaram Finance Limited (the “Company”). No representation or warranty, expressor implied, is made and no reliance should be placed on the accuracy, fairness or completeness of the information presentedor contained in the presentation. This document is for information purposes only and is not and does not form part of aninvitation / offer / advertisement / advise to purchase or sell any securities of the Company.
The materials and information contained in the document are prepared by the company and are correct and accurate to thebest of our knowledge. No information contained herein has been independently verified by anyone else or approved by anyregulatory authorities. No warranty is given as to their accuracy and the company does not accept any responsibility andshall not be liable for any direct or indirect loss caused, arising from and / or use of this document.
The presentation may also contain statements that are forward looking. These statements are based on current expectationsand assumptions that are subject to risks and uncertainties. Actual results could differ materially from our expectations andassumptions. We do not undertake any responsibility to update any forward looking statements nor should this beconstituted as a guidance of future performance.
This presentation sets out the broad framework for the proposed Scheme of arrangement. The scheme is subject tonecessary statutory and shareholder approvals and is not binding.
The contents of the website are subject to change and review from time to time without notice. By accessing this document,you are deemed to have accepted this disclaimer clause.
DISCLAIMER
45

THANK YOU

ANNEXURE – INDIA AUTOMOTIVE INDUSTRY STATISTICS

MARKET INFORMATION – COMMERCIAL VEHICLE SALESCommercial Vehicles 2011-12 2012 - 13 2013 -14 2014 -15 2015 - 16 Apr-Jan 2017 3Yr CAGR 5Yr CAGR
M & HCVs 3,76,618 2,88,213 2,24,440 2,63,407 3,37,565 2,68,530% YoY 7% -23% -22% 17% 28% 2% 5% -1%Domestic 3,48,701 2,68,689 2,00,627 2,32,755 3,02,373 2,32,589 % YoY 8% -23% -25% 16% 30% -2% 4% -1%Export 27,917 19,524 23,813 30,652 35,192 35,941
% YoY -2% -30% 22% 29% 15% 29% 22% 4%
LCVs 5,25,577 5,85,025 4,85,354 4,38,480 4,49,828 3,82,692 % YoY 29% 11% -17% -10% 3% 5% -8% 2%Domestic 4,60,831 5,24,522 4,32,111 3,82,193 3,83,331 3,27,383 % YoY 27% 14% -18% -12% 0% 7% -10% 1%Export 64,746 60,503 53,243 56,287 66,497 55,309
% YoY 42% -7% -12% 6% 18% -2% 3% 8%
Source: SIAM data
Total CVs 9,02,195 8,73,238 7,09,794 7,01,887 7,87,393 6,51,222
% YoY 19% -3% -19% -1% 12% 4% -3% 1%
3 Year CAGR refers to growth between FY’13 and FY’165 Year CAGR refers to growth between FY’11 and FY’16
48

Cars 2011-12 2012 - 13 2013 -14 2014 -15 2015 - 16 Apr-Jan 2017 3Yr CAGR 5Yr CAGR
Total Cars & MUVs 31,25,390 32,24,429 30,97,192 32,20,888 34,43,567 31,33,784
% YoY 6% 3% -4% 4% 7% 11% 2% 3%
Domestic 26,18,072 26,65,015 25,03,685 25,99,547 27,89,678 25,08,845
% YoY 5% 2% -6% 4% 7% 9% 2% 2%
Export 5,07,318 5,59,414 5,93,507 6,21,341 6,53,889 6,24,939
% YoY 14% 10% 6% 5% 5% 17% 5% 8%
MARKET INFORMATION – PASSENGER VEHICLE SALES
Source: SIAM data 3 Year CAGR refers to growth between FY’13 and FY’165 Year CAGR refers to growth between FY’11 and FY’16
49
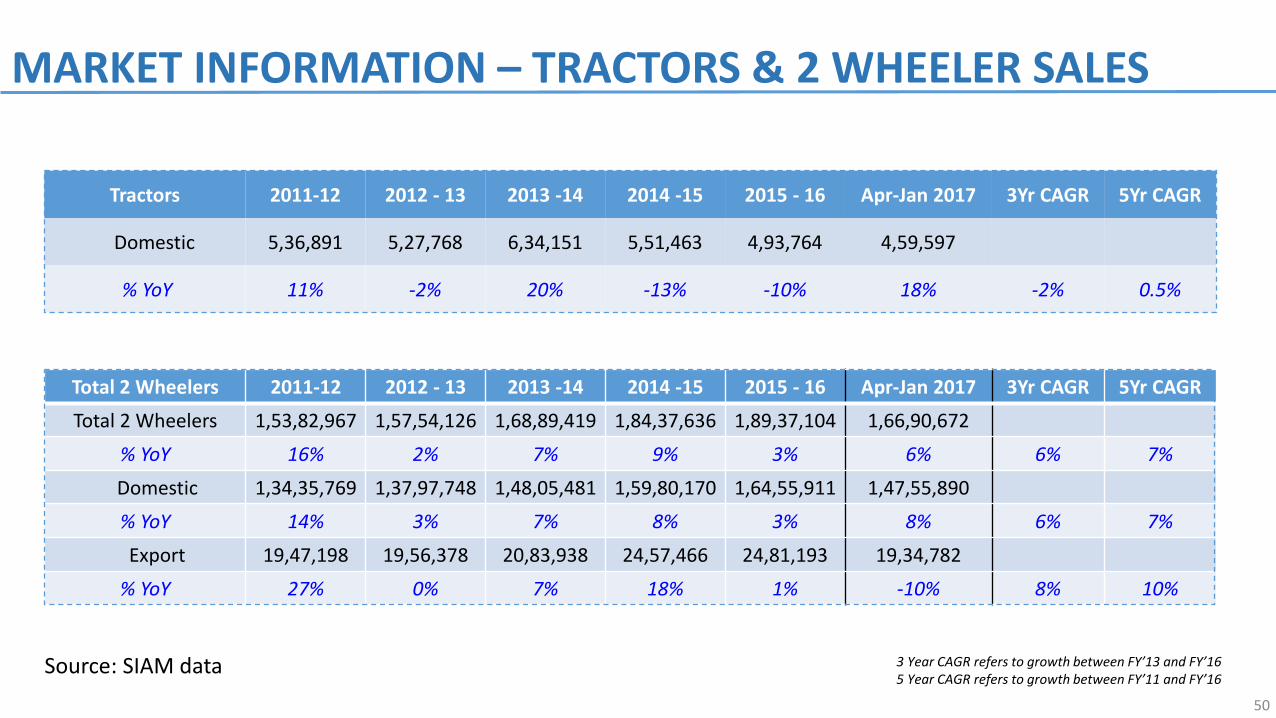
Tractors 2011-12 2012 - 13 2013 -14 2014 -15 2015 - 16 Apr-Jan 2017 3Yr CAGR 5Yr CAGR
Domestic 5,36,891 5,27,768 6,34,151 5,51,463 4,93,764 4,59,597
% YoY 11% -2% 20% -13% -10% 18% -2% 0.5%
Total 2 Wheelers 2011-12 2012 - 13 2013 -14 2014 -15 2015 - 16 Apr-Jan 2017 3Yr CAGR 5Yr CAGR
Total 2 Wheelers 1,53,82,967 1,57,54,126 1,68,89,419 1,84,37,636 1,89,37,104 1,66,90,672
% YoY 16% 2% 7% 9% 3% 6% 6% 7%
Domestic 1,34,35,769 1,37,97,748 1,48,05,481 1,59,80,170 1,64,55,911 1,47,55,890
% YoY 14% 3% 7% 8% 3% 8% 6% 7%
Export 19,47,198 19,56,378 20,83,938 24,57,466 24,81,193 19,34,782
% YoY 27% 0% 7% 18% 1% -10% 8% 10%
MARKET INFORMATION – TRACTORS & 2 WHEELER SALES
Source: SIAM data 3 Year CAGR refers to growth between FY’13 and FY’165 Year CAGR refers to growth between FY’11 and FY’16
50