Embed Size (px)
Citation preview
Measuring the Impacts of Different Messengers on Consumer Preferences for Products Irrigated with Recycled Water: A Field Experiment
by
Alix T. Schmidt
A thesis submitted in partial fulfillment of the requirements for the degree of
Master of Science
in
Agricultural and Resource Economics
Department of Resource Economics and Environmental Sociology University of Alberta
© Alix T. Schmidt, 2018
ii
Abstract This study tests how different messengers—scientists, government agencies, non-profit
organizations, and newspapers—influence consumer behaviour. We conducted framed field
experiments to compare the effects of these messengers on consumers’ monetary bids on different
items produced with recycled and conventional irrigation water. Using recycled wastewater for
agricultural irrigation has the potential to conserve substantial amounts of fresh water. Although it
has been shown that using recycled water for irrigating for both edible and inedible crops can be
safe for human consumption, people may stigmatize these products since the origin of the
wastewater is too apparent. Providing consumers with information about recycled water can help
ameliorate their negative perceptions, and the effectiveness of such information depends on who is
the messenger. Our results suggest that participants respond least favourably to the scientist
messenger and most favourably to the newspaper messenger. Further analysis shows that consumer
responses to the scientist messenger fall into two general categories: (1) individuals who refused to
place bids and (2) individuals who did place relatively larger bids in response to information from
scientists.
iii
Preface This thesis is an original work by Alix Schmidt. The research project, of which this thesis is a part,
received research ethics approval from the University of Alberta Research Ethics Board, Project
name “Willingness to pay for agricultural products grown with non-traditional irrigation water”, No.
Pro00071733, April 25, 2017 and the University of Delaware Institutional Review Board, Project
name “Perceptions of alternative irrigation waters”, No. 874969-6, April 24, 2017.
iv
Acknowledgements Thank you Maik Kecinski, Tongzhe Li, Kent Messer, and Julia Parker for your contributions to this
project. Maik, your dedication to your students, passion for research, and calm and encouraging
nature make you an exemplary supervisor. Thank you for all of your guidance; I am so grateful for
the opportunities you have given me. Tongzhe, you are an econometric rock star and it was a
pleasure getting to work with you. Dr. Messer, thank you for taking on the role of co-supervisor and
welcoming me to the Center. Julia, your commitment and enthusiasm made collaborating easy and
enjoyable. I would also like to thank Dr. Boxall for his support and positive encouragement
throughout the project and my degree.
I would like to thank the United States Department of Agriculture- National Institute of Food and
Agriculture for funding support for this project through CONSERVE (Coordinating Non-traditional
Sustainable Water Use in Variable Climates): A Center of Excellence at the Nexus of Sustainable
Water Reuse, Food, and Health. I am also grateful for receiving a Joseph-Armand Bombardier
Canada Graduate Scholarships Program Master’s Scholarship granted by the Social Sciences and
Humanities Research Council of Canada. Thanks to Dr. Luckert and Dr. Wichmann for their roles
in preparing this application.
I would like to thank everyone from the Center for Experimental and Applied Economics at the
University of Delaware who helped with data collection. Maik, Maddi Valinski, Kaitlynn Ritchie,
Francesca Piccone, Huidong Xu, Julia, Mark Griesinger, and Brian Kurz thank you for showing me
the ropes. Everyone’s positive and professional attitudes were instrumental in the success of data
collection. I would also like to thank James Geisler for his work programming the experiment.

v
I would like to thank the students and staff of the Department of REES for creating an encouraging,
supportive, and constructive environment. To my family and friends, thank you for your constant
support throughout my schooling. I love you all.
vi
Table of Contents
Abstract ........................................................................................................................................ ii
Preface ......................................................................................................................................... iii
Acknowledgements ...................................................................................................................... iv
List of Tables .............................................................................................................................. vii
List of Figures............................................................................................................................ viii
Chapter 1 Introduction .................................................................................................................. 1
Chapter 2 Literature Review ......................................................................................................... 9
Chapter 3 Experimental Design................................................................................................... 15
Chapter 4 Results ........................................................................................................................ 20
4.1 Descriptive Results ............................................................................................................ 20
4.2 Regression Results ............................................................................................................ 31
Chapter 5 Conclusion .................................................................................................................. 40
References .................................................................................................................................. 44
Appendix A Visualizations of the BDM auction method ............................................................. 54
Appendix B Details on treatments ............................................................................................... 56
Appendix C Experimental instructions ........................................................................................ 62
Appendix D Experiment order .................................................................................................... 64
Appendix E Survey questions ..................................................................................................... 71
Appendix F Power and sample size analysis ............................................................................... 75
Appendix G Balance across treatments ....................................................................................... 76
vii
List of Tables
Table 1: Hypotheses testing summarizing key results. Table 2: Summary of survey responses including respondents’ demographics. Table 3: Percentage of correct answers to each practice questions (N=201). Table 4: Results from the hurdle model examining the effects of messenger treatments on participants’ WTP compared to the no information control treatment. Table 5: Results from the ordered probit model examining the effects of demographic variables on participants’ stated trust in information received from scientific sources ranked from strongly disagree (1) to strongly agree (5). Table 6: Results from difference-in-difference model examining the effects of participants’ relative WTP for products produced with recycled water compared to conventional water. Table A1: The following table includes individual characteristics from the survey results split by treatment to demonstrate the balance across treatments. These results are also displayed graphically in the charts below.
viii
List of Figures
Figure 1: Freshwater reserves are limited. Of all global water reserves, oceans account for 96.5% while only 2.5% represents freshwater sources. 68.7% of the 2.5% of freshwater is unavailable for human consumption as it is stored in glaciers and ice caps. Lakes account for 20.9% of surface water and other freshwater, while rivers only account for 0.5% of this reserve. Note: The totals of these figures may not be 100% because of rounding. Figure 2: Summary of survey responses to trust associated with different messengers. Strongly disagree refers to participants distrust in the messenger while strongly agree refers to trusting the source. Figure 3: Histograms of bids separated by product type (t-shirt or strawberry) and type of irrigation water (unspecified, conventional, or recycled). Figure 4: Summary of mean bids by messenger treatment and product type. Figure A1: Visualization of the BDM method when the individual’s stated WTP (their bid) is higher than their true WTP. This is sub-optimal for the individual. Figure A2: Visualization of the BDM method when the individual’s stated WTP (their bid) is lower than their true WTP. This is sub-optimal for the individual. Figure A3: Visualization of the BDM method when the individual’s stated WTP (their bid) equals their true WTP and these values are greater than the random price. This is optimal for the individual. Figure A4: Visualization of the BDM method when the individual’s stated WTP (their bid) equals their true WTP and these values are less than the random price. This is optimal for the individual. Figure A5: The additional information quote displayed to participants if the link for more information was clicked came from this EPA document (Bastian and Murray 2012). This source is considered both a scientist and government messenger. This positive information quote was then incorporated into the other messengers. Figure A6: The webpage for the UDaily newspaper source appears as shown in the image presented above (Thomas 2016). Figure A7: The same quote that was found in the EPA 2012 Guidelines for Water Reuse report (Bastian and Murray 2012) is part of the UDaily newspaper article as shown above in the article titled, “UD professors look at water reuse for irrigation and consumer response” (Thomas 2016). Figure A8: The webpage for the nonprofit source, Center for Health and Hope, appears as shown in the image presented above (Center for Health and Hope 2016). Figure A9: The same language from the EPA report (Bastian and Murray 2012) is also included on the Center for Health and Hope webpage in an article about recycled water titled, “Urgent Need: Recycled Water” (Center for Health and Hope 2016).
ix
Figure A10: Ex post two means power and sample size analysis. Figure A11: Percentage of respondents who identified themselves as females in the survey listed by treatment. Figure A12: Mean age of respondents in each treatment. Figure A13: Balance of political affiliation among treatments shown by percentages of respondents grouped by political affiliation and separated by treatments.
1
Chapter 1 Introduction
Effective communication depends, in part, on perceptions of the veracity and potential bias of its
provider. Therefore, the individuals, organizations, and institutions that function to transmit
information are an integral part of the decisions consumers make. When individuals trust the
“messenger,” they are more likely to trust the information; when they do not trust the messenger,
they might reject the information entirely. Thus, two messengers providing the same information
can lead to quite different interpretations.
A number of studies have examined the effect of public trust in various messengers on perceptions
of environmental products. Most used surveys and hypothetical questions to investigate how
individuals ranked their degree of trust for different types of messengers. These studies will be
discussed in more detail in the Literature Review section. This present research, however,
specifically looks at the behavioural differences induced by different messengers. Moreover, using
field experiments, we apply these potential behavioural interventions in a framework that
addressed a timely and important natural resource issue – the use of recycled water in agriculture.
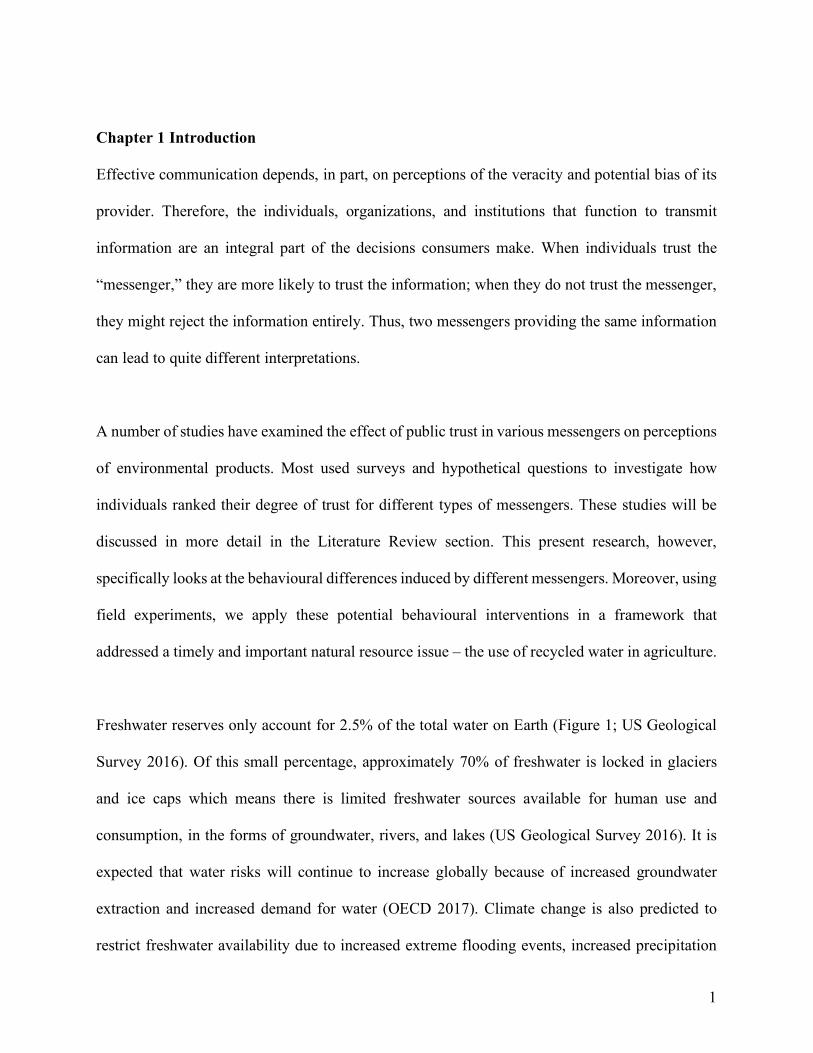
Freshwater reserves only account for 2.5% of the total water on Earth (Figure 1; US Geological
Survey 2016). Of this small percentage, approximately 70% of freshwater is locked in glaciers
and ice caps which means there is limited freshwater sources available for human use and
consumption, in the forms of groundwater, rivers, and lakes (US Geological Survey 2016). It is
expected that water risks will continue to increase globally because of increased groundwater
extraction and increased demand for water (OECD 2017). Climate change is also predicted to
restrict freshwater availability due to increased extreme flooding events, increased precipitation

2
variability, rising sea levels, and water quality deterioration (OECD 2017). An important water
issue the world is facing is the failure to meet basic needs for water (Gleick 2003). Worldwide,
over 1 billion people lack access to safe drinking water and 40% of the global population is
affected by water scarcity (United Nations, Department of Public Information n.d.). The United
Nations emphasized the importance of this issue by including the need to “ensure access to water
and sanitation for all” in the Sustainable Development Goals (United Nations, Department of
Public Information n.d.). While there is growing awareness of water issues, Gleick (2003) states
that international economic support for projects providing water for human use is declining.
Total Global Water Oceans 96.5% Freshwater 2.5%
Freshwater Other Saline Water 0.9%
Glaciers and Ice Caps 68.7%
Groundwater 30.1%
Surface/ Other Freshwater 1.2%
Surface Water and Other Freshwater
Ground Ice and Permafrost 69.0%
Lakes 20.9% Soil Moisture 3.8% Atmosphere 3.0% Swamps, Marshes 2.6% Rivers 0.5% Living Things 0.3%
Figure 1: Freshwater reserves are limited. Of all global water reserves, oceans account for 96.5% while only 2.5% represents freshwater sources. 68.7% of the 2.5% of freshwater is unavailable for human consumption as it is stored in glaciers and ice caps. Lakes account for 20.9% of surface water and other freshwater, while rivers only account for 0.5% of this reserve. Note: The totals of these figures may not be 100% because of rounding.
Along with the distributional issues and declining economic support for water issues, freshwater
reserves are declining. Freshwater reserves are declining globally due to demand increases from a
growing population and increased climate variability (USDA-ERS 2016). According to the United

3
Nations (United Nations n.d.), over the last century water use has grown at more than twice the
rate of population increase. Many problems arise due to the decline in freshwater supplies,
including environmental, economic, and social consequences. There is environmental damage to
freshwater ecosystems and freshwater fauna around the globe are in danger, which can be shown,
for example, in North America where 27% of freshwater fauna are considered threatened with
extinction (Gleick 2003; Ricciardi and Rasmussen 1999). Decreased river flows have also led to
issues such as nutrient depletion, loss of habitat, declining bird populations, shoreline erosion, and
negative effects on local communities (Cohen and Henges- Jeck 2001; Nixon 2003; Vorosmarty
and Meybeck 2003). There are also economic implications when freshwater sources are fully or
over-allocated within a management area; the South Saskatchewan River Basin (SSRB) in Alberta
demonstrates an example of over-allocation of surface water (Alberta Environment 2006). As part
of a newly created Water Management Plan for the SSRB, no new surface water permits are being
granted for three sub-basins within the management area (Government of Alberta 2014).
Therefore, the only way to obtain water permits in these closed sub-basins is through water
allocation transfers from an existing license holder, which limits economic expansion in the area.
There are also social consequences related to freshwater declines as water distribution disputes
can lead to regional and international conflicts (Postel and Wolf 2009).
In order to face these water issues and promote more sustainable water use, changes need to be
implemented in sectors with high water consumption. Agricultural production depends heavily on
adequate access to water, and a vast quantity of water is required for the United States’ agricultural
industry. Agricultural uses accounted for 80% of the United States’ total water consumption and
for more than 90% of the water consumed in many western states, most of this is used for irrigation
4
(USDA-ERS 2016). As a consequence, traditional water sources such as wells drawing from
underground aquifers, reservoirs, and rivers are increasingly suffering from the effects of climate
change, such as droughts, and overuse (Aeschbach-Hertig and Gleeson 2012). Hence, the future
availability of water and sustainability of its use will predominantly depend on how the
agricultural industry and policymakers address water-conservation efforts.
A potential solution to water conservation efforts worldwide is using non-traditional sources of
irrigation water such as recycled water from wastewater treatment plants. Recycled water is highly
treated wastewater from sources like domestic sewage, industrial wastewater, and storm water
runoff (California Department of Water Resources n.d.). There are many benefits of reuse water
as a sustainable alternative water supply. Water reuse typically uses less energy than importing
water (Sheikh 1998). Reusing water also reduces the amount of treated wastewater that is released,
which is especially important in sensitive or impaired surface waters (Miller 2006; Sheikh 1998).
Recycled water is a solution that is being researched and implemented worldwide. In Israel,
limited freshwater availability as well as repeated cycles of multi-year droughts motivated
innovation in non-traditional water sources (Dreizin 2006). Israel now leads the world in use of
non-traditional water for agriculture and has used it successfully in food-crop irrigation for more
than 30 years. For instance, in 2012, Israel’s total effluent reuse was 85% (Israeli Water Authority
2015), which significantly abated the deficit of freshwater supplies (Becker and Ward 2015; Tenne
2010).
5
While other studies have used surveys and hypothetical questions, we are aware of no prior studies
that have used non-hypothetical field experiments involving actual purchase decisions to evaluate
the importance of different messengers in mitigating negative perceptions and nudging consumers
to accept products associated with recycled water. Our field experiments provide insight into both
behavioural responses and willingness to pay (WTP) for agricultural products when the same
information about the benefits of recycled water are provided by different messengers.
Specifically, this study addresses three key questions: (1) Does providing information on the
benefits of sustainable growing techniques affect consumers’ acceptance of their use? (2) What
are the impacts of messenger communication on consumers’ WTP? (3) How effective are different
types of messengers (newspapers, scientists, government agencies, and non-profit organizations)
in increasing the acceptability of recycled water products?
We provide a summary of key results in Table 1. Our results indicate that individual behaviour
can be influenced by a two-stage decision process explained using a hurdle model. Particularly,
we find that the scientists messenger reduces participants’ willingness to bid on products irrigated
with recycled water relative to other kinds of messengers. The opposite is true for participants who
chose to place a bid – once they crossed the lower-limit hurdle of placing a bid, receiving
information from the scientists messenger resulted in a greater WTP for products associated with
recycled water than when the information came from other messengers. Furthermore, when
considering use of recycled water, we find that participants were willing to pay relatively more for
non-food products than for food products. Understanding how people respond to different
messengers has important implications for agricultural and environmental policies. This study
contributes to our understanding of how effective different types of communication mediums are

6
in efforts to foster sustainable consumer decisions, allowing policymakers to improve their
communications and thereby increase acceptance of environmentally friendly and cost effective
practices by broader sections of the public.
7
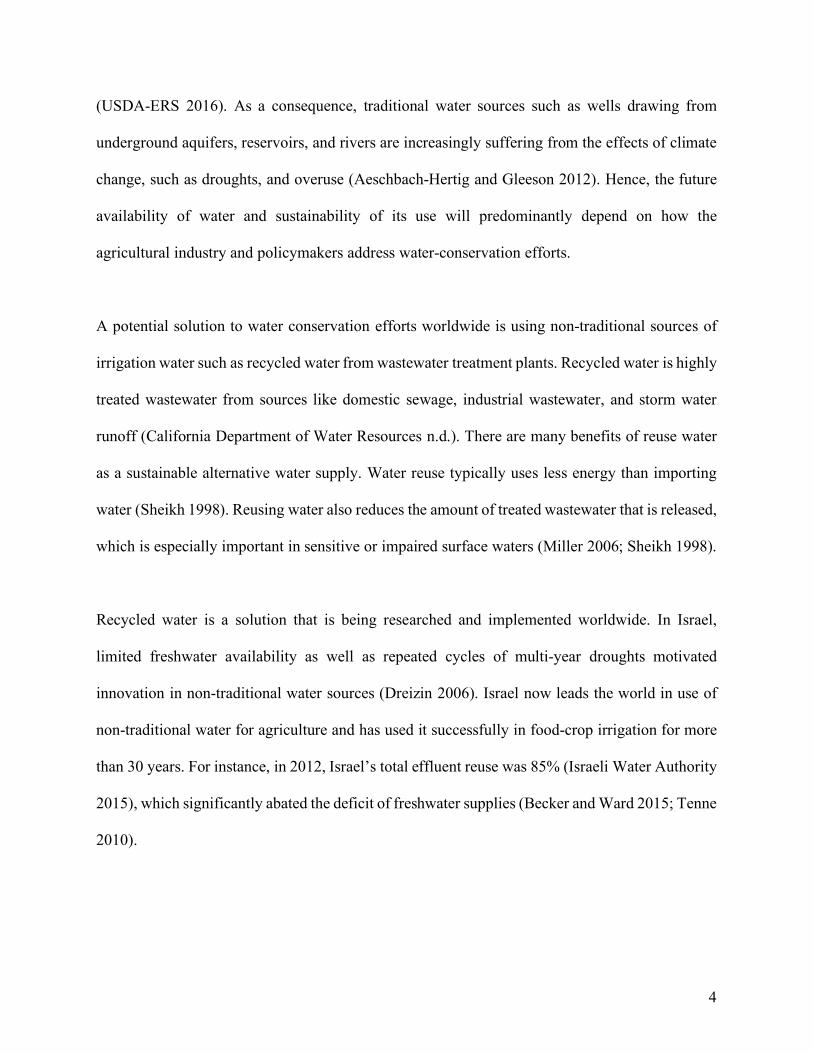
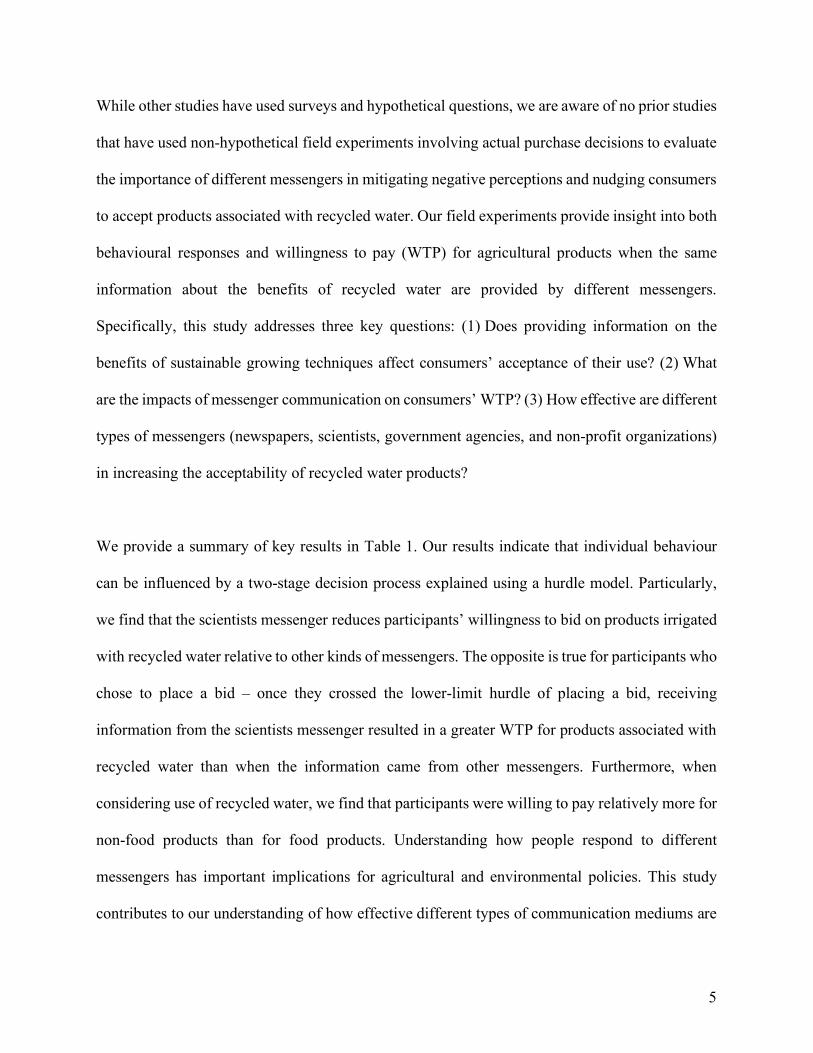
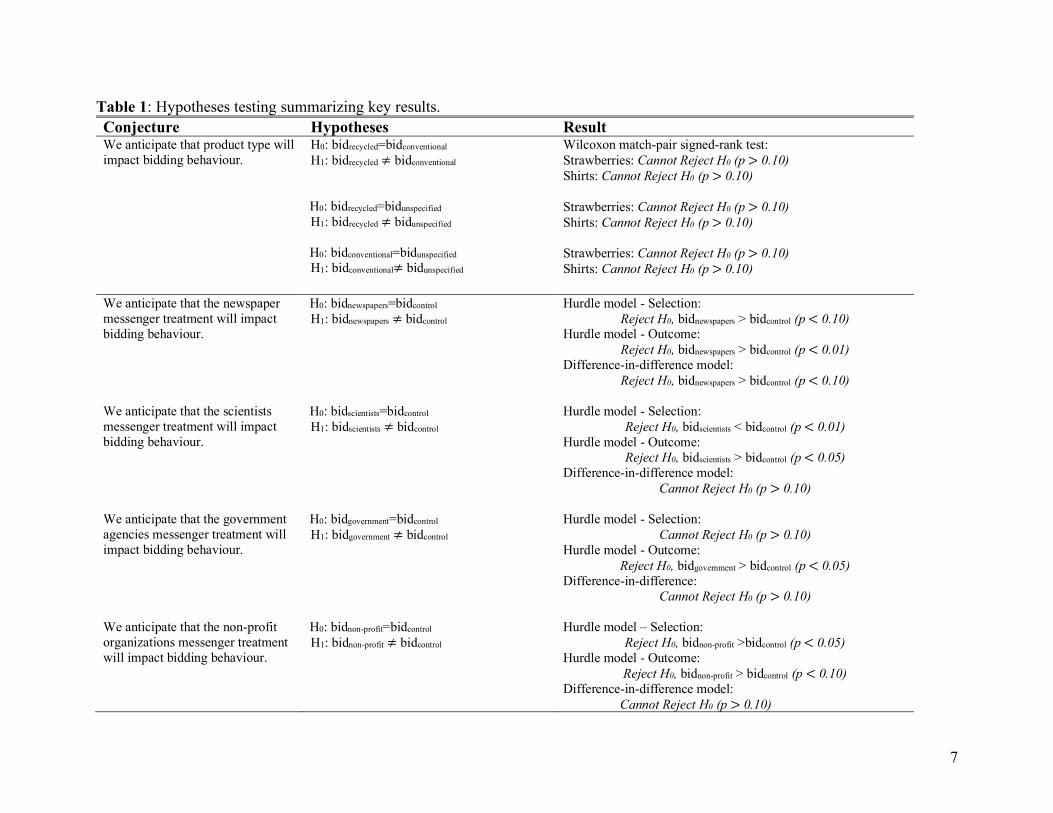
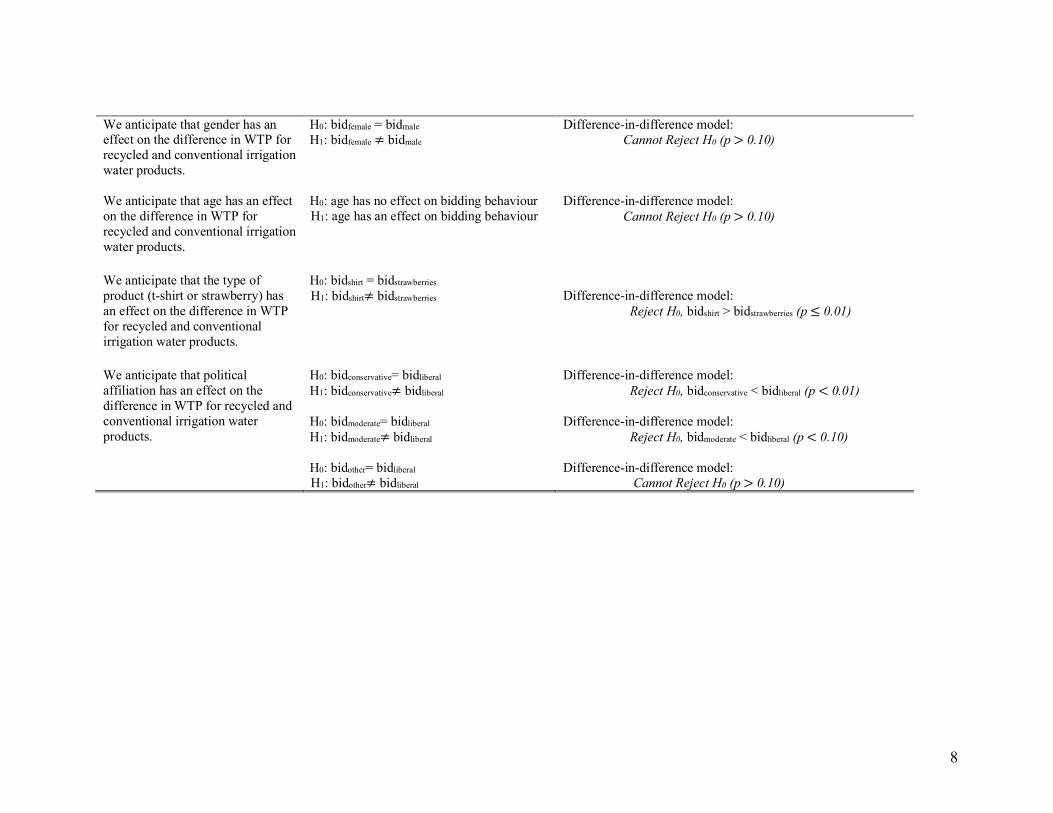
Table 1: Hypotheses testing summarizing key results. Conjecture Hypotheses Result We anticipate that product type will impact bidding behaviour.
H0: bidrecycled=bidconventional H1: bidrecycled ≠ bidconventional
H0: bidrecycled=bidunspecified H1: bidrecycled ≠ bidunspecified
H0: bidconventional=bidunspecified H1: bidconventional≠ bidunspecified
Wilcoxon match-pair signed-rank test: Strawberries: Cannot Reject H0 (p > 0.10) Shirts: Cannot Reject H0 (p > 0.10) Strawberries: Cannot Reject H0 (p > 0.10) Shirts: Cannot Reject H0 (p > 0.10) Strawberries: Cannot Reject H0 (p > 0.10) Shirts: Cannot Reject H0 (p > 0.10)
We anticipate that the newspaper messenger treatment will impact bidding behaviour.
H0: bidnewspapers=bidcontrol H1: bidnewspapers ≠ bidcontrol
Hurdle model - Selection: Reject H0, bidnewspapers > bidcontrol (p < 0.10)
Hurdle model - Outcome: Reject H0, bidnewspapers > bidcontrol (p < 0.01)
Difference-in-difference model: Reject H0, bidnewspapers > bidcontrol (p < 0.10)
We anticipate that the scientists messenger treatment will impact bidding behaviour.
H0: bidscientists=bidcontrol H1: bidscientists ≠ bidcontrol
Hurdle model - Selection: Reject H0, bidscientists < bidcontrol (p < 0.01)
Hurdle model - Outcome: Reject H0, bidscientists > bidcontrol (p < 0.05)
Difference-in-difference model: Cannot Reject H0 (p > 0.10)
We anticipate that the government agencies messenger treatment will impact bidding behaviour.
H0: bidgovernment=bidcontrol H1: bidgovernment ≠ bidcontrol
Hurdle model - Selection: Cannot Reject H0 (p > 0.10)
Hurdle model - Outcome: Reject H0, bidgovernment > bidcontrol (p < 0.05)
Difference-in-difference: Cannot Reject H0 (p > 0.10)
We anticipate that the non-profit organizations messenger treatment will impact bidding behaviour.
H0: bidnon-profit=bidcontrol H1: bidnon-profit ≠ bidcontrol
Hurdle model – Selection: Reject H0, bidnon-profit >bidcontrol (p < 0.05)
Hurdle model - Outcome: Reject H0, bidnon-profit > bidcontrol (p < 0.10)
Difference-in-difference model: Cannot Reject H0 (p > 0.10)
8
We anticipate that gender has an effect on the difference in WTP for recycled and conventional irrigation water products.
H0: bidfemale = bidmale H1: bidfemale ≠ bidmale
Difference-in-difference model: Cannot Reject H0 (p > 0.10)
We anticipate that age has an effect on the difference in WTP for recycled and conventional irrigation water products.
H0: age has no effect on bidding behaviour H1: age has an effect on bidding behaviour
Difference-in-difference model: Cannot Reject H0 (p > 0.10)
We anticipate that the type of product (t-shirt or strawberry) has an effect on the difference in WTP for recycled and conventional irrigation water products.
H0: bidshirt = bidstrawberries H1: bidshirt≠ bidstrawberries
Difference-in-difference model: Reject H0, bidshirt > bidstrawberries (p ≤ 0.01)
We anticipate that political affiliation has an effect on the difference in WTP for recycled and conventional irrigation water products.
H0: bidconservative= bidliberal H1: bidconservative≠ bidliberal
H0: bidmoderate= bidliberal H1: bidmoderate≠ bidliberal
H0: bidother= bidliberal H1: bidother≠ bidliberal
Difference-in-difference model: Reject H0, bidconservative < bidliberal (p < 0.01) Difference-in-difference model: Reject H0, bidmoderate < bidliberal (p < 0.10) Difference-in-difference model: Cannot Reject H0 (p > 0.10)
9
This paper will be structured in the following way: Chapter 2 will discuss the relevant literature
surrounding the topic. This will be followed by the experimental design in Chapter 3, which
explains the set up for this experiment and analysis. Chapter 4 will discuss the results, first
examining the descriptive results in section 4.1 followed by the regression results in section 4.2.
This paper will conclude with a summary of the findings and potential policy implications in
Chapter 5.
Chapter 2 Literature Review
As previously stated, most of the research that has been conducted on the effects of public trust in
messengers related to the perceptions of environmental products have used survey and
hypothetical question methods. In a survey related to genetically modified foods in the United
Kingdom, Hunt and Frewer (2001) found that the most trusted entities were university scientists,
departments of health and of the environment, and Friends of the Earth, followed by organizations
such as the Environment Agency, Greenpeace, quality newspapers, and government scientists.
Respondents were less likely to trust local news reports, government ministers, and tabloid
newspapers. Arbuckle et al. (2015) compared trust in six environmentally oriented interest groups
and found that farmers in Iowa trusted scientists the most and mainstream media outlets the least.
Through interviews and surveys, Haynes et al. (2007) examined trust in scientists, government
authorities, and a risk-management team during a volcanic event in the West Indies island of
Montserrat. They found that government authorities placed a large amount of trust in the scientists
as experts in their particular fields. Members of the public also put most of their faith in the
scientists, noting that people had died in a 1997 volcanic event on the island after ignoring

10
warnings by scientists. While the scientists were viewed as highly competent and honest because
of their impartial stance, information supplied by the government was viewed as politically
motivated. On a five-point Likert scale, most of the participants rated friends as the most
trustworthy (4.24), followed by scientists (3.94), the local radio station (3.91), the emergency
operations center (3.77), and the Montserratian government (3.03).
In research closely related to our study, Dolnicar and Hurlimann (2010) used interviews and focus
groups to examine influences on public acceptance of alternative water sources and asked
participants about the organizations and individuals who most influenced their attitudes about
water issues. The top three sources were research findings (88%), publicized news and information
(84%), and scientists (76%), followed by environmental groups and organizations (63%), the
media (45%), and the government (38%).
However, more recently, several studies have found that the public’s trust in scientist messengers
is declining. Bubela et al. (2009) attributed the loss of trust to perceptions of scientific endeavours
as increasingly interdisciplinary, bureaucratic, globally focused, and funded by private dollars (see
also Higgins 2016; Makri 2017). In a study of genetically modified food, Huffman et al. (2004)
used a survey approach and found that 36.1% of the respondents rated the “other/media” category
as the most trustworthy source of information, followed by third-party and scientific sources
(29.6%), the government (19.5%), private industries (5.0%), and environmental and consumer
groups (3.8%), and 6% viewed none of the messengers as trustworthy. Leiserowitz et al. (2012)
identified a similar trend. They examined the impact of the 2009 “Climategate” controversy on
the public’s beliefs about global warming and trust in information provided by scientists. Between
11
2008 and 2010, the percentage of Americans who believed in climate change fell from 71% to
57%, while the percentage of Americans who denied the existence of climate change rose from
10% to 20%. Although 74% of Americans trusted scientists’ information about climate change
and only 36% trusted information on climate change presented in the media, they found that trust
in scientists as a source for accurate information about global warming had dropped approximately
9%.
Another issue to consider is that using treated, recycled water for irrigation is a new technology,
and therefore, only a few agricultural producers in the United States have adopted it despite its
value as a cost-effective and sustainable way to irrigate crops (Gleick 2010). Their reluctance is
likely related, at least in part, to concerns about how consumers will react to food that is produced
with recycled water. Cusimano et al. (2015), for example, reported that farmers were reluctant to
use recycled water because of negative public perceptions, and similar stigmas have been
associated with other new food-production technologies such as genetic engineering and
irradiation (Aschemann-Witzel et al. 2017; Messer et al. 2017).
Consumers’ concerns likely stem primarily from the fact that recycled water has been in contact
with substances, such as sewage, that are viewed as disgusting. Though the same is true to varying
degrees for literally all water on the planet, the fact that recycled irrigation water has “recently”
(close relation between toilet and tap) been in contact with fecal matter and other potentially
disgusting substances can create strong visceral responses (Rozin 2001; Rozin et al. 1986; Keisner
et al. 2013; Hoffman et al. 2014; Kecinski et al. 2016a, 2016b). In a recent study, Xu et al. (2018)
compared consumers’ responses to various products irrigated with conventional and recycled
12
water and found that participants overall strongly preferred products irrigated with conventional
water. In an earlier study, Po et al. (2005) found that communities that initially supported the
concept of water reuse later rejected it in practice. Similarly, Hurlimann and Dolnicar (2010)
examined the case of Toowoomba, Australia in which public opposition, politics, timing, and
information manipulation led to the community voting against a referendum to implement a
wastewater reuse project. They show that the public may have had concerns of bias and difficulty
trusting information sources on both sides of the referendum. Furthermore, Po et al. (2005) also
found that acceptance of reused water declined with the degree of personal contact people had
with a product; they readily accepted using treated wastewater for irrigating public parks and
playgrounds but were much less accepting of it for drinking and cooking at home. Rock et al.
(2012) similarly found that 67% of Arizona residents supported recycled irrigation water for
inedible crops while only 28% supported it for edible crops. Looking specifically at WTP for
recycled water in Greece, Menegaki et al. (2007) showed that producers were willing to pay 55%
of the price of freshwater for recycled water for irrigation of olive trees and tomatoes. Consumers’
mean WTP for olive oil produced from trees irrigated with recycled water was 88% of the market
price for olives produced using freshwater.
One way to counter negative perceptions of recycled water and thus substantially improve
consumers’ WTP is to provide information about its safety. Bakopoulou et al. (2008), for example,
concluded that consumers would pay more for products that had been irrigated with recycled water
when they received a sufficient amount of information about the processes associated with reusing
water. In the United States, consumers generally know little about agricultural technologies so it
13
is important to determine how best to provide information about recycled water as it can be a safe
and sustainable irrigation method (Bastian and Murray 2012).
Another issue to be aware of is the existence of environmental price premiums. Although disgust
can result in lower WTP for some products, on the other hand, some people are willing to pay
price premiums for certain environmentally friendly and sustainably grown products (see Ferraro
et al. 2005). In a study by Vecchio and Annunziata (2015), the authors found that WTP for
environmentally sustainable-labeled products increased with age, household income, and was
higher for females. However, Bazoche et al. (2008) studied wine consumers’ WTP for
environmental characteristics, specifically wine with reduced pesticide use, and found that
consumers did not value environmentally friendly wines more when they isolated the
environmental effect from the health effect.
It is important to consider that demographics can influence WTP related to recycled water
products. Menegaki et al. (2007) found that younger people were more likely to consume tomatoes
irrigated with recycled water. However, Fielding et al. (2015) found the opposite effect of age;
they found that older people were more comfortable with using recycled water for irrigation. While
some research has shown that women have a higher WTP for environmentally friendly products,
other research has found that females had more negative attitudes towards recycled water as well
as a lower tolerance for risk and disgust than males (Dolnicar and Schaefer 2009; Fielding et al.
2015; Po et al. 2005).
14
Researchers have also found impacts of demographic variables on trust. Vainio et al. (2017)
studied the associations between trust and perceived risk related to nuclear energy and climate
change mitigation. They found that trust varied by respondents’ political affiliation, household
income, and gender; and that increased education was associated with an increased trust of
government sources. Although education will not be used as an explanatory variable in this study,
it is important to research other contexts related to trust in order to thoroughly understand this
topic. Po et al. (2005) found that people with lower education were less trusting of authorities.
Around issues of genetically modified foods, Huffman et al. (2004) found that well-educated
individuals were more likely to trust an independent third-party to provide verifiable information
than other groups which included government, environmental or consumer groups, private
industry, none of the sources, and other sources. They also found that participants informed about
the issue of genetically modified foods were more likely to trust government sources relative to a
third-party source and that a strict religious upbringing impacted participants’ trust of certain
organizations. Dolnicar and Hurlimann (2010) found that participants with a higher education
level were more strongly influenced by government and scientific sources. 20% of participants
without a college degree were not influenced by anyone, whereas this number dropped to 7% for
those with a postgraduate degree. Arbuckle et al. (2015) found that farmers who believe in human-
induced climate change are more likely to trust government action on greenhouse gas emissions.
In the Leiserowitz et al. (2012) study that examined the decline of trust in scientists for climate
change information following “Climategate”, Democrats were less likely to lessen their trust in
scientists than any other political party. Those with an egalitarian worldview were also less likely
to lose trust in scientists than those with an individualistic worldview. In another study, trust in
15
science and the government were found to be positive predictors of comfort with drinking recycled
water (Fielding et al. 2015).
Chapter 3 Experimental Design The Becker-DeGroot-Marschak (BDM) (Becker et al. 1964) auction is commonly used in
experiments to generate incentive-compatible, demand-revealing results (see Boyce et al. 1992;
Irwin et al. 1998; Messer et al. 2010). This present study used the BDM method in a framed field
experiment. While there is less control in field experiments than laboratory settings, field
experiments have the advantage of being more of a real-world setting (Lusk et al. 2001). The BDM
method was used to elicit participants’ WTP for two types of items, fresh strawberries and all-
cotton t-shirts, produced with conventional and recycled irrigation water by presenting participants
with six opportunities to bid: (1) t-shirts made from cotton irrigated with conventional water, (2) t-
shirts made from cotton irrigated with recycled water, (3) cotton t-shirts with no specification of
the source of irrigation water used, (4) strawberries irrigated with conventional water,
(5) strawberries irrigated with recycled water, and (6) strawberries with no specification made of
the type of irrigation water used.
Each participant received $15 that could be used to purchase products in the auction via private
bids made on tablet computers provided to them. Each participant, i, was asked to indicate the
highest amount (B) they would pay for each product, j (Equation 1). Once the bidding rounds were
completed, the computer program randomly chose one round for implementation and a price (R)
for the product in that round. The outcome of the auction was determined by:
16
"#$%&'()*+(+,-+%./&%0,-12 = 4.0/,ℎ#6+78912 ≥ "12
;&.0/,ℎ#6+78912 < "12
(1)
where Bij and Rij were truncated from below at $0 and from above at $15.
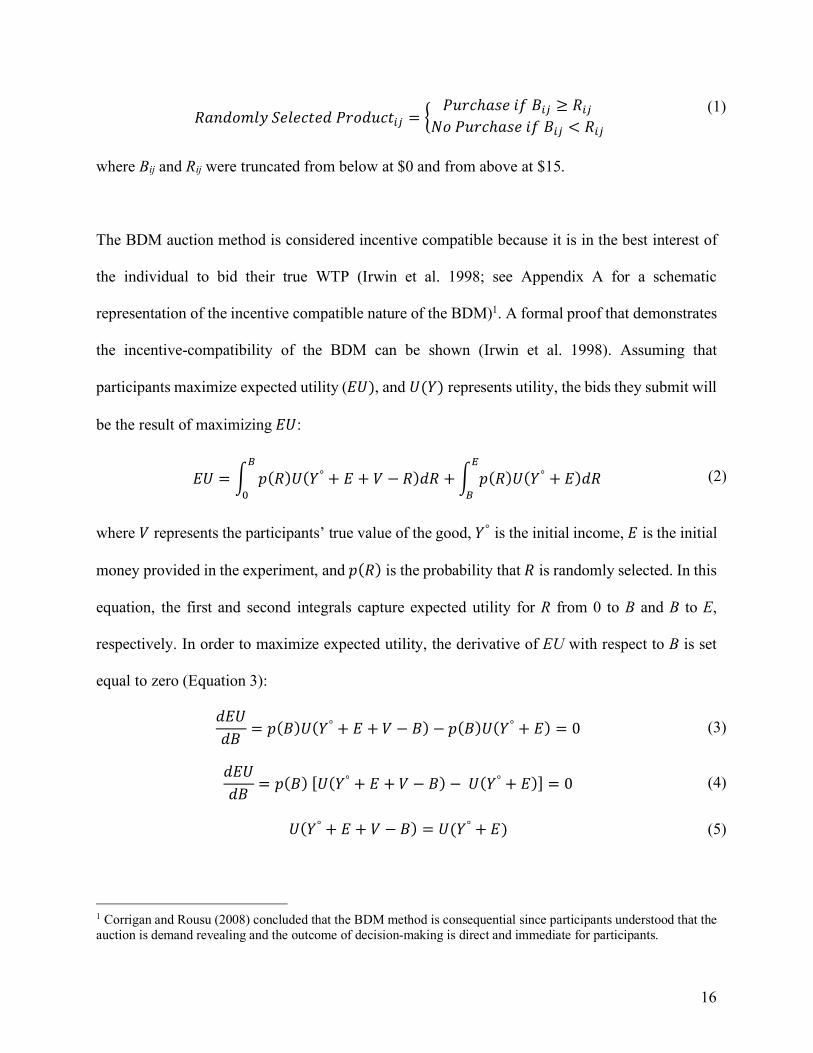
The BDM auction method is considered incentive compatible because it is in the best interest of
the individual to bid their true WTP (Irwin et al. 1998; see Appendix A for a schematic
representation of the incentive compatible nature of the BDM)1. A formal proof that demonstrates
the incentive-compatibility of the BDM can be shown (Irwin et al. 1998). Assuming that
participants maximize expected utility (=>), and >(A) represents utility, the bids they submit will
be the result of maximizing =>:
=> = B C(")>(A° + = + F − ")%" +B C(")>(A° + =)%"H
I
I
J (2)
where F represents the participants’ true value of the good, A° is the initial income, = is the initial
money provided in the experiment, and C(") is the probability that " is randomly selected. In this
equation, the first and second integrals capture expected utility for R from 0 to B and B to E,
respectively. In order to maximize expected utility, the derivative of EU with respect to B is set
equal to zero (Equation 3):
%=>%9
= C(9)>(A° + = + F − 9) − C(9)>(A° + =) = 0 (3)
%=>%9
= C(9)[>(A° + = + F − 9) − >(A° + =)] = 0 (4)
>(A° + = + F − 9) = >(A° + =) (5)
1 Corrigan and Rousu (2008) concluded that the BDM method is consequential since participants understood that the auction is demand revealing and the outcome of decision-making is direct and immediate for participants.
17
∴ F = 9 (6)
Assuming C(9) > 0, Equations 3 through 6 imply that the maximum => occurs when 9 = F; it
is optimal for an individual to submit a bid that is equal to their true value for the product.
There are many additional benefits of using the BDM auction method. BDM auctions have been
shown to be useful for eliciting values in field settings since participants’ bids are compared to a
random number instead of other participants’ bids (Lusk et al. 2001; Rousu et al. 2005), as would
be the case for first, second, or nth-price auctions where multiple people simultaneously making
decisions are required. Participants are also not as prone to competition or collusion because they
are bidding against a random number (Bougherara and Combris 2009). The BDM is a beneficial
method to use since it offers control over payoffs and initial information provided (Irwin et al.
1998). While BDM auctions are demand-revealing in theory, Lusk and Shogren (2007) have noted
the importance of first providing participants with training and practice using the mechanism.
Without it, participants can approach bidding heuristically, choosing to buy low or sell high and
thereby thwarting the auction’s ability to reveal their true demand. Plott and Zeiler (2005), on the
other hand, showed that providing thorough training and explanations largely overcame
misconceptions about bidding and offering behaviour in such auctions2. In our experiment, we
provided five practice rounds before the participants placed their bids. Each round presented a
question in the following format.
If your bid is $6 and the randomly drawn number is $10, what is the outcome?
(A) You purchase the product for $10 and have $5 remaining.
(B) You will not purchase the product and have $15 remaining.
2 Horowitz (2006) pointed to potential issues arising from the circumstances used in the auction. For instance, participants’ valuations can be influenced by how they are asked to pay for the items.
18
After each practice question, the Python-based computer program indicated whether the
participant had answered correctly, providing an opportunity for participants to learn from their
mistakes.
To evaluate differences in how information from different types of messengers was perceived, the
participants were randomly assigned to one of five groups—a no-information control group and
four messenger treatment groups (see Appendix B for more details): (a) newspapers, (b)
government agencies, (c) scientists, and (d) non-profit organizations. In the newspaper treatment,
for example, the messenger, providing information and an associated link on the benefits of using
recycled irrigation water, would be described as a “newspaper article:”
“A newspaper article <LINK> has pointed to the positive impacts of using recycled
water in agricultural production.”
Participants who wanted more information could click on the link provided to view an excerpt of
the article. The remainder of the statement and the wording in the excerpt in the treatments were
identical; only the source of the information varied. This specification allowed us to observe how
many participants chose to click the link and could potentially shed light on how the participants’
behaviour varied in terms of bidding.
For this study, participants were recruited at a branch of the Department of Motor Vehicles, a local
ice cream parlor, and a Life-long Learning Center in the United States mid-Atlantic region.
Combined, these locations allowed us to collect data from a large cross-section of the population.
At each location, the products in the auction were displayed on a table that was clearly visible to
visitors and patrons. A second table near the establishment entrance provided the tablet computers
19
loaded with the experiment. The sample was selected by approaching individuals at the
establishment and inviting them to participate in a research study concerning water and a number
of products that had been irrigated with the water. Individuals were also free to approach members
of the research team, who were clearly visible at each location and welcomed individuals’
participation. After signing the informed consent and reading the instructions (which included
several detailed examples of the auction process), participants completed the training/practice
session involving the five multiple-choice questions designed to familiarize them with the BDM
mechanism (the instructions and practice questions are provided in Appendix C and the training
questions are shown in Appendix D). Then, prior to the auction, each participant was given the
following definitions for conventional and recycled water:
Recycled Water: “Recycled water is highly treated wastewater from various sources,
such as domestic sewage, industrial wastewater, and storm water runoff.”
Conventional Water: “Typical sources of conventional water include: surface water,
groundwater from wells, rainwater, impounded water (ponds, reservoirs, and lakes),
open canals, rivers, streams, and irrigation ditches.”
The auction involved three opportunities to bid on strawberries and three other opportunities to
bid on t-shirts—one for each water condition (conventional, recycled, and no information)—that
were presented in random order (for the overall order and presentation of the experiment see
Appendix D).
The instructions informed participants that they would receive $15 for their participation in the
experiment and could keep the money or use it to purchase products in the auction. Bids in the
auction were restricted from $0 (choosing not to bid) to a maximum of $15. Once the bidding was
20
completed, the participants also completed a brief survey (Appendix E) that collected demographic
information. Finally, the computer program randomly selected one of the rounds for
implementation and established the product’s price, determining the product purchased by
winning bidders and the participants’ net earnings.
Chapter 4 Results
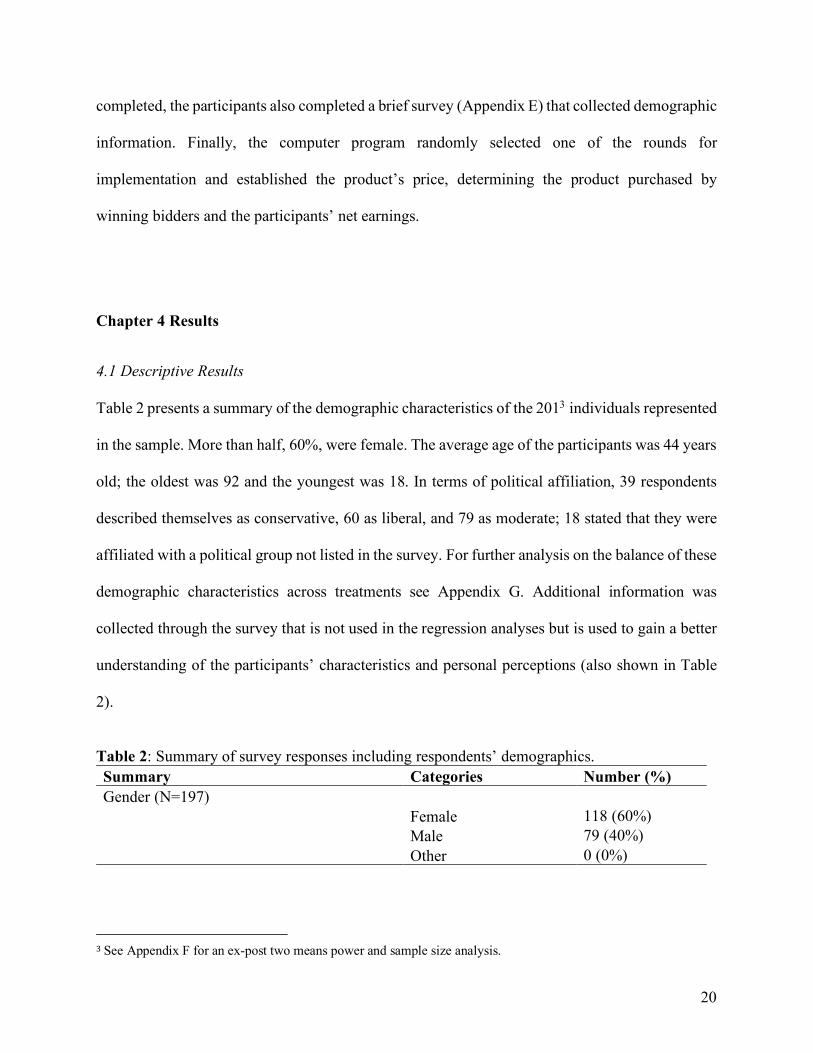
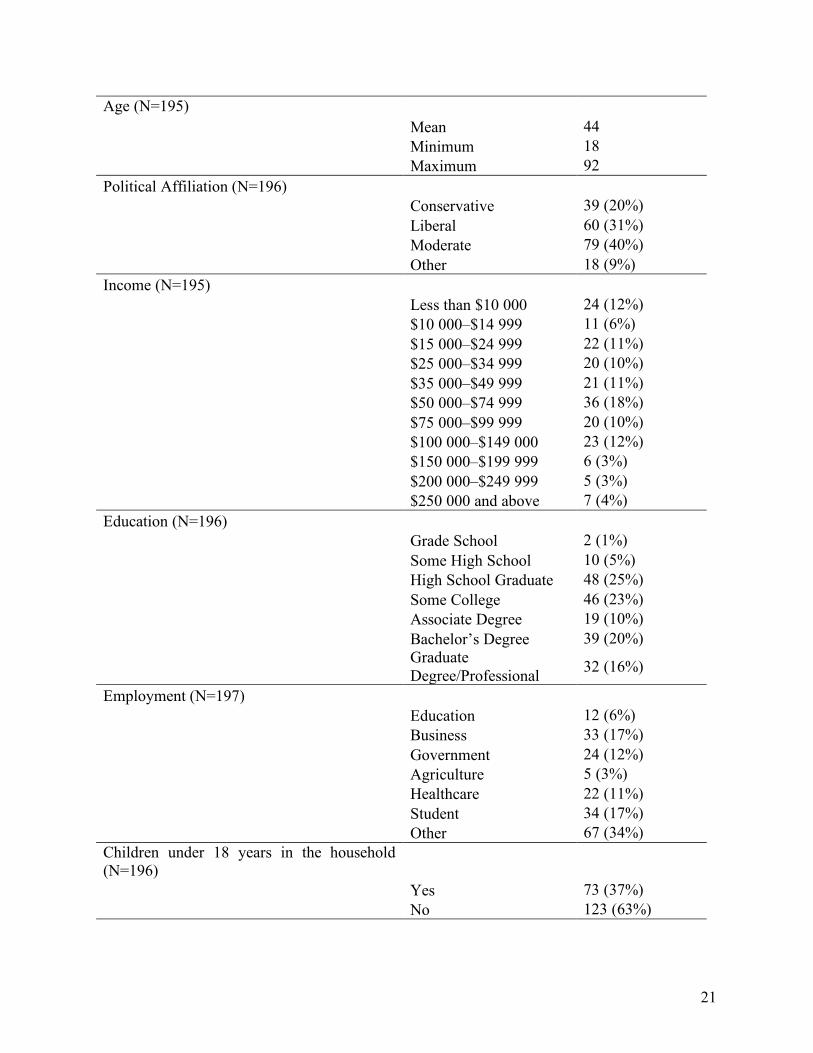
4.1 Descriptive Results Table 2 presents a summary of the demographic characteristics of the 2013 individuals represented
in the sample. More than half, 60%, were female. The average age of the participants was 44 years
old; the oldest was 92 and the youngest was 18. In terms of political affiliation, 39 respondents
described themselves as conservative, 60 as liberal, and 79 as moderate; 18 stated that they were
affiliated with a political group not listed in the survey. For further analysis on the balance of these
demographic characteristics across treatments see Appendix G. Additional information was
collected through the survey that is not used in the regression analyses but is used to gain a better
understanding of the participants’ characteristics and personal perceptions (also shown in Table
2).
Table 2: Summary of survey responses including respondents’ demographics.
3See Appendix F for an ex-post two means power and sample size analysis.
Summary Categories Number (%) Gender (N=197) Female 118 (60%) Male 79 (40%) Other 0 (0%)
21
Age (N=195) Mean 44 Minimum 18 Maximum 92 Political Affiliation (N=196) Conservative 39 (20%) Liberal 60 (31%) Moderate 79 (40%) Other 18 (9%) Income (N=195) Less than $10 000 24 (12%) $10 000–$14 999 11 (6%) $15 000–$24 999 22 (11%) $25 000–$34 999 20 (10%) $35 000–$49 999 21 (11%) $50 000–$74 999 36 (18%) $75 000–$99 999 20 (10%) $100 000–$149 000 23 (12%) $150 000–$199 999 6 (3%) $200 000–$249 999 5 (3%) $250 000 and above 7 (4%) Education (N=196) Grade School 2 (1%) Some High School 10 (5%) High School Graduate 48 (25%) Some College 46 (23%) Associate Degree 19 (10%) Bachelor’s Degree 39 (20%)
Graduate Degree/Professional 32 (16%)
Employment (N=197) Education 12 (6%) Business 33 (17%) Government 24 (12%) Agriculture 5 (3%) Healthcare 22 (11%) Student 34 (17%) Other 67 (34%) Children under 18 years in the household (N=196) Yes 73 (37%) No 123 (63%)
22
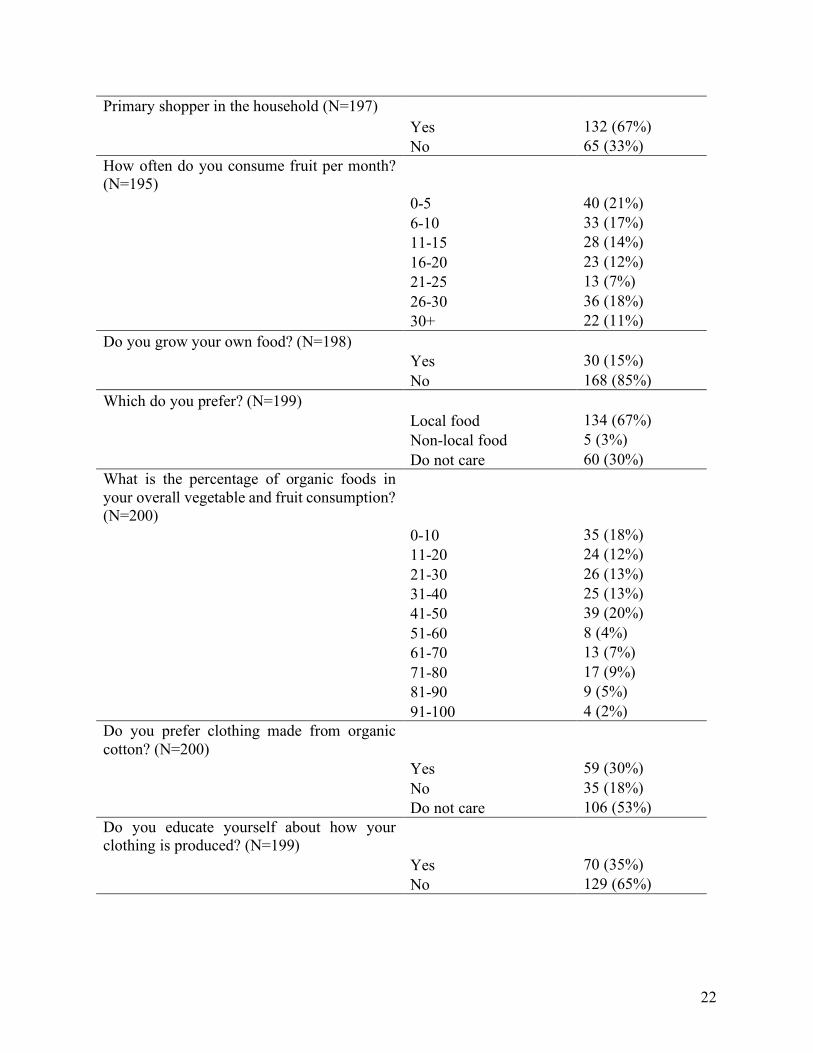
Primary shopper in the household (N=197) Yes 132 (67%) No 65 (33%) How often do you consume fruit per month? (N=195) 0-5 40 (21%) 6-10 33 (17%) 11-15 28 (14%) 16-20 23 (12%) 21-25 13 (7%) 26-30 36 (18%) 30+ 22 (11%) Do you grow your own food? (N=198) Yes 30 (15%) No 168 (85%) Which do you prefer? (N=199) Local food 134 (67%) Non-local food 5 (3%) Do not care 60 (30%) What is the percentage of organic foods in your overall vegetable and fruit consumption? (N=200)
0-10 35 (18%) 11-20 24 (12%) 21-30 26 (13%) 31-40 25 (13%) 41-50 39 (20%) 51-60 8 (4%) 61-70 13 (7%) 71-80 17 (9%) 81-90 9 (5%) 91-100 4 (2%) Do you prefer clothing made from organic cotton? (N=200) Yes 59 (30%) No 35 (18%) Do not care 106 (53%) Do you educate yourself about how your clothing is produced? (N=199) Yes 70 (35%) No 129 (65%)
23
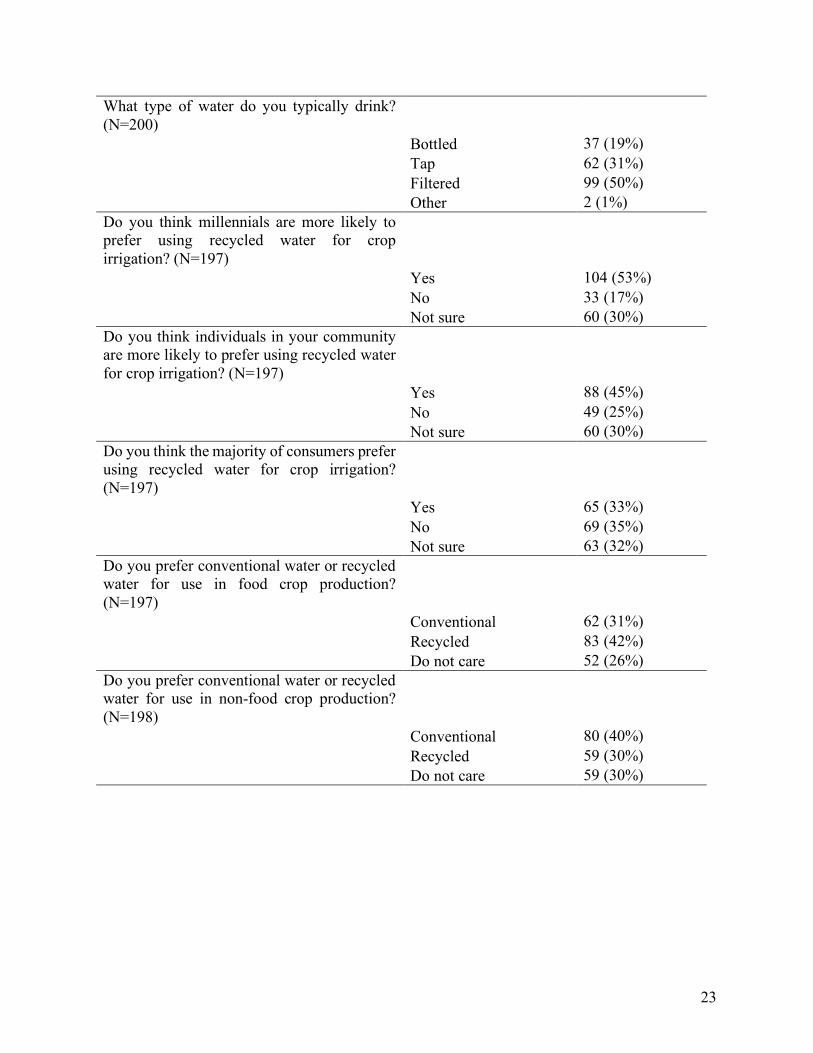
What type of water do you typically drink? (N=200) Bottled 37 (19%) Tap 62 (31%) Filtered 99 (50%) Other 2 (1%) Do you think millennials are more likely to prefer using recycled water for crop irrigation? (N=197)
Yes 104 (53%) No 33 (17%) Not sure 60 (30%) Do you think individuals in your community are more likely to prefer using recycled water for crop irrigation? (N=197)
Yes 88 (45%) No 49 (25%) Not sure 60 (30%) Do you think the majority of consumers prefer using recycled water for crop irrigation? (N=197)
Yes 65 (33%) No 69 (35%) Not sure 63 (32%) Do you prefer conventional water or recycled water for use in food crop production? (N=197)
Conventional 62 (31%) Recycled 83 (42%) Do not care 52 (26%) Do you prefer conventional water or recycled water for use in non-food crop production? (N=198)
Conventional 80 (40%) Recycled 59 (30%) Do not care 59 (30%)
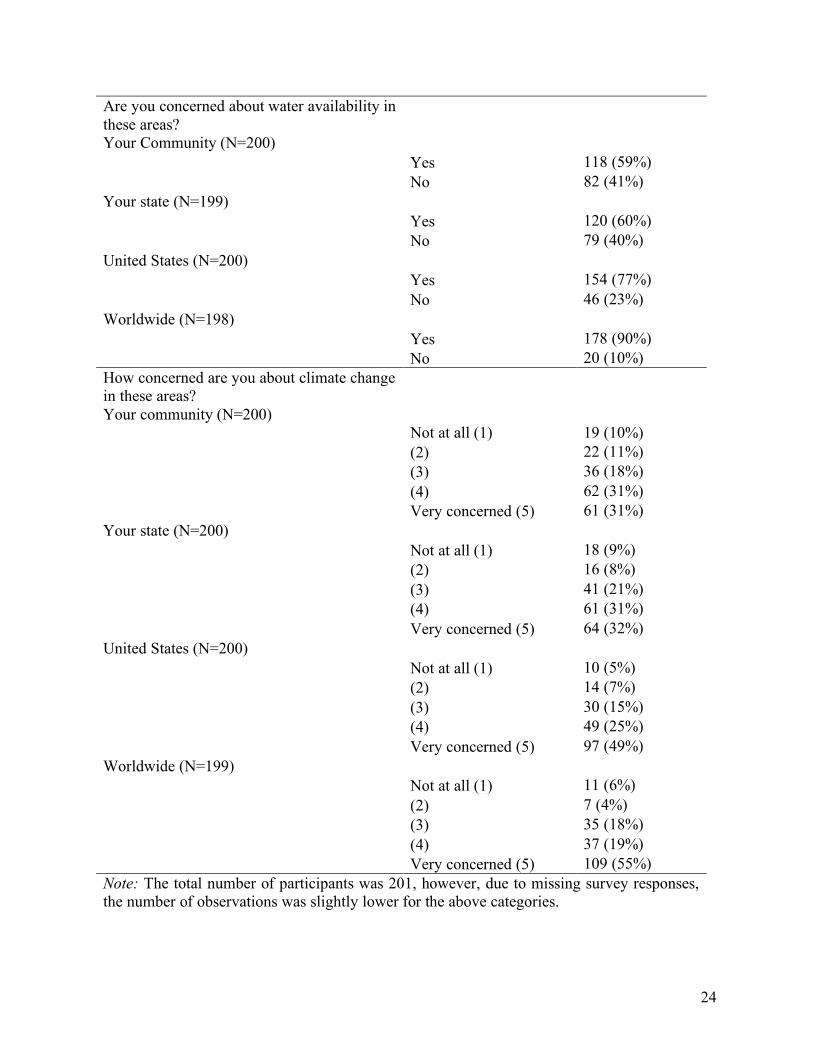
24
Are you concerned about water availability in these areas? Your Community (N=200) Yes 118 (59%) No 82 (41%) Your state (N=199)
Yes 120 (60%) No 79 (40%)
United States (N=200) Yes 154 (77%)
No 46 (23%) Worldwide (N=198)
Yes 178 (90%) No 20 (10%)
How concerned are you about climate change in these areas? Your community (N=200)
Not at all (1) 19 (10%) (2) 22 (11%) (3) 36 (18%) (4) 62 (31%)
Very concerned (5) 61 (31%) Your state (N=200)
Not at all (1) 18 (9%) (2) 16 (8%) (3) 41 (21%) (4) 61 (31%) Very concerned (5) 64 (32%)
United States (N=200) Not at all (1) 10 (5%) (2) 14 (7%) (3) 30 (15%) (4) 49 (25%) Very concerned (5) 97 (49%)
Worldwide (N=199) Not at all (1) 11 (6%) (2) 7 (4%) (3) 35 (18%) (4) 37 (19%) Very concerned (5) 109 (55%)
Note: The total number of participants was 201, however, due to missing survey responses, the number of observations was slightly lower for the above categories.

25
Our study included participants with a range of employment backgrounds; for example including
business, government, and students. 37% of respondents had children under the age of 18 in their
household and 67% stated that they were the primary shopper of their household. The sample was
split on how often fruit was consumed per month; individual unit responses for this question were
grouped into categories. The highest category was 0-5 times per month, which contained 21% of
the sample and the next most common category with 18% of respondents was 26-30 times per
month. Only a small portion of people in the study, 15%, grow their own food; however, the
majority, 67%, prefer local food. Respondents were also asked what percentage of their overall
fruit and vegetable consumption was organic. Their responses were condensed into categories of
10. The majority of responses were under 50% organic with the top categories of 41-50% organic,
which contained 20% of the sample followed by 18% of respondents in the 0-10% organic
category.
Most respondents, 53%, stated “Do not care” when asked if they had a preference for clothing
made from cotton and the majority, 65%, also said they did not educate themselves about how
their clothing is produced. 50% of people in the study said they drink filtered water, followed by
31% who said they drink tap water. 53% of participants thought millennials were more likely to
prefer recycled water for crop irrigation. When participants were asked if they thought individuals
in their community were more likely to prefer using recycled water for crop irrigation, 45%
responded “Yes” and 25% responded “No”, while the remaining were uncertain. When asked a
similar question instead about the majority of consumers preferring recycled water, only 33%
responded “Yes” and the “No” responses increased to 35%. Participants were also asked about
their own preferences for using recycled water for irrigation. 42% stated a preference for recycled
26
water for use in food crop production, 31% preferred conventional water, and 26% did not care.
In response to a similar question regarding non-food crop production, the portion of respondents
who preferred recycled water dropped to 30% and preference for conventional rose to 40%.
Participants were concerned about water availability to varying degrees for different areas. More
specifically the larger the scale presented, the more concerned about water availability they were
(59% were concerned at their community level compared to 90% on a worldwide level). Similarly,
respondents were increasingly concerned about climate change as the area presented increased;
31% stated that they were very concerned about climate change in their community, up to 55%
stating very concerned about climate change worldwide.
Additionally, participants were asked in the survey how much they trusted information from all
the sources used as treatments (scientists, government agencies, non-profit organizations, and
newspapers), the results of which are summarized in Figure 2. 44% of participants stated that they
strongly agreed with trusting information from scientists. In the other categories, only 18%
strongly agreed with trusting information from non-profit organizations, 7% strongly agreed with
trusting newspapers, and 6% strongly agreed with trusting government agencies. The highest
portion of responses for trusting newspapers, non-profit organizations, and government agencies
was in the middle response, (3), between strongly disagree (1) and strongly agree (5).

27
Figure 2: Summary of survey responses to trust associated with different messengers. Strongly disagree refers to participants distrust in the messenger while strongly agree refers to trusting the source.
Table 3 reports how participants responded to practice questions, which were designed to
familiarize them with the BDM auction. Most individuals (82%) correctly answered the first quiz
question. However, interestingly and surprisingly, there is a slightly decreasing trend in terms of
correctness. Specifically, the first question yielded the highest number of correct answers,
followed by the second question through the last question in a monotonically descending order. It
is beyond the scope of this research to identify the underlying reasons for such behavioural pattern,
2238
7155
14
0
20
40
60
80
1 2 3 4 5Strongly Disagree (1) to
Strongly Agree (5)
Newspapers
824
67 66
35
0
20
40
60
80
1 2 3 4 5Strongly Disagree (1) to
Strongly Agree (5)
Non-profit Organizations
34
5365
36
12
0
20
40
60
80
1 2 3 4 5Strongly Disagree (1) to
Strongly Agree (5)
Government Agencies
6 9
40
58
87
0
20
40
60
80
1 2 3 4 5Strongly Disagree (1) to
Strongly Agree (5)
Scientists
28
as it may be explained by fatigue, loss of interest, or simply that the questions could appear to
have different difficulty levels to the participants. However, this raises an interesting question for
future research in determining what the optimal training intensity for participants is in
experimental auctions.
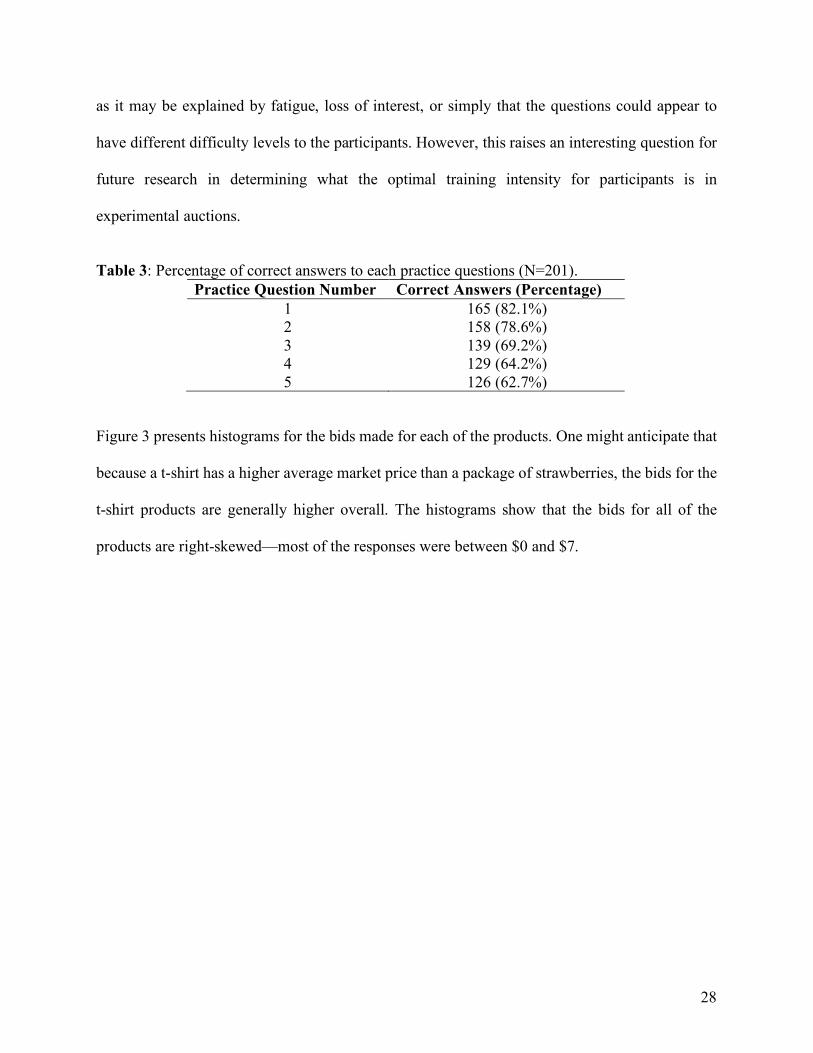
Table 3: Percentage of correct answers to each practice questions (N=201).
Figure 3 presents histograms for the bids made for each of the products. One might anticipate that
because a t-shirt has a higher average market price than a package of strawberries, the bids for the
t-shirt products are generally higher overall. The histograms show that the bids for all of the
products are right-skewed—most of the responses were between $0 and $7.
Practice Question Number Correct Answers (Percentage) 1 165 (82.1%) 2 158 (78.6%) 3 139 (69.2%) 4 129 (64.2%) 5 126 (62.7%)

29
Figure 3: Histograms of bids separated by product type (t-shirt or strawberry) and type of irrigation water (unspecified, conventional, or recycled).
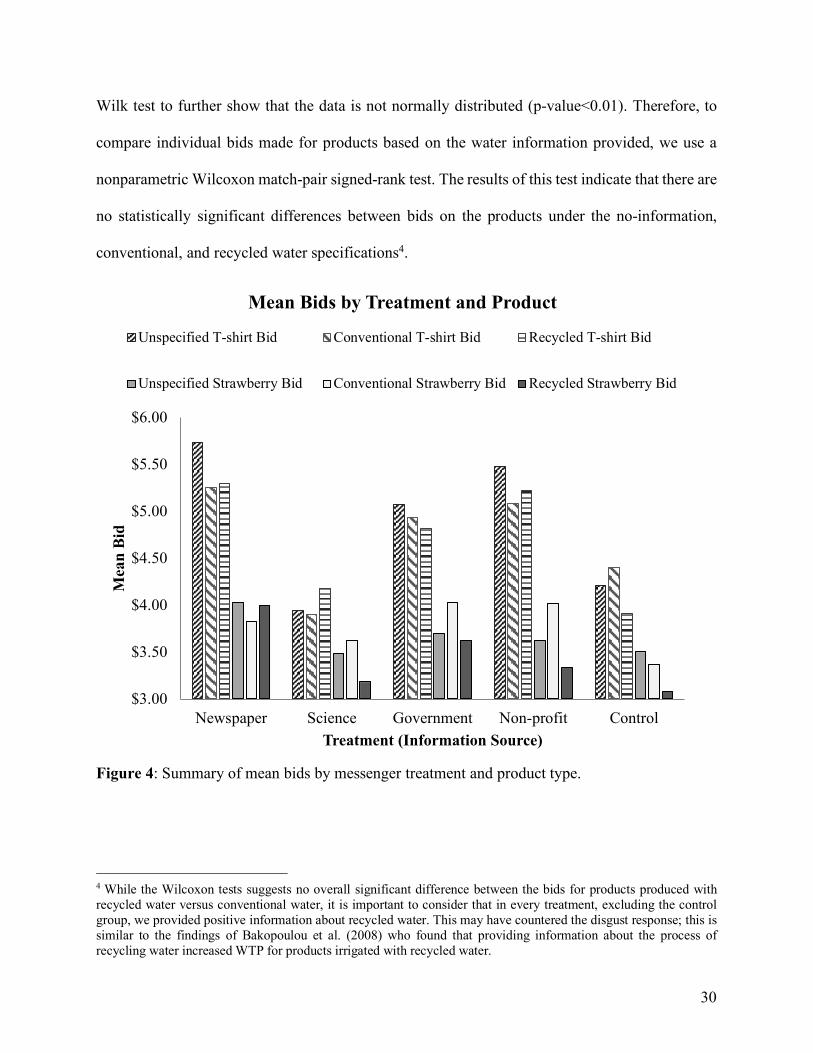
Figure 4 shows mean bids for each product type and messenger treatment. Again, as expected, the
average bids for t-shirts are higher than the average bids for strawberries. The mean bid over all
of the products and treatments is $4.23. A comparison of the bids for t-shirts shows means of $4.94
for no irrigation water specification, $4.75 for conventional water, and $4.74 for recycled water.
The results for the strawberries are similar: mean bids of $3.69 for no water specification, $3.79
for conventional water, and $3.48 for recycled water. Next, we analyze the potential effects of the
messengers. We find that the newspapers treatment produces the highest overall bids with a mean
of $4.69 and the scientists treatment produces the lowest with a mean of $3.72. We used a Shapiro-
05
1015
05
1015
0 5 10 15 0 5 10 15 0 5 10 15
Shirt- Unspecified Shirt- Conventional Shirt- Recycled
Strawberry- Unspecified Strawberry- Conventional Strawberry-Recycled
Den
sity
Bid in US DollarsGraphs by ProductDummy
Histograms of Bids by Product
30
Wilk test to further show that the data is not normally distributed (p-value<0.01). Therefore, to
compare individual bids made for products based on the water information provided, we use a
nonparametric Wilcoxon match-pair signed-rank test. The results of this test indicate that there are
no statistically significant differences between bids on the products under the no-information,
conventional, and recycled water specifications4.
Figure 4: Summary of mean bids by messenger treatment and product type.
4 While the Wilcoxon tests suggests no overall significant difference between the bids for products produced with recycled water versus conventional water, it is important to consider that in every treatment, excluding the control group, we provided positive information about recycled water. This may have countered the disgust response; this is similar to the findings of Bakopoulou et al. (2008) who found that providing information about the process of recycling water increased WTP for products irrigated with recycled water.
$3.00
$3.50
$4.00
$4.50
$5.00
$5.50
$6.00
Newspaper Science Government Non-profit Control
Mea
n B
id
Treatment (Information Source)
Mean Bids by Treatment and Product
Unspecified T-shirt Bid Conventional T-shirt Bid Recycled T-shirt Bid
Unspecified Strawberry Bid Conventional Strawberry Bid Recycled Strawberry Bid

31
4.2 Regression Results
We use regression models to explore participants’ decision-making regarding the products with a
specific interest in the effects of the messenger treatments and certain demographic characteristics.
Recall that the results we present in Figure 3 show a large number of $0 bids, which indicate that
a number of participants chose not to bid for particular items. There are also clusters of bids around
$5 for t-shirts and $3.50 for strawberries. These observations may represent the participants’
perceived market prices for those products. Colson et al. (2010), for example, collected data on
individual perceptions of market prices in a WTP experiment and used those prices as upper
censors in their model (see also Harrison et al. 2004). However, they collected data in a grocery
store so the consumers’ transaction cost to purchase goods outside of the auction was extremely
low; upper censoring at the perceived market price was a realistic specification of that model. Our
experiment did not collect data on the participants’ perceptions of market prices. Additionally, the
transaction cost of purchasing the strawberries and t-shirts elsewhere was higher in terms of both
dollars and availability of products labeled with the type of irrigation water used; therefore, we do
not use upper censoring in our analysis.
Also note that only three participants5 across all treatment groups chose to click the provided link
to receive further information about the benefits of using recycled water. This is an interesting
finding as it contributes to our understanding of how consumers’ purchasing decisions are
impacted by accompanied information. Specifically, it appears that participants’ efforts to acquire
further information were relatively small. The literature suggests that consumers are in favour of
5 All three participants were part of the newspapers treatment. However, there are too few observations to draw inference from this finding.
32
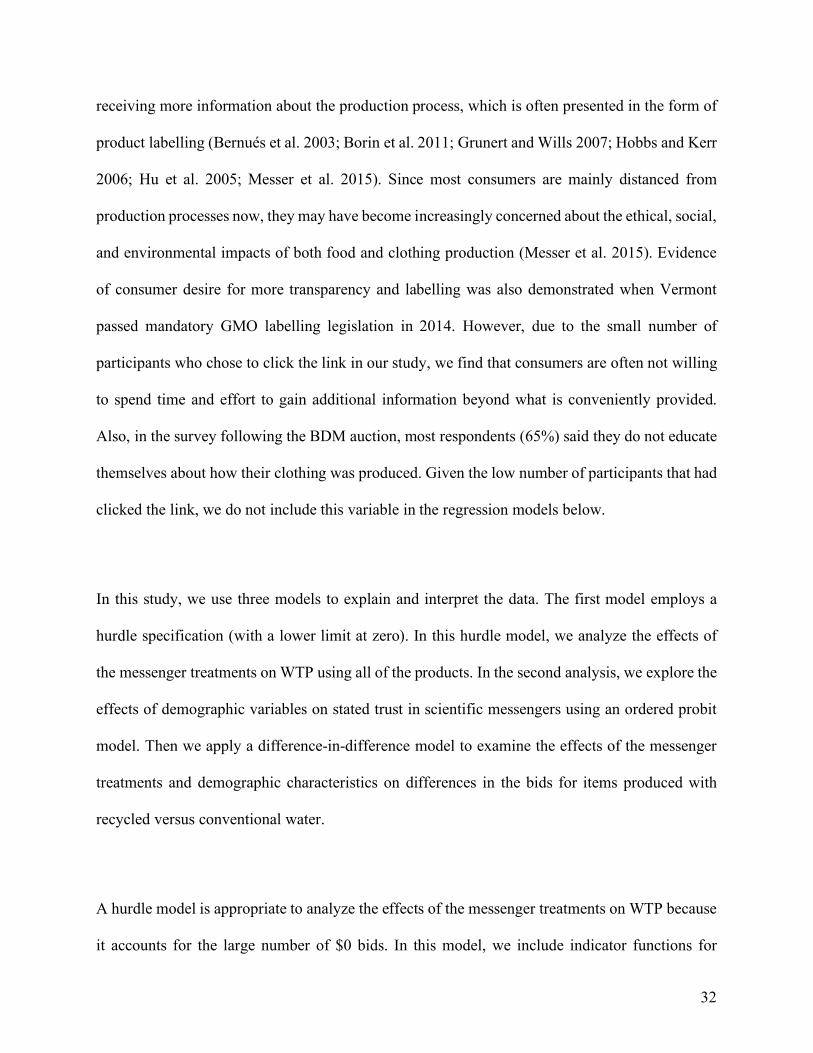
receiving more information about the production process, which is often presented in the form of
product labelling (Bernués et al. 2003; Borin et al. 2011; Grunert and Wills 2007; Hobbs and Kerr
2006; Hu et al. 2005; Messer et al. 2015). Since most consumers are mainly distanced from
production processes now, they may have become increasingly concerned about the ethical, social,
and environmental impacts of both food and clothing production (Messer et al. 2015). Evidence
of consumer desire for more transparency and labelling was also demonstrated when Vermont
passed mandatory GMO labelling legislation in 2014. However, due to the small number of
participants who chose to click the link in our study, we find that consumers are often not willing
to spend time and effort to gain additional information beyond what is conveniently provided.
Also, in the survey following the BDM auction, most respondents (65%) said they do not educate
themselves about how their clothing was produced. Given the low number of participants that had
clicked the link, we do not include this variable in the regression models below.
In this study, we use three models to explain and interpret the data. The first model employs a
hurdle specification (with a lower limit at zero). In this hurdle model, we analyze the effects of
the messenger treatments on WTP using all of the products. In the second analysis, we explore the
effects of demographic variables on stated trust in scientific messengers using an ordered probit
model. Then we apply a difference-in-difference model to examine the effects of the messenger
treatments and demographic characteristics on differences in the bids for items produced with
recycled versus conventional water.
A hurdle model is appropriate to analyze the effects of the messenger treatments on WTP because
it accounts for the large number of $0 bids. In this model, we include indicator functions for
33
between-subject messenger treatments in both the selection and outcome (Cragg 1971; Greene
2012). The selection portion of the model captures individual decisions about whether they are
interested in bidding on the product. The variable )* represents an unobservable comparison of
marginal costs and marginal benefits in terms of utility that the consumer theoretically makes and
) is the observable bid placed. The variableP represents the decision of the respondent to place a
bid (P12 = 1) or not (P12 = 0). If the marginal benefits of placing a bid are greater than the marginal
costs (Equation 7), then the respondent will place a bid. The outcome portion analyzes how the
independent variables affect the nonzero bids. The dependent variable in this outcome model is
the values of the bids submitted by all respondents for all of the products. The key independent
variables, RS, are the dummy variables for each between-subject treatment messenger
(newspapers, scientists, government agencies, and non-profit organizations), which were
compared to the no-information control group and γ is the vector of coefficients for these
unobservable attributes. In this model, U represents the standard normal cumulative density
function, Vis the standard deviation, and λ represents the inverse Mills ratio, which is a weighting
method for the error term, Vλ (Greene 2012). Since we do not require a weighted error for our
purposes (as participants were randomly assigned to treatments), we assume Vλ12 = ϵ12~;(0, VZ).
The models are indexed by individual i and product j (see Greene 2012).
Equations 7 and 8 are the participation equations that estimate the selection portion of the hurdle
model – whether a respondent chose to participate in the auction by placing a positive bid (a binary
choice model). Equation 9 is the intensity equation and estimates the outcome portion of the hurdle
./&[\)12∗ > 0^ = U_R12
S `a, P12 = 178)12∗ > 0 (7)
./&[\)12∗ ≤ 0^ = 1 − U_R12
S `a, P12 = 078)12∗ ≤ 0 (8)
=\)12cP12 = 1^ = R12S d + Ve12 (9)

34
model – how much participants were willing to bid after crossing the zero-bid hurdle (truncated,
continuous model).
The results of the hurdle model indicate that the nature of the messenger has a significant effect
on participants’ behaviour for all products, as shown in Table 46. However, the coefficients for the
scientists treatment show stark differences between choosing whether to bid and the amount of the
bid. The scientists messenger coefficient in the selection model is negative and significant;
participants who receive that treatment are significantly less likely to place a bid on a product. In
the outcome model, the reverse is true. On average, participants who cross the zero-hurdle submit
a bid that is significantly higher than the participants in the no-information control treatment.
Participants under the other three messenger treatments are more likely to place a positive bid and
bid higher amounts than participants under the control treatment. While all treatments result in
greater WTP compared to the control in the outcome model, the newspaper treatment coefficient
has the largest magnitude.
6 This hurdle model was also run with only products produced with recycled water and produced similar results in terms of significance and direction of coefficient effects; however, there was reduced overall significance of the model due to a reduction in the number of observations.
35
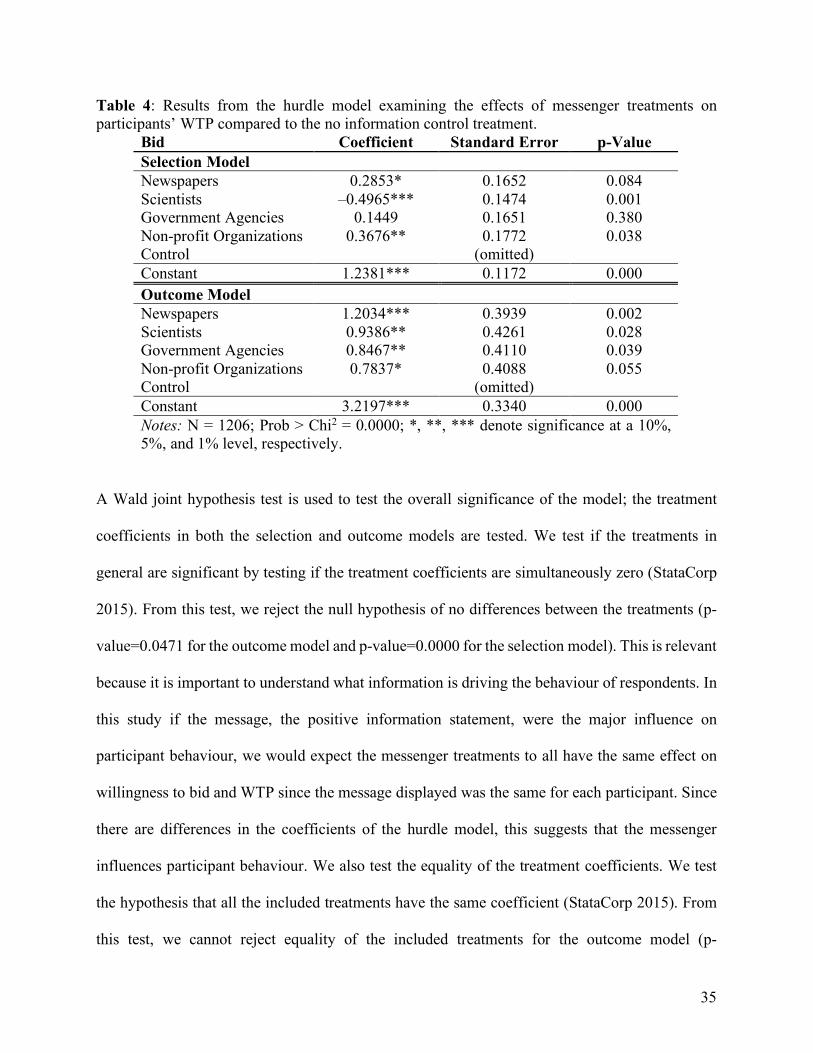
Table 4: Results from the hurdle model examining the effects of messenger treatments on participants’ WTP compared to the no information control treatment.
A Wald joint hypothesis test is used to test the overall significance of the model; the treatment
coefficients in both the selection and outcome models are tested. We test if the treatments in
general are significant by testing if the treatment coefficients are simultaneously zero (StataCorp
2015). From this test, we reject the null hypothesis of no differences between the treatments (p-
value=0.0471 for the outcome model and p-value=0.0000 for the selection model). This is relevant
because it is important to understand what information is driving the behaviour of respondents. In
this study if the message, the positive information statement, were the major influence on
participant behaviour, we would expect the messenger treatments to all have the same effect on
willingness to bid and WTP since the message displayed was the same for each participant. Since
there are differences in the coefficients of the hurdle model, this suggests that the messenger
influences participant behaviour. We also test the equality of the treatment coefficients. We test
the hypothesis that all the included treatments have the same coefficient (StataCorp 2015). From
this test, we cannot reject equality of the included treatments for the outcome model (p-
Bid Coefficient Standard Error p-Value Selection Model Newspapers 0.2853* 0.1652 0.084 Scientists –0.4965*** 0.1474 0.001 Government Agencies 0.1449 0.1651 0.380 Non-profit Organizations 0.3676** 0.1772 0.038 Control (omitted) Constant 1.2381*** 0.1172 0.000 Outcome Model Newspapers 1.2034*** 0.3939 0.002 Scientists 0.9386** 0.4261 0.028 Government Agencies 0.8467** 0.4110 0.039 Non-profit Organizations 0.7837* 0.4088 0.055 Control (omitted) Constant 3.2197*** 0.3340 0.000 Notes: N = 1206; Prob > Chi2 = 0.0000; *, **, *** denote significance at a 10%, 5%, and 1% level, respectively.
36
value=0.6441); however, we can reject equality of treatment coefficients in the selection model
(p-value=0.0000) and conclude that the coefficients are not all the same7.
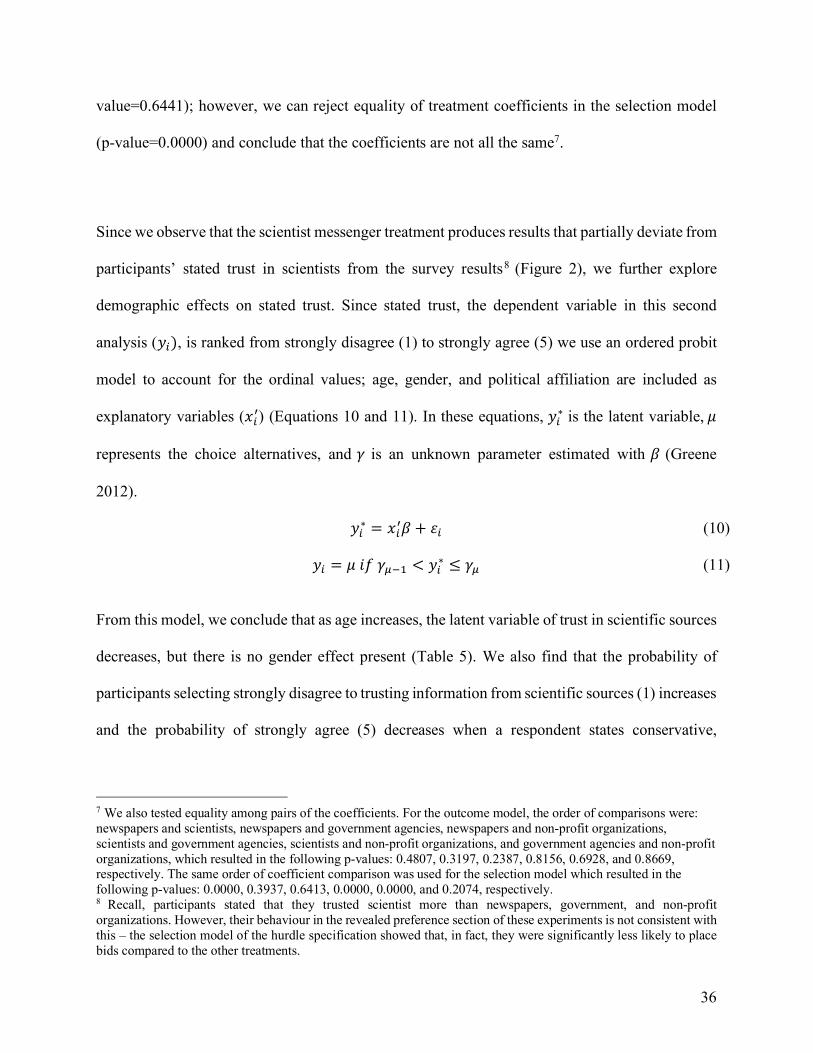
Since we observe that the scientist messenger treatment produces results that partially deviate from
participants’ stated trust in scientists from the survey results8 (Figure 2), we further explore
demographic effects on stated trust. Since stated trust, the dependent variable in this second
analysis ()1), is ranked from strongly disagree (1) to strongly agree (5) we use an ordered probit
model to account for the ordinal values; age, gender, and political affiliation are included as
explanatory variables (R1S) (Equations 10 and 11). In these equations, )1∗ is the latent variable, f
represents the choice alternatives, and ` is an unknown parameter estimated with d(Greene
2012).
)1∗ = R1
Sd + g1 (10)
)1 = f78 h̀ij < )1∗ ≤ h̀
(11)
From this model, we conclude that as age increases, the latent variable of trust in scientific sources
decreases, but there is no gender effect present (Table 5). We also find that the probability of
participants selecting strongly disagree to trusting information from scientific sources (1) increases
and the probability of strongly agree (5) decreases when a respondent states conservative,
7 We also tested equality among pairs of the coefficients. For the outcome model, the order of comparisons were: newspapers and scientists, newspapers and government agencies, newspapers and non-profit organizations, scientists and government agencies, scientists and non-profit organizations, and government agencies and non-profit organizations, which resulted in the following p-values: 0.4807, 0.3197, 0.2387, 0.8156, 0.6928, and 0.8669, respectively. The same order of coefficient comparison was used for the selection model which resulted in the following p-values: 0.0000, 0.3937, 0.6413, 0.0000, 0.0000, and 0.2074, respectively. 8 Recall, participants stated that they trusted scientist more than newspapers, government, and non-profit organizations. However, their behaviour in the revealed preference section of these experiments is not consistent with this – the selection model of the hurdle specification showed that, in fact, they were significantly less likely to place bids compared to the other treatments.

37
moderate, or other political affiliation compared to liberal affiliation. Therefore, it appears that the
stated preferences – not to trust scientific information – may be driven by political affiliation and
age.
Table 5: Results from the ordered probit model examining the effects of demographic variables on participants’ stated trust in information received from scientific sources ranked from strongly disagree (1) to strongly agree (5).
Trust in Science Coefficient Standard Error p-Value Ordered Probit Age -0.0084*** 0.0018 0.000 Female 0.0366 0.0673 0.586 Political Affiliation
Conservative -0.5860*** 0.0940 0.000 Moderate -0.3911*** 0.0814 0.000 Other -1.2234*** 0.1249 0.000 Liberal (omitted)
Cut 1 -2.7129 0.1381 - Cut 2 -2.2400 0.1272 - Cut 3 -1.3695 0.1184 - Cut 4 -0.5608 0.1146 - Notes: N=1164; Prob > Chi2 = 0.0000; *, **, *** denote significance at a 10%, 5%, and 1% level, respectively.
The third model we explore is a difference-in-difference model. This model analyzes the
difference between bids for recycled and conventional irrigation methods and how such difference
varies between control and treatment groups. In this model, the dependent variable, k1l, is the
difference between bids for a product labeled as produced with recycled water (97%m)versus the
same product labeled as produced with conventional water (97%n) (Equation 12). The independent
variables in this case were the treatment dummies as well as the age, gender, and political
affiliation of the respondent (Equation 13)9. This model also includes a dummy variable to indicate
9 We attempted to include interactions of treatment variables and demographic characteristics in the difference-in-difference model; however, we chose not to include interactions in our final model in order to present the most meaningful results.
38
whether the item was a t-shirt or strawberry, which is denoted as k in Equations 12 and 13 and i is
the individual.
k1l = (97%m − 97%n)1l (12)
k1l = o1 + dj ∗ ;+k6C#C+/%0'')1l + dZ ∗ *,7+$,+1l + dp ∗ q&r+/$'+$-1l + ds
∗ ;&$C/&87-1l + dt ∗ q+$%+/1l + du ∗ vw+1l + dx ∗ y6ℎ7/-1l + d
∗ .&(7-7,61l + g1l
where g1l~;(0, VZ).
(13)
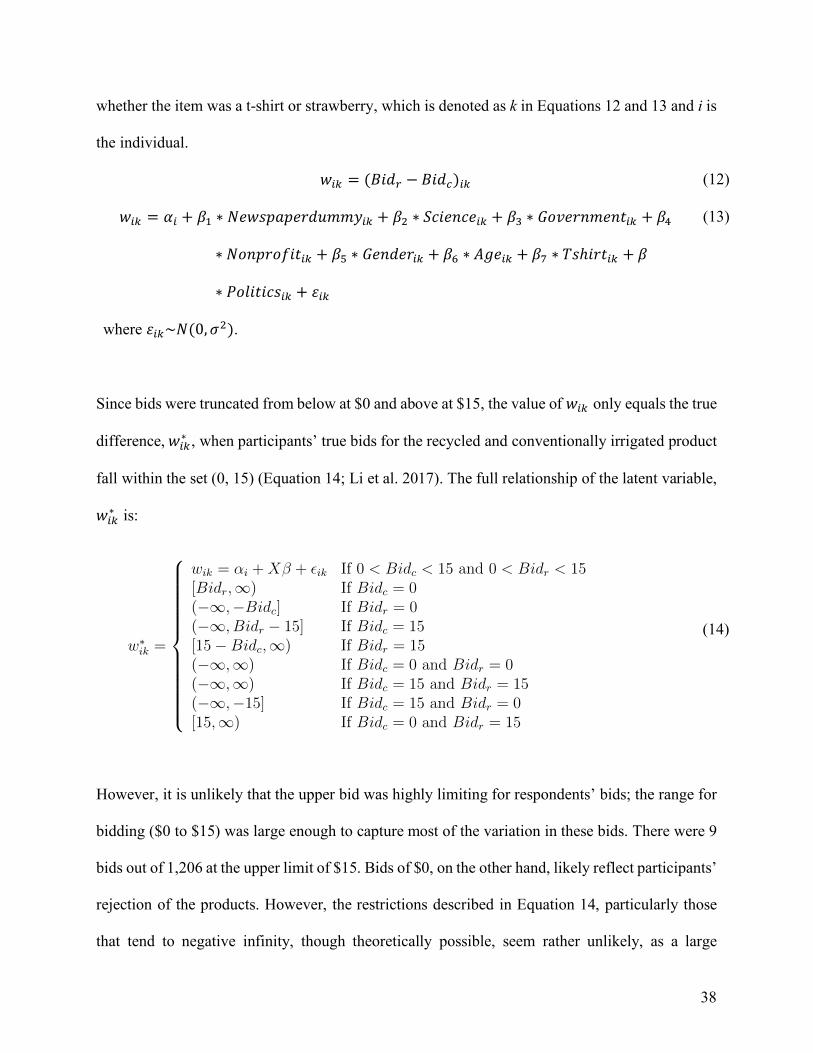
Since bids were truncated from below at $0 and above at $15, the value of k1l only equals the true
difference,k1l∗ , when participants’ true bids for the recycled and conventionally irrigated product
fall within the set (0, 15) (Equation 14; Li et al. 2017). The full relationship of the latent variable,
k1l∗ is:
(14)
However, it is unlikely that the upper bid was highly limiting for respondents’ bids; the range for
bidding ($0 to $15) was large enough to capture most of the variation in these bids. There were 9
bids out of 1,206 at the upper limit of $15. Bids of $0, on the other hand, likely reflect participants’
rejection of the products. However, the restrictions described in Equation 14, particularly those
that tend to negative infinity, though theoretically possible, seem rather unlikely, as a large
w⇤ik =
8>>>>>>>>>>>><
>>>>>>>>>>>>:
wik = ↵i +X� + ✏ik If 0 < Bidc < 15 and 0 < Bidr < 15[Bidr,1) If Bidc = 0(�1,�Bidc] If Bidr = 0(�1, Bidr � 15] If Bidc = 15[15� Bidc,1) If Bidr = 15(�1,1) If Bidc = 0 and Bidr = 0(�1,1) If Bidc = 15 and Bidr = 15(�1,�15] If Bidc = 15 and Bidr = 0[15,1) If Bidc = 0 and Bidr = 15
1
39
negative WTP would indicate that participants would reject small amounts of money to accept
goods they could immediately discard or give to others. Therefore, we acknowledge the
mathematical possibility that differences in bids, k1l,do not necessarily equal the true value of
the difference, k1l∗ – but these discrepancies should be negligible.
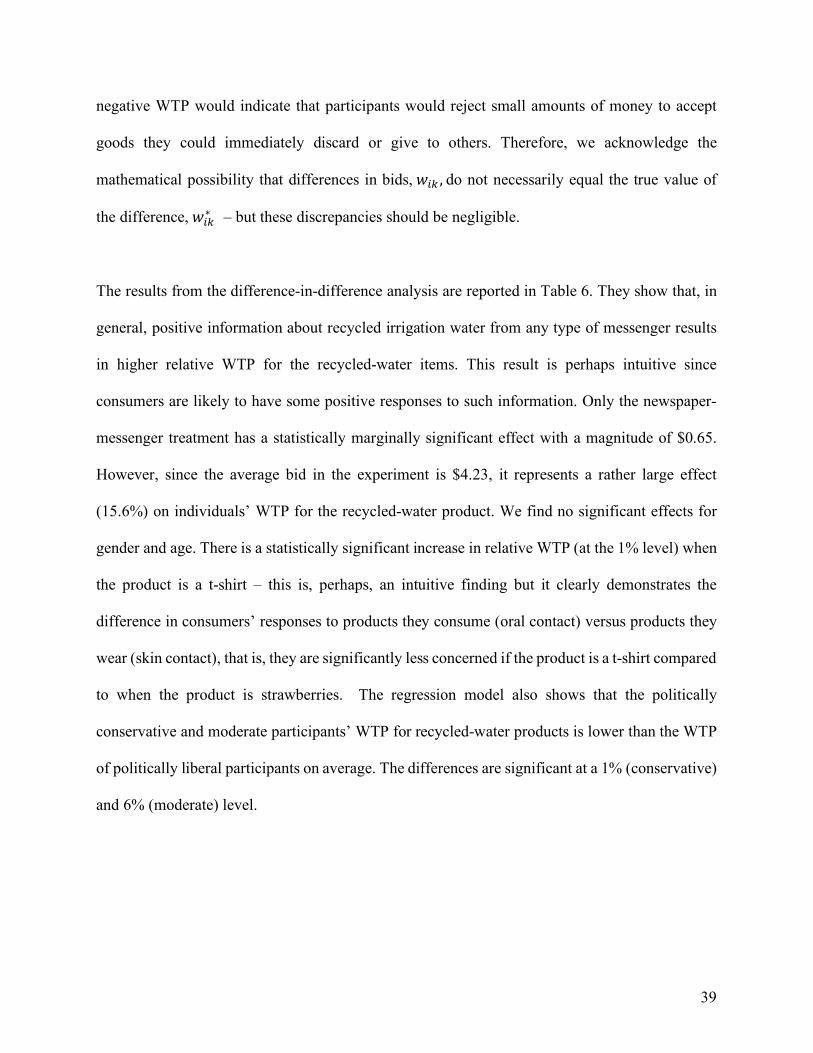
The results from the difference-in-difference analysis are reported in Table 6. They show that, in
general, positive information about recycled irrigation water from any type of messenger results
in higher relative WTP for the recycled-water items. This result is perhaps intuitive since
consumers are likely to have some positive responses to such information. Only the newspaper-
messenger treatment has a statistically marginally significant effect with a magnitude of $0.65.
However, since the average bid in the experiment is $4.23, it represents a rather large effect
(15.6%) on individuals’ WTP for the recycled-water product. We find no significant effects for
gender and age. There is a statistically significant increase in relative WTP (at the 1% level) when
the product is a t-shirt – this is, perhaps, an intuitive finding but it clearly demonstrates the
difference in consumers’ responses to products they consume (oral contact) versus products they
wear (skin contact), that is, they are significantly less concerned if the product is a t-shirt compared
to when the product is strawberries. The regression model also shows that the politically
conservative and moderate participants’ WTP for recycled-water products is lower than the WTP
of politically liberal participants on average. The differences are significant at a 1% (conservative)
and 6% (moderate) level.
40
Table 6: Results from difference-in-difference model examining the effects of participants’ relative WTP for products produced with recycled water compared to conventional water.
Bid Coefficient Standard Error p-Value Difference-in-Difference Model Newspapers 0.6453* 0.3834 0.092 Scientists 0.3528 0.3975 0.375 Government Agencies 0.3262 0.3969 0.411 Non-profit Organizations 0.1806 0.3993 0.651 Gender 0.1131 0.2453 0.645 Age 0.0047 0.0065 0.467 Shirt Products 0.4329*** 0.1686 0.010 Political Affiliation
Conservative -1.2544*** 0.3422 0.000 Moderate -0.5358* 0.2882 0.063 Other -0.7459 0.4610 0.106 Liberal (omitted)
Constant -0.4245 0.5145 0.409 Notes: N = 388; Wald Chi2 = 25.30; Prob > Chi2 = 0.0048; *, **, *** denote significance at a 10%, 5%, and 1% level, respectively.
Chapter 5 Conclusion
The agricultural industry is the single largest consumer of freshwater in the United States and in
many other countries around the world. Therefore, agriculture plays a vital role in promoting
sustainable water usage. Water recycling may be a sustainable and cost-effective way to irrigate
crops safely and could become a necessity in the future; but, producers have been reluctant to
adopt the technology because of the risk of rejection of the products by consumers due to stigma
associated with what was once wastewater. Prior studies have shown that many consumers have
developed strong negative perceptions about new food production technologies such as irradiation
and genetic modification. A similar process could affect their WTP for products irrigated with
recycled water and thus could hinder farmers’ adoption of the technology.
41
Evidence in the related literature shows that positive information about a potentially stigmatizing
technology can increase public acceptance of it (see, for example, Messer et al. 2008; Liaukonyte
et al. 2013). Furthermore, some recent research has explored individuals’ level of trust in
information provided by different messengers using a survey approach. Several of the studies (i.e.
Hunt and Frewer 2001; Arbuckle et al. 2015) found that participants trusted scientific sources the
most, but others (Bubela et al. 2009; Leiserowitz et al. 2012) found that participants’ trust in
science messengers was declining.
This study is the first to use non-hypothetical experiments to examine consumers’ preferences for
an environmentally friendly practice and the effect of different types of messengers providing
positive information about the practice. We analyze those preferences in the context of items
produced using recycled wastewater for irrigation. We conclude from our results that messengers
can significantly impact consumer behaviour, since we saw all treatments increase WTP in the
outcome model of the hurdle analysis. We also find that a messenger carrying information from
scientists can lead to conflicting outcomes. Our results show that participants under the scientists-
messenger treatment were generally less likely to place a positive bid when compared to the
control. However, people in the scientists treatment also placed relatively higher bids if they chose
to bid positive amounts in the BDM auction. The newspaper treatment had the greatest impact in
terms of increasing WTP of all the treatments. A recent poll also found a similar increase of
Americans’ confidence in newspaper sources (Newport 2017). The poll asked Americans how
much confidence they had across 14 institutions and the percentage of people who responded a
‘great deal’ and ‘quite a lot’ of confidence in newspapers increased from 20% in 2016 to 27% in
2017.
42
The results of the difference-in-difference model confirm findings from previous studies (for
example, Po et al. 2005) that showed that the degree of contact with recycled water is an important
factor in the acceptance of the process. Our results indicate that participants were more accepting
of recycled water used to produce t-shirts and less accepting of recycled water used for food
production – perhaps suggesting that stigma related to oral ingestion reigns higher than the one
associated with skin contact. We also conclude that political affiliation affects WTP since there
was a negative effect of conservative and moderate political affiliation compared to liberal
affiliation on the difference in bids between recycled and conventional irrigation water products.
Looking forward, including a question about participants’ initial beliefs on the use of recycled
water may augment future research. Documenting initial beliefs may help to better reform our
understanding of what drives consumers’ decisions and behaviours by establishing a frame of
reference. In the future, it may also be interesting to study how negative information is perceived
when compared to positive information, and how it influences consumers’ decision-making. This
could further explain the relationship of trust in information communication and purchasing
decisions. However, this would require a large sample size to properly analyze, as additional
treatments would further split the data.
There is a push within the United States government, and governments around the world, for more
evidence-based policy. The goal of evidence-based policy is to maximize the likelihood of
successful policy implementation by using research to predict policy outcomes driven by real life
decision-making (Government of Canada 2017; Howlett 2009). The results of this study can be

43
used to inform public policy. This research provides evidence on how to improve the effectiveness
of government communication; it shows that the interpretation of information is affected by the
sources cited. In order to improve the acceptance of sustainable and cost-effective policies and
technologies and ultimately lead to successful implementation of these programs, governments
should consider the importance of not just the message being delivered, but also the associated
messengers. Lastly, these results add to a growing body of evidence that there may be an overall
decline in trust in the United States in scientists. We find that the decline may be explained by
distinctly different behaviours. Some people have perhaps chosen to “turn their heads” from
scientists and thus refuse to “place bids” altogether while those who have chosen to place bids
view scientific information as important and their behaviour is influenced by it – these are
important considerations for future studies and policies.
44
References Aeschbach-Hertig W, Gleeson T (2012) Regional strategies for the accelerating global problem
of groundwater depletion. Nat Geosci 5(12):853–861
Alberta Environment (2006) Approved water management plan for the South
Saskatchewan River Basin (Alberta). http://aep.alberta.ca/water/programs-and-
services/river-management-frameworks/south-saskatchewan-river-basin-approved-water-
management-plan/documents/SSRB-ApprovedWaterManagementPlan-2006.pdf. Cited 10
Oct 2017
Aschemann-Witzel J, Jensen JH, Jensen MH, Kulikovskaja V (2017) Consumer behaviour
towards price-reduced suboptimal foods in the supermarket and the relation to food waste in
households. Appetite 116:246-258
Arbuckle JG Jr, Morton LW, Hobbs J (2015) Understanding farmer perspectives on climate
change adaptation and mitigation: the roles of trust in sources of climate information,
climate change beliefs, and perceived risk. Environ Behav 47(2):205–234. DOI
10.1177/0013916513503832
Bakopoulou S, Katsavou I, Polyzos S, Kungolos A (2008) Using recycled water for agricultural
purposes in the Thessaly region, Greece: a primary investigation of citizens’ opinions. WIT
Trans Ecol Environ 109:869–878. DOI 10.2495/WM080881
Bastian R, Murray D (2012) Guidelines for water reuse. US EPA Office of Research and
Development, Washington DC EPA/600/R-12/618.
https://nepis.epa.gov/Adobe/PDF/P100FS7K.pdf. Cited 14 Sept 2017
45
Bazoche P, Deola C, Soler LG (2008) An experimental study of wine consumers’ willingness to
pay for environmental characteristics. 12th Congress of the European Association of
Agricultural Economists: 1–8
Becker G, DeGroot M, Marschak J (1964) Measuring utility by a single-response sequential
method. Syst Res Behav Sci 9:226–236
Becker N, Ward F (2015) Adaptive water management in Israel: structure and policy options. Int
J Water Resour Devel 31(4):540-557
Bernués A, Olaizola A, Corcoran K (2003) Labelling information demanded by European
consumers and relationships with purchasing motives, quality and safety of meat. Meat
Science 65(3):1095-1106
Borin N, Cerf DC, Krishnan R (2011) Consumer effects of environmental impact in product
labeling. J Consumer Mark 28(1):76-86
Bougherara D, Combris P (2009) Eco-labelled food products: what are consumers paying for?
European Rev Agric Econ 36(3):321-341
Boyce RR, Brown TC, McClelland GH, Peterson GL, Schulze WD (1992) An experimental
examination of intrinsic values as a source of the WTA-WTP disparity. Am Econ Rev
82(5):1366–1373
Bubela T, Nisbet MC, Borchelt R, Brunger F, Critchley C, Einsiedel E, Geller G, Gupta A,
Hampel J, Hyde-Lay R, Jandciu E, Jones S, Kolopack P, Lane S, Lougheed T, Nerlich B,
Ogbogu U, O’Riordan K, Ouellette C, Spear M, Strauss S, Thavaratnam T, Willemse L,
Caulfield T (2009) Science communication reconsidered. Nat Biotechnol 27(6):514–518.
DOI 10.1038/nbt0609-514
California Department of Water Resources (No date) Recycled water use in the landscape.

46
http://www.water.ca.gov/pubs/conservation/recycled_water_use_in_the_landscape/recyland
scape.pdf. Cited 10 Oct 2017
Center for Health and Hope (2016) Urgent need: recycled water.
https://www.centerforhealthandhope.org/clean-water-sanitation. Cited 31 Oct 2017
Cohen MJ, Henges-Jeck C (2001) Missing water: the uses and flows of water in the Colorado
River Delta region. Pacific Institute for Studies in Development, Environment, and
Security. Oakland, CA
Colson G, Corrigan JR, Rousu MC (2010) The impact of perceived prices on willingness to pay
in experimental auctions. J Agric Food Ind Organ 8(1). DOI 10.2202/1542-0485.1307
Corrigan JR, Rousu MC (2008) Testing whether field auction experiments are demand revealing
in practice. J Agr Resource Econ 33(2):290-301
Cragg JG (1971) Some statistical models for limited dependent variables with application to the
demand for durable goods. Econometrica 39(5):829–844
Cusimano J, McLain JE, Eden S, Rock C (2015) Agricultural use of recycled water for crop
production in Arizona. The University of Arizona Cooperative Extension.
https://extension.arizona.edu/sites/extension.arizona.edu/files/pubs/az1670-2015.pdf. Cited
14 Sept 2017
Dolnicar S, Hurlimann A (2010) Water alternatives – who and what influences public
acceptance? J Public Aff 11(1):49–59
Dolnicar S, Schaefer A (2009) Desalinated versus recycled water: public perceptions and
profiles of the accepters. J Environ Manage 90(2):888–900
Dreizin Y (2006) Ashkelon seawater desalination project—off-taker’s self costs, supplied
water costs, total costs and benefits. Desalination 190(1-3):104-116

47
Ferraro PJ, Uchida T, Conrad JM (2005) Price premiums for eco-friendly commodities: are
‘green’ markets the best way to protect endangered ecosystems? Environ Resour Econ
32(3):419–438. DOI 10.1007/s10640-005-7962-6
Fielding KS, Gardner J, Leviston Z, Price J (2015) Comparing public perceptions of alternative
water sources for potable use: the case of rainwater, stormwater, desalinated water, and
recycled water. Water Resour Manage 29(12):4501–4518
Gleick PH (2003) Global freshwater resources: soft-path solutions for the 21st
century. Science 302(5650):1524-1528
Gleick PH (2010) Roadmap for sustainable water resources in southwestern North
America. Proc Natl Acad Sci USA 107(50):21300–21305
Government of Alberta (2014) Water act administrative guideline for transfer of water
allocations (and agreements to assign water, and licence amendments) volume 2.0.
http://aep.alberta.ca/water/legislation-guidelines/documents/Guideline
TransferWaterAllocation-Nov2014.pdf. Cited 19 Oct 2017
Government of Canada (2017) The case for evidence-based policy.
http://www.horizons.gc.ca/en/content/case-evidence-based-policy. Cited 1 Dec 2017
Greene WH (2012) Econometric analysis. Pearson, Boston
Grunert KG, Wills JM (2007) A review of European research on consumer response to nutrition
information on food labels. J Public Health 15(5):385-399
Harrison GW, Harstad RM, Rutström EE (2004) Experimental methods and elicitation of
values. Exp Econ 7(2):123-140
Haynes K, Barclay J, Pidgeon N (2007) The issue of trust and its influence on risk
communication during a volcanic crisis. Bull Volcanol 70(5):605–621

48
Higgins K (2016) Post-truth: a guide for the perplexed. Nature 540(7631):9. DOI
10.1038/540009a
Hobbs JE, Kerr WA (2006) Consumer information, labelling and international trade in
agri-food products. Food Policy 31(1):78-89
Hoffman V, Fooks J, Messer KD (2014) Measuring and mitigating HIV stigma: a framed field
experiment. Econ Devel Cult Change 62(4):701-726
Horowitz JK (2006) The Becker-DeGroot-Marschak mechanism is not necessarily incentive
compatible, even for non-random goods. Econ Lett 93(1):6–11
Howlett M (2009) Policy analytical capacity and evidence-based policy-making: lessons from
Canada. Can Public Adm 52(2):153-175
Hu W, Veeman MM, Adamowicz WL (2005) Labelling genetically modified food:
heterogeneous consumer preferences and the value of information. Can J Agric Econ
53(1):83-102
Huffman WE, Rousu M, Shogren JF, Tegene A (2004) Who do consumers trust for information:
the case of genetically modified foods? Am J Agric Econ 86(5):1222–1229. DOI
10.1111/j.0002-9092.2004.00669.x
Hunt S, Frewer LJ (2001) Trust in sources of information about genetically modified food risks
in the UK. Brit Food J 103(1):46–62
Hurlimann A, Dolnicar S (2010) When public opposition defeats alternative water projects–the
case of Toowoomba Australia. Water Res 44(1):287-297
Irwin JR, McClelland GH, McKee M, Schulze WD, Norden NE (1998) Payoff dominance vs.
cognitive transparency in decision making. Econ Inq 36(2):272–285
49
Israeli Water Authority (2015) The wastewater and treated effluent infrastructure development
in Israel. www.water.gov.il/Hebrew/ProfessionalInfoAndData/2012/03-
The%20Wastewater%20and%20Treated%20Effluents%20Infrastructure%20Development
%20in%20Israel.pdf. Cited 15 Sep 2017
Kecinski M, Keisner DK, Messer KD, Schulze WD (2016a) Measuring stigma: the behavioral
implications of disgust. Environ Resour Econ:1–16
Kecinski M, Keisner DK, Messer KD, Schulze WD (2016b) Stigma mitigation and the
importance of redundant treatments. J Econ Psychol 54:44–52
Keisner DK, Messer KD, Schulze WD, Zarghamee H (2013) Testing social preferences for an
economic ‘bad’: an artefactual field experiment. Scand J Econ 115(1):27–61
Leiserowitz AA, Maibach EW, Roser-Renouf C, Smith N, Dawson E (2012) Climategate, public
opinion, and the loss of trust. Am Behav Sci 57(6):818–837
Li T, Bernard JC, Johnston ZA, Messer KD, Kaiser HM (2017) Consumer preferences before
and after a food safety scare: an experimental analysis of the 2010 egg recall. Food
Policy 66:25-34
Liaukonyte J, Streletskaya NA, Kaiser HM, Rickard BJ (2013) Consumer response to “contains”
and “free of” labeling: evidence from lab experiments. Appl Econ Perspect Policy
35(3):476-507
Lusk JL, Fox JA, Schroeder TC, Mintert J, Koohmaraine M (2001) In-store valuation of steak
tenderness. Am J Agric Econ 83(3):539–550
Lusk JL, Shogren JF (2007) Experimental auctions: methods and applications in economic and
marketing research. Cambridge University Press
50
Makri A (2017) Give the public the tools to trust scientists. Nature 541(7637):261. DOI
10.1038/541261a
Menegaki AN, Hanley N, Tsagarakis KP (2007) The social acceptability and valuation of
recycled water in Crete: a study of consumers’ and farmers’ attitudes. Ecol Econ 62(1):7–18
Messer KD, Bligh S, Costanigro M, Kaiser H, Crespi J, McCluskey J, Norwood B, Redick T,
Armfelt M (2015) Process labeling of food: consumer behavior, the agricultural sector, and
policy recommendations. Issue Paper-Council for Agricultural Science and Technology 56
Messer KD, Costanigro M, Kaiser H (2017) Labeling food processes: the good, the bad and the
ugly. Appl Econ Perspect Policy 39(3):407-427
Messer KD, Kaiser HM, Schulze WD (2008) The problem of free riding in voluntary generic
advertising: parallelism and possible solutions from the lab. Am J Agric Econ 90(2):540–
552
Messer KD, Poe GL, Rondeau D, Schulze WD, Vossler CA (2010) Social preferences and
voting: an exploration using a novel preference revealing mechanism. J Public Econ
94(3):308–317
Miller GW (2006) Integrated concepts in water reuse: managing global water
needs. Desalination 187(1-3):65-75
Newport F (2017) Americans’ confidence in institutions edges up. Gallup News.
http://news.gallup.com/poll/212840/americans-confidence-institutions-
edges.aspx?g_source=Politics&g_medium=newsfeed&g_campaign=tiles. Cited 23 Nov
2017
Nixon SW (2003) Replacing the Nile: are anthropogenic nutrients providing the fertility
once brought to the Mediterranean by a great river? Ambio 32(1):30-39
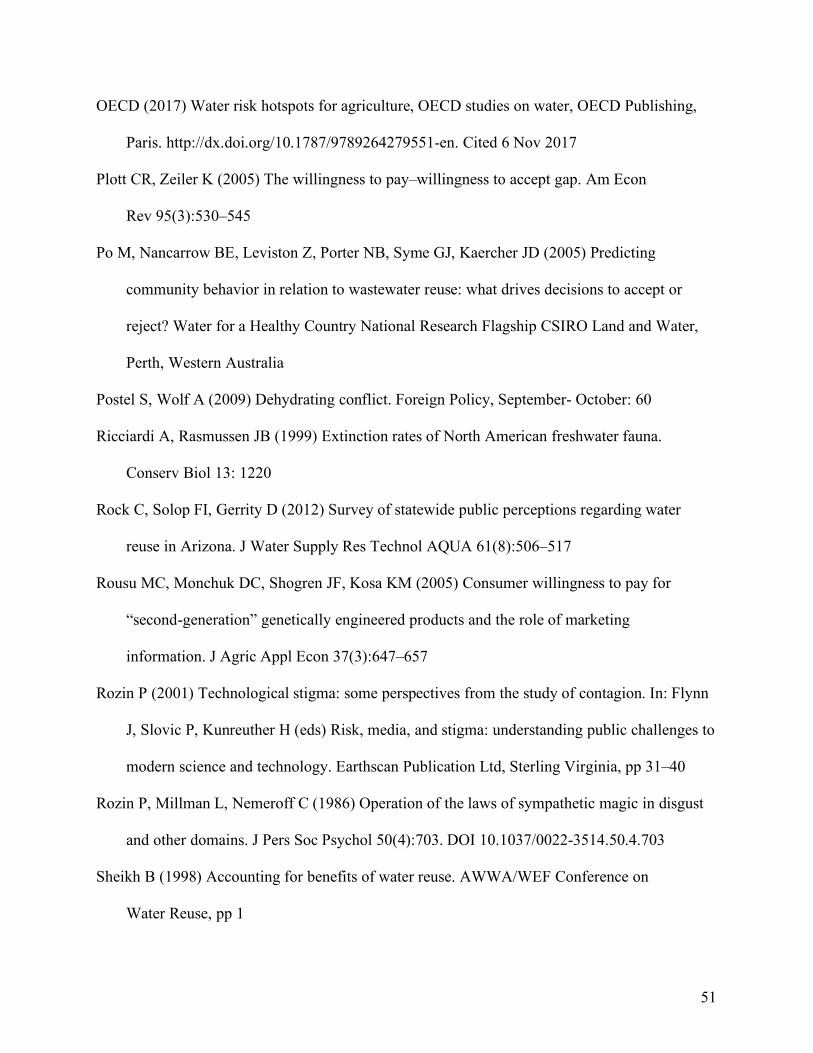
51
OECD (2017) Water risk hotspots for agriculture, OECD studies on water, OECD Publishing,
Paris. http://dx.doi.org/10.1787/9789264279551-en. Cited 6 Nov 2017
Plott CR, Zeiler K (2005) The willingness to pay–willingness to accept gap. Am Econ
Rev 95(3):530–545
Po M, Nancarrow BE, Leviston Z, Porter NB, Syme GJ, Kaercher JD (2005) Predicting
community behavior in relation to wastewater reuse: what drives decisions to accept or
reject? Water for a Healthy Country National Research Flagship CSIRO Land and Water,
Perth, Western Australia
Postel S, Wolf A (2009) Dehydrating conflict. Foreign Policy, September- October: 60
Ricciardi A, Rasmussen JB (1999) Extinction rates of North American freshwater fauna.
Conserv Biol 13: 1220
Rock C, Solop FI, Gerrity D (2012) Survey of statewide public perceptions regarding water
reuse in Arizona. J Water Supply Res Technol AQUA 61(8):506–517
Rousu MC, Monchuk DC, Shogren JF, Kosa KM (2005) Consumer willingness to pay for
“second-generation” genetically engineered products and the role of marketing
information. J Agric Appl Econ 37(3):647–657
Rozin P (2001) Technological stigma: some perspectives from the study of contagion. In: Flynn
J, Slovic P, Kunreuther H (eds) Risk, media, and stigma: understanding public challenges to
modern science and technology. Earthscan Publication Ltd, Sterling Virginia, pp 31–40
Rozin P, Millman L, Nemeroff C (1986) Operation of the laws of sympathetic magic in disgust
and other domains. J Pers Soc Psychol 50(4):703. DOI 10.1037/0022-3514.50.4.703
Sheikh B (1998) Accounting for benefits of water reuse. AWWA/WEF Conference on
Water Reuse, pp 1
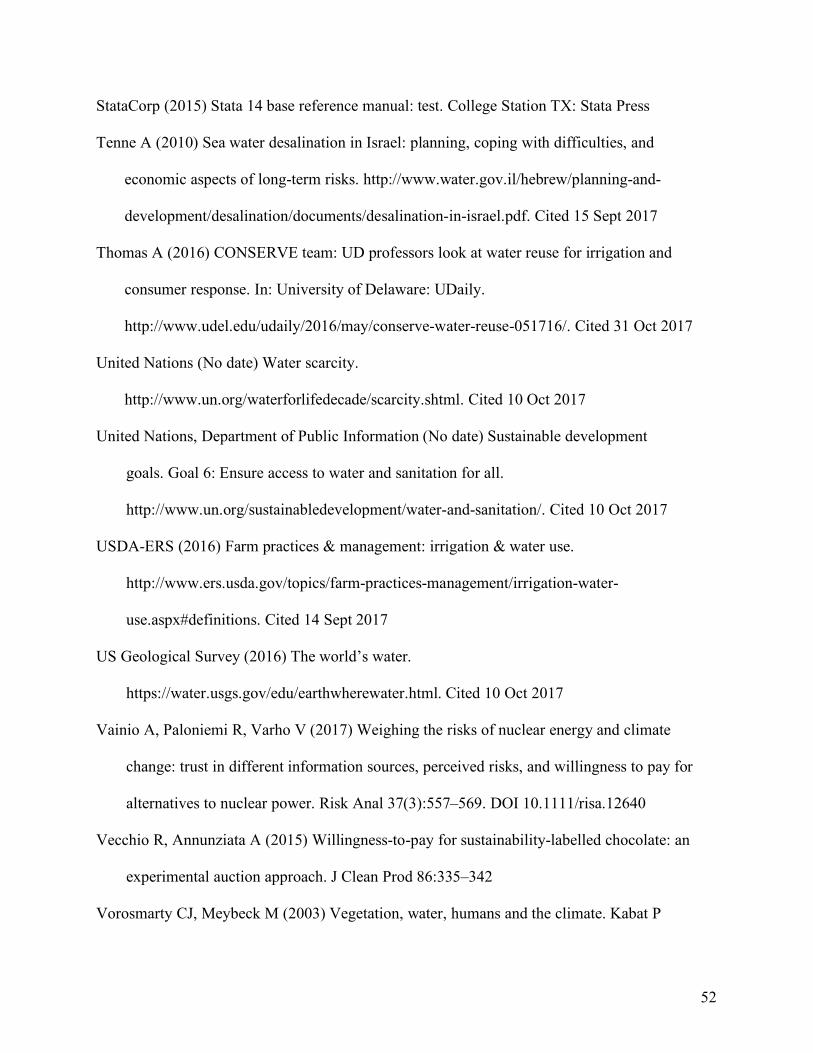
52
StataCorp (2015) Stata 14 base reference manual: test. College Station TX: Stata Press
Tenne A (2010) Sea water desalination in Israel: planning, coping with difficulties, and
economic aspects of long-term risks. http://www.water.gov.il/hebrew/planning-and-
development/desalination/documents/desalination-in-israel.pdf. Cited 15 Sept 2017
Thomas A (2016) CONSERVE team: UD professors look at water reuse for irrigation and
consumer response. In: University of Delaware: UDaily.
http://www.udel.edu/udaily/2016/may/conserve-water-reuse-051716/. Cited 31 Oct 2017
United Nations (No date) Water scarcity.
http://www.un.org/waterforlifedecade/scarcity.shtml. Cited 10 Oct 2017
United Nations, Department of Public Information (No date) Sustainable development
goals. Goal 6: Ensure access to water and sanitation for all.
http://www.un.org/sustainabledevelopment/water-and-sanitation/. Cited 10 Oct 2017
USDA-ERS (2016) Farm practices & management: irrigation & water use.
http://www.ers.usda.gov/topics/farm-practices-management/irrigation-water-
use.aspx#definitions. Cited 14 Sept 2017
US Geological Survey (2016) The world’s water.
https://water.usgs.gov/edu/earthwherewater.html. Cited 10 Oct 2017
Vainio A, Paloniemi R, Varho V (2017) Weighing the risks of nuclear energy and climate
change: trust in different information sources, perceived risks, and willingness to pay for
alternatives to nuclear power. Risk Anal 37(3):557–569. DOI 10.1111/risa.12640
Vecchio R, Annunziata A (2015) Willingness-to-pay for sustainability-labelled chocolate: an
experimental auction approach. J Clean Prod 86:335–342
Vorosmarty CJ, Meybeck M (2003) Vegetation, water, humans and the climate. Kabat P

53
et al. Eds. Springer- Verlag, Heidelberg, Germany. pp. 408-572
Xu H, Savchenko O, Kecinski M, Messer KD, Li T (2018) Fresh foods irrigated with recycled
water: a framed field experiment on consumer response. University of Delaware APEC
Working Paper 2018-1
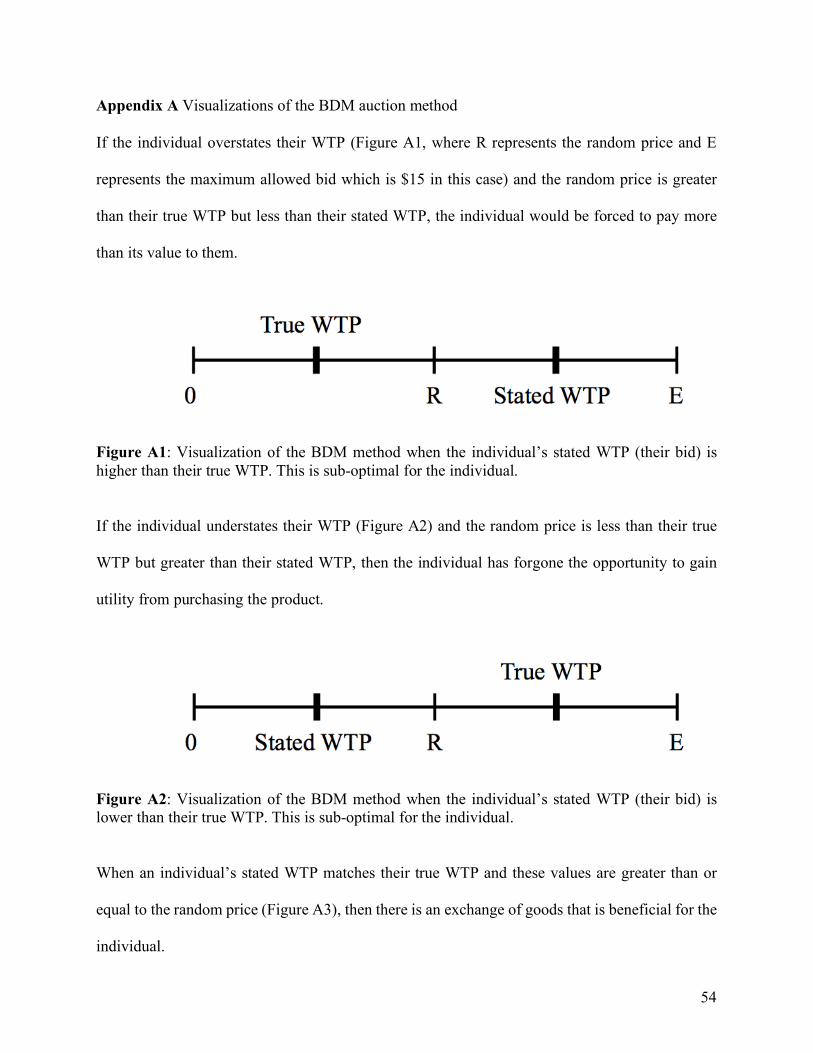
54
Appendix A Visualizations of the BDM auction method If the individual overstates their WTP (Figure A1, where R represents the random price and E
represents the maximum allowed bid which is $15 in this case) and the random price is greater
than their true WTP but less than their stated WTP, the individual would be forced to pay more
than its value to them.
Figure A1: Visualization of the BDM method when the individual’s stated WTP (their bid) is higher than their true WTP. This is sub-optimal for the individual.
If the individual understates their WTP (Figure A2) and the random price is less than their true
WTP but greater than their stated WTP, then the individual has forgone the opportunity to gain
utility from purchasing the product.
Figure A2: Visualization of the BDM method when the individual’s stated WTP (their bid) is lower than their true WTP. This is sub-optimal for the individual.
When an individual’s stated WTP matches their true WTP and these values are greater than or
equal to the random price (Figure A3), then there is an exchange of goods that is beneficial for the
individual.
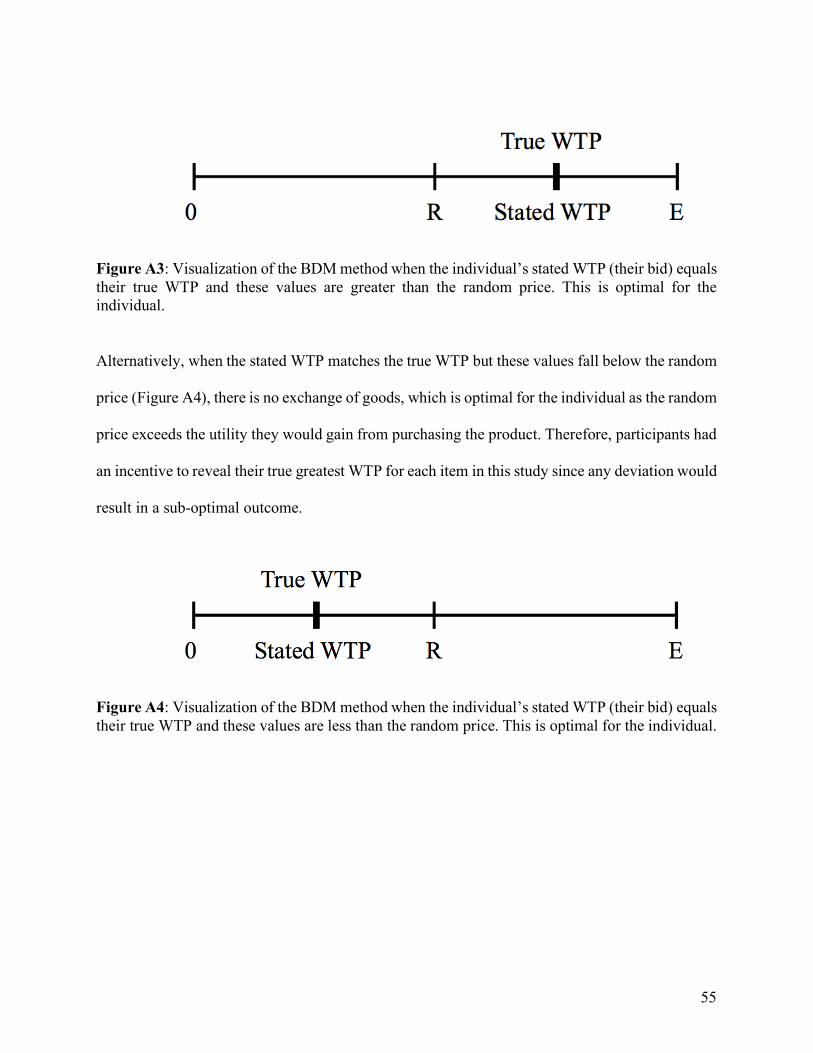
55
Figure A3: Visualization of the BDM method when the individual’s stated WTP (their bid) equals their true WTP and these values are greater than the random price. This is optimal for the individual.
Alternatively, when the stated WTP matches the true WTP but these values fall below the random
price (Figure A4), there is no exchange of goods, which is optimal for the individual as the random
price exceeds the utility they would gain from purchasing the product. Therefore, participants had
an incentive to reveal their true greatest WTP for each item in this study since any deviation would
result in a sub-optimal outcome.
Figure A4: Visualization of the BDM method when the individual’s stated WTP (their bid) equals their true WTP and these values are less than the random price. This is optimal for the individual.
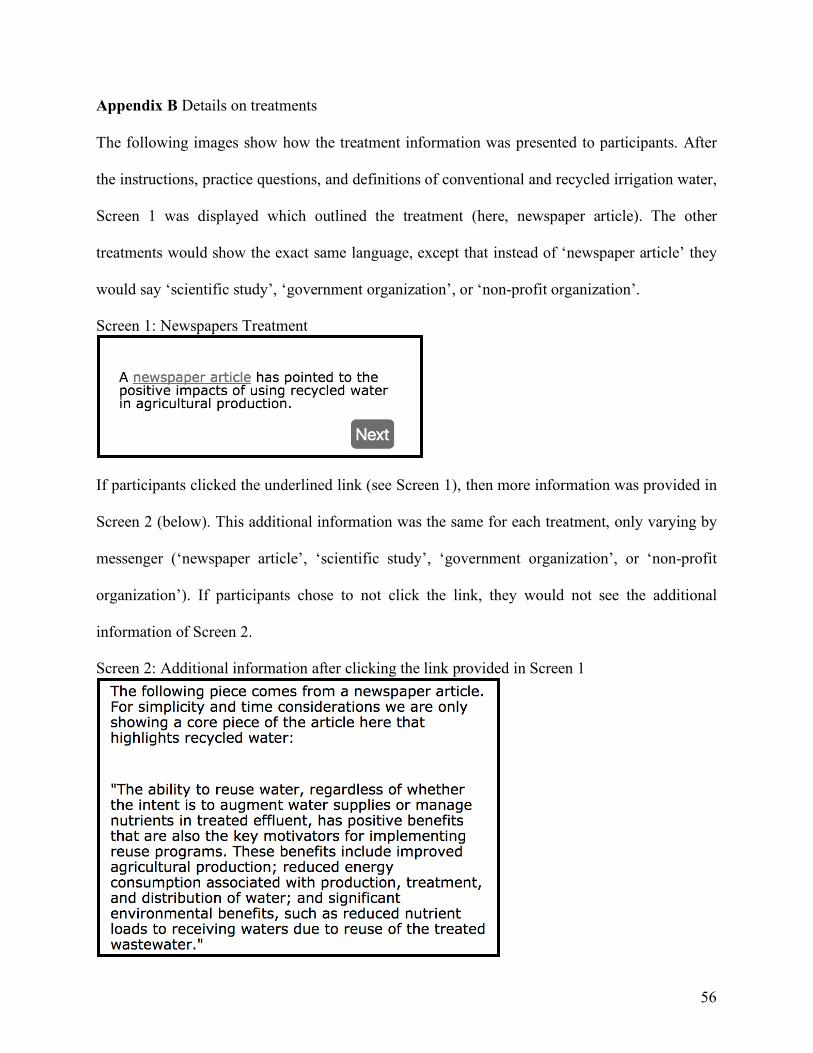
56
Appendix B Details on treatments The following images show how the treatment information was presented to participants. After
the instructions, practice questions, and definitions of conventional and recycled irrigation water,
Screen 1 was displayed which outlined the treatment (here, newspaper article). The other
treatments would show the exact same language, except that instead of ‘newspaper article’ they
would say ‘scientific study’, ‘government organization’, or ‘non-profit organization’.
Screen 1: Newspapers Treatment
If participants clicked the underlined link (see Screen 1), then more information was provided in
Screen 2 (below). This additional information was the same for each treatment, only varying by
messenger (‘newspaper article’, ‘scientific study’, ‘government organization’, or ‘non-profit
organization’). If participants chose to not click the link, they would not see the additional
information of Screen 2.
Screen 2: Additional information after clicking the link provided in Screen 1
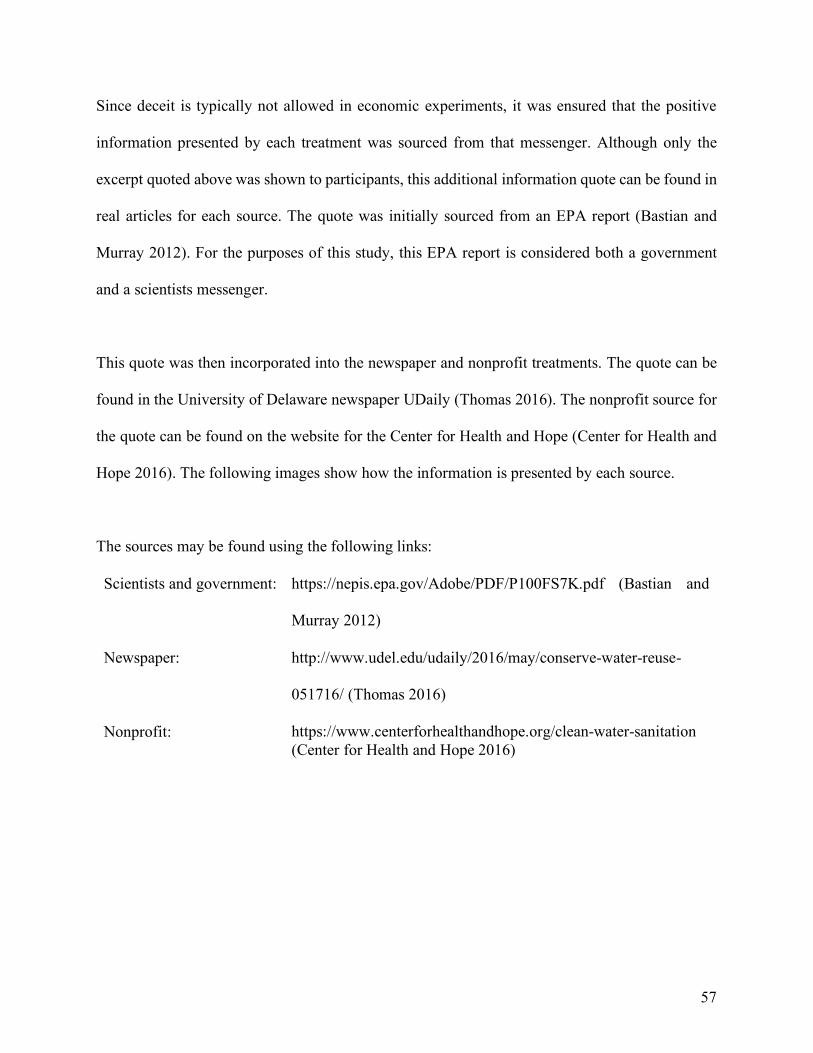
57
Since deceit is typically not allowed in economic experiments, it was ensured that the positive
information presented by each treatment was sourced from that messenger. Although only the
excerpt quoted above was shown to participants, this additional information quote can be found in
real articles for each source. The quote was initially sourced from an EPA report (Bastian and
Murray 2012). For the purposes of this study, this EPA report is considered both a government
and a scientists messenger.
This quote was then incorporated into the newspaper and nonprofit treatments. The quote can be
found in the University of Delaware newspaper UDaily (Thomas 2016). The nonprofit source for
the quote can be found on the website for the Center for Health and Hope (Center for Health and
Hope 2016). The following images show how the information is presented by each source.
The sources may be found using the following links:
Scientists and government: https://nepis.epa.gov/Adobe/PDF/P100FS7K.pdf (Bastian and
Murray 2012)
Newspaper:
http://www.udel.edu/udaily/2016/may/conserve-water-reuse-
051716/ (Thomas 2016)
Nonprofit: https://www.centerforhealthandhope.org/clean-water-sanitation (Center for Health and Hope 2016)
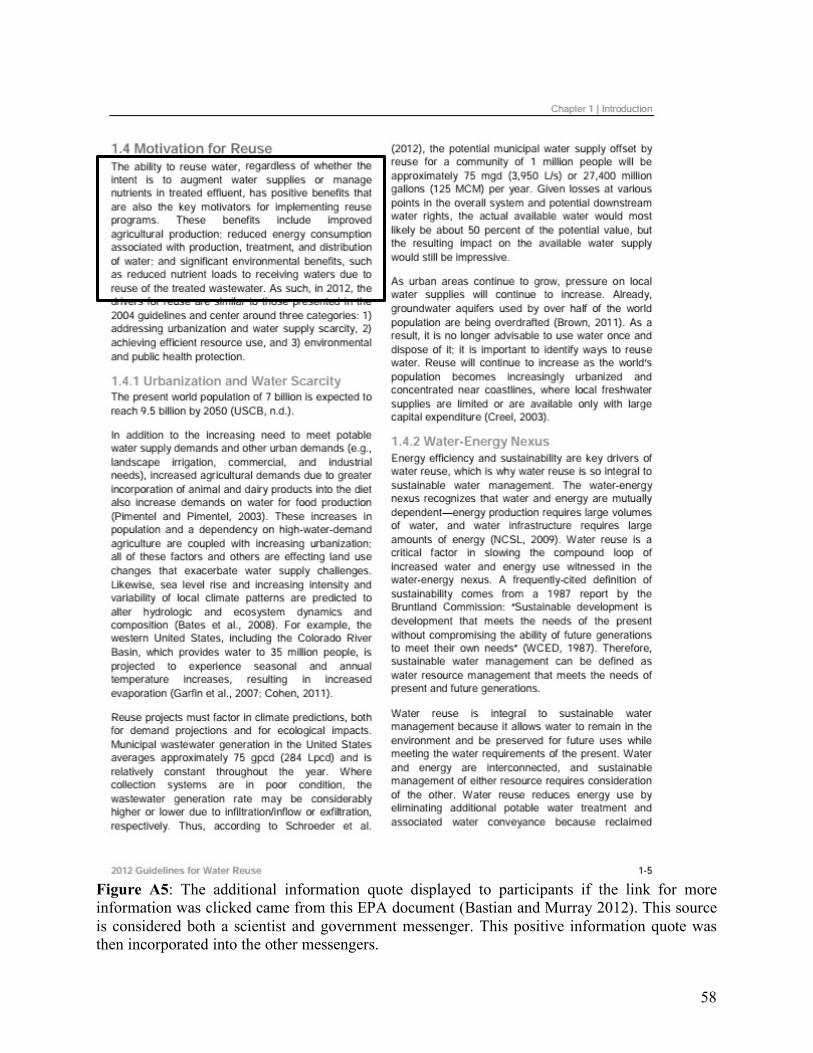
58
Figure A5: The additional information quote displayed to participants if the link for more information was clicked came from this EPA document (Bastian and Murray 2012). This source is considered both a scientist and government messenger. This positive information quote was then incorporated into the other messengers.

59
Figure A6: The webpage for the UDaily newspaper source appears as shown in the image presented above (Thomas 2016).
Figure A7: The same quote that was found in the EPA 2012 Guidelines for Water Reuse report (Bastian and Murray 2012) is part of the UDaily newspaper article as shown above in the article titled, “UD professors look at water reuse for irrigation and consumer response” (Thomas 2016).
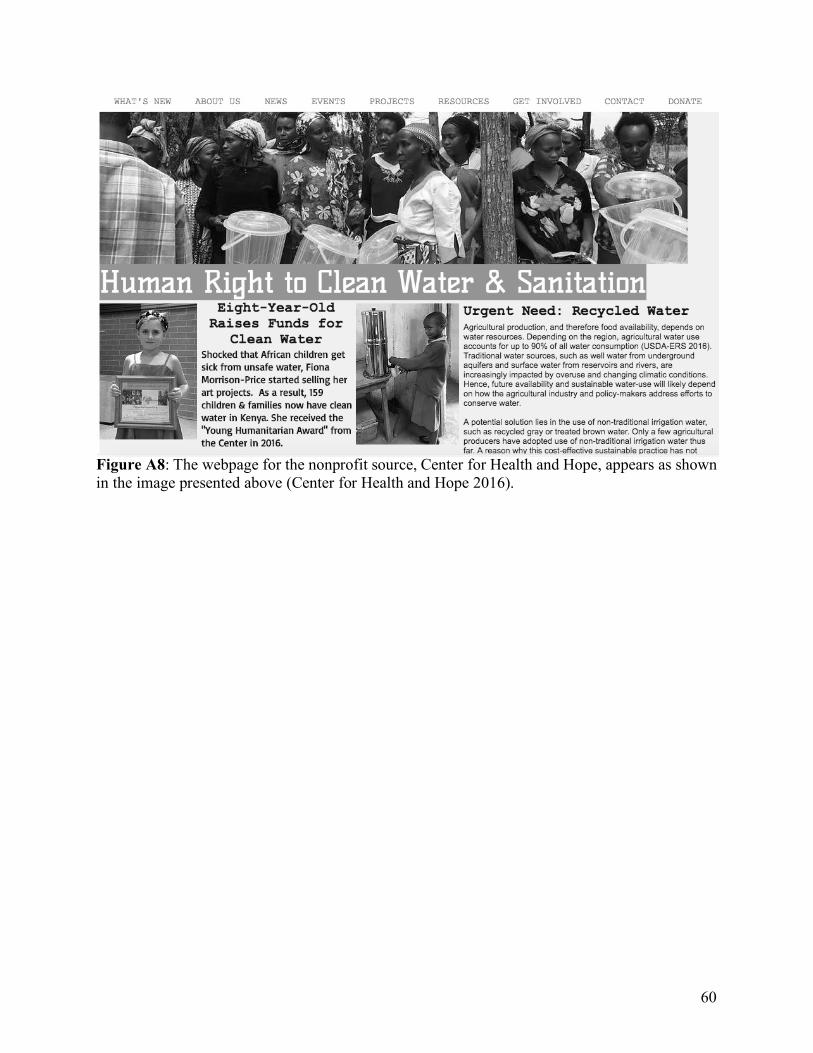
60
Figure A8: The webpage for the nonprofit source, Center for Health and Hope, appears as shown in the image presented above (Center for Health and Hope 2016).
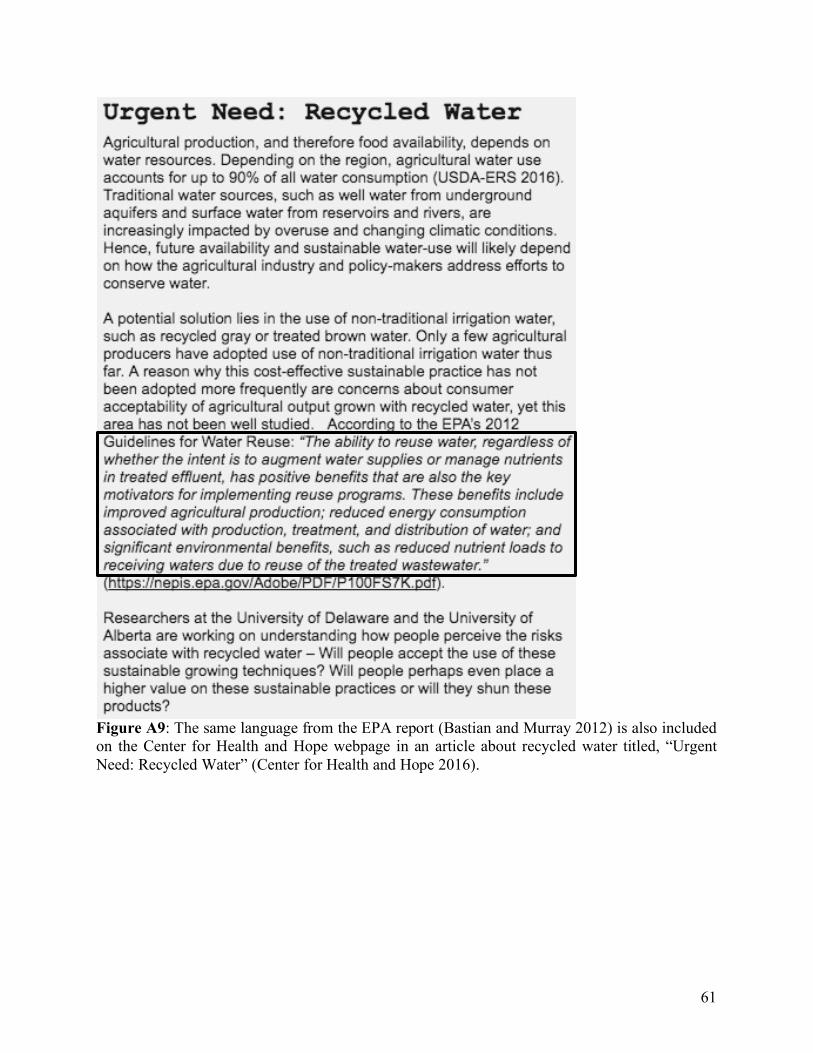
61
Figure A9: The same language from the EPA report (Bastian and Murray 2012) is also included on the Center for Health and Hope webpage in an article about recycled water titled, “Urgent Need: Recycled Water” (Center for Health and Hope 2016).

62
Appendix C Experimental instructions Instructions: Please read these instructions carefully. Please do not communicate with other participants. If you have questions, please raise your hand and an administrator will come to you. In today’s study, you will be asked to indicate the highest amount of money you would pay for certain products. This amount will be called your bid. You will receive $15 for participating in this study. Below we will explain how you can use this money to place bids on certain products. All decisions you make are real decisions – this means that you will place bids of real money on real products. Process: We will ask you to bid the highest amount of money you are willing to pay for a number of products. These products will be on display at the main table. You will fill out a short survey. At the end, one of your bids for a product will be randomly selected for implementation. The computer will draw a random price for the selected product. If your bid for that product is higher than the random price, you will purchase the product at the random price. If your bid is lower than the random price, you will not purchase any product. Any purchases you make will be deducted from the $15 you receive for your participation. Rules for Bidding: Your bids must be between $0 and $15. Once you have placed your bids for all the products, the computer will randomly choose one product for implementation. For the chosen product, the computer will randomly generate a price between $0 and $15. If your bid for that product is higher or equal to the random price, you will receive the product and pay only the random price. If your bid is lower than the random price, you will not receive the product and receive the $15. It is most beneficial for you to accurately bid the highest amount of money you are willing to pay for the product. Example 1: Suppose the highest amount of money you are willing to pay for the product is $10, so you bid $10. Suppose this product is randomly selected at the end of the study. Possible Outcomes: If the randomly drawn price is $5, then you will receive the product and pay $5 – because your bid was higher than the random price. The $5 will be deducted from your balance of $15, so you will receive the product and $10 ($15-$5). If the randomly drawn price is $10, then you will receive the product and pay $10 – because your bid was equal to the random price. The $10 will be deducted from your balance of $15, so you will receive the product and $5 ($15-$10).

63
If the randomly drawn price is $12, then you will not receive the product because your bid was lower than the random price. You will receive $15 and no product. Example 2: Say that the highest amount of money you are willing to pay for the product is $15, so you bid $15. Possible Outcomes: If you bid $15 you will definitely receive the product because any random price will be equal to or less than $15, for example: If the randomly drawn price is $15, then you will receive the product and pay $15 – because your bid was equal to the random price. The $15 will be deducted from your balance of $15, so you receive the product and $0 ($15-$15). If the randomly drawn price is $2, then you will receive the product and pay $2 – because your bid was higher than the random price. The $2 will be deducted from your balance of $15, so you receive the product and $13 ($15-$2). Example 3: Say that the highest amount of money you are willing to pay for the product is $0, so you bid $0. Possible Outcomes: If you bid $0 you will either receive the product for free ($0) and still receive $15, or you will not receive the product and receive $15, for example: If the randomly drawn price is $0, then you will receive the product and pay $0 – because your bid was equal to the random price. The $0 will be deducted from your balance of $15, so you receive the product and $15 ($15-$0). If the randomly drawn price is $2, then you will not receive the product and will be paid $15 – because your bid was lower than the random price.
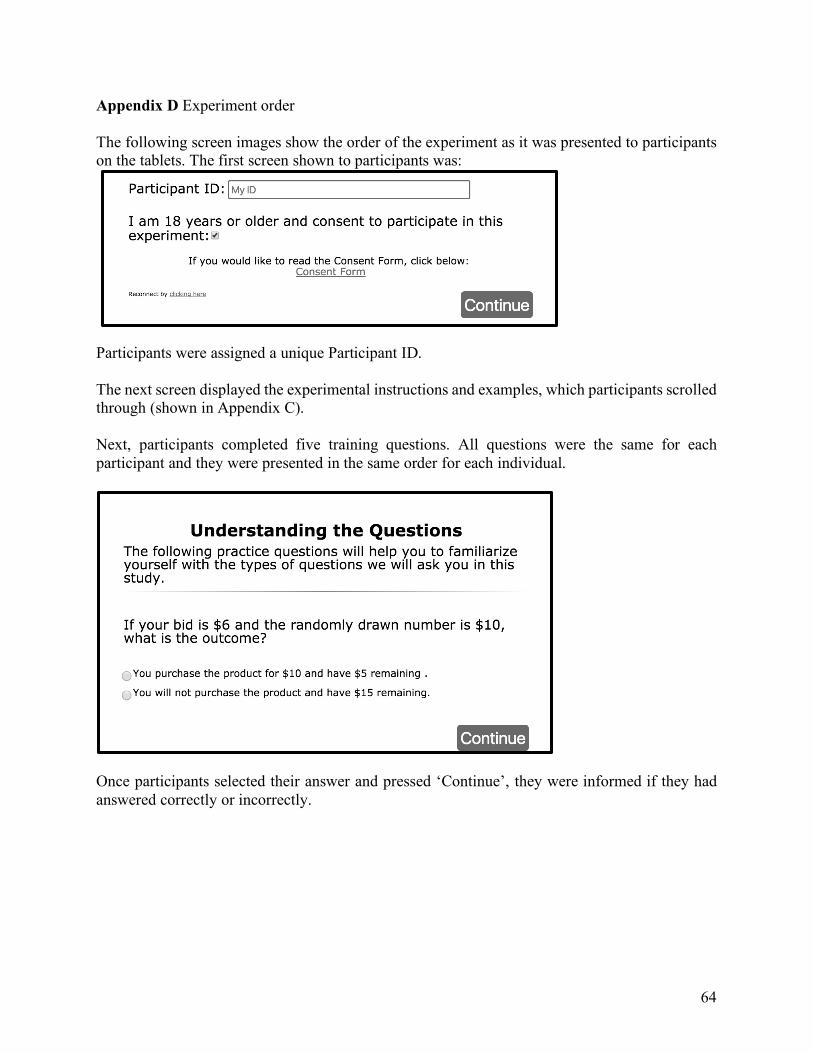
64
Appendix D Experiment order The following screen images show the order of the experiment as it was presented to participants on the tablets. The first screen shown to participants was:
Participants were assigned a unique Participant ID. The next screen displayed the experimental instructions and examples, which participants scrolled through (shown in Appendix C). Next, participants completed five training questions. All questions were the same for each participant and they were presented in the same order for each individual.
Once participants selected their answer and pressed ‘Continue’, they were informed if they had answered correctly or incorrectly.
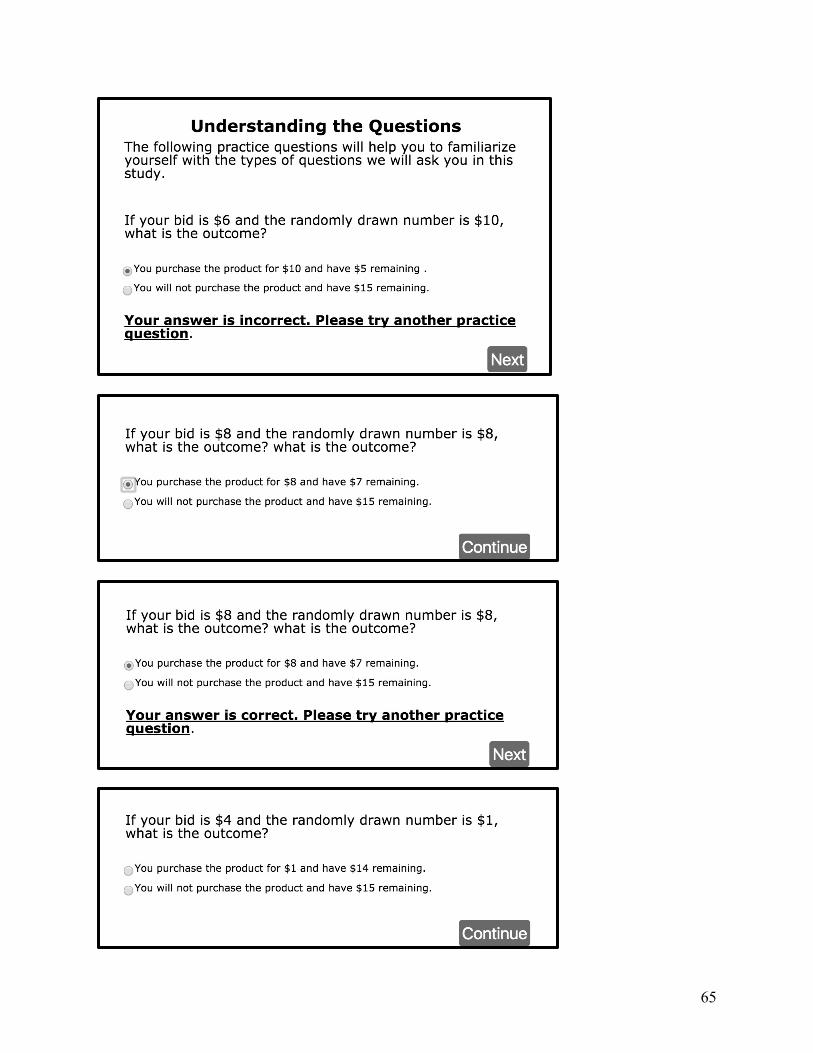
65
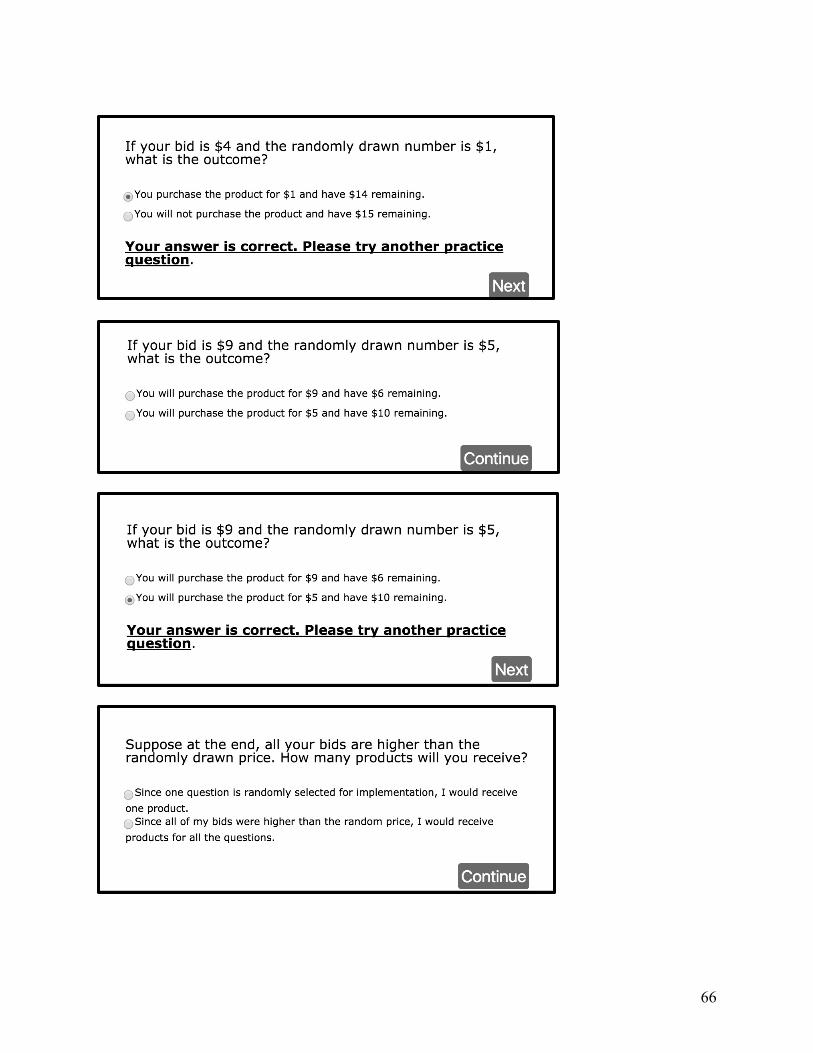
66

67
Participants were reminded of the non-hypothetical nature of the real experiment and the implications of their choices. The next screen displayed definitions of conventional and recycled water.
Following the definitions, the treatment information was displayed (outlined in Appendix B). After the treatment information, participants were asked to place bids on the six different products. The products were displayed in random order; an example is shown below. All products and bids were contained on one screen that participants scrolled through. Note that pictures were shown in colour during the experiment.
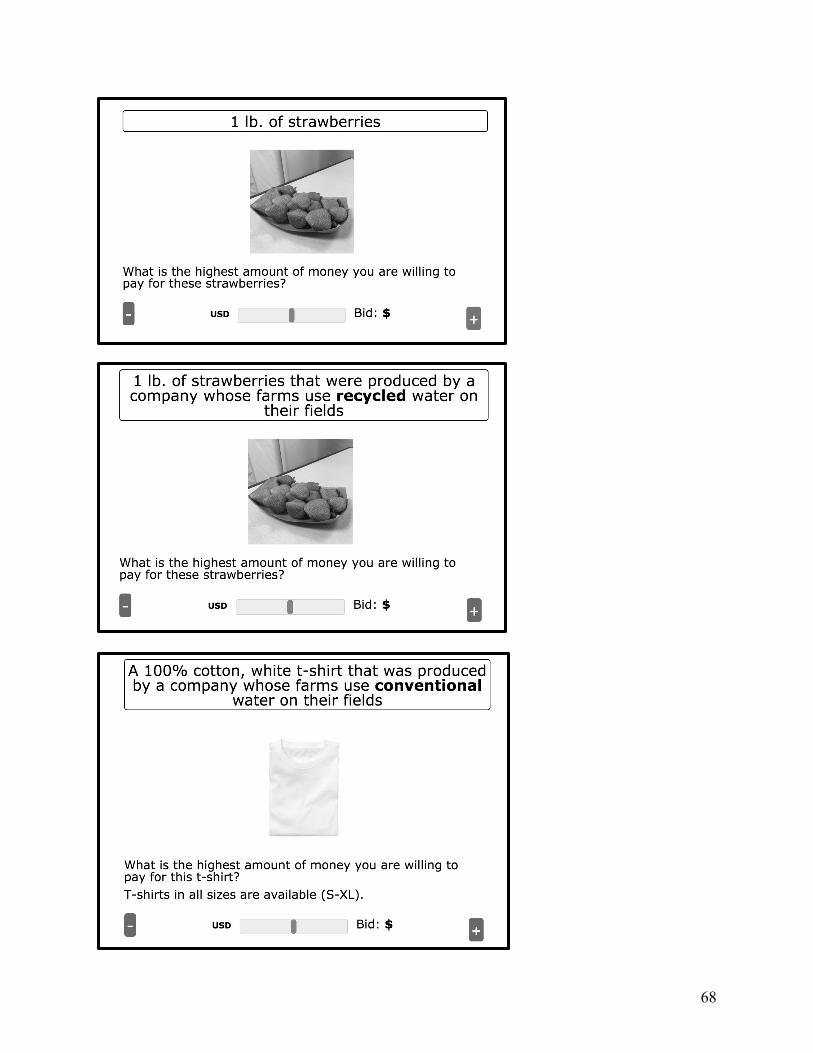
68
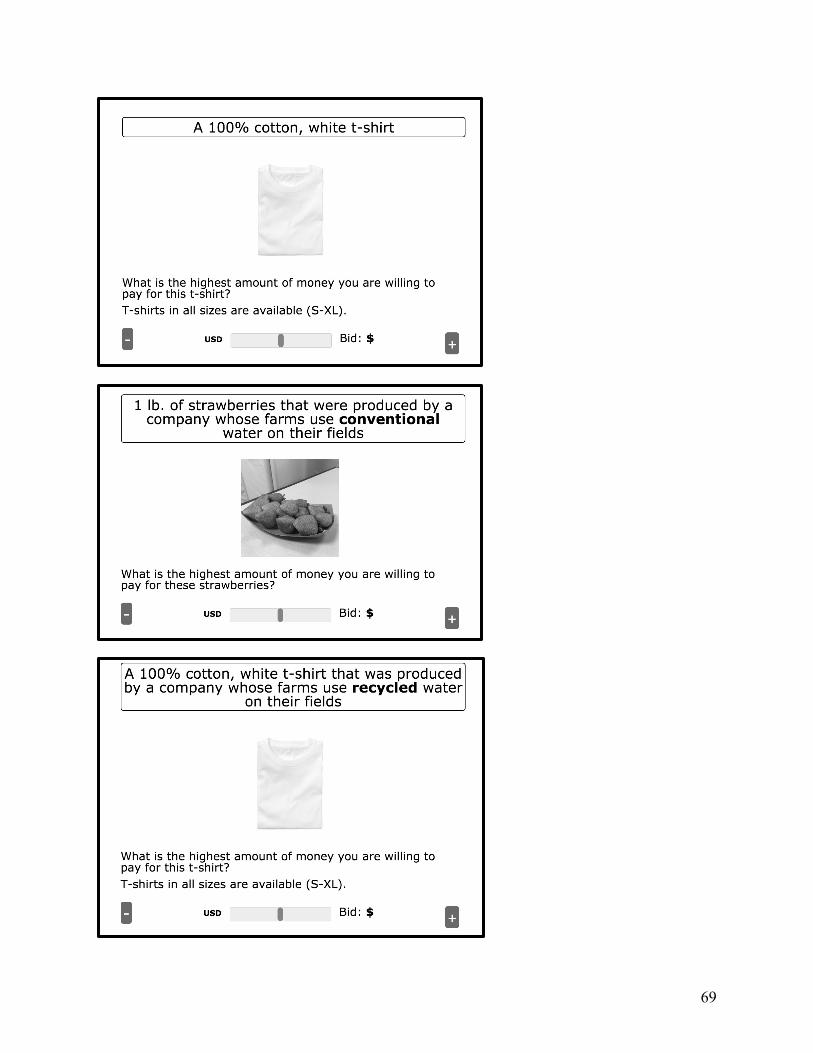
69
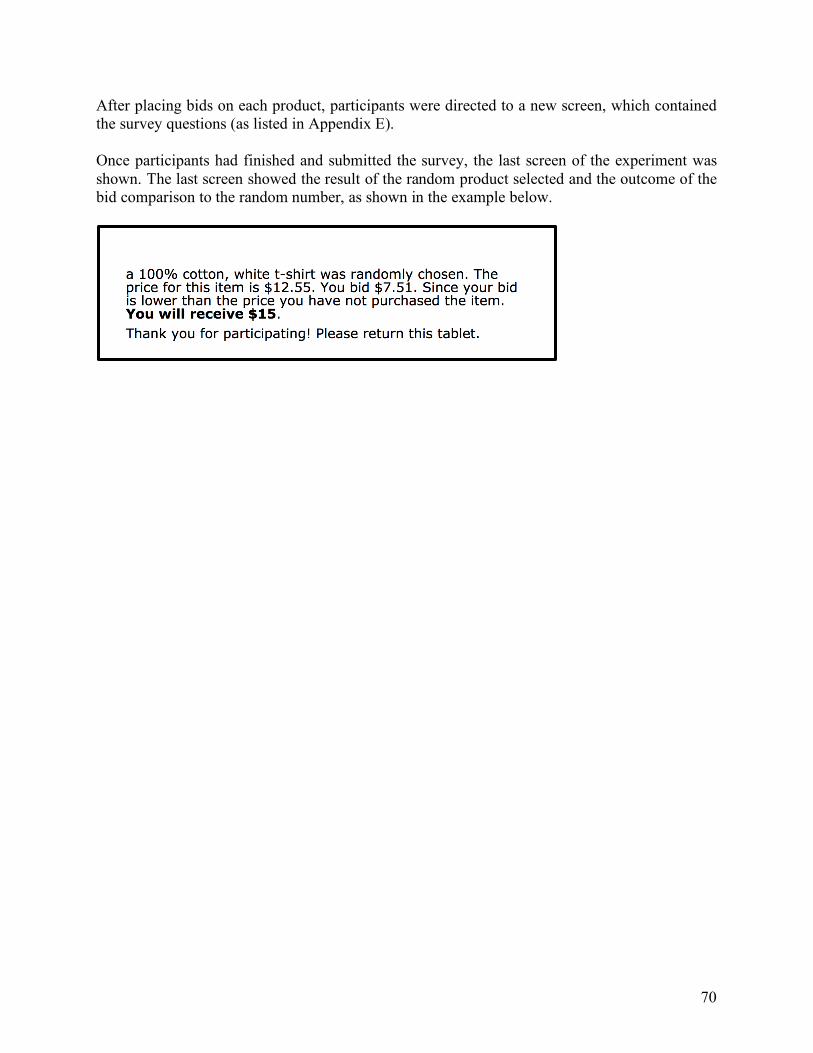
70
After placing bids on each product, participants were directed to a new screen, which contained the survey questions (as listed in Appendix E). Once participants had finished and submitted the survey, the last screen of the experiment was shown. The last screen showed the result of the random product selected and the outcome of the bid comparison to the random number, as shown in the example below.
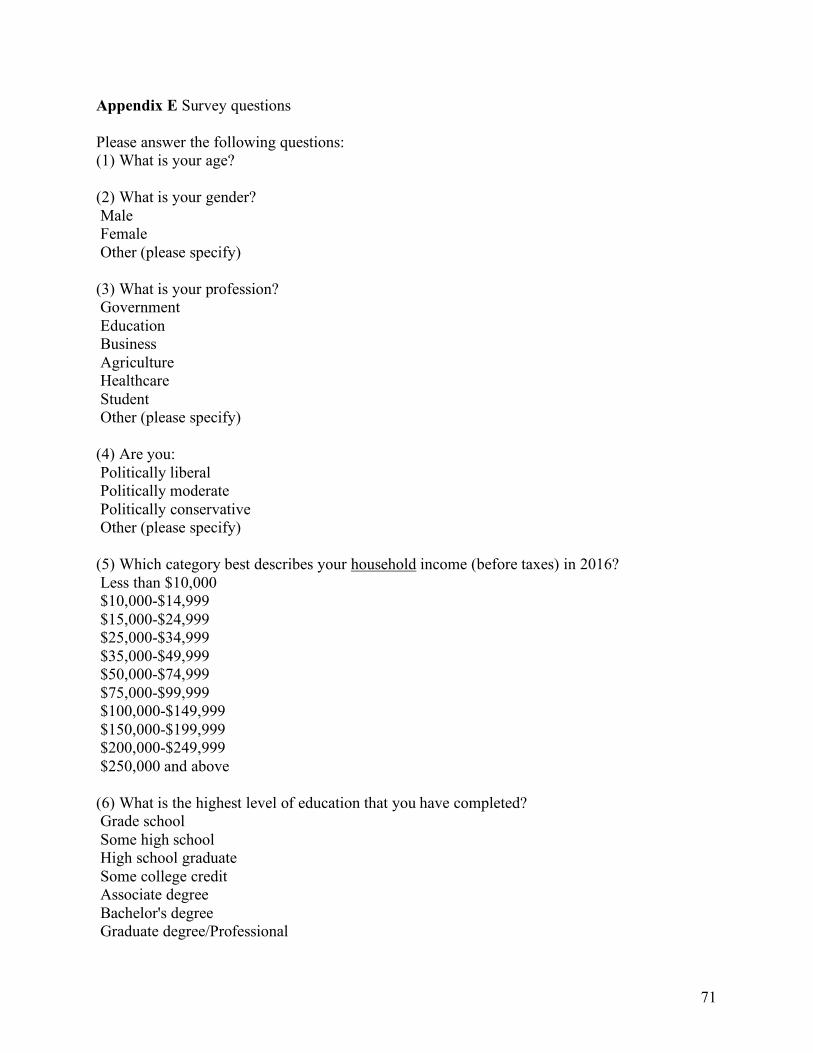
71
Appendix E Survey questions Please answer the following questions: (1) What is your age? (2) What is your gender? Male Female Other (please specify) (3) What is your profession? Government Education Business Agriculture Healthcare Student Other (please specify) (4) Are you: Politically liberal Politically moderate Politically conservative Other (please specify) (5) Which category best describes your household income (before taxes) in 2016? Less than $10,000 $10,000-$14,999 $15,000-$24,999 $25,000-$34,999 $35,000-$49,999 $50,000-$74,999 $75,000-$99,999 $100,000-$149,999 $150,000-$199,999 $200,000-$249,999 $250,000 and above (6) What is the highest level of education that you have completed? Grade school Some high school High school graduate Some college credit Associate degree Bachelor's degree Graduate degree/Professional
72
(7) Do you have a child/children under the age of 18 years old in your household? Yes No (8) How often do you consume fruit? __times per month (9) Are you the primary shopper in your household? Yes No (10) Do you think millennials (individuals born between 1981 and 1997) are more likely to prefer using recycled water for crop irrigation? Yes No Not sure (11) Do you think individuals in your community are more likely to prefer using recycled water for crop irrigation? Yes No Not sure (12) Do you think the majority of consumers prefer using recycled water for crop irrigation? Yes No Not sure (13) Did you know that social norms (what most people do) can influence our decisions? Yes No Not sure (14) What is the percentage of organic foods in your overall vegetable and fruit consumption? Non-Organic (0%) – slider – Organic (100%) (15) Do you grow your own food? Yes No (16) Which do you prefer? Local Food Non-Local Food Do not care
73
(17) What type of water do you typically drink? Bottled Water Tap Water Filtered Water Other (please specify) (18) Are you concerned about water availability in these areas? Your Community Yes No Your State Yes No United States Yes No Worldwide Yes No (19) How concerned are you about climate change in these areas? Your Community: Not At All (1) – slider – Very Concerned (5) Your State: Not At All (1) – slider – Very Concerned (5) United States: Not At All (1) – slider – Very Concerned (5) Worldwide: Not At All (1) – slider – Very Concerned (5) (20) Do you prefer conventional water or recycled water for use in food crop production? Conventional Recycled water Do not care (21) Do you prefer conventional water or recycled water for use in non-food crop production? Conventional Recycled water Do not care
74
(22) How much do you trust information from the following sources: Newspaper: Strongly Disagree (1) – slider – Strongly Agree (5) Government: Strongly Disagree (1) – slider – Strongly Agree (5) Non-profit organization: Strongly Disagree (1) – slider – Strongly Agree (5) Science: Strongly Disagree (1) – slider – Strongly Agree (5) (23) Do you prefer clothing made from organic cotton? Yes No Do not care (24) Do you educate yourself about how your clothing is produced? Yes No
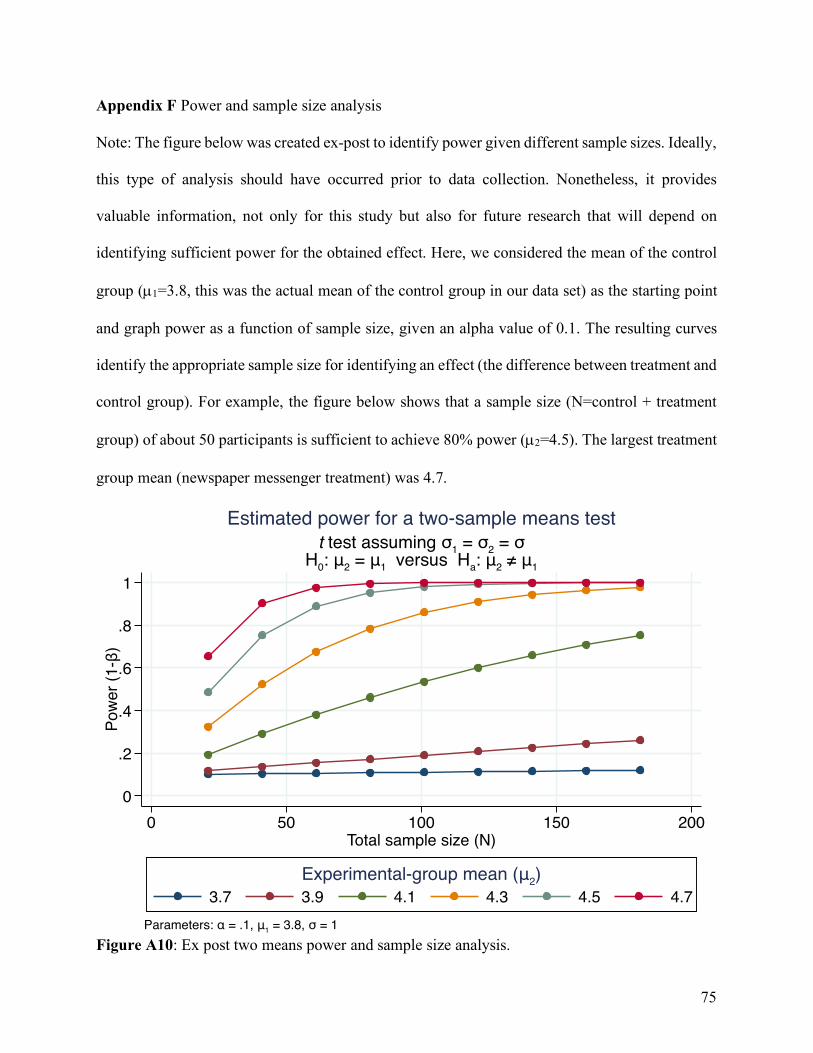
75
Appendix F Power and sample size analysis Note: The figure below was created ex-post to identify power given different sample sizes. Ideally,
this type of analysis should have occurred prior to data collection. Nonetheless, it provides
valuable information, not only for this study but also for future research that will depend on
identifying sufficient power for the obtained effect. Here, we considered the mean of the control
group (µ1=3.8, this was the actual mean of the control group in our data set) as the starting point
and graph power as a function of sample size, given an alpha value of 0.1. The resulting curves
identify the appropriate sample size for identifying an effect (the difference between treatment and
control group). For example, the figure below shows that a sample size (N=control + treatment
group) of about 50 participants is sufficient to achieve 80% power (µ2=4.5). The largest treatment
group mean (newspaper messenger treatment) was 4.7.
Figure A10: Ex post two means power and sample size analysis.
0
.2
.4
.6
.8
1
Pow
er (1
-β)
0 50 100 150 200Total sample size (N)
3.7 3.9 4.1 4.3 4.5 4.7Experimental-group mean (μ2)
Parameters: α = .1, μ1 = 3.8, σ = 1
t test assuming σ1 = σ2 = σH0: μ2 = μ1 versus Ha: μ2 ≠ μ1
Estimated power for a two-sample means test
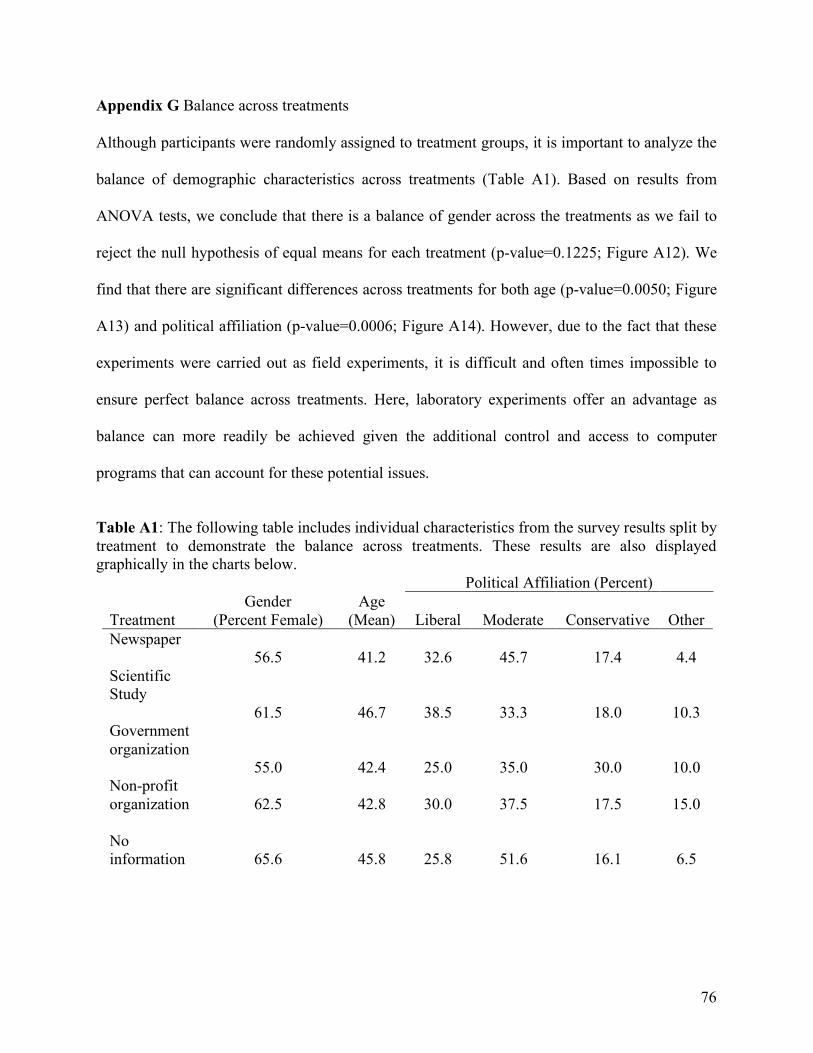
76
Appendix G Balance across treatments Although participants were randomly assigned to treatment groups, it is important to analyze the
balance of demographic characteristics across treatments (Table A1). Based on results from
ANOVA tests, we conclude that there is a balance of gender across the treatments as we fail to
reject the null hypothesis of equal means for each treatment (p-value=0.1225; Figure A12). We
find that there are significant differences across treatments for both age (p-value=0.0050; Figure
A13) and political affiliation (p-value=0.0006; Figure A14). However, due to the fact that these
experiments were carried out as field experiments, it is difficult and often times impossible to
ensure perfect balance across treatments. Here, laboratory experiments offer an advantage as
balance can more readily be achieved given the additional control and access to computer
programs that can account for these potential issues.
Table A1: The following table includes individual characteristics from the survey results split by treatment to demonstrate the balance across treatments. These results are also displayed graphically in the charts below.
Political Affiliation (Percent)
Treatment Gender
(Percent Female) Age
(Mean) Liberal Moderate Conservative Other Newspaper 56.5 41.2 32.6 45.7 17.4 4.4 Scientific Study 61.5 46.7 38.5 33.3 18.0 10.3 Government organization 55.0 42.4 25.0 35.0 30.0 10.0 Non-profit organization 62.5 42.8 30.0 37.5 17.5 15.0 No information 65.6 45.8 25.8 51.6 16.1 6.5
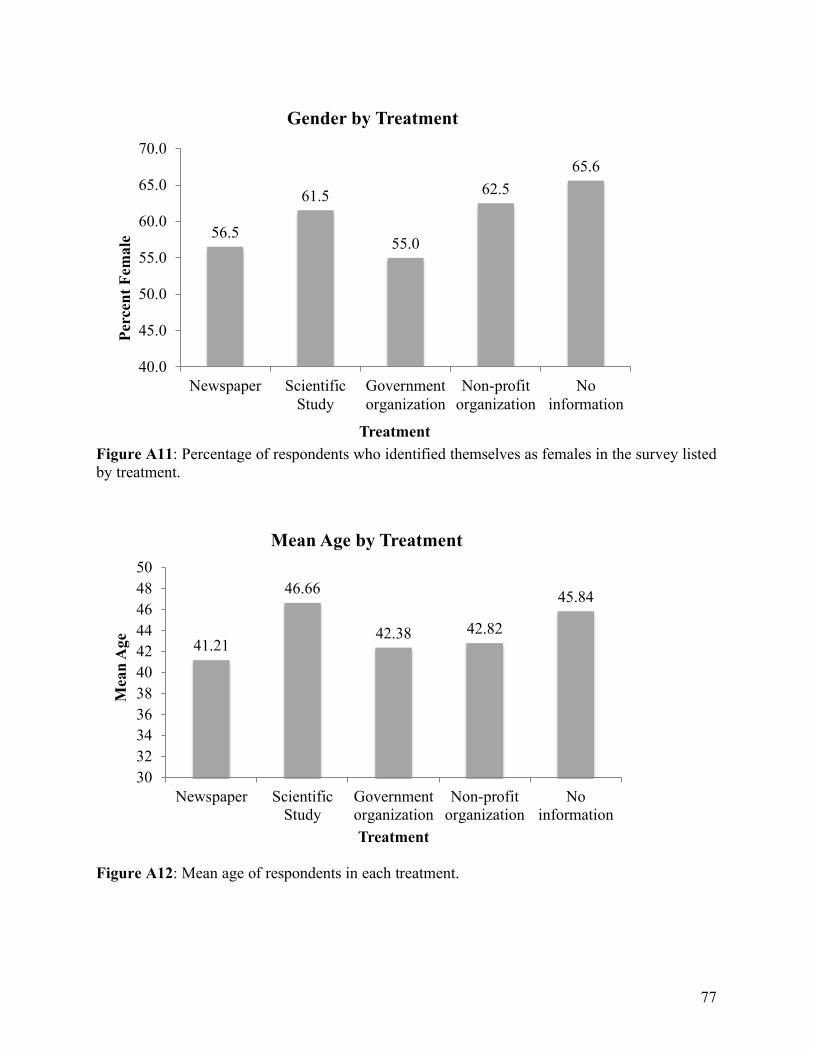
77
Figure A11: Percentage of respondents who identified themselves as females in the survey listed by treatment.
Figure A12: Mean age of respondents in each treatment.
56.5
61.5
55.0
62.565.6
40.0
45.0
50.0
55.0
60.0
65.0
70.0
Newspaper ScientificStudy
Governmentorganization
Non-profitorganization
Noinformation
Perc
ent F
emal
e
Treatment
Gender by Treatment
41.21
46.66
42.38 42.82
45.84
3032343638404244464850
Newspaper ScientificStudy
Governmentorganization
Non-profitorganization
Noinformation
Mea
n A
ge
Treatment
Mean Age by Treatment
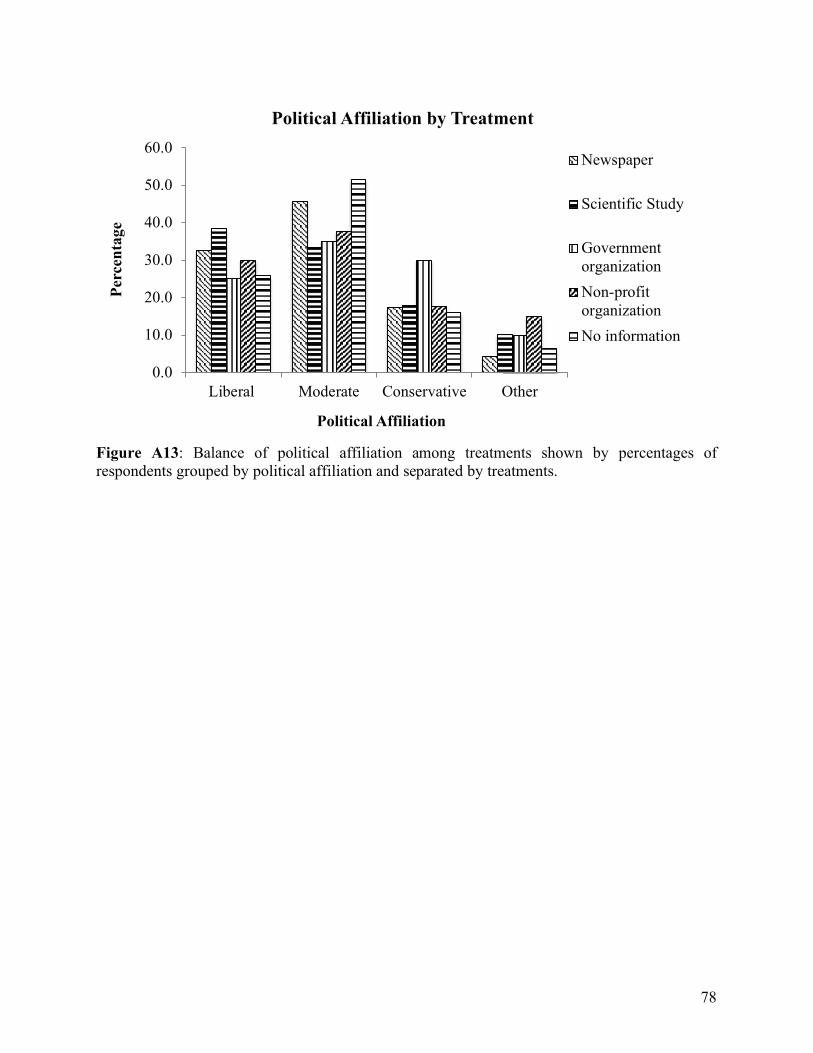
78
Figure A13: Balance of political affiliation among treatments shown by percentages of respondents grouped by political affiliation and separated by treatments.
0.0
10.0
20.0
30.0
40.0
50.0
60.0
Liberal Moderate Conservative Other
Perc
enta
ge
Political Affiliation
Political Affiliation by Treatment
Newspaper
Scientific Study
GovernmentorganizationNon-profitorganizationNo information