Embed Size (px)
Citation preview
School Accountability Report Card Reported for the 2009-10 School Year Published During 2010-11
1 Lincoln Middle Santa Monica-Malibu Unified
Lincoln Middle
The School Accountability Report Card (SARC), which is required by law to be published annually, contains information about the condition and performance of each California public school. More information about SARC requirements is available on the SARC Web page at www.cde.ca.gov/ta/ac/sa/. For additional information about the school, parents and community members should contact the school principal or the district office.
I. School Information
Contact Information (2010-11 School Year) This section provides the school’s contact information.
School District
School Name Lincoln Middle District Name Santa Monica-Malibu Unified
Street 1501 California Ave. Phone Number 310 450-8338
City, State, Zip Santa Monica, CA, 90403-4305 Website www.smmusd.org
Phone Number 310 393-9227 Superintendent Tim Cuneo
Principal Suzanne Webb E-mail Address [email protected]
E-mail Address [email protected] CDS Code 19649806061659
Principal’s Message (2009-10 School Year) This section provides information about the school, its programs and its goals.
District Vision:
As a community of learners, the Santa Monica-Malibu Unified School District works together in a nurturing environment to help students be visionary, versatile thinkers; resourceful, life-long learners; effective, multilingual communicators and global citizens. We are a richly varied community that values the contributions of all its members. We exist to prepare all students in their pursuit of academic achievement and personal health and to support and encourage them in their development of intellectual, artistic, technological, physical and social expression.
About Lincoln:
Lincoln Middle School is located at 1501 California Avenue in Santa Monica, one block north of Wilshire Boulevard. We serve a diverse community of students enrolled in grades six through eight. The vast majority of these students arrive from our three local feeder elementary schools. Our staff includes 46 credentialed teachers of whom eleven have received National Board Certification, three full-time administrators, three full-time counselors, a full-time librarian, a full-time nurse, a full-time school psychologist, a speech pathologist, 12 instructional assistants, two security guards, and five office staff personnel. Numerous parent volunteers also support our work. Recognized as one of the leading middle schools in both California and the nation. Lincoln received the 2001 Disney Spotlight School of the Year Award, the 2000 National Blue Ribbon School of Excellence Award, and the State Distinguished School Award in
School Accountability Report Card Reported for the 2009-10 School Year Published During 2010-11
2 Lincoln Middle Santa Monica-Malibu Unified
the years 1994 and 1999. In addition to a rigorous academic program and an API (Annual Performance Index) of 892, we use Character Counts! to help promote integrity and compassion in our student community.
Parental Involvement (2009-10 School Year) This section provides information about opportunities for parents to become involved with school activities.
Contact Person Name: Karen Gardner Contact Person Phone Number: [email protected]
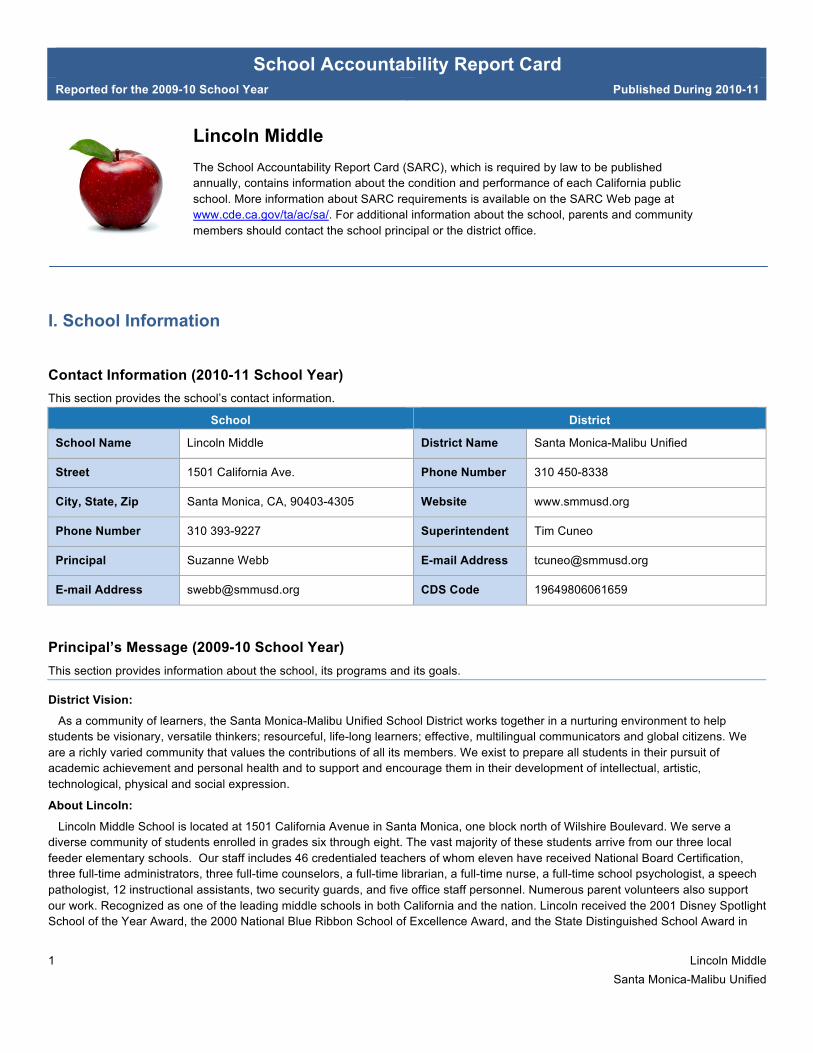
Parents may become involved in many ways, both in ongoing and in single event opportunities: They may assist in the library, the student store, the teacher copy room, the main office, or at the front gate, as well as participate in various school activities (such as field trips, class performances, reward parties, drama program) and fundraising efforts. The Lincoln Middle School PTSA's guiding premise is to "Positively Impact the Lives of All the Children at Lincoln Middle School through Advocacy, Leadership and Communication." They offer over 35 volunteer committees to the community to get involved supporting the school in addition to parent education opportunities during our monthly PTSA meetings. Average Class Size and Class Size Distribution (Secondary) This table displays by subject area the average class size and the number of classrooms that fall into each size category (a range of total students per classroom).
2007-08 2008-09 2009-10 Number of
Classrooms Number of Classrooms Number of Classrooms Subject Avg.
Class Size 1-22 23-32 33+
Avg. Class Size 1-22 23-32 33+
Avg. Class Size 1-22 23-32 33+
English 22 8 8 3 25 6 7 5 26.1 9 25 9
Mathematics 29 5 19 14 28 4 24 12 30.38 8 16 13
Science 32 0 18 17 30 3 21 14 29.39 3 21 14
Social Science 29 1 7 5 32 0 6 7 28.69 8 18 13
Student Enrollment by Grade Level (2009-10 School Year) This table displays the number of students enrolled in each grade level at the school.
Grade Level Number of Students Grade Level Number of Students
Kindergarten 0 Grade 8 386
Grade 1 0 Ungraded Elementary 0
Grade 2 0 Grade 9 0
Grade 3 0 Grade 10 0
Grade 4 0 Grade 11 0
Grade 5 0 Grade 12 0
Grade 6 362 Ungraded Secondary 0
Grade 7 391 Total Enrollment 1140
School Accountability Report Card Reported for the 2009-10 School Year Published During 2010-11
3 Lincoln Middle Santa Monica-Malibu Unified
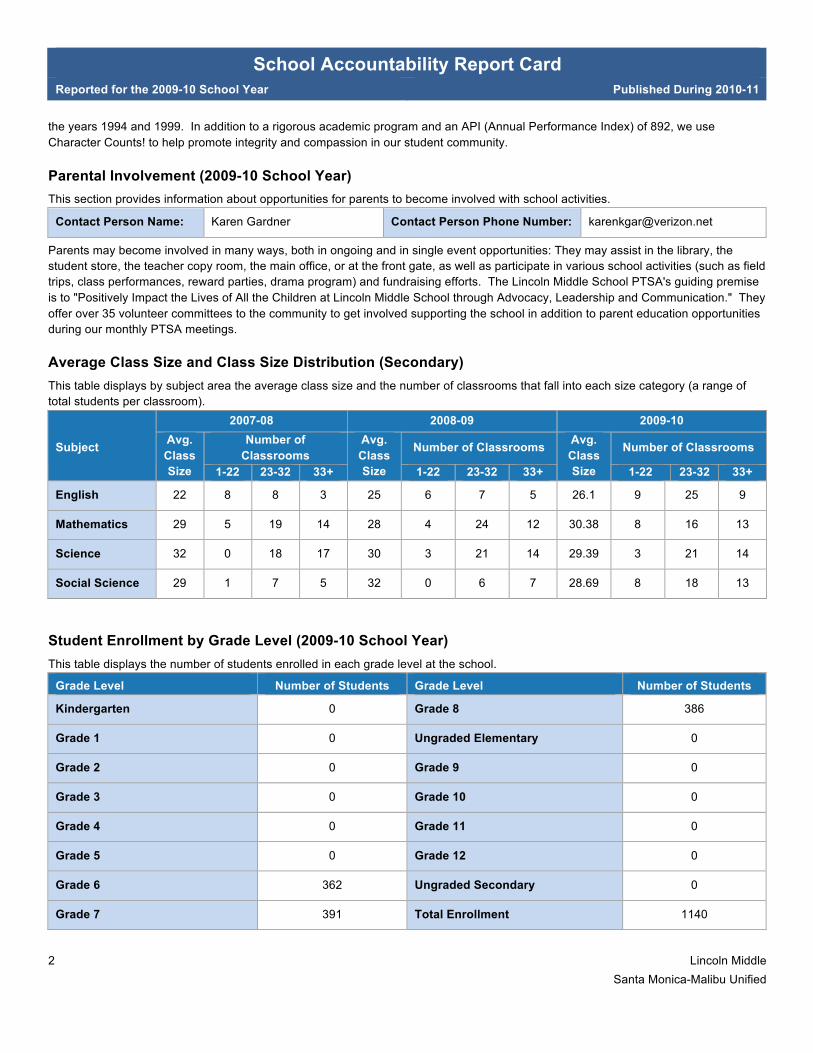
Student Enrollment by Group (2009-10 School Year) This table displays the percent of students enrolled at the school who are identified as being in a particular group.
Group Percent of Total Enrollment
Group Percent of Total Enrollment
Black or African American 4.9% White (not Hispanic) 58.7%
American Indian or Alaska Native 0.4% Two or More Races 8.8%
Asian 9.7% Socioeconomically Disadvantaged 18.0%
Filipino 0.4% English Learners 8.0%
Hispanic or Latino 16.9% Students with Disabilities 8.0%
Native Hawaiian or Pacific Islander 0.2%
II. School Safety and Facilities
School Safety Plan (2009-10) This section provides information about the school’s comprehensive safety plan.
Date School Safety Plan last reviewed: December 6, 2010
We have two full-time Security Officers who work a staggered schedule five days a week. One Officer works from 7:30 AM to 4:00 PM and the other Officer works from 8:30 AM to 5:00 PM. Their primary responsibility is to patrol the campus and the buildings throughout the day. The office staff and administrators maintain contact with the Security Officers via radios. One officer carries a cell phone for emergencies only. During the school day there is no unauthorized access to the school campus. Only one entrance is open during school hours, and school security staff and/or parent volunteers man this gate during school hours. Visitors must sign in and/or show ID. The classroom space is large enough to accommodate the class size of 32-36 students. Grade levels are located in the same area of the building and the interdisciplinary teams are located next door and/or across the hall from each other which allows for better collaboration and communication. There is enough space to hold faculty meetings in the library, plus there are three conference rooms varying in size to accommodate various groupings of personnel.
We have a systematic emergency evacuation plan that is used for both fire drills and earthquake drills. Students are informed of the correct path to take to the field on the north side of the school where they meet their Homebase teachers for attendance and further instructions. Administrators and classified staff have specific duties during this drill from gathering attendance sheets to securing grounds and looking for victims. An emergency drill is conducted once every six weeks and an earthquake drill is conducted at least once each year.
Suspensions & Expulsions This table displays the rate of suspensions and expulsions (the total number of incidents divided by the total enrollment) at the school and district levels for the most recent three-year period.
School District
2007-08 2008-09 2009-10 2007-08 2008-09 2009-10
Suspension Rate 6.0% 7.0% 6.0% 5.0% 4.0% 4.0%
Expulsion Rate 0.0% 0.0% 0.0% 0.0% 0.0% 0.0%
School Accountability Report Card Reported for the 2009-10 School Year Published During 2010-11
4 Lincoln Middle Santa Monica-Malibu Unified
School Facility Conditions This section provides information about the condition of the school’s grounds, buildings, and restrooms, and a description of any planned or recently completed facility improvements.
Lincoln is over 80 years young! The school facility is well maintained and is in well-functioning condition. Lincoln School provides a clean, safe, and modern learning environment. Our facilities currently support the largest number of middle school students, faculty, and staff in the District. A Technology Committee oversees our technology infrastructure, which currently provides two fully-equipped student computer labs, computers and telephones in every classroom, TV/VCR set-ups in all core classrooms as well as a closed-circuit Student TV system that links our Homebase classes for weekly live and prerecorded announcements. We take pride in the cleanliness and appearance of our campus that is maintained by 4.5 custodial staff members and the cooperative efforts of our students.
Planned Improvements (2010-11 School Year)
The district continues to keep its Deferred Maintenance fund open, however flexibility provided by the State has allowed us to use balances in this fund to relieve the General Fund, due to shortages in State funding. This flexibility was used during the 2009-10 fiscal year and is expected to be used in 2010-11. The district did not transfer any of the fund balance back to the General Fund, but has not made new contributions in the past two years. The balances in the Deferred Maintenance fund are still being used on approved maintenance projects. The district is carefully deciding which projects to move forward, as we do not expect to contribute additional funds from the district or receive new state Deferred Maintenance any time soon.
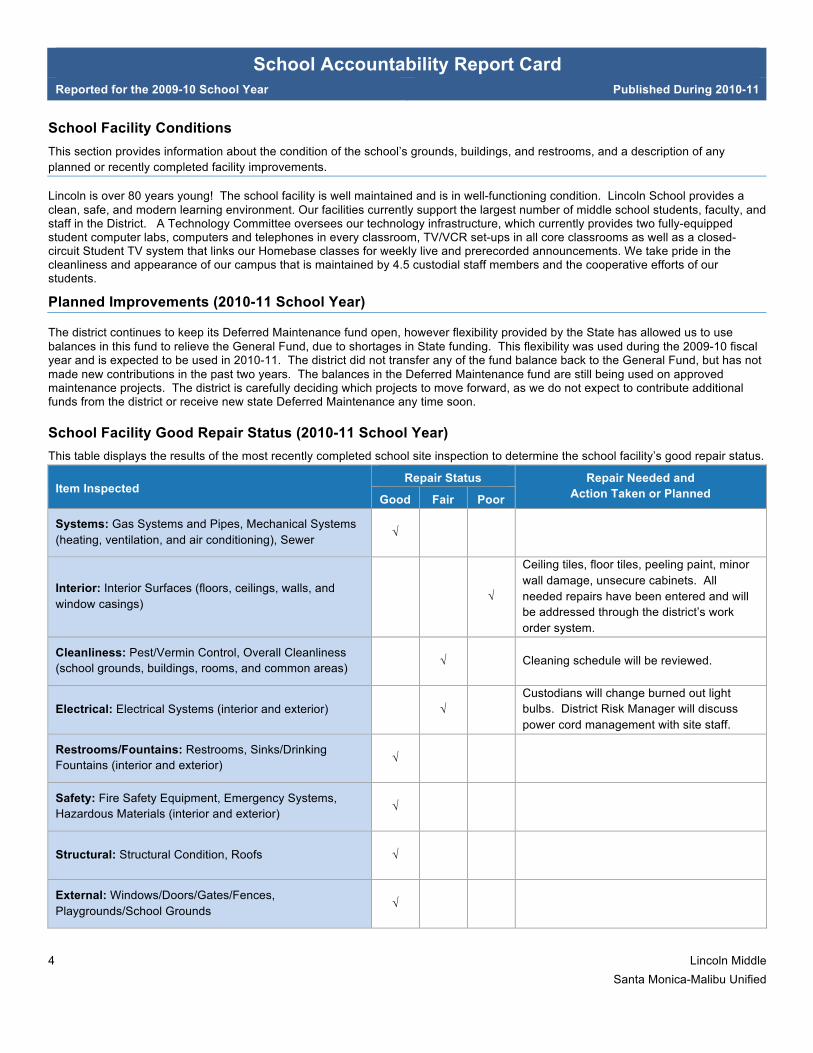
School Facility Good Repair Status (2010-11 School Year) This table displays the results of the most recently completed school site inspection to determine the school facility’s good repair status.
Repair Status Item Inspected
Good Fair Poor
Repair Needed and Action Taken or Planned
Systems: Gas Systems and Pipes, Mechanical Systems (heating, ventilation, and air conditioning), Sewer
√
Interior: Interior Surfaces (floors, ceilings, walls, and window casings)
√
Ceiling tiles, floor tiles, peeling paint, minor wall damage, unsecure cabinets. All needed repairs have been entered and will be addressed through the district’s work order system.
Cleanliness: Pest/Vermin Control, Overall Cleanliness (school grounds, buildings, rooms, and common areas) √ Cleaning schedule will be reviewed.
Electrical: Electrical Systems (interior and exterior) √ Custodians will change burned out light bulbs. District Risk Manager will discuss power cord management with site staff.
Restrooms/Fountains: Restrooms, Sinks/Drinking Fountains (interior and exterior) √
Safety: Fire Safety Equipment, Emergency Systems, Hazardous Materials (interior and exterior) √
Structural: Structural Condition, Roofs √
External: Windows/Doors/Gates/Fences, Playgrounds/School Grounds
√
School Accountability Report Card Reported for the 2009-10 School Year Published During 2010-11
5 Lincoln Middle Santa Monica-Malibu Unified
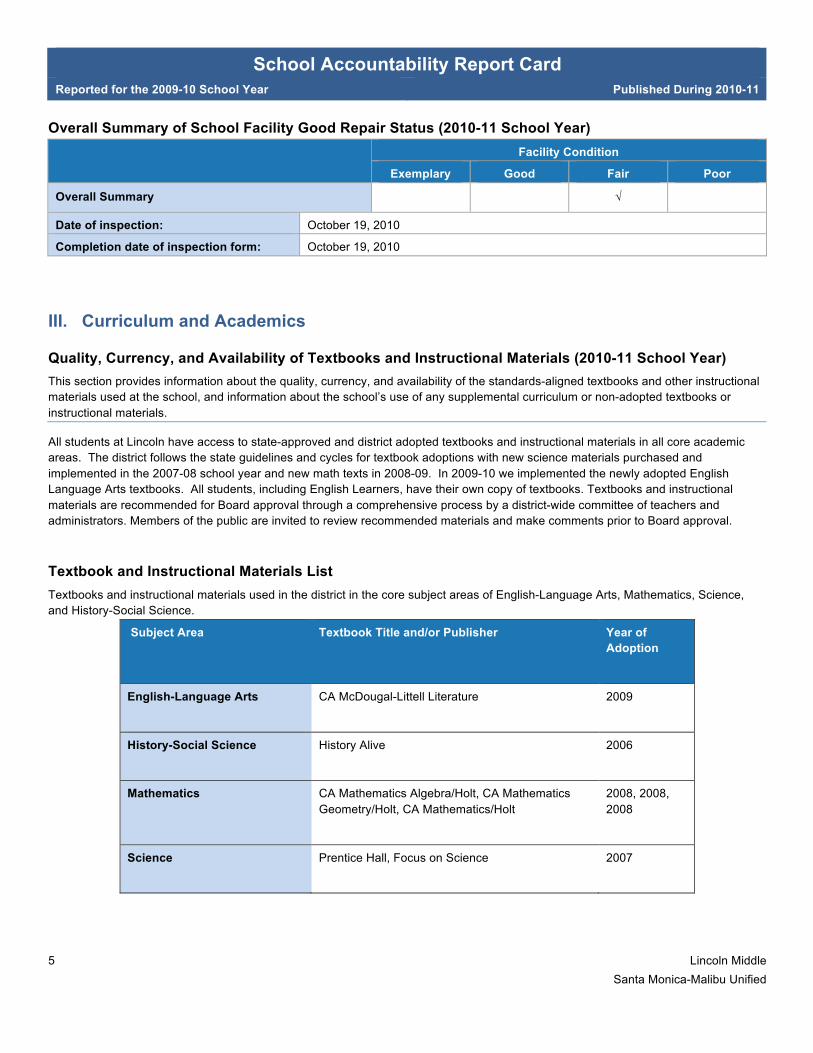
Overall Summary of School Facility Good Repair Status (2010-11 School Year) Facility Condition
Exemplary Good Fair Poor
Overall Summary √
Date of inspection: October 19, 2010
Completion date of inspection form: October 19, 2010
III. Curriculum and Academics
Quality, Currency, and Availability of Textbooks and Instructional Materials (2010-11 School Year) This section provides information about the quality, currency, and availability of the standards-aligned textbooks and other instructional materials used at the school, and information about the school’s use of any supplemental curriculum or non-adopted textbooks or instructional materials.
All students at Lincoln have access to state-approved and district adopted textbooks and instructional materials in all core academic areas. The district follows the state guidelines and cycles for textbook adoptions with new science materials purchased and implemented in the 2007-08 school year and new math texts in 2008-09. In 2009-10 we implemented the newly adopted English Language Arts textbooks. All students, including English Learners, have their own copy of textbooks. Textbooks and instructional materials are recommended for Board approval through a comprehensive process by a district-wide committee of teachers and administrators. Members of the public are invited to review recommended materials and make comments prior to Board approval.
Textbook and Instructional Materials List Textbooks and instructional materials used in the district in the core subject areas of English-Language Arts, Mathematics, Science, and History-Social Science.
Subject Area Textbook Title and/or Publisher Year of Adoption
English-Language Arts CA McDougal-Littell Literature 2009
History-Social Science History Alive 2006
Mathematics CA Mathematics Algebra/Holt, CA Mathematics Geometry/Holt, CA Mathematics/Holt
2008, 2008, 2008
Science Prentice Hall, Focus on Science 2007
School Accountability Report Card Reported for the 2009-10 School Year Published During 2010-11
6 Lincoln Middle Santa Monica-Malibu Unified
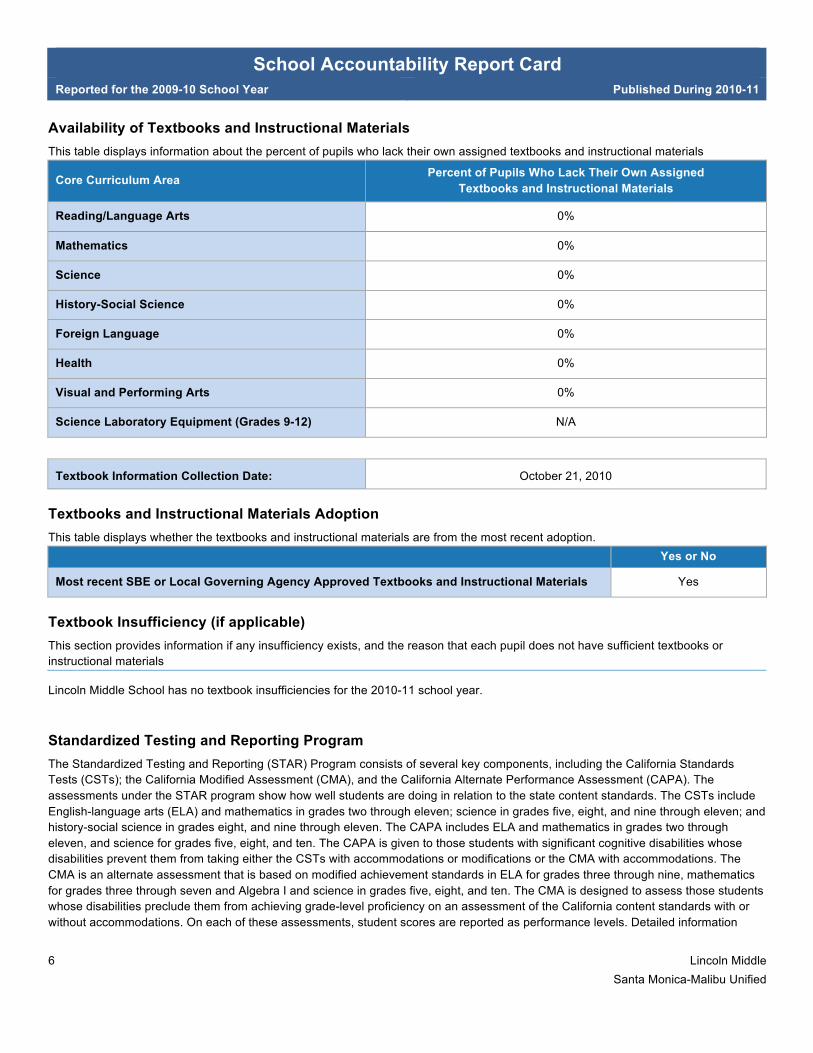
Availability of Textbooks and Instructional Materials This table displays information about the percent of pupils who lack their own assigned textbooks and instructional materials
Core Curriculum Area Percent of Pupils Who Lack Their Own Assigned Textbooks and Instructional Materials
Reading/Language Arts 0%
Mathematics 0%
Science 0%
History-Social Science 0%
Foreign Language 0%
Health 0%
Visual and Performing Arts 0%
Science Laboratory Equipment (Grades 9-12) N/A
Textbook Information Collection Date: October 21, 2010
Textbooks and Instructional Materials Adoption This table displays whether the textbooks and instructional materials are from the most recent adoption.
Yes or No
Most recent SBE or Local Governing Agency Approved Textbooks and Instructional Materials Yes
Textbook Insufficiency (if applicable) This section provides information if any insufficiency exists, and the reason that each pupil does not have sufficient textbooks or instructional materials
Lincoln Middle School has no textbook insufficiencies for the 2010-11 school year.
Standardized Testing and Reporting Program The Standardized Testing and Reporting (STAR) Program consists of several key components, including the California Standards Tests (CSTs); the California Modified Assessment (CMA), and the California Alternate Performance Assessment (CAPA). The assessments under the STAR program show how well students are doing in relation to the state content standards. The CSTs include English-language arts (ELA) and mathematics in grades two through eleven; science in grades five, eight, and nine through eleven; and history-social science in grades eight, and nine through eleven. The CAPA includes ELA and mathematics in grades two through eleven, and science for grades five, eight, and ten. The CAPA is given to those students with significant cognitive disabilities whose disabilities prevent them from taking either the CSTs with accommodations or modifications or the CMA with accommodations. The CMA is an alternate assessment that is based on modified achievement standards in ELA for grades three through nine, mathematics for grades three through seven and Algebra I and science in grades five, eight, and ten. The CMA is designed to assess those students whose disabilities preclude them from achieving grade-level proficiency on an assessment of the California content standards with or without accommodations. On each of these assessments, student scores are reported as performance levels. Detailed information
School Accountability Report Card Reported for the 2009-10 School Year Published During 2010-11
7 Lincoln Middle Santa Monica-Malibu Unified
regarding the STAR Program results for each grade and performance level, including the percent of students not tested, can be found on the CDE Standardized Testing and Reporting (STAR) Results Web site at http://star.cde.ca.gov.
*Note: Scores are not shown when the number of students tested is ten or less, either because the number of students in this category is too small for statistical accuracy or to protect student privacy. In no case shall any group score be reported that would deliberately or inadvertently make public the score or performance of any individual student.
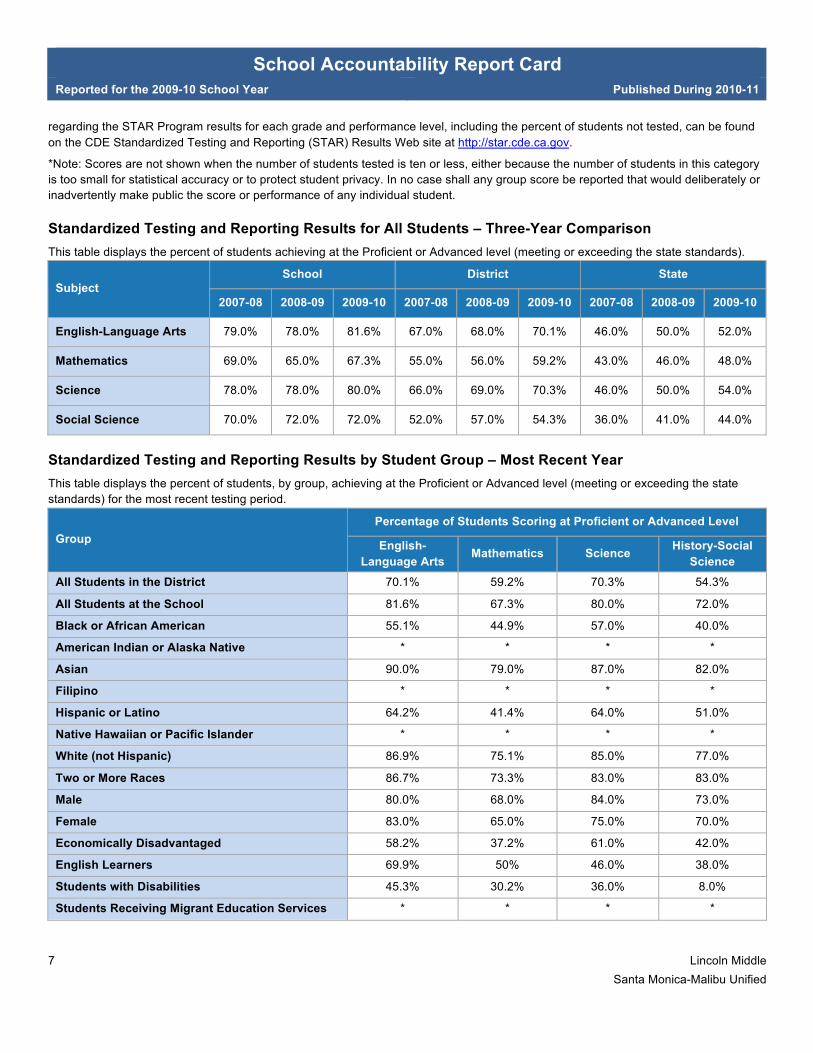
Standardized Testing and Reporting Results for All Students – Three-Year Comparison This table displays the percent of students achieving at the Proficient or Advanced level (meeting or exceeding the state standards).
School District State Subject
2007-08 2008-09 2009-10 2007-08 2008-09 2009-10 2007-08 2008-09 2009-10
English-Language Arts 79.0% 78.0% 81.6% 67.0% 68.0% 70.1% 46.0% 50.0% 52.0%
Mathematics 69.0% 65.0% 67.3% 55.0% 56.0% 59.2% 43.0% 46.0% 48.0%
Science 78.0% 78.0% 80.0% 66.0% 69.0% 70.3% 46.0% 50.0% 54.0%
Social Science 70.0% 72.0% 72.0% 52.0% 57.0% 54.3% 36.0% 41.0% 44.0%
Standardized Testing and Reporting Results by Student Group – Most Recent Year This table displays the percent of students, by group, achieving at the Proficient or Advanced level (meeting or exceeding the state standards) for the most recent testing period.
Percentage of Students Scoring at Proficient or Advanced Level Group English-
Language Arts Mathematics Science History-Social
Science All Students in the District 70.1% 59.2% 70.3% 54.3%
All Students at the School 81.6% 67.3% 80.0% 72.0%
Black or African American 55.1% 44.9% 57.0% 40.0%
American Indian or Alaska Native * * * *
Asian 90.0% 79.0% 87.0% 82.0%
Filipino * * * *
Hispanic or Latino 64.2% 41.4% 64.0% 51.0%
Native Hawaiian or Pacific Islander * * * *
White (not Hispanic) 86.9% 75.1% 85.0% 77.0%
Two or More Races 86.7% 73.3% 83.0% 83.0%
Male 80.0% 68.0% 84.0% 73.0%
Female 83.0% 65.0% 75.0% 70.0%
Economically Disadvantaged 58.2% 37.2% 61.0% 42.0%
English Learners 69.9% 50% 46.0% 38.0%
Students with Disabilities 45.3% 30.2% 36.0% 8.0%
Students Receiving Migrant Education Services * * * *
School Accountability Report Card Reported for the 2009-10 School Year Published During 2010-11
8 Lincoln Middle Santa Monica-Malibu Unified
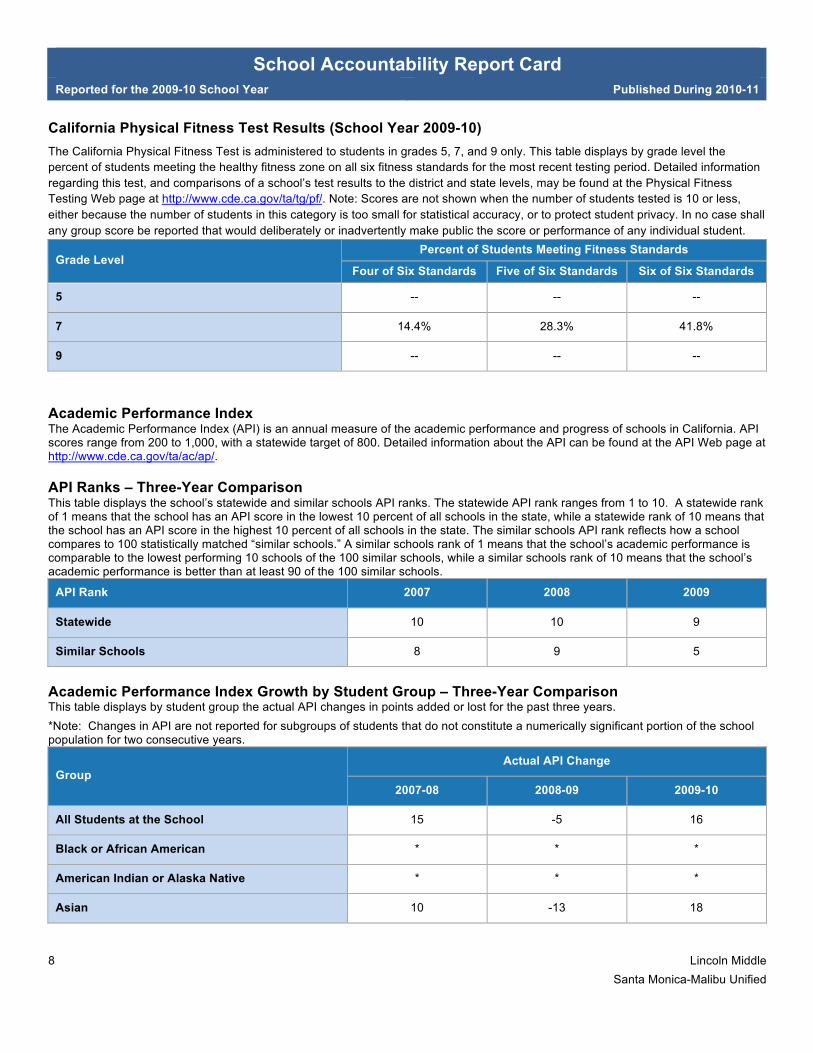
California Physical Fitness Test Results (School Year 2009-10) The California Physical Fitness Test is administered to students in grades 5, 7, and 9 only. This table displays by grade level the percent of students meeting the healthy fitness zone on all six fitness standards for the most recent testing period. Detailed information regarding this test, and comparisons of a school’s test results to the district and state levels, may be found at the Physical Fitness Testing Web page at http://www.cde.ca.gov/ta/tg/pf/. Note: Scores are not shown when the number of students tested is 10 or less, either because the number of students in this category is too small for statistical accuracy, or to protect student privacy. In no case shall any group score be reported that would deliberately or inadvertently make public the score or performance of any individual student.
Percent of Students Meeting Fitness Standards Grade Level
Four of Six Standards Five of Six Standards Six of Six Standards
5 -- -- --
7 14.4% 28.3% 41.8%
9 -- -- --
Academic Performance Index The Academic Performance Index (API) is an annual measure of the academic performance and progress of schools in California. API scores range from 200 to 1,000, with a statewide target of 800. Detailed information about the API can be found at the API Web page at http://www.cde.ca.gov/ta/ac/ap/.
API Ranks – Three-Year Comparison This table displays the school’s statewide and similar schools API ranks. The statewide API rank ranges from 1 to 10. A statewide rank of 1 means that the school has an API score in the lowest 10 percent of all schools in the state, while a statewide rank of 10 means that the school has an API score in the highest 10 percent of all schools in the state. The similar schools API rank reflects how a school compares to 100 statistically matched “similar schools.” A similar schools rank of 1 means that the school’s academic performance is comparable to the lowest performing 10 schools of the 100 similar schools, while a similar schools rank of 10 means that the school’s academic performance is better than at least 90 of the 100 similar schools.
API Rank 2007 2008 2009
Statewide 10 10 9
Similar Schools 8 9 5
Academic Performance Index Growth by Student Group – Three-Year Comparison This table displays by student group the actual API changes in points added or lost for the past three years. *Note: Changes in API are not reported for subgroups of students that do not constitute a numerically significant portion of the school population for two consecutive years.
Actual API Change Group
2007-08 2008-09 2009-10
All Students at the School 15 -5 16
Black or African American * * *
American Indian or Alaska Native * * *
Asian 10 -13 18
School Accountability Report Card Reported for the 2009-10 School Year Published During 2010-11
9 Lincoln Middle Santa Monica-Malibu Unified
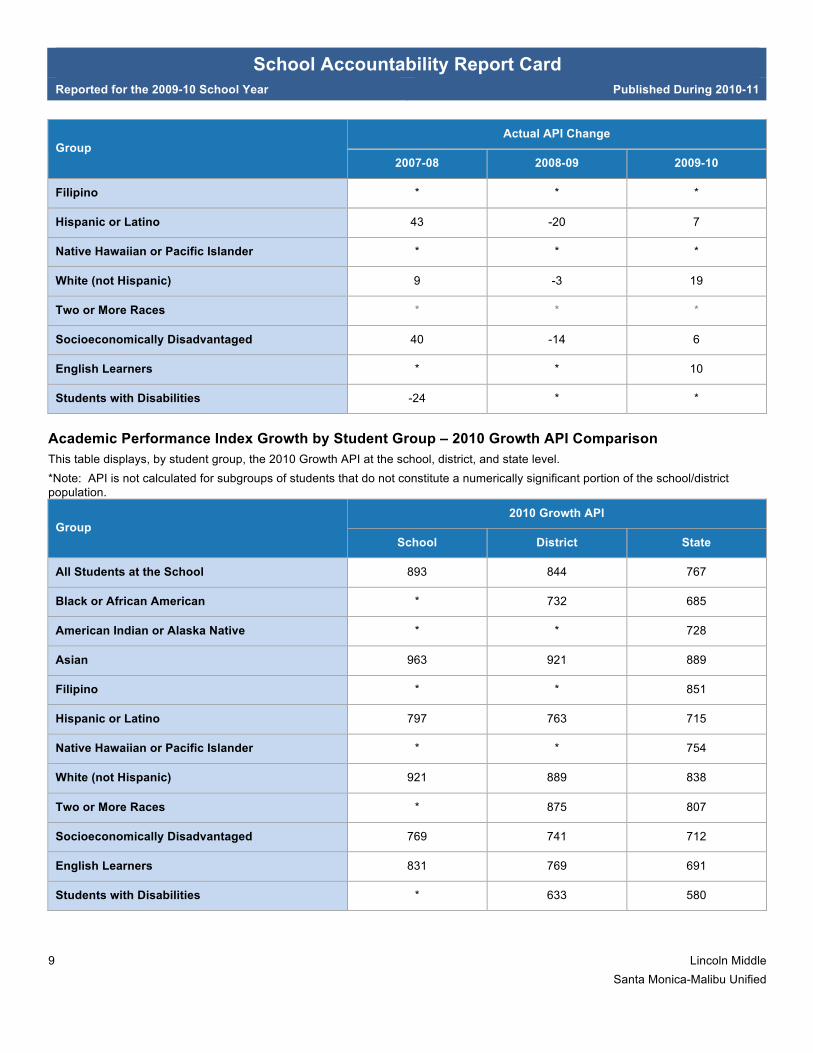
Actual API Change Group
2007-08 2008-09 2009-10
Filipino * * *
Hispanic or Latino 43 -20 7
Native Hawaiian or Pacific Islander * * *
White (not Hispanic) 9 -3 19
Two or More Races * * *
Socioeconomically Disadvantaged 40 -14 6
English Learners * * 10
Students with Disabilities -24 * *
Academic Performance Index Growth by Student Group – 2010 Growth API Comparison This table displays, by student group, the 2010 Growth API at the school, district, and state level. *Note: API is not calculated for subgroups of students that do not constitute a numerically significant portion of the school/district population.
2010 Growth API Group
School District State
All Students at the School 893 844 767
Black or African American * 732 685
American Indian or Alaska Native * * 728
Asian 963 921 889
Filipino * * 851
Hispanic or Latino 797 763 715
Native Hawaiian or Pacific Islander * * 754
White (not Hispanic) 921 889 838
Two or More Races * 875 807
Socioeconomically Disadvantaged 769 741 712
English Learners 831 769 691
Students with Disabilities * 633 580
School Accountability Report Card Reported for the 2009-10 School Year Published During 2010-11
10 Lincoln Middle Santa Monica-Malibu Unified
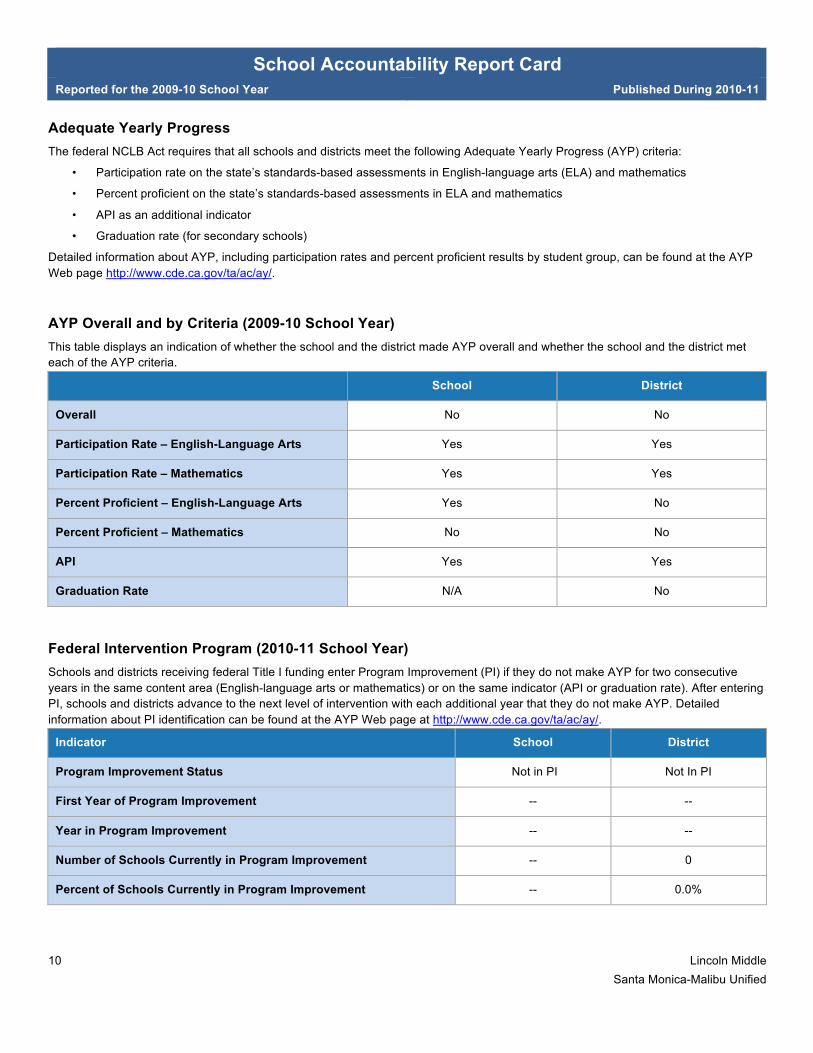
Adequate Yearly Progress The federal NCLB Act requires that all schools and districts meet the following Adequate Yearly Progress (AYP) criteria:
• Participation rate on the state’s standards-based assessments in English-language arts (ELA) and mathematics
• Percent proficient on the state’s standards-based assessments in ELA and mathematics
• API as an additional indicator
• Graduation rate (for secondary schools)
Detailed information about AYP, including participation rates and percent proficient results by student group, can be found at the AYP Web page http://www.cde.ca.gov/ta/ac/ay/.
AYP Overall and by Criteria (2009-10 School Year) This table displays an indication of whether the school and the district made AYP overall and whether the school and the district met each of the AYP criteria.
School District
Overall No No
Participation Rate – English-Language Arts Yes Yes
Participation Rate – Mathematics Yes Yes
Percent Proficient – English-Language Arts Yes No
Percent Proficient – Mathematics No No
API Yes Yes
Graduation Rate N/A No
Federal Intervention Program (2010-11 School Year) Schools and districts receiving federal Title I funding enter Program Improvement (PI) if they do not make AYP for two consecutive years in the same content area (English-language arts or mathematics) or on the same indicator (API or graduation rate). After entering PI, schools and districts advance to the next level of intervention with each additional year that they do not make AYP. Detailed information about PI identification can be found at the AYP Web page at http://www.cde.ca.gov/ta/ac/ay/.
Indicator School District
Program Improvement Status Not in PI Not In PI
First Year of Program Improvement -- --
Year in Program Improvement -- --
Number of Schools Currently in Program Improvement -- 0
Percent of Schools Currently in Program Improvement -- 0.0%
School Accountability Report Card Reported for the 2009-10 School Year Published During 2010-11
11 Lincoln Middle Santa Monica-Malibu Unified
IV. Teachers & Support Staff
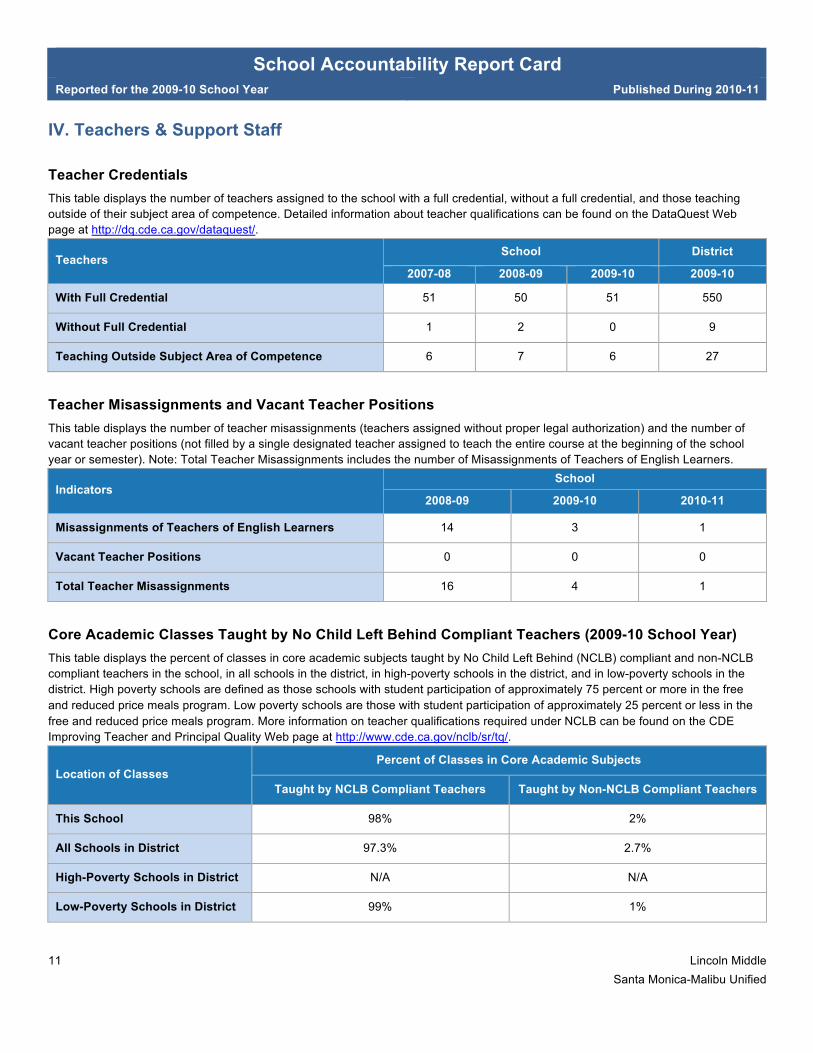
Teacher Credentials This table displays the number of teachers assigned to the school with a full credential, without a full credential, and those teaching outside of their subject area of competence. Detailed information about teacher qualifications can be found on the DataQuest Web page at http://dq.cde.ca.gov/dataquest/.
School District Teachers
2007-08 2008-09 2009-10 2009-10
With Full Credential 51 50 51 550
Without Full Credential 1 2 0 9
Teaching Outside Subject Area of Competence 6 7 6 27
Teacher Misassignments and Vacant Teacher Positions This table displays the number of teacher misassignments (teachers assigned without proper legal authorization) and the number of vacant teacher positions (not filled by a single designated teacher assigned to teach the entire course at the beginning of the school year or semester). Note: Total Teacher Misassignments includes the number of Misassignments of Teachers of English Learners.
School Indicators
2008-09 2009-10 2010-11
Misassignments of Teachers of English Learners 14 3 1
Vacant Teacher Positions 0 0 0
Total Teacher Misassignments 16 4 1
Core Academic Classes Taught by No Child Left Behind Compliant Teachers (2009-10 School Year) This table displays the percent of classes in core academic subjects taught by No Child Left Behind (NCLB) compliant and non-NCLB compliant teachers in the school, in all schools in the district, in high-poverty schools in the district, and in low-poverty schools in the district. High poverty schools are defined as those schools with student participation of approximately 75 percent or more in the free and reduced price meals program. Low poverty schools are those with student participation of approximately 25 percent or less in the free and reduced price meals program. More information on teacher qualifications required under NCLB can be found on the CDE Improving Teacher and Principal Quality Web page at http://www.cde.ca.gov/nclb/sr/tq/.
Percent of Classes in Core Academic Subjects Location of Classes
Taught by NCLB Compliant Teachers Taught by Non-NCLB Compliant Teachers
This School 98% 2%
All Schools in District 97.3% 2.7%
High-Poverty Schools in District N/A N/A
Low-Poverty Schools in District 99% 1%
School Accountability Report Card Reported for the 2009-10 School Year Published During 2010-11
12 Lincoln Middle Santa Monica-Malibu Unified
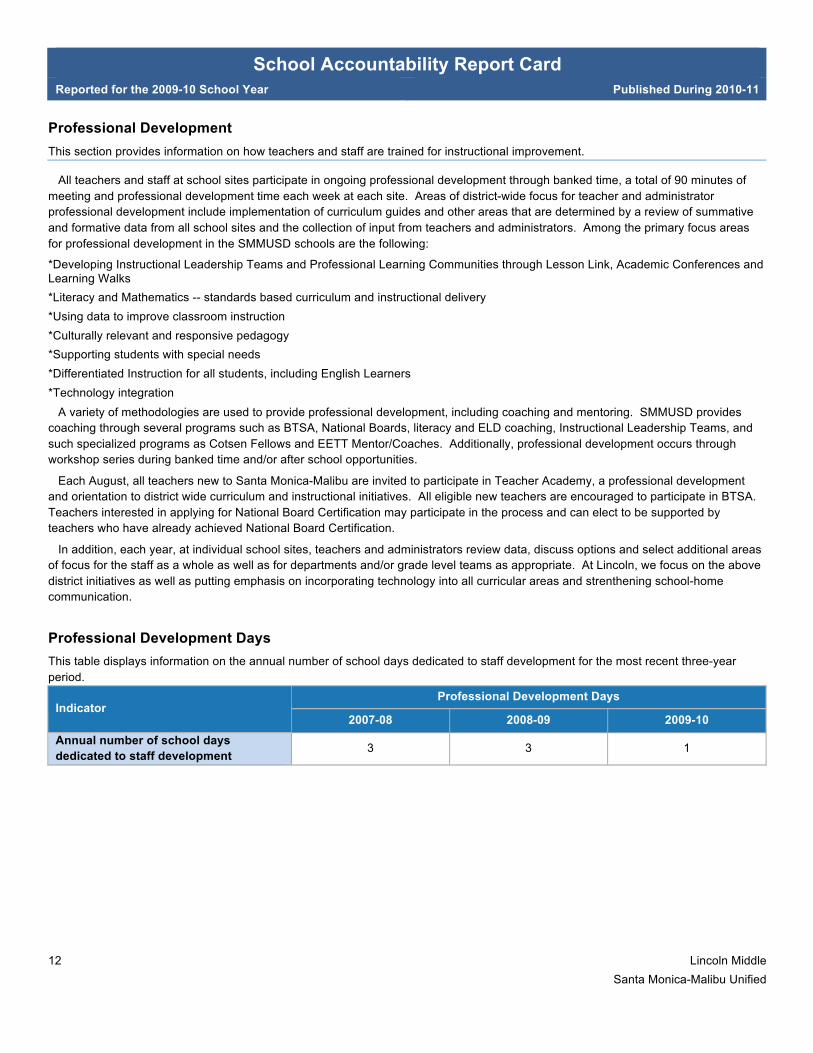
Professional Development This section provides information on how teachers and staff are trained for instructional improvement.
All teachers and staff at school sites participate in ongoing professional development through banked time, a total of 90 minutes of meeting and professional development time each week at each site. Areas of district-wide focus for teacher and administrator professional development include implementation of curriculum guides and other areas that are determined by a review of summative and formative data from all school sites and the collection of input from teachers and administrators. Among the primary focus areas for professional development in the SMMUSD schools are the following:
*Developing Instructional Leadership Teams and Professional Learning Communities through Lesson Link, Academic Conferences and Learning Walks *Literacy and Mathematics -- standards based curriculum and instructional delivery *Using data to improve classroom instruction *Culturally relevant and responsive pedagogy *Supporting students with special needs *Differentiated Instruction for all students, including English Learners *Technology integration A variety of methodologies are used to provide professional development, including coaching and mentoring. SMMUSD provides coaching through several programs such as BTSA, National Boards, literacy and ELD coaching, Instructional Leadership Teams, and such specialized programs as Cotsen Fellows and EETT Mentor/Coaches. Additionally, professional development occurs through workshop series during banked time and/or after school opportunities.
Each August, all teachers new to Santa Monica-Malibu are invited to participate in Teacher Academy, a professional development and orientation to district wide curriculum and instructional initiatives. All eligible new teachers are encouraged to participate in BTSA. Teachers interested in applying for National Board Certification may participate in the process and can elect to be supported by teachers who have already achieved National Board Certification.
In addition, each year, at individual school sites, teachers and administrators review data, discuss options and select additional areas of focus for the staff as a whole as well as for departments and/or grade level teams as appropriate. At Lincoln, we focus on the above district initiatives as well as putting emphasis on incorporating technology into all curricular areas and strenthening school-home communication.
Professional Development Days This table displays information on the annual number of school days dedicated to staff development for the most recent three-year period.
Professional Development Days Indicator
2007-08 2008-09 2009-10 Annual number of school days dedicated to staff development 3 3 1
School Accountability Report Card Reported for the 2009-10 School Year Published During 2010-11
13 Lincoln Middle Santa Monica-Malibu Unified
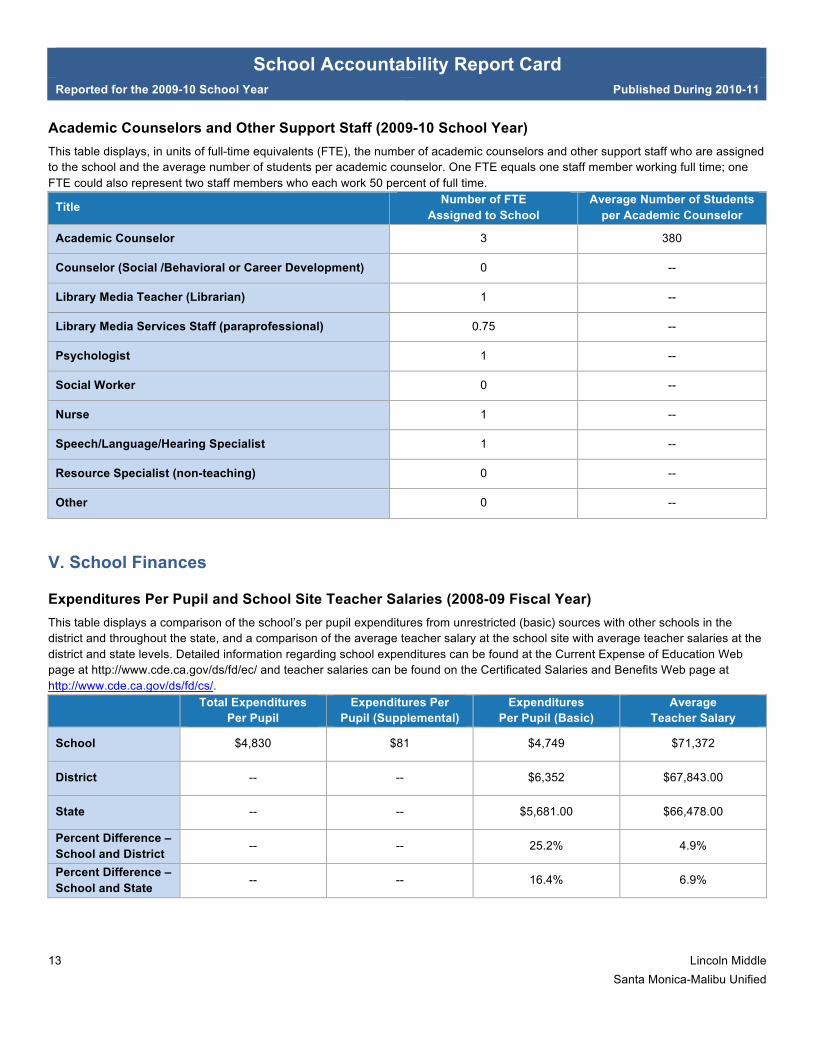
Academic Counselors and Other Support Staff (2009-10 School Year) This table displays, in units of full-time equivalents (FTE), the number of academic counselors and other support staff who are assigned to the school and the average number of students per academic counselor. One FTE equals one staff member working full time; one FTE could also represent two staff members who each work 50 percent of full time.
Title Number of FTE Assigned to School
Average Number of Students per Academic Counselor
Academic Counselor 3 380
Counselor (Social /Behavioral or Career Development) 0 --
Library Media Teacher (Librarian) 1 --
Library Media Services Staff (paraprofessional) 0.75 --
Psychologist 1 --
Social Worker 0 --
Nurse 1 --
Speech/Language/Hearing Specialist 1 --
Resource Specialist (non-teaching) 0 --
Other 0 --
V. School Finances
Expenditures Per Pupil and School Site Teacher Salaries (2008-09 Fiscal Year) This table displays a comparison of the school’s per pupil expenditures from unrestricted (basic) sources with other schools in the district and throughout the state, and a comparison of the average teacher salary at the school site with average teacher salaries at the district and state levels. Detailed information regarding school expenditures can be found at the Current Expense of Education Web page at http://www.cde.ca.gov/ds/fd/ec/ and teacher salaries can be found on the Certificated Salaries and Benefits Web page at http://www.cde.ca.gov/ds/fd/cs/.
Total Expenditures Per Pupil
Expenditures Per Pupil (Supplemental)
Expenditures Per Pupil (Basic)
Average Teacher Salary
School $4,830 $81 $4,749 $71,372
District -- -- $6,352 $67,843.00
State -- -- $5,681.00 $66,478.00
Percent Difference – School and District
-- -- 25.2% 4.9%
Percent Difference – School and State
-- -- 16.4% 6.9%
School Accountability Report Card Reported for the 2009-10 School Year Published During 2010-11
14 Lincoln Middle Santa Monica-Malibu Unified
Types of Services Funded (2009-10 Fiscal Year) This section provides information about the programs and supplemental services that are available at the school and funded through either categorical or other sources.
We use Lottery Funds to purchase supplemental instructional materials for our core classes as well as for AVID (Advancement Via Individual Achievement) and ELD (English Language Development) programs.
Our School and Library Improvement Funds help provide our teachers with professional development opportunities such as participating in Lesson Link, Learning Walks, attending conferences, grading and norming. These funds cover subs needed, hourly teacher pay and/or conference and travel monies.
We use Equity Fund and Gift Money to support New School Yard Productions (which is a dee jay group that works with at risk students to give them a positive outlet); AVID (for program support, conference and travel for training, field trips for students and paying college aged tutors); and our Transition Program with our elementary feeder schools so that the transition from 5th to 6th grade is as smooth as possible.
Our PTSA generously provides teachers accounts to purchase extra supplies that are not covered by the school, copiers, technology (such as response clickers in our science classrooms to provide immediate feedback for experiment purposes) as well as many other activities including parent educational evenings, grade level enrichment activities in history, core projects and reward activities and more!
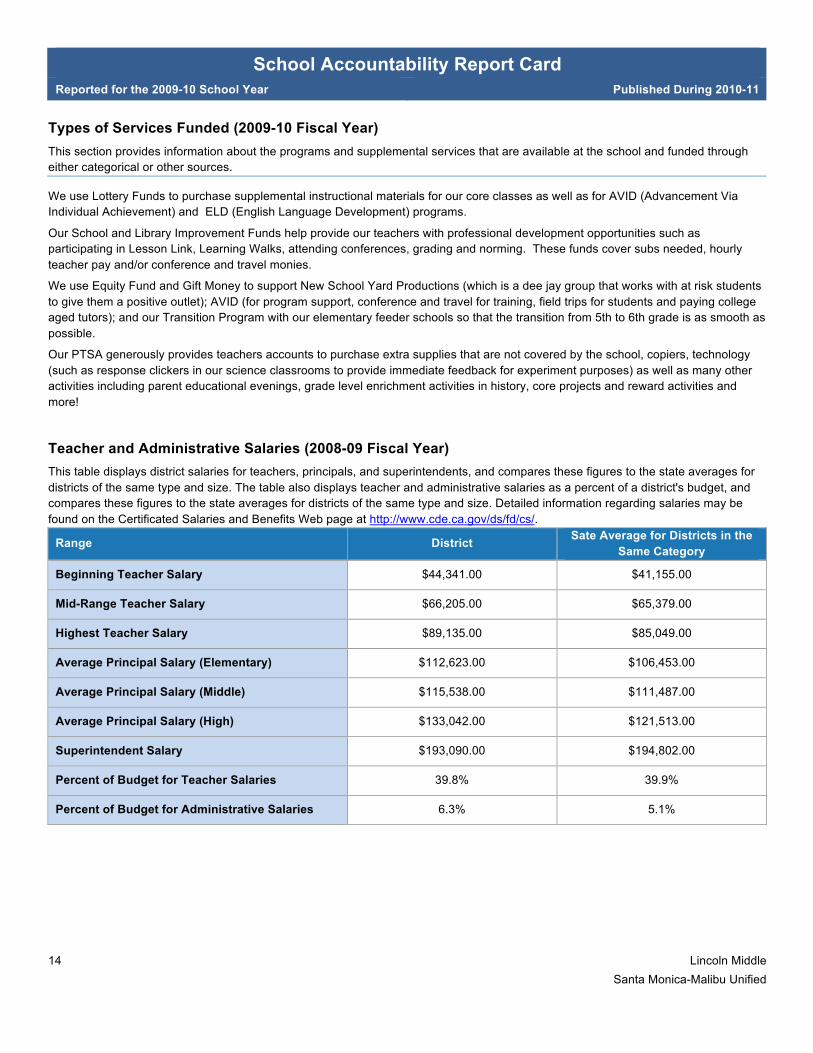
Teacher and Administrative Salaries (2008-09 Fiscal Year) This table displays district salaries for teachers, principals, and superintendents, and compares these figures to the state averages for districts of the same type and size. The table also displays teacher and administrative salaries as a percent of a district's budget, and compares these figures to the state averages for districts of the same type and size. Detailed information regarding salaries may be found on the Certificated Salaries and Benefits Web page at http://www.cde.ca.gov/ds/fd/cs/.
Range District Sate Average for Districts in the Same Category
Beginning Teacher Salary $44,341.00 $41,155.00
Mid-Range Teacher Salary $66,205.00 $65,379.00
Highest Teacher Salary $89,135.00 $85,049.00
Average Principal Salary (Elementary) $112,623.00 $106,453.00
Average Principal Salary (Middle) $115,538.00 $111,487.00
Average Principal Salary (High) $133,042.00 $121,513.00
Superintendent Salary $193,090.00 $194,802.00
Percent of Budget for Teacher Salaries 39.8% 39.9%
Percent of Budget for Administrative Salaries 6.3% 5.1%
School Accountability Report Card Reported for the 2009-10 School Year Published During 2010-11
15 Lincoln Middle Santa Monica-Malibu Unified
VI. Data and Access
DataQuest DataQuest is an online data tool located at http://dq.cde.ca.gov/dataquest/ that contains additional information about this school and comparisons of the school to the district, the county, and the state. Specifically, DataQuest is a dynamic system that provides reports for accountability (e.g. Academic Performance Index [API], Adequate Yearly Progress [AYP], test data, enrollment, graduates, dropouts, course enrollments, staffing, and data regarding English learners.
Internet Access Internet access is available at public libraries and other locations that are publicly accessible (e.g., the California State Library). Access to the Internet at libraries and public locations is generally provided on a first-come, first-served basis. Other use restrictions include the hours of operation, the length of time that a workstation may be used (depending on availability), the types of software programs available on a workstation, and the ability to print documents.