Embed Size (px)
Citation preview
SCHOOL BASED FACTORS INFLUENCING IMPLEMENTATION OF
TEACHERS PERFORMANCE APPRAISAL DEVELOPMENT IN PUBLIC
PRIMARY SCHOOLS IN KIENI –EAST- SUB-COUNTY, KENYA
Macharia Francis Muthee
A Research Project Submitted for Registration in Partial Fulfillment of the
Requirements for the Degree of Master of Education on Corporate Governance
University of Nairobi
2020
ii
DECLARATION
This research project is my original work and has not been presented for a degree in any
university
………………………………
Macharia Francis Muthee
E55/89806/2016
This research project has been submitted for registration with our approval as University
supervisors.
……………………………………
Dr. Phylisters Daizy Matula
Lecturer
Department of Education Administration and Planning,
University of Nairobi
…………………………………
Dr. Sr. Petronilla Kingi
Lecturer
Department of Education Administration and Planning,
University of Nairobi
iii
DEDICATION
I wish to dedicate this report to my late parents, Mr. Paul Macharia and Mrs. Margret
Wangu Macharia whose unconditional love, support encouragement and understanding
have always served as the pillar from which I draw my strength.
Thanks to my sister Mrs. Jecinta Wahome for her moral and financial support and her
encouragement, not forgetting my sister Evelyn, my daughters Caroline Wangu and
Doreen Muthoni for their moral support.
iv
ACKNOWLEDGMENT
I am grateful to God the almighty for giving me the strength, intellect and inspiration for
taking me this far. I wish to acknowledge the following people for their unwavering and
inspiring efforts and support they have accorded me. This study would not have been
accomplished were it not for the input, counsel and patience of my supervisors Dr.
Phylisters Daizy Matula and Sr. Dr. Petronilla M. Kingi. My sincere heartfelt gratitude
goes to my two kids: Dorean Muthoni and Caroline Wangu. Special thanks to my head
teacher Mr Gitonga and other teachers for the support they accorded me.
v
TABLE OF CONTENTS
DECLARATION ............................................................................................................... ii
DEDICATION .................................................................................................................. iii
ACKNOWLEDGMENT .................................................................................................. iv
TABLE OF CONTENTS .................................................................................................. v
LIST OF TABLES ............................................................................................................ ix
LIST OF FIGURES .......................................................................................................... xi
LIST OF ABBREVIATIONS AND ACRONYMS ....................................................... xii
ABSTRACT ..................................................................................................................... xiii
CHAPTER ONE ................................................................................................................ 1
INTRODUCTION ............................................................................................................. 1
1.1 Background of the Study ............................................................................................ 1
1.2 Statement of the Problem ........................................................................................... 4
1.3 Purpose of the Study .................................................................................................. 5
1.4 Research Objectives ................................................................................................... 5
1.5 Research Questions .................................................................................................... 5
1.6 Hypothesis .................................................................................................................. 6
1.7 Significance of Study ................................................................................................. 6
1.8 Limitations of the Study ............................................................................................. 7
1.9 Delimitation of the Study ........................................................................................... 8
1.10 Basic assumptions .................................................................................................... 8
1.11 Definition of significant terms ................................................................................. 8
1.12 Organization of the study ......................................................................................... 9
CHAPTER TWO ............................................................................................................. 10
LITERATURE REVIEW ............................................................................................... 10
vi
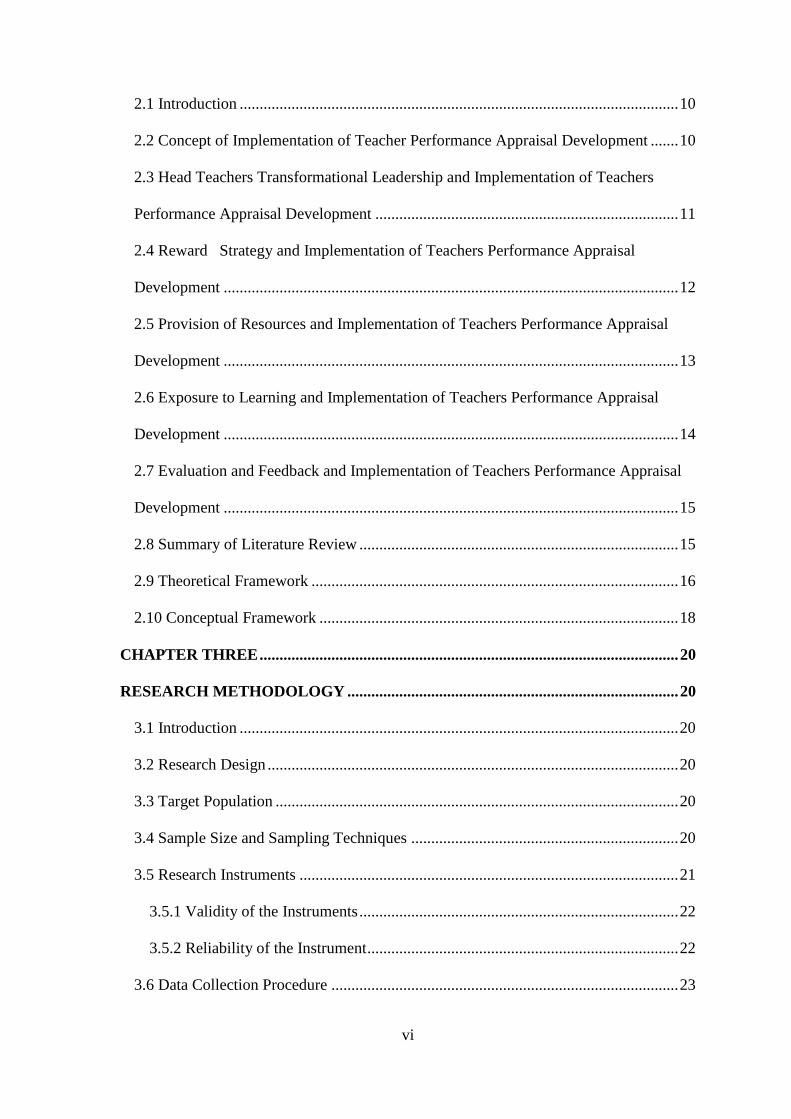
2.1 Introduction .............................................................................................................. 10
2.2 Concept of Implementation of Teacher Performance Appraisal Development ....... 10
2.3 Head Teachers Transformational Leadership and Implementation of Teachers
Performance Appraisal Development ............................................................................ 11
2.4 Reward Strategy and Implementation of Teachers Performance Appraisal
Development .................................................................................................................. 12
2.5 Provision of Resources and Implementation of Teachers Performance Appraisal
Development .................................................................................................................. 13
2.6 Exposure to Learning and Implementation of Teachers Performance Appraisal
Development .................................................................................................................. 14
2.7 Evaluation and Feedback and Implementation of Teachers Performance Appraisal
Development .................................................................................................................. 15
2.8 Summary of Literature Review ................................................................................ 15
2.9 Theoretical Framework ............................................................................................ 16
2.10 Conceptual Framework .......................................................................................... 18
CHAPTER THREE ......................................................................................................... 20
RESEARCH METHODOLOGY ................................................................................... 20
3.1 Introduction .............................................................................................................. 20
3.2 Research Design ....................................................................................................... 20
3.3 Target Population ..................................................................................................... 20
3.4 Sample Size and Sampling Techniques ................................................................... 20
3.5 Research Instruments ............................................................................................... 21
3.5.1 Validity of the Instruments ................................................................................ 22
3.5.2 Reliability of the Instrument .............................................................................. 22
3.6 Data Collection Procedure ....................................................................................... 23
vii
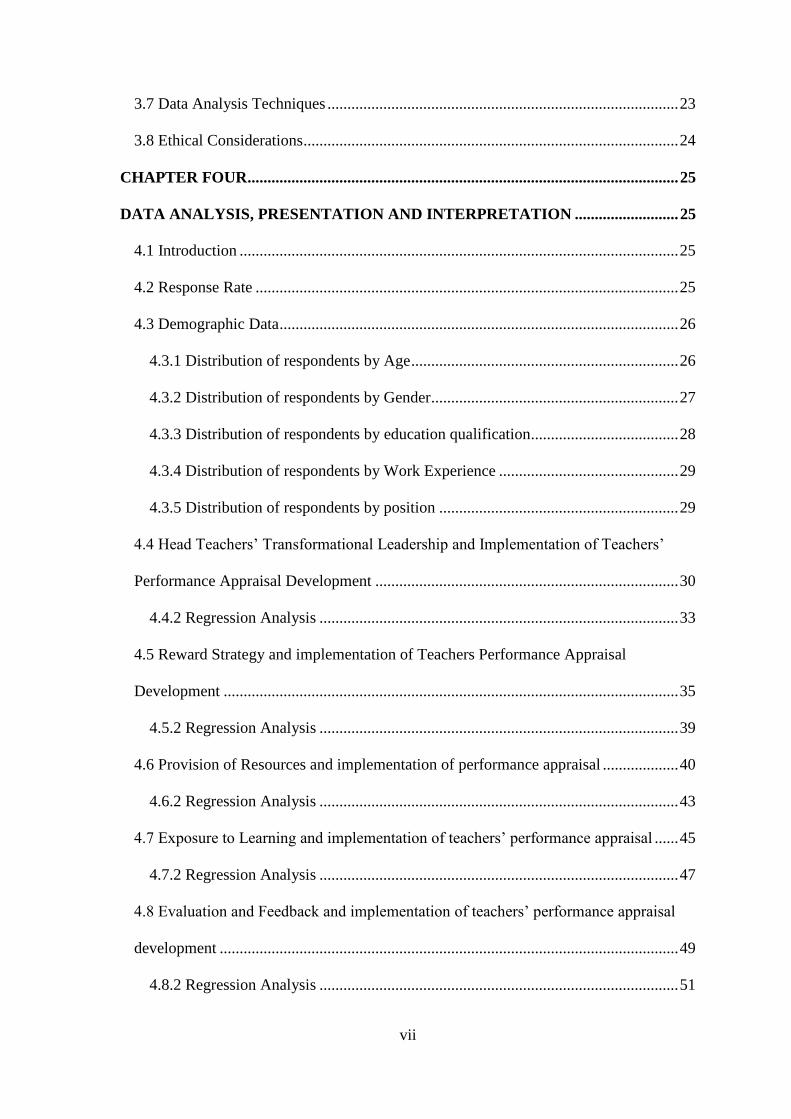
3.7 Data Analysis Techniques ........................................................................................ 23
3.8 Ethical Considerations .............................................................................................. 24
CHAPTER FOUR ............................................................................................................ 25
DATA ANALYSIS, PRESENTATION AND INTERPRETATION .......................... 25
4.1 Introduction .............................................................................................................. 25
4.2 Response Rate .......................................................................................................... 25
4.3 Demographic Data .................................................................................................... 26
4.3.1 Distribution of respondents by Age ................................................................... 26
4.3.2 Distribution of respondents by Gender .............................................................. 27
4.3.3 Distribution of respondents by education qualification ..................................... 28
4.3.4 Distribution of respondents by Work Experience ............................................. 29
4.3.5 Distribution of respondents by position ............................................................ 29
4.4 Head Teachers’ Transformational Leadership and Implementation of Teachers’
Performance Appraisal Development ............................................................................ 30
4.4.2 Regression Analysis .......................................................................................... 33
4.5 Reward Strategy and implementation of Teachers Performance Appraisal
Development .................................................................................................................. 35
4.5.2 Regression Analysis .......................................................................................... 39
4.6 Provision of Resources and implementation of performance appraisal ................... 40
4.6.2 Regression Analysis .......................................................................................... 43
4.7 Exposure to Learning and implementation of teachers’ performance appraisal ...... 45
4.7.2 Regression Analysis .......................................................................................... 47
4.8 Evaluation and Feedback and implementation of teachers’ performance appraisal
development ................................................................................................................... 49
4.8.2 Regression Analysis .......................................................................................... 51
viii
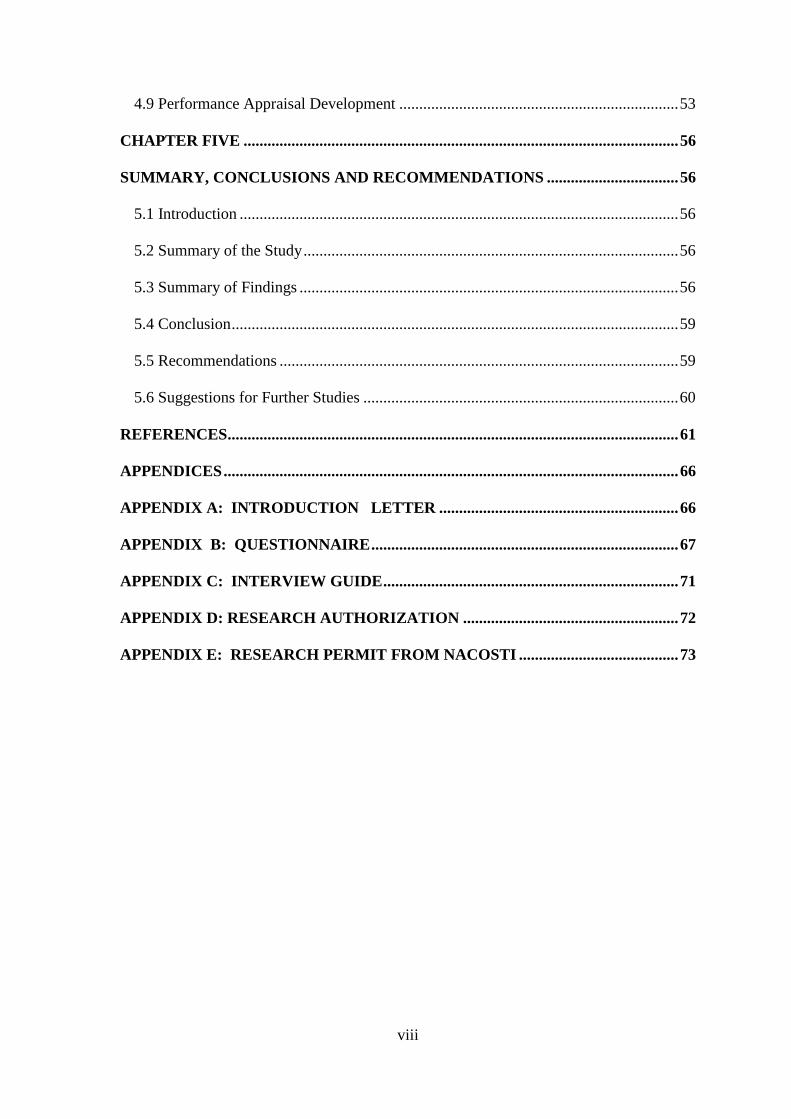
4.9 Performance Appraisal Development ...................................................................... 53
CHAPTER FIVE ............................................................................................................. 56
SUMMARY, CONCLUSIONS AND RECOMMENDATIONS ................................. 56
5.1 Introduction .............................................................................................................. 56
5.2 Summary of the Study .............................................................................................. 56
5.3 Summary of Findings ............................................................................................... 56
5.4 Conclusion ................................................................................................................ 59
5.5 Recommendations .................................................................................................... 59
5.6 Suggestions for Further Studies ............................................................................... 60
REFERENCES ................................................................................................................. 61
APPENDICES .................................................................................................................. 66
APPENDIX A: INTRODUCTION LETTER ............................................................ 66
APPENDIX B: QUESTIONNAIRE ............................................................................. 67
APPENDIX C: INTERVIEW GUIDE .......................................................................... 71
APPENDIX D: RESEARCH AUTHORIZATION ...................................................... 72
APPENDIX E: RESEARCH PERMIT FROM NACOSTI ........................................ 73
ix
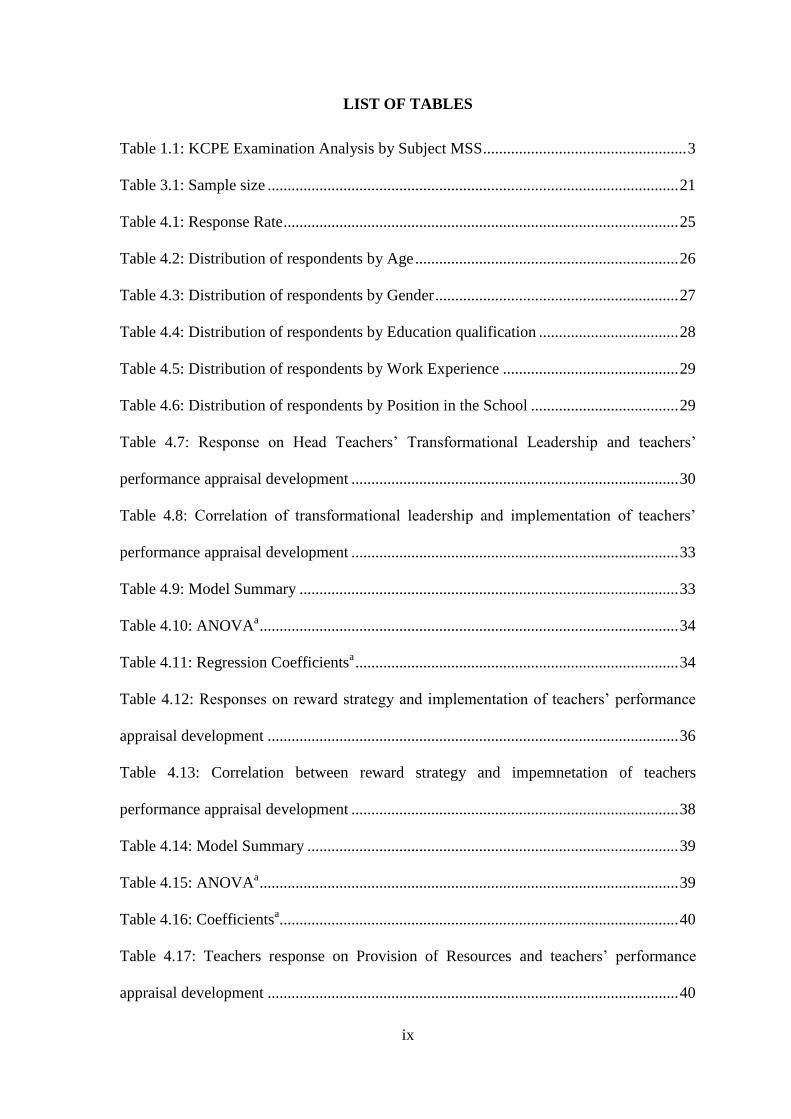
LIST OF TABLES
Table 1.1: KCPE Examination Analysis by Subject MSS ................................................... 3
Table 3.1: Sample size ....................................................................................................... 21
Table 4.1: Response Rate ................................................................................................... 25
Table 4.2: Distribution of respondents by Age .................................................................. 26
Table 4.3: Distribution of respondents by Gender ............................................................. 27
Table 4.4: Distribution of respondents by Education qualification ................................... 28
Table 4.5: Distribution of respondents by Work Experience ............................................ 29
Table 4.6: Distribution of respondents by Position in the School ..................................... 29
Table 4.7: Response on Head Teachers’ Transformational Leadership and teachers’
performance appraisal development .................................................................................. 30
Table 4.8: Correlation of transformational leadership and implementation of teachers’
performance appraisal development .................................................................................. 33
Table 4.9: Model Summary ............................................................................................... 33
Table 4.10: ANOVAa ......................................................................................................... 34
Table 4.11: Regression Coefficientsa ................................................................................. 34
Table 4.12: Responses on reward strategy and implementation of teachers’ performance
appraisal development ....................................................................................................... 36
Table 4.13: Correlation between reward strategy and impemnetation of teachers
performance appraisal development .................................................................................. 38
Table 4.14: Model Summary ............................................................................................. 39
Table 4.15: ANOVAa ......................................................................................................... 39
Table 4.16: Coefficientsa .................................................................................................... 40
Table 4.17: Teachers response on Provision of Resources and teachers’ performance
appraisal development ....................................................................................................... 40
x
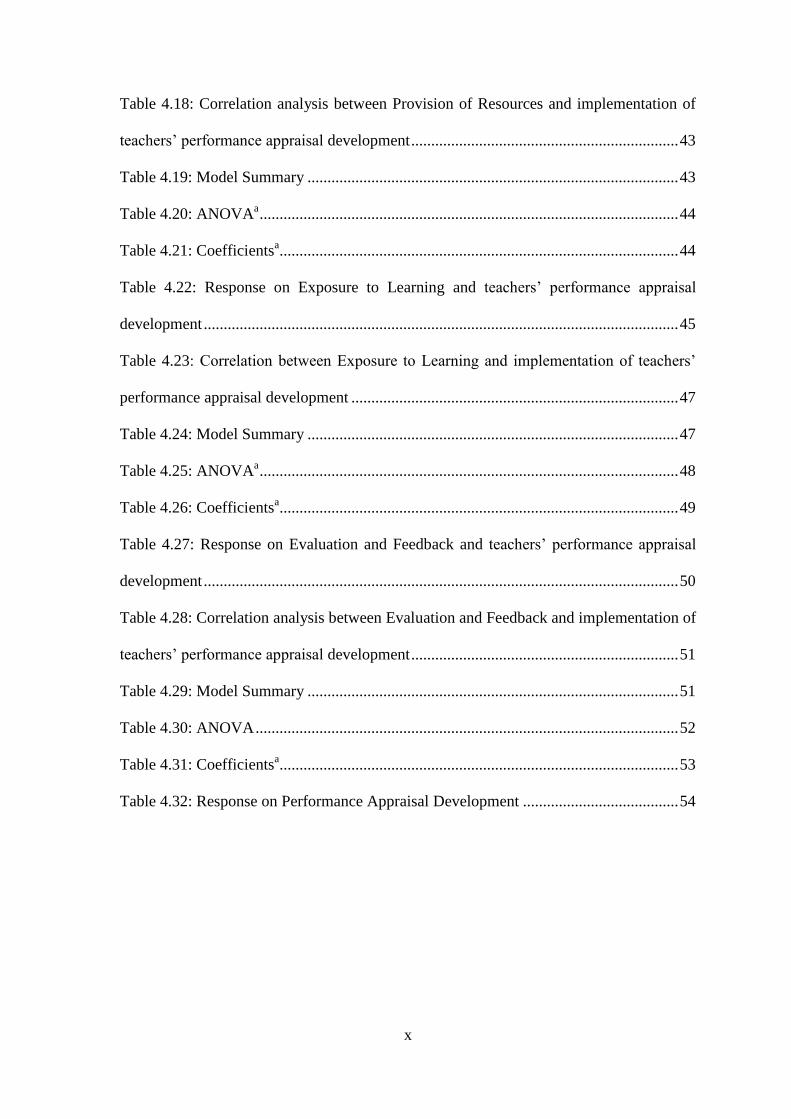
Table 4.18: Correlation analysis between Provision of Resources and implementation of
teachers’ performance appraisal development ................................................................... 43
Table 4.19: Model Summary ............................................................................................. 43
Table 4.20: ANOVAa ......................................................................................................... 44
Table 4.21: Coefficientsa .................................................................................................... 44
Table 4.22: Response on Exposure to Learning and teachers’ performance appraisal
development ....................................................................................................................... 45
Table 4.23: Correlation between Exposure to Learning and implementation of teachers’
performance appraisal development .................................................................................. 47
Table 4.24: Model Summary ............................................................................................. 47
Table 4.25: ANOVAa ......................................................................................................... 48
Table 4.26: Coefficientsa .................................................................................................... 49
Table 4.27: Response on Evaluation and Feedback and teachers’ performance appraisal
development ....................................................................................................................... 50
Table 4.28: Correlation analysis between Evaluation and Feedback and implementation of
teachers’ performance appraisal development ................................................................... 51
Table 4.29: Model Summary ............................................................................................. 51
Table 4.30: ANOVA .......................................................................................................... 52
Table 4.31: Coefficientsa .................................................................................................... 53
Table 4.32: Response on Performance Appraisal Development ....................................... 54

xi
LIST OF FIGURES
Figure 2. 1 Conceptual framework .................................................................................... 19

xii
LIST OF ABBREVIATIONS AND ACRONYMS
AASA American Schools in South America
AITSAL Australian institute for teaching school leadership
CBC Competence based curriculum
EPA Environment Protection Agency
G&C Guidance and counseling
GES Ghana evaluations office
IQMS Integrated quality management system
KCPE Kenya Certificate of Primary Education
KEMI Kenya Education Management Institute
KESI Kenya Education Staff Institute
KICD Kenya Institute of Curriculum Development
KNUT Kenya National Union of Teachers
MBO Management Maintenance Management System
MoE Ministry of Education
NBPTS National Board for Professional Teaching Standards
PA Performance Appraisal
SEO Sub-county Education Officer
SMART Specific Measurable Applicable Reasonable Time bound
SPSS Statistical Package for Social Services
SSO Sub-County Staffing Officer
SW Strengths and Weaknesses
TPAD Teachers Performance Appraisal Development
TSC Teachers Service Commission
xiii
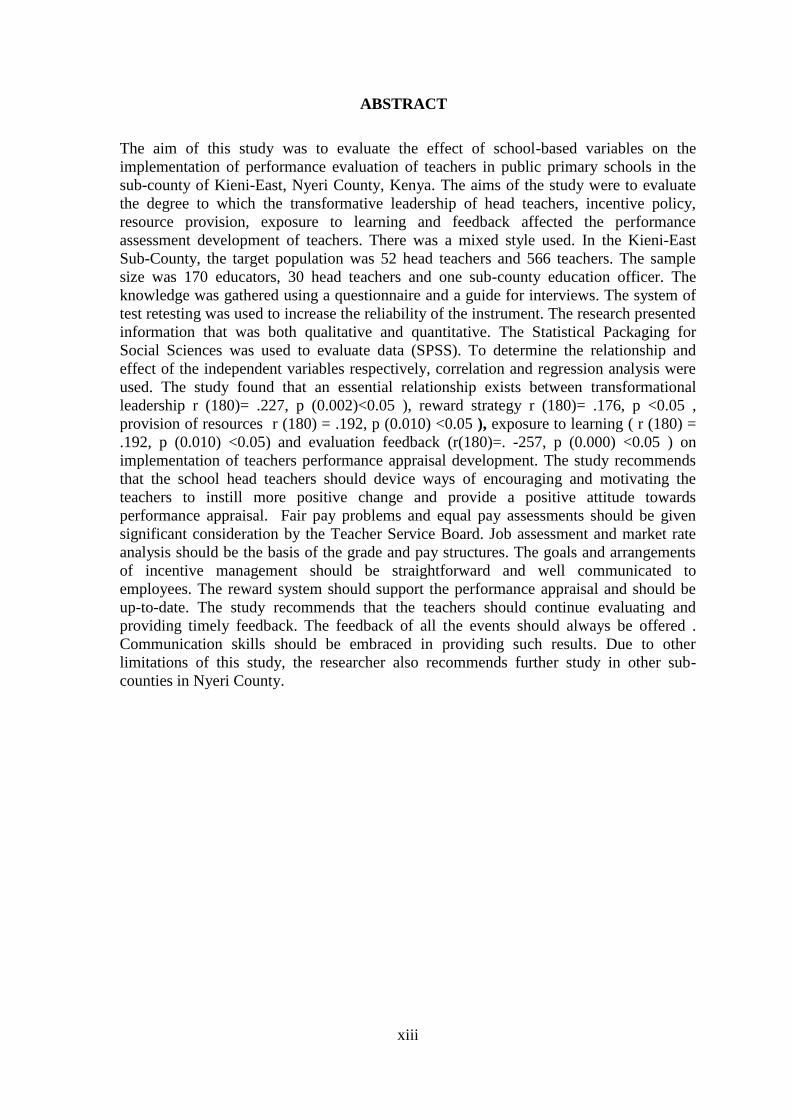
ABSTRACT
The aim of this study was to evaluate the effect of school-based variables on the
implementation of performance evaluation of teachers in public primary schools in the
sub-county of Kieni-East, Nyeri County, Kenya. The aims of the study were to evaluate
the degree to which the transformative leadership of head teachers, incentive policy,
resource provision, exposure to learning and feedback affected the performance
assessment development of teachers. There was a mixed style used. In the Kieni-East
Sub-County, the target population was 52 head teachers and 566 teachers. The sample
size was 170 educators, 30 head teachers and one sub-county education officer. The
knowledge was gathered using a questionnaire and a guide for interviews. The system of
test retesting was used to increase the reliability of the instrument. The research presented
information that was both qualitative and quantitative. The Statistical Packaging for
Social Sciences was used to evaluate data (SPSS). To determine the relationship and
effect of the independent variables respectively, correlation and regression analysis were
used. The study found that an essential relationship exists between transformational
leadership r (180)= .227, p (0.002)<0.05 ), reward strategy r (180)= .176, p <0.05 ,
provision of resources r (180) = .192, p (0.010) <0.05 ), exposure to learning ( r (180) =
.192, p (0.010) <0.05) and evaluation feedback (r(180)=. -257, p (0.000) <0.05 ) on
implementation of teachers performance appraisal development. The study recommends
that the school head teachers should device ways of encouraging and motivating the
teachers to instill more positive change and provide a positive attitude towards
performance appraisal. Fair pay problems and equal pay assessments should be given
significant consideration by the Teacher Service Board. Job assessment and market rate
analysis should be the basis of the grade and pay structures. The goals and arrangements
of incentive management should be straightforward and well communicated to
employees. The reward system should support the performance appraisal and should be
up-to-date. The study recommends that the teachers should continue evaluating and
providing timely feedback. The feedback of all the events should always be offered .
Communication skills should be embraced in providing such results. Due to other
limitations of this study, the researcher also recommends further study in other sub-
counties in Nyeri County.

1
CHAPTER ONE
INTRODUCTION
1.1 Background of the Study
Performance assessment (PA) is used to assess employee job output and the success of
establishment as they seek to realize their goals (Yamina2016) (Yamina,2016). It tends to
occur worldwide. In the United States of America during the Second World War in the
1940s, performance evaluation was adopted as a way of justifying the compensation of an
employee during the Second World War (Mugwe, 2010 cited Morehead and Graffin,
1992). When applying to the National Board for Professional Teaching Standards
(NBPTS) for teaching, Santiago et al. (2011). This is used as a mechanism for increasing
their salary.
OESD, (2009) Ontario Canada, Ontario Ministry of Education, describes the elements of
the Teachers' Performance Assessment System (TPA) based on the Ontario College of
Teachers Standard of Practice for the Teaching Profession. Student engagement and
learning, educational experience, leadership in learning groups, and continuing
professional learning are included in the elements.
In United Kingdom and New Zealand (OESD, 2013), the beginners By the completion of
the probation period, they would have proven their competence to receive their teaching
license. Those that demonstrate proficiency will be given or become qualified for a
permanent position. The others undergo periodic review.
In Korea, (Kim et al, 2010) the teachers’ When the assessment is finished, assessment
sheets are compiled and drawn up in the final report on the basis of assessment
performance, excellent teachers are offered a study and research year as an opportunity to
engage in professional development. Underperformers engage according to their
2
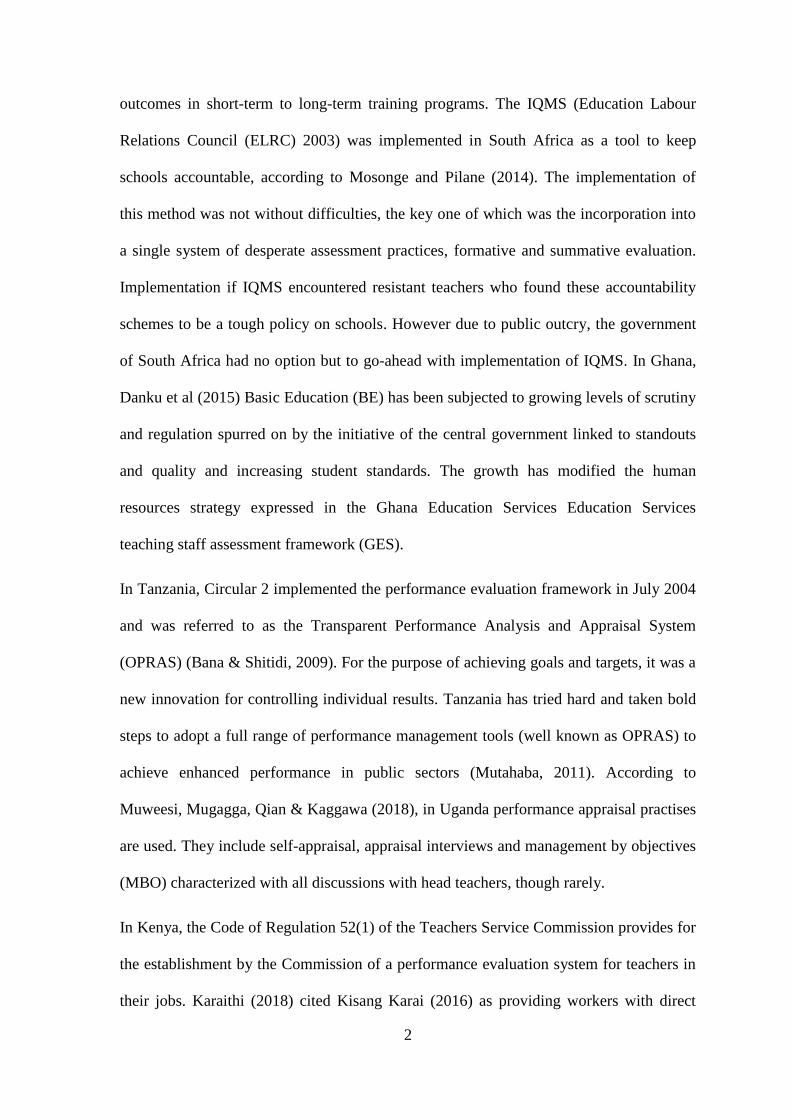
outcomes in short-term to long-term training programs. The IQMS (Education Labour
Relations Council (ELRC) 2003) was implemented in South Africa as a tool to keep
schools accountable, according to Mosonge and Pilane (2014). The implementation of
this method was not without difficulties, the key one of which was the incorporation into
a single system of desperate assessment practices, formative and summative evaluation.
Implementation if IQMS encountered resistant teachers who found these accountability
schemes to be a tough policy on schools. However due to public outcry, the government
of South Africa had no option but to go-ahead with implementation of IQMS. In Ghana,
Danku et al (2015) Basic Education (BE) has been subjected to growing levels of scrutiny
and regulation spurred on by the initiative of the central government linked to standouts
and quality and increasing student standards. The growth has modified the human
resources strategy expressed in the Ghana Education Services Education Services
teaching staff assessment framework (GES).
In Tanzania, Circular 2 implemented the performance evaluation framework in July 2004
and was referred to as the Transparent Performance Analysis and Appraisal System
(OPRAS) (Bana & Shitidi, 2009). For the purpose of achieving goals and targets, it was a
new innovation for controlling individual results. Tanzania has tried hard and taken bold
steps to adopt a full range of performance management tools (well known as OPRAS) to
achieve enhanced performance in public sectors (Mutahaba, 2011). According to
Muweesi, Mugagga, Qian & Kaggawa (2018), in Uganda performance appraisal practises
are used. They include self-appraisal, appraisal interviews and management by objectives
(MBO) characterized with all discussions with head teachers, though rarely.
In Kenya, the Code of Regulation 52(1) of the Teachers Service Commission provides for
the establishment by the Commission of a performance evaluation system for teachers in
their jobs. Karaithi (2018) cited Kisang Karai (2016) as providing workers with direct
3
feedback on their results is one of the most critical conditions in assessment. Effectively
and effectively evaluating every employee would contribute to the success of the
organization (Kanisa and Makoha, 2017) in Kenya these system was introduced in 2006
with the same aim. Before then yearly confidential reports were used to appraise
teachers’. In 2012, it was revised and in 2016 TSC built up to an open performance
appraisal.
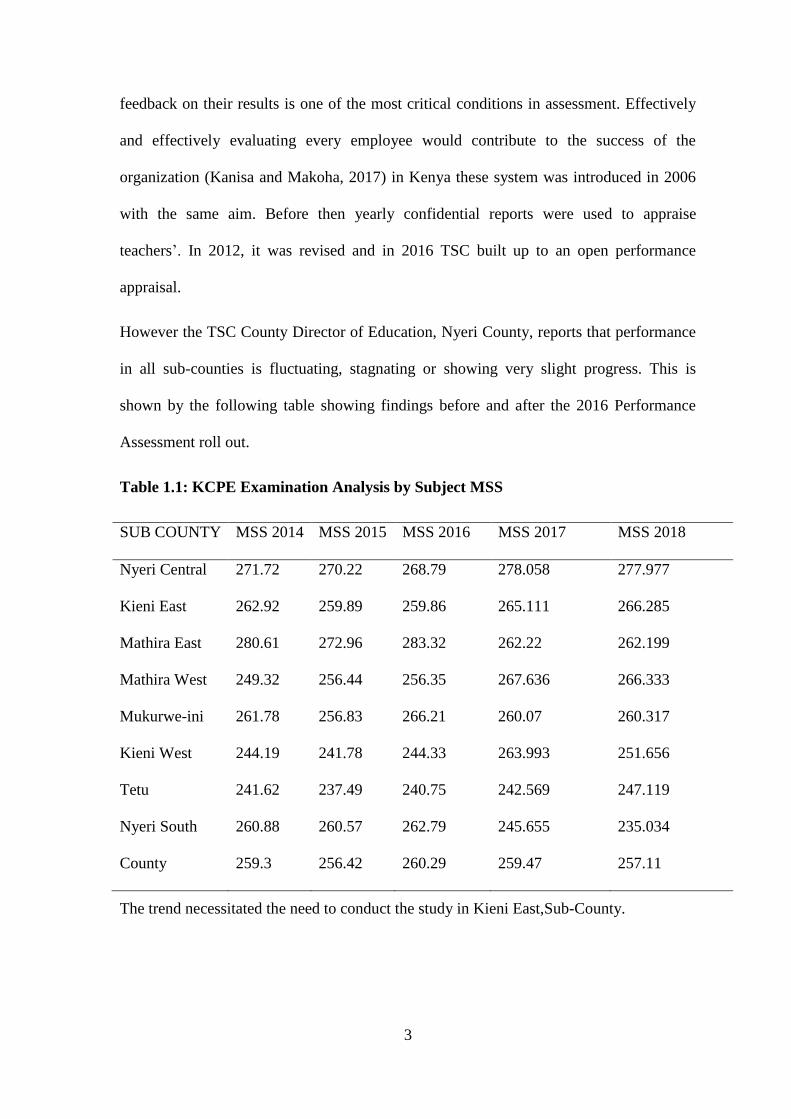
However the TSC County Director of Education, Nyeri County, reports that performance
in all sub-counties is fluctuating, stagnating or showing very slight progress. This is
shown by the following table showing findings before and after the 2016 Performance
Assessment roll out.
Table 1.1: KCPE Examination Analysis by Subject MSS
SUB COUNTY MSS 2014 MSS 2015 MSS 2016 MSS 2017 MSS 2018
Nyeri Central 271.72 270.22 268.79 278.058 277.977
Kieni East 262.92 259.89 259.86 265.111 266.285
Mathira East 280.61 272.96 283.32 262.22 262.199
Mathira West 249.32 256.44 256.35 267.636 266.333
Mukurwe-ini 261.78 256.83 266.21 260.07 260.317
Kieni West 244.19 241.78 244.33 263.993 251.656
Tetu 241.62 237.49 240.75 242.569 247.119
Nyeri South 260.88 260.57 262.79 245.655 235.034
County 259.3 256.42 260.29 259.47 257.11
The trend necessitated the need to conduct the study in Kieni East,Sub-County.
4
1.2 Statement of the Problem
Teachers performance appraisal development was initiated to bring success on teachers
performance appraisal development. It was geared to help head teachers be able to
supervise and evaluate how the teachers are performing, and carrying out their duties. It is
carried out to assess the effectiveness and efficiency of teachers which should in turn
result to improved performance. However, Teachers Performance Appraisal development
have been ineffective.
Performance evaluation is the systematic organized method of assessing and analyzing
the work-related activities and results of an employee, to understand how and why the
employee is actually doing the work, according to Mutsuddi (2011), how an employee
can perform more effectively in the future so that both the employee and the company can
benefit from each other. .Many researchers have conducted research studies that have
failed to explain some of the existing gaps that influence the Teachers Performance
Appraisal development such as the influence of head teachers transformational leadership
and teachers performance appraisal development, reward strategy and teachers
performance appraisal development, provision of resources and teachers performance
appraisal development, exposure to learning and teachers performance appraisal
development, evaluation and feedback practices and teachers performance appraisal
development. Hence this study was conducted in Kieni East Sub-County to try and fill
these gaps.
5
1.3 Purpose of the Study
The aim of this study was to evaluate the effect of school-based variables on the
implementation of performance evaluation of teachers in public primary schools in the
sub-county of Kieni-East, Nyeri County, Kenya.
1.4 Research Objectives
The objectives of the study were:
(i) To determine the extent to which head teachers’ transformational leadership
influence implementation of teachers’ performance appraisal development.
(ii) To evaluate the degree to which the incentive method affects the production of
teacher performance evaluation implementation.
(iii) To examine the extent to which provision of resources influence implementation
of teachers’ performance appraisal development.
(iv) To examine the extent to which exposure to learning influence implementation of
teachers’ performance appraisal development.
(v) To assess the extent to which evaluation and feedback influence implementation
of teachers’ performance appraisal development.
1.5 Research Questions
The goal of the study was to address the following research questions:
(i) To what extent does the head teachers’ transformational leadership influence
implementation of teachers’ performance appraisal development?
(ii) How does reward strategy influence implementation of teachers’ performance
appraisal development.?
(iii) To what extent does provision of resources influence implementation of teachers’
performance appraisal development?
6
(iv) To what extent does exposure to learning influence implementation of teachers’
performance appraisal development?
(v) How does evaluation and feedback influence implementation of teachers’
performance appraisal development?
1.6 Hypothesis
(i) Ho1. There is no major difference amid the transformational leadership of head
teachers and the production of teacher performance evaluation implementation.
(ii) Ho2. There is no significant difference amid reward strategy and implementation
of teachers’ performance appraisal development.
(iii) Ho3. There is no significant difference amongst provision of resources and
implementation of teachers’ performance appraisal development.
(iv) Ho4. There is no substantial difference amongst learning exposure and the
application of the performance evaluation development of teachers.
(v) Ho5. There is no significant difference amid evaluation and feedback and
implementation of teachers’ performance appraisal development.
1.7 Significance of Study
The data obtained by the study may be useful to a number of people, institutions and
personnel involved in decision making, formulation of policies and implementation. The
institutions which may benefit include Ministry of Education (MoE), Teachers Service
Commission (TSC), Curriculum Development Institute of Kenya (KICD),Universities
and Teacher Colleges involved in training teachers.
The Ministry of Education may find it useful in organizing head teachers training in
leadership which may benefit head teachers and teacher on improved leadership styles.
7
KISD may find it useful in preparing a curriculum for further training of teachers who
will benefit by refreshing their knowledge skills and attitudes. TSC may come up with a
better system of teachers’ promotion and teachers’ performance appraisal. This may
promote teachers’ development, the appreciation and owning of TPAD. The government
of Kenya may use the research findings to formulate policies with regard to teachers’
salaries. This may help in retaining teachers exiting the job for better pastures hence the
government may benefit for it may reduce cost of training other teachers. Other
institutions may also find some useful information that they may use to help them. The
study may also help teachers, students and administrators who are studying educational
administration especially in cooperate governance to carry out further research on the
same.
1.8 Limitations of the Study
James and Murrain (2019) claim that weaknesses are variables that can not be regulated
by the investigator. They are the conditions or influences of weaknesses that the
researcher who places constraints and methods can not regulate. The answering of
questions is heavily relied on respondents’ honesty. The researcher earnestly pleaded with
them to be honest. Some might have feared to give information although confidentiality
was guaranteed to them. Firm assurance was given to them to alleviate the fear by
affirming to them that the research is purely for education purposes.
Others may not have given true information affecting total reliability of the data. The
researcher created a good rapport with the teachers so as to give true information. Others
may have been biased depending on their relationship with the head teacher. The
researcher pleaded with them to keep away differences with anybody when filling the
forms.
8
1.9 Delimitation of the Study
Marilyn and Goes (2013) states that a study's boundaries are those characteristics that
arise from study scope constraints and the conscious exclusionary and inclusionary
choices made during the study plan's development. Only teachers in public primary
schools from the Kieni East Sub-county schools participated in the study because they are
the only ones affected by TSC TPAD.
1.10 Basic assumptions
The following assumptions were made in the study:
i) Head teachers and teachers gave truthful and honest information.
ii) That the respondents were ready to respond to all questionnaires.
1.11 Definition of significant terms
Head teachers: Refers to the overall administrative responsibility in a school.
Leadership: refers to the approach used to encourage teachers to offer their best in the
pursuit of the desired results by head teachers.
Leadership styles: refers to the manner and method of Head Teachers to provide
guidance, execute strategies and inspire teachers under their leadership.
Performance appraisal: This is the comprehensive assessment of employee
performance to understand a person's capabilities for further growth and development.
Primary school: refers to an institution where for eight years, pupils receive regular
instruction.
Reward strategy: This is anything given or done in recognition of service, effort or
achievement.
Teacher: This is a person who helps others to acquire knowledge.
9
Transformative leadership: The ability to encourage or empower teachers to willingly
exert concerted efforts to enhance the delivery of education is one of the attributes that
head teachers must seek.
1.12 Organization of the study
The analysis was arranged into five chapters:
Section one consists of the study context, the statement, the intention of the study, the
aims of the study, research questions, the relevance of the study, the shortcomings of the
study, the delimitations of the study, the meanings of significant terms and the
organization of the study. The associated research in section two of the literature review
consists of introduction, concept of implementation teachers performance appraisal
development, head teachers’ transformational leadership practice influencing
implementation of teachers performance appraisal development, influence of reward
strategy and implementation of teachers performance appraisal development, influence of
provision of resources and implementation of teachers performance appraisal
development, influence of exposure to learning and implementation of teachers
performance appraisal development, influence of evaluation and feedback and
implementation of teachers performance appraisal development, Literature analysis
overview, theoretical structure and conceptual context. Section three explains the
technique of study that was used. This includes the essence of the study, the target
population, the sample size and sampling techniques, the test instrument, the instrument's
validity, the instrument's reliability, the method of data collection, data analysis
techniques and ethical considerations. The analyzed data, its presentation and
interpretation are included in chapter four. The overview of the study, the outcomes,
findings, recommendations and suggestions for future studies are included in chapter
five..
10
CHAPTER TWO
LITERATURE REVIEW
2.1 Introduction
The literature reviewed under the following sub-headings are discussed in this section;
concept of performance appraisal development, head teachers’ transformational
leadership influencing teachers performance appraisal development, reward strategies
influencing teachers performance appraisal development, influence on provision of
resources on teachers performance appraisal development, influence of exposure to
learning on teachers performance appraisal development, influence of evaluation and
feedback on teachers performance appraisal development, Literature analysis overview,
theoretical structure and conceptual context.
2.2 Concept of Implementation of Teacher Performance Appraisal Development
The concept of teachers’ appraisal entails how the teacher appraisal is and how it is
carried out in our schools. Gupta (2011) described teacher performance assessment as the
process of accessing teacher performance and progress or a group of teachers on the
teaching job and their potential for future growth. This is done over a specific period of
time. Due to differences in their backgrounds experiences, knowledge, skills, abilities
and aptitudes, they are assessed for further exposure to learning. The assessment
identifies these differences.
Myhem (2018) says the aim of the basic performance evaluation framework is to identify
and maintain good performance and inspire workers to improve in areas where the
performance of their work does not meet expectations. While appraising, there are various
criteria that require consideration. First is relevancy which measures the objectives of the
job leaving out irrelevant. Secondly is reliability whereby the evaluation procedures
11
should produce consistent and replicable results. Thirdly, there should be freedom from
contamination by ensuring the employee is unfairly appraised because of factors beyond
his control.
TSC decided to use management by objective (MBO). According to Nzuve (2015), this is
a method where a relationship between the evaluator and evaluate is established and goals
set to be achieved in a given period. However, this method the TSC sat down and came
up with it without involving the employees or their representative, the KNUT. Again,
they are only formally done without any meaning since no promotions are given. They
are only used by head teachers to pressurize the teachers where they don’t meet their
targets irrespective of other factors that may hinder its effective roll out.
2.3 Head Teachers Transformational Leadership and Implementation of Teachers
Performance Appraisal Development
There are various leadership methods practiced in our schools. Transformational
leadership is considered the best. Chetry (2018) Transformational leadership is a
leadership style in which positive improvements are influenced by those who follow it..
Leaders in transformational leadership are focused on helping teachers excel. White
(2018) says that leadership in transformation is a leadership style in which teachers are
empowered, driven and motivated to innovate and generate change that will help them
grow and alter the school's potential success.
Bayer, 2012 says one of the attributes that head teachers must seek in transformative
leadership is the ability to empower or encourage teachers to willingly exercise persistent
efforts to enhance the delivery of education. Via engagement and willingness, it is related
to enhanced school functioning and quality education delivery, achieving objectives or
educational targets. Waiganjo (2015) says that transformational leaders help followers

12
grow and develop into leaders by supporting and aligning individual followers, leaders,
the society and the wider organization's goals and objectives by responding to the needs
of individual followers. Transformative leadership thus helps teachers to surpass expected
outcomes.
Maela (2016), one of the positive factors that has a direct correlation with job engagement
is the style of transformative leadership. This research was primarily carried out on the
influence it has on the assessment of teacher results, since head teachers need to
collaborate with teachers for the delivery of education and students for learning. The
researcher will therefore study whether the head teachers are practicing transformational
leadership in their schools. The researcher will also study whether the teachers are
comfortable with this type of leadership.
2.4 Head teachers’ Reward Strategy and Teachers Performance Appraisal
Rewards are very necessary in motivating teachers and pupils towards their achievements.
Rewards gives morale and motivates all who look forward on better performance. All feel
recognized for what they are doing. The reward plan, according to Armstrong (2009),
points out what the company plans to do in the longer term to establish and enforce
reward strategies, procedures and processes that will further the achievement of
objectives..
Mutwiri (2015) says rewards are intrinsic or extrinsic. KESI (2011), intrinsic motivation
is characterized as motivation that comes from within a person rather than any external or
external rewards. It implies that to keep a person motivated, such external incentives are
not enough. Motivation that comes from outside a person is extrinsic motivation. And
when they have no interest in it because of the expected gratification they will get some
reward, an extrinsically motivated teacher will work on a job.
13
Brown (2019) says before employers offer any more voluntary incentives, they must
understand that any successful total compensation program is focused on the secure basis
of a reasonable base pay level combined with providing all workers particularly the
lowest paying, with real remuneration and career development opportunities. This will
make teachers feel they are truly making a difference.
According to Tornquist (2014) work environment is the leadership styles the organization
culture, work and life balance. All this contributes to improved performance, both by
teachers and pupils. The researcher will therefore study the influence of reward strategy
on implementation of teachers’ performance appraisal development.
2.5 Head teachers’ Provision of Resources and Teachers Performance Appraisal
Resources are very essential in every day to day learning of a school. In the delivery of
quality formal and non-formal primary services, three types of tools are utilized: human
resources, material resources and financial resources cited by Usman and Dangara (2016).
For success, human resources are critical. Planners, managers, instructors, mentors,
executives and support staff are included. It is important to balance the teacher / pupil
ratio well.
An obstacle to quality education may be material services, both availability and quality.
The lack of physical facilities ultimately hampers instruction, depresses the children's
spirit and the educators' enthusiasm. (Bizimana, 2014). According to Okongo, Ngao, Rop
& Nyongesa (2015), physical facilities development and maintenance in schools accounts
for the difference in achievement. When the quantity and consistency of physical
resources are ample, the learning experiences are fruitful. Financial resources act as a
barrier to education. Both human resource and material resource require finance to be
14
attained. The researcher will study how these factors influence implementation of
teachers’ performance appraisal development.
2.6 Head teachers Exposure to Learning and Teachers Performance Appraisal
For teachers to perform, they should be exposed to learning. Learning helps teachers to
boost their knowledge, skills and attitudes. It enables them to refresh on their previous
know how. Learning is a continuous process. Everyday a new thing is learnt.
Warner (2013) says, training and development improves employees’ performance.
Exposure to learning makes teachers more productive because of understanding more
about their role. It also makes the teachers more confident in their work performance.
A teacher through exposure to learning gains improved satisfaction and morale in
teaching. Teachers gains value and creates support in school. Exposure to learning also
addresses weaknesses. This exposure to learning allows teachers to do any task hence
one does not have to wait for a task to be done if one teacher is absent.
Training is critical for the growth and success of employees, according to Dracker (2015),
which motivates him, apart from just money to work for a certain organization. Teacher
exposure to learning has been introduced in the country. This is being referred to as
Competency Based Curriculum (CBC). Evidence-based universal principles in teaching
and measuring skills, expertise, professional values and attitudes for both pre-training and
in-service training are encouraged by exposure to learning. This exposure to learning has
emphasis on child-centered learning, multi-grade teaching and how to teach in unique
environment. The researcher will study how well the teachers are perceiving this and
whether the training is gaining strength in the institutions.
15
2.7 Head Teachers’ Evaluation and Feedback and Teachers Performance Appraisal
Evaluation is necessary for the teachers and the head teacher to gauge where they were,
where they are and where they want to go. It also gives them feedback on how their
performance is. It reveals their strengths and weaknesses and they are able to see their
opportunities and threats on their line of duty. Evaluation is the process of judging or
placing a value on a procedure, the degree to which expertise has been learned, or an
ability, according to Saleemi (2011). Feedback, on the other hand, is the way to provide
knowledge about teacher learning or the development of skills in order to prepare
learning objectives and to imitate attitudes and skills.
According to Clynes and Raftery (2008) feedback is helpful in recognizing and promoting
habits that are helpful and successful. To hinder successful professional growth, habits are
defined and modified. Written appraisal occurs regularly through placement, while verbal
comments are made during and after situations on a more frequent basis.
Feedback also supports teachers in theory and practice, which promotes self-evaluation,
improves self-confidence and helps to minimize fear of evaluation, according to
Heckman-stone (2004). Creating a transparent, emphatic and corresponding partnership
will foster a supportive and productive climate conducive to successful feedback. Clynes
& Rafterly (2008) says evaluation and feedback should be in an open environment, non –
threatening and supportive. The researcher will therefore find out how teachers evaluation
and the feedback practices is done and whether it has any gain their respective schools.
2.8 Summary of Literature Review
The comprehensive literature on the efficacy of schools in developing countries is that
achieving improved learning outcomes is fundamentally dependent on changes in the
performance of teachers. Teaching is the primary determinant of school success at school
16
level, so the teacher is paramount to this realization. Ways to strengthen teacher activities
and skills are also essential to any systematic effort to enhance learning. If these ways
lack, the teachers may respond in many different ways. They may lose morale in
teaching, reduce effort, become disgruntled and in extreme eases quit the teaching career.
The compulsory filling of TPAD without taking into consideration factors that affect its
purpose and realization in order to improve performance has continued to either lower or
stagnate performance. Therefore, for high successful performances which is naturally to
the interest of all education systems context, head teachers transformational leadership,
rewards strategy, provision of resources, exposure to learning, evaluation and feedback
need to be addressed properly, to ultimately achieve the concept of implementation of
teachers performance appraisal development.
2.9 Theoretical Framework
The theory of input output systems inspired this analysis by the Ludwig Von Bertalanffy
(1973) approach to system theory, and organizations must communicate with the world as
open social systems in order to function. This approach defines organizational
behaviours by mapping the repetitive cycles between the organization and the external
environment of input, during, output and feedback. The system looks management as an
open-ended process. It emphasizes detachment, objectivity and control. It helps in
coordinating purposeful individuals (teachers) whose actions stems from applying their
unique interpretation to the particular situations confronting them. Teachers receives
inputs and transform them to outputs. The system will help in viewing common and
uncommon themes that explain their behavior and their effectiveness in terms of their
goals, objectives or common purposes.
17
In order to understand the relationship amid inputs, outputs and processes, one has to
consider the context in which all this takes place. Although the environment is not part of
the system, it is all that is necessary to understand the functioning of the system.
Education is a system because it has a collection of inputs that are subject to a process
(administrative variables, money, pupils, teachers, facilities, etc to achieve those goals
that appear as outputs.
In this case the researcher decided to analyze the input of head teachers, the output, in
order to get the output from teachers who are then evaluated by the performance
assessment of the instructor.
In this case, an open-ended system was used to determine the effectiveness and efficiency
of the so laid down objectives in this study. The ability of heartache to guide teachers
through transformational leadership has great influence on implementation of teacher’s
performance appraisal development. Reward strategy laid down by the head teacher
results to how motivated teachers are and this will definitely influence implementation of
teacher’s performance appraisal development. Teachers require learning resources in
order to effectively carry out their teaching and their provision will highly result to good
output hence influence implementation of teacher’s performance appraisal development.
Teachers will also require to be exposed to learning.
Learning has no end and therefore input on teachers further learning will result to their
improved output hence influencing implementation of teacher’s performance appraisal
development. Timely evaluation and feedback will also boast teacher’s capability of self-
evaluating themselves, geared to enhancing effective output. This will also influence
implementation of teacher’s performance appraisal development. Hence the input output
system theory greatly helped to guide this study.
18
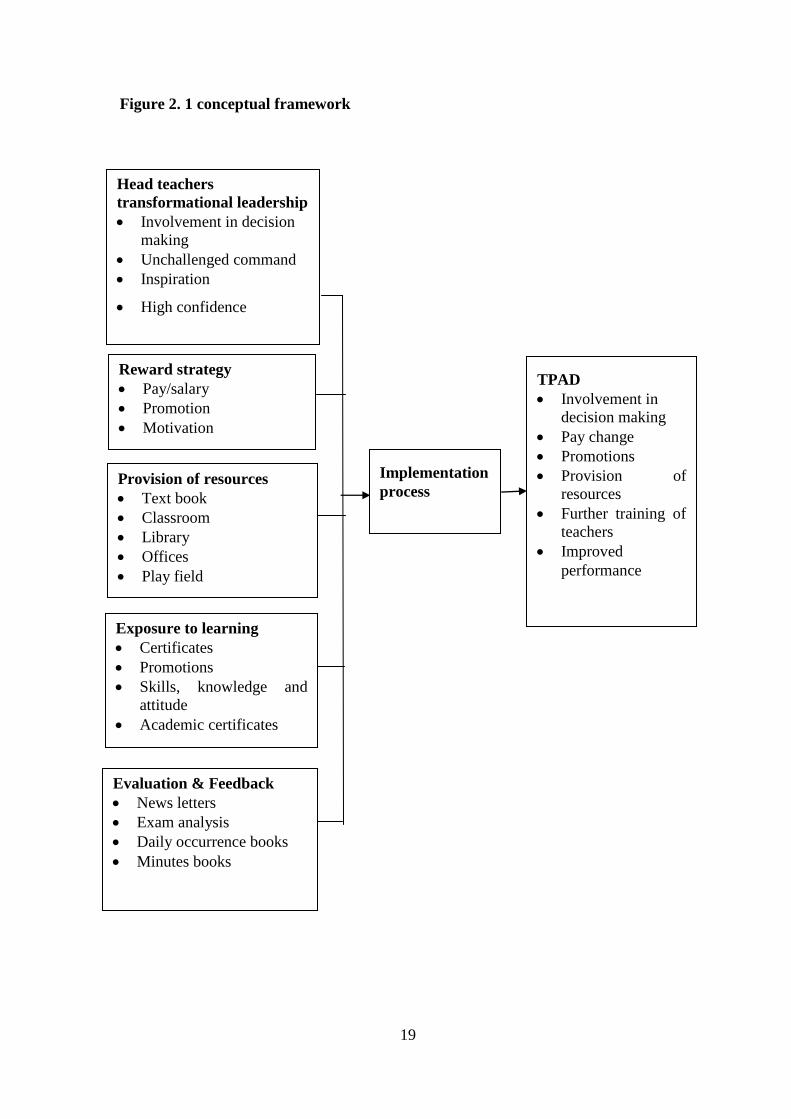
2.10 Conceptual Framework
This is a rundown of the study's key independent and dependent variables and the
relationship between them. Related variables are situations that tend to change as
independent variables change. From the figure head teachers transformational leadership
will be studied to see whether it has any influence on implementation of teacher’s
performance appraisal development. In order to evaluate the impact of the
implementation of teacher performance evaluation development, incentive strategies will
be studied.
Provision of resources will be studied to establish whether they have any influence on
implementation of teacher’s performance appraisal development. Exposure to learning
will be studied to determine whether it has any effect on implementation of teacher’s
performance appraisal development. Evaluation and feedback and their effects on
implementation of teacher’s performance appraisal development.
19
Figure 2. 1 conceptual framework
Head teachers
transformational leadership
Involvement in decision
making
Unchallenged command
Inspiration
High confidence
Reward strategy
Pay/salary
Promotion
Motivation
Provision of resources
Text book
Classroom
Library
Offices
Play field
Exposure to learning
Certificates
Promotions
Skills, knowledge and
attitude
Academic certificates
Evaluation & Feedback
News letters
Exam analysis
Daily occurrence books
Minutes books
Implementation
process
TPAD
Involvement in
decision making
Pay change
Promotions
Provision of
resources
Further training of
teachers
Improved
performance
20
CHAPTER THREE
RESEARCH METHODOLOGY
3.1 Introduction
The research methodology for research design, target population samples and sampling
procedure, research instrument, validity of the instrument, data collection procedure and
data analysis techniques will be addressed in this study.
3.2 Research Design
Gatara (2010) posit research designs as a plan, collection, deduction and analysis. This
study employed mixed methods approach underpinned by pragmatism. In particular, this
study used descriptive survey design and research design for correlation studies
(Rothbauer, 2008; Creswell, 2009). Shield and Rangarjan (2013) posit the characteristics
of a population being studied are defined using descriptive survey designs. Correlation
analysis architecture was used to measure connections between the two identifiable
variables that existed. The regression analysis was later determined to determine the
degree to which the dependent variable was predicted by the independent variable
(Creswell, 2012).
3.3 Target Population
Any specific study targets a specific population from which questionnaires and interviews
are distributed to collect the requisite data for analysis. (Orotho, 2009). In the Kieni-East
Sub-County, 52 schools, 52 head teachers and 566 teachers were the target population.
Source; Kieni-East Sub-County Staffing Office Sub-county.3.4 Sample Size and
Sampling Techniques.
21
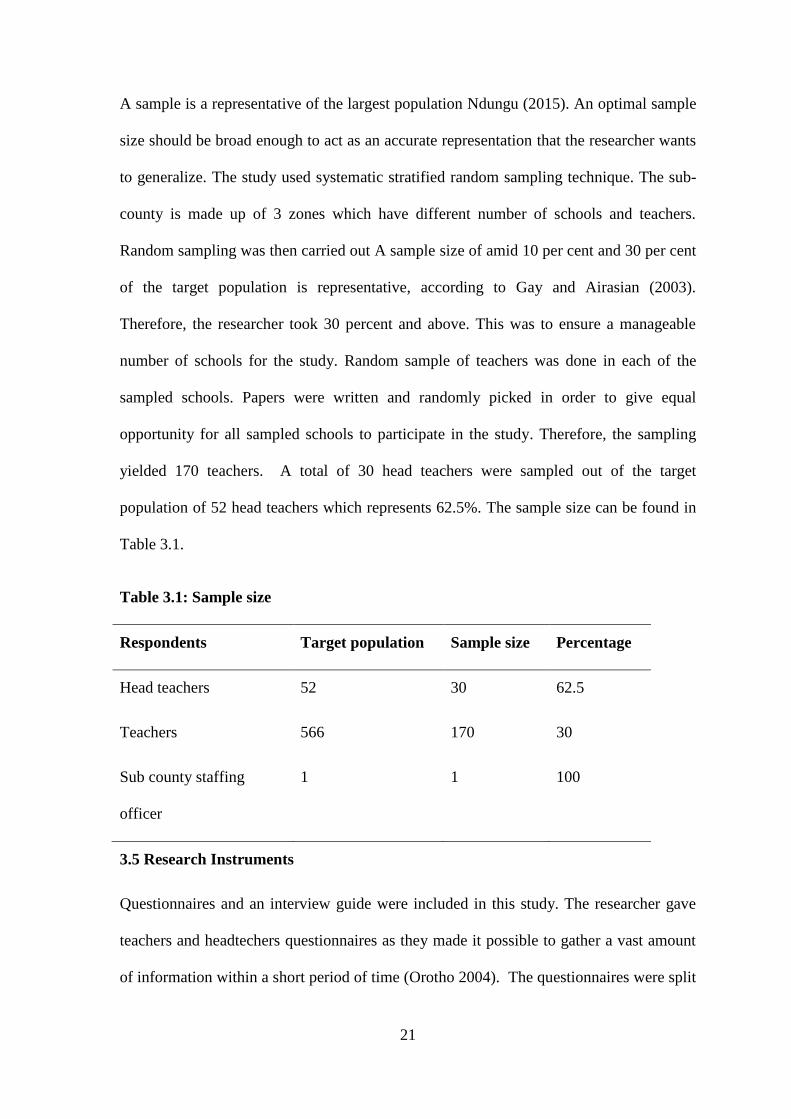
A sample is a representative of the largest population Ndungu (2015). An optimal sample
size should be broad enough to act as an accurate representation that the researcher wants
to generalize. The study used systematic stratified random sampling technique. The sub-
county is made up of 3 zones which have different number of schools and teachers.
Random sampling was then carried out A sample size of amid 10 per cent and 30 per cent
of the target population is representative, according to Gay and Airasian (2003).
Therefore, the researcher took 30 percent and above. This was to ensure a manageable
number of schools for the study. Random sample of teachers was done in each of the
sampled schools. Papers were written and randomly picked in order to give equal
opportunity for all sampled schools to participate in the study. Therefore, the sampling
yielded 170 teachers. A total of 30 head teachers were sampled out of the target
population of 52 head teachers which represents 62.5%. The sample size can be found in
Table 3.1.
Table 3.1: Sample size
Respondents Target population Sample size Percentage
Head teachers 52 30 62.5
Teachers 566 170 30
Sub county staffing
officer
1 1 100
3.5 Research Instruments
Questionnaires and an interview guide were included in this study. The researcher gave
teachers and headtechers questionnaires as they made it possible to gather a vast amount
of information within a short period of time (Orotho 2004). The questionnaires were split
22
into sections and included open and closed-ended questions. Information on demographic
data was included in Section A dependent and independent variables were discussed in
Section B. And there was a sub-county staffing officer interview guide. On a five point
likerts scale, the teachers and head teachers were asked to show the degree to which they
agreed with the statements by 5: strongly agree, 4; Agree, 3: undecided, 2: disagree, 1:
strongly disagree.
3.5.1 Validity of the Instruments
When an instrument accurately calculates any prescribed variable, according to Ghazali
(2016), it is considered a valid instrument for that particular variable. Questionnaires for
teachers and head teachers and an interview guide for sub-county parental education
directors were the methods used in this report. To gain clarification and significance, the
validity of the instruments was checked in four public primary schools that were not
included in the study sample. The result led the investigator to obtain the validity of the
material. In order to improve the testing instruments, corrections, modifications and
rephrasing of statements were made where appropriate.
3.5.2 Reliability of the Instrument
Reliability is a measure of the degree to which a research instrument provides reliable
results or knowledge after repeated tests (Mugenda and Mugenda, 2003). This helped the
investigator estimate mistakes and make corrections if any. In order to determine their
reliability, the research instrument was tested. The test-retest was used for accuracy
determination. The questionnaires were administered by the investigator to the
respondents and the same questionnaires were administered again within a week to the
same respondents. The two sets of scores were regressed in order to establish the
correlation coefficient (r) between the two sets of scores using the Pearson Product
23
Moment Correlation. The instructor's questionnaire provided a reliability of 0.7.
According to Mugenda and Mugenda, a reliability coefficient of 0.7 to 1.00 is deemed
acceptable (2003).
3.6 Data Collection Procedure
The researcher obtained the approval of the School of Education of the University of
Nairobi. A research permit was obtained by the National Commission for Science,
Technology and Innovation (NACOSTI). The investigator also obtained a letter of
approval to conduct the investigation from the County Director of Education in Nyeri
County. The investigator also visited the sampled school in order to gain permission from
the corresponding head teachers to conduct research in their schools. The researcher left
the questionnaires in college, personally. He then gave the respondent time to fill them
up, so he went personally and collected them for two weeks. The respondents were
assured of strict confidentiality of all their answers during this exercise.
3.7 Data Analysis Techniques
Data analysis is the process of systematically looking for and arranging completed
research tools after field work to enhance researchers' knowledge of them, enabling the
researcher to present them to others (Mutwiri, 2015). It used SPSS. There was both
qualitative and quantitative data in the data review. Quantitative information was
evaluated and interpreted using tables using frequencies, ratios, mean scores and standard
deviations. Qualitative data was evaluated thematically. By first classifying and
addressing responses according to themes for each object, this was accomplished. The
data was edited, coded and documented using descriptive narratives of the respondents'
opinions, attitudes and viewpoints.
24
This made it easy for the researcher to convert the form of scale data into continuous data
that allowed correlation and regression analysis to be computed. The estimation of
frequencies, percentages and means included descriptive statistics. To be able to develop
the relationships, Pearson-Product Moment Correlation was used when using the Linear
Regression Model to assess the influence of the relationship between the two variables. A
correlation coefficient of between -1.00 to +1.00 is used, according to Creswell (2008), to
calculate the degree and intensity of the relationship between the variables and a
correlation coefficient of 0.00 suggests a lack of linear relationship. The lower the
coefficient of correlation to 0.00, the weaker the relationship between the variables.
Hypotheses were evaluated using the correlation coefficient at a 0.05 level of
significance. The models used for regression were as follows:Y = β0 + βX+ ε
Where y= implementation of teachers’ performance appraisal development
While β0 is the constant, β is the coefficients of X variable and ε is the error term.
3.8 Ethical Considerations
The investigator found that information on the questionnaires was confidential.
Information regarding the respondent was not used for any reason other than for
educational purposes. On the questionnaires, the names of the respondents were not
written. Before administering the questionnaires, the definitions of the respondents were
sorted and the researcher introduced himself to the respondents and clearly stated his task.
25
CHAPTER FOUR
DATA ANALYSIS, PRESENTATION AND INTERPRETATION
4.1 Introduction
This chapter covers data analysis, conclusions, interpretation and discussion of responses
obtained from the study on school-based factors affecting the performance evaluation of
teachers in public primary schools in the sub-county of Kieni-East, Nyeri County, Kenya.
The section presents the research results on the return rate of the questionnaire,
demographic characteristics, transformative leadership, incentive policy, resource
provision, learning exposure and input on the progress of teacher performance evaluation
implementation. There was a mixed style used. The study of the data was performed
using descriptive and inferential statistics.
4.2 Response Rate
The return rate of the questionnaire refers to the number of questionnaires administered,
completed and returned to the researcher for the purposes of analysis. In Kieni-East sub-
county, Nyeri County, Kenya, the respondents were head teachers, teachers and the sub-
county director of education in public primary schools. A 50 per cent response rate is
satisfactory, 60 per cent decent and over 70 per cent rated really good, according to
Mugenda and Mugenda (2013). This indicates that the response rate was over 80 percent,
based on this statement. Table 4.1 presents the response rate.
26
Table 4.1: Response Rate
Respondents sampled Response Percentage
Teachers 170 152 89.4
Head Teachers 30 28 93.3
Sub-county staffing
officer
1 1 100
Total 201 181 90
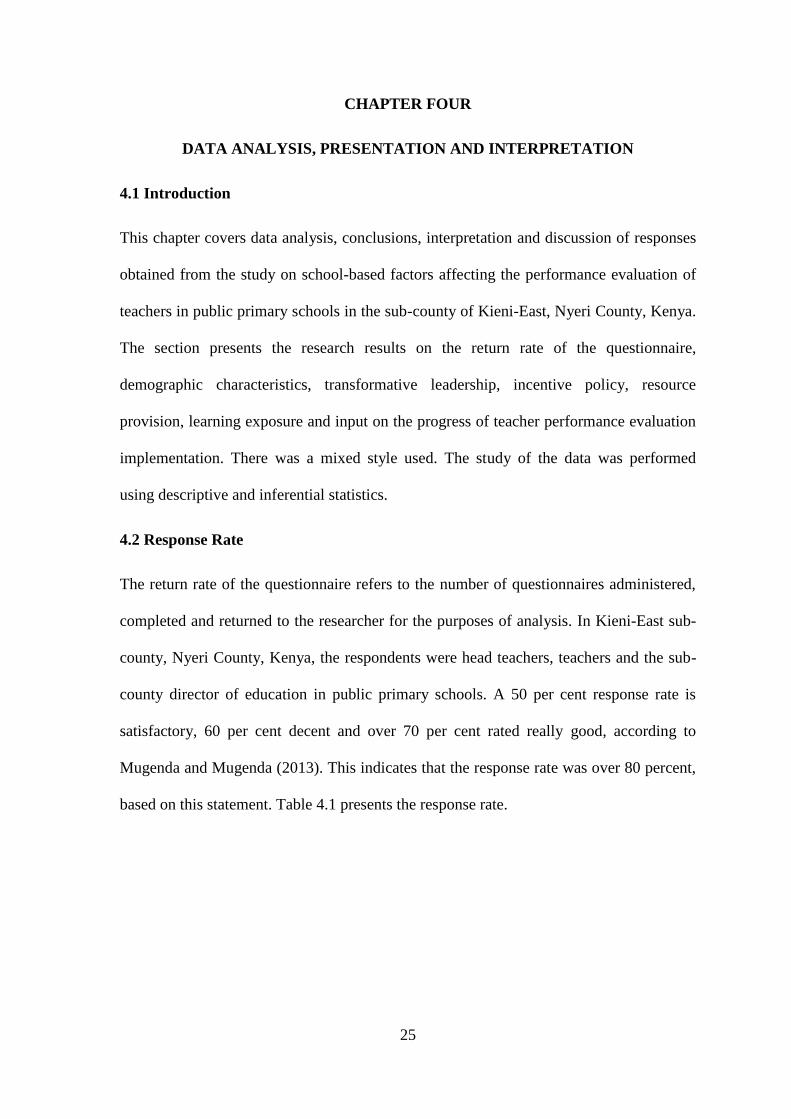
Table 4.1 shows that 152 teachers and 28 head teachers returned the questionnaires hence
the response rate of 85% was regarded as satisfactory.
4.3 Demographic Data
Participants' demographic characteristics included: age, gender, qualification for
education, job experience and place held in the school. This data enabled the study to
evaluate the impact of school-based factors affecting the implementation of performance
evaluation of teachers in public primary schools in the sub-county of Kieni-East, Nyeri
County, Kenya.
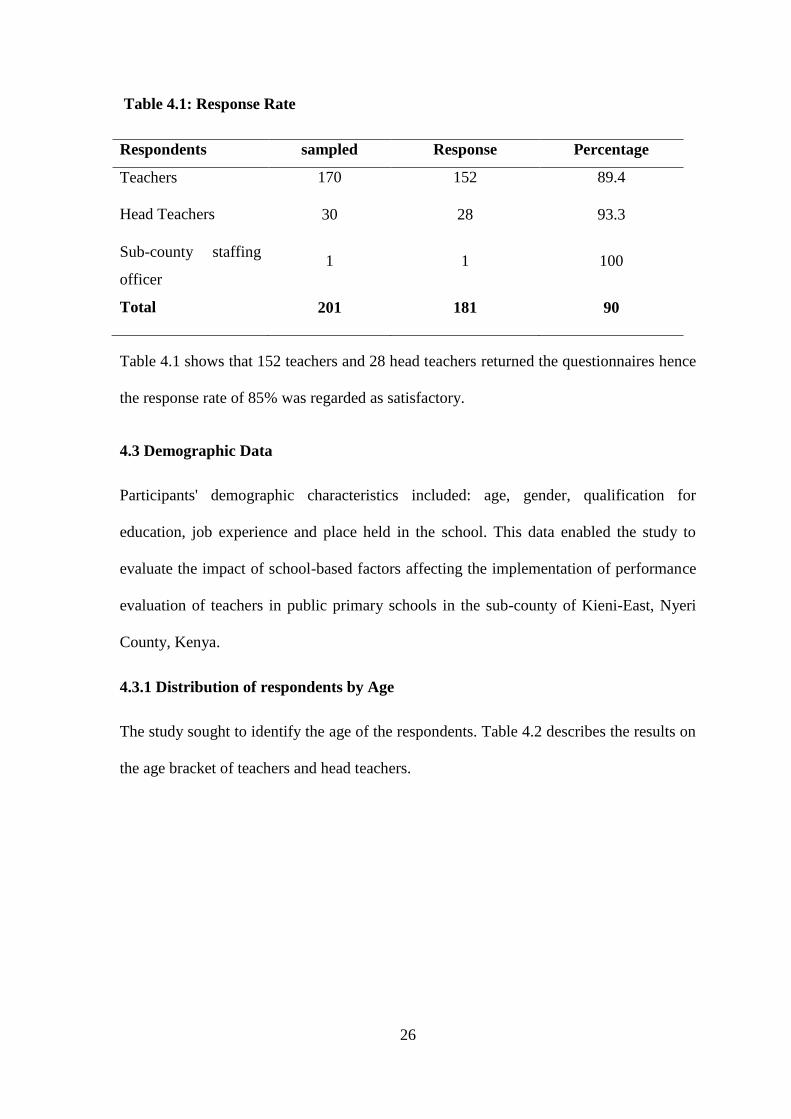
4.3.1 Distribution of respondents by Age
The study sought to identify the age of the respondents. Table 4.2 describes the results on
the age bracket of teachers and head teachers.
27
Table 4.2: Distribution of respondents by Age
Teachers Head Teachers
Age f % f %
Below 30 years 4 2.6% 0 00
31-40 years 28 18.4% 2 7.1%
41-50 years 44 28.9% 5 17.9%
51-60 years 76 50% 21 75%
Total 152 100 28 100
The findings on the age of teachers reveal that 76 (50%) teachers were between 51 to 60
years, 44 (28.9%) were between 41 to 50 years, 28 (18.4%) were aged 31 to 40 years
while the least 4 (2.6%) were below 30 years. The findings indicated majority of the
teachers were over 41 years. The findings on head teachers age revealed that three
quarters of the head teachers 21 (75%) were between 51 to 60 years while the least 5
(17.9%) were 41 to 50 years, 2 (7.1%) were 31 to 40 years. The findings suggested
majority of the head teachers were above 50 years. This means they have more
experience in the teaching profession and could give more detailed information about the
pupil’s progress.
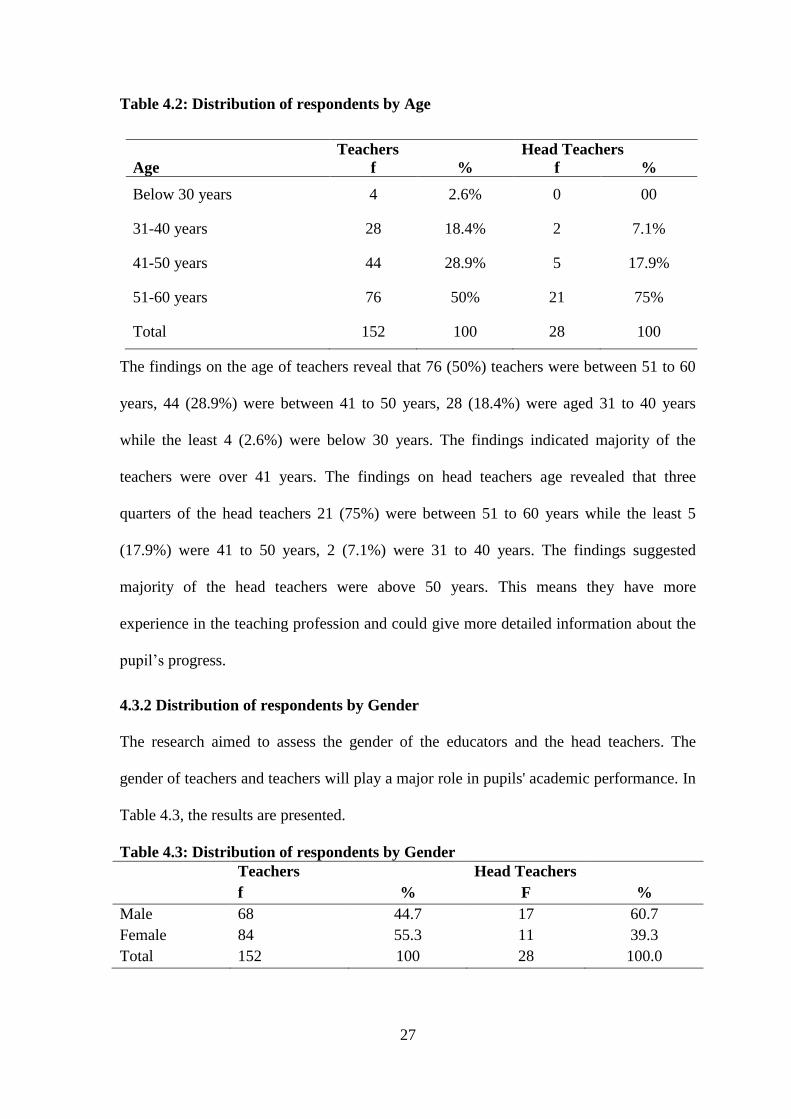
4.3.2 Distribution of respondents by Gender
The research aimed to assess the gender of the educators and the head teachers. The
gender of teachers and teachers will play a major role in pupils' academic performance. In
Table 4.3, the results are presented.
Table 4.3: Distribution of respondents by Gender
Teachers Head Teachers
f % F %
Male 68 44.7 17 60.7
Female 84 55.3 11 39.3
Total 152 100 28 100.0
28
The results in Table 4.3 show that the majority of teachers were 84 (55.3 %) female while
the male was 17 among the head teachers (60.7 %).There were therefore more female
teachers than the male but more male head teachers than the female. According to the
2010 Constitution of Kenya (2010), either of the gender should take up a third of any
appointments to a public office.
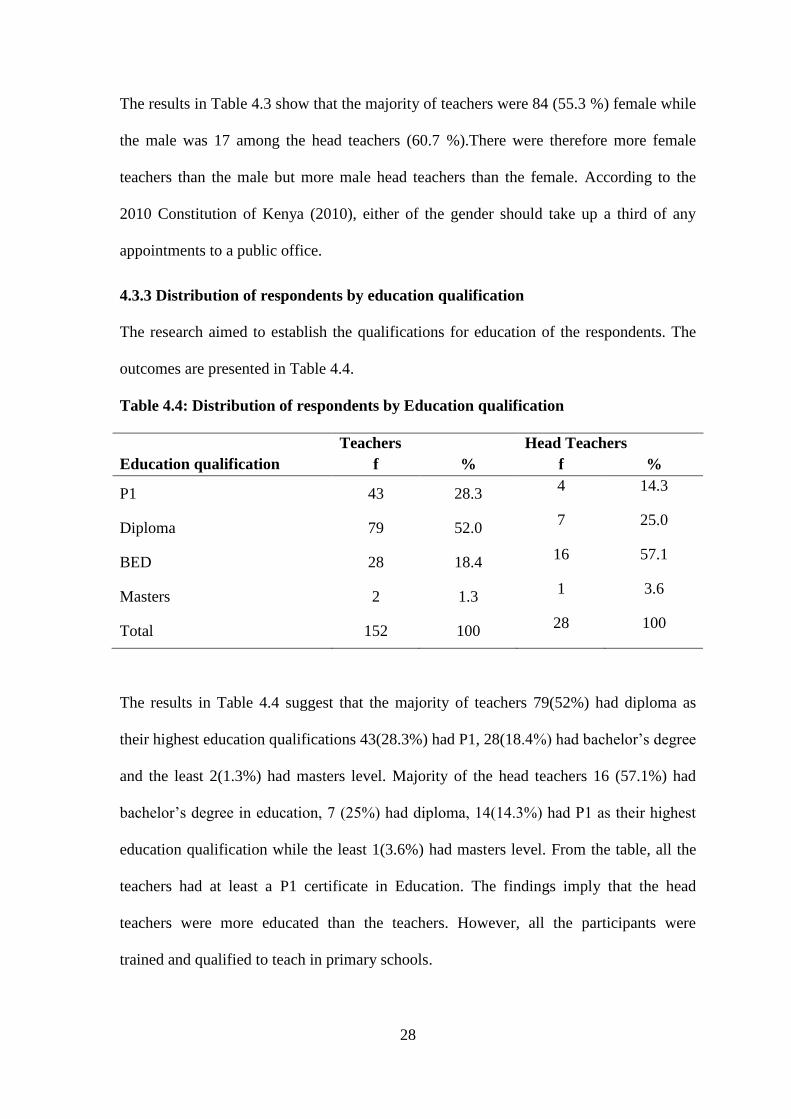
4.3.3 Distribution of respondents by education qualification
The research aimed to establish the qualifications for education of the respondents. The
outcomes are presented in Table 4.4.
Table 4.4: Distribution of respondents by Education qualification
Teachers Head Teachers
Education qualification f % f %
P1 43 28.3 4 14.3
Diploma 79 52.0 7 25.0
BED 28 18.4 16 57.1
Masters 2 1.3 1 3.6
Total 152 100 28 100
The results in Table 4.4 suggest that the majority of teachers 79(52%) had diploma as
their highest education qualifications 43(28.3%) had P1, 28(18.4%) had bachelor’s degree
and the least 2(1.3%) had masters level. Majority of the head teachers 16 (57.1%) had
bachelor’s degree in education, 7 (25%) had diploma, 14(14.3%) had P1 as their highest
education qualification while the least 1(3.6%) had masters level. From the table, all the
teachers had at least a P1 certificate in Education. The findings imply that the head
teachers were more educated than the teachers. However, all the participants were
trained and qualified to teach in primary schools.
29
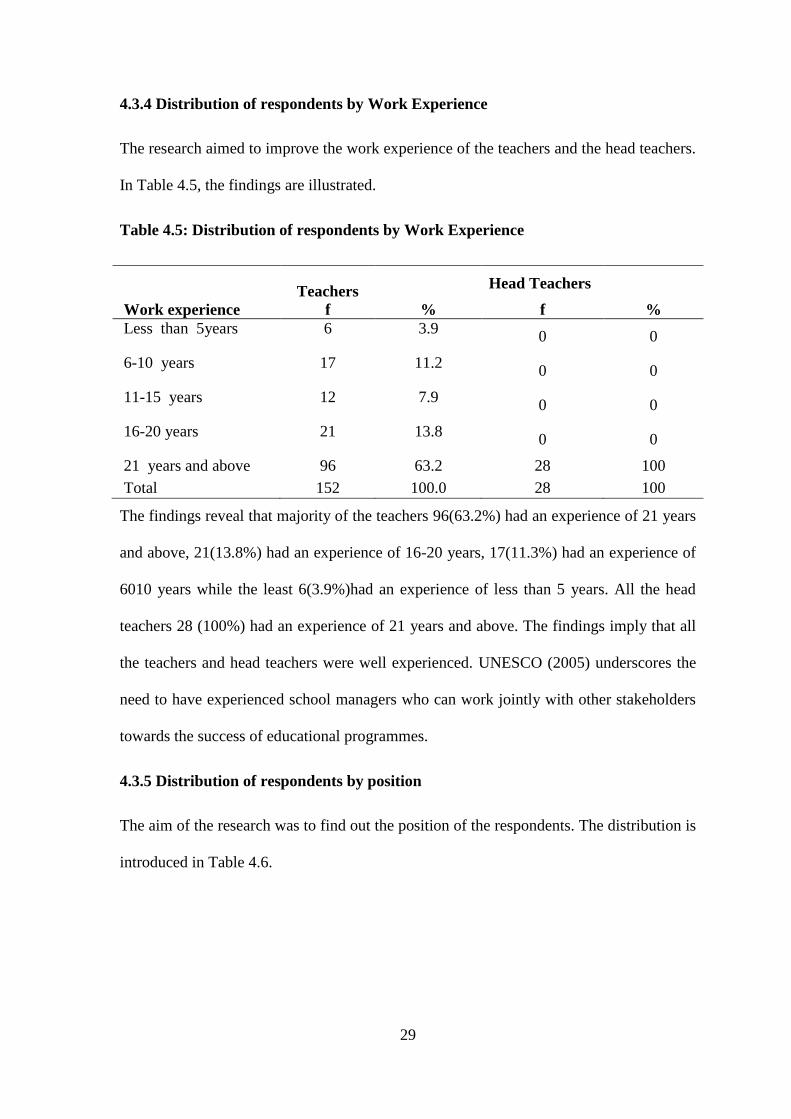
4.3.4 Distribution of respondents by Work Experience
The research aimed to improve the work experience of the teachers and the head teachers.
In Table 4.5, the findings are illustrated.
Table 4.5: Distribution of respondents by Work Experience
Teachers
Head Teachers
Work experience f % f %
Less than 5years 6 3.9 0 0
6-10 years 17 11.2 0 0
11-15 years 12 7.9 0 0
16-20 years 21 13.8 0 0
21 years and above 96 63.2 28 100
Total 152 100.0 28 100
The findings reveal that majority of the teachers 96(63.2%) had an experience of 21 years
and above, 21(13.8%) had an experience of 16-20 years, 17(11.3%) had an experience of
6010 years while the least 6(3.9%)had an experience of less than 5 years. All the head
teachers 28 (100%) had an experience of 21 years and above. The findings imply that all
the teachers and head teachers were well experienced. UNESCO (2005) underscores the
need to have experienced school managers who can work jointly with other stakeholders
towards the success of educational programmes.
4.3.5 Distribution of respondents by position
The aim of the research was to find out the position of the respondents. The distribution is
introduced in Table 4.6.
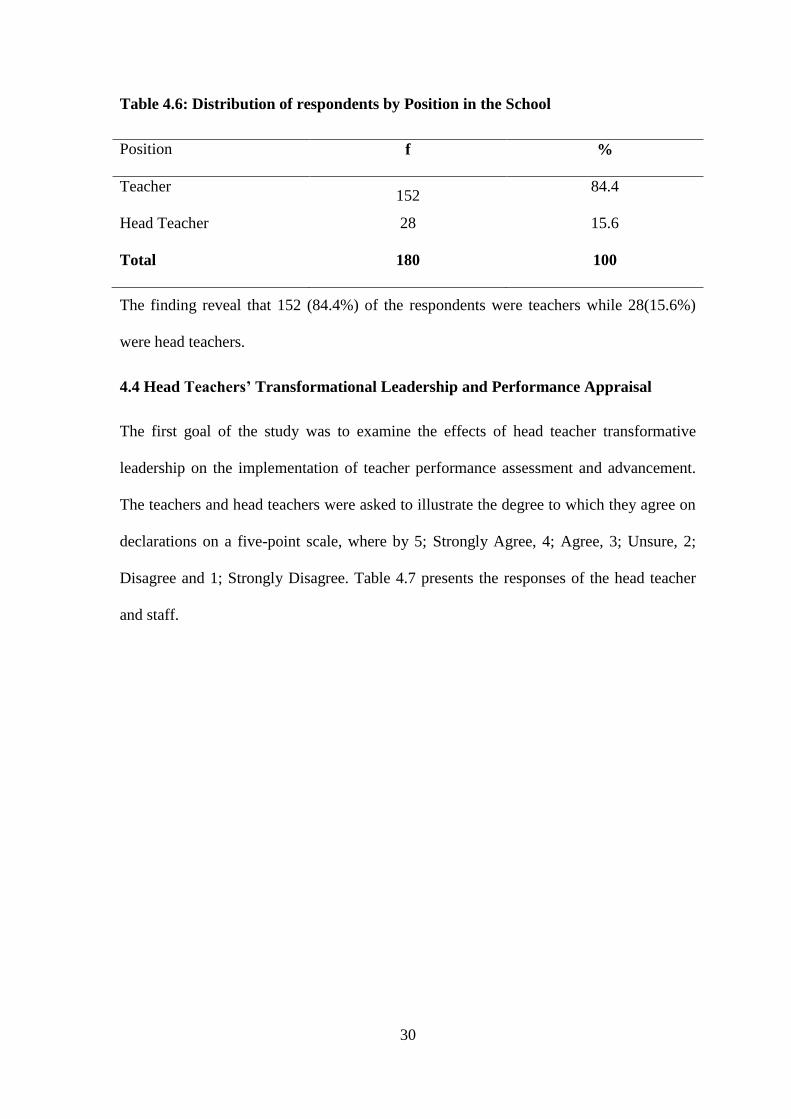
30
Table 4.6: Distribution of respondents by Position in the School
Position f %
Teacher 152
84.4
Head Teacher 28 15.6
Total 180 100
The finding reveal that 152 (84.4%) of the respondents were teachers while 28(15.6%)
were head teachers.
4.4 Head Teachers’ Transformational Leadership and Performance Appraisal
The first goal of the study was to examine the effects of head teacher transformative
leadership on the implementation of teacher performance assessment and advancement.
The teachers and head teachers were asked to illustrate the degree to which they agree on
declarations on a five-point scale, where by 5; Strongly Agree, 4; Agree, 3; Unsure, 2;
Disagree and 1; Strongly Disagree. Table 4.7 presents the responses of the head teacher
and staff.
31
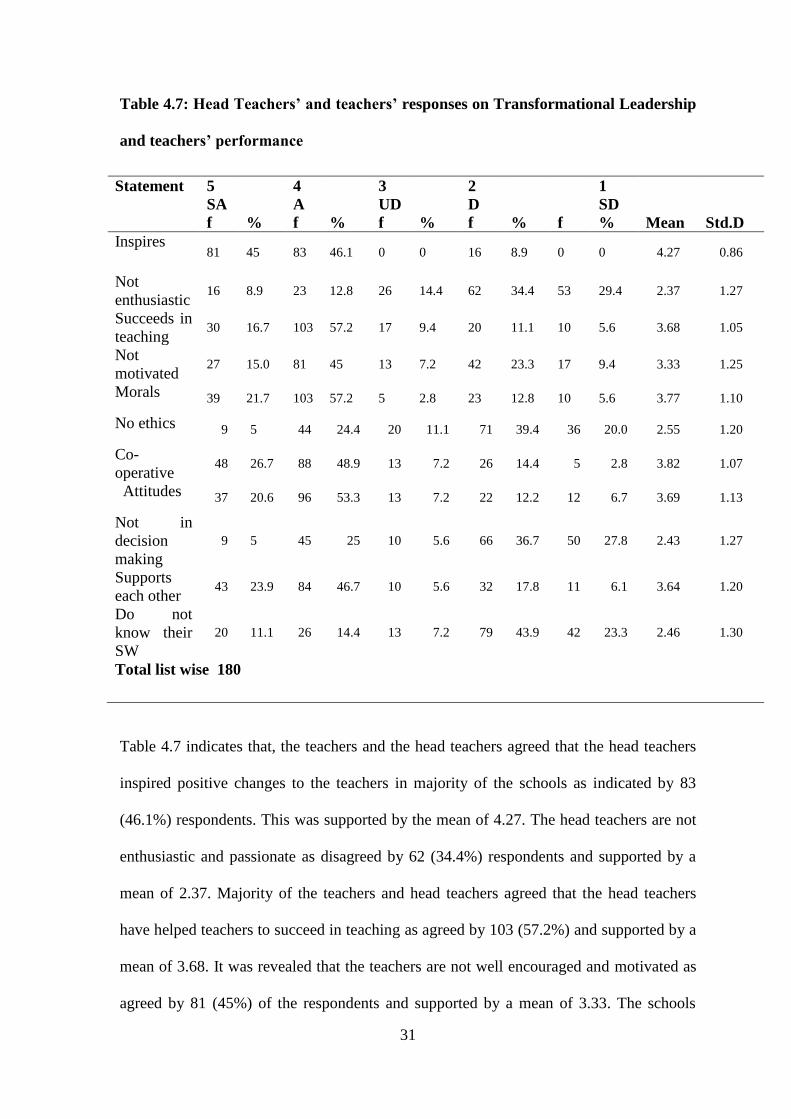
Table 4.7: Head Teachers’ and teachers’ responses on Transformational Leadership
and teachers’ performance
Statement 5
SA
4
A
3
UD
2
D
1
SD
f % f % f % f % f % Mean Std.D
Inspires 81 45 83 46.1 0 0 16 8.9 0 0 4.27 0.86
Not
enthusiastic 16 8.9 23 12.8 26 14.4 62 34.4 53 29.4 2.37 1.27
Succeeds in
teaching 30 16.7 103 57.2 17 9.4 20 11.1 10 5.6 3.68 1.05
Not
motivated 27 15.0 81 45 13 7.2 42 23.3 17 9.4 3.33 1.25
Morals 39 21.7 103 57.2 5 2.8 23 12.8 10 5.6 3.77 1.10
No ethics 9 5 44 24.4 20 11.1 71 39.4 36 20.0 2.55 1.20
Co-
operative 48 26.7 88 48.9 13 7.2 26 14.4 5 2.8 3.82 1.07
Attitudes 37 20.6 96 53.3 13 7.2 22 12.2 12 6.7 3.69 1.13
Not in
decision
making
9 5 45 25 10 5.6 66 36.7 50 27.8 2.43 1.27
Supports
each other 43 23.9 84 46.7 10 5.6 32 17.8 11 6.1 3.64 1.20
Do not
know their
SW
20 11.1 26 14.4 13 7.2 79 43.9 42 23.3 2.46 1.30
Total list wise 180
Table 4.7 indicates that, the teachers and the head teachers agreed that the head teachers
inspired positive changes to the teachers in majority of the schools as indicated by 83
(46.1%) respondents. This was supported by the mean of 4.27. The head teachers are not
enthusiastic and passionate as disagreed by 62 (34.4%) respondents and supported by a
mean of 2.37. Majority of the teachers and head teachers agreed that the head teachers
have helped teachers to succeed in teaching as agreed by 103 (57.2%) and supported by a
mean of 3.68. It was revealed that the teachers are not well encouraged and motivated as
agreed by 81 (45%) of the respondents and supported by a mean of 3.33. The schools
32
exemplify moral standards as agreed by 103 (57.2%) of the respondents and supported by
a mean of 3.77.
Most of the respondents disagreed that teachers do not enjoy an ethical working
atmosphere with specific goals and expectations of values, as shown by 71 (39.4%)
respondents and supported by a mean of 2.55. Teachers were authentically co-operative
and enjoy open communication as indicated by 88 (48.9%) respondents and supported by
a mean of 3.82. Majority of the respondents agreed that teachers’ were self-driven and
worked for a common goal as indicated by 96(53.3%) respondents as supported by a
mean of 3.69.
Most of teachers and head teachers disagreed that the teachers are not allowed to
participate in decision making as indicated by 66 (36.7%) and supported by a mean of
2.43. The respondents were of the opinion that, as shown by 84 (46.7 %) respondents and
further endorsed by an average of 3.64, they supported each other and the school as a
whole. Much of the respondents disagreed that teachers should not recognize their power
and limitations (disagreed by 79 (43.9%) respondents and further supported by a mean of
2.46.
Further the study sought information from TSC sub-county. From the interview, the study
found that head teachers were recruited only after attainment of experience job group M.
The sub county staffing officer further revealed that the head teachers practiced
transformative leadership styles. It was established that teachers were authentically co-
operative and enjoy open communication. Waiganjo (2015) says that transformative
leadership helps followers grow and evolve into leaders by encouraging them and
aligning the priorities and objectives of individual followers, leaders, the community and
the larger organization to respond to the needs of individual followers.
33
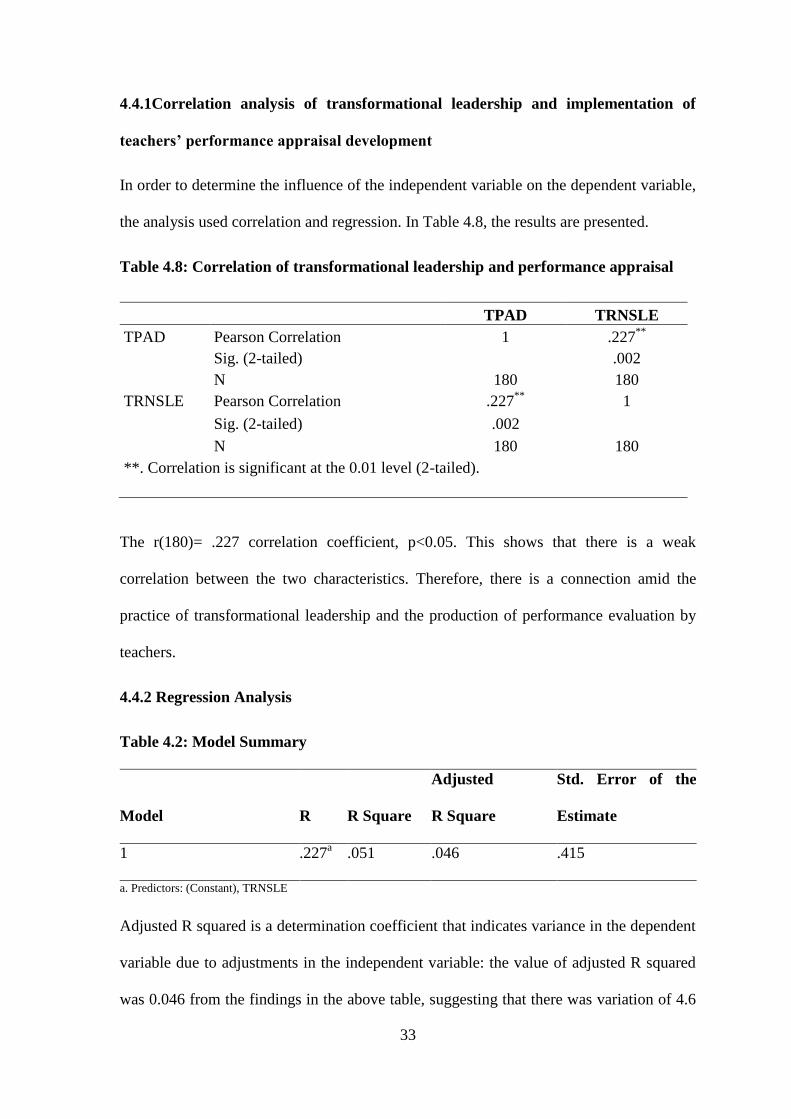
4.4.1Correlation analysis of transformational leadership and implementation of
teachers’ performance appraisal development
In order to determine the influence of the independent variable on the dependent variable,
the analysis used correlation and regression. In Table 4.8, the results are presented.
Table 4.8: Correlation of transformational leadership and performance appraisal
TPAD TRNSLE
TPAD Pearson Correlation 1 .227**
Sig. (2-tailed) .002
N 180 180
TRNSLE Pearson Correlation .227**
1
Sig. (2-tailed) .002
N 180 180
**. Correlation is significant at the 0.01 level (2-tailed).
The r(180)= .227 correlation coefficient, p<0.05. This shows that there is a weak
correlation between the two characteristics. Therefore, there is a connection amid the
practice of transformational leadership and the production of performance evaluation by
teachers.
4.4.2 Regression Analysis
Table 4.2: Model Summary
Model R R Square
Adjusted
R Square
Std. Error of the
Estimate
1 .227a .051 .046 .415
a. Predictors: (Constant), TRNSLE
Adjusted R squared is a determination coefficient that indicates variance in the dependent
variable due to adjustments in the independent variable: the value of adjusted R squared
was 0.046 from the findings in the above table, suggesting that there was variation of 4.6

34
percent on implementation of the performance appraisal growth of teachers due to
changes in transformational leadership practice at 95 pp. R is the correlation coefficient
that indicates the association amid the research variables, as shown by 0.227, there was a
positive relationship amid transformational leadership improvements and teacher
performance evaluation implementation.
The study examined the model’s significance through application of Analysis of Variance
(ANOVA) method. The outcomes are illustrated.
Table 4.3: ANOVAa
Model
Sum of
Squares df Mean Square F Sig.
1 Regression 1.663 1 1.663 9.649 .002b
Residual 30.678 178 .172
Total 32.341 179
a. Dependent Variable: TPAD
b. Predictors: (Constant), TRNSLE
The critical F was 3.89 at the 5 % significance stage, 1d.f, 178 d.f, while the calculated F
was 9.649, as the calculated F is greater than the critical F (value = 3.89), which indicates
that the overall model was important. The processed results, which is the population
parameters, had a meaning level of 0.002 percent because the null hypothesis was
rejected by p 0.002 <0.05. This indicates that there is a major difference between the
transformational leadership practice of head teachers and the performance evaluation
production of teachers.
Table 4.4: Regression Coefficientsa
Model
Unstandardized Coefficients
Standardized
Coefficients
t Sig. B Std. Error Beta
1 (Constant) 2.192 .274 8.000 .000
TRNSLE .310 .100 .227 3.106 .002
a. Dependent Variable: TPAD
35
It was observed from the regression equation above that holding transformational
leadership practice to a constant zero would be 2.192 to implement the performance
assessment development of teachers. A unit increase in transformational leadership
practice would lead to an increase of 0.31 units in the performance assessment
development of teachers' implementation. Transformational leadership experience was
important at a 5 percent level of significance and a 95 percent level of trust (p
0.002<0.05).
4.5 Reward Strategy and Performance Appraisal Development
The second objective of the study aimed to ascertain the effect of the incentive approach
on the performance evaluation development of teachers. On a five-point likert scale
where by 5; Strongly Agree, 4; Agree, 3; Undecided, 2; Disagree and 1; Strongly
Disagree, the teachers and the head teachers were asked to show their degree of
agreement with the claims. The results are presented in Table 4.12
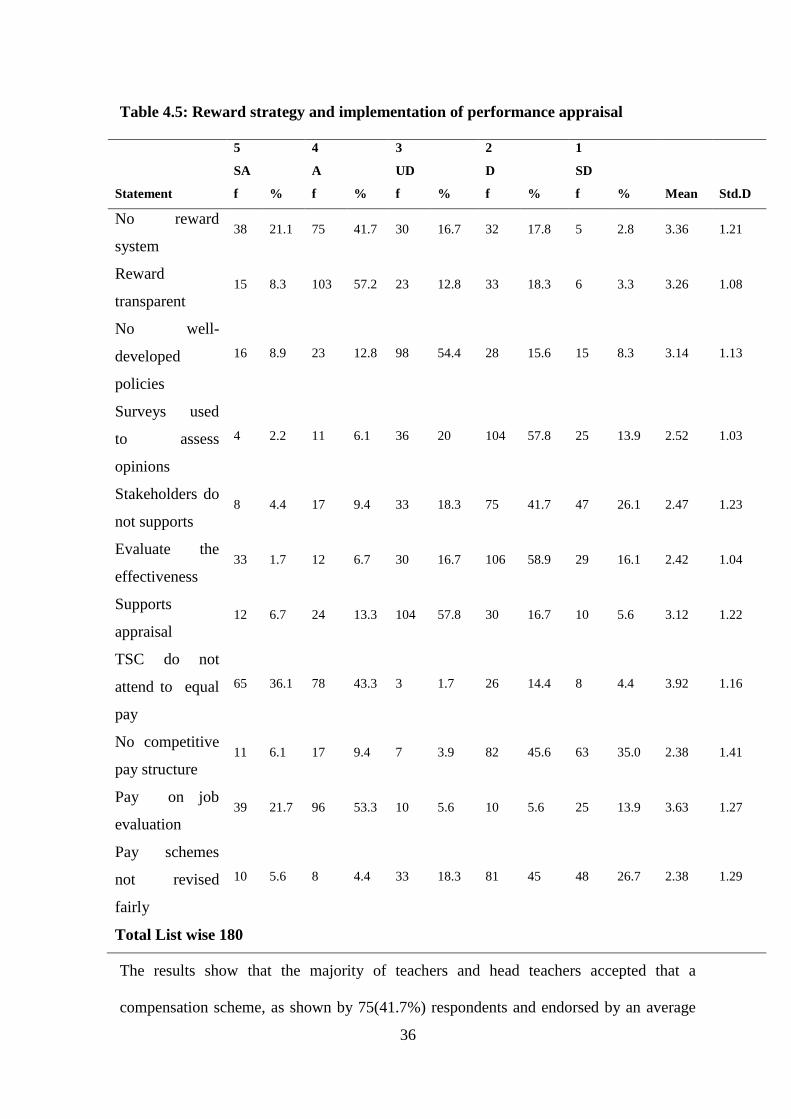
36
Table 4.5: Reward strategy and implementation of performance appraisal
5
SA
4
A
3
UD
2
D
1
SD
Statement f % f % f % f % f % Mean Std.D
No reward
system 38 21.1 75 41.7 30 16.7 32 17.8 5 2.8 3.36 1.21
Reward
transparent 15 8.3 103 57.2 23 12.8 33 18.3 6 3.3 3.26 1.08
No well-
developed
policies
16 8.9 23 12.8 98 54.4 28 15.6 15 8.3 3.14 1.13
Surveys used
to assess
opinions
4 2.2 11 6.1 36 20 104 57.8 25 13.9 2.52 1.03
Stakeholders do
not supports 8 4.4 17 9.4 33 18.3 75 41.7 47 26.1 2.47 1.23
Evaluate the
effectiveness 33 1.7 12 6.7 30 16.7 106 58.9 29 16.1 2.42 1.04
Supports
appraisal 12 6.7 24 13.3 104 57.8 30 16.7 10 5.6 3.12 1.22
TSC do not
attend to equal
pay
65 36.1 78 43.3 3 1.7 26 14.4 8 4.4 3.92 1.16
No competitive
pay structure 11 6.1 17 9.4 7 3.9 82 45.6 63 35.0 2.38 1.41
Pay on job
evaluation 39 21.7 96 53.3 10 5.6 10 5.6 25 13.9 3.63 1.27
Pay schemes
not revised
fairly
10 5.6 8 4.4 33 18.3 81 45 48 26.7 2.38 1.29
Total List wise 180
The results show that the majority of teachers and head teachers accepted that a
compensation scheme, as shown by 75(41.7%) respondents and endorsed by an average
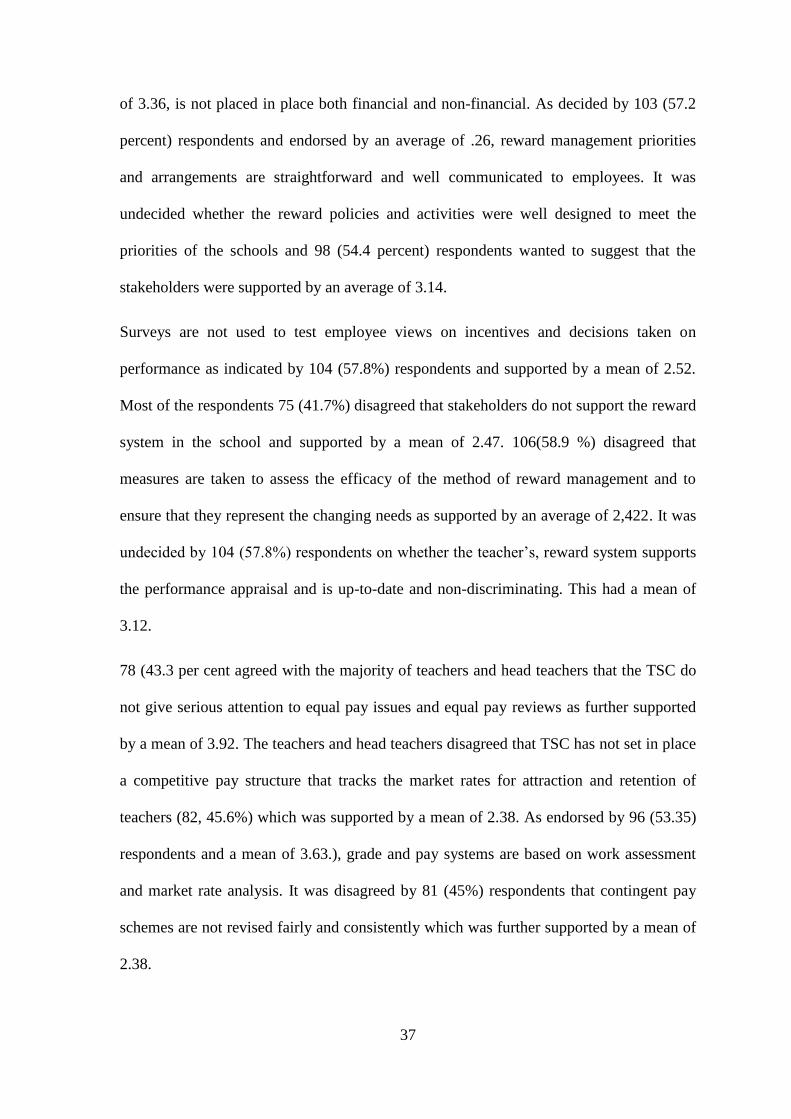
37
of 3.36, is not placed in place both financial and non-financial. As decided by 103 (57.2
percent) respondents and endorsed by an average of .26, reward management priorities
and arrangements are straightforward and well communicated to employees. It was
undecided whether the reward policies and activities were well designed to meet the
priorities of the schools and 98 (54.4 percent) respondents wanted to suggest that the
stakeholders were supported by an average of 3.14.
Surveys are not used to test employee views on incentives and decisions taken on
performance as indicated by 104 (57.8%) respondents and supported by a mean of 2.52.
Most of the respondents 75 (41.7%) disagreed that stakeholders do not support the reward
system in the school and supported by a mean of 2.47. 106(58.9 %) disagreed that
measures are taken to assess the efficacy of the method of reward management and to
ensure that they represent the changing needs as supported by an average of 2,422. It was
undecided by 104 (57.8%) respondents on whether the teacher’s, reward system supports
the performance appraisal and is up-to-date and non-discriminating. This had a mean of
3.12.
78 (43.3 per cent agreed with the majority of teachers and head teachers that the TSC do
not give serious attention to equal pay issues and equal pay reviews as further supported
by a mean of 3.92. The teachers and head teachers disagreed that TSC has not set in place
a competitive pay structure that tracks the market rates for attraction and retention of
teachers (82, 45.6%) which was supported by a mean of 2.38. As endorsed by 96 (53.35)
respondents and a mean of 3.63.), grade and pay systems are based on work assessment
and market rate analysis. It was disagreed by 81 (45%) respondents that contingent pay
schemes are not revised fairly and consistently which was further supported by a mean of
2.38.
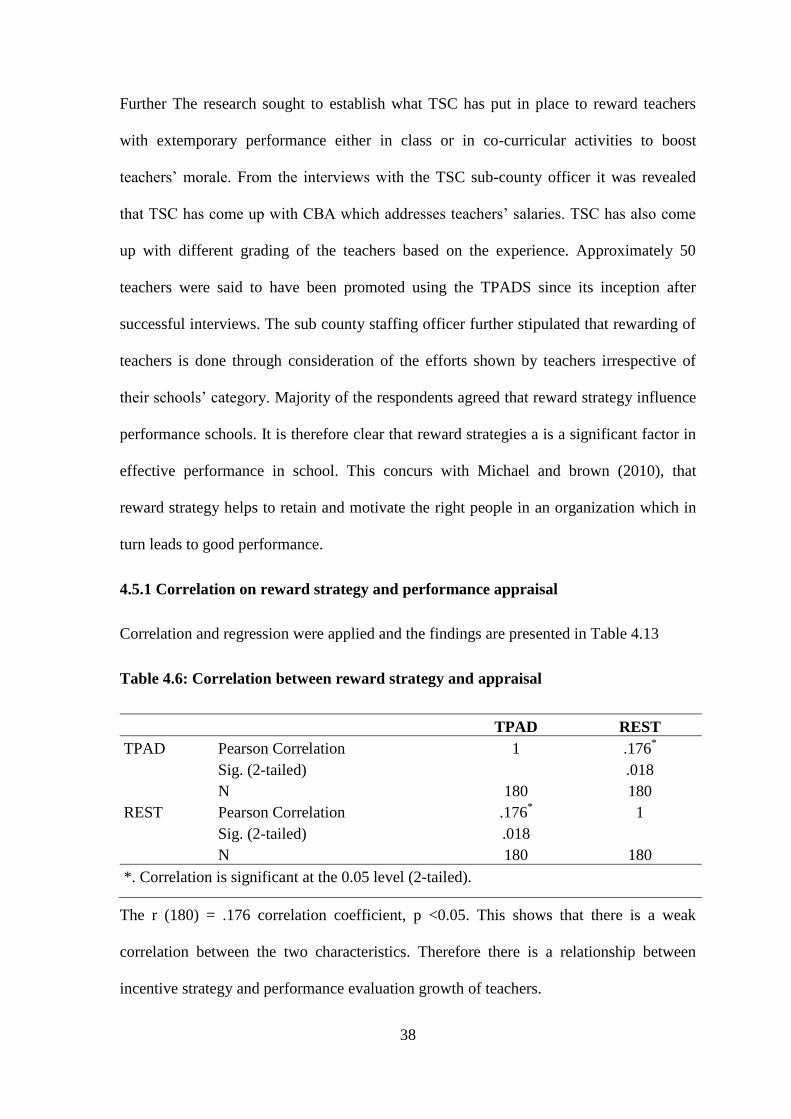
38
Further The research sought to establish what TSC has put in place to reward teachers
with extemporary performance either in class or in co-curricular activities to boost
teachers’ morale. From the interviews with the TSC sub-county officer it was revealed
that TSC has come up with CBA which addresses teachers’ salaries. TSC has also come
up with different grading of the teachers based on the experience. Approximately 50
teachers were said to have been promoted using the TPADS since its inception after
successful interviews. The sub county staffing officer further stipulated that rewarding of
teachers is done through consideration of the efforts shown by teachers irrespective of
their schools’ category. Majority of the respondents agreed that reward strategy influence
performance schools. It is therefore clear that reward strategies a is a significant factor in
effective performance in school. This concurs with Michael and brown (2010), that
reward strategy helps to retain and motivate the right people in an organization which in
turn leads to good performance.
4.5.1 Correlation on reward strategy and performance appraisal
Correlation and regression were applied and the findings are presented in Table 4.13
Table 4.6: Correlation between reward strategy and appraisal
TPAD REST
TPAD Pearson Correlation 1 .176*
Sig. (2-tailed) .018
N 180 180
REST Pearson Correlation .176* 1
Sig. (2-tailed) .018
N 180 180
*. Correlation is significant at the 0.05 level (2-tailed).
The r (180) = .176 correlation coefficient, p <0.05. This shows that there is a weak
correlation between the two characteristics. Therefore there is a relationship between
incentive strategy and performance evaluation growth of teachers.
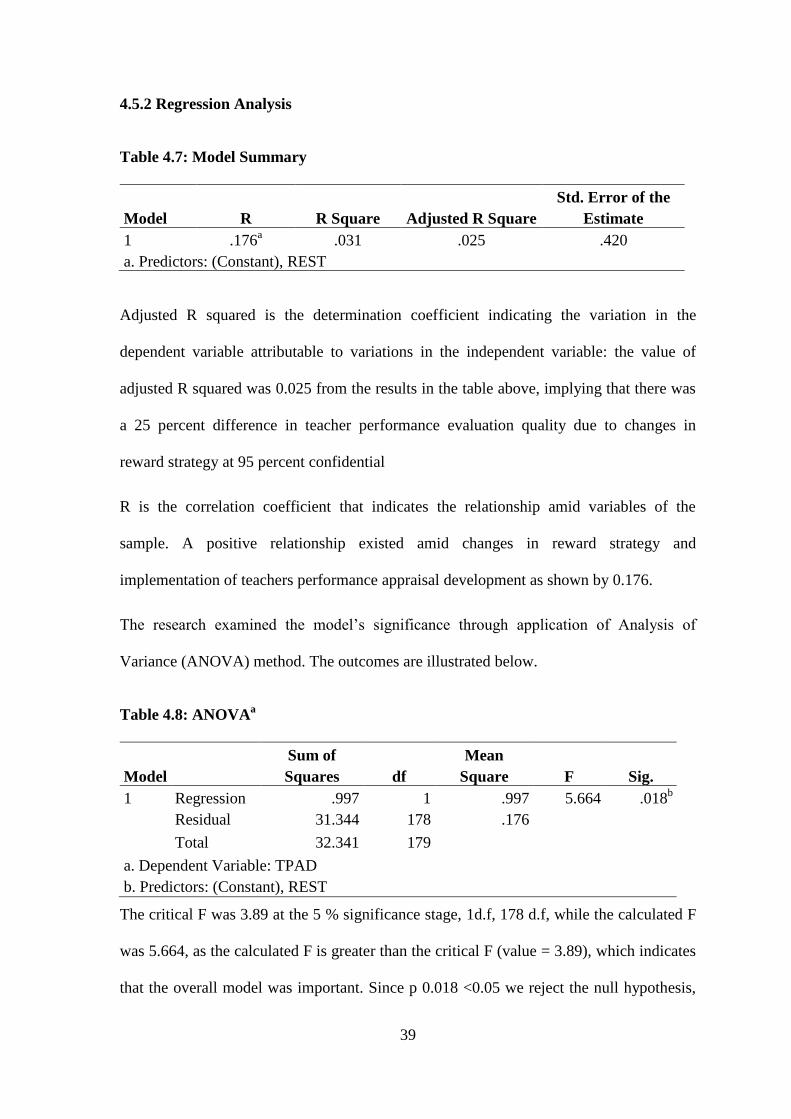
39
4.5.2 Regression Analysis
Table 4.7: Model Summary
Model R R Square Adjusted R Square
Std. Error of the
Estimate
1 .176a .031 .025 .420
a. Predictors: (Constant), REST
Adjusted R squared is the determination coefficient indicating the variation in the
dependent variable attributable to variations in the independent variable: the value of
adjusted R squared was 0.025 from the results in the table above, implying that there was
a 25 percent difference in teacher performance evaluation quality due to changes in
reward strategy at 95 percent confidential
R is the correlation coefficient that indicates the relationship amid variables of the
sample. A positive relationship existed amid changes in reward strategy and
implementation of teachers performance appraisal development as shown by 0.176.
The research examined the model’s significance through application of Analysis of
Variance (ANOVA) method. The outcomes are illustrated below.
Table 4.8: ANOVAa
Model
Sum of
Squares df
Mean
Square F Sig.
1 Regression .997 1 .997 5.664 .018b
Residual 31.344 178 .176
Total 32.341 179
a. Dependent Variable: TPAD
b. Predictors: (Constant), REST
The critical F was 3.89 at the 5 % significance stage, 1d.f, 178 d.f, while the calculated F
was 5.664, as the calculated F is greater than the critical F (value = 3.89), which indicates
that the overall model was important. Since p 0.018 <0.05 we reject the null hypothesis,
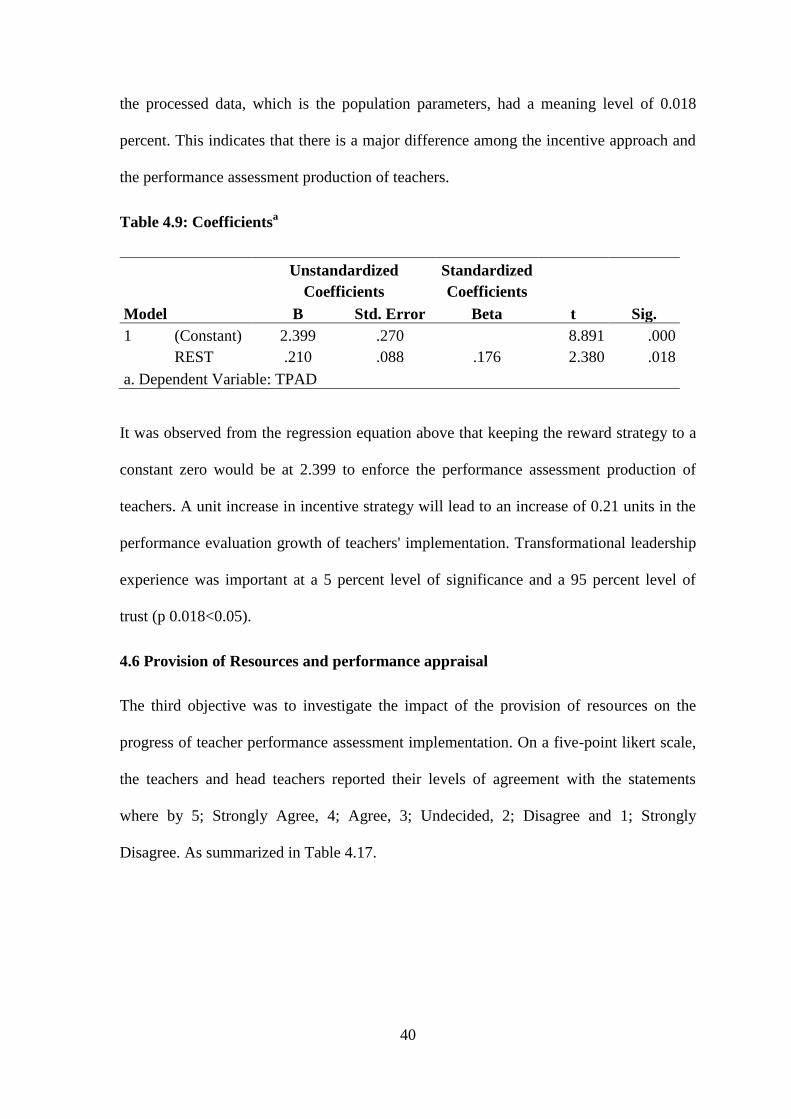
40
the processed data, which is the population parameters, had a meaning level of 0.018
percent. This indicates that there is a major difference among the incentive approach and
the performance assessment production of teachers.
Table 4.9: Coefficientsa
Model
Unstandardized
Coefficients
Standardized
Coefficients
t Sig. B Std. Error Beta
1 (Constant) 2.399 .270 8.891 .000
REST .210 .088 .176 2.380 .018
a. Dependent Variable: TPAD
It was observed from the regression equation above that keeping the reward strategy to a
constant zero would be at 2.399 to enforce the performance assessment production of
teachers. A unit increase in incentive strategy will lead to an increase of 0.21 units in the
performance evaluation growth of teachers' implementation. Transformational leadership
experience was important at a 5 percent level of significance and a 95 percent level of
trust (p 0.018<0.05).
4.6 Provision of Resources and performance appraisal
The third objective was to investigate the impact of the provision of resources on the
progress of teacher performance assessment implementation. On a five-point likert scale,
the teachers and head teachers reported their levels of agreement with the statements
where by 5; Strongly Agree, 4; Agree, 3; Undecided, 2; Disagree and 1; Strongly
Disagree. As summarized in Table 4.17.
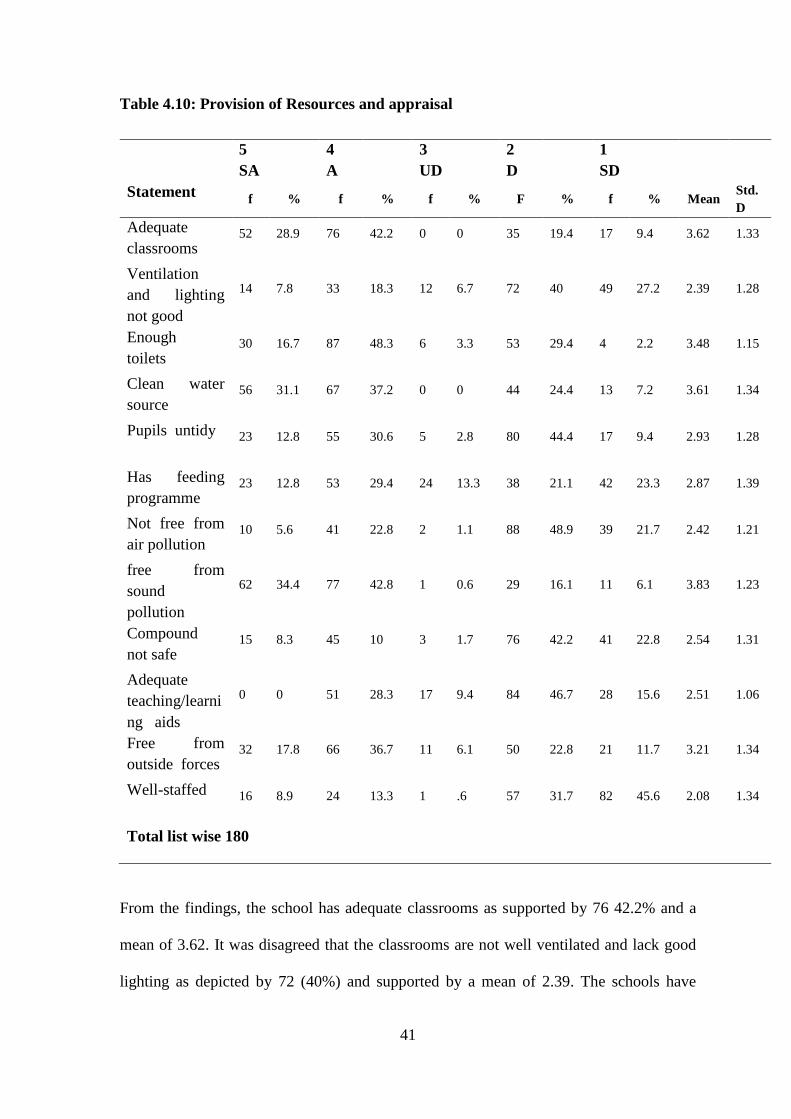
41
Table 4.10: Provision of Resources and appraisal
5
SA
4
A
3
UD
2
D
1
SD
Statement f % f % f % F % f % Mean
Std.
D
Adequate
classrooms 52 28.9 76 42.2 0 0 35 19.4 17 9.4 3.62 1.33
Ventilation
and lighting
not good
14 7.8 33 18.3 12 6.7 72 40 49 27.2 2.39 1.28
Enough
toilets 30 16.7 87 48.3 6 3.3 53 29.4 4 2.2 3.48 1.15
Clean water
source 56 31.1 67 37.2 0 0 44 24.4 13 7.2 3.61 1.34
Pupils untidy 23 12.8 55 30.6 5 2.8 80 44.4 17 9.4 2.93 1.28
Has feeding
programme 23 12.8 53 29.4 24 13.3 38 21.1 42 23.3 2.87 1.39
Not free from
air pollution 10 5.6 41 22.8 2 1.1 88 48.9 39 21.7 2.42 1.21
free from
sound
pollution
62 34.4 77 42.8 1 0.6 29 16.1 11 6.1 3.83 1.23
Compound
not safe 15 8.3 45 10 3 1.7 76 42.2 41 22.8 2.54 1.31
Adequate
teaching/learni
ng aids
0 0 51 28.3 17 9.4 84 46.7 28 15.6 2.51 1.06
Free from
outside forces 32 17.8 66 36.7 11 6.1 50 22.8 21 11.7 3.21 1.34
Well-staffed 16 8.9 24 13.3 1 .6 57 31.7 82 45.6 2.08 1.34
Total list wise 180
From the findings, the school has adequate classrooms as supported by 76 42.2% and a
mean of 3.62. It was disagreed that the classrooms are not well ventilated and lack good
lighting as depicted by 72 (40%) and supported by a mean of 2.39. The schools have
42
enough toilets for teachers, boys and girls as agreed by 87 (48.3%) and supported by a
mean of 3.48. The school has adequate source of clean water as agreed by 67 (37.2%) and
supported by a mean of 3.61. It was revealed that most respondents disagreed the pupils
were untidy and wears worn out clothes as indicated by 80(44.4%) while as supported by
a mean of 2.93. Most of the schools have well-organized feeding programmes as
indicated by 53 (29.4%) and a mean of 2.87. The respondents disagreed that the schools
are not free from air pollution as indicated by 88 (48.9%) and supported by a mean of
2.42. The schools are free from sound pollution as agreed by 77 (42.8%) and supported
by a mean of 3.83. Most respondents disagreed that the school compound is not safe for
their pupils indicated by 76(42.2%) with a mean of 2.54.
It was not accepted that 84(46.7 %) and helped by an average of 2.51, the school has
sufficient teaching/learning aids. It was undecided whether the schools, funded by an
average of 3.21, were free from outside influences and interruptions. Most teachers and
head teachers disagreed that the schools were well staffed, as 57 (31.7 %) were strongly
endorsed and supported by an average of 2.08.
The study also aimed to evaluate what the government has done to ensure that all schools
have the basic services required. From the interview conducted with the TSC sub-county
officer, it was revealed that the government has embarked on text book supply. The
government has made efforts in construction of classrooms and has provided funds for
purchase of teaching aids.
Majority of the schools have adequate basic resources. According to Bizamna (2014), the
lack of physical resources hampers teaching, depresses the children's spirit and teachers'
enthusiasm. Most of the respondents verified the availability of these tools.
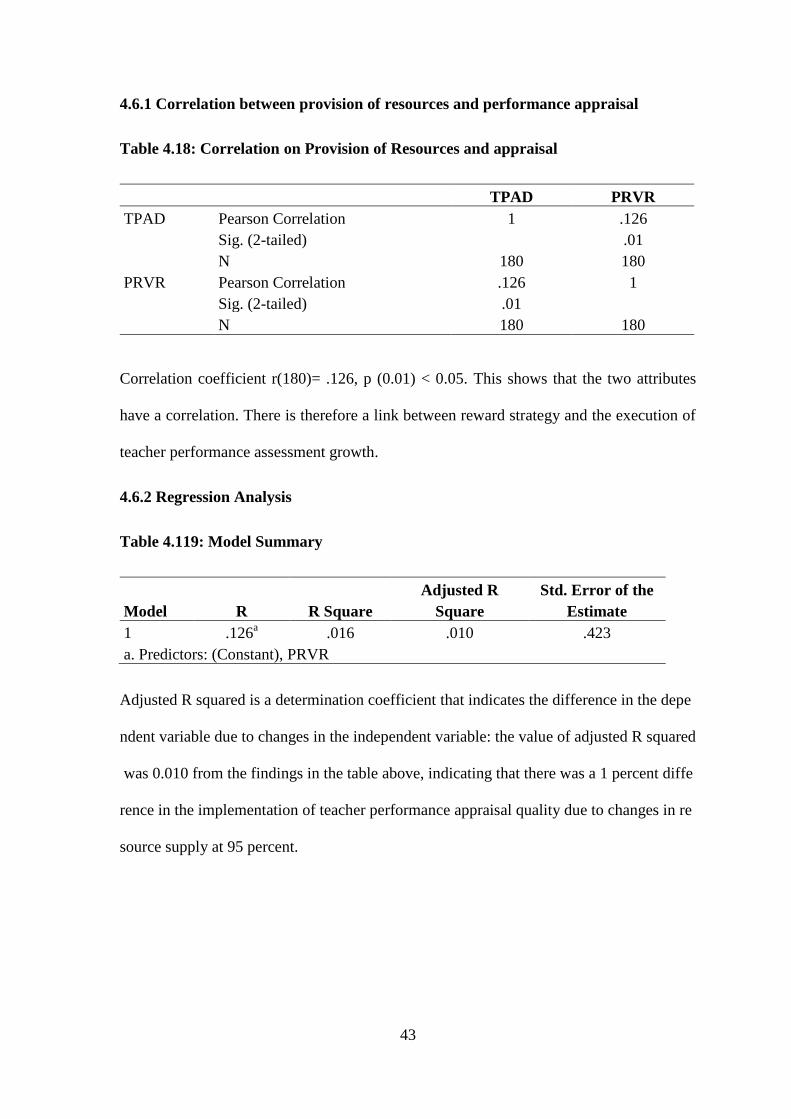
43
4.6.1 Correlation between provision of resources and performance appraisal
Table 4.18: Correlation on Provision of Resources and appraisal
TPAD PRVR
TPAD Pearson Correlation 1 .126
Sig. (2-tailed) .01
N 180 180
PRVR Pearson Correlation .126 1
Sig. (2-tailed) .01
N 180 180
Correlation coefficient r(180)= .126, p (0.01) < 0.05. This shows that the two attributes
have a correlation. There is therefore a link between reward strategy and the execution of
teacher performance assessment growth.
4.6.2 Regression Analysis
Table 4.119: Model Summary
Model R R Square
Adjusted R
Square
Std. Error of the
Estimate
1 .126a .016 .010 .423
a. Predictors: (Constant), PRVR
Adjusted R squared is a determination coefficient that indicates the difference in the depe
ndent variable due to changes in the independent variable: the value of adjusted R squared
was 0.010 from the findings in the table above, indicating that there was a 1 percent diffe
rence in the implementation of teacher performance appraisal quality due to changes in re
source supply at 95 percent.
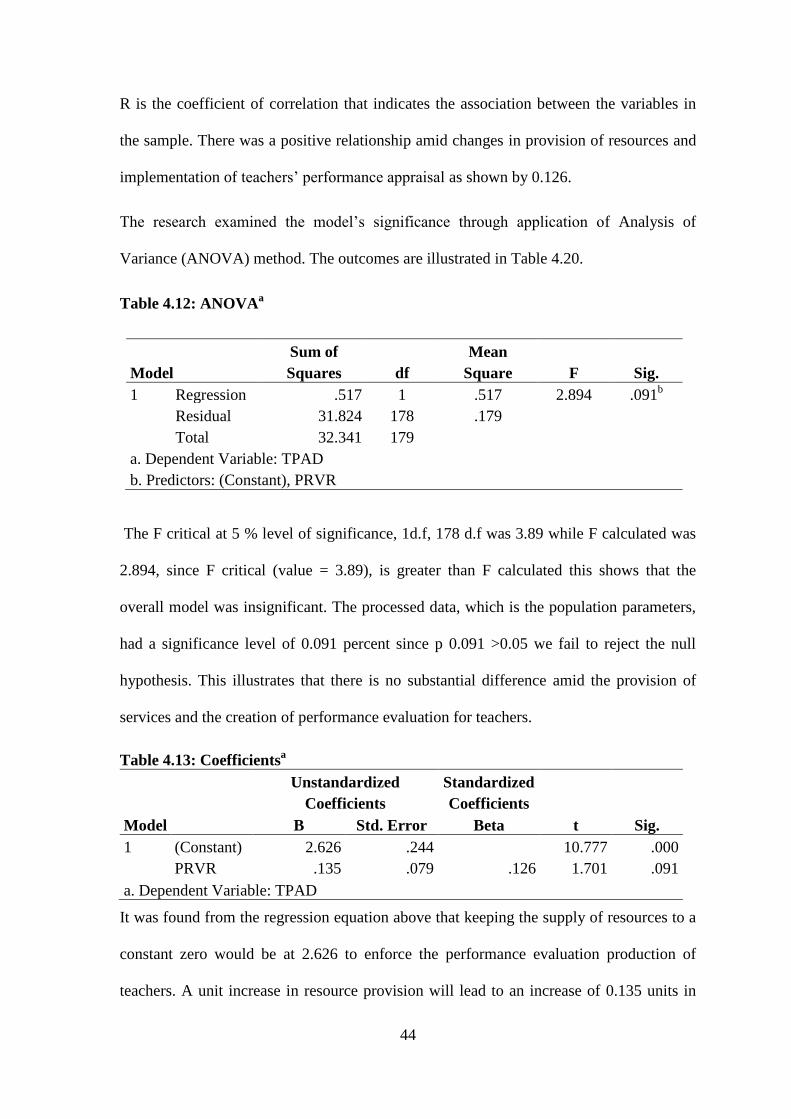
44
R is the coefficient of correlation that indicates the association between the variables in
the sample. There was a positive relationship amid changes in provision of resources and
implementation of teachers’ performance appraisal as shown by 0.126.
The research examined the model’s significance through application of Analysis of
Variance (ANOVA) method. The outcomes are illustrated in Table 4.20.
Table 4.12: ANOVAa
Model
Sum of
Squares df
Mean
Square F Sig.
1 Regression .517 1 .517 2.894 .091b
Residual 31.824 178 .179
Total 32.341 179
a. Dependent Variable: TPAD
b. Predictors: (Constant), PRVR
The F critical at 5 % level of significance, 1d.f, 178 d.f was 3.89 while F calculated was
2.894, since F critical (value = 3.89), is greater than F calculated this shows that the
overall model was insignificant. The processed data, which is the population parameters,
had a significance level of 0.091 percent since p 0.091 >0.05 we fail to reject the null
hypothesis. This illustrates that there is no substantial difference amid the provision of
services and the creation of performance evaluation for teachers.
Table 4.13: Coefficientsa
Model
Unstandardized
Coefficients
Standardized
Coefficients
t Sig. B Std. Error Beta
1 (Constant) 2.626 .244 10.777 .000
PRVR .135 .079 .126 1.701 .091
a. Dependent Variable: TPAD
It was found from the regression equation above that keeping the supply of resources to a
constant zero would be at 2.626 to enforce the performance evaluation production of
teachers. A unit increase in resource provision will lead to an increase of 0.135 units in
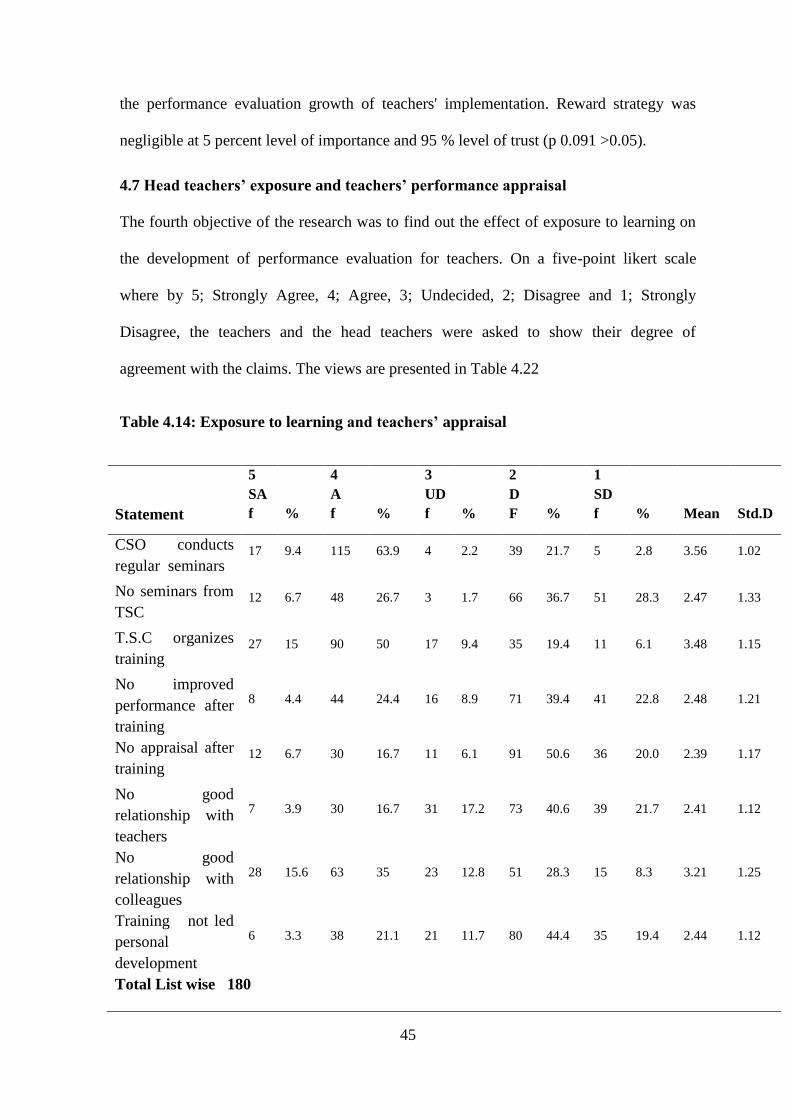
45
the performance evaluation growth of teachers' implementation. Reward strategy was
negligible at 5 percent level of importance and 95 % level of trust (p 0.091 >0.05).
4.7 Head teachers’ exposure and teachers’ performance appraisal
The fourth objective of the research was to find out the effect of exposure to learning on
the development of performance evaluation for teachers. On a five-point likert scale
where by 5; Strongly Agree, 4; Agree, 3; Undecided, 2; Disagree and 1; Strongly
Disagree, the teachers and the head teachers were asked to show their degree of
agreement with the claims. The views are presented in Table 4.22
Table 4.14: Exposure to learning and teachers’ appraisal
5
SA
4
A
3
UD
2
D
1
SD
Statement f % f % f % F % f % Mean Std.D
CSO conducts
regular seminars 17 9.4 115 63.9 4 2.2 39 21.7 5 2.8 3.56 1.02
No seminars from
TSC 12 6.7 48 26.7 3 1.7 66 36.7 51 28.3 2.47 1.33
T.S.C organizes
training 27 15 90 50 17 9.4 35 19.4 11 6.1 3.48 1.15
No improved
performance after
training
8 4.4 44 24.4 16 8.9 71 39.4 41 22.8 2.48 1.21
No appraisal after
training 12 6.7 30 16.7 11 6.1 91 50.6 36 20.0 2.39 1.17
No good
relationship with
teachers
7 3.9 30 16.7 31 17.2 73 40.6 39 21.7 2.41 1.12
No good
relationship with
colleagues
28 15.6 63 35 23 12.8 51 28.3 15 8.3 3.21 1.25
Training not led
personal
development
6 3.3 38 21.1 21 11.7 80 44.4 35 19.4 2.44 1.12
Total List wise 180
46
The majority of teachers and head teachers accepted that regular seminars/courses for
teachers are performed by 115(63.9%) and sponsored by an average of 3.56 by the
curriculum support offices. Most respondents disagreed that 66 (37.6 %) and endorsed by
an average of 2.47 did not arrange seminars / courses for teachers by the TSC.
The majority of teachers and head teachers agreed that 90 (50 per cent) and supported by
an average of 3.48, T.S.C organizes teacher training. Most teachers disagreed that the
training received did not lead to enhanced performance in teaching 71(39.4 percent) and
supported by an average of 2.48. It was not decided that the training received did not
contribute to the evaluation of teachers by 91 (50.6%) respondents with a mean of 2.39.
Most of the teachers and head teachers disagreed that the training received has not led to
their good relationship with the teachers as indicated by 73 (40.6%) with a mean of 2.41.
Most of the teachers and head teachers were undecided whether the training received has
not lead to good relationship with colleagues as indicated by a mean of 3.21. The findings
reveal that the respondents disagreed that the training received has not led to their
personal development indicated by 80(44.4%) respondents and supported by a mean of
2.44.
Further the study sought to find out what TSC has put in place to offer teachers on the job
training opportunities. The interview with the TSC sub county officer revealed that TSC
was at the time training teachers in CBC. The purpose of such training was said to be for
the improvement of competency based curriculum. The interview provided that TSC had
provided a guideline that all teachers must be trained after every 5 years and has
developed the training modules however the training had not commenced due to wrangles
between TSC and KNUT. The study further established that the head teachers are
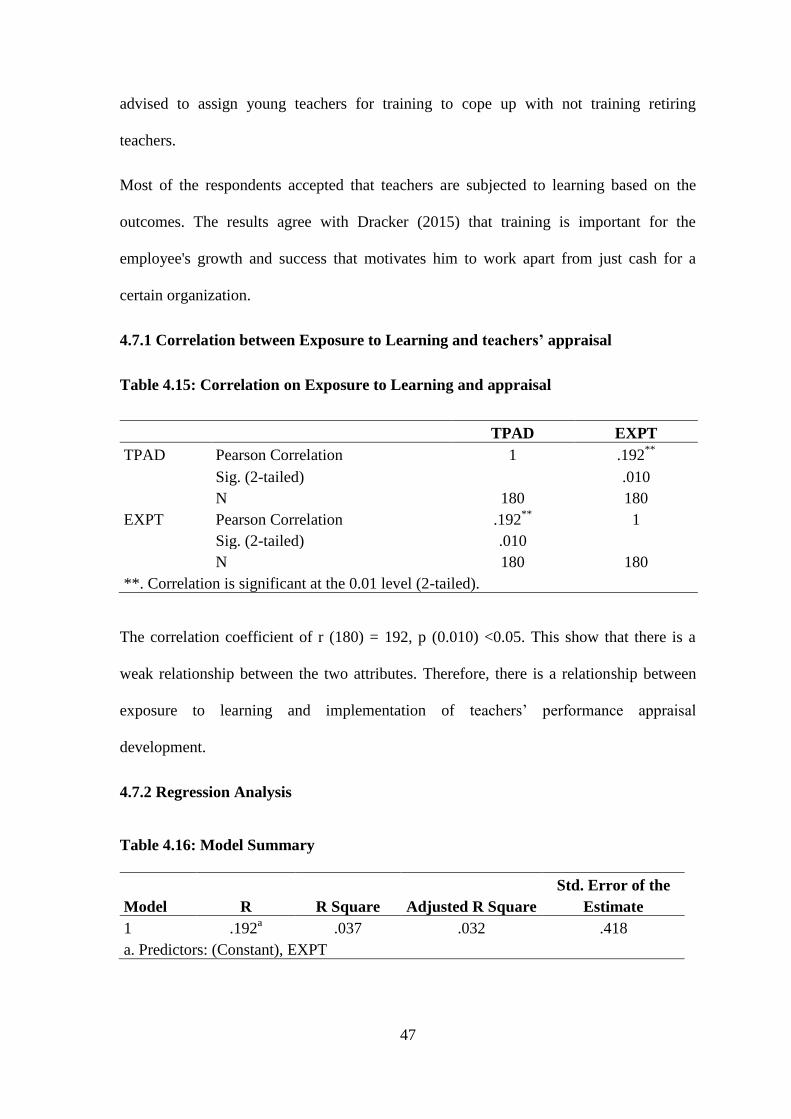
47
advised to assign young teachers for training to cope up with not training retiring
teachers.
Most of the respondents accepted that teachers are subjected to learning based on the
outcomes. The results agree with Dracker (2015) that training is important for the
employee's growth and success that motivates him to work apart from just cash for a
certain organization.
4.7.1 Correlation between Exposure to Learning and teachers’ appraisal
Table 4.15: Correlation on Exposure to Learning and appraisal
TPAD EXPT
TPAD Pearson Correlation 1 .192**
Sig. (2-tailed) .010
N 180 180
EXPT Pearson Correlation .192**
1
Sig. (2-tailed) .010
N 180 180
**. Correlation is significant at the 0.01 level (2-tailed).
The correlation coefficient of r (180) = 192, p (0.010) <0.05. This show that there is a
weak relationship between the two attributes. Therefore, there is a relationship between
exposure to learning and implementation of teachers’ performance appraisal
development.
4.7.2 Regression Analysis
Table 4.16: Model Summary
Model R R Square Adjusted R Square
Std. Error of the
Estimate
1 .192a .037 .032 .418
a. Predictors: (Constant), EXPT
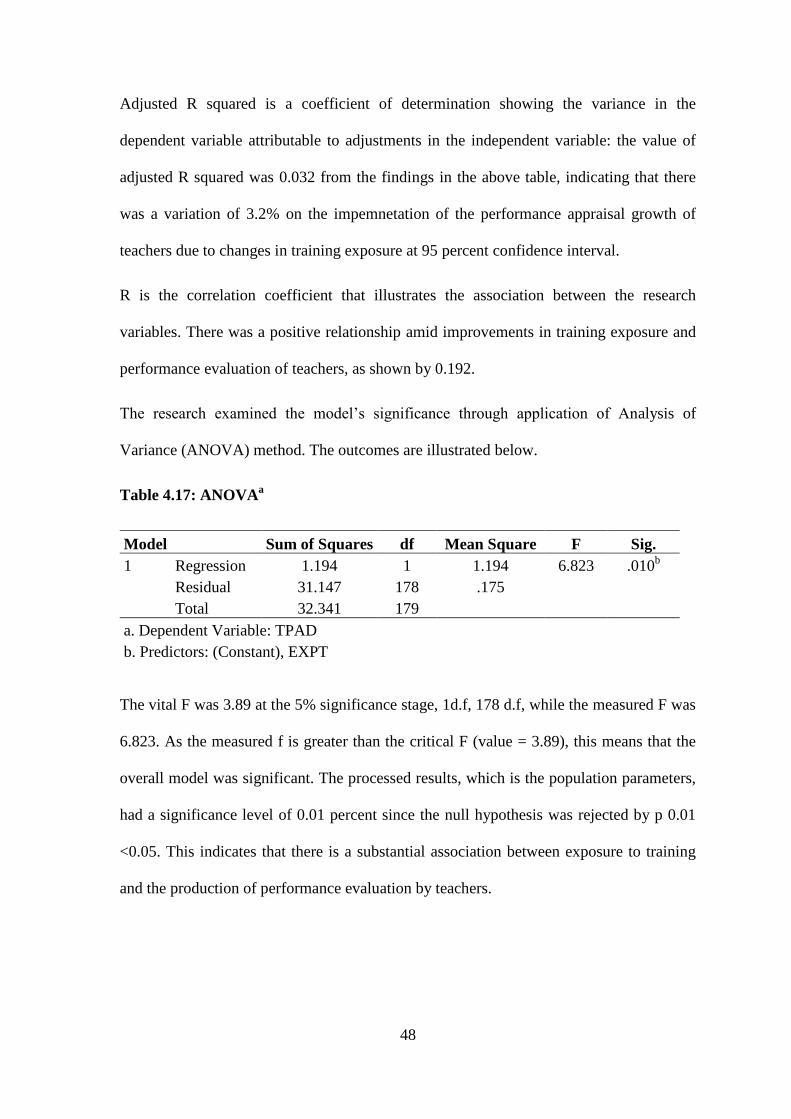
48
Adjusted R squared is a coefficient of determination showing the variance in the
dependent variable attributable to adjustments in the independent variable: the value of
adjusted R squared was 0.032 from the findings in the above table, indicating that there
was a variation of 3.2% on the impemnetation of the performance appraisal growth of
teachers due to changes in training exposure at 95 percent confidence interval.
R is the correlation coefficient that illustrates the association between the research
variables. There was a positive relationship amid improvements in training exposure and
performance evaluation of teachers, as shown by 0.192.
The research examined the model’s significance through application of Analysis of
Variance (ANOVA) method. The outcomes are illustrated below.
Table 4.17: ANOVAa
Model Sum of Squares df Mean Square F Sig.
1 Regression 1.194 1 1.194 6.823 .010b
Residual 31.147 178 .175
Total 32.341 179
a. Dependent Variable: TPAD
b. Predictors: (Constant), EXPT
The vital F was 3.89 at the 5% significance stage, 1d.f, 178 d.f, while the measured F was
6.823. As the measured f is greater than the critical F (value = 3.89), this means that the
overall model was significant. The processed results, which is the population parameters,
had a significance level of 0.01 percent since the null hypothesis was rejected by p 0.01
<0.05. This indicates that there is a substantial association between exposure to training
and the production of performance evaluation by teachers.
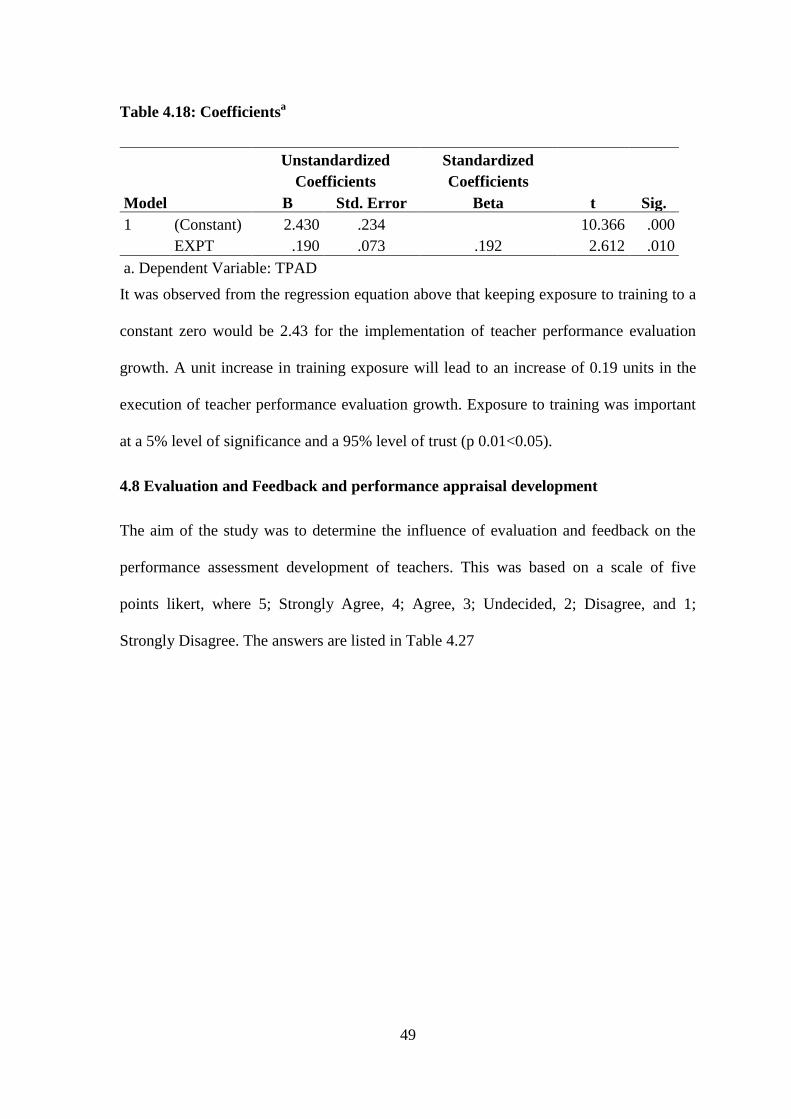
49
Table 4.18: Coefficientsa
Model
Unstandardized
Coefficients
Standardized
Coefficients
t Sig. B Std. Error Beta
1 (Constant) 2.430 .234 10.366 .000
EXPT .190 .073 .192 2.612 .010
a. Dependent Variable: TPAD
It was observed from the regression equation above that keeping exposure to training to a
constant zero would be 2.43 for the implementation of teacher performance evaluation
growth. A unit increase in training exposure will lead to an increase of 0.19 units in the
execution of teacher performance evaluation growth. Exposure to training was important
at a 5% level of significance and a 95% level of trust (p 0.01<0.05).
4.8 Evaluation and Feedback and performance appraisal development
The aim of the study was to determine the influence of evaluation and feedback on the
performance assessment development of teachers. This was based on a scale of five
points likert, where 5; Strongly Agree, 4; Agree, 3; Undecided, 2; Disagree, and 1;
Strongly Disagree. The answers are listed in Table 4.27

50
Table 4.19: Evaluation Feedback and teachers’ appraisal
Statements 5
SA
4
A
3
UD
2
D
1
SD
f % f % f % f % f % Mean Std.D
Feedback
only when
asked
40 22.2 85 47.2 8 4.4 38 21.1 9 5.0 3.61 1.19
Feedback
only when
request 2 1.1 45 25 7 3.9 92 51.1 34 18.9 2.38 1.09
Feedback
after an event 41 22.8 112 62.2 3 1.7 23 12.8 1 0.6 3.94 0.90
Self-
assessment 10 5.6 124 68.9 27 15.0 13 7.2 6 3.3 3.66 0.83
No G&C 0 0 16 8.9 12 6.7 90 50.0 62 34.4 1.90 0.87
Subject
panels
meetings 34 18.9 88 48.9 10 5.6 44 24.4 4 2.2 3.58 1.12
Total List wise 180
Most of the teachers and head teachers agreed that they do one to one feedback after an
event or a test only when asked to do so indicated by 85(47.2%) and supported by 3.61.
The teachers and head teachers disagreed that they give feedback to pupils’ personal
problems only when they request indicated 92(51.1%) with a mean of 2.38. The teachers
give feedback immediately after an event as indicated by 112 (62.2%) respondents and
supported by 3.94. It was agreed that teachers do self-assessment after an event has taken
place as indicated by 124 (68.9%) with a mean of 3.66. The teachers and head teachers
disagreed that they do not offer guidance and counseling in their school indicated by 90
(50%) respondents and supported by a mean of 1.90. The teachers agreed that they hold
subject panel meetings after every evaluation test indicated by 88(48.9%) with support of
a mean of 3.58.
Further the study sought to determine the importance of the introduced TPAD by TSC to
ensure feedback on teacher’s performance. The interview with the TSC sub-county
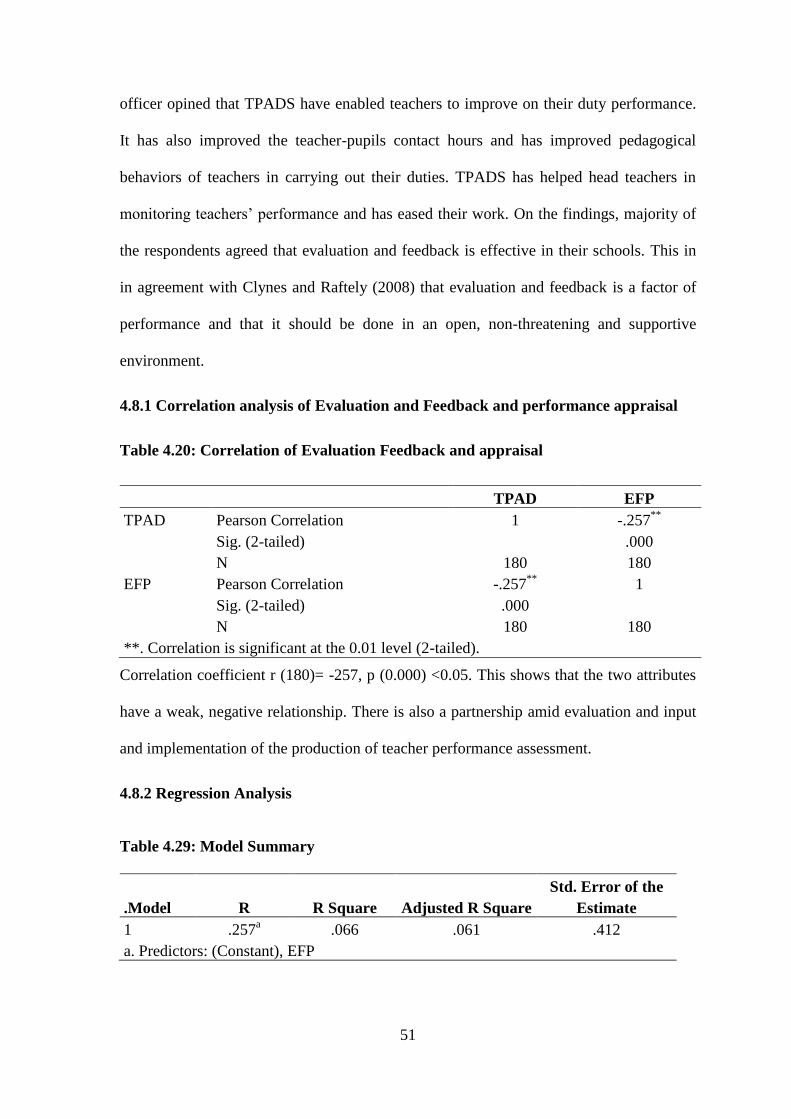
51
officer opined that TPADS have enabled teachers to improve on their duty performance.
It has also improved the teacher-pupils contact hours and has improved pedagogical
behaviors of teachers in carrying out their duties. TPADS has helped head teachers in
monitoring teachers’ performance and has eased their work. On the findings, majority of
the respondents agreed that evaluation and feedback is effective in their schools. This in
in agreement with Clynes and Raftely (2008) that evaluation and feedback is a factor of
performance and that it should be done in an open, non-threatening and supportive
environment.
4.8.1 Correlation analysis of Evaluation and Feedback and performance appraisal
Table 4.20: Correlation of Evaluation Feedback and appraisal
TPAD EFP
TPAD Pearson Correlation 1 -.257**
Sig. (2-tailed) .000
N 180 180
EFP Pearson Correlation -.257**
1
Sig. (2-tailed) .000
N 180 180
**. Correlation is significant at the 0.01 level (2-tailed).
Correlation coefficient r (180)= -257, p (0.000) <0.05. This shows that the two attributes
have a weak, negative relationship. There is also a partnership amid evaluation and input
and implementation of the production of teacher performance assessment.
4.8.2 Regression Analysis
Table 4.29: Model Summary
.Model R R Square Adjusted R Square
Std. Error of the
Estimate
1 .257a .066 .061 .412
a. Predictors: (Constant), EFP
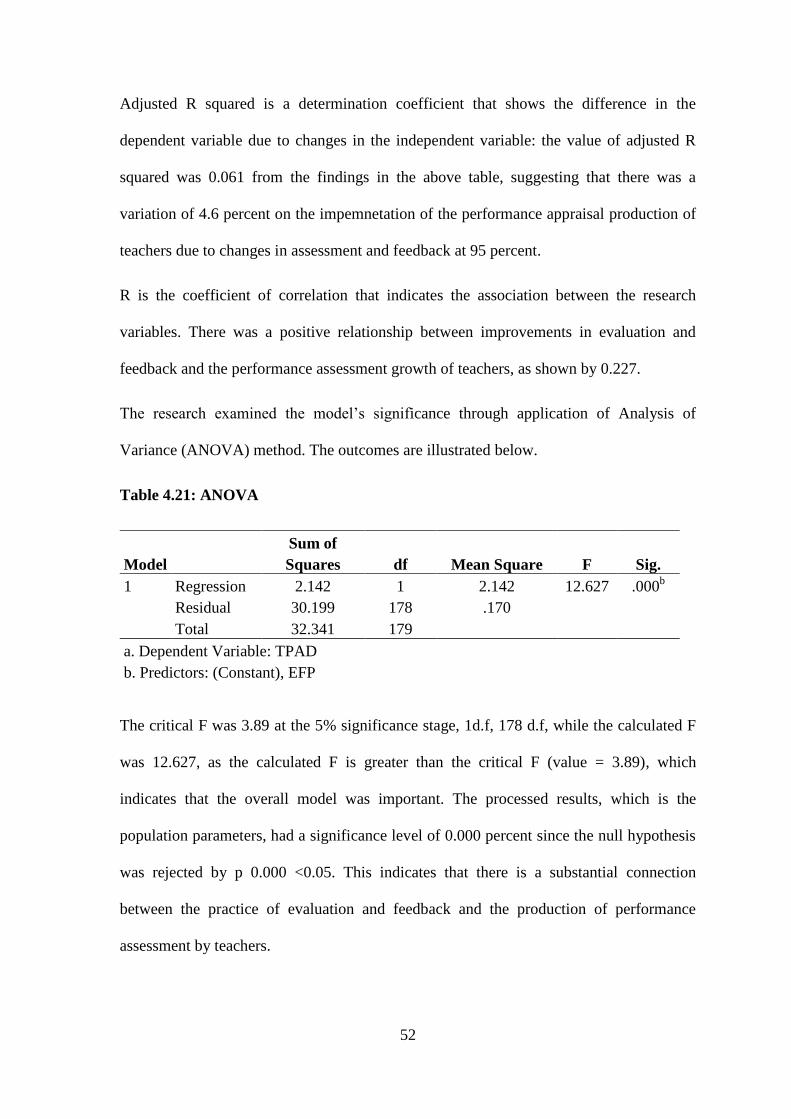
52
Adjusted R squared is a determination coefficient that shows the difference in the
dependent variable due to changes in the independent variable: the value of adjusted R
squared was 0.061 from the findings in the above table, suggesting that there was a
variation of 4.6 percent on the impemnetation of the performance appraisal production of
teachers due to changes in assessment and feedback at 95 percent.
R is the coefficient of correlation that indicates the association between the research
variables. There was a positive relationship between improvements in evaluation and
feedback and the performance assessment growth of teachers, as shown by 0.227.
The research examined the model’s significance through application of Analysis of
Variance (ANOVA) method. The outcomes are illustrated below.
Table 4.21: ANOVA
Model
Sum of
Squares df Mean Square F Sig.
1 Regression 2.142 1 2.142 12.627 .000b
Residual 30.199 178 .170
Total 32.341 179
a. Dependent Variable: TPAD
b. Predictors: (Constant), EFP
The critical F was 3.89 at the 5% significance stage, 1d.f, 178 d.f, while the calculated F
was 12.627, as the calculated F is greater than the critical F (value = 3.89), which
indicates that the overall model was important. The processed results, which is the
population parameters, had a significance level of 0.000 percent since the null hypothesis
was rejected by p 0.000 <0.05. This indicates that there is a substantial connection
between the practice of evaluation and feedback and the production of performance
assessment by teachers.
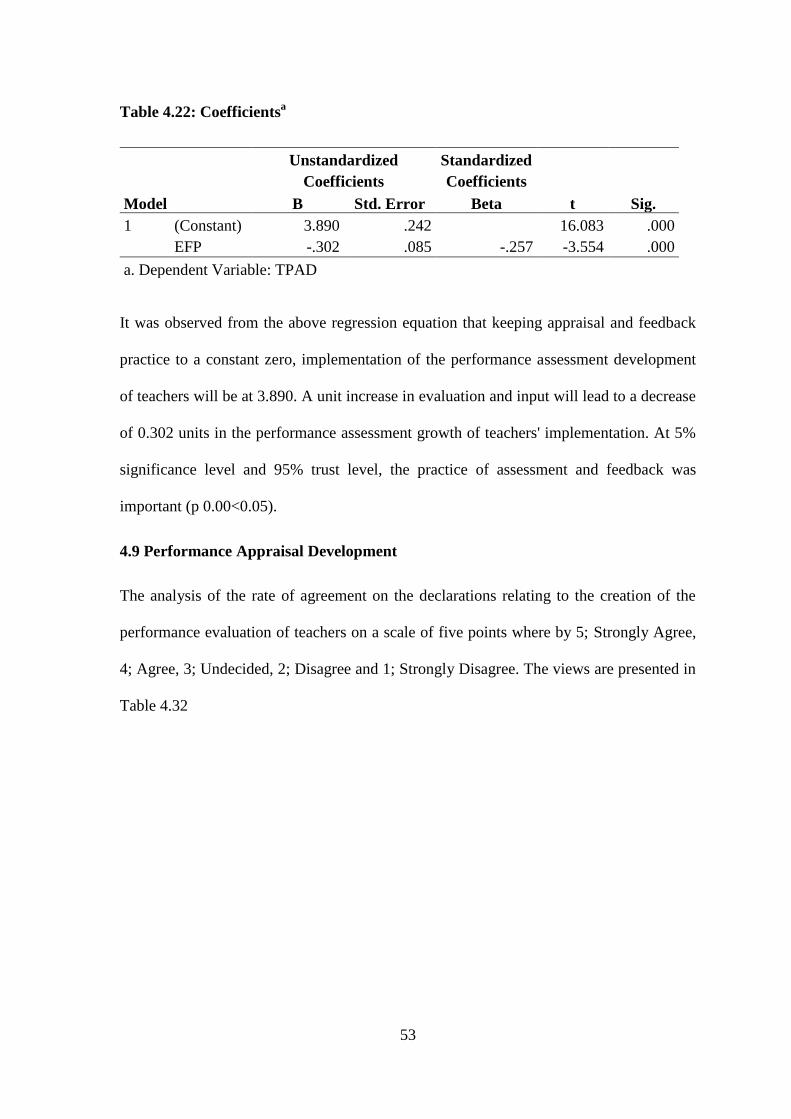
53
Table 4.22: Coefficientsa
Model
Unstandardized
Coefficients
Standardized
Coefficients
t Sig. B Std. Error Beta
1 (Constant) 3.890 .242 16.083 .000
EFP -.302 .085 -.257 -3.554 .000
a. Dependent Variable: TPAD
It was observed from the above regression equation that keeping appraisal and feedback
practice to a constant zero, implementation of the performance assessment development
of teachers will be at 3.890. A unit increase in evaluation and input will lead to a decrease
of 0.302 units in the performance assessment growth of teachers' implementation. At 5%
significance level and 95% trust level, the practice of assessment and feedback was
important (p 0.00<0.05).
4.9 Performance Appraisal Development
The analysis of the rate of agreement on the declarations relating to the creation of the
performance evaluation of teachers on a scale of five points where by 5; Strongly Agree,
4; Agree, 3; Undecided, 2; Disagree and 1; Strongly Disagree. The views are presented in
Table 4.32
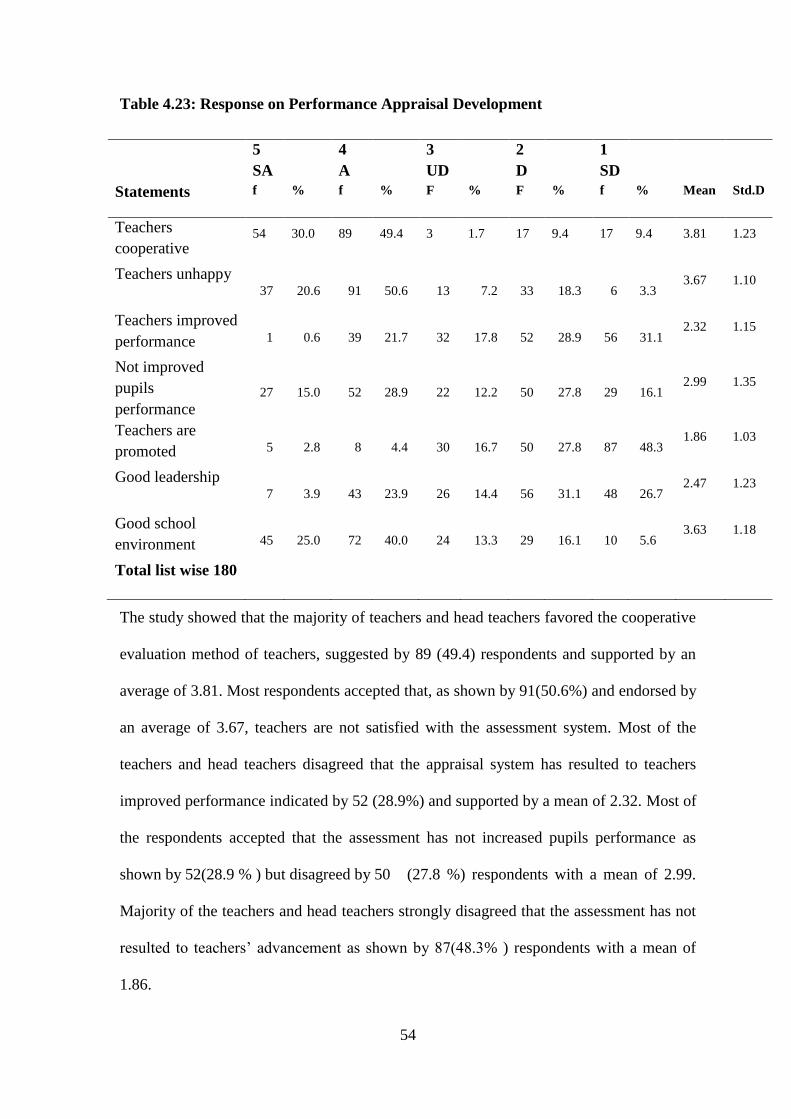
54
Table 4.23: Response on Performance Appraisal Development
5
SA
4
A
3
UD
2
D
1
SD
Statements f % f % F % F % f % Mean Std.D
Teachers
cooperative 54 30.0 89 49.4 3 1.7 17 9.4 17 9.4 3.81 1.23
Teachers unhappy 37 20.6 91 50.6 13 7.2 33 18.3 6 3.3
3.67 1.10
Teachers improved
performance 1 0.6 39 21.7 32 17.8 52 28.9 56 31.1 2.32 1.15
Not improved
pupils
performance 27 15.0 52 28.9 22 12.2 50 27.8 29 16.1
2.99 1.35
Teachers are
promoted 5 2.8 8 4.4 30 16.7 50 27.8 87 48.3 1.86 1.03
Good leadership 7 3.9 43 23.9 26 14.4 56 31.1 48 26.7
2.47 1.23
Good school
environment 45 25.0 72 40.0 24 13.3 29 16.1 10 5.6 3.63 1.18
Total list wise 180
The study showed that the majority of teachers and head teachers favored the cooperative
evaluation method of teachers, suggested by 89 (49.4) respondents and supported by an
average of 3.81. Most respondents accepted that, as shown by 91(50.6%) and endorsed by
an average of 3.67, teachers are not satisfied with the assessment system. Most of the
teachers and head teachers disagreed that the appraisal system has resulted to teachers
improved performance indicated by 52 (28.9%) and supported by a mean of 2.32. Most of
the respondents accepted that the assessment has not increased pupils performance as
shown by 52(28.9 % ) but disagreed by 50 (27.8 %) respondents with a mean of 2.99.
Majority of the teachers and head teachers strongly disagreed that the assessment has not
resulted to teachers’ advancement as shown by 87(48.3% ) respondents with a mean of
1.86.
55
The respondents disagreed that the appraisal has not resulted to good leadership as shown
indicated by 56 (31.1%) and supported by a mean of 2.47. Most of the teachers and head
teachers agreed that the appraisal has not resulted to good school environment as shown
by 72 (40.0%) respondents and a mean of 3.63.
The research also tried to find out from the sub-county officer of the TSC whether
teachers were positive or negative in filling the forms of TPAD and why their altitude
was appropriate. The study found that the teachers were positive since they are able to
assess themselves and they can see the outcome.
The study also sought to establish what TSC was doing to improve the meaningfulness of
TPAD in schools. The findings reveal that TSC considered TPADS in its promotion of
teachers. The study also sought to evaluate whether TPAD had resulted to improvements
in schools in terms of performance. The findings from the interview revealed that
improvement had been noticed in majority of the schools as a result of TPAD.
Most of the respondents agreed on the results that performance evaluation has not been
successfully carried out. The aim of the basic performance evaluation framework,
according to Mayhem (2018), is to identify and maintain stringent performance and
inspire workers to improve in areas where job performance fails to meet expectations.
This is an environment in which most respondents conclude that to the satisfaction of
teachers, TSC has not worked effectively.
56
CHAPTER FIVE
SUMMARY, CONCLUSIONS AND RECOMMENDATIONS
5.1 Introduction
Based on the research goals, this chapter presents the review, findings and
recommendations of the report. The study centered on the effect of school-based variables
on the implementation of performance evaluation of teachers in public primary schools in
the sub-county of Kieni-East, Nyeri County, Kenya.
5.2 Summary of the Study
The research examined the factors affecting the performance evaluation of head teachers
in public primary schools in the sub-county of Kieni-East, Nyeri County, Kenya. The
objectives were to evaluate the effect of the transformative leadership of head teachers,
incentive policy, resource provision, visibility and appraisal input on the growth of
teacher performance assessment implementation. A descriptive design was used. The
target population will include 52 schools, 52 head teachers and 566 teachers and 1Sub-
county Staffing Office. 52 schools, 52 head teachers and 566 teachers were included in
the target population, from which a sample of 30 head teachers and 170 teachers were
chosen. Using questionnaires, the data was obtained. The system of test retesting was
used to increase the reliability of the instrument. Data on quantities were analyzed using
the Statistical Packaging for Social Sciences (SPSS). To test the influence of independent
variables, correlation and regression analysis were used.
5.3 Summary of Findings
5.3.1 Head teachers’ transformational leadership and teachers’ performance
The first objective was to evaluate the impact of the transformative leadership of head
teachers on the performance evaluation growth of teachers in the Kieni East sub-county.
57
The majority of the respondents accepted that transformational leadership was a key
factor in the success of teachers. The association study of Pearson moments revealed a
poor relationship between transformational leadership and teacher success execution r
(180)= .227, p (0.002)<0.05.It was observed from the regression equation above that
keeping transformational leadership practice to a constant zero would be 2.192 to
introduce the performance evaluation production of teachers. A unit improvement in
transformational leadership practice will lead to an increase of 0.31 units in the
performance evaluation growth of teachers' implementation.
5.3.2 Head teachers’ Reward strategy and teachers’ performance
The second goal of the study was to evaluate the influence of the incentive strategy on the
growth of teacher performance assessment implementation. The results showed that the
coefficient of correlation of r (180) = .176, p < 0.05 is an indicator of a weak relationship
between the two characteristics. It was observed from the regression equation that holding
the reward strategy to a constant zero would be at 2.399 to implement the performance
evaluation development of teachers. A unit increase in incentive strategy will lead to an
increase of 0.21 units in the performance evaluation growth of teachers' implementation.
5.3.3 Head teachers’ provision of resources and teachers’ performance
The third aim of the analysis was to explore the degree to which the availability of
resources affects the production of teacher performance evaluation implementation. The
research shows that there is infrastructure and services in the school. A weak link
between the two attributes was shown by the correlation coefficient of r (180) = .192, p
(0.01) <0.05. It was observed from the regression equation above that keeping exposure
to a constant zero would be 2.43 for the performance evaluation production of teachers. A
58
unit increase in training exposure will lead to an increase of 0.19 units in the execution of
teacher performance evaluation growth.
5.3.4 Head teachers’ exposure to learning and teachers’ performance
The study's fourth objective was to assess the degree to which the exposure of head
teachers affected the performance of teachers. The study shows that the majority of
educators and head teachers believed that exposure was a success factor. A coefficient of
correlation of r (180) = 192, p (0.010) <0.05. A weak relationship exists between the two
attributes. It was observed from the regression equation above that keeping exposure to
training to a constant zero would be 2.43 for the implementation of teacher performance
evaluation growth. A unit increase in training exposure will lead to an increase of 0.19
units in the execution of teacher performance evaluation growth. Exposure to training was
important at a 5% level of significance and a 95% level of trust (p 0.01<0.05).
5.3.5 Evaluation and feedback and teachers’ performance
The fifth objective of the analysis was to determine the effects of the evaluation feedback
on the growth of teacher performance assessment implementation. The study shows that
most teachers and head teachers decided to provide one-to-one input after 3.61. The study
indicates that the two attributes r(180)= .-257, p (0.000) <0.05 have a weak negative
relationship. The regression analysis shows that holding evaluation and feedback practice
to a constant zero, teachers’ performance would be at 3.890. A unit increase in evaluation
and input will lead to a decrease of 0.302 units in the performance assessment growth of
teachers' implementation. At 5% significance level and 95% trust level, the practice of
assessment and feedback was important (p 0.00<0.05).

59
5.4 Conclusion
The study concludes that there is a relation between school based factors and teachers
performance. The teachers are authentically co-operative and enjoy an open
communication. The study also concluded that the teachers and head teachers give
feedback immediately after an event. The teachers and head teachers do self-assessment
after an event has taken place and hold subject panel meetings after every evaluation test.
The teachers give feedback to pupils’ personal problems not only when they request but
even in other times. The teachers offer guidance and counseling in their school.
5.5 Recommendations
The following recommendations were made there on the basis of the research findings;
i. Study recommends that the school head teachers should device ways of
encouraging and motivating the teachers to instill more positive change and
provide a positive attitude towards performance appraisal.
ii. The teachers service commission should give serious attention to equal pay issues
and equal pay reviews. Job assessment and market rate analysis should be the
basis of the grade and pay structures.
iii. The goals and arrangements of incentive management should be straightforward
and well communicated to employees. The performance evaluation should be
sponsored by the reward scheme and should be up to date.
iv. The study recommends that the teachers should continue evaluating and providing
timely feedback. The feedback of all the events should always be given.
Communication skills should be embraced in providing such results..
60
5.6 Suggestions for Further Studies
The study examined school-based factors affecting the performance assessment growth of
teachers in public primary schools in the sub-county of Kieni-East, Nyeri County, Kenya.
Accordingly, the research indicates that more studies on;
i. For contrast, school-based variables influence the implementation of teacher
performance assessment growth in public primary schools in other sub-counties.
ii. The factors that influence the effectiveness of the creation of teacher performance
assessment among teachers and head teachers.
61
REFERENCES
Ahmed, Z. Ridder, A. (2009) Methods in Sample Survey (PDF) The Johns Hopkins
University and Saifuddin Ahmed.
Armstrong M (2009) Armstrong’s Handbook of Human Resource Management Practice.
Replica Press Pvt Ltd.I.ndia
Bana,A.B. & Shitindi,E.(2009) Performance Management in Tanzania Public Service
Bizimana B.(2014) Teaching and Learning Resource Availability and Teachers Effective
Classroom Management and Content Delivery in secondary Schools Huye District
Rwanda,A journal of Education and Practise Vol5 no.9 www.iiste.org
Black, K. (2010) Business Statistics; Contemporary Decision Making, 6th
Edition, Wiley
& Sons.
Boccanfusoc S, Kulfeld M (2011). Multiple Responses Promoting Results; Evidence
Base, on Punitive Alternative to Zero Tolerance Washington DC child trends
Bonio F. & Warner A. (2014). What make humanitarian feedback mechanism
work. ALNAF literature review London.
Botev, Z. Ridder, A. (2017). Variance Reduction”. Wiley StatsRef; Statistics Reference
online; 1 -6 doi; 10.1002/9781118445112. Stat 07975.
Chowdhury P.Q. (2015), Managers Perceptions of the Performance Pppraisal Pystems In
the local municipality of Gauteng Province in South Africa Mediterranean
Journal of SOCIAL Sciences vol6 no.151 MCSER Publishing
Clynes, M.P. & Raftery S.E.C. (2008) Feedback: An Essential Element of Student
Practice Nurse Education in Practice. NMC Publications.
Danku et al (2015) Performance Appraisal in the Ghana Education Service. The case of
Basic School Teachers in Ho Municipality. International Journal of Managerial
Studies and Research. (IJMSR) Vol. 3(6) ISSN2349-6330(Print)ISSN,ISSN2349-
0349(Online)
Drucker P. (2015) Training and development – meaning, its need and importance.
Harvard business Press publications.
Dunson Brown (2019). What is reward strategy. Brown Books publishing group Dallas
Franco-Santos,M. River,P. Bourne,M. (2014) Performance Management in UK Higher
Education Institutions. The need for a Hybrid Approach Full Report Cranfield
.The Leadership Foundation.
Gatara (2010) Research Methodology. The Olive Marketing and Publishing Company
,Nairobi, Kenya.
62
Gathii M.A. (2010) Teachers’ Perception of Perforomance Appraisal Practices in Public
Secondary schools in Limuru District. An MED Thesis University of Nairobi
PDF.
Gerald A. Lieberman (2018). Education and Environment Harvard Education press.
Ghazali, N.H. (2016) A reliability and validity of instruments to Evaluate the School-
Based Assessment System: A Pilot Study: International Journal of Evaluation and
Research in Education (IJERE) vol.5 no.2
Graham W. Mclead & Robert C. Mortimer (2015). Evaluation feedback mechanism in
the school of Earth and environment, published online.
Gupta C.B (2011) Human Resource Management. Sultan Shand and Sons Publishers New
Delhi
Heckman-Stone (2004) Trainee Preferences for Feedback in Clinical supervision. The
Clinical Supervisor Publication, World Scientific Publishing CO.
Ice ,M; Thapa , A; Cohen, J.(2015) Recognizing community voice and youth red school
community partnership in the school climate improvement process; School
Community Journal
James Mac Gregor Burns (1978). Transformational leadership theory. Barnes
Publishing Group Washington D.C.
James P H $ Murrain J. (2019) Research limitations and the necessity of reporting them.
American journal of health education.
Kabba, E. Cokey (2014) Teachers education in Anglophone. West Africa Emerald
Group Publishing Limited.
Kahl Johan Astrom $ Richard M. Murrey (2006). Feedback systems: An introduction
for scientists and Engineers Princeton University Press.
Kanisa,N.O. & Makokha, E.N. (2017), Effect of Performance Appraisal on
Organizational Performances. European Journal of Business and Management,26
(95101)
Kareithi,M.W (2018), Effect of Performance Appraisal System on Performance of
Secondary Schools Teachers in Kirinyaga West Sub-County. MBA Thesis School
of Business KCA University.
Karugaba A (2015) Effectiveness of Teachers Perforomance appraisal feedback in
secondary Education perforomance. The case of selected public secondary
schools in Bukoba Municipal Council, MBA Thesis Mzumbe University. PDF.
Kerry E. 2015; Teacher Perforomance Appraisal; more abour Parformance or
Development? Anstralian Journal of Education 40 (9)
http://ro.ecu.edu/ajte/vol40/issues9/6.
63
KESI (2011); Diploma in Educational management for primary schools. Kenya
Literature Bureau
Kim et al (2010) OESD, Review on Evaluation and Assessment Framework for improving
schools outcomes. Country Background Report for Korea, Korean Educational
Development Institute (KEDI), Seoul www.oesd.org/education/evaluation
policy
Kiregeie R.V and Morgan D (1970); Determining sample size for Research Activities.
Educational and Phychological Measurement Vol. 30 No. 3 P608.
Kothari C.R. and Garg G. (2014); Research Methodology, methods and techniques. New
Age International Publishers, New Delhi.
Krishnaswami O.R. and Ranganatham M. (2011), Methodology of Research in Social
Sciences. Himalaya Publishing House, Mumbai.
Kumar V, (2014) Globalization in India. Journal of Advanced in Humanities and Social
Sciences 1(1)14-11
Kwendra Cherry (2018) Transformational leadership full service publishing house
Pocatell 1 dah d
Ludwig Von Bertalanffy (1973). General systems theory.(Revised Edition).George
Braziller New York.
Maaleki, Ali (2018). The Arzesh Competency Model: Appraisal and Development
Manager’s Competency Model. Lambert Academic Publishing p. 18.
Marilyn K Simon & Jim Goes (2013) Assumptions, limitations, delimitations and scope of
the study. Simon $ Schaster, Inc New York
Mary Susan, Terry R. Swen Schroth (2003) Ensuring Safe Environment: exploring
issues, seeking solutions. Lawrence Grlbaum associate publishers Makwal New
Jersey
Michael Armstrong $ Duncan Brown (2010) Strategic Reward: Implementing more
effective reward management. Kogan Page Publishers.
Michael Rose (2018) What is reward strategy. Kogan Publishers .S.
Mpungose J.E (2014) Managing, Teachers Perforomance and Its Appraisal – Scienta
Socials. Paul Chapman Publishing.
Mugenda, O. M., & Mugenda, A. G. (2013). Research Methods: Quantitative and
Qualitative Approaches. Nairobi Acts press.
Muijs,D. (2011) Doing Qualitative Research in education with SPSS ,Landon, SAGE
Publishers Limited.
64
Musoge M.J. and Pilane M.W (2014) Performance Maagement; the neglected Imperative
of accountability systems in Education; South African Journal of Education 34 (1)
PDF at [email protected] Govt. Priners. .
Mutsuddi I. (2011) Essentials of Human Resource Management. New Age International
(P) Ltd. Publishers New Delhi
Mutwiri E.M. (2015) Institutional Factors Influencing Job satisfaction among teachers in
mixed day secondary schools in Imenti South District, Kenya. Unpublished MED
thesis ,University of Nairobi, Kenya
Muweesi, C. Mugagga, A. M. Qian Xu, Kaggwa, Y. T. (2018) Epistemological Dynamics
and Incorporation of Appraisal Practices in Kampala Arch- Diocesian Secondary
Schools. An open Library Journal 2018, Vol.5e5052 Uploaded by Charles
Muweesi.
Ndungu G.W. (2015). Influence of Board of Management Governance Practices on
Teachers job Satisfaction in Secondary Schools in Lari, Kiambu County, Kenya.
Unpublished M.ED Thesis, University of Nairobi,
Nzuve S.N.M (2015) Management of Human Resources. Basic Modern Management
Consultants Publishers, Nairobi, Kenya p. 45
OECD (2013). Standards and Governance of Teachers Appraisal. OECD Publication
Paris.
OECD (2019) Creating Effective Teaching and Learning Environments. First Results
from Talis, OECD Publishing, Paris
OECD 2013 Standards and Governance of Teacher Appraisal. OECD Publications, Paris.
Okongo R.B, Ngao G. Rop, N. K, Nyongesa W.J (2015) Effect of Availability of
Teaching and Learning resources on the implementation of inclusive Resources on
The Implementation of Inclusive Education in the Pre-school Centres in Nyamira
North Sub-County, Nyamira County, Kenya, Journal of Education and Practice
Vol. 6 no.35 IISTE www.iiste.org
Orotho S.A (2009) Elements of Education and Social Sciences Research Methods;
Department of Educational Management Policy and Curriculum Studies- Maseno;
Kenzia Publishers, Kenya.
Ram (2010) Research Methodology New Delhi Sage Publication p.121.
Ram (2014) Research Methods .Jaiper New Delhi Rawati Publication p.454.
Ruth Mayhew (2019) Performance Appraisal System. Leaf Group Ltd /Leaf Group
Media
Santiago et al 2011 OECD Reviews of Evaluation and Assessment in Education, Sweden,
OECD Publishing, Paris.
65
Sing R.R. and Vadivelu S, (2016) Performance Appraisal India. A Review in International
Journal of Applied Engineering Research, ISSN 0973-4563 Vol.11 no.5 pp3229-
3234@reseach India Publication
Stavoroula .S. (2014) The effects of school internal environment. MCSER Publishing
Rome-Italy.
Tornquist E. (2014). Strategic focus on 3R Principles. Humburg Germany Kuwer
Academic Publishers.
Usman & Dangara Y. (2016). Education Resources: An Intergral Component for effective
School Administration in Nigeria. Journal on Research on Humanities and Social
Sciences Vo16 No. 13 IISTE www.iiste.org.
Walch G. S. (2017). A co-creativity theoretical framework to foster and evaluate
the presence of wise humanizing creativity in virtual learning environment
(VLES) Journal.
Wang, Ming-te, Dego Jessicca L (2016). A review of construct measurement and impact
on students outcome, educational physiology review, Microsoft publisher
Wikipedia.
Warner Jon (2013). Train /Train – the- trainer publications PTY Limited.
White S. K. (2018) Transformational leadership. Emerald group publishing
Yamima D.(2018) International Journal of Applied Sciences Vol.13 no.2 A Review of
Perforance Apraisal Systems in Different Countries;The U.K.,India, South Africa
and Ghana.Research India Publications.
66
APPENDICES
APPENDIX A: INTRODUCTION LETTER
UNIVERSITY OF NAIROBI
DEPARTMENT OF EDUCATIONAL
ADMINISTRATION & PLANNING
P.O. Box 30197 -00100,
NAIROBI.
Dear Sir/Madam,
LETTER OF INTRODUCTION TO HEADTEACHERS
I am a postgraduate student in the Department of Education Management and Planning of
the Faculty of Education, University of Nairobi, with a Master's degree in Corporate
Governance in Education. I am carrying out a study on school-based factors affecting
the creation of teacher performance evaluation in Kieni East Sub-county, Nyeri
County, public primary school.
Please complete the attached questionnaire designed to promote this research. Please be
assured that the requested details will be used for research work only. This information
will be handled confidentially, so do not write on this questionnaire your name or your
school name.
Any other assistance from you in promoting this study will be highly appreciated.
Thanking you in advance for your time and co-operation. I remain.
Yours faithfully,
Francis M. Macharia
Postgraduate Student
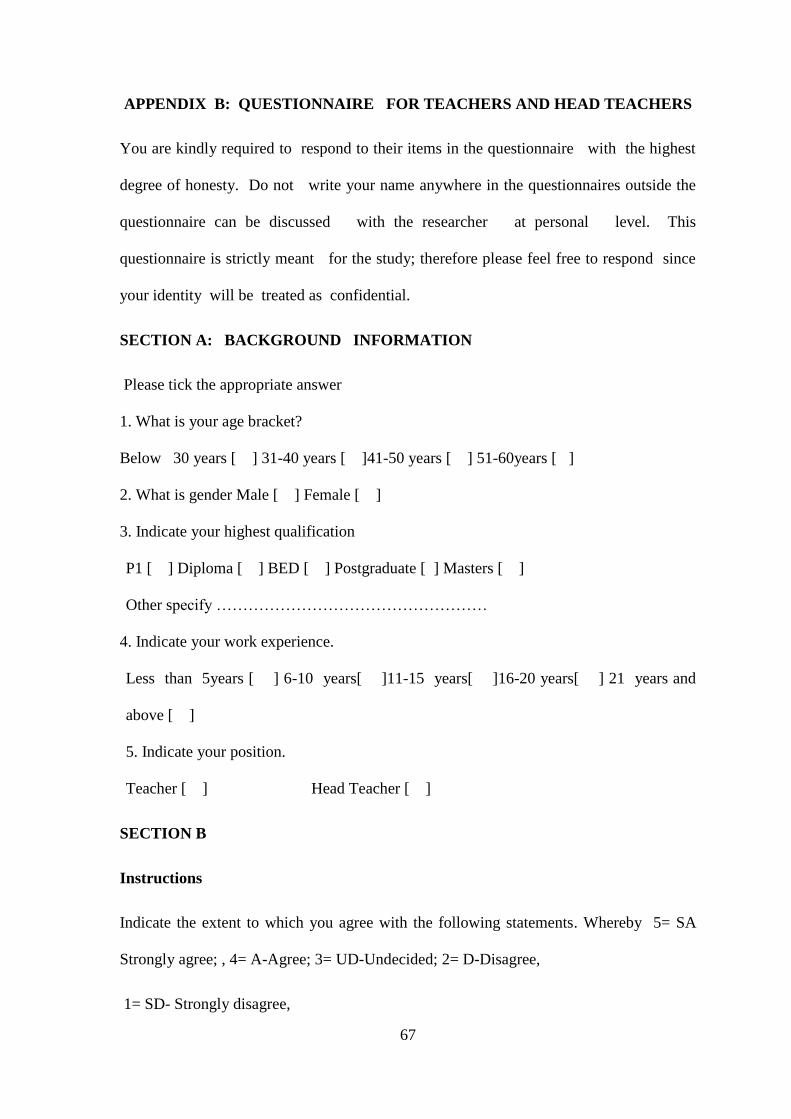
67
APPENDIX B: QUESTIONNAIRE FOR TEACHERS AND HEAD TEACHERS
You are kindly required to respond to their items in the questionnaire with the highest
degree of honesty. Do not write your name anywhere in the questionnaires outside the
questionnaire can be discussed with the researcher at personal level. This
questionnaire is strictly meant for the study; therefore please feel free to respond since
your identity will be treated as confidential.
SECTION A: BACKGROUND INFORMATION
Please tick the appropriate answer
1. What is your age bracket?
Below 30 years [ ] 31-40 years [ ]41-50 years [ ] 51-60years [ ]
2. What is gender Male [ ] Female [ ]
3. Indicate your highest qualification
P1 [ ] Diploma [ ] BED [ ] Postgraduate [ ] Masters [ ]
Other specify ……………………………………………
4. Indicate your work experience.
Less than 5years [ ] 6-10 years[ ]11-15 years[ ]16-20 years[ ] 21 years and
above [ ]
5. Indicate your position.
Teacher [ ] Head Teacher [ ]
SECTION B
Instructions
Indicate the extent to which you agree with the following statements. Whereby 5= SA
Strongly agree; , 4= A-Agree; 3= UD-Undecided; 2= D-Disagree,
1= SD- Strongly disagree,

68
1 Transformational leadership 5 4 3 2 1
(i) The headteacher inspires positive changes to the
teachers
(ii) The headteacher is not enthusiastic and passionate
(iii) The headteacher has helped teachers to succeed in
teaching
(iv) Teachers are not well encouraged and motivated
(v) The school exemplifies moral standards
(vi) Teachers do not enjoy ethical work environment with
clear values priorities and standards.
(vii) Teachers are authentically co-operative and enjoy open
communication.
(viii) Teachers attitude are not of self-interest but are mind
set and work for a common goal
(ix) Teachers are not allowed to participate in decision
making.
(x) Teachers support each other and the school as a whole
(xi) Teachers do not know their strength and weaknesses
2
Reward strategy
(i) A reward system is not put in place both financial and
non-financial.
(ii) The goals and arrangements of incentive management are
straightforward and well communicated to employees.
(iii) Reward strategies and processes are not well designed to
support the interests of schools and the needs of
stakeholders.
(iv) Surveys are used to determine the perceptions of workers
on the effects of incentives and steps taken.
(v) Stakeholders do not supports the reward system in our
school
(vi) Steps are taken to determine the efficacy of the mechanism
of reward management and to ensure that they represent
changing needs.
(vii) Reward system supports the performance appraisal and
is up-to-date and non-discriminating
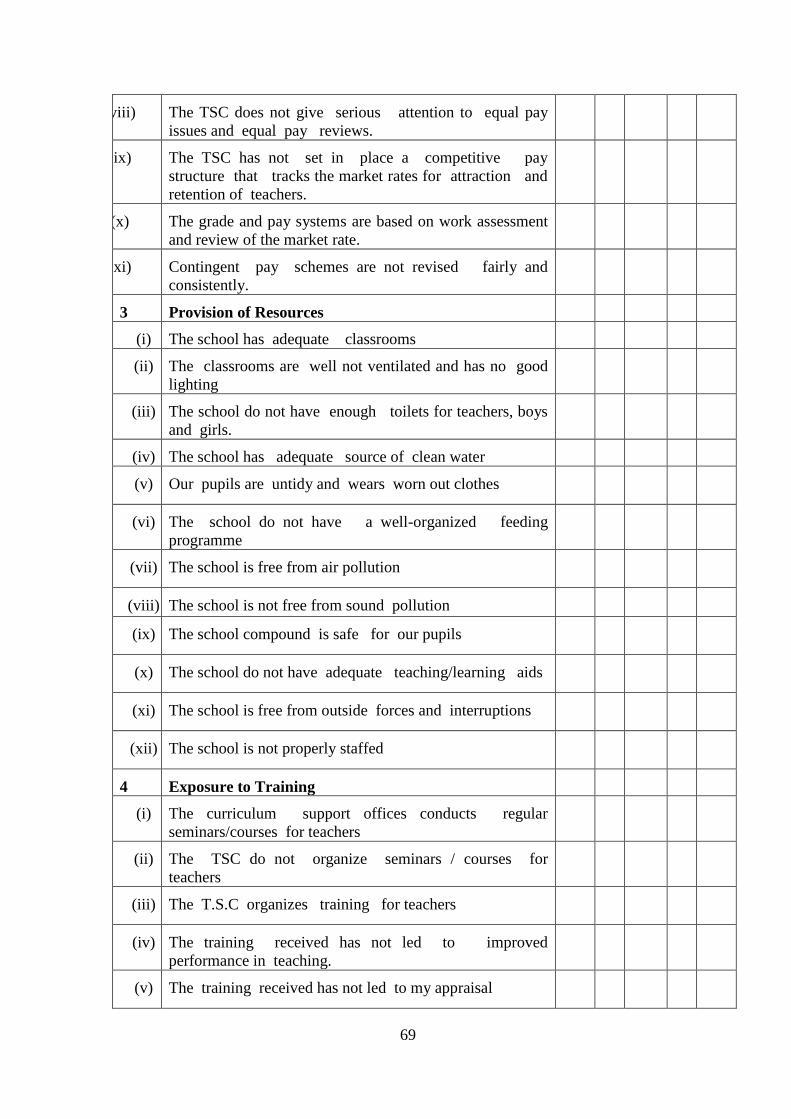
69
(viii) The TSC does not give serious attention to equal pay
issues and equal pay reviews.
(ix) The TSC has not set in place a competitive pay
structure that tracks the market rates for attraction and
retention of teachers.
(x) The grade and pay systems are based on work assessment
and review of the market rate.
(xi) Contingent pay schemes are not revised fairly and
consistently.
3 Provision of Resources
(i) The school has adequate classrooms
(ii) The classrooms are well not ventilated and has no good
lighting
(iii) The school do not have enough toilets for teachers, boys
and girls.
(iv) The school has adequate source of clean water
(v) Our pupils are untidy and wears worn out clothes
(vi) The school do not have a well-organized feeding
programme
(vii) The school is free from air pollution
(viii) The school is not free from sound pollution
(ix) The school compound is safe for our pupils
(x) The school do not have adequate teaching/learning aids
(xi) The school is free from outside forces and interruptions
(xii) The school is not properly staffed
4 Exposure to Training
(i) The curriculum support offices conducts regular
seminars/courses for teachers
(ii) The TSC do not organize seminars / courses for
teachers
(iii) The T.S.C organizes training for teachers
(iv) The training received has not led to improved
performance in teaching.
(v) The training received has not led to my appraisal
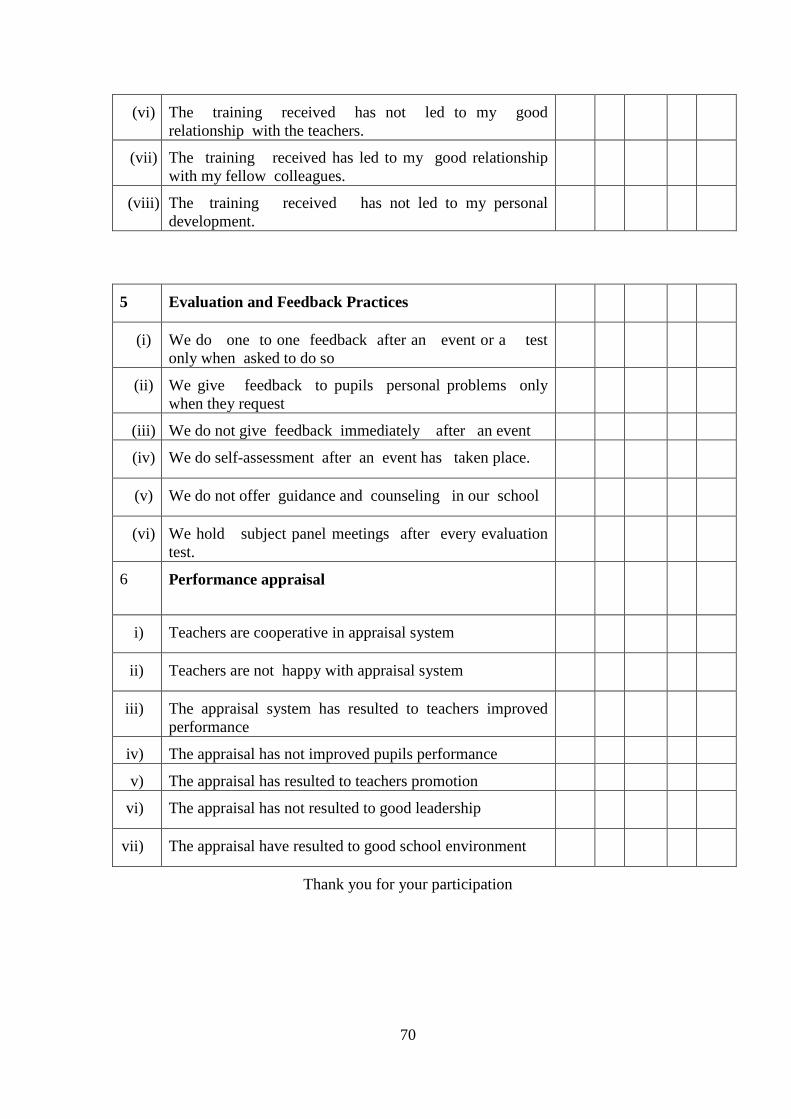
70
(vi) The training received has not led to my good
relationship with the teachers.
(vii) The training received has led to my good relationship
with my fellow colleagues.
(viii) The training received has not led to my personal
development.
5 Evaluation and Feedback Practices
(i) We do one to one feedback after an event or a test
only when asked to do so
(ii) We give feedback to pupils personal problems only
when they request
(iii) We do not give feedback immediately after an event
(iv) We do self-assessment after an event has taken place.
(v) We do not offer guidance and counseling in our school
(vi) We hold subject panel meetings after every evaluation
test.
6
Performance appraisal
i) Teachers are cooperative in appraisal system
ii) Teachers are not happy with appraisal system
iii) The appraisal system has resulted to teachers improved
performance
iv) The appraisal has not improved pupils performance
v) The appraisal has resulted to teachers promotion
vi) The appraisal has not resulted to good leadership
vii) The appraisal have resulted to good school environment
Thank you for your participation
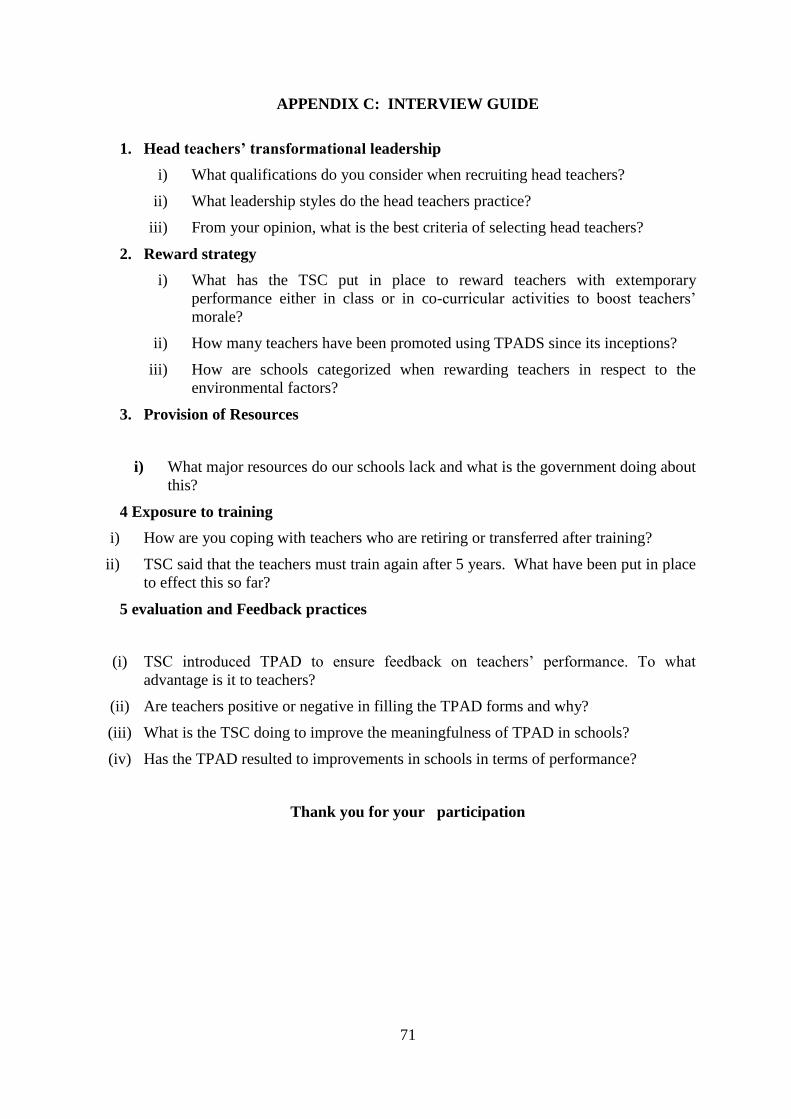
71
APPENDIX C: INTERVIEW GUIDE
1. Head teachers’ transformational leadership
i) What qualifications do you consider when recruiting head teachers?
ii) What leadership styles do the head teachers practice?
iii) From your opinion, what is the best criteria of selecting head teachers?
2. Reward strategy
i) What has the TSC put in place to reward teachers with extemporary
performance either in class or in co-curricular activities to boost teachers’
morale?
ii) How many teachers have been promoted using TPADS since its inceptions?
iii) How are schools categorized when rewarding teachers in respect to the
environmental factors?
3. Provision of Resources
i) What major resources do our schools lack and what is the government doing about
this?
4 Exposure to training
i) How are you coping with teachers who are retiring or transferred after training?
ii) TSC said that the teachers must train again after 5 years. What have been put in place
to effect this so far?
5 evaluation and Feedback practices
(i) TSC introduced TPAD to ensure feedback on teachers’ performance. To what
advantage is it to teachers?
(ii) Are teachers positive or negative in filling the TPAD forms and why?
(iii) What is the TSC doing to improve the meaningfulness of TPAD in schools?
(iv) Has the TPAD resulted to improvements in schools in terms of performance?
Thank you for your participation
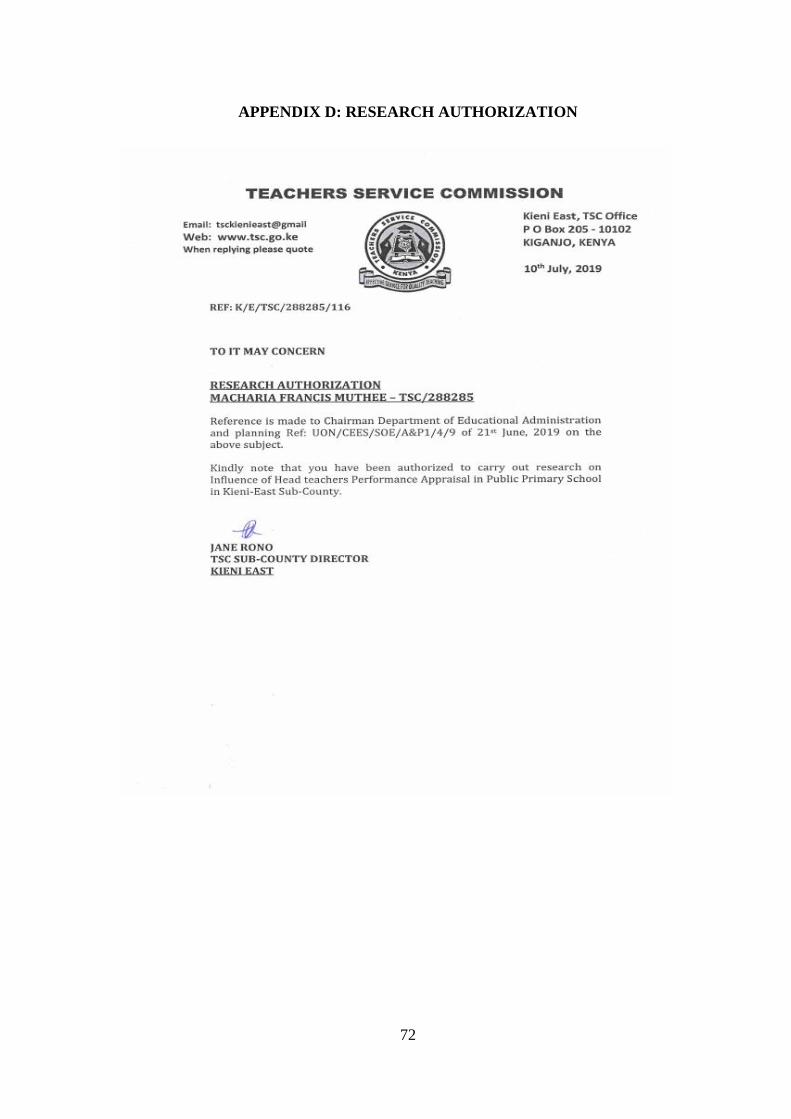
72
APPENDIX D: RESEARCH AUTHORIZATION
73
APPENDIX E: RESEARCH PERMIT FROM NACOSTI
74