Embed Size (px)
Citation preview

School break and lunch times and young people’s social lives: A follow-up
national study
Final report
Ed Baines and Peter Blatchford
Department of Psychology and Human Development UCL Institute of Education
May 2019
Research funded by the Nuffield Foundation

2
Contents Terminology ..................................................................................................................................... 4
Executive summary .............................................................................................................................. 5
Background ...................................................................................................................................... 5
What we did ..................................................................................................................................... 5
Key findings ...................................................................................................................................... 6
Conclusions .................................................................................................................................... 10
Recommendations ......................................................................................................................... 12
1 Introduction ............................................................................................................................... 14
1.1 Background .......................................................................................................................... 14
1.2 A positive role for school breaktimes.................................................................................. 16
1.3 This study ............................................................................................................................. 17
2 Methods ..................................................................................................................................... 19
2.1 Phase 1 national school survey on the nature, organisation and management of breaktimes ..................................................................................................................................... 20
2.1.1 Phase 1 sampling .......................................................................................................... 20
2.1.2 Response rates ............................................................................................................. 22
2.1.3 Representativeness of the sample ............................................................................... 22
2.1.4 Characteristics of the sample that returned questionnaires ....................................... 23
2.2 Phase 2 ................................................................................................................................ 24
2.2.1 Survey of children’s social life within and outside of school ....................................... 24
2.2.2 Case studies .................................................................................................................. 25
2.3 Data entry and cleaning ...................................................................................................... 25
2.4 Data analyses ....................................................................................................................... 25
3 Results ........................................................................................................................................ 26
3.1 School breaktime questionnaire ......................................................................................... 26
3.1.1 The duration of the school day and the length of break times ................................... 26
3.1.2 Changes in total duration of break time between 1995 and 2017 .............................. 33
3.1.3 Nature and use of the school playground, resources and structures ......................... 39
3.1.4 Supervision at breaktime ............................................................................................. 44
3.1.5 Pupils’ freedoms during breaktimes and reasons for missing breaktimes .................. 51
3.1.6 Organised, teacher led activities during breaktimes and after school ........................ 54
3.1.7 Views on breaktimes and pupil behaviour .................................................................. 59
3.2 The Pupil Breaktime Survey ................................................................................................ 63
3.2.1 Pupils’ views on school and breaktime ........................................................................ 63
3.2.2 The three best and worst things about breaktimes .................................................... 65

3
3.2.3 Pupils’ views on the length of lunch breaks ................................................................ 67
3.2.4 Pupils’ views on the number of supervisors ................................................................ 68
3.2.5 Pupils’ experiences of what happens during break and lunch times .......................... 69
3.2.6 Social life after school .................................................................................................. 74
4 Discussion ................................................................................................................................... 83
4.1 The length of breaktimes .................................................................................................... 83
4.2 Pupils’ views on breaktimes and its duration ..................................................................... 84
4.3 The importance of friendships in school ............................................................................. 85
4.4 Withholding breaks ............................................................................................................. 86
4.5 The value and problems of breaktime ................................................................................ 87
4.6 Behaviour at breaktimes and out of school ........................................................................ 90
4.7 Supervision and organisation of breaktime and going off site ........................................... 91
4.8 Activities at breaktime ........................................................................................................ 93
4.8.1 Access to mobile devices at school and during break ................................................. 94
4.8.2 Freedom of movement during break times ................................................................. 95
4.9 Suitability of school grounds at breaktime and facilities available ..................................... 96
4.10 Clubs and activities before/after school .......................................................................... 97
4.10.1 Clubs outside of school ................................................................................................ 98
4.11 Social life after and outside of school.............................................................................. 99
4.12 Findings relative to main factors ................................................................................... 101
4.13 Conclusions and recommendations .............................................................................. 103
5 References................................................................................................................................ 107
6 Appendices ............................................................................................................................... 112
The BaSiS (Breaktime and Social Life in Schools) study is directed by Ed Baines and Peter Blatchford at the UCL Institute of Education. Further information and publications can be found at www.breaktime.org.uk. Comments and questions about the research can be emailed to [email protected] and [email protected]. The research was funded by the Nuffield Foundation (grant number: EDU/42402). The Nuffield Foundation is an endowed charitable trust that aims to improve social well-being in the widest sense. It funds research and innovation in education and social policy and also works to build capacity in education, science and social science research. The Nuffield Foundation has funded this project, but the views expressed are those of the authors and not necessarily those of the Foundation. More information is available at www.nuffieldfoundation.org

4
Acknowledgements We are grateful to the many people involved in assisting with this research, who have contributed their precious time and support. We would like to thank the Nuffield Foundation for funding the study and for their support throughout. Our deepest thanks go to those who made this research possible, the school head teachers, other staff and pupils who engaged with us by completing and returning the survey questionnaires and by allowing us to visit their school and to talk to them about their views and experiences. We would also like to thank the many friends, colleagues and students who gave up their time to assist with this research and to offer their thoughts and advice, in particular, Tamara Lorenz, Anthony Russell, Kelly Golding, Paul Bassett, Oliver Chan, Sara Burdett, Cath Prisk and Neil Coleman. We are also indebted to the team of data entry people who spent many hours entering and checking the data and transcribing the interviews. We would also like to extend our thanks to the advisory group members: Emily Tanner, Julia Bishop, Helen MacIntyre, Tim Gill, Lauren McNamara, David Whitebread, and Andrew Lamb - we very much appreciate your dedicated interest, advice and support with developing and promoting the research and in providing valuable feedback on the final report.
Terminology ‘Breaktime’ (or ‘recess’ as it is referred to in the US) is a break within the school day which typically involves access to outdoor space, when weather and space permit, and is often unstructured time for recreation, play and socialization with peers in a setting where adults often supervise at a distance. Breaktimes can be differentiated from other short breaks which allow students to have a comfort break, a snack or meal or to move to another location for the next lesson - without unstructured time for recreation.
Here we use the term ‘break’ or ‘break time’ to refer to any breaks in the school day allowing for unstructured recreation. These may take place in the morning, as part of a lunchtime or in the afternoon. Sometimes we refer to specific breaks such as morning or afternoon break. ‘Lunch time’ refers to more than break time, however, and refers to the specific break in the school day that also includes time for a meal, as few schools seem to separate out meal time from recreational time during the lunch period.

5
Executive summary
Background Over the last two to three decades there have been substantial changes to schools and education in England. There has been increasing pressure on schools to increase standards whilst also supporting the needs of their pupils to meet the changing challenges of living in 21st century society. There have been structural changes to schools and the curriculum in England as well as campaigns focusing on improving school food and increasing levels of physical activity amongst children. Over this period there have been growing concerns about the mental health of children and young people. There have also been marked changes in children’s social lives in and out of school with a decline in children’s independence of movement and a corresponding reduction in off line opportunities for informal peer interaction and play outside of school (Play England, 2012; Shaw et al., 2013). Online communication and interaction has substantially increased. There has been increased interest in attendance of adult-organised after-school activities and clubs (Chanfreau et al., 2015). Against this backdrop, a seeming constant in schools is break and lunch times – the parts in the school day when pupils get to meet friends and socialise, eat, visit the toilet and engage in activities that are meaningful for them in a setting relatively free of adult control. Just about the only systematic data available on breaktimes in schools in England and, as far as we know, anywhere in the world, comes from the two previous national surveys, funded by the Nuffield Foundation, undertaken in 1995 (with information on changes to breaktimes since 1990) and 2006. However, there is little agreement about the value and function of break times amongst school staff and policy makers, and they are often taken for granted. For many adults, breaks are simply a habitual, relatively unimportant pause in a busy day. There is no statutory requirement for schools to provide children with a break in the school day and they hardly figure in government policy or in Ofsted inspection processes. When they are considered by schools it is often in the context of the problems that can arise and the practicalities of school management. For pupils, however, breaktimes are some of the most valued times and experiences they have in school. Our previous research (Baines & Blatchford, 2011; Baines & Blatchford, 2009; Blatchford, 1998; Blatchford et al., 2003) has shown that breaktimes have an important role in social development. Given the changes to education and society, and the lack of officially gathered systematic information on breaktimes, it is a timely moment to carry out a follow-up national survey, and an important opportunity to map trends in this little understood part of school life over the past 25 years. In addition, we also wanted to survey changes in children’s social lives in and out of school since 2006 to provide important information on their perspective on break and lunch times but also to see how these times relate to their wider social lives with peers outside of school.
What we did The BaSiS (Breaktime and Social life in Schools) study involved a national survey of state funded and independent primary and secondary schools in England. We collected current information on the main features of break and lunch times, including: timing and duration; breaktime organisation and management; supervision arrangements; changes to school grounds; rules for pupil movement during break times; the perceived value and function of these times and views on pupil behaviour at break times. The study also involved a survey of pupils’ views and experience of social life in and out of school and a set of case studies of schools that characterise a range of approaches to break and lunch times and school provision.

6
Over a quarter of sampled schools1 returned school surveys. The responding sample was found to be representative in relation to most measures (e.g., school type, proportion of pupils receiving free school meals, where schools were located, pupil gender and Ofsted status). Data and findings relating to independent schools (which made up 5% of the total sample) are reported separately to enable accurate comparisons with earlier surveys in 1995 and 2006 (as previous surveys only collected data from state schools).
A sub-sample of schools also agreed to participate in the pupil survey. Of the primary and secondary schools that agreed, a random sample stratified by region and school phase was selected, sent questionnaires and asked to allow at least one class of pupils in Year 5 or Years 8 and 10 to be invited to complete a questionnaire2. Surveys were completed by 1669 pupils, 691 were in Year 5, 540 in Year 8 and 438 in Year 10.
Findings presented here relate to state funded schools unless explicitly stated. Analyses provide an up-to-date view of arrangements, views on and experiences of breaktimes in schools in 2017 and, through comparison with previous data, changes in these since 2006, 1995 and in some areas relative to 1990.
Key findings The duration of break and lunch times Break times and lunch times are universally experienced in schools. There were no cases of schools that did not report some form of break for pupils. Total time devoted to breaks varies according to education phase. Average total time for breaks was 85 minutes at Key Stage 1 (KS1 – pupils aged 5-7 years), 76 minutes at Key Stage 2 (KS2 – pupils aged 7-11 years) and 63-64 minutes at Key Stage 3 (KS3 - pupils aged 11 to 14 years) and Key Stage 4 (KS4 – pupils aged 14 to 16 years). As a proportion of the school day, breaks made up on average about 22%, 20% and 16% at primary level (KS1 and KS2) and secondary levels (KS3 and KS4 combined) respectively. Independent schools had longer breaktimes than state funded schools. Most primary schools have morning breaks of 15 minutes with a few taking 20 minutes. Lunch breaks of between 45-60 minutes are the most common at Key Stages 1 and 2 but more schools reported KS1 lunchtime breaks of more than an hour than at KS2. By contrast, more schools reported shorter breaks of up to 45 minutes at KS2 than KS1. Only 15% of primary schools reported having an afternoon break at KS2 whereas over half of schools reported that KS1 pupils had an afternoon break, usually of about 15 minutes. A majority of secondary schools have morning breaks of 20 mins, with a few having 15 minutes. About half of all secondary schools have lunch breaks of less than 45 mins, with about a quarter having 35 minutes or less. Afternoon breaks are virtually non-existent at secondary level. An important finding is that there has been a reduction in the length of breaktimes since 2006 and a really marked decline since 1995. Since 1995 breaktimes have been reduced by an average of 45 minutes per week for the youngest children in school (at KS1) and by 65 minutes per week for
1 A 20% sample of primary and secondary schools (n=4379) was sent a school questionnaire. There was a 26% response rate overall (993 surveys were returned by primary schools and 199 by secondary schools). The response rate was lower for independent schools (16%) than state funded schools (26%). 2 52 schools were sent questionnaires for pupils to complete (or could complete the survey electronically) – 37 schools (23 primary and 14 secondary) returned completed pupil questionnaires (a 71% response rate).

7
students in secondary school (at KS3 and 4). These reductions are caused by the cutting out of afternoon breaks and, increasingly, the shortening of the lunch break. The main reasons given by schools for the reduction in break times are to create more time for teaching and learning, specifically to cover the curriculum and to manage or limit perceived poor behaviour of students that school staff say occurs during lunchtimes. These are the same reasons for reductions in breaks identified in previous surveys. Primary schools with a higher proportion of pupils in receipt of free school meals and/or in urban areas tended to have less total time for breaks even when controlling for the length of the school day. Suitability of school grounds for breaktime activities, supervision, and teaching and learning outdoors Schools were very positive about the suitability of their school grounds for breaktime activities, supervision, and learning outdoors. This view was more positive than in previous surveys. Primary schools were positive about the nature and state of repair of a wide range of spaces, structures and resources available in the outdoor areas used for breaks. Secondary schools were also positive about the availability and quality of their basic provision but were more negative about the existence and quality of playground markings, sheltered and quiet areas on the playground. A particular difference between primary and secondary schools was in the availability and quality of fixed and portable play equipment. These were widely available and in good repair in primary schools but not in secondary schools. Furthermore, this was an area of improvement in primary schools, relative to previous figures in 2006, but not in secondary schools. When working with outside agencies to improve the school grounds, fixed play equipment was the area that most schools, primary and secondary, were focusing on. There has been a marked increase since 2006 in the presence of CCTV in school playgrounds with nearly half of primary and three quarters of secondary schools with CCTV in their playground spaces. However, this security measure was least likely to be identified as an area the school had worked to improve. Breaktime Supervision Support staff were most likely to supervise at break times in primary schools, particularly during the lunch break. Teachers were most likely to supervise breaks in secondary schools and independent schools. There has been a marked increase in the average numbers of adult supervisors supervising breaks on primary and secondary playgrounds in 2017 compared to 2006 and 1995. This means that there is a higher staff to pupil ratio than in previous surveys. This seeming increase may be affected by a possible increase in the staggering of breaks in schools, however, which would require more supervision, and the exact figures may therefore be lower. Nevertheless, across the three surveys, the supervisor-student ratio in 2017 is the highest yet. The predominant approach to the support and training of supervisors in primary and secondary schools was informal (e.g. involving discussions with supervisors as and when required, discussion of job role, etc.). The provision of formal training of supervisors has reduced compared to previous surveys, particularly in secondary schools.

8
Supervision in most schools takes the form of general oversight but in many primary schools some supervisors organise and supervise particular activities for children to participate in if they wish. There was little evidence of schools having adopted fully structured breaktimes where pupils are required to choose from a menu of adult led/supervised activities to participate in. Freedom of movement In primary schools, children were largely required to stay outside of school buildings during breaktimes. In most secondary schools, pupils were allowed access to specific indoor areas during breaks and the proportion of schools offering this had increased since 2006 and 1995. However, in earlier surveys pupils were more likely to be allowed access to most areas of the school during breaks. During poor weather, most primary schools had a policy of children staying in their classrooms with very few schools allowing children outside. In secondary schools, during wet weather pupils were allowed access to most areas of the school and a large minority of schools still allowed children out, though not onto grassy areas. Secondary schools rarely allow any students off school premises during lunch breaks even with parental permission. This is different to the picture in the earlier surveys. In 1995 approximately 67% of secondary schools allowed any students or particular year groups (usually older students in years 9-11) off site during lunch breaks, when parental permission was in place. In 2017, the equivalent figure is that only 12% of secondary schools report allowing some students to leave the premises during lunch break. Withholding breaks A major finding was that 60% of primary and secondary schools said that children might miss a full break or lunch time. The main reasons given for this related to the management of misbehaviour or to help pupils catch up with schoolwork. Many schools indicated that this was part of a school policy. This was a line of enquiry that was new and particular to the 2017 survey and thus it is not possible to examine changes in the withholding of breaks over the 20-year period. Activities during breaks and before/after school Many schools reported that they offered activities for children during breaktimes and this had increased slightly since 2006. Most frequently offered adult-led activities during breaks were team sports, music and curriculum support activities. Independent schools were more likely to run a wider range of clubs than state funded secondary schools during break times. The proportion of primary schools offering breakfast clubs has nearly doubled since 2006 from 42% in 2006 to 78% in 2017. Nearly three quarters of secondary schools also offered breakfast clubs. Nearly all primary and secondary schools offered adult-led clubs and activities after school but slightly fewer secondary schools were offering these compared to 2006. Independent schools were less likely to run clubs after school. The most commonly offered after-school clubs involved team sports, music, art, drama and curriculum support. There was a marked increase, compared to 2006, in the proportion of schools offering curriculum support activities after school, while proportions offering other types of clubs were stable or had declined.

9
Nearly three quarters of secondary schools and 31% of primary schools allowed children to bring mobile phones to school. Their use was prevented during the school day in primary schools but nearly half of secondary schools allowed pupils to use them during breaks. The perceived value and challenges of breaks, and views on pupil behaviour Primary schools highlighted breaktimes as providing important opportunities for energy release and physical exercise, socialising with peers and to get fresh air. Secondary schools saw breaks in more functional terms as important times for eating and drinking, energy release, physical exercise and getting fresh air than valuing it for the social opportunity it provides. The valuing of breaks as time to get fresh air has increased since 2006. Although the majority of schools indicated that there were challenges at breaktimes, the proportions of schools saying this had reduced compared to levels in 2006. The main challenges highlighted were the poor social behaviour of a minority of pupils and concerns about overcrowding of the dinner hall/ outside space, and the quality of supervision, particularly at secondary level. Schools were more positive than in 2006 and 1995 about pupils’ behaviour during breaktimes and outside of school. Proportionally more schools in 2017 than in previous surveys reported a perceived improvement or no improvement in breaktime behaviour in the past 5 years. In contrast to previous surveys, schools that reported a perceived decline in behaviour suggested that this was less to do with aggressive behaviour and more to do with poor levels of social competence among some pupils. There is, then, an apparent shift in the perceived cause of poor behaviour. Pupils’ views on breaktimes Findings from the survey of pupils’ views showed that pupils are overwhelmingly positive about break times and particularly the longer lunch break which 87% of pupils liked or really liked. Very few pupils (5%) expressed a dislike of these times. These findings are unchanged since the previous pupil survey undertaken in 2006. Higher percentages of pupils like breaktimes than they do school in general, lessons and/or mealtimes. Pupils at primary and secondary levels valued breaks first and foremost for the opportunity they provide to socialise with friends. They also valued the opportunity for some free time, and the chance to choose what they wanted to do and/or to engage in playful activities. These values were largely consistent with those identified by the 2006 survey. Since 2006, all pupils, but particularly secondary-aged pupils, were more likely to value lunch time as time to eat and drink and less likely as a chance to get physical exercise. Pupils, consistent with school staff, identified the poor behaviour of some other pupils as the main challenge of breaktime. This was coupled with the absence of things to do, the banning of fun activities and, particularly amongst secondary pupils, having sufficient time to eat. Concerns about the banning of fun activities and sufficient time to eat have increased since 2006. A majority of pupils indicated that lunchbreaks were too short and should be made longer. Surprisingly, older students were more likely to express this view, possibly because of the relatively short lunch breaks that secondary pupils experience compared to primary pupils. Most pupils also felt that there were enough adults supervising at breaktime, though older students were slightly more likely than younger pupils to express the view that there were too many adults supervising.
10
Pupils’ experiences of what happens during breaktimes Over three quarters of primary pupils indicated that they participated in adult-organised activities during breaktimes. This was much lower, at less than a third, for Year 8 pupils, and even less for pupils in Year 10. The most prevalent activities that pupils participated in were team sports, other sports, and music, and nearly 10% indicated that they attended homework/curriculum support clubs during break times. A large majority of pupils (over 80%) indicated that they had missed break times and this was more likely amongst older pupils. The main reasons for missing breaks were consequences imposed on all class members due to the poor behaviour of one individual, or to finish off homework/ class work. The majority of pupils reported that they enjoyed mealtimes. However, reflecting our earlier finding, secondary pupils indicated that they did not have enough time to eat their lunch. Social life after school Most primary pupils, but only a minority of secondary school pupils, attended after-school clubs and clubs outside of school. There has been a marked decline in the attendance of after-school and out-of-school clubs in the 10 years since the previous survey in 2006. Nevertheless, the types of clubs that pupils today are most likely to attend are much the same as 2006, and largely involve after-school team sports, other sports and music, and out-of-school youth organisations (e.g. Brownies, Scouts etc). Most pupils, particularly older students, reported that on the preceding day they had gone straight home. Fewer pupils than in 2006 reported that they went to a friend’s house after school and in terms of activities after school, fewer pupils than in 2006 indicated that they played or met with friends. TV viewing/playing on devices (without friends physically present) has overtaken activities with friends as the principle after school activity. It is important to emphasise that this survey did not examine social engagement with friends online. An important finding is that there has been a marked reduction, since 2006, in the proportions of pupils who regularly meet (offline) with peers outside of school. There has also been an increase in the proportion of students who rarely meet with peers outside of school (less than once a week). These findings highlight that school is increasingly the main, and in some cases, the only context where young people get to socialise directly (and in unmediated ways) with peers and friends of their own age. Results also show, consistent with the findings for the 2006 survey, that the vast majority (85%) of pupils felt that it was important for them to have time to meet with friends in school; less than 5% indicated that it was not important. Pupils in 2017 were less likely than in 2006 to report that it was true that they had many friends in school (73% vs 87% respectively). In 2017 a higher proportion of pupils (10%) than in 2006 (4%) reported that they did not believe that they had many friends in school.
Conclusions The BaSiS study set out to understand the nature, organisation and management of school break times, along with the views of school staff and pupils, and to provide insights into the social lives of pupils outside of school. The study aimed to compare this national picture with our previous surveys

11
undertaken in 2006 and 1995 to provide an understanding of continuities and changes in these areas over the course of the last two decades.
The findings from the BaSiS study come at a time of increased concern about the mental and social health of young people. There are strong suggestions that they are experiencing more stress and pressure, and more mental health problems than ever before. It also comes at a time when there are debates about the value of adult-organised clubs after school, concerns about the narrowing of the school curriculum, and pressure on young people and schools to improve performance. Outside of the school context, there are debates about declining independence and opportunities for play outdoors, as well as concerns about the changing influence of, and access to, digital technology and associated activities in children’s lives. The research findings reported here are relevant to all of these debates.
The BaSiS project findings show that there is currently a lack of clarity about the purpose of break times in school and how they may contribute to the broader aims of school, education and development. Break times offer space, time and opportunities for a range of non-curricular and extra-curricular activities, but this lack of clarity means that some schools feel that they can reduce these times in favour of the curriculum and learning in class. There are clearly difficulties that can arise at breaktime and it is therefore understandable if one solution involves limiting the contexts within which poor behaviour occurs most frequently or seeking to control it by increasing supervision. Yet, the overall impression was that pupils’ views about breaktime were at odds with the view of school staff who stressed the problems that arise and the perception that breaktimes need to be tightly managed and short. The vast majority of students viewed breaktimes very positively and valued the social opportunities they allow, as well as the opportunities for eating and drinking. Pupils would in fact prefer break and lunch times to be longer and would like to see an easing of constraints on enjoyable activities, and more opportunities for activities to engage in.
There are alternative ways of handling the challenging behaviours that can sometimes arise during breaks. These may, in part, come about due to an absence of resources, activities and things to do or poor use of space. Even if pupils do engage in anti-social behaviour we query the view that the solution is yet more adult structure and control. Just as important, we feel, is dealing with it in the context of everyday peer interaction itself (e.g. during school breaktimes). Whilst schools and teachers can be effective in teaching children about moral understanding, children also learn from their own experiences, mistakes and reflections. School breaktimes play an important role here. The difficulties that staff know arise at breaktime can be viewed positively in the sense that they can be the basis for discussion with pupils and greater involvement of pupils in school decisions and management (Blatchford, 1998), within a moral framework provided by the school. Evidence of further cuts to breaktime and shortening of lunchtimes take on more significance in the light of findings on children’s opportunities to meet offline with friends outside of school. Not only did we find a significant reduction on 2006 levels in direct offline socialising with friends after school and a reduction in going to a friend’s house after school. We also found a significant reduction in meeting up with peers outside of school such that nearly a third of children saw peers outside of school less than once a week. These three consistent findings suggest a marked decline in face-to-face direct socialisation with peers outside of school, at least outside of a digital context. These have important implications when considered against the wealth of research evidence that strongly suggests that breaktimes are important sites for peer interaction and for the development of personal, social, cognitive and emotional understanding and skills3 (Baines & Blatchford, 2011; Blatchford 1998; Gray, 2011; McNamara et al., 2018; Smith, 2010; Veiga et al.,
3 It is important to note that a unique, direct causal connection has not yet been established between breaktime interaction, play and the development of important social skills, though as argued here it is a main site for interaction with peers and friends and participation in groups. These in turn have been found to significantly affect children’s development and wellbeing (see Blatchford et al., 2016; Bukowski et al., 2018).

12
2017; Whitebread et al., 2009). It may be that breaktimes are one of the few remaining opportunities that children have for sustained interaction with each other on their own terms and on the issues, activities and topics of interest and value to them. These contexts offer significant opportunities for the development of important skills and understandings that are not often learned in other contexts such as the classroom, in many adult-led after-school clubs or at home.
At a time of growing concern about children’s mental health and personal and social development, we believe that every school pupil should have the opportunity for break times in the school day. These times are important as an enjoyable brief break from the intensities of learning. But they also provide crucial opportunities for children and adolescents alike to engage with peers and friends in fun activities of their own choosing in a safe and supportive context. It is important, we believe, to acknowledge the valuable contributions that break times make to the social, emotional, mental and physical development of children and young people.
Recommendations There are six main recommendations arising from this research:
1. Schools should carefully consider the time available for breaks and work to ensure that pupils
in both primary and secondary schools have adequate breaks in the day. This should include a
lunch time that allows reasonable time for pupils to meet with friends, collect and eat a meal,
and some free time for self-chosen activities, whether this is play, participating in a club or
socialising freely with friends and peers. While there is no consensus on the optimal length of
breaks, the length of breaks should be considered in terms of a restorative function (e.g. for
engagement, learning, cognitive processing) as well as functioning to provide opportunities for
sustained social interaction with peers, play, physical exercise and extra-curricular clubs.
2. Schools should aim to develop a policy on breaks in the school day. While breaktimes make up
around 20% of the school day, they are overlooked, and this is reflected in the lack of school policy.
A school policy should cover their nature and length, their staffing and training for break time
supervision, making clear what the school hopes pupils will gain from breaks and how it is perceived
that these times support children’s development, learning, and wellbeing.
3. Schools should consult and work with pupils to enable them to have a say on break times, the
activities and clubs on offer and how the outdoor space is set up, resourced and decorated so that
playground activities can be engaging, interesting and fun. There are a number of organisations
that provide useful advice on, and support for, improving opportunities during break times.
Secondary schools, in particularly, should also try innovative ideas to enrich the quality of break
times for pupils. Schools should consider providing adult led clubs/ extended learning opportunities
as part of the school day or after school rather than during break times.
4. Schools should reconsider the practice of withholding break time as an individual or group
sanction or for pupils to complete work, especially if this is routinely used. This is taken for granted
as a punishment, but there is evidence that this approach is likely to be counter-productive to
children’s well-being generally, especially if regularly experienced. It is also important to note that
although there appears to be no legislation requiring that pupils are allowed time for a break (in

13
contrast to the situation for teachers), article 31 of the UN Convention on the Rights of the Child,
to which the UK is a signatory, states that children have a right to play. Schools should consider
alternative, constructive ways of motivating and sanctioning pupils and enabling them to finish
academic work rather than withholding breaktimes.
5. Schools should review their approach to the training of supervisors. Supervisor training should
aim to support, manage and to strategically facilitate positive and constructive breaktime
experiences that contribute to children’s wellbeing and their social and psychological development.
Training should ensure that staff know how to manage everyday problems that can arise during
breaks in an inclusive and strategic fashion.
6. Policy makers should consider legislating for time for pupils to have breaks. Working adults,
including teachers have a right to breaks but there is no equivalent policy for pupils. Legislation
should convey an average expectation that ensures all pupils have regular and sustained periods
of break time every day to undertake activities of their own choosing, with peers and in an
outdoor space for the purpose of play, recreation and social development.

14
1 Introduction This report provides a detailed account of the main findings from the Breaktimes and Social life in Schools (BaSiS) project which included a national survey of primary and secondary schools in England along with a survey of pupils’ views and experiences of school breaks and their social life in and outside of school. This research builds on, and reports findings in relation to, two earlier surveys undertaken first in 1995 and then in 2006 – to provide an understanding of changes to breaks in school over a period of 20-25 years. This is the first output from this project. Further reports and articles focusing on other parts of the project will be written and published in due course and will be available from the project website (www.breaktime.org.uk).
The report begins with a general overview of the background to the project along with the research questions. There is a section outlining the methodology and the various considerations when planning and undertaking the research. The findings are then reported in relation to the breaktime survey and the pupil survey. The report finishes with a discussion of findings along with implications for policy and practice.
1.1 Background Over the last two to three decades there have been substantial changes to education and to schools. There has been increasing pressure on schools to increase standards whilst also supporting the needs of their pupils to meet the changing challenges, needs and values of 21st Century society living. There have been many structural changes to schools in England, with a substantial number of schools converting to academy4 status, the opening of free schools and an increase in large schools. There have been multiple curriculum and assessment reforms in schools, and campaigns and substantial funding to increase the quality and uptake of school meals and increase the level of physical activity in schools. Outside schools there have also been substantial changes in children’s social lives in and out of school with a continuing decline in children’s independence of movement and a corresponding reduction in opportunities for informal peer interaction and play outside of school (Play England, 2012; Shaw et al., 2013). Online communication and interaction has substantially increased with widespread availability of engagement through social media, social networking and online face-to-face interaction. There has been increased interest in attendance of adult organised after school activities and clubs (Chanfreau et al., 2015).
In the context of these changes, a seeming constant in schools is breaktime and lunchtime – the parts in the school day when pupils get to meet friends and socialise. Just about the only systematic data available on breaktimes in schools in England, and as far as we know anywhere in the world, comes from the two previous national surveys, funded by the Nuffield Foundation, undertaken in 1995 (with information on changes to breaktimes since 1990) and 2006. These surveys showed that lunch and breaktimes were a significant part of the school day, making up between 18% - 24% of time in school. However, our findings also showed that breaktimes had been reduced in length in the 16 years from 1990 to 2006, particularly the lunch-break, and that the afternoon break had effectively been abolished at Key Stage 25 and secondary school level. Our research has also shown that for the vast majority of children and young people, these breaks are still the most enjoyable and memorable times they have in school.
4 Academies and Free Schools are funded by the state but receive this directly from the government rather than via a Local Authority. They are normally independently run by a head teacher with a charitable trust providing strategic direction and support. Free schools are academies set up by parent/teacher groups or other types of groups with an education provider taking responsibility for the day-to-day running of the school. These schools can set their own curriculum and terms and school day timings. 5 The English National Curriculum is divided into four Key Stages. Key Stage 1 relates to children aged 5-7 years; Key Stage 2 relates to children aged 7 to 11 years; Key Stage 3 relates to pupils aged 11 to 14 years and Key Stage 4 relates to pupils aged 14 to 16 years. Primary schools cover KS1 and 2 and secondary schools normally cover KS3 and 4.

15
Yet there is little agreement about the value and function of breaktimes amongst school staff and policy makers and they are often taken for granted. For many adults in schools, especially secondary schools, breaks are simply a habitual pause in a busy day, and they hardly figure in government policy or in Ofsted inspection processes. When they are considered by schools it is often in the context of the problems that can arise and school management difficulties. Yet our previous research (Baines & Blatchford, 2011; Baines & Blatchford, 2009; Blatchford, 1998; Blatchford et al., 2003) has shown that breaktimes have an important role in social development and other aspects of psychological and physical development and for young people to engage in self-chosen activities involving play and games.
Given these changes and the lack of systematic information on breaktimes collected centrally, we felt it was a timely moment to carry out a follow-up national survey which could provide the unique opportunity to map trends in this little understood part of school life over the past 27 years. In addition, we also wanted to survey changes in children’s social lives in and out of school since 2006.
A main reason for reductions in the length of breaktimes reported in 2006 was the perceived pressure to cover the curriculum, in part driven by concerns about the UK in international comparisons of school performance (e.g. PISA), but also in relation to school performance and accountability. If anything, such pressures have increased over the past 10 years. Recent curriculum and assessment reforms and the expanded focus on performance have led to strong claims that the curriculum has narrowed (NUT, 2013; Pollard, 2012). Schools, though, can still feel the value in providing a broad curriculum and this might have added pressure to provide ‘enrichment’ activities, such as music tuition, computing/coding clubs, drama and art, which may take place during school lunch times and after school or even as part of an extended school day. These changes may have influenced the length but also the ‘open’ nature of breaktime. To reduce pressure on students, some schools may be introducing shorter but more frequent breaks between lessons (NUT, 2015), as practiced in other parts of the world, e.g., Japan, Finland, (Beresin 2016).
Another reason for reducing the length of breaktimes is an enduring concern about conflicts, aggressive behaviour and bullying in schools, which can take place on school playgrounds (Smith, 2014). School staff are concerned about what they see as needlessly aggressive behaviour, and much time and effort can be expended resolving arguments and calming pupils down after they have returned from breaktime. It is therefore understandable if one solution to these problems involves controlling or limiting the contexts within which these things occur. However, by shortening breaks, or by organising them so that they involve activities that are largely led by adults, we may be restricting important occasions for young people to develop essential social skills and for learning vital social lessons.
In addition to the changes in the school system already mentioned, changes in policy now mean that all schools, especially academies and free schools, have power to alter the nature and length of the school day (DFE, 2011). Recent financial constraints may mean funds are re-directed to staffing and learning resources rather than equipment for play or the school grounds. New schools are being built and set up with little or even no outside space or playground (Beckford, 2007). Increasing school rolls have meant more temporary buildings, which eat into playground space and playing fields (Roberts, 2013) especially in urban areas where space is already at a premium.
The introduction of free school meals to all children in Key Stage 1 (KS1) may have introduced practical constraints (e.g. seating all children in a dining room including those who had previously taken a packed lunch) and led to changes in the length and organisation of lunch times. Recommendations in relation to meal times often highlight the importance of children taking time to eat their food (School Food Trust, 2009). This extra time may mean reduced time available for play, recreation and socialisation on the playground. Some schools seem to be ‘engineering’ children’s meal time experiences (Baines & MacIntyre, forthcoming), for example, through allocated seating and roles to enhance inclusion and responsible behaviour, and thus reducing opportunities

16
for children to sit and socialise with friends. Recent policy changes and debate concerning school food provision, public concern about levels of obesity and increased awareness of involvement in sport following the London Olympics (Horridge, 2014) may also have led to changes in school break and lunchtimes or to more structured approaches to encouraging physical activity on the playground (e.g. Ridgers et al., 2006; ukactive, 2015). While it is unlikely that there are changes similar to those in the USA where many schools have replaced recess with periods of physical education (Ramstetter et al., 2010), nevertheless, breaktime activity may be more adult structured or adult led to encourage more physical activity, e.g. ‘the daily mile’ and other similar interventions. All of these changes may have important implications for school break and lunch times but as yet have not been documented since 2006.
Changes to breaktime in school need to be seen alongside wider changes over the last two decades in children's out of school activities. The previous Nuffield funded survey in 2006 included a survey of over 1300 primary and secondary school pupils in terms of their social lives in and outside of school and identified a marked decline in children’s independence of movement (compared to 1971 and 1990 levels) and an increase in travel accompanied by adults (Baines & Blatchford, 2012). Children’s social lives outside school have become more tightly controlled because of parental concerns (Collishaw et al., 2012; Gill, 2007; Layard & Dunn, 2009; Shaw et al., 2013). Modern media and technology can mean more solitary and less interactive play and activities in the home. On the other hand, provision of and attendance at out-of-school adult-led activities, tutoring and after-school clubs may have increased (Chanfreau et al., 2015). As part of our 2006 survey we found that over a quarter of children and adolescents rarely saw their friends outside of school (i.e., less than once a week). Data from the Millennium Cohort Study for children at age 7 and 11 show a similar pattern with a quarter and a fifth respectively spending time with friends less than once per week (MCS, 2010; 2013). This means that for some children, school break and lunch times are one of the few opportunities they have to socialise with their friends and develop social skills in a context that is relatively free from adult structure and control.
There is also a broader policy concern about children’s social, physical and mental well-being. Studies undertaken by UNICEF (2007; 2013) raised concerns about the state of children’s social lives in the UK with potential consequences for their physical and emotional health. These concerns were raised again in the recent annual ‘Good Childhood’ reports by the Children’s Society (2015; 2017) which highlighted evidence suggesting a decline in children’s happiness with friends between 2007 and 2011 and ongoing concerns about the negative and potential long-term effects of bullying. Recent reports have highlighted concerns about mental health and behaviour problems in children and young people and the possible effect of structured and unstructured time and peer group dynamics (Children’s Society, 2018; DOH, 2015; Nuffield, 2012). Reports from the Play England and the All Party Parliamentary Group on a Fit and Healthy Childhood, have identified the worrying lack of play opportunities for children and the importance of play for children and childhood. The APPG called for play to be at the centre of a 'whole child' approach to children's health and well-being. Yet there is relatively little recent data on the nature of children’s social lives in school and outside of school. Recent Nuffield funded research (Chanfreau et al., 2015) utilised data from the millennium cohort study that was collected some time ago.
1.2 A positive role for school breaktimes There are good grounds for a positive view about breaktimes. Breaktime, especially at primary school level, is often a time for vigorous physical activity and this has an obvious function in the context of concerns about sedentary life styles, childhood obesity and mental health (Ahn & Fedewa, 2011; Beresin, 2012; Beyler et al., 2014; Delidou et al., 2016). Reduction in the length of breaktimes may reduce opportunities for children and young people to achieve the daily levels of physical exercise needed for a healthy lifestyle. For a minority of (usually) primary school staff,

17
breaktime is a valuable opportunity for pupils to change gear, and to let off steam. There is evidence to support the idea that breaktimes offer distinct benefits for classroom engagement when used to break up long and intense periods of learning (Barros et al., 2009; Jarett et al. 1998; Pellegrini et al. 1995). There is also evidence to suggest that learning is improved after a period of physical activity (Carlson et al., 2015; Ramstetter et al., 2010). But breaks should not be seen simply as a break from a busy schedule or as solely an opportunity for physical exercise; the interactions, playful activities and relationships forged during these times have important positive implications for classroom learning in other ways, for example, in terms of enhancing creativity and literacy (e.g. Grugeon, 2005).
Despite concerns amongst children and school staff about mean behaviour, exclusion and bullying, breaktimes are, according to children and young people, one of the most enjoyable aspects of school, if not one of the main motivations for going to school (Blatchford, 1998). This is not surprising given the findings from the Good Childhood Enquiry report (2015) that good quality friendships, leisure activities, having free time, education and freedom/ autonomy are at the heart of indicators of young people’s subjective wellbeing. Put simply, breaktimes provide the main forum for young children’s social life in school and sustained interactions with friends. Of course, this can have a negative side, e.g., in instances of aggression and bullying. But breaktime is also a time when friends, not always in the same class, can meet; a time when they can have fun and, at primary level and also at secondary level, construct playful and sometimes risky activities in a relatively safe environment; a time when important social interaction and bonding takes place, where networks are formed; a time when they can fall out, but can also develop strategies for avoiding conflict. It is a rare time when the rules of conduct are more their own and when children develop important social skills such as negotiating entry into groups, handling slights and teasing, developing new friendships and collaborating in activities and being creative with friends. Many of these skills are not easily taught, certainly not in conventional ways, but are often valued as important ‘soft skills’ (or even 21st Century skills – Luckin, Baines, Cukurova & Holmes, 2017) which are useful for later life (Sluckin, 1981) for making and sustaining networks, and enhancing social capital. Similarly, these times are important opportunities for developing positive peer relations and friendships which are connected to later positive adjustment and wellbeing (Bagwell & Schmidt, 2012; Blatchford, Pellegrini & Baines, 2016; Bukowski, Laursen & Rubi, 2018; Ladd, 2005). The difficulties that staff know arise at breaktime can also be viewed positively in the sense that they can be the basis for problem solving discussions with pupils and greater involvement of pupils in school decisions about breaktimes (Blatchford & Baines, 2010).
This more positive view of breaktime stems largely from recognition of its value from pupils' perspectives. A main concern is that because the inherent value of this part of the school day for the child is only poorly understood by staff, it is being gradually eroded or becoming over controlled and structured. This may be a particular issue in secondary schools. We therefore use the term 'breaktime' rather than 'playtime' to indicate that it is an issue for secondary as well as primary schools. Although teenagers may not describe their social activities as ‘play’, and its value may not be apparent to adults, their social lives are as important, and they also need time and space for sustained contact with friends.
1.3 This study The BaSiS (Breaktime and Social life in Schools) study was therefore designed to collect current information on the main features of break and lunch times, including: timing and duration; supervision arrangements; changes to school grounds; rules for pupil movement during break times; views on pupil behaviour at break times; breaktime management; and the perceived value and function of these times. The study also sought to better understand the nature of the activities that take place during these times, arrangements and timings of eating time, practices in relation to discipline and

18
completion of work and access to breaktimes, the role of staff in the organisation of playground activities, the prevalence of enrichment activities and before and after school provision, and views on decisions which have led to changes.
A strength of this study is that as these areas were also examined in our previous surveys, we are able to compare changes to break and lunch times over a period of nearly 30 years, between 1990 and 2017. We were also able to examine each topic across phases in education (primary and secondary) and across different types of schools (e.g., local authority maintained schools, academies and free schools, and independent schools).
The research also aimed to collect parallel information on pupil perspectives on break times and their social life in and out of school. In detail the study focused on the following areas: 1. Duration of break and lunch times As with the previous surveys, we sought to find out about current arrangements and lengths of breaks in the school day, whether there have been further reductions to their duration over the past decade and whether there had been changes to the length of the school day. We also aimed to identify the reasons behind any changes. 2. Break and lunch time organisation and management Breaktime presents considerable dilemmas for school management. There appears to be a growing move to what might be called an 'interventionist' view, involving more deliberate management of pupils' behaviour at breaktime. This approach risks affecting the positive social opportunities identified above, while a non-interventionist stance risks allowing anti-school cultures and negative behaviour to dominate potentially having a destructive effect on learning. As in the previous surveys, information was collected on policies regarding breaktime, and on the involvement of pupils and support staff in decisions about break time. Information was also collected on rules about pupil movements at breaktime, including whether or not they have to go out to the playground, and access to the school buildings and other locations in the school grounds. In previous surveys we found that some children liked the option of staying in (Blatchford, 1998), whereas in most primary schools they had to go out. At secondary level, rules seemed to vary considerably in regard to whether pupils were allowed off the school premises at lunchtime. Some schools used break and lunch times as ways to discipline and control children’s behaviour (e.g. through detentions or holding children back to complete work), yet we know very little about the current situation and about policies/ practices in relation to preventing children and young people from having a break.
Very little is known about the nature of school organised activities that are available during break or lunch times. It is not unusual for schools to organise extra-curricular activities and clubs during lunchtimes but there may also be other forms of activities led by play workers and there may be clubs that are less extra-curricular (such as homework club, additional support for literacy and numeracy). Some schools may even have abandoned free recreational time in favour of elected opportunities for so called ‘enrichment activities’. It may be that formal learning and/or adult organised activities are increasingly intruding on break and lunch times or even that parts of the curriculum are covered during these periods (NUT, 2015).
With recent interest in and policy based change to school meal provision, we wanted to find out whether these changes had affected the organisation of lunchtimes. To what extent have recent concerns and changes (e.g., the offering of free meals to all children in Key Stage 1 and concerns about intake of food) led to adjustments to lunchtimes and opportunities for children to socialise with peers on the playground?

19
3. Supervision at breaktime Break and lunch time supervision has presented difficulties for schools for many years. Busy staff need time for a break themselves and the 1995 and 2006 surveys showed that the main supervisory role has passed from teachers to support staff, who are often poorly trained, poorly supported, poorly paid and have little say in decisions about breaktimes. Supervision at breaktime was more than three times as thinly spread at secondary in comparison to primary schools, particularly during the long lunch break. As a result of the 2006 survey, we concluded that the whole area of supervision at breaktime and in particular supervisor training needed to be fundamentally reconsidered. More recent large-scale research by one of the applicants (Blatchford, Russell & Webster, 2012), has drawn attention to the deployment and impact of support staff and the difficulties that dual support staff roles (e.g., on the playground and in the classroom) can cause. But we know little about current arrangements for supervision and it is therefore important to obtain a systematic description of the numbers and type of staff supervising at break times, what their functions and roles are seen to be, the extent to which supervision causes concern, perceived changes in the quality of supervision over the past 10 years, and the extent and type of training supervisory staff have received. 4. Changes to school services and school grounds As suggested above, changes to the activities and services provided by schools before and after school have taken place over the past 10-15 years. It seems that many schools offer breakfast clubs, childcare opportunities and at the end of the school day a range of afterschool activities, sometimes provided by the school or by other organisations allowed on to the school site (Carpenter et al., 2010). There are anecdotal reports that some schools have extended the school day to allow for opportunities for students to engage in extended learning and enrichment activities, but this may have come at a cost in relation to children’s breaktimes. With increased pressure on school rolls, especially in major cities, there are likely to have been changes to the physical nature of the school grounds since the 2006 survey and these can be expected to have affected pupils' breaktime experiences in school. On the other hand, schools may have used sports premium funding to make alterations to facilities available on the playground. This study sought to document the current nature of school services and school grounds. 5. The perceived value and function of breaktime and breaktime behaviour As in the previous surveys, we were keen to ascertain staff views on the value and purpose of breaktime, and on problems arising at breaktime and out of school, to see what changes have taken place over time. 6. Pupils’ views and experience of social life in and out of school Finally, we were also keen to study pupil perspectives on breaktime, and on opportunities for informal social interactions and relationships with peers both within and outside of school, attendance of after-school and out-of-school clubs and how these connect with feelings about relations with friends, peers, and views on breaktimes and school.
2 Methods The study was undertaken over two main phases. The first phase consisted of a national survey of schools in terms of their arrangements for break and lunch times. The second phase consisted of a survey of children and young people in terms of their social life within and outside of school and a set of case studies of primary and secondary schools that focused on the experiences and views of pupils and staff in relation to breaktimes and school grounds.

20
2.1 Phase 1 national school survey on the nature, organisation and management of breaktimes
This was a large-scale postal survey, similar to the 2006 and 1995 surveys. The breaktime questionnaire used in previous surveys (see Blatchford & Baines, 2006; Blatchford & Sumpner, 1998) was revised and updated e.g., on the basis of pilot work involving exploratory visits to primary and secondary schools, and interviews with head teachers and school staff and with pupils. It was necessary to further update and extend the questionnaire to capture recent changes to schools and the school system. Whereas the previous school survey had sections on the community use of school and its grounds and security features (fencing, CCTV etc), the new survey aimed to provide more detail on the nature of break and lunch times, including meal time organisation, withholding of breaktimes and organisation of and access to school clubs sometimes called ‘enrichment activities’.
Pilot work aimed to find out how far the questions were clear and appropriate. We undertook several interviews with head teachers and small group interviews with pupils and students within these schools to help further develop the school survey and the phase 2 student social life in school questionnaire. This informed the questions asked and response categories offered in each of the surveys as well as providing early insights into key areas of importance for young people.
2.1.1 Phase 1 sampling To achieve a survey comparable to that undertaken previously, and in order to get a comprehensive and reliable account, we aimed to get a sample of state primary and secondary schools similar in size to the previous surveys. We also wanted to extend the survey to include a sample of independent private schools in England. Previous surveys did not contact independent schools – and an aim of this research was to find out more about arrangements for breaktime in these schools. Deciding on a sample size is not straightforward when there is a need to establish power but also to ensure a representative sample across multiple variables and when the research is largely descriptive in nature involving analyses across a wide range of categorical variables. Nevertheless, our estimates indicated that a sample of approximately 1600 schools would be highly powered6 to identify potential differences across the three surveys in the main variables examined.
A drawback with questionnaires is the frequently experienced low response rate, and we were concerned that given the current pressures facing hard-pressed schools this might mean a reduced response rate. However, our experience also suggested that the topic itself is of interest to school staff, and completion can be maximised by carefully chosen and concisely expressed questions. For the 2006 survey there had been a reasonable response rate, with between 36%–40% of the 4,000 primary and secondary phase schools approached returning completed questionnaires. This was less than for the 1995 survey, which achieved a remarkable 61% response rate (other survey studies of a similar sort at the time achieved a 20% response rate – See Blatchford & Baines, 2006). The previous surveys provided data on approximately 7% of all schools. To adapt to the strong possibility that schools would be more reluctant to respond to surveys now, we aimed to approach a random selection of 20% of schools in England (approximately 4,500 schools). Schools were drawn randomly from the publicly available and up-to-date database of schools on the Department for Education web site. We aimed to ensure that all
6 A power analysis was undertaken based on a key outcome variable ‘total length of breaktime’. Drawing on data from
the 2006 survey, which at primary level indicated a standard deviation of 9.6 mins, and assuming a 5% significance level and a very high power (>99.9), the 2017 survey would aim for 1336 primary schools in order to detect a change by 5-mins in breaktime length between surveys. A similar calculation for secondary schools, where the 2006 survey suggested a standard deviation of 10.4 minutes, indicated a sample size of 264 schools. With lower levels of power, a smaller sample size would be warranted. The choice of power was based on the need to ensure a nationally representative sample across a range of variables and the importance of subsequent analyses focusing on sub-groups of schools.

21
types of establishment (primary and secondary; LA maintained, academies and free schools, and independent schools) were well represented in the sample and thus sampled separately from these groups. Online or paper survey? We also looked into the possibility of undertaking the survey via an online platform. Online survey tools offer substantial benefits in terms of being easily sent out to schools and once completed no data entry is required. One key barrier is that although school addresses are publicly available, school email addresses are not, at least in the form of a freely available database. We successfully identified a company that could enable us to email a survey directly to schools. However, we were not persuaded that exclusive use of an online survey would get a more substantive response. Despite the potential for increased contact via electronic media, we felt that an electronic survey may be easily lost amongst the many other emails appealing for the attention of school staff and our view was that a paper survey could be more successful. Rather than undertake the full survey using an emailed approach we decided to trial this method in primary schools. As an automatic random selection of individual schools was not practically possible with the email database, we therefore selected by hand a 20% random sample of Local Authority (LA) areas and then a 20% sample of primary schools within each LA7. We then sent out a short email to this sample of primary schools inviting them to take part in the research and provided a link to the survey. The email was sent to the main email address for each school and the school Special Educational Needs Coordinators (SENCos), as an identifiable staff member within the data set often interested in the pastoral side of education and possibly more likely to respond to such a survey than head teachers. Two weeks after the initial email, a reminder email was sent to schools. Tracking data indicated that just less than a fifth of the approached sample opened the email. In the event, and despite the presence of an incentive entry into the prize draw set up for the main survey, the response rate to the e-survey was very poor even after the reminder letter (see Table 1). It is difficult to say why the response rate was so poor, but it may be to do with this being a ‘cold’ survey which participants were not expecting, staff being very busy, or that emails were intercepted by spam filters (with less than a fifth opening the email, it suggests that this may have been the case). Either way, this strongly indicates that email sent directly to generic or specific school email addresses and inviting them to participate in research without prior contact are likely to have a very poor response rate.
Since the response to the e-survey was poor, for the main survey, our final approach was to utilise a mixed strategy whereby a letter and paper questionnaire was sent to all schools in the main sample and which allowed for a paper and postal return or online survey completion and return. It was hoped that such a strategy would maximise the response rate and would be more successful than either method alone.
Letters were sent toward the end of the spring term in 2017 to a new random sample of primary, secondary and independent schools in England, inviting them to complete the included paper questionnaire or to complete the online version via a given link. A freepost envelope in which the paper questionnaire could be returned was also provided. We sent out two reminders to encourage schools to complete and return the paper survey and these also included the link to the online version. The first reminder was sent out a few weeks after the school questionnaire had been sent. This reminder was a letter asking schools to complete and return the questionnaire. A second reminder sent out towards the end of the summer term included a second slightly reduced version of the questionnaire. This had been shortened in key areas without substantially influencing the number of questions asked and was designed to further encourage schools to complete and return the survey.
7 The ‘pilot’ online survey sample did not overlap with the main study sample.

22
2.1.2 Response rates Table 1 provides full details of school surveys that were returned and the response rates broken down by school type8. Overall, 26% of the questionnaires were returned, with LA maintained primary schools and independent secondary schools the most likely to return questionnaires and independent primary schools the least likely to respond. Table 1 also provides information in terms of the mode of response. Despite offering the possibility of an online response this was rarely taken up, with only 48 schools completing the main survey on-line. Table 1. Nature of sample and comparison with non-return sample
Academies + Free
LA Maintained
Independent Overall Total
Primary phase
Postal Survey sample approached 759 2595 156 3510
Received 184 701 20 +933
of which electronic 4 34 1 39
*E-survey 1 10 0 11
Response Rate % 24 27 13 27
Secondary phase
Postal Survey sample approached 441 244 106 791
Received 106 58 35 +199
of which electronic 7 1 1 9
Response Rate % 24 24 33 25
Total
Overall Postal Survey sample 1200 2839 262 4301
Received 290 759 55 1133
of which electronic 11 35 2 44
Response Rate % 24 27 21 26
Notes: Included in Primary phase are: Infant, Junior, First and Middle deemed primary schools.
Secondary Phase includes Middle deemed secondary schools. *E-survey sent to 3,085 Primary schools (separate from the main sample) – followed by reminders - this is a response rate of 0.36%. Tracking data indicated that approximately 18% of schools opened the email. + a number of completed questionnaires were returned anonymously and therefore the precise school type is unknown.
2.1.3 Representativeness of the sample To establish the representativeness of the sample we compared the characteristics of schools that returned questionnaires with those that did not and relative to the overall sample. As the database is large with many non-returners and returners, it is not difficult to achieve a significant result on inferential tests. Findings indicated that there were few substantive differences between responders and non-responders. However, at primary level, but not secondary level, independent schools (relative to state funded schools) and urban schools (relative to rural schools) were slightly less likely to return questionnaires. Responding primary schools had a slightly lower school roll and secondary schools a slightly larger school roll than non-responders. Fewer schools than expected in
8 Data for academies and free schools were combined because there were few responses from free schools and because of their similarity in nature (publicly funded, self-governing, independence from the national curriculum).

23
the north west returned questionnaires and primary schools in the south west were slightly more likely to respond. There were no differences between responders and non-responders in terms of the level of free school meals, the levels of single sex schools or coeducational schools, and the levels of schools with an Ofsted status of ‘special measures’. A number of weighted analyses were undertaken and the results compared to those for unweighted analyses to examine the possible effects of the slight differences in the sample compared to the overall sample. Weighting made very little difference to any of the descriptive statistics or to the results of inferential tests. Where there were variations this was when the sample size included in the analysis was small or the number of responses for a particular category were low (e.g. for some analyses weighting made a difference to the data for independent schools). Variations between weighted and unweighted analyses are noted, where they occur
2.1.4 Characteristics of the sample that returned questionnaires The number of pupils on roll and percentage in receipt of Free School Meals (FSM) did not vary by primary school type (see Table 2), however these did vary for secondary schools, with Academies and Free schools having significantly more students on roll than LA maintained schools and
independent schools (F(2,191) =24.5; p<.001; 2= .21). Similarly, Secondary academies and free schools had a slightly higher proportion of children in receipt of FSM than LA maintained schools
(F(1,157)=13.1, p<.001, 2=.08). Table 2. Average number of pupils on roll and proportion in receipt of Free School Meals by school phase and school type
Academy+Free LA Maintained Independent Total Anova Effect size
Mean SD N Mean SD N Mean SD N Mean SD N F p2
Primary Roll 282.6 165.9 147 259.1 156.3 701 201.1 105.7 20 261.7 157.4 868 ns -
% FSM 14.5 11.2 147 12.9 10.8 701 13.2 10.9 848 ns -
Secondary Roll 1083.5 a 364.9 100 886.3 b 408.8 57 571 c 357.8 35 931.5 421.1 192 24.5*** .21
% FSM 12.3 a 8.4 100 18.2 b 11.8 57 14.4 10.1 157 13.1*** .08
Note. Statistical comparisons involved ANOVA and Games-Howell post-hoc tests with partial eta squared effect sizes. Differing subscripts indicate p<.01 on post hoc tests.
In terms of rural/ urban split (see Table 3), relatively equal proportions of schools of each type at both primary and secondary level came from rural and urban areas. In terms of spread of schools across different parts of England there were differences across the different types of primary schools with academies and free schools less likely than expected to be located in the north of England and most likely to be represented in the south, and independent schools more likely than expected to be based in London. At Secondary level there were also differences, with independent schools more likely than expected to be based in the South.
Table 3. Proportion of schools classed as Rural/Urban by school phase and school type
Academy+Free LA
Maintained Independent Total N Test χ2
Effect
size c
Primary Rural 25% 34% 30% 32% 288 ns -
Urban 75% 66% 70% 68% 616
Secondary Rural 13% 14% 17% 14% 28 ns -
Urban 87% 86% 83% 86% 170
Note. Statistical comparisons involved Chi-Square and Cramer’s V

24
Table 4. Proportion of schools located in different areas of England by school phase and school type
Academy+Free LA
Maintained Independent Total N Test χ2
Effect
size c
Primary North 19% 29% 10% 26% 237
21.4** .11
East 19% 20% 25% 20% 182
West 12% 9% 5% 10% 89
London 10% 12% 30% 12% 107
South 41% 30% 30% 32% 290
Secondary North 17% 29% 6% 19% 37
25.2** .35
East 26% 16% 6% 19% 38
West 14% 10% 6% 12% 23
London 14% 19% 26% 18% 35
South 29% 26% 57% 33% 65
Note. Statistical comparisons involved Chi-Square and Cramer’s V
2.2 Phase 2 One main function of the phase 1 survey was to enable selection of a sub sample of schools for further study in phase 2. The last 2 questions on the questionnaire asked whether schools would be happy to be contacted in relation to the related survey of pupils’ experience of breaktimes and social life in and out of school and/or whether schools would be happy for one of the research team to visit to find out more about their specific arrangements. These two questions were only asked in the first tranche of questionnaires sent out to schools (i.e. not in the shortened reminder questionnaire)9 and the online questionnaire which remained unchanged over the research.
2.2.1 Survey of children’s social life within and outside of school From the national survey returns, we invited a random selection of schools, drawn from those that had shown a willingness to be further involved in a pupil survey (223 primary schools and 30 secondary schools) and equally from different parts of England, to allow us to approach a sample of students in their school about participating in a survey of their views and experiences of social life within and outside of school.
This survey took the form of a self-completed questionnaire, based on the similar survey undertaken in 2006 but further developed on the basis of pilot work undertaken in phase 1. It focused on children and young people’s views and experiences of break and lunch times, their views on school and lessons, the people they socialise with and the activities/ clubs that they participate in, within and outside of school, as well as what they do immediately after school. We sought their views on their recreational time and eating time during break times as well as how they feel about their relationships with peers and friends.
As with the previous survey, we tried to avoid placing added strains on pupils who were preparing for national testing and exams, and also children younger than 8 years, who can find self-completed questionnaires difficult. In line with the previous survey in 2006, we asked each school contacted to allow a class of pupils in either Year 5 or Years 8 and 10 to be invited to complete the questionnaire. We also set up the questionnaire so that it was available for completion on-line.
A covering letter along with sufficient copies of the pupil paper surveys was sent to schools that had indicated they would be willing to assist with the pupil survey. The pack also included an
9 Schools that responded to the first and reminder letters were similar in terms of main school characteristics, length of the school day, and breaktime variables.
25
information letter to be sent to parents about the research and how they can opt out of the research if they did not want their children to complete the questionnaire. Pupils could choose not to participate in the study by simply not completing and returning the questionnaire. Those schools that indicated they would be willing to complete an online survey were sent an email along with a link to the online version of the survey along with electronic versions of the parent letters.
In all we contacted 30 primary schools and 22 secondary schools10. We received completed responses from 23 primary schools and 14 secondary schools. Based on responses to the school questionnaire relating to numbers of questionnaires to send, we sent approximately 1100 surveys to secondary schools and approximately 1000 surveys to primary schools. The total sample of responses consisted of 1669 children and young people with 978 questionnaires from secondary schools (540 completed by Year 8s and 438 completed by Year 10s) and 691 returned by primary schools.
2.2.2 Case studies In parallel with the survey of pupils’ views and experiences we undertook a small number of case studies. However due to space restrictions and the complexity of the survey findings we do not report on these here, though see Appendix 1 for a summary. Case study findings will be discussed in a separate report available at www.breaktime.org.uk in due course.
2.3 Data entry and cleaning Paper copies of the school and pupil questionnaires were entered into a spread sheet by a group of data entry personnel. A 10% sample of each enterer’s questionnaires was checked for errors and where there were multiple inaccuracies these were corrected and further checks made. Questionnaires completed online also required data handling to ensure consistency across paper and online entry, to remove test data and false starts or half completed surveys and to ensure that variable values were meaningful for the data analysis tool.
2.4 Data analyses Phase 1: Statistical analyses of survey data are principally descriptive and comparative providing a detailed examination of the main topic areas asked about and in relation to phase of education and across school types (academies and free schools, LA maintained schools and independent schools). Given the categorical nature of the survey data, analyses largely involve cross-tabulations and chi-square analyses.
A second layer of analysis involved comparing trends over time across the 3 surveys. As the data sets represent different samples of schools collected at a different time (i.e., they are not repeated measures of the same schools) they were treated as independent samples. Each survey also had some questions that were particular to that survey but there was also a core of questions that overlapped and there was a core set of analyses that was undertaken to make comparisons over 3-4 data points11, for example in relation to the durations of the school day and of breaktimes, the ratios of supervisors
10 A power analysis to identify the sample size for the pupil survey was based on a need to compare the current survey
with the 2006 survey. A key variable ‘frequency that pupils met with peers outside of school’ categorised as either once a week or less, or more frequently than once a week was used. The previous survey suggested that for each of Years 5, 8 and 10, approximately 27% of pupils met friends once a week or less. It was assumed that data from each year group would be analysed separately. A difference of 10% in this figure between surveys is regarded as being of practical difference. It is hypothesised that any change would be an increase in the proportion meeting less than once per week, so a 10% change would see an increase to 37%. With a 5% significance level and 90% power, it was calculated that 456 pupils (per year group) were required from the current survey. 11 The 1995 survey contained some questions about the nature of breaktimes in 1990 – thus providing a fourth reference point for certain analyses.

26
to pupils on the playground, supervisor training, staff perceptions about the nature and quality of the school grounds and the nature of young people’s behaviour within school. For some questions, comparisons could be made with 1990, while for others, comparisons could only be made over 2 data points, for example in relation to adult led clubs during breaktimes and before and after school. These analyses overall provide substantial insights into changes and adjustments in school and playground life over 20 – 25 years12. Phase 2 pupil survey: Analyses were similar to the main survey analysis in that they were largely descriptive and comparative across age groups and gender. We examined these key variables in relation to other measures such as of the nature of breaktimes in school and their enjoyment of breaktimes and school and their views about their relationships with peers and friends. Analyses here were mainly categorical and correlational. A final phase of analysis compared findings for the 2017 pupil survey with those collected in 2006 (pupil data were not collected in 1995/1990) to provide insights into possible changes over the past 10-12 years. As for the school survey, the two data sets were independent samples, with data collected from different schools.
3 Results In this section, first we report on results from the school breaktime questionnaire followed by results from the surveys of pupils and young people in primary and secondary schools. Within each subsection, first data are examined for 2017 generally and then in relation to school type, and second in relation to previous surveys where there is overlap in the question asked and response sets. In order to facilitate cross survey comparisons, and to compare like with like, total figures for 2017 in the tables do not include data from independent schools. This is because only state funded schools, and not independent schools, were surveyed in previous studies.
Information on statistical analyses are included in tables where possible. In order to maintain readability of this report, significant differences between subgroups (e.g. through the use of post-hoc comparison tests) are signalled in the text but details are not provided.
3.1 School breaktime questionnaire
3.1.1 The duration of the school day and the length of break times This section reports the main findings on the length of the school day and the length of breaktimes and in terms of the changes over time and reasons for changes
3.1.1.1 The length of the school day Nearly three quarters of primary schools with pupils at KS1 and/or KS2 start the school day between 8:46 and 9:00 with a further quarter starting between 8:31 and 8:45 (see Table 5). Only 3% of primary schools start school before 8:30 and only 1% start school after 9:00am. Independent schools were slightly more likely than state funded primary schools to have an earlier start with nearly a third starting at 8:30 or before.
12 Comparisons across the three surveys involved comparing results from unadjusted (i.e. unweighted) data sets and excluded 2017 data from independent schools, as equivalent data were not available for these schools in earlier surveys. Analyses undertaken at the time of the previous surveys indicated that data sets were representative of state schools generally.
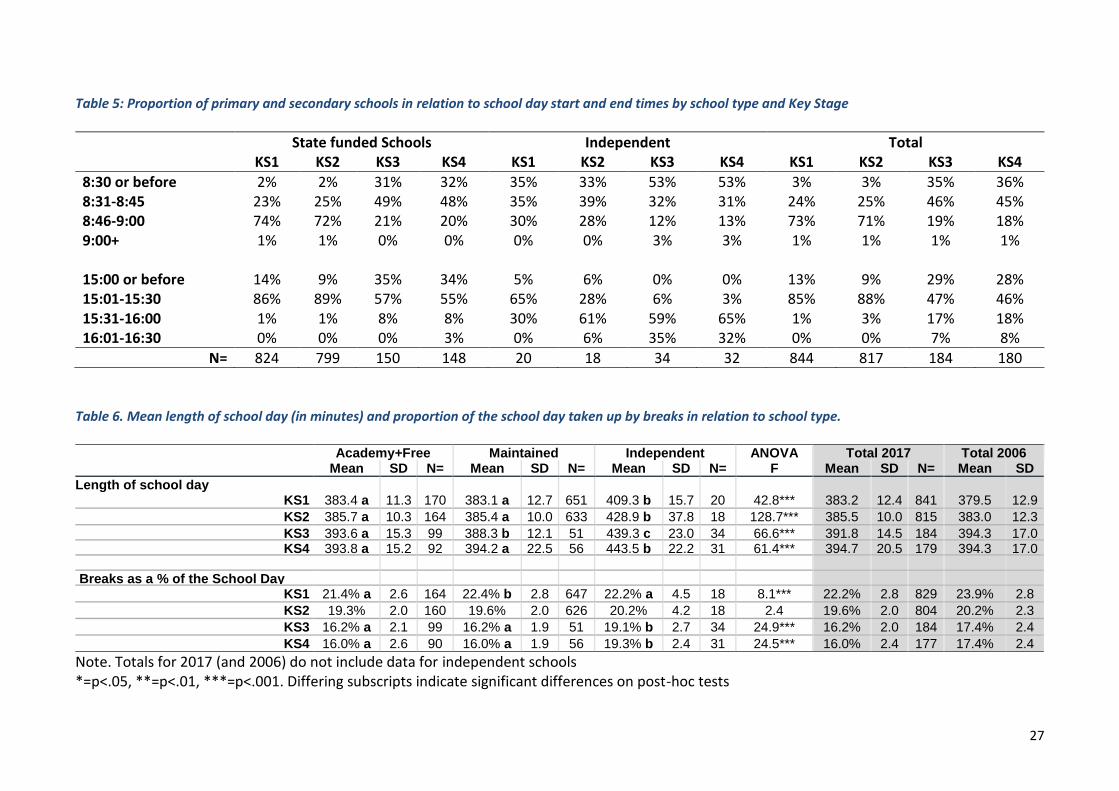
27
Table 5: Proportion of primary and secondary schools in relation to school day start and end times by school type and Key Stage
State funded Schools Independent Total KS1 KS2 KS3 KS4 KS1 KS2 KS3 KS4 KS1 KS2 KS3 KS4
8:30 or before 2% 2% 31% 32% 35% 33% 53% 53% 3% 3% 35% 36% 8:31-8:45 23% 25% 49% 48% 35% 39% 32% 31% 24% 25% 46% 45% 8:46-9:00 74% 72% 21% 20% 30% 28% 12% 13% 73% 71% 19% 18% 9:00+ 1% 1% 0% 0% 0% 0% 3% 3% 1% 1% 1% 1% 15:00 or before 14% 9% 35% 34% 5% 6% 0% 0% 13% 9% 29% 28% 15:01-15:30 86% 89% 57% 55% 65% 28% 6% 3% 85% 88% 47% 46% 15:31-16:00 1% 1% 8% 8% 30% 61% 59% 65% 1% 3% 17% 18% 16:01-16:30 0% 0% 0% 3% 0% 6% 35% 32% 0% 0% 7% 8%
N= 824 799 150 148 20 18 34 32 844 817 184 180
Table 6. Mean length of school day (in minutes) and proportion of the school day taken up by breaks in relation to school type.
Academy+Free Maintained Independent ANOVA Total 2017 Total 2006 Mean SD N= Mean SD N= Mean SD N= F Mean SD N= Mean SD
Length of school day KS1 383.4 a 11.3 170 383.1 a 12.7 651 409.3 b 15.7 20 42.8*** 383.2 12.4 841 379.5 12.9
KS2 385.7 a 10.3 164 385.4 a 10.0 633 428.9 b 37.8 18 128.7*** 385.5 10.0 815 383.0 12.3
KS3 393.6 a 15.3 99 388.3 b 12.1 51 439.3 c 23.0 34 66.6*** 391.8 14.5 184 394.3 17.0 KS4 393.8 a 15.2 92 394.2 a 22.5 56 443.5 b 22.2 31 61.4*** 394.7 20.5 179 394.3 17.0
Breaks as a % of the School Day
KS1 21.4% a 2.6 164 22.4% b 2.8 647 22.2% a 4.5 18 8.1*** 22.2% 2.8 829 23.9% 2.8
KS2 19.3% 2.0 160 19.6% 2.0 626 20.2% 4.2 18 2.4 19.6% 2.0 804 20.2% 2.3
KS3 16.2% a 2.1 99 16.2% a 1.9 51 19.1% b 2.7 34 24.9*** 16.2% 2.0 184 17.4% 2.4
KS4 16.0% a 2.6 90 16.0% a 1.9 56 19.3% b 2.4 31 24.5*** 16.0% 2.4 177 17.4% 2.4
Note. Totals for 2017 (and 2006) do not include data for independent schools *=p<.05, **=p<.01, ***=p<.001. Differing subscripts indicate significant differences on post-hoc tests

28
Table 7. Mean length of breaktimes at Key Stages 1 - 4 across school type
Academy+Free Maintained Independent Total State funded Total ANOVA Mean SD N= Mean SD N= Mean SD N= Mean SD Mean SD N= F
KS1 AM Break 16.0 2.9 168 15.9 2.2 654 21.6 6.0 19 15.9 2.4 16.0 2.7 841 47.62***
KS1 Lunch Break 59.5 6.9 168 62.1 7.2 653 66.6 15.2 19 61.6 7.2 61.7 7.5 840 12.45*** +KS1 PM Break 14.0 2.9 78 13.6 2.7 367 15.0 0.0 3 13.6 2.7 13.7 2.8 448
Total Break KS1 81.9 a 10.6 165 85.6 b 10.4 651 90.8 c 17.6 18 84.8 10.5 85.0 10.7 834 10.79***
KS2 AM Break 16.0 2.7 164 15.9 2.3 637 20.6 5.7 18 15.9 2.4 16.0 2.6 819 30.61***
KS2 Lunch Break 56.7 6.5 164 57.9 6.1 636 63.3 13.3 18 57.6 6.2 57.7 6.5 818 8.96*** +KS2 PM Break 13.4 2.4 22 12.8 3.0 98 22.5 10.6 2 12.9 2.9 13.0 3.3 122
Total Break KS2 74.6 a 8.0 162 75.7 a 8.1 634 86.4 b 16.4 18 75.5 8.1 75.7 8.5 814 16.25***
KS3 AM Break 19.9 3.4 105 19.4 3.7 51 22.4 5.3 34 19.7 3.5 20.2 4.0 190 6.69**
KS3 Lunch Break 44.0 9.6 104 43.5 8.6 51 59.4 9.3 34 43.9 9.2 46.7 11.0 189 39.09*** +KS3 PM Break 17.5 17.7 2 - - 0 29.2 24.4 12 17.5 17.7 27.5 23.3 14
Total Break KS3 63.8 a 9.5 105 62.1 a 11.0 51 92.1 b 20.0 34 63.5 9.2 68.4 16.6 190 76.04***
KS4 AM Break 20.1 3.5 99 19.7 3.8 58 21.9 4.2 32 19.9 3.6 20.2 3.8 189 3.96*
KS4 Lunch Break 43.8 9.5 96 42.5 8.6 58 59.0 9.4 31 43.3 9.2 46.0 10.9 185 37.68*** +KS4 PM Break 17.5 17.7 2 13.3 2.9 3 28.9 23.4 13 15.0 9.4 25.0 21.1 18
Total Break KS4 62.8 a 11.4 99 62.2 a 10.7 58 90.8 b 20.8 32 62.9 10.4 67.4 16.9 189 60.36***
Note: *=p<.05, **=p<.01, ***=p<.001. += average across schools with an afternoon break (i.e. excluding those with 0 minutes) ANOVAs were not conducted for PM breaks due to low numbers.

29
Students in secondary schools start the day earlier than primary aged pupils with 81% of schools with students in KS3 and/or KS4 starting at 8:45 or before. Independent secondary schools were more likely than state funded secondary schools to start at 8:30 or before.
In terms of the end of the school day, pupils in state funded primary and secondary schools were most likely to finish before 15:30, while the majority of independent primary and secondary schools ended the school day after 15:30 for KS2 – KS4 pupils.
The length of the school day (see Table 6) varied slightly by Key Stage and by school type. State funded schools had shorter school days than independent schools at all Key Stages (note that these differences may be offset by longer school holidays for students at independent schools). There was evidence to indicate that at KS3 LA maintained schools had shorter school days than academies and free schools. Older pupils at KS3 and 4 in state funded schools spend on average about 10 minutes more per day in school compared to children in KS1. For independent schools, the difference was approximately 35 minutes extra for the oldest compared to the youngest groupings of pupils.
Comparison of the figures between 2006 and 2017 for state funded schools suggest that the school day has largely stayed the same. In primary schools the day may have been lengthened slightly by 2-4 minutes, while at secondary level the school day at KS4 is the same and KS3 appears slightly shorter on average by about 2 minutes.
3.1.1.2 Ratio of breaktime duration to the school day The total ratio of breaktimes to the length of the school day decreased with pupil age (see Table 6). Breaktimes made up about 22% of the school day at KS1 and 20% at KS2 and 16% at KS3 and 4. The ratio also varied by school type but only at Secondary level. For independent schools the ratio of break times to school day length was similar to state funded schools for KS1 and KS2 pupils but was different at secondary levels making up approximately 19% - 20% of the school day.
The figures for 2017 are lower by about 1 to 2% than the figures for the 2006 survey where as a proportion of the school day breaks made up 24%, 20% and 17% at KS1, KS2 and secondary levels respectively.
3.1.1.3 Length of breaktimes A main question in the survey asked about the lengths and timings of all breaks in the school day. Space was available to identify breaks in the morning, lunchtime and afternoon, as well as to describe alternative arrangements. In the case of lunchtime, although we hoped to separate time for eating and time on the playground, we discovered during pilot work that primary schools do not always have a fixed period of time for eating and thus exact eating time varies, with some children taking large amounts of time to eat while others spending relatively little time in the dining hall. At secondary level pupils have even more autonomy over whether and when they eat.
We look first at the average duration of breaktimes. At KS1 this was 85 minutes, at KS2 it was 76 minutes and at KS3 and KS4 the average duration was 63-64 minutes (see Table 7). Independent schools tended to allow much more time for breaks with total durations of around 90 minutes at KS1, KS3 and KS4. At KS2, this was slightly less at 86 minutes, nevertheless still longer than in state funded schools by about 10 minutes. Academies and free schools tended to have less total amount of time for breaks at KS1 than LA maintained schools and these in turn had shorter breaks than independent schools. This difference was however not found at later Key Stages.
A categorical analysis of the lengths of breaks provides a more detailed picture of breaktime length (see data for 2017 in Table 8). Nearly all schools reported having between 2 and 3 breaks in the school day. Only a few schools had different arrangements.
In terms of the lengths of morning, lunch and afternoon breaks (see Table 8), figures are virtually identical for KS1 and KS2 for morning breaks, but differences are apparent for lunch time
30
and afternoon breaks. The vast majority of primary schools report morning breaks of 15 minutes with a small proportion reporting morning breaks of 20 minutes. Lunch breaks of between 45-60 minutes are the most common at both Key Stages but more schools reported longer KS1 lunchtime breaks of more than an hour than at KS2. By contrast, more schools reported shorter breaks of up to 45 minutes at KS2 than KS1.
Afternoon breaks were also likely to vary across Key Stages. Only 15% of schools reported having an afternoon break at KS2 whereas over half of schools reported that KS1 pupils had an afternoon break. When present, afternoon breaks were most often 15 minutes and sometimes shorter.
At secondary level, patterns were very similar across KS3 and 4. The majority of schools reported morning breaks of around 20 minutes, with just over a fifth of schools reporting morning breaktime lengths of 15 minutes and around 14% of schools reporting morning breaks of 25 minutes or more.
In terms of lunch breaks at secondary school, nearly a quarter of schools allowed 35 minutes or less for lunch break (including time to eat lunch) and slightly more than a quarter had lunches of between 36 and 45 minutes (thus more than half of secondary schools had lunch breaks of 45 minutes or less). Approximately 16% of secondary schools reported lunch breaks of around an hour. Very few state funded secondary schools (1-2%) indicated that they had a break in the afternoon.
The lengths of breaktimes varied to a degree by school type (see Table 7 and Table 61 in Appendix). Independent schools were significantly more likely to report longer morning and lunch breaks than state funded primary and secondary schools at all Key Stages. Only about 10% of independent secondary schools had lunchbreaks of 45 minutes or less and nearly 80% had breaks of 55 minutes or more, with over a third of these reporting lunch breaks of more than an hour. Independent secondary schools were also more likely than state funded schools to report that students had an afternoon break with around 35-40% of independent schools reporting this. There is some question over the nature of these breaks in independent schools and in many cases during lunch breaks or during afternoon breaks pupils were expected to choose from an array of more informally arranged enrichment / or co-curriculum activities that were offered during these times.
3.1.1.4 Associations between the duration of breaktimes, % of pupils who received FSM and school location
Our analyses showed that the total duration of breaktime in the school day is negatively correlated with the percentage of pupils within the school who receive Free School Meals (%FSM) at Key Stages 1, 2 and 3 but not at KS4 (see Table 9). This indicates that schools with higher %FSM – a proxy measure of socio-economic disadvantage (Taylor, 2017) - had less total time for breaks. However, this might be due to a shorter school day rather than the length of break per se, and correlations did also indicate a weak relation between the length of the school day and percentage of pupils that received FSM, at least at KS2 and KS3. In order to clarify this matter, we undertook partial correlations between the %FSM and the total amount of time for breaks, whilst controlling for the length of the school day. Findings show a negative correlation for KS1 and KS2. That is, the higher the proportion of children in school that receive a FSM the shorter the total amount of time a school has for breaks, even when the overall length of the school day is controlled for.

31
Table 8. Differences in the duration of breaks in state funded schools by Key Stage and over time at 1995, 2005 and 2017
KS1 KS2 KS3+4
1995 2006 2017* 1995 2006 2017* 1995 2006 2017*
AM No Break 3% 0% 0% 4% 0% 0% 3% 0% 0%
10 mins 3% 1% 1% 4% 2% 1% 2% 1% 0% 15 mins 78% 83% 82% 79% 84% 81% 44% 40% 22% 20 mins 17% 15% 15% 14% 14% 16% 48% 53% 64%
25 mins + 2% 2% 2% 3% 1% 2% 7% 6% 14% Lunch
Up to 35 mins 2% 1% 0% 2% 1% 0% 5% 9% 24% 36 to 44 mins 1% 0% 1% 2% 0% 1% 5% 13% 28%
45-54 mins 2% 4% 6% 7% 17% 19% 19% 34% 30% 55-64 mins 35% 51% 72% 57% 69% 75% 47% 39% 17% 65-74 mins 16% 15% 10% 14% 8% 4% 16% 5% 1%
75 mins + 44% 29% 12% 17% 4% 2% 7% 0% 0% PM
No break 30% 30% 46% 58% 74% 85% 87% 96% 99% 5 mins 0% 1% 1% 0% 0% 1% 0% 1% 1%
10 mins 17% 21% 15% 13% 11% 6% 4% 2% 0% 15 mins 50% 46% 37% 27% 14% 9% 4% 1% 0% 20 mins 2% 3% 1% 1% 1% 0% 1% 0% 0%
25 mins + 1% 0% 0% 2% 0% 0% 5% 0% 1% *excludes independent schools to ensure fair comparison with previous studies. Red highlight indicates reduction over time, green indicates increase over time

32
Table 9. Correlations between total time for breaks, the length of the school day and the proportion of pupils in receipt of free school meals.
Total Break
time Length
School Day Ratio Partial Correlation Total Breaktime (taking account of
the length of the school day)
%FSM
KS1 -.24** -.06 -.22** -.24**
KS2 -.27** -.10** -.28** -.27**
KS3 -.20* -.21* -.16 -.06
KS4 -.16 -.11 -.11 -.12
Note: **=p<.01, *=p<.05
There were also indications that total amount of break time varied slightly by geographic
region at each Key Stage (see Table 10), though the patterns were not consistent across Key Stages, and subsequent post-hoc tests failed to identify significant differences, except at KS2 where schools in the west appeared to have shorter breaks than schools in the east and the north. Table 10. Average time for breaks at different Key Stages for state funded schools in different sectors of England.
KS1 KS2 KS3 KS4 Region Mean SD N Mean SD N Mean SD N Mean SD N
North 86.3 10.9 222 76.4 ab 9.6 218 62.5 10.2 34 61.7 10.4 34 East 84.7 8.7 160 77.0 a 6.9 153 65.0 8.3 34 64.0 8.2 33 West 83.2 11.5 84 73.1 c 7.3 79 62.5 10.3 20 63.0 9.9 20 London 86.9 11.5 93 75.9 abc 6.8 92 66.4 9.6 25 65.6 13.2 26 South 83.6 10.3 257 74.3 bc 7.8 254 62.0 8.1 43 61.2 10.3 44
Total 84.9 10.5 816 75.5 8.1 796 63.5 9.2 156 62.9 10.4 157
Note: Excludes data for independent schools. Differing subscripts within columns show significant differences on post-hoc tests p<.05
Differences between urban and rural locations were also evident at KS1 and KS2 (see Table 11), with rural schools tending to have slightly more total time devoted to breaks than schools in more urban areas. No differences were found in the total amount of time for breaks in secondary schools according to Urban/Rural location, and this is because of high within group variation. Table 11. Average time for breaks at different Key Stages for state funded schools in rural and urban areas of England.
KS1 KS2 KS3 KS4 Location Mean SD N Mean SD N Mean SD N Mean SD N
Rural 86.7 a 9.7 276 77.1 a 8.2 268 66.6 7.0 22 66.2 7.2 20 Urban 84.0 b 10.8 539 74.6 b 7.9 527 63.0 9.5 134 62.4 10.7 137
Total 84.9 10.5 815 75.4 8.1 795 63.5 9.2 156 62.9 10.4 157
Note: differing subscripts within columns show significant differences on ANOVA tests p<.05

33
3.1.1.5 Summary To summarise this section on the duration of the school day and length of breaktimes, break times continue to be a universal experience in English schools, with most having two breaks and some schools having more.
Most state funded primary and secondary schools have a school day of between 6 and 7 hours, and break times make up 22%, 20% and 16% of the school day at Key Stages 1, and 2 and at secondary level, respectively. This is a reduction on levels in 2006 which were 24%, 20% and 17% respectively. The total amount of time for breaks that students in state funded schools had on average in 2017 is 85 minutes at KS1, 76 minutes at KS2 and 67 minutes for KS3 and 4 combined. Most primary schools had a morning break of 15 minutes and a lunch break of approximately an hour. Over half of primary schools reported having an afternoon break for KS1 pupils but only 15% of schools reported having afternoon breaks for KS2 pupils. Most secondary schools, reported morning breaks of 20 minutes and lunch breaks of up to 45 minutes. Nearly a quarter of secondary schools reported lunchtimes of 35 minutes or less.
Independent schools allow more time for breaks with total durations of approximately 90 minutes for KS1, KS3 and KS4 pupils and with KS2 pupils experiencing on average less time for breaks at 86 mins. While independent schools also report longer school days (of between 6¾ - 7½ hours), breaks make up approximately 19% of the school day at KS2 and KS4, 20% of the school day at KS2 and 22% of the school day at KS1. Although pupils in independent schools have more time for break, the proportion of the school day at primary level is comparable with state funded primary schools. At secondary level breaks make up a greater proportion of the school day compared to state funded schools.
An important finding was that the total amount of time for breaks was negatively related to the percentage of pupils that are in receipt of FSM and that children in rural, as opposed to urban, areas have more total time for breaks. That is, schools with a higher proportion of children from low SES backgrounds on average have less time for breaks and schools in urban areas have shorter breaks.
3.1.2 Changes in total duration of break time between 1995 and 2017 There are marked changes to the total length of breaktime over time. Table 12 shows changes over time in the average durations of breaktime. At KS1, average total time for breaks was 94 minutes in 1995, 91 minutes in 2006 and 85 minutes in 2017. Across the 20-year period, this amounts to an overall decline of 9 minutes per day or a total of 45 minutes less breaktime per week (equivalent to a lunchtime per week).
At KS2 there is a similar decline, but the largest decline appears to have taken place between 1995 and 2006 where total time for break reduced from 83 minutes per day to 77 minutes per day. In 2017, KS2 pupils have an average of 75 minutes per day – this is 8 minutes per day less than in 1995, equivalent to approximately 40 minutes less per week.
The most substantial reductions in the lengths of breaktimes are evident amongst secondary school students. In 1995 students had 76 minutes of breaks in the day. This reduced to 69 minutes in 2006 and in 2017 it is 63 minutes. This is a reduction of 13 minutes per day since 1995 and equivalent to a reduction of 65 minutes per week since 1995 (this is equivalent to losing a whole day’s worth of breaks per week).
Over this period, although there were initially relatively modest cuts to breaktimes between 1995 and 2006 for the youngest children in primary schools compared to those for KS2 and KS3 and 4, by 2017 these reductions are slightly larger than for KS2 pupils. Compared to 1995, children in KS1 now have the equivalent amount of break time that KS2 children had in 1995. Similarly, KS2 children have roughly the equivalent amount of time that students in secondary school had in 1995.

34
Table 12. Average total time for recess (in mins) over the school day in 1995, 2006 and 2017 and changes in duration.
Primary school (5-11 yrs) Secondary school (12-16 yrs) KS1 KS2
1995 94 83 76
2006 91 77 69 Change since 1995
per day -3 -6 -7 per week -15 -30 -35
2017* 85 75 63
Change since 2006 per day -6 -2 -6
per week -30 -10 -30 Change since 1995
per day -9 -8 -13 per week -45 -40 -65
*to provide comparison with earlier data, figures for 2017 exclude data from independent schools.
A more detailed categorical analysis of changes over time in the duration of breaktimes is
shown in Table 8, where the data for 2017, which we have already looked at, are presented alongside results from the 1995 and 2006 surveys. At KS1 and KS2 morning breaks have tended to remain fairly constant with the majority of schools reporting 15 minutes for morning break. However, at KS3 and KS4 there appears to have been a trend to extend the morning breaktime from 15 minutes up to 20 minutes and in a few cases longer.
The most substantive changes have been made to lunch breaks and afternoon breaks where at all Key Stages there is a clear trend for shorter lunch breaks and a decline in the number of schools with afternoon breaks. Figure 1 shows this trend for schools to reduce and then eliminate the afternoon break between 1990 and 2017. As the figure shows, in 1990 90% of primary schools indicated that KS1 pupils had an afternoon break. This had declined to approximately 70% in 1995 but remained stable between 1995 and 2006 but then there has been a further reduction to 54% in 2017. At KS2 there was a substantial decline between 1990 and 1995 from 85% to 42%, a further decline to 26% in 2006 and now in 2017 only 15% of schools report an afternoon break at KS2. Amongst secondary schools, while there was a substantial elimination of afternoon breaks between 1990 and 1995 from 41% to 13%, this has been eroded further to 4% in 2006 and now 1% in 2017.

35
Figure 1. The proportion of state funded schools reporting having an afternoon break at 1990, 1995, 2006 and 2017.
3.1.2.1 Changes made to breaks between 2012 and 2017 and reasons given We can supplement the survey data on breaktimes, reported above, with answers to an open-ended question about any changes made to breaktimes in the last 5 years. This was only asked in the first school survey mailout and thus relates to a sub-sample of 502 schools. Findings show that one in four primary schools (25%) and nearly a third of secondary schools (29%) indicated that they had made changes to breaks. The open-ended responses given were coded to identify the nature of the change made (see Table 13) and the main reason given. We can compare these findings to a response to a similar question asked in 1995 (relative to 1990). Table 13. Nature of Changes made to breaks between 2012 and 2017
Shortened/ abolished
Stayed same
Extended Adjusted Other Total n
2012-17 Primary % 14% 75% 2% 5% 4%
N 54 295 7 21 15 392
Secondary % 20% 71% 3% 5% 2% N 22 78 3 5 2 110
1990 - 95 Infant 29% 66% 4% - 2%
Juniors 43% 53% 3% - 1% Secondary 36% 56% 8% - 0%
Note: 1990-95 and 2012-17 are not directly comparable figures as they were derived differently. Any comparisons should only be tentative
The most substantial change to break times was the shortening or abolition of the PM break and cuts to the length of the lunch break (14% and 20% of primary and secondary schools respectively). About 5% of primary and secondary schools indicated that they had made
0
20
40
60
80
100
KS1 KS2 Secondary
Proportion of schools with an afternoon break between 1990 and 2017
1990 1995 2006 2017

36
adjustments (shortening one break but lengthening another by equal time) and there were a few cases 2%-3% where breaks had been extended. The remaining schools (approximately 73%) indicated that breaks had remained the same. It is possible to compare these findings with data from the 1995 survey. This should only be tentative because the data for the 1995 survey were collected in a slightly different way. The data indicate that there have been fewer attempts in the past 5 years than between 1990-95 to shorten or abolish breaktimes and approximately the same proportion as in 2017 have extended break times.
In terms of the reasons given by senior leaders for altering breaktimes (see Table 14), the shortening or abolition of breaks were primarily for curriculum/teaching time-based reasons. The following are examples of comments made by respondents in answer to this question:
“Afternoon break dropped, no benefits identified, consistency of learning was being impacted”
“Dropped afternoon break to enable extended project time.”
“No afternoon break in KS1 due to curricular pressures”
“Longer morning sessions as children focus better in the morning”
Behavioural management and incidents was another main reason given for shortening
breaks – largely the lunch time break – sometimes this was about reducing the lunch break whilst lengthening the PM break. Some examples of the comments made are as follows:
“Shorter KS2 lunchtime for behaviour management.”
“Shortened lunch by 15 mins - as a result there are significantly reduced issues towards the end of playtime. Behaviour is now consistently good.”
“Shortened lunch from 1 hour to 40 minutes to lessen the opportunity for poor behaviour”
“Shortened lunch and introduced afternoon play to lessen behavioural issues and enable better concentration after lunch”
“Shortened lunch break to 45mins, shortened school day and improved behaviour of kids”
In one instance a change was made and then reversed: “Split lunchbreaks from sept15-
sept16 to reduce incidents on playground. Changed back sept 16”.
In a few cases (15%) the abolition or shortening of the afternoon break was in order for pupils to undertake physical exercise such as the ‘daily mile’ or further PE.
“No afternoon break, however all classes go outside for 10m run around. Walk/Run 1km”
“Infant PM break now includes daily mile so 10m play time, then daily mile 10m”
“No afternoon breaks in KS1 - demands of curriculum - now more structured PE sessions”
Some reports on reductions/ abolition of breaks was to reduce the length of the school day. In the following example from one school, not only was the lunch break shortened but the afternoon break was dropped as well.
“Shorter lunch time has allowed earlier end of day finish time. Afternoon break dropped due to shortened day.”

37
The introduction of universal free school meals has led to changes to the timings of breaks
and lunches but this is largely in terms of increasing the staggering of the lunchtimes (and thus extending the overall lunch time period for staff but not students). A small minority of schools had either shortened, extended or re-balanced the lunch time period to adjust to the new policy.
“Extended by 15 mins (lunch) to give children more time to eat and play”
“Staggered lunchtimes introduced due to KS1 free school meals”
“We have staggered break. Years 3 and 4 have lunch at 11:45-12:30 and the 5s and 4s have lunch at 12:30-13:15. The above lunch times only came into force this week, previous to this everyone had 12:15-13:15 lunch with no afternoon break [now have 45min lunch and 15 min pm break]”
There were a range of other reasons given by senior leaders for abolishing or shortening breaks:
“Lunchtime reduced by 5 mins to allow for lining up”
“Lunchtime shortened by 10m due to staff cover shortage”
“Shortened lunchtime - too long for children to play”
“stopped afternoon break for infants - not necessary”
“Previously KS1 pupils had a longer lunch break (1hr + 30 mins) we felt it was too long for some children so shortened it by 30 mins and extended afternoon play (to 30 mins) [NET CUT 15 mins].”
3.1.2.2 Summary In sum, there have been significant declines in the total amount of time for breaks since 2006 and 1995. Breaks have been shortened since 2006 by on average 30 minutes per week for pupils in KS1 and KS3 and 4. Breaks for KS2 pupils are on average 10 minutes shorter per week since 2006. Over the past 20 years, since 1995, breaks have been shortened by on average 45 minutes per week at KS1, 40 minutes per week at KS2, and 65 minutes per week at KS3 and KS4. Since 1995 and 1990, many secondary schools have abolished afternoon breaks, and primary schools have increasingly abolished afternoon breaks at KS2 and to a lesser degree at KS1. There is an increasing trend for shorter lunchtime breaks at all Key Stages with secondary schools showing most marked change with nearly a quarter of schools having lunchbreaks of 35 minutes or less and more than half having 45 mins or less. Over the same period there has been a slight trend for secondary schools to increase morning breaks from 15 minutes to 20 minutes at KS3 and 4.

38
Table 14. Changes to breaks at primary level and reasons given – content analysis
Reason given
Curriculum, lesson length,
teaching/learning Behaviour/
incidents Meals Physical
Exercise/PE School
day
Pupil numbers/
space Improve
Play Other Unclear N=
Primary N=
Secondary N=
Shortened PM/AM break
33% 3% 15% 10% 5% 10% 25% 35 5 40
Shortened Lunch break
31% 25% 8% 6% 3% 3% 6% 19% 19 17 36
Adjust/balance breaks
17% 8% 25% 25% 8% 17% 8 4 12
Stagger breaks 7% 50% 36% 7% 13 1 14
Extend Lunch break
50% 17% 33% 5 1 6
Extend PM break
100% 2 2 4
Other/Unclear 100% 15 2 17
Total N 26 12 16 6 6 12 3 7 26 97 32 129

39
The principal reasons given by school staff for reducing breaks has been to create more time for learning activities and curriculum coverage and to manage student poor behaviour – much the same reasons given in response to this question on previous surveys.
3.1.3 Nature and use of the school playground, resources and structures In terms of playground space and its use, the majority of primary schools had all pupils sharing the playground space at the same time. In about a quarter of primary schools some groups had their own playground space, usually separated by Key Stage but sometimes in other ways. About 11% of schools fully (i.e. both morning and lunch breaks) staggered their break times.
Amongst secondary schools, two thirds (69%) reported that the space was shared between pupils all at the same time (however this needs to be qualified because data on meal timings suggested that many lunches were staggered, meaning that children would have been on the playground at different times), 5% used the same space at different times, 6% indicated that they had separate outdoor space and 15% indicated that students had their own and shared outdoor spaces.
3.1.3.1 Suitability of school grounds at breaktime and facilities available In the 1995 survey we asked schools: ‘considering your schools’ needs, how suitable are your school grounds for breaktime activities’, and separately, ‘for supervision’. In the 2006 survey we added the question to include ‘for teaching and learning outdoors’. In 2017 we asked all three questions again and results at each of the time points are shown in Table 15 and Table 16. In the latest survey, over 67% of primary schools suggested that the outdoor space was good for these three activities and only 7% or fewer schools indicated that it was poor. There were few statistical differences between types of schools at primary level, although independent schools were slightly more positive about the school grounds for all activities. With the exception of learning outdoors, secondary schools were less positive about the quality of school grounds for breaktime activities and supervision. However independent schools were more positive about the quality of the space for breaktime activities and supervision but not teaching and learning outdoors. Table 15. Quality of space for breaktime activities, supervision and teaching and learning outdoors by primary school type.
Academy+Free Maintained Independent Total ANOVA Mean SD Mean SD Mean SD Mean SD N
Pri
mar
y
For breaktime activities 1.30 .53 1.37 .58 1.11 .32 1.35 .57 902 2.8
For supervision 1.27 .48 1.33 .54 1.16 .38 1.32 .53 901 1.9
For teaching and learning outdoors
1.37 .61 1.42 .63 1.32 .48 1.41 .62 901 .57
Seco
nd
ary For breaktime activities 1.60 .69 1.54 .66 1.27 .52 1.53 .66 195 3.2*
For supervision 1.70 .71 1.65 .72 1.21 .42 1.61 .69 195 6.9**
For teaching and learning outdoors
1.38 .63 1.48 .76 1.42 .71 1.42 .68 193 .37
Note. Responses were on a scale of 1-3 with a lower score indicating a more positive view about the quality of the school grounds.

40
Table 16. Suitability of school grounds for breaktime activities, supervision and teaching and learning outdoors by education phase and over time.
Primary Secondary Good Adequate Poor N Good Adequate Poor N
Breaktime activities – 2017 70% 25% 5% 883 53% 37% 10% 162 Breaktime activities – 2006 48% 42% 10% 1330 27% 36% 36% 228 Breaktime activities – 1995 30% 48% 22% 1263 38% 41% 21% 287 Supervision – 2017 71% 26% 3% 882 46% 40% 14% 162 Supervision – 2006 49% 44% 7% 1325 17% 48% 35% 229 Supervision – 1995 29% 55% 17% 1261 15% 48% 38% 285 Teaching & learning outdoors -
2017 67% 26% 7% 882 69% 21% 11% 160
Teaching & learning outdoors - 2006
51% 38% 12% 1327 41% 40% 19% 228
Table 16 shows changes over time in views on the suitability of the school grounds for breaktime activities, supervision at breaktime and teaching and learning outdoors. Since 1995, views on the suitability of school grounds have changed markedly with far higher proportions of primary school staff indicating that the school grounds are well set up for breaktime activities and supervision and fewer indicating that they are just adequate or are poor. A similar trend is evident for secondary schools. Views with regard to the suitability for the school grounds for teaching and learning outdoors have also improved. Since 2006 the percentage of primary and secondary schools indicating that the school grounds are of good quality for teaching and learning outdoors has increased and fewer schools are suggesting that this is adequate or poor.
We also asked in greater detail about the nature and quality of the school playground and
grounds more generally. The results comparing 2006 with 2017 surveys are presented in Table 17.
Primary schools: Only 2 primary schools reported not having a hard surface playground and the majority of the remainder indicated that this was of good quality. A minority of schools reported not having a designated area for sports (18%); the vast majority did and over 40% reported this to be in good order. Only 8% indicated that they did not have an area of grass and only 2% said they did not have greenery/planting/shrubs. Similarly, only 4% reported not having a gardening area. This is surprising given the number of inner-city schools involved in the research though the lack of specificity in this question might mean it includes fairly small areas of grass or garden pots. The majority (over 53%) of schools also indicated that when present the quality of these areas was good.
Primary schools were less positive about the quality of seating, playground markings, sheltered and quiet areas, with most indicating that these were adequate or good, but with a sizeable portion indicating these were in a poor state. Many schools reported having fixed and portable equipment and most often this was of good or adequate state of repair. However independent schools were least likely to have portable props available and academies were more likely to report these as being in a poor state.
In recent years there have been organisations that provide primary schools packages of play materials, such as loose parts and scrap, usually to stimulate creativity in constructive and imaginary play. Surprisingly, given the wider interest in such packages or collections of play materials, a significant proportion of primary schools (35%) indicated that they did not have such a package.

41
When these were in evidence they were reportedly of poor quality. As often referred to as ‘scrap’ or ‘loose parts’, such resources may inevitably be of lower quality, but this might be a problem if children are prevented from using these materials in their play.
Table 17. Existence and quality of areas and fixed and portable equipment in primary and secondary school grounds
Primary Secondary Absent Good Adequate Poor Absent Good Adequate Poor
Playground (hard) - 2017 0.5% 64% 31% 4% 2% 58% 31% 8%
2006 0 53% 38% 9% 4% 33% 43% 20%
Designated sports areas -2017 18% 41% 26% 11% 14% 63% 18% 1%
2006 29% 28% 27% 11% 7% 44% 34% 12%
Multi Use Games Area - 2017 - - - - 23% 61% 14% 1%
2006 - - - - 21% 30% 29% 16%
Grass area / field - 2017 8% 62% 13% 9% 8% 58% 16% 14%
2006 9% 55% 20% 9% 2% 58% 27% 7%
Greenery, planting - 2017 2% 58% 30% 8% 7% 52% 30% 11%
2006 6% 47% 35% 11% 6% 34% 44% 17%
Gardening/ wildlife - 2017 4% 54% 29% 12% 19% 32% 29% 19%
2006 10% 41% 31% 17% 17% 18% 27% 37%
Benches/ Tables - 2017 3% 41% 44% 13% 4% 42% 38% 17%
2006 7% 35% 40% 18% 8% 17% 43% 32%
Playground markings - 2017 2% 36% 43% 20% 36% 16% 24% 25%
2006 4% 37% 38% 21% 28% 7% 30% 36%
Sheltered area - 2017 7% 29% 37% 28% 20% 13% 25% 42%
2006 21% 15% 22% 43% 24% 7% 10% 59%
Quiet area - 2017 7% 37% 40% 17% 30% 13% 32% 25%
2006 16% 25% 36% 23% 23% 11% 29% 37%
Fixed play equipment – 2017 6% 42% 38% 14% 31% 10% 31% 29%
2006 19% 32% 29% 20% 17% 14% 41% 28%
Portable equipment - 2017 2% 49% 41% 9% 31% 7% 35% 26%
2006 6% 47% 41% 7% 33% 13% 31% 23%
*Package of play materials - 2017 35% 12% 21% 32% - - - -
- - - - - - - -
CCTV in playground - 2017 53% 45% 15% 18% 26% 21% 37% 16% +2006 71% - - - 32% - - -
Notes: Total N= : 2006 survey - 1331 primary school and 230 secondary school responses. 2017 survey – 532 primary school and 87 secondary school responses. *this was a new question asked of primary schools in 2017. +This question was asked differently in 2006 – whether absent, present or planned. Secondary schools: The majority of secondary schools reported the basic playgrounds and designated sports areas and Multi-Use Games Areas (MUGA) to be largely in good condition. School staff were somewhat more negative about other aspects of the school playground. Higher proportions of schools indicated less positive views (than at primary level) of the grass area, greenery and planting and gardening/ wildlife areas. While 19% indicated that they did not have gardening or wildlife areas many schools felt that these were in adequate or poor condition.

42
Secondary school staff, in particular, reported that playground markings, sheltered areas, quiet areas, fixed and portable equipment were either absent or in a poor state of repair. Overall these findings indicate that the quality of breaktime spaces for secondary students are of poor quality or are poorly maintained.
3.1.3.2 Change since 2006 in the quality of playground facilities and equipment Table 17 also shows the comparable figures for the earlier survey in 2006. In 2017 schools are much more positive about the presence and quality of the breaktime resources and provision. Compared to 2006, more primary and secondary schools reported the presence of benches and picnic tables.
Primary schools report more designated sports areas since 2006 and that these were of better quality. However, fewer secondary schools reported the presence of these areas, though those that did have them said they were of good quality. At secondary level, more schools in 2017 reported that their multi-use games areas were of good quality compared to 2006.
At primary level, slightly more schools indicated that their playing field was of better quality but just as many schools indicated they were of poor quality or absent compared to 2006. At secondary level fewer schools reported having a playing field and more (14%) said that they were of poor quality than in 2006 (7%).
Gardening and wildlife areas have increased in number and quality at primary level but fewer secondary schools reported having them, though of those that did, more indicated that they were of a good quality than in 2006.
Quiet areas seem to have reduced in number at secondary level compared to 2006 with fewer schools reporting their presence.
While the presence and quality of fixed playground equipment seems to have improved in primary schools, the reverse seems to be the case at secondary level with fewer schools reporting fixed equipment compared to 2006 (69% vs 83%) and the quality barely having changed.
Portable equipment did not show dramatic changes in quality though did increase slightly in availability at primary level.
Finally, and perhaps unsurprisingly, the presence of CCTV in the school playgrounds has increased by about 6% at secondary school level and 18% at primary school level.
3.1.3.3 Improvement of school grounds Just over half of primary schools (53%) had recently worked with outside agencies to develop their school grounds whereas only 20% of secondary schools reported that they had done so (see Table 18). State funded schools were more likely than independent schools at both primary and secondary levels to have worked with outside providers to improve their school grounds. Figures in 2017 are lower than in 2006 when nearly two thirds (63%) of primary schools and 42% of secondary schools had worked with outside agencies to develop the school grounds.
An examination of the nature of the improvements undertaken suggests that the majority of changes made in primary schools were to fixed equipment like climbing frames and other structures, followed by the introduction or improvement of a garden or quiet area. Security measures were the least likely to see change over time. At secondary level most changes were to ‘other’ things (such as addition of astro-turf, seating, outdoor classrooms and other general improvements) but also garden and sheltered areas seemed to have been where changes were made followed by the improvement of fixed equipment.

43
Table 18. Had schools worked with outside agencies/groups/charities to improve the school grounds and breaktime facilities (Ns affirmative responses are given in brackets)?
Primary
schools Secondary
schools
Worked with outside agencies to improve the school grounds
2017 54% (473) 20% (38)
2006 63% (833) 42% (97)
If yes, what did this involve: Development of school improvement plan prior to
changes 2017 16% 20% 2006 36% 23%
Improvement/introduction of garden, quiet, sheltered areas etc
2017 38% 32% 2006 61% 45%
Decoration of the school playground 2017 21% 3% 2006 38% 7%
Improvement of fixed equipment (e.g. markings, structures, climbing frames)
2017 56% 26% 2006 51% 29%
Improvement of portable equipment (e.g. balls, bats etc.)
2017 20% 5% 2006 39% 11%
Improvement of security measures 2017 12% 13% 2006 17% 29%
Landscaping 2017 24% 10% 2006 37% 32%
Other 2017 21% 37% 2006 11% 21%
Comparison with the results from the 2006 survey indicate quite marked changes in working with outside organisations to develop the outdoor playground space. Primary schools were 10% less likely to work with outside agencies than in 2006. At primary level there has been a reduction in working with outside agencies to develop plans for change, to develop gardens or quiet and sheltered areas, decoration of the playground, improvement of portable equipment and landscaping. The one area that bucked the trend was in terms of improvement of fixed equipment which was slightly higher than in 2006.
Secondary schools were half as likely to work with outside agencies in 2017 as in 2006. This reduction was evident in areas of potential development of the school grounds. The ‘other’ category which saw an increase related to provision of benches/furniture and of sports equipment (e.g. astro-turf, outdoor gym, table tennis).
3.1.3.4 Summary Overall in relation to the nature and use of playground resources and structures and associated improvements, findings showed that schools were very positive about the suitability of the school grounds for breaktime activities, supervision and learning outdoors and more so than for previous surveys. Primary schools were largely positive about the nature and repair of a wide range of areas, structures and resources available in the outdoor areas used for breaks. Secondary schools were

44
also positive about the basic provision but were more negative about areas of grass and greenery, markings, sheltered and quiet areas on the playground. Although the presence and quality of fixed equipment and the availability of portable resources has improved in primary schools the reverse appears evident in secondary schools.
There has been a marked increase in the presence of CCTV in school playgrounds with nearly half of primary and three quarters of secondary schools now reporting having CCTV in their playground spaces.
Over half of primary schools and nearly a fifth of secondary schools had worked with outside agencies to improve the school grounds. However, this was a decline on figures for 2006 – that is, fewer schools are working with outside agencies to develop their school groups. Where improvements had taken place, primary schools had largely worked to install and improve fixed equipment, whereas secondary schools had improved areas and facilities such as astro-turf and seating.
3.1.4 Supervision at breaktime Schools were asked how many staff are usually on breaktime supervision duty whether inside the school or on the school grounds and excluding catering staff. Responses allowed separation of teachers, other school staff (i.e., all staff employed by the school other than teaching staff, and would include Mid-day assistants, playground supervisors, Teaching Assistants), and a separate category for pupils (e.g. prefects, playground buddies13) and other adults. We asked them to record supervision arrangements for morning break and lunchbreak. We also asked about afternoon break but given its rarity, as we have seen, results are not presented here. Results for the average number of supervising staff in relation to school type in 2017 are presented in Table 19 and Table 20 and averages and ratios of pupils to staff for the 2017 survey and previous surveys in 1995 and 2006 are shown in Table 21 and Table 22.
We deal first with results from the latest survey in 2017. At primary level (see Table 19), support staff are the main supervisors at break and lunch times overall. Teaching staff were more likely to be involved in supervision during morning and afternoon breaks and support staff were more likely to be supervising at lunchtimes. This was the case for both academies/free schools and maintained schools and the levels were very similar. However, independent schools were far more likely to have more teaching staff supervising at all breaks than support staff and this was statistically significant at lunchtimes at primary level. Having pupils involved in supervision was a characteristic of academies and free schools and this was particularly apparent for the afternoon break. Nevertheless, pupils with supervisory responsibilities were most likely to be involved in this role during lunch breaks. It is also notable that there was marked variation across schools in the numbers of pupils with supervisory responsibilities. While some schools reported substantial use and numbers of pupils taking on these roles, others did not involve pupils in the supervisory process at breaktime at all.
The picture is somewhat different at secondary level (see Table 19) with supervisors being more likely to be teaching staff than support staff for both morning and lunch breaks. There was a slight increase in numbers of support staff supervising (and a corresponding decrease in teachers supervising) at lunch breaks, though only in state funded schools. Although Academies and free schools were slightly more likely to have pupils involved in supervision this was not statistically significant.
13 A wide range of terms are used in schools to give children adult sanctioned responsibilities on the playground. It is acknowledged that ‘playground buddies’ and ‘monitors’ are less likely to have a formal ‘supervisory’ role compared to ‘prefects’ nevertheless are included in figures relating to pupils with playground responsibilities.

45
In relation to the patterns across the different surveys (see Table 21 and Table 22), a distinct change over time is evident. The mean numbers of staff supervising breaktimes have increased markedly since 1995 and 2006 at both primary and secondary levels. At primary level, the numbers of supervisors that are support staff have increased and they are now, in 2017, the main adults involved in supervision at both morning and lunch breaks. In 2006 and 1995 teachers outnumbered support staff as supervisors during morning breaks, though not lunch breaks. However, this is not the case in independent primary schools where teachers remain the principle persons supervising at breaks. At secondary level, the average numbers of supervisors that are teachers has nearly doubled compared to 2006 figures and they are far more likely to supervise break and lunchtimes than support staff. The ratios of students to staff supervisors (i.e. the combination of teaching and support staff) at both primary and secondary levels have also increased with far more supervisors to pupils than was the case in 2006 and 1995. This is particularly evident at morning break times but less so at lunchtimes at primary level where ratios have been consistent. At secondary level, the average numbers of staff supervising and the overall ratios of students to staff have changed markedly since 2006 and 1995 with the numbers of staff to pupils substantially higher than they were in 2006.
3.1.4.1 The nature of supervision at breaktimes We also asked about the nature of supervision. As seen in Table 23 in just over half of primary schools, staff supervise at a distance and allow pupils the freedom to undertake activities of their own choosing. In over a quarter of primary schools, informal activities are organised by adults and in nearly 15% of schools, staff are required to organise activities and games for pupils to choose if they wish. Only eight schools (2%) organised what might be described as structured breaktimes where staff set up activities and where children must choose from the options available. There were no differences by school type.
At secondary level, by far the most dominant form of supervision was ‘supervision at a distance’, while in a few schools, staff either voluntarily (n=6) or were ‘required’ or paid additionally (n=2) to put on clubs/ activities for students to participate in at lunchtime.

46
Table 19. Mean number of staff/pupil supervisors at each breaktime in relation to primary school type
Academy+Free Maintained Independent Total ANOVA Mean SD N Mean SD N Mean SD N Mean SD N
AM break Teaching Staff 2.6 2.2 174 2.5 2.2 669 3.7 4.7 19 2.5 2.3 862 as
Support Staff 3.0 3.2 174 3.0 4.0 671 2.5 3.0 18 3.0 3.9 863
Pupils (prefects etc) 2.2 8.1 175 1.3 3.6 680 1.7 4.6 19 1.5 4.9 874 as
Other Adults 0.0 0.3 176 0.1 1.1 687 0.0 0.0 19 0.1 1.0 882
Lunch break
Teaching Staff 1.2 2.3 180 1.0 1.5 677 3.9 4.7 19 1.1 1.9 876 ***
Support Staff 7.8 5.3 178 7.8 5.3 671 2.6 3.0 18 7.7 5.3 867 ***
Pupils (prefects etc) 3.3 6.1 179 2.8 5.1 679 1.6 4.6 19 2.9 5.3 877
Other Adults 0.1 0.4 181 0.2 1.3 688 0.0 0.0 19 0.1 1.1 888
PM break
Teaching Staff 1.9 1.9 75 2.0 2.0 347 1.8 0.4 5 2.0 1.9 427
Support Staff 1.5 1.4 75 1.6 2.1 347 0.3 0.5 4 1.6 2.0 426
Pupils (prefects etc) 2.5 10.5 76 0.6 2.7 353 0.8 1.8 5 0.9 5.0 434 **
Other Adults 0.0 0.3 76 0.0 0.4 356 0.0 0.0 5 0.0 0.4 437
Note: as = p<.08; * = p<.05; **=P<.01; ***= p<0.001
Table 20. Mean number of staff/pupil supervisors at each breaktime in relation to Secondary school type
School Type Academy+Free Maintained Independent Total ANOVA
Mean SD N Mean SD N Mean SD N Mean SD N
AM break Teaching Staff 14.1 6.9 92 13.3 11.4 55 4.1 4.0 33 12.0 9.0 180 ***
Support Staff 2.4 3.9 95 3.0 4.3 55 .9 1.5 34 2.3 3.8 184 *
Pupils (prefects etc) 4.9 14.1 97 3.0 6.0 55 2.5 4.3 35 3.9 10.8 187
Other Adults .0 .0 97 .05 .3 55 .2 1.0 35 .1 .5 187
Lunch break
Teaching Staff 10.2 7.3 93 11.05 11.3 56 6.0 4.9 33 9.7 8.5 182 *
Support Staff 4.5 5.0 95 5.95 5.3 56 1.3 1.8 34 4.4 4.9 185 ***
Pupils (prefects etc) 5.3 13.7 95 4.93 10.1 56 3.7 5.5 35 4.9 11.5 186
Other Adults .0 .0 99 .0 .1 56 .3 1.7 35 .1 .7 190
Note: as = P<.08; * = p<.05; **=P<.01; ***= p<0.001

47
Table 21. Mean number of staff/pupil supervisors and ratio of supervisors to pupils relative to Primary school roll (AM and lunch break only)
1995 2006 2017 2017 State funded Total State funded Independent+
Mean Ratio Mean Ratio Mean Ratio Mean Ratio Overall Mean
Overall Ratio
Morning break Teaching staff 2.1 122 1.9 116 2.5 109 3.7 60 2.5 107 Support staff 1.1 156 1.6 119 3.0 92 2.5 61 3.0 92 Pupils on duty - - 2.0 50 1.5 52 1.7 54 1.5 52 Total ratio 86 67 52 34 51
Lunch break Teaching staff 1.1 179 0.7 177 1.0 177 3.9 54 1.1 171 Support staff 5.9 38 6.2 35 7.8 32 2.6 57 7.7 33 Pupils on duty - - 3.0 46 2.9 48 1.6 66 2.9 48 Total ratio 33 33 29 29 29
Note: Ratio of staff on the playground to FTE of pupils in school was calculated by dividing the number of teachers and supervisors on breaktime supervision duty by the total pupils on roll (FTE). We used the number of pupils as reported by schools in 1995, 2006 and 2017 surveys, rather than PLASC/Edubase data which we found had a number of incongruences. Data presented here are a relatively general statistic in that they do not take account of situations in which not all pupils were on the playground at once, (e.g. staggered breaks or more than one playground). The figures may not reflect the actual ratios on the playground at any given moment. However, only a few schools stagger their lunch breaks and thus the figures for the lunch time break are likely to be reliable. In some cases 1995 figures vary from those published previously. This is because errors were found in the original data which have now been corrected. + because of the low numbers of independent schools, unweighted data vary when compared to weighted data (e.g. by geographical location) and thus it is unclear how representative these figures are of independent schools generally.

48
Table 22. Mean number of staff/pupil supervisors and ratio to Secondary school roll (AM and lunch break only)
1995 2006 2017 2017
State funded State funded Independent+
Mean Ratio Mean Ratio Mean Ratio Mean Ratio Overall Mean
Overall Ratio
Morning break Teaching staff 8.7 104 7.0 111 13.8 78 4.1 103 12.0 82.1 Support staff 0.5 337 1.2 354 2.6 242 0.9 184 2.3 233.5 Pupils on duty 5.0 93 3.9 113 4.2 97 2.5 85 3.9 93.9 Total ratio 97 92 54 69 56.7
Lunch break Teaching staff 4.8 231 5.9 234 10.5 135 6.0 68 9.7 124.0 Support staff 4.8 186 5.4 216 5.1 209 1.3 177 4.4 204.5 Pupils on duty 4.1 98 4.5 132 5.2 118 3.7 95 4.9 112.4 Total ratio 91 99 57 42 54.6
Note: Ratio of staff on the playground to FTE of pupils in school was calculated by dividing the number of teachers and supervisors on breaktime supervision duty by the total pupils on roll (FTE). We used the number of pupils as reported by schools in the 1995, 2006 and 2017 surveys, rather than PLASC/Edubase data which we found had a number of incongruences. Data presented here are a relatively general statistic in that they do not take account of situations in which not all pupils were on the playground at once, (e.g. staggered breaks or more than one playground). The figures may not reflect the actual ratios on the playground at any given moment. However, only a few schools stagger their lunch breaks and thus the figures for the lunch time break are likely to be reliable. In some cases 1995 figures vary from those published previously. This is because errors were found in the original data which have now been corrected. + because of the low numbers of independent schools, unweighted data vary when compared to weighted data (e.g. by geographical location) and thus it is unclear how representative these figures are of independent schools generally.

49
Table 23. Nature of supervision and adult involvement in activities during breaktimes
Primary Secondary % N % N
1. Supervise at a distance and pupils engage in self-chosen activities
53% 267 91% 79
2. Informal activities arranged and pupils choose to participate or not
28% 140 7% 6
3. Formally organised activities and pupils choose to participate or not
15% 76 2% 2
4. Supervisors required to organise activities + pupils must choose activity to participate in
2% 8 - -
5. Other 4% 18 - -
Note. At Secondary level only, options 1,2 and 5 were given and open-ended answers were reclassified to fit the above categories.
3.1.4.2 Training and support for supervisory staff We asked about the nature of training and support that breaktime staff receive in relation to breaktime supervision. As many schools ticked more than a single option, a multiple response analysis was conducted. This showed that for primary schools, regular meetings held with the head or with senior staff was the most frequent arrangement, followed by discussion as and when or discussions of the job description (see Table 24). Only 3% of primary schools indicated that no training was offered. In 40% of cases training/ support had been received by an outside agency and 15% reported training by the LA (50% of primary schools reported receiving training from the LA or an outside agency or both).
Secondary schools were much less likely than primary schools to provide formal training for supervisory staff and only 6% of schools reported training provided by the LA or a private company. The main approach to training of supervisors in secondary schools was largely informal through discussions as and when or through a discussion of the job description.
The equivalent figures for the earlier survey in 2006 are also shown in Table 24. The figures for primary schools are very consistent over time with the main approach to training and support of supervisors involving regular meetings. However, there was an increase since 2006 in the number of secondary schools reporting that they did not train supervisors and a decline of training provided by LAs, a slight increase in training by private agencies and a reduction in discussion about job description. The main change in secondary schools appears to be a reduction in regular meetings with breaktime supervisors.
3.1.4.3 Meetings with supervisors to discuss issues at breaktimes In order to get a clear idea about the support and engagement of senior staff with breaktime supervisors we asked if breaktime supervisory staff met with senior staff to discuss breaktime management and if so whether it was through discussion as and when required, through termly or occasional meetings with head/teaching staff, or through half termly (or more frequent) meetings with head or teaching staff.

50
Table 24. Training and support (in relation to supervision) received by supervisory staff.
Primary Secondary 2006 2017 2006 2017 % N % N % N % N
No training for supervisory staff 2% 32 3% 16 9% 20 18% 15 Regular meetings 64% 850 60% 302 32% 73 22% 19 Discussion as and when 60% 800 54% 275 58% 134 58% 50 Training by LEA 45% 592 15% 78 16% 36 1% 1 Training by private agency 36% 481 40% 202 8% 18 5% 4 Discussion of job description 63% 840 42% 210 45% 103 43% 37 Other 9% 112 6% 28 13% 30 6% 5
Note. Percentages and totals are based on the number of respondents and not the number of responses.
In terms of supervision, 94% of primary schools and 75% of secondary schools indicated that supervisory staff would meet with senior staff to discuss supervision (see Table 25). These meetings were most likely on an informal ‘as and when’ basis, particularly at secondary level, although half termly or termly meetings were also likely to take place at primary level. The nature of meetings with breaktime supervisors did not vary significantly across school type but as can be seen in Table 25, and consistent with the approach to training, at secondary level informal meetings were far more likely. The likelihood of informal support arrangements has increased since 2006 with nearly 50% of primary schools and three quarters of secondary schools reporting that this was the principle approach to supporting supervisory staff. Table 25: Frequency and degree of formality of meetings between supervisory staff and senior staff.
Primary Secondary 2006 2017 2006 2017 % N % N % N % N
Discussion as and when 37% 466 47% 229 64% 125 73% 46 Termly meetings 28% 354 16% 75 15% 29 13% 8 Half termly meetings 31% 387 26% 128 12% 23 11% 7 Other 5% 58 11% 53 9% 17 3% 2 Total 1265 485 194 63
Note. Percentages and totals are based on the number of respondents and not the number of responses.
3.1.4.4 Summary Overall key findings in relation to the supervision of breaktimes showed that support staff were most likely to be involved in playground supervision for all breaks at primary level. Teachers were also involved in supervision, though less likely during lunch time breaks. At secondary level and amongst primary independent schools, teachers were the most likely adults to be supervising breaks.

51
Since 2006 and 1995 the numbers of support staff as supervisors in primary schools have further increased and they now outnumber teachers as supervisors for morning breaks and lunch breaks. But in secondary schools the number of teacher supervisors has increased markedly. There has been a distinct increase since 1995 and 2006 in the average numbers of supervisors on primary and secondary playgrounds such that there are now fewer pupils to staff than in previous surveys. School breaktimes are thus now more supervised than they have ever been in the past. Supervision of secondary school breaktimes largely involves supervision at a distance. However, at primary level many supervisors informally or formally arrange activities for children to participate in if they wish. Fully structured breaktimes are not substantially in evidence in English primary schools. The main approach to the training and support of supervisors in primary and secondary schools was through discussions as and when required, discussions of job descriptions and through regular meetings. However regular meetings were less likely in secondary schools than primary schools and there was a trend since previous surveys for meetings with breaktime supervisors to be even more informally arranged. The level of formal training of breaktime supervisors has declined, particularly in secondary schools.
3.1.5 Pupils’ freedoms during breaktimes and reasons for missing breaktimes
3.1.5.1 Do pupils have to leave the school building for breaktimes? We were interested in the schools’ policies on whether pupils were expected to leave the school buildings. We asked schools to choose which of the following applied in their schools (excluding arrangements during inclement weather): 1. pupils were normally expected to stay out of the school buildings, 2. pupils were allowed access to specific indoor areas (not just toilets), or 3. pupils were allowed access to most areas indoors including classrooms. Results are shown in Table 26.
During good weather most primary schools had a policy that children should stay out of the school and not be allowed access to indoor areas (see Table 26). This was especially the case for the morning break. In about a quarter of schools, children were allowed access to specific indoor spaces during the morning break (e.g., library, cloak rooms etc.). Access to indoor spaces were more likely during the longer lunch breaks with 39% of primary schools reporting that children could come in during these times. These arrangements did not vary substantially by school type despite a slight trend for academies to be less likely to allow pupils in to the school. Table 26. Percentage of schools with different rules governing access to the school at break time
Must stay out Access to specific indoor areas
Access to most areas of school
Break 1995 2006 2017 1995 2006 2017 1995 2006 2017
Primary AM 82% 73% 73% 14% 25% 25% 4% 3% 2% Lunch 72% 59% 59% 24% 39% 39% 4% 3% 2% PM 83% 77% - 11% 20% - 4% 3% -
Secondary AM 18% 19% 14% 46% 59% 71% 35% 22% 15% Lunch 14% 13% 14% 50% 66% 70% 35% 21% 16% PM 19% 29% - 36% 43% - 45% 29% -
Note. Total N for the different surveys for primary and secondary schools are approximately: 1995 N= 1267 (primary), 288 (secondary); 2006 N = 1318 (primary), 229 (secondary); 2017 N= 487 (primary), 85 (secondary).

52
At secondary level a different pattern is evident with the vast majority of secondary schools (86%) not requiring students to stay out on the playground and allowing students access to either specific indoor areas (71%) or most areas of the school (15%) during break and lunch times.
Since 2006 the pattern in primary schools has remained the same with identical proportions being required to stay out or allowed in. In the first survey in 1995, there was a slight tendency for even more children at primary level to be expected to stay out on the playground. At secondary level the patterns in the data are relatively similar although there has been a trend over time to increasingly allow students access to specific indoor areas of the school.
3.1.5.2 Access to areas of the school and playground during wet breaktimes We also asked a similar question about arrangements for those times when the weather is poor - so called ‘wet’ breaktimes. As was the case in 2006, we asked which of the following applied in their school during poor weather (excluding times when pupils were eating their lunch): 1. Pupils must stay in classrooms; 2. pupils must stay in the hall or other large room (e.g., gym, dinner hall); or 3. pupils are allowed to go to a number of rooms in the school (e.g., hall, library, classrooms, computer labs etc). But we also wanted to understand whether schools continued to allow students to go outside and on playing fields during ‘wet’ breaks. We therefore introduced two further categories: 4. ‘Pupils are allowed out but not on to grassy areas’ and 5. ‘Pupils are allowed out and on grassy areas’.
During wet weather, as can be seen in Table 27, for the most part primary school pupils were required to stay in their classrooms or in a hall over the break time or lunch time periods (77% and 69% for AM and lunchtime breaks respectively). In just over 11-13% of schools, pupils were still allowed outside during morning and lunch-time breaks and nearly one in five were allowed in most areas of the school during wet lunch breaks. Patterns of freedom of movement around the school are relatively similar in 2017 compared to 2006 (see Table 27).
Unlike primary schools, secondary schools were much less likely to report that students were restricted to classrooms or halls during wet breaks. Interestingly, over a quarter of secondary schools reported that students were allowed access to most areas of the school and in over 50% of cases students were still allowed outside the school buildings (though often there were constraints about not walking on grass/playing fields) during wet weather. Table 27. Percentage of schools with different rules governing access to the school at break time and freedom of movement outside during wet breaks
Must stay in classes
Must stay in hall
Access to most areas of
school
Pupils are allowed out but not on
grassy areas
Pupils are allowed out
and on grassy areas’
Break 2006 2017 2006 2017 2006 2017 2006 2017 2006 2017
Primary AM 78% 69% 10% 8% 11% 11% - 9% - 2% Lunch 65% 63% 12% 6% 21% 18% - 10% - 3% PM 82% - 7% - 10% - - - - -
Secondary AM - 5% - 12% - 27% - 42% - 14% Lunch - 2% - 13% - 26% - 43% - 16%
Note. Data were not collected on this issue in 1995 and not in secondary schools in 2006 nor for afternoon breaks in primary or secondary schools in 2017. In 2006 N= 1314 (primary); 2017 N= 489 (primary), 85 (secondary).

53
3.1.5.3 Are students allowed off school premises? The secondary school survey, as in our previous surveys, asked questions about whether students are allowed off the school site during lunch breaks (e.g. to go to shops, home etc.). As can be seen in Table 28, there have been very marked changes since the previous two surveys. We now find that most schools (86%) say that students are now not allowed off site (this was just 38% in 2006 and only 27% in 1995) and there has been a parallel significant decline in allowing students off site or allowing students off site with parental permission. Table 28. Whether students are allowed off school premises at lunchtime (%) – secondary schools only
1995 2006 2017
All pupils allowed off premises (Year 7+) 4% 3% 1% Year 8/9/10+ 11% 10% 3% Year 11 only 12% 10% 3% With parents’ permission 42% 36% 6% Not allowed off premises 27% 38% 86% Other 6% 5% 2%+
N= 287 230 158 Note: +For the ‘other’ category these were only selected persons, i.e. Y11 prefects or Y11s with parental permission.
3.1.5.4 Children missing a full break/ lunch time and reasons for this A further question new to the 2017 breaktime survey asked about times when children were prevented from having a break time. The question was very specific about those times when children miss a FULL breaktime or lunchtime rather than the first 5-10 minutes as this might depend on individual teacher practices and lateness. Findings indicate (see Table 29) that in 64% of primary schools, pupils might be prevented from having a break, and this was slightly less likely to happen in independent schools (44%) compared to state funded schools (p<.05). Many primary schools said that withholding breaks was part of their formal behaviour policy. Table 29. Times when pupils might miss a full break or lunch time
Do students miss a full break or lunch time? Primary Secondary
No 36% 43% Yes 64% 57%
If they misbehave in class (e.g. detention) 49% 51% If they misbehave during break or lunch
time 45% 41%
To catch up with class/home work 23% 29% To attend sports competitions 18% 35%
To attend paid classes (music lessons) 10% 12% To attend adult-led activities (e.g. lunch
clubs) 12% 20%
Other 1% 7% N= 923 85
Note: Percentages and totals are based on respondents.

54
In the vast majority of cases where primary schools said children might miss a full break, this was most likely to be due to the child misbehaving either in class or during breaktime. In fact, nearly half of all primary schools indicated this. In over a fifth of primary schools (23%) children could miss a full break or lunchtime in order to catch up with their class-work/ homework.
More than half of secondary schools (57%) indicated that there were times when students may be prevented from taking a full break or lunch time (see Table 29). It is notable that this figure is lower than that for primary schools. Again, the majority of secondary schools reported that students might miss a full break or lunchtime because of poor behaviour in class (51%) or at break time (41%). Nearly 30% also indicated that students would be prevented from taking a break to finish off homework. Secondary schools were more likely than primary schools to indicate that students would miss a break to attend sports competitions or adult led clubs.
3.1.5.5 Summary To summarise this section on freedoms and rules at breaktimes; in primary schools, children were largely required to stay out of buildings, though there was some access to specific indoor areas like a library and this had changed little since 2006. For secondary schools, pupils were allowed access to specific indoor areas during breaks and this had increased since 2006 and 1995, while access to most areas of the school had declined. During wet breaks most primary schools had a policy of children staying in their classes with very few schools allowing children outside. At secondary level arrangements for wet break were different with students having access to most areas of the school and a large minority of schools still allowing students out during wet weather, though not onto grassy areas. Though there had been some relaxation of freedom of movement within secondary school during breaks, there was a marked reduction in the proportion of schools that allow students off the premises during lunch breaks. This freedom has now been almost entirely abolished even when parents have consented to this. In 1995 approx. 67% of secondary schools allowed students off site during lunch breaks, often only with parental permission, the figure now is 12%. A key finding was that 60% of primary and secondary schools reported that children might miss a full break or lunch time and the main reasons for this were to do with the management of misbehaviour or to help pupils catch up with homework and classwork. Many schools indicated that this was part of their formal school behaviour policy.
3.1.6 Organised, teacher led activities during breaktimes and after school A number of questions on the survey aimed to find out more about adult led activities that take place during breaktimes and after school and to find out who provides the after-school activities. When asked about adult-led, organised activities that take place during lunchtimes, approximately 85% of primary schools indicated that these took place. There were no significant differences across school type (see Table 30). Most frequently offered types of clubs during lunch times were team sports (60%), musical clubs (49%) and clubs offering generic activities (41%). Curriculum support activities were also often on offer with 32% of schools indicating that these took place at lunchtimes. At secondary level, 89% of schools indicated that they organised activities for students to participate in during lunchtimes. The figure did not vary by school type. However, when it comes to the types of activities/clubs on offer there were some interesting findings. Most frequently mentioned was music (82%) followed by team sports clubs (72%) and then curriculum support activities such as homework club or exam preparation (64%) and computing/coding (62%). There were also differences between different types of schools with independent schools offering a variety of clubs and LA maintained schools offering fewer clubs. Independent schools were more likely to

55
offer music (97%), curriculum support (81%), language clubs (63%), art (69%), science (63%) and competitive board games like chess (66%), than state funded schools. An interesting difference was that curriculum support was more likely to be offered in independent schools (81%) and least likely in LA maintained schools (56%).
As is evident in Table 30, there has been a slight increase by 2-3% on the provision of school clubs during lunchtimes since 2006. The provision of some clubs has remained largely stable, these are: music, language classes, science clubs and other clubs. Interestingly there has been a decline in some clubs, such as: computing/IT, drama/dance and competitive board games, and there has been an increase in art and design. Notably, curriculum support has increased markedly (from 11.7% to 31.6%) in provision at primary level but has decreased at secondary level (from 74.5% to 64.2% - though see after school clubs below). Unfortunately, from these data it is difficult to get a sense of the number of clubs going on at any one time. It might be the case that certain activities are offered all year round whilst others are offered only at certain times in the year and maybe only to certain pupils. Table 30. Breaktime activities organised by the school by school phase and over time
Primary Secondary 2006 2017 2006 2017 School organises activities for pupils at breaktimes 82% 85% 87% 89%
Total N 1328 879 230 163
Generic school club - 41% - 56% Music (choir, orchestra, band) 49% 49% 83% 82% Team sports 39% 60% 81% 72% Individual sports - 16% - 39% Language classes 14% 10% 30% 27% Computing/IT 30% 24% 82% 63% Drama/dance 18% 14% 57% 52% Gardening/nature 22% - 13% - Art/design/crafts/cookery 19% 25% 48% 51% Science clubs 4% 6% 38% 44% Curriculum support (eg Homework) 12% 32% 75% 64% Competitive games (eg chess, cards) 27% 22% 53% 44% New playground games/ activities 54% - 0% - Other 24% 26% 27% 25%
Note: Percentages are based on the number of respondents We followed this with a question about whether any adult organized activities were available for pupils before or after school (e.g., after school clubs). Nearly all primary and secondary schools reported that they did (see Table 31). Independent schools were slightly less likely to offer activities outside of school (82%) – though this estimate was based on small numbers.
Outside of school hours, 78% of primary schools and 64% of secondary schools indicated that they offered a breakfast club. This has been a growing area (the 2006 survey did not even ask about breakfast clubs at secondary schools) and there has been a marked increase in the provision of breakfasts.

56
Table 31. After school activities organised by the school
Primary Secondary 2006 2017 2006 2017
School organises activities for pupils after school 97% 98% 100% 94% Total N 1330 495 230 85
Breakfast club 42% 78% - 64% Generic after school club - 51% - 45% Music (choir, orchestra) 52% 52% 87% 81% Team sports 86% 84% 94% 90% Individual sports - 37% - 56% Language classes 27% 18% 38% 33% Computing/IT/coding 37% 34% 75% 51% Drama/dance 54% 58% 80% 65% Gardening/nature 27% - 13% - Art/design/crafts/cookery 53% 60% 59% 69% Science clubs 13% 27% 46% 59% Curriculum Support (eg homework) 26% 53% 82% 87% Competitive board games (eg chess club) 23% 24% 38% 32% Childcare 35%* 27% - - Martial arts (e.g., Karate, Judo, etc.) - - 15% 9% Other 27% 11% 27% 22%
Note: Percentages are based on respondents. * previously this was asked as part of another question. At primary level and in terms of more activity focused clubs after school, team sports were most likely on offer (84%) followed by clubs for art (60%) and drama (58%) followed by curriculum support opportunities (53%) and then music (52%) and generic school club (51%). The response ‘generic school club’ was introduced after the previous survey because there had been an indication supported by pilot work for the current survey that smaller schools tended to run an after-school club which undertook a wide range of activities which varied week by week14. The prevalence of these clubs is higher than expected, particularly amongst secondary schools – though it is unclear why. Language clubs/classes were least likely to be on offer. Secondary schools also provided a broad range of adult led after school activities with the most frequently offered being team sports (90%), curriculum/homework support (87%), music (81%), art and design (69%) followed by drama/dance (65%) and science (59%). In relation to the 2006 survey data, there are some remarkable similarities whilst also some changes. Proportions of schools offering music, team sports and competitive board games are largely similar. Language classes and computing and IT/coding have reduced in popularity, while curriculum support has increased (particularly at primary level where it has more than doubled), and drama/dance and art/ design/ crafts/ cookery have also increased. Science clubs have declined at primary but increased at secondary.
14 It is important to acknowledge that it is impossible to clearly differentiate ‘after school childcare’ from ‘after school clubs’ since both offer ‘activities’ for children to engage in. While childcare may involve a range of activities and are less adult directed, some smaller schools also run a generic after school club with different activities offered each week. Similarly many ‘clubs’ also involve formal instruction to greater and lesser degrees thus making it difficult to differentiate clubs from classes.

57
3.1.6.1 Who runs after school clubs A related question asked of both primary and secondary schools was ‘who provides and runs these before/after school clubs?’. Results show (see Table 32) that the majority of these were organised and run by the school and about a fifth of schools indicated that staff organised these independently of the school. Nearly two thirds of primary schools, but only 12% of secondary schools, indicated that the after-school clubs were run by an outside agency (63%). There were few differences across school type.
The same question was asked in 2006 and there have been some slight changes with slightly fewer schools now reporting that they provide after-school clubs and a slight increase at primary school level in the use of outside agencies. Parental provision of clubs has dropped. Table 32. Who runs the after-school clubs (% of responses)
Primary Secondary 2006 2017 2006 2017
School 93% 87% 99% 93% School staff (indep. of school) - 22% - 20% Parents 18% 8% 3% 1% LA 4% 1% 1% 0% Outside agency 49% 63% 14% 12% Other 11% 4% 8% 1%
N= 1286 488 228 82 Note: Percentages and totals are based on respondents.
3.1.6.2 Use of mobile devices in school and during breaktimes A new question, asked in the 2017 survey, was about the extent to which mobile phones were allowed into school and when usage by children and students was permitted by the school. This reflects the increased availability of mobile phones to younger people but also the substantial changes in children’s social lives in that these phones are used more for communications and social media. Our pilot work highlighted the increased importance of online interaction between pupils on the playground and how phones could be a cause for tension with school staff as students in secondary schools at least used them to interact but also in the sharing of imagery and for joint entertainment and discussion. Given increased concerns about the use of social networking sites and cyberbullying amongst younger children as well as adolescents we decided to ask the same questions of primary and secondary schools. As can be seen in Table 33, the majority of primary schools (69%) indicated that mobile phones and other devices were not allowed in school but 31% of primary schools indicated that devices were allowed to be brought to school. Almost all of these (27% of primary schools) reported that the device was held somewhere (usually in the school office) for safe keeping and returned to pupils at the end of the school day. Only 1 primary school indicated that devices may be made available during break and lunch times. Of the 86 secondary schools that responded to this question, just over a quarter indicated that mobile phones were not allowed in school. This policy appeared to be slightly more likely in Academies/free schools than LA maintained schools, though this was not statistically significant. Nearly three quarters of secondary schools allowed students to bring mobile devices to school. Overall, though, devices were not allowed to be used in school but nearly half indicated that they might be allowed to be used at specific times and just over 40% of all secondary schools allowed

58
mobiles to be used during break and lunchtimes. However, it was slightly more complex in that many schools did not allow the use of devices during mealtimes. It is likely that this complex system of rules leads to difficulties in policing the use of mobile phones in secondary school. Of the 17% that selected ‘other’, some (n=7) indicated that students were not allowed to use them in school at all (i.e. they can bring them but the must remain switched off and out of sight) or they could be used outside of school buildings (n=4), or outside of school hours (n=4). Table 33.Whether or not and when mobile devices are brought to and used in school
Primary Secondary
Students are not allowed mobile devices in school
69% 26%
Students are allowed mobile devices in school
31% 74%
Use devices at any time 0% 2%
Use at morning break 0% 42% Use at lunch break 0% 42% Use at meal times 0% 16%
Use at PM break 0% 3% Use in class at specific times 1% 48%
Use during school clubs 1% 9% Other 27% 17%
N= 529 86
Note: Percentages and totals are based on respondents.
3.1.6.3 Summary To summarise this section, many schools offered activities for children to participate in during breaktimes and this had increased slightly since 2006. The most frequently offered adult led activities were music, team sports and curriculum support activities and independent schools seemed to offer a broader range of activities than state funded schools. There had been a marked increase in the offering of breakfast clubs before the start of the school day in primary schools. This was nearly double the figure in 2006. Nearly three quarters of secondary schools also offered breakfast clubs. Furthermore, although nearly all primary and secondary schools offered adult-led clubs and activities after school, slightly fewer secondary schools were offering these compared to 2006. The main activities offered at primary and secondary levels after school were team sports, music clubs, art clubs, drama clubs and the provision of curriculum support activities. While most clubs had declined or stayed the same in terms of popularity, the offering of curriculum support activity was the main club to have increased at both primary and secondary levels and had also increased as an activity during lunch breaks in primary schools, though not in secondary schools. Nearly three quarters of secondary schools and 31% of primary schools indicated that children could bring mobile phones to school. At primary level their use was highly controlled but at secondary level nearly half of schools allowed pupils to use them during breaks.

59
3.1.7 Views on breaktimes and pupil behaviour The final section of the school survey sought the views of school staff on the value of breaktimes, the challenges faced by breaktimes and whether pupil behaviour at break time and outside of school had changed in recent years. In the following sections we will cover each in turn.
3.1.7.1 The value of breaktimes When asked about the main value of breaktimes, schools were allowed to identify up to 3 responses, the three most common responses from primary schools (see Table 34) were the opportunity it provided for the release of energy and physical exercise (86%), for socialising with peers (84%), and the opportunity it provided to get fresh air (54%). The next most frequent categories were opportunities to eat and drink (25%) and extra-curricular activities (10%). While there were few differences in the values expressed by different types of schools, independent schools (63%), more than state funded schools (43%), emphasised the opportunity that breaks offered for free and undirected recreation (p=.066). Table 34. The value of breaktimes at primary and secondary levels and over time
Primary Secondary
1995 2006 2017 1995 2006 2017
Pupils can eat and drink - 19% 25% - 68% 71%
Pupils can relax after time in classroom 68% 30% 31% 83% 37% 37%
Pupils can get fresh air 46% 29% 54% 30% 21% 43%
Pupils can engage in clubs /extra-curricular activities 6% 3% 10% 36% 15% 24%
Pupils can have time for free undirected recreation 32% 39% 44% 22% 15% 22%
Pupils can release energy / get physical exercise* 57%* 85% 86% 55%* 58% 57%
Pupils can socialise with friends /peers 58% 83% 83% 69% 60% 57%
To give teachers a break - 9% 6% - 22% 14%
Other 1% 1% 2% 4% 1% 0%
N= 1268 1329 879 289 228 162 Note: Percentages and totals are based on respondents. *For the 1995 survey this was 2 separate questions.
In contrast to primary schools, the most common value of breaktime highlighted by
secondary schools is that they are important times for students to eat and drink (71%), followed by time to socialise (57%) and time to release energy and get exercise (57%). Only 24% saw break times as important times for extracurricular activities (despite the large amounts of activities that seem to go on during this time) or for undirected free recreation (22%). Getting fresh air and time for relaxing lay in between as factors of moderate importance at secondary level. What stands out when comparing primary and secondary schools is the more functional view of breaks at secondary level as times for students to eat and drink, with less priority given to the social opportunities it provides and time for energy release. Turning to changes over time in the value of breaktimes, we can see similarities between the 2006 and the 2017 data. For primary schools the results are similar with figures for the two most frequent responses (i.e., the release of energy and physical exercise and socialising with peers) being almost exactly the same. Seeing the value of breaktime in terms of getting fresh air had increased from 2006 to 2017. In the case of secondary schools, the figures for 2006 and 2017 are again broadly similar with the three most commonly expressed values of breaktime (time to eat and drink, time to socialise and time to release energy and get exercise) the same at the two time-points. As at

60
primary schools, there had been an increase in seeing the value of breaktime in terms of getting fresh air. We need to be cautious about comparisons with the data for 1995 because of the slightly different set of answer categories used then. There were no categories given for ‘pupils can eat and drink’ and ‘giving teachers a break’, and ‘releasing energy’ and ‘getting physical exercise’ were two separate questions in 1995. Perhaps the most obvious trend is that the importance in 1995 of breaktimes as ‘a time for relaxing after time in the classroom’ had declined by the later surveys. This seems to have been replaced by a perceived need to ‘release energy and get physical exercise’ and highlights changing views and concerns about sedentary behaviour and obesity. This is quite a subtle yet possibly important change from viewing breaktime as ‘a time to relax and recuperate mentally’ to a ‘time to release energy and get physical exercise’. It also seems the value of breaktimes in terms of the value of socialising with peers was less obvious in 1995 than it is now – maybe reflecting an implicit understanding of the importance of this time for young people.
3.1.7.2 Challenges of breaktimes Schools were also allowed up to three responses in terms of the main challenges of breaktimes. The majority of primary schools (64%) indicated that there were concerns and challenges with regard to break times (see Table 35). This did not vary by school type. The main challenge for schools was the poor social behaviour of a few pupils who have difficulties socialising (64%), followed by overcrowding in the dinner hall and outside (25%), the quality of supervision (23%) and the dominance of team sports (23%). Secondary schools were even more likely than primary schools to indicate that there were challenges (73%) at breaktimes. However, this varied by school type with only 40% of independent schools indicating that there were challenges and 80% of state funded schools indicating that there
were challenges. This finding was statistically significant (χ2(1)=23.71, p<.001, Cv = .35).
Table 35. Concerns and challenges with regard to break times
Primary Secondary 1995 2006 2017 1995 2006 2017
No - 15% 36% - 8% 27% Yes - 85% 64% - 92% 73%
N= 1265 1316 925 289 227 198
Poor behaviour of a small number of students who have difficulties in socialising
73% 70% 64% 63% 74% 64%
Poor behaviour due to lack of physical activity 12% 4% 1% 17% 9% 8% Overcrowding in the dinner hall or outside 20% 17% 25% 50% 50% 53% Problems concerning the quality of supervision 19% 22% 23% 28% 36% 31% Poor behaviour due to students being disruptive 29% 11% 8% 16% 16% 16% Problems of the school site / grounds 24% 20% 18% 33% 30% 21% Team sports (like football) dominate the
playground space 27% 43% 23% 5% 6% 12%
Problems concerning the provision of activities and / or equipment
20% 18% 18% 7% 15% 10%
Health and safety of the activities students want to engage in
- - 5% - - 3%
Other 4% 5% 10% 9% 8% 13% Notes: Percentages and totals are based on respondents.
The second part of this table presents data that is a subset of the first, i.e. the proportions of those responding ‘yes there were challenges’
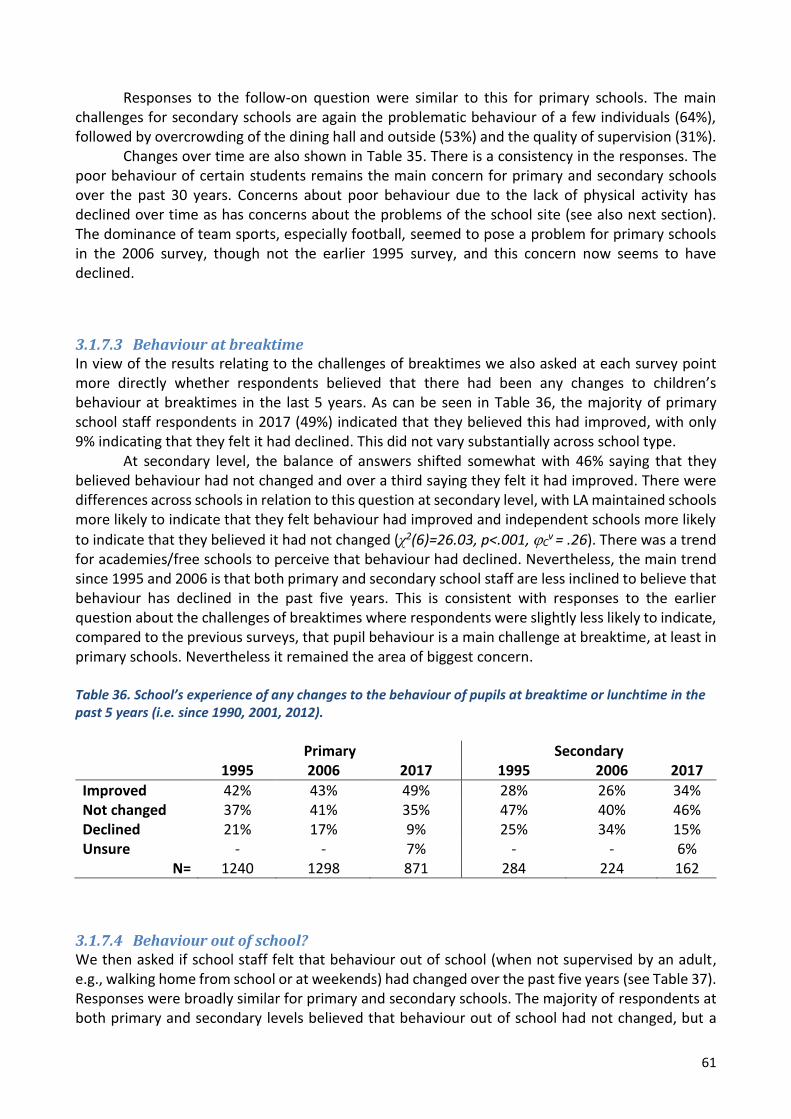
61
Responses to the follow-on question were similar to this for primary schools. The main challenges for secondary schools are again the problematic behaviour of a few individuals (64%), followed by overcrowding of the dining hall and outside (53%) and the quality of supervision (31%).
Changes over time are also shown in Table 35. There is a consistency in the responses. The poor behaviour of certain students remains the main concern for primary and secondary schools over the past 30 years. Concerns about poor behaviour due to the lack of physical activity has declined over time as has concerns about the problems of the school site (see also next section). The dominance of team sports, especially football, seemed to pose a problem for primary schools in the 2006 survey, though not the earlier 1995 survey, and this concern now seems to have declined.
3.1.7.3 Behaviour at breaktime In view of the results relating to the challenges of breaktimes we also asked at each survey point more directly whether respondents believed that there had been any changes to children’s behaviour at breaktimes in the last 5 years. As can be seen in Table 36, the majority of primary school staff respondents in 2017 (49%) indicated that they believed this had improved, with only 9% indicating that they felt it had declined. This did not vary substantially across school type. At secondary level, the balance of answers shifted somewhat with 46% saying that they believed behaviour had not changed and over a third saying they felt it had improved. There were differences across schools in relation to this question at secondary level, with LA maintained schools more likely to indicate that they felt behaviour had improved and independent schools more likely
to indicate that they believed it had not changed (χ2(6)=26.03, p<.001, Cv = .26). There was a trend
for academies/free schools to perceive that behaviour had declined. Nevertheless, the main trend since 1995 and 2006 is that both primary and secondary school staff are less inclined to believe that behaviour has declined in the past five years. This is consistent with responses to the earlier question about the challenges of breaktimes where respondents were slightly less likely to indicate, compared to the previous surveys, that pupil behaviour is a main challenge at breaktime, at least in primary schools. Nevertheless it remained the area of biggest concern. Table 36. School’s experience of any changes to the behaviour of pupils at breaktime or lunchtime in the past 5 years (i.e. since 1990, 2001, 2012).
Primary Secondary 1995 2006 2017 1995 2006 2017
Improved 42% 43% 49% 28% 26% 34% Not changed 37% 41% 35% 47% 40% 46% Declined 21% 17% 9% 25% 34% 15% Unsure - - 7% - - 6%
N= 1240 1298 871 284 224 162
3.1.7.4 Behaviour out of school? We then asked if school staff felt that behaviour out of school (when not supervised by an adult, e.g., walking home from school or at weekends) had changed over the past five years (see Table 37). Responses were broadly similar for primary and secondary schools. The majority of respondents at both primary and secondary levels believed that behaviour out of school had not changed, but a

62
substantial minority at primary level (29%) and secondary level (22%) indicated that they perceived behaviour to have declined. In relation to previous surveys in 1995 and 2006, there is a greater sense at both primary and secondary levels that staff perceive behaviour outside of school to have remained much the same in the last 5 years, with fewer participants compared to previous years indicating that it has declined. This is a positive development and again consistent with the earlier views about behaviour at breaktime in schools. Table 37. whether schools felt that behaviour out of school (when not supervised by an adult e.g. walking home from school or at weekends) had changed over the past five years
Primary Secondary 1995 2006 2017 1995 2006 2017
Improved 6% 6% 13% 9% 8% 12% Not changed 37% 46% 58% 40% 47% 66% Declined 57% 48% 29% 51% 45% 22%
N= 1208 1246 474 286 226 85
Where school staff perceived a decline in behaviour outside of school, we asked about their
views on possible reasons for this decline (see Table 38). It is important to note that responses to this question were much lower than in previous surveys where more participants felt that behaviour had declined. Main reasons given by primary and secondary school staff were that ‘pupils seem less respectful’ and ‘pupils seem less socially competent’ and percentages for this question are also broadly similar to those in 2006. There are also overlaps with the 1995 survey where ‘pupils being less respectful’ was the main reason given for a perceived decline in behaviour. However, data vary somewhat from views in 1995. Since 1995 primary and secondary school staff are less likely to hold the view that ‘students appear to be more aggressive’ and, amongst secondary school staff in particular, that behaviour has declined for a particular subset of pupils. However secondary school staff are more likely to perceive that pupils seem to be less socially competent than in 1995. Table 38. school staff views on a ‘decline’ in behaviour outside of school
Primary Secondary 1995 2006 2017 1995 2006 2017
Pupils appear to be more aggressive 65% 51% 33% 60% 62% 48% Pupils watch and copy TV/media characters more frequently
57% 37% 38% 13% 17% 24%
Pupils seem to be less socially competent 54% 63% 59% 38% 54% 62% Pupils seem to be less respectful 66% 76% 71% 78% 81% 81% There are particular pupils whose behaviour has declined
42% 35% 36% 64% 61% 38%
Other 7% 6% 10% 5% 7% 0% N= 692 596 147 147 101 21
3.1.7.5 Summary In sum, primary schools value breaks for the opportunity they provide pupils for: energy release and physical exercise, socialising with peers and getting fresh air. In contrast secondary schools value breaks in more functional terms as important times for eating and drinking, times to release energy

63
and get physical exercise, and to a lesser extent to socialise. Breaktimes as an important time to get fresh air has increased in importance since 2006 at both primary and secondary levels. Nearly 20% fewer primary and secondary schools than in 2006 felt there were challenges at break times but secondary schools were more likely to perceive challenges than primary schools. All schools highlighted the poor social behaviour of a minority of pupils as a problem and concerns about the quality of supervision and overcrowding of the dinner hall/ outside, particularly at secondary level. Schools were also more positive about pupil and students’ behaviour during breaktimes with higher levels than in 2006 and 1995 indicating that this had improved or not changed in the past 5 years. Schools were also more positive about the behaviour of pupils outside of school with the vast majority indicating that this had not changed in the past 5 years and very few indicating a decline. Further, of those that had identified a decline in behaviour outside of school, fewer schools than in 2006 and 1995 indicated that this was due to pupils appearing more aggressive. Slightly more schools than in previous surveys indicated that this decline was due to poor social competence of some pupils.
3.2 The Pupil Breaktime Survey We move now to consider the findings from the pupil survey of views and experiences of breaktimes and social life in and out of school. Each section will review results for the 2017 survey overall, by age and by gender and then over time comparing findings with those from the 2006 survey (a comparable survey was not undertaken in 1995).
3.2.1 Pupils’ views on school and breaktime The survey asked a number of questions which overlapped with the school breaktime questionnaire to provide pupils’ perspectives on the nature and organisation of breaktimes as well as their views about the values and challenges of school breaks.
3.2.1.1 Liking of breaktimes and school Pupils were asked to indicate how much they liked breaktime by ticking which one of five points on scale best reflected their feelings. At secondary level the options were: ‘It’s great’, ‘I like it’, ‘Not sure’, ‘I don’t like it’, and ‘I hate it’, while primary students were given a scale where pictures of faces representing the five levels of the scale. This technique was used in earlier research (e.g., Blatchford, Creeser & Mooney, 1990), where it was found that children of primary school age found this type of response set easier to use. Questions were asked separately for morning break, lunchtime break (excluding eating time) and wet break.
Findings show that children and young people really like morning and lunch break, though they show a preference for the lunchbreak (see Table 39 and Table 40). Over 80% of all pupils said that they liked or really liked morning breaks and 87% said this of lunch breaks. Only 5% of pupils said they disliked morning break and the lunch break. There were a small group of pupils who said that they were unsure how they felt about morning breaktime (14%) and lunchtime (9%). The overwhelmingly positive view of breaktimes is a really important finding and highlights the important position of breaktime in the school day and in children’s lives. It is clear that break and lunchtimes are one of the most valued aspects of school by pupils (as we will see later, attitudes towards school and mealtimes are also positive but not as markedly).
Table 39 and Table 40 also compare pupil views about breaks between 2006 and 2017 and there is a clear consistency over this period. The view of morning and lunchtime breaks is again very positive, and only a few indicated that they disliked either the morning or lunch time breaks. Similarly, the numbers who were unsure were consistent over time. Pupils in 2017 are slightly more

64
positive than in 2006 about the morning break time period, with slightly higher proportions indicating that they thought it was great and a slightly lower proportion indicating that they liked it. Table 39. Liking of morning breaktime
How much do you like the morning breaktime? Great Like Not sure Don't like Hate it N
2017
Year 5 44% 37% 15% 2% 1% 683 Year 8 27% 53% 14% 5% 1% 539 Year 10 25% 55% 13% 6% 1% 437 Total 34% 47% 14% 4% 1% 1659
2006
Year 5 33% 48% 14% 3% 2% 535 Year 8 22% 62% 13% 2% 1% 431 Year 10 22% 55% 14% 9% 1% 375 Total 26% 54% 14% 4% 2% 1341
Table 40. Liking of lunchtime break (excluding eating time)
How much do you like the lunchtime break? (excluding eating time)
Great Like Not sure Don't like Hate it N
2017
Year 5 73% 17% 7% 2% 1% 685 Year 8 48% 37% 9% 5% 1% 539 Year 10 42% 42% 11% 6% 1% 438 Total 57% 30% 9% 4% 1% 1662
2006
Year 5 69% 21% 6% 2% 2% 534 Year 8 47% 41% 8% 3% 1% 429 Year 10 44% 38% 13% 4% 2% 373 Total 55% 32% 9% 3% 2% 1336
Positive views of school were also evident from pupils’ responses (see Table 41). This was a question that we asked for the first time in 2017. Only about 15% of students seemed to dislike school with 63% indicating that they liked it. There were also variations with age with older pupils showing greater ambivalence or dislike for school than younger pupils. Girls were more positive about school generally. Views about lessons in school were also interesting (see Table 42). Responses were marked on a scale of 1-5 with 1 showing liking of all lessons, 2 = liking most lessons, 3 = liking some lessons, 4 = liking only 1 or 2 lessons, and 5 = indicating not liking of any lessons. Just over half of pupils (52%) indicated that they liked most lessons or all lessons and only 15% indicated that they only liked 1-2 lessons or no lessons at all. There were age differences with primary school pupils demonstrating greater liking for a wider range of lessons than Secondary students. There was a slight trend for girls to like lessons more than boys. Responses to these different scaled variables were correlated in order to see whether school and lesson liking were related to liking of breaktimes. Positive associations were identified between liking of school and morning (.22**), lunch (.23**) and wet breaks (.17**) and the time when they eat their lunch (.24**). Though as might be expected these were not strong associations compared to the liking of school and the liking of lessons (.63**), it appears that on the whole pupils see school and lessons as connected but there appears to be less of a relation between liking of school and breaktimes. It may be the case that, as school staff do not see breaks as central to the business of school (in many respects it is seen as a break from school), pupils also see it as something separate

65
from the academic experience. Alternatively, as breaktimes are only one element of the whole school experience and there are many other aspects of school that may influence school liking including relations with staff, liking of lessons etc., it may be that weak correlations might be expected. Either way, the key finding here is that there is relatively little relation between liking of breaktime and school liking. Table 41. Liking of school
How much do you like School? Great Like Not sure Don't like Hate it N
2017
Year 5 36% 41% 14% 5% 4% 677 Year 8 8% 52% 27% 9% 5% 536 Year 10 7% 38% 29% 17% 8% 436 Total 19% 44% 22% 9% 5% 1649
Table 42. Liking of lessons in school
How much do you like lessons in school?
Like all lessons
Like most lessons
I like some lessons
I only like one or two lessons in
school
I don't like any lessons N
2017
Year 5 21% 43% 24% 10% 2% 686 Year 8 2% 43% 41% 13% 1% 539 Year 10 4% 36% 39% 19% 2% 437 Total 10% 41% 34% 13% 2% 1662
2006
Year 5 8% 41% 32% 16% 3% 533 Year 8 4% 38% 41% 17% 1% 428 Year 10 1% 39% 43% 16% 1% 374 Total 5% 39% 38% 16% 2% 1335
3.2.2 The three best and worst things about breaktimes Students were asked to say what they felt were the three best things about breaktime and the three main problems with breaktime (see Table 43). They were given a list used in the previous surveys and based on further pilot work which showed these still to be valid reasons. We added two new categories and dropped one category - ‘relax after lessons’ because it overlapped with ‘free time’ and we added ‘attend a school club’ and ‘choose what to do’ as these were dimensions that seemed to be important in pilot work. In the main survey, pupils were asked to tick no more than three responses. In line with pilot work, there were two further reasons given to the secondary pupils so exact comparison across these stages and across cohorts is not easy. Results are shown in Table 43. Analysis of these data required use of multiple response analysis which means that analyses are descriptive and that inferential statistical tests were not used for the whole set of responses in relation to this question. Taking all age groups together, pupils overall said the best things about break were the opportunity it provided to meet up with friends (86%), it was their free time (62%) and the opportunity it provided to eat and drink (48%). Year 5 children, but not Year 8 and 10 pupils, also valued the time it offered for play or recreation (41%) and physical exercise (30%). Older pupils

66
highlighted the opportunity it provided to eat and drink (56% and 69% for Year 8 and 10 pupils respectively) and this was also to a degree found with the children in Year 5 (30%). Table 43. Pupils’ views on the three best things about breaktimes in 2017 and 2006
2017 2006 Year 5 Year 8 Year 10 Total Year 5 Year 8 Year 10 Total
Nothing 2% 2% 1% 2% 2% 1% 1% 1% Physical exercise 30% 7% 6% 16% 42% 22% 16% 29% Be with friends 84% 87% 90% 86% 93% 80% 81% 86% Recreational activities/
games 41% 11% 7% 22% 64% 9% 1% 29%
Free time 58% 63% 68% 62% 66% 48% 49% 55% *Fresh air - 27% 20% 14% - 41% 33% 22% Choose what to do 26% 27% 28% 27% - - - - Eat and drink 30% 56% 69% 48% 14% 39% 44% 30% Attend a school club 8% 5% 2% 6% - - - - *Relax after lessons - - - - - 44% 57% 30% Other 7% 7% 4% 6% 5% 3% 5% 4% Total 41% 32% 26% 100% 40% 32% 28% 100% N 685 539 438 1662 535 427 375 1337
Note: *these responses were available on the secondary student questionnaire only.
Changes to the questionnaire may have led to slightly different patterns in the responses between the 2006 and the 2017 surveys. While the main ‘benefits’ of breaktimes were largely unchanged (to be with friends, free time, eat and drink), a higher proportion of pupils in the most recent survey highlighted free time and eating and drinking as important benefits. However, in 2017 compared to 2006, pupils were less likely to see breaks as an opportunity for physical exercise. It was also noticeable that in 2006 primary pupils were more likely to value breaks for the opportunity they provided to spend with friends and recreational activities and games, while in 2017 time with friends appears to be valued even more amongst secondary school students. A similar pattern is in evidence for free time in that more secondary pupils in 2017 seem to value break for the free time it affords.
When it comes to problems with break times (see Table 44), pupils were most concerned overall about the behaviour of some other pupils (40%), thus reflecting the concerns of school staff, and the absence of things to do (34%). These may be important as poor behaviour may be related to the lack of things to do. However, the challenges seemed to differ for different age groups. For Year 5 pupils the predominant responses were: some pupils behave badly (53%), that there are no problems at breaktime (30%) and that there are activities that are banned (28%). Year 8 pupils were predominantly concerned about the lack of things to do (41%), time to eat their lunch (38%) and that some pupils behave badly (36%). Year 10 students were primarily concerned about the lack of time to eat (44%), the lack of things to do (36%), and that the school grounds needed improvement (29%). The poor behaviour of some others was still an issue for the oldest students, but this declined as an issue with age.

67
Table 44. Pupils’ views on the three main challenges about breaktimes in 2017 and 2006
2017 2006 Year 5 Year 8 Year10 Total Year 5 Year 8 Year10 Total
None 30% 19% 17% 23% 33% 22% 18% 25%
Some pupils behave badly
53% 36% 24% 40% 57% 39% 32% 44%
Lack of space 22% 13% 11% 16% 25% 16% 9% 18%
Ball games get in way 24% 6% 7% 14% 38% 24% 14% 27%
Not enough to do 27% 41% 36% 34% 30% 40% 36% 35%
*Enjoyable activities not allowed
28%* 21% 27% 26% 13% 28% 30% 22%
Not enough time to eat - 38% 44% 24% - 20% 36% 17%
No fun at break 4% 7% 7% 6% - - - -
School grounds need improvement
15% 22% 29% 21% 7% 6% 13% 8%
Other 14% 22% 23% 19% 11% 13% 17% 14%
N 678 536 434 1648 530 424 374 1328
Note: *At primary level this variable is a composite of responses indicating the prevention of running, prevention of playing on equipment, or the banning of games. If a respondent indicated any of these it was counted in this percentage.
Comparison of the 2006 and 2017 data shows that the main shortcomings identified are
largely the same with poor behaviour of some pupils and the absence of things to do the most prevalent at both time points. However, differences are evident for ‘ball games get in the way’ which seems to have declined as a problem since 2006 (note this trend was also apparent for the school questionnaire). This may be due to improvements in the organisation and management of playground space or possibly due to banning of ball games. However, for secondary pupils having enough time to eat has now become an issue of importance. In the most recent survey more students overall said that the school grounds needed improvement and this sentiment increased with age.
The response ‘Enjoyable activities are not allowed’ was identified by 26% of students as an issue of concern. This appears to be an issue that has increased in importance largely because of the increase of this as an issue amongst primary school pupils where 28% of pupils raised this as a problem.
3.2.3 Pupils’ views on the length of lunch breaks Given the trend over time for a reduction in the length of lunchbreaks, as identified earlier, particularly at secondary level, responses to the question asking for students’ views about the length of lunchtime breaks have an obvious importance (see Table 45). Overall, very few students thought the break was too long (2%). The most common response was that the lunch break was not long enough and should be made longer (55% overall). Rather tellingly, this was a view that grew over the school years so that at Year 8 and 10 over 60% of students said that the lunch break was too short, (F(1, 1647)=23.20, p<.001). This trend maybe reflects older students’ dissatisfaction with shorter total amount of time for breaks that they experience compared with earlier stages in school. The numbers who thought it was about the right length declined with age so that the majority of Year 5 pupils were happy with the length (53%) but this reduced to 38% at Year 8 and 36% at Year 10. By Year 10, therefore, nearly twice as many students thought breaktime was not long enough as thought it was about the right length. There is therefore a growing dissatisfaction with the length

68
of breaktime with age. There is a stark contrast with the view of school staff that students can have problems with breaktime and that it is too long; these students feel it is not long enough. As is also evident from Table 45, pupils’ views are largely unchanged since the last survey in 2006. This offers strong evidence that the majority of secondary school pupils, and a sizeable minority of primary school students, want lunch breaktimes to be longer. Table 45. Pupils’ views about the length of lunchtime breaks in 2017 and 2006.
What do you think about the length of lunch time breaks?
Too long and should be shorter
about right length
Too short and should be made longer
N
Year 5 2017 3% 53% 45% 678 2006 1% 56% 43% 527
Year 8 2017 1% 38% 61% 536 2006 1% 40% 59% 423
Year 10 2017 2% 36% 62% 436 2006 5% 31% 64% 375
Total 2017 2% 44% 55% 1650 2006 2% 44% 54% 1325
Note. 2017 age effect = χ2(4)=49.01, p<.001
3.2.4 Pupils’ views on the number of supervisors We also asked pupils whether they thought there was sufficient supervision on the playground at lunch times (see Table 46). They could provide one of 3 responses: there were not enough adults to supervise, there was just the right amount, or there were too many. The vast majority of pupils felt that there was about the right amount supervision. About one fifth suggested that there were too many adults supervising and about 16% suggested there were too few. There was a change in response according to age with older students more likely to suggest there were too many adults supervising and primary pupils were more likely to indicate that there were not enough adults supervising. There were no gender differences in the views expressed. Table 46. Pupils’ views about the number of supervisors at lunchtimes.
Do you think there are enough adult supervisors at lunch times?
Not enough adults About the right amount Too many adults N
Year 5 2017 23% 65% 11% 683 2006 15% 72% 14% 532
Year 8 2017 16% 58% 26% 537 2006 13% 60% 27% 421
Year 10 2017 6% 62% 32% 431 2006 10% 56% 34% 375
Total 2017 16% 62% 22% 1651 2006 13% 64% 24% 1328
Note. 2017 age effect = χ2(4)=112.96, p<.001
In the case of secondary pupils, results for the 2017 survey are very similar to the earlier survey in 2006 (see Table 46). However primary pupils are now slightly more likely to indicate that there are not enough adults supervising and less likely to say that there is the right number of supervisors.

69
3.2.4.1 Summary The key findings in terms of pupils’ views on school and the nature and organisation of breaktimes show that pupils are overwhelmingly positive about break times and particularly the longer lunch break. Indeed, very few pupils expressed a dislike of these times (5%). This finding is unchanged since the previous pupil survey undertaken in 2006. In fact, higher percentages of pupils seem to like breaktimes than they do school in general, lessons and/or mealtimes. In terms of the value of breaktimes, pupils overwhelmingly highlight that first and foremost breaks afford them the chance to socialise with friends. They also valued these occasions for the opportunity for some free time, and to choose what they want to do/ engage in playful activities. These values were largely consistent with those identified by the 2006 survey. An area of change since 2006 was that all pupils, but particularly secondary aged pupils, valued it as time to eat and drink.
Pupils also identified a number of challenges about break times and these included concerns about the poor behaviour of some other pupils, the absence of things to do and the banning of fun activities and, particularly amongst older pupils, having sufficient time to eat. These were similar to the concerns expressed by pupils in 2006 except that the banning of fun activities and concerns about sufficient time to eat have increased as issues, whilst concerns about ball games getting in the way had declined.
When it came to their views about the length of lunch breaks, a majority of pupils indicated that these were too short and should be made longer. Surprisingly, older students were more likely to express this view, possibly because of the short lunch breaks that secondary pupils seem to experience. In relation to their views on the number of supervisors at break, the majority of pupils seemed to feel that there were enough adults supervising but older students were more likely to indicate that they felt there were too many adults supervising.
3.2.5 Pupils’ experiences of what happens during break and lunch times The survey in 2017 focused more on what takes place during break and lunch times. We wanted to find out more about the presence of adult organised clubs and activities and pupils’ access or take up of these. We also wanted to find out more about the extent to which pupils missed a break and the reasons why, as well as pupils’ reflections on the nature of their interactions with peers and activities.
3.2.5.1 Clubs and activities organised during lunchtimes In terms of clubs and activities that were organised at breaktimes (see Table 47), primary pupils were far more likely to indicate (69%) that they participated in activities offered than secondary school students. In fact, 70% of Year 8 students and 87% of Year 10 students said that they did not participate in organised activities at break times.
Of the 42% of pupils overall who indicated that they participated in clubs/activities at breaktimes, the majority indicated that this was team sports (48%), followed by other sports (25%) such as athletics, running, tennis, followed by music (22%). Interestingly 10% (n=40) of Year 5 pupils attending clubs said they attended a homework club and 13 secondary school pupils reported attending extra classes during breaktimes.

70
Table 47. Participation in adult organised activities during breaktimes
Year group 5 8 10 Total %
% Participate in clubs at break* Yes 69% 31% 13% 42% No 31% 59% 35% 49% N= 687 536 434 1657
Team Sports 46% 52% 49% 48% Other Sports 25% 27% 21% 25% Music 22% 22% 25% 22% Computing/coding 7% 7% 5% 7% Drama/Dance 14% 20% 9% 15% Art/design/crafts/cookery 12% 13% 5% 12% Science 2% 2% 4% 2% Gardening/nature (secondary only) - 4% 0% 1% Homework/curriculum support 10% 7% 9% 9% Extra classes (secondary only) - 4% 11% 2% Competitive board games 7% 4% 4% 6% Other 22% 11% 14% 18% Lego Club (primary only) 5% - - 3% Note: * figures do not total 100% as data for the third option ‘My school does not organise clubs at break’ are not presented. The second part of this table present data that are a subset of the first, i.e. the proportion of those responding ‘yes, they did participate in adult led activities during break’
3.2.5.2 Missing breaktimes In order to compare with results from the school survey, we asked a new question of pupils about whether they had missed all or part of a break time (see Table 48). Although many schools indicated that children and young people did miss breaktimes we had little insight into how prevalent this actually is and how many pupils may be affected. Over 80% of young people said there are times when they have missed a breaktime and this was highest amongst the Year 10 respondents with 88% saying this had happened and lower for Year 5 pupils with 77% reporting this. This age effect was statistically significant, (χ2(2) = 20.38, p<.001). There was also a gender effect with boys (83%) slightly more likely to report that they missed a break time than girls (79%), (χ2(1) = 3.98, p<.05). Table 48. Whether pupils have missed all or part of a break or lunch time in relation to age and gender
No Yes N=
Year 5 23% 77% 687 Year 8 20% 80% 537 Year 10 12% 88% 434 Males 17% 83% 807 Females 21% 79% 823
Total 19% (320) 81% (1338) 1658

71
A multiple responses analysis of the reasons given for missing break or lunch times (see Table 49) showed that nearly half (49%) of the pupils cited the misbehaviour of others as a main reason for missing breaks, followed by their own misbehaviour in class (28%). Approximately a quarter of pupils also said that they missed breaks because they had not completed their homework (25%) or they had to catch up with class work (24%). There were also variations according to age. Secondary school students were more likely than primary school pupils to miss a break due to the behaviour of others and/or themselves. In relation to gender the patterns were relatively consistent except that boys were more likely than girls to miss out on break due to their own behaviour (34% vs 22%).
A range of ‘other’ reasons were also given, many of these overlapped with the given responses but others included school focused reasons (such as to attend one-to-one meetings with staff, mock exams, extra lessons, duties (prefects, library, cleaning art materials), performance rehearsals) to more personal issues (such as health issues during school, attendance of health appointments outside of school etc.). Table 49. Reasons given for missing a break or lunch time
Year group 5 8 10 Total %
Times when you have missed a break? Yes 77% 80% 88% 81% No 23% 20% 12% 19% N= 687 537 434 1658
Misbehaved in Class 19% 36% 33% 28% Others misbehaved 34% 59% 57% 49% To finish homework 27% 22% 27% 25% To catch up with class work 27% 16% 29% 24% To do extra class work 14% 6% 8% 10% To attend sports competitions 15% 15% 11% 14% To attend paid classes 6% 6% 7% 6% Other 20% 17% 19% 19% Note: the second part of this table present data that are a subset of the first, i.e. the proportion of those responding ‘yes, there had been times when they had missed a break’
3.2.5.3 Social life and activities at breaktimes A set of questions asked pupils about their social lives with others and friends at breaktimes and the extent to which they could choose what they wanted to do and how often they were physically active (see Table 50). These items were measured on a 3 point scale with a value of 3 indicating ‘most of the time’, 2 indicating ‘sometimes’ and 1 indicating ‘rarely’. There was also a ‘not sure’ category, pupils that selected this category were left out of this analysis.
The clear majority of primary and secondary pupils indicated that most of the time they did get along with others during breaktimes and could be with friends during these times. Only around 5-6% indicated that this was rarely the case. There were however age differences in terms of the nature of interactions with others and the opportunity to be with friends during breaks, with Year 10 students more likely to report that they get along with others during breaks and that they can be with friends during breaks than Year 5 pupils. Although most pupils felt that could do the things that they want during breaktimes - at least sometimes, about 17% indicated that that they could not do the things they want. This may reflect the banning of certain games and activities as discussed earlier.

72
Table 50. Pupils’ views on their social opportunities and activities during break times and meal times
Year group Gender 5 8 10 Total Males Females
Mean SD Mean SD Mean SD Mean SD ANOVA Mean SD Mean SD ANOVA
I get along well with others during breaktimes. 2.57 0.66 2.75 0.53 2.88 0.36 2.71 0.56 *** 2.68 0.59 2.74 0.53 ns
I can be with friends during breaktimes. 2.63 0.69 2.82 0.46 2.91 0.34 2.77 0.55 *** 2.76 0.57 2.77 0.53 ns
I spend most of breaktimes being so physically active that I am breathing hard and sweating.
1.96 0.78 1.43 0.62 1.28 0.54 1.59 0.73 *** 1.71 0.75 1.47 0.69 ***
I can do the things I want during breaktimes 2.27 0.77 2.23 0.70 2.26 0.70 2.25 0.73 ns 2.27 0.76 2.25 0.70 ns
How much I like the time when I am eating lunch* 1.90 1.01 2.24 1.06 2.18 1.04 2.08 1.04 *** 2.04 1.01 2.11 1.05 ns
I get along well with others during eating times. 2.53 0.70 2.70 0.58 2.80 0.45 2.66 0.61 *** 2.64 0.63 2.69 0.59 ns
I can sit with my friends during eating times. 2.46 0.74 2.70 0.59 2.75 0.53 2.61 0.65 *** 2.58 0.67 2.65 0.63 *
I enjoy talking to other kids during eating times 2.40 0.78 2.62 0.65 2.69 0.59 2.56 0.70 *** 2.53 0.73 2.59 0.67 ns
I am given enough time to eat my lunch 2.33 0.79 2.22 0.77 2.15 0.80 2.24 0.79 ** 2.27 0.80 2.22 0.78 ns Note: all dimensions except ‘How much they like lunch’ are measured on a 3 point scale with 1 being the lowest and 3 being the highest. ‘How much they like
lunch’ is measured on a 5 pt scale with 1 being the highest and 5 the lowest

73
We included a question to find out about the extent to which pupils believed they were
physically active during breaks (see Table 50 and Table 51 and Fig. 2). This is of course a subjective judgement but given the attention given to breaktimes as important times for physical exercise we thought it would be a useful question to ask. The large majority of pupils (56%) indicated that they rarely spent their breaktimes very physically active to the extent that they were breathing hard and sweating. Approximately 30% indicated that they were sometimes physically active and 15% indicated that they were physically active most of the time. This also varied quite dramatically by age with more than double the proportion of Year 10 students (76%) and Year 8 students (64%), as Year 5 students (33%), indicating they were rarely physically active during breaks. Even amongst the Year 5 pupils, only 29% indicated that they were physically active most of the time. This suggests that only a minority of pupils in primary school are physically active during breaks. There was also an interaction with gender. While boys were more active overall, girls were increasingly likely with age to say that they were rarely physically active during breaktime.
Table 51. I spend most of breaktime being so physically active that I am breathing hard and sweating
Year 5 Year 8 Year 10 Total
Mostly 31% 12% 8% 18%
Boys Sometimes 37% 38% 30% 35%
Rarely 32% 50% 63% 47%
Mostly 26% 2% 1% 11%
Girls Sometimes 41% 20% 8% 25%
Rarely 33% 78% 91% 64%
3.2.5.4 Social opportunities and experiences during school mealtimes One area that we wanted to find out more about was pupil’s experience of meal times. We have seen already that a main positive feature of breaktimes for secondary school students is the
0%
10%
20%
30%
40%
50%
60%
70%
80%
90%
100%
Y5 Y8 Y10
Figure 2. % of children that said they were rarely physically active at breaktime
Boys
Girls

74
opportunity it affords for something to eat. We have also seen that secondary school students in particular identify a lack of time to eat as one of the main problems with break and lunch times. We asked several questions about pupils’ meal time experiences (see Table 50). Pupils reported that they really enjoyed their meal times (70% liked it, 9% didn’t like it), that most of the time they get to sit with friends (70%) and get along with others during meal times (71%). A large portion also enjoy engaging in conversation with peers during these times (66%). However, a fifth of all respondents indicated that they felt they did not have enough time to eat their lunch. These patterns varied by age, with younger pupils expressing a greater preference for eating time than students in secondary school (where 11-12% disliked eating times). Secondary school students were more likely than Year 5 pupils to say that most of the time they got on well with others and got to sit with friends during eating times. They were also more likely to say that most of the time they enjoyed talking with peers during eating times. However, Year 5 pupils were more likely than Year 8 and Year 10 students to report that most of the time they are given enough time to eat their lunch. Year 10 students are more likely to report that this rarely happened.
3.2.5.5 Summary In summary, over three quarters of primary pupils indicated that they participated in adult organised activities during breaktimes. This was much lower at less than a third for Year 8 pupils, and even less for pupils in Year 10. The most prevalent activities that pupils participated in were team sports, other sports and music and nearly 10% indicated that they attended homework/curriculum support clubs during break times.
A large majority of pupils (over 80%) indicated that they had missed break times and this response was more prevalent amongst older pupils. Principle reasons given for missing breaks were related to adult imposed consequences for poor behaviour, usually instigated by someone else in the class, or to finish off homework/ class work. Findings show that more than half of pupils indicated that they were rarely physically active during breaktimes, to the extent that they were breathing hard and sweating, and older pupils and especially girls were more likely to report this. When asked about mealtimes (i.e. the time when pupils were eating), the majority reported that they enjoyed these times, that for the bulk of the time they got to experience this with friends. However, reflecting the earlier concerns about having enough time to eat, many pupils indicated that they did not have enough time to eat their lunch, especially older students at secondary level.
3.2.6 Social life after school The pupil questionnaire asked a number of questions about children’s social lives after and outside school including in relation to adult organised clubs/activities after school and more informal activities and meeting with friends and peers outside of school. We will review findings in relation to these questions in turn.
3.2.6.1 Attendance of after-school clubs One question related to attendance at after-school clubs and a second question asked about clubs outside of school (see Table 52). Only 44% said of pupils said that they had attended an after-school club in the last week. The extent to which after school clubs were taken up varied by age with over 60% of primary pupils reporting that they attended an after-school club. This dropped to only a third of Year 8 students and a quarter of Year 10 students choosing to attend clubs after school, (χ2(4)= 180.2, p<.001). No gender differences were evident.
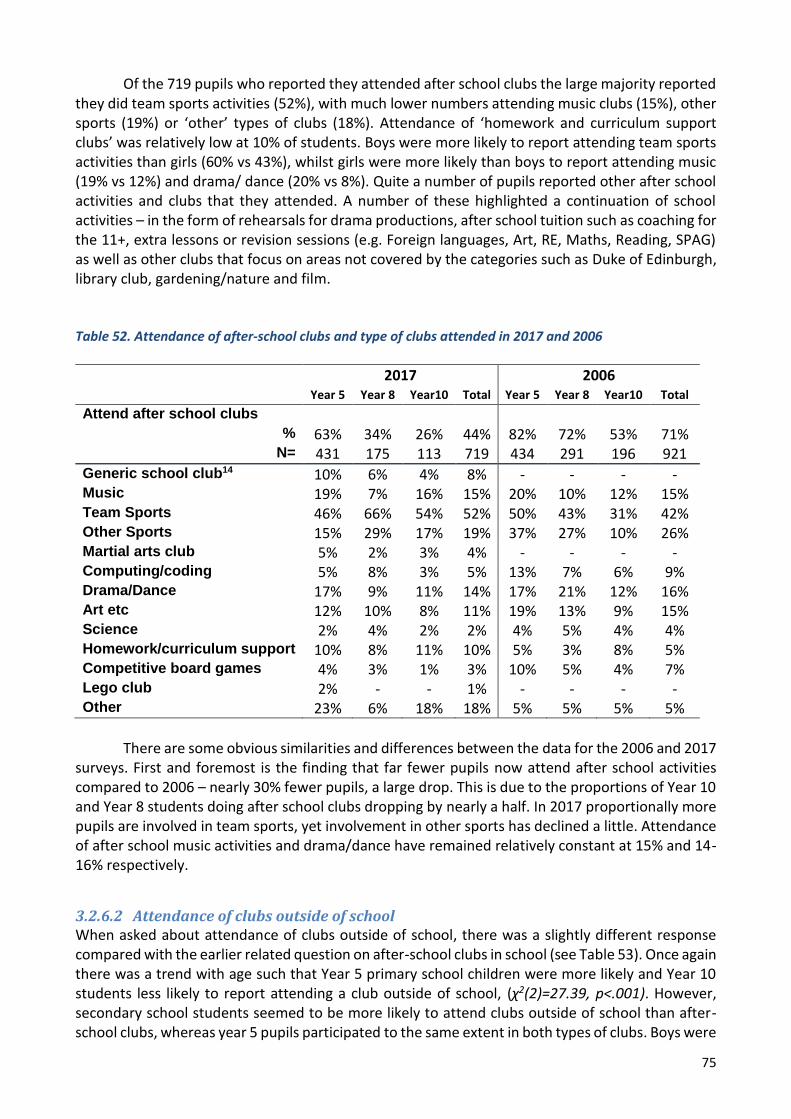
75
Of the 719 pupils who reported they attended after school clubs the large majority reported they did team sports activities (52%), with much lower numbers attending music clubs (15%), other sports (19%) or ‘other’ types of clubs (18%). Attendance of ‘homework and curriculum support clubs’ was relatively low at 10% of students. Boys were more likely to report attending team sports activities than girls (60% vs 43%), whilst girls were more likely than boys to report attending music (19% vs 12%) and drama/ dance (20% vs 8%). Quite a number of pupils reported other after school activities and clubs that they attended. A number of these highlighted a continuation of school activities – in the form of rehearsals for drama productions, after school tuition such as coaching for the 11+, extra lessons or revision sessions (e.g. Foreign languages, Art, RE, Maths, Reading, SPAG) as well as other clubs that focus on areas not covered by the categories such as Duke of Edinburgh, library club, gardening/nature and film. Table 52. Attendance of after-school clubs and type of clubs attended in 2017 and 2006
2017 2006 Year 5 Year 8 Year10 Total Year 5 Year 8 Year10 Total
Attend after school clubs
% 63% 34% 26% 44% 82% 72% 53% 71% N= 431 175 113 719 434 291 196 921
Generic school club14 10% 6% 4% 8% - - - - Music 19% 7% 16% 15% 20% 10% 12% 15% Team Sports 46% 66% 54% 52% 50% 43% 31% 42% Other Sports 15% 29% 17% 19% 37% 27% 10% 26% Martial arts club 5% 2% 3% 4% - - - - Computing/coding 5% 8% 3% 5% 13% 7% 6% 9% Drama/Dance 17% 9% 11% 14% 17% 21% 12% 16% Art etc 12% 10% 8% 11% 19% 13% 9% 15% Science 2% 4% 2% 2% 4% 5% 4% 4% Homework/curriculum support 10% 8% 11% 10% 5% 3% 8% 5% Competitive board games 4% 3% 1% 3% 10% 5% 4% 7% Lego club 2% - - 1% - - - - Other 23% 6% 18% 18% 5% 5% 5% 5%
There are some obvious similarities and differences between the data for the 2006 and 2017
surveys. First and foremost is the finding that far fewer pupils now attend after school activities compared to 2006 – nearly 30% fewer pupils, a large drop. This is due to the proportions of Year 10 and Year 8 students doing after school clubs dropping by nearly a half. In 2017 proportionally more pupils are involved in team sports, yet involvement in other sports has declined a little. Attendance of after school music activities and drama/dance have remained relatively constant at 15% and 14-16% respectively.
3.2.6.2 Attendance of clubs outside of school When asked about attendance of clubs outside of school, there was a slightly different response compared with the earlier related question on after-school clubs in school (see Table 53). Once again there was a trend with age such that Year 5 primary school children were more likely and Year 10 students less likely to report attending a club outside of school, (χ2(2)=27.39, p<.001). However, secondary school students seemed to be more likely to attend clubs outside of school than after-school clubs, whereas year 5 pupils participated to the same extent in both types of clubs. Boys were

76
slightly more likely to report attending a club outside of school than girls (57% vs 51%), (χ2(1)=4.89, p<.05). In terms of the activities undertaken, team sports were most popular, with 41% of pupils reporting attendance of such clubs, followed by other types of sports (28%), youth organisations (21%) and drama/dance (17%). There were variations by age with Year 8 students most likely to participate in team sports, youth organisations and drama/dance but less likely than Year 5 or 10 students to participate in other sports. There were marked gender differences in the types of clubs attended, with girls more likely than boys to attend clubs that did drama/dance or music and boys twice as likely to attend clubs focused on team sports. Table 53. Attendance of and type of clubs outside of school attended in 2017 and 2006
2017 2006 Year 5 Year 8 Year10 Total Year 5 Year 8 Year10 Total % Attend clubs outside of school
Yes 60% 55% 44% 54% 73% 75% 53% 68% No 40% 45% 56% 46% 27% 25% 47% 32% N= 684 511 425 1620 524 392 367 1283
Team 38% 48% 39% 41% 31% 32% 26% 30% Other Sports 29% 25% 29% 28% 26% 24% 13% 22%
Outdoor activity 6% 6% 4% 6% 7% 13% 7% 9% Music 12% 12% 11% 12% 9% 13% 10% 10%
Drama /dance 16% 19% 16% 17% 15% 14% 8% 13% Youth organisations 20% 24% 18% 21% 21% 28% 15% 21%
Martial Arts 4% 2% 3% 9% 7% 10% 3% 6% Art/ crafts/ cookery 6% 2% 1% 3% 3% 2% 1% 2%
Other 19% 6% 9% 13% 8% 3% 3% 5%
Attendance of clubs outside of school was proportionally lower (54%) than in 2006 (68%).
However, the types of clubs that pupils attended seems to have altered with more students attending clubs that do team sports and drama/dance.
3.2.6.3 Where pupils went and what they did after school We asked where students had gone when they had left school in the afternoon the previous day (see Table 54). The majority of pupils at all three age levels reported that they went straight home after school (64%), some (8%) reported going to an after-school club, small numbers went to a relative’s house (6%), to a friend’s house (5%) or played out locally (5%). There were slight differences between the different age groups, (χ2(12) = 139.47, p<.001). Primary aged pupils were more likely to go to a relative’s house or a child minder’s and were also more likely to attend an after-school club. Year 10 students were more likely to go straight home than younger students.
The data are not easily compared with the equivalent data from the 2006 survey as the responses offered were somewhat different (not as many categories were on offer). Nevertheless, even allowing for this it appears that fewer students go directly home than in 2006 and similarly fewer pupils in 2017 seemed to visit a friend’s house than in the 2006 survey.

77
Table 54. Where students went most often after they left school
Where students went most often after they left school? Straight
home Relative / family
friends house Child minder
(primary only) Friend’s house
Clubs outside of school
I hung out locally (secondary) Other N
2017 Year 5 58% 9% 2% 5% 10% - 16% 672 Year 8 67% 4% - 6% 7% 8% 9% 513
Year 10 70% 2% - 5% 6% 8% 9% 427
Total 64% 6% 1% 5% 8% 5% 12% 1612
2006 Year 5 79% - 4% 7% - - 11% 530 Year 8 79% - - 10% - - 12% 400
Year 10 77% - - 10% - - 14% 367
Total 78% 2% 8% - 12% 1297 Table 55. What pupils did after school on the preceding day in 2017 and 2006
What did you do after school yesterday? 2017 2006 Year 5 Year 8 Year10 Total Year 5 Year 8 Year10 Total
Played/hung out with friends 15% 20% 17% 17% 40% 35% 42% 39% Played alone or with family members 12% 22% 19% 17% - - - - Did homework 12% 15% 16% 14% 10% 23% 18% 16% Watched TV/device without a friend present 25% 17% 24% 22% 18% 16% 15% 16% Watched TV/device with a friend present 11% 7% 5% 8% 4% 5% 7% 5% Went to club 11% 10% 10% 10% 13% 8% 6% 10% Other 14% 10% 10% 12% 16% 13% 14% 14%

78
When asked about what they did after school there were a wide range of responses (see Table 55). The largest percentage of pupils reported that they watched TV or used a device without friends present (22%) – only 8% reported doing this with a friend (these were more likely to be Year 5 pupils). However, about 17% of pupils spent time with friends and the same proportion spent time at home with or without other family present. Age differences were evident, but this seems largely due to slight differences in being home alone or with family and watching TV with friends. There were however significant differences between boys and girls in terms of what they reported doing after school. Boys were far more likely to report watching TV or using a device with a friend than girls (12% vs 4%), whilst girls were more likely than boys to report doing their homework after school (19% vs 10%), (χ2(6)=77.29, p<.001).
Comparison of 2017 data with 2006 results suggests markedly different activities are now undertaken after school. It is particularly noticeable that while in 2006 about 4 in 10 pupils (39%) said they met with friends after school, this had reduced to less than 2 in 10 pupils (17%) in 2017. This might be affected to some extent by the addition of the new question which relates to playing alone or with family, but it seems unlikely to have a been a major factor in the change. We seem to have found therefore a marked decline in social contact with friends outside school. To some degree this can be explained by an accompanying increase in the proportions of pupils watching TV or using a device without a friend present (from 16% to 22%) and watching TV or device with a friend (5% to 8%).The levels of children doing school homework after school were fairly stable at 14-16%.
3.2.6.4 The importance of being with friends at school We asked students how important they thought it was to be with friends in school (see Table 56). They were asked to tick one of five points on a scale – very important, quite important, sometimes important, not that important and not at all important.
The majority of pupils (60%) indicated that being with friends in school was very important to them, and a further 26% felt it was quite important. Adding these two responses together we can say that nearly 90% of pupils (86%) thought that it was ‘important’ to be with their friends at school. A small minority (4%) felt that it was ‘not that important’ or ‘not at all important’ to be with friends in school. Older pupils tended to rate the importance of meeting with friends in school more highly whereas Year 5 pupils were more likely to suggest that being with friends was sometimes or not that important. There were no sex differences in views on the importance of being with friends. Table 56. Views on the importance of being with friends in school
How important do you think it is to be with your friends in school?
Very
important Quite
important Sometimes important
Not that important
Not at all important N
2017 Year 5 50% 27% 16% 6% 1% 684 Year 8 63% 27% 7% 3% 1% 539
Year 10 70% 24% 4% 2% 0% 436
Total 60% 26% 10% 4% 1% 1659
2006 Year 5 54% 28% 13% 4% 2% 535 Year 8 62% 27% 9% 1% 1% 425
Year 10 56% 31% 9% 4% 0% 373
Total 57% 28% 11% 3% 1% 1333
The 2017 findings are largely similar to the 2006 results, except the age trend is less marked
in the 2006 sample with Year 10 students being less likely to highlight being with friends as very important.

79
3.2.6.5 Friendships in school In the questionnaire completed by secondary school students only, we also asked about the extent to which students ‘felt’ they had lots of friends in school (see Table 57). The majority of students indicated that this was probably or definitely true (73%) and only 4% indicated that this was definitely not true (and only 10% indicated that it was probably not true or definitely not true). There were no age or gender differences. It may be of some significance that there are marked differences between responses in 2006 and 2017, with pupils in 2017 feeling less ‘sure’ about friendships with only about a third saying it was ‘definitely true’ that they had lots of friends in school compared to nearly 60% in 2006. Far more pupils in 2017, than in 2006, suggest they were ‘not sure’ or that this was ‘probably true’ that they had lots of friends in school. About 10% of pupils felt it was either ‘probably’ or ‘definitely untrue’ that they had lots of friends in school in 2017 – double that for 2006 (4%). It is difficult to know exactly what the results for this question tell us, and more importantly, why there has been such a change. Do these results reflect a reality that young people feel they have fewer friends or is this about their own confidence? Our other results (see above and below) suggest that young people spend less time with peers and friends outside of school and it may be that this finding is related to this. Table 57. Extent to which secondary school students felt they had lots of friends in school
Do you feel you have lots of friends in school? Definitely
true Probably
true Not sure
Probably not true
Definitely not true
N
2017 Year 8 34% 42% 15% 6% 3% 508
Year 10 30% 41% 19% 6% 4% 423
Total 32% 41% 17% 6% 4% 931
2006* Year 8 61% 26% 10% 2% 1% 415
Year 10 55% 32% 7% 4% 1% 376
Total 58% 29% 9% 3% 1% 791
Note. * In 2006 Year 5 data were also collected but are left out of this table (they were similar to the Year 8 data in 2006)
3.2.6.6 Meeting with peers and friends outside of school Two important questions asked of all pupils was about whether they ‘played with other children’ (primary) / ‘hang out with other students’ (secondary) outside of school and if they did, how regularly they did in the evening after school or at weekends. In the previous 2006 survey we found that over a quarter of children and young people did not see play or meet with peers outside of school during the week, except possibly at weekends, and 15% indicated that they saw peers rarely or less than once per week. When pupils were asked in 2017 (see Table 58) whether they hung out/played with peers in the evening after school or at weekends, very high proportions of pupils indicated that they did (86%). However this varied with age, with nearly 90% of Year 10s indicating that they met with peers and a lower proportion of Year 5 children (82%) indicating that they did, (χ2(2)=14.19, p=.001).

80
Table 58. Whether and how often children spend time with peers outside of school
2017 2006 Year 5 Year 8 Year10 Total Year 5 Year 8 Year10 Total
Yes, meet with peers outside of school?
82% 88% 89% 86% 91% 88% 92% 91%
If so how often
Every night 10% 7% 8% 9% 18% 15% 20% 18% A few times a week 35% 41% 34% 36% 45% 46% 48% 46%
Once a week 7% 10% 9% 9% 11% 10% 4% 9% Only at weekends 13% 14% 22% 16% 10% 11% 16% 12%
Less than once a week 18% 16% 17% 17% 8% 6% 4% 6% Rarely 18% 12% 11% 14% 9% 12% 8% 9%
N 679 481 409 1569 531 410 373 1314
However, the more detailed follow up question was more revealing (see Table 58, see also
Graphs 2 and 3). The graphs show that outside of school nearly a third of pupils (31%) get to see friends less than once a week or more rarely. About 16% get to see friends at the weekend and approximately 52% get to see friends once a week or more frequently. There were differences across the age groups, (χ2(10) =39.22, p<.001). Year 5 pupils were least likely to see peers outside of school with 36% seeing them less than once a week (28% for Year 8 and for Year 10 pupils). However, Year 5 pupils were also more likely than other age groups to see peers every night. Year 10 pupils were more likely to meet with peers at the weekend than other age groups. There was a slight gender difference with girls more likely and boys less likely to see peers at weekends (19% vs 12%) but also a slightly higher proportion of boys compared to girls said they rarely saw peers outside of school (16% vs 12%), (χ2(5)=17.22, p<.01).

81
In comparison to 2006, the 2017 figures show a marked change, particularly for primary aged children. In 2006 approximately 15% of children and young people met with peers less than once a week or rarely, but by 2017 this figure had increased to 31% of pupils. Furthermore, far fewer students see peers every night (a drop from 18% in 2006 to 9% in 2017). These results are important and imply a marked decline in meeting with other peers or friends outside of school. In 2006 the figures from the survey were very consistent with similar basic figures collected as part of the millennium cohort study. These trends appear consistent with other indicators outlined above that suggest that children are less likely to play with or hang out with friends after school (see Table 55) and they are less likely to go to a friend’s house after school (see Table 54).
3.2.6.7 Types of friends met with outside school We then asked about whether peers met outside of school were from their own school or not (see Table 59). An equal proportion of students reported seeing mostly their school friends outside of school (43%) or a mix of school and non-school friends (44%) and this did not vary by age group. However there was an interesting variation with gender with boys more likely to report seeing mostly school friends outside of school than girls (50% vs 38%), (χ2(3)=14.84, p<.01).
Table 59. Extent to which friends are from the same school
Extent to which friends are from the same school? School
friends Not school
friends A mix of
both Other N
2017
Boys 50% 8% 40% 2% 415 Girls 38% 11% 47% 4% 434
Year 8 42% 10% 44% 3% 508 Year 10 44% 8% 44% 4% 423
Total 43% 9% 44% 3% 931
2006 Year 8 50% 8% 41% 2% 385 Year 10 42% 8% 49% 1% 358
Total 45% 8% 45% 2% 743

82
Analysis of social networks beyond the school was extended by asking about which friends
were most important to them – school friends, friends from different schools or a mixture of both (see Table 60). Approximately a third indicated that school friends were most important, a slightly higher proportion (37%) indicated that all friends were important and approximately 5% indicated that their out of school friends were more important. Levels were consistent across the two year groups studied but varied by gender. Boys were slightly more likely than girls to report that their school friends were more important to them (40% vs 30%), (χ2(5)=21.54, p=.001). This may reflect the earlier finding that boys were more likely to meet with school friends.
The findings for 2017 are broadly comparable to those in 2006, though in 2006 an age difference seemed to be apparent with the older (Year 10) pupils more general in their answer, in the sense that they were more likely to say that all friends were important and less likely to say that just school friends were important. Interestingly, though, at Year 10 there was a gender difference also observed in the 2017 data (χ2(5)=19.6, p=.001) with boys more likely than girls to say that school friends were more important to them (40% vs 30% respectively), and girls were more likely to say that all friends, either school or non-school, were important to them (40% vs 35% for girls and boys respectively). Table 60. Views on which friends are most important to them
Which friends are more important?
School friends
Outside of school friends
Some school friends and some non
All friends equally
Neither group are important Other N
2017
Boys 40% 3% 15% 35% 4% 3% 441
Girls 30% 6% 21% 40% 1% 2% 452
Year 8 32% 5% 19% 38% 3% 3% 498
Year 10 36% 4% 18% 37% 2% 3% 419
Total 34% 5% 18% 37% 3% 3% 917
2006 Year 8 45% 10% 13% 32% 0% 0% 408
Year 10 29% 5% 17% 46% 1% 2% 371
Total 35% 5% 15% 43% 1% 1% 779
3.2.6.8 Summary In relation to questions about social life after school, a majority of primary pupils but a minority of secondary school pupils indicated that they attended after school clubs and clubs outside of school. There has been a marked decline in the attendance of after school and out of school clubs in the 10 years since the previous survey in 2006. Nevertheless, the types of clubs that pupils are most likely to attend are much the same and largely involve team and other sports and music and specifically in relation to out-of-school clubs, youth organisations (e.g. Brownies, Scouts etc). The large majority of pupils, particularly older students, reported that on the preceding day they had gone straight home. Fewer pupils than in 2006 reported that they went to a friend’s house after school and in terms of activities after school, fewer pupils than in 2006 indicated that they played or met with friends. TV viewing/playing on devices has overtaken activities with friends as the principle after school activity.

83
Findings also show that in terms of meeting up with and socialising with peers outside of school, there has been a marked decline since 2006 in terms of the proportion of pupils that regularly meet with peers outside of school and an associated increase in the proportions of students that rarely meet with peers outside of school. This finding is important and highlights that school is increasingly the main, and in some cases the only, context where young people get to socialise with peers and friends of their own age.
Results also show, consistent with the findings for the 2006 survey, that the vast majority (85%) of pupils felt that it was important for them to meet with and be with friends in school and less than 5% indicated that it was not important. However, it was also found that pupils were less likely than in 2006 to report that it was true that they had lots of friends in school. In 2017 they were more likely to report that it was not true.
4 Discussion The BaSiS project had three main aims. Firstly, it set out to collect current information on the nature, duration and organisation of school break and lunch times in primary and secondary schools and staff and pupils’ views on these times. Secondly, it examined pupils’ views and experiences of social life in and out of school. Thirdly, it provides a long-term analysis of trends by comparing findings with those from our previous surveys undertaken in 1995 and 2006. This study is unique and significant in providing a comprehensive understanding of the nature and length of a little understood part of the school day, that of break times in primary and secondary schools. To our knowledge there is no other research that provides systematic data on the nature and length of breaktimes either nationally or internationally. Even in publications such as the OECD (2017) ‘Education at a Glance’ guides and other recent publications (Beresin, 2016), national and international data on the nature and length of recess/ break times is largely anecdotal or based on relatively limited evidence. This study is also rigorous in its approach to data collection being based on data systematically collected via a random sample of over a thousand schools in England covering the primary and secondary phases of education. A further original feature of this research is that it provides a long-term perspective based on the information collected at three distinct time points each separated by approximately 11 years to provide an overall and historical view of the nature of and changes to break times in schools over a 20 – 25-year period and the relative importance of these times in children’s social lives. Our findings show that there have been marked changes over this period and that these have important implications for pupil’s social development and mental and physical health and significant implications for educational and social policy.
In this section we summarise and discuss findings in relation to the key areas covered by the study and in relation to current issues in education. Recommendations for future work are provided through the course of the discussion. The section ends with some conclusions and recommendations for policy and practice in terms of school breaks and the social lives of young people in primary and secondary schools.
4.1 The length of breaktimes The survey of schools showed that break and lunch times are a universal experience in primary and secondary schools. There were no instances of schools that did not allow at least some time for pupils to have a break. In state funded primary schools the average total amount of time for breaktimes (including lunchtime) is 85 minutes per day at KS1 and 76 mins per day at KS2. In secondary schools the average total amount of time devoted to breaks (at KS3 and 4) was 63-64

84
mins. Breaks made up 22% of the school day at KS1, 19% of the school day at KS2 and 16% of the school day at KS3 and 4. Nearly all schools had 2 breaks in the school day – usually morning and lunch breaks - and a few had 3 breaks. There were a few schools with alternative arrangements – e.g. more shorter breaks – but these were relatively few in number. Morning breaks were on average longer in secondary schools than in primary schools but in turn lunchbreaks were much shorter in secondary schools than in primaries. A break in the afternoon was extremely rare in secondary schools and rare at KS2. However slightly more than half of primary phase schools reported an afternoon break at KS1. In the last survey in 2006 we found that there had been a reduction in the lengths of breaks since the first survey in 1995. In the 2017 survey we have found that this trend has continued: primary pupils in 2017 experienced 40-45 mins less breaktime per week than in 1995 and secondary pupils experienced over an hour (65 mins) less breaktime per week. In relation to 2006, KS1 and secondary school pupils get 30mins less per week and KS2 pupils get 10 mins less per week. There has been an interesting trend in secondary schools for morning breaks to have been slightly extended over time with more schools moving towards a morning break of 20 minutes, perhaps to compensate for shorter lunchbreaks, though this extension is minor and has had very little impact on the overall duration of breaktime.
The areas where breaks have been eroded are twofold. Firstly, the afternoon break has been further eradicated: fewer primary schools offer these to KS1 and 2 pupils compared to 1995 and 2006. In 1995, KS1 pupils in 70% of schools had an afternoon break but this has by 2017 dropped to 54% of schools. At KS2, 42% of schools had afternoon breaks in 1995, but now this is 15% of schools. In addition, 13% of secondary schools offered afternoon breaks in 1995, now the figure is closer to 1%.
Secondly, there has been a further shortening of the lunchbreak. At KS2, in 1995, 30% of schools offered pupils a lunchtime of more than an hour. This is now 6% of schools. At secondary level, in 1995 one in ten schools had lunches of less than 45 mins, in 2017 this is now half of secondary schools and nearly a quarter of secondary schools have very short lunchbreaks of up to 35 mins.
There is then good evidence of an historical trend over the past 30 years for the duration of break times in schools to have declined. This means that there is a marked reduction in the time that children and young people in primary and secondary schools get to meet and make friends and engage in play or activity of their own choosing.
The principal reasons given for shortening breaks seems to be to provide more time for teaching and learning and to reduce behavioural incidents and to assist with the management of behaviour. These themes are much the same main reasons identified in the 1995 survey (where many schools were concerned about bullying and providing more time for learning) but this time to make further cuts to the length of breaktimes. These reductions are concerning since they are at the expense of important time for a brief pause in the school day, for play, recreation and socialisation with friends and peers, for physical activity and eating food in a leisurely and relaxed social environment.
4.2 Pupils’ views on breaktimes and its duration The pupil survey allowed us the unique opportunity to compare their views with school policies on breaktimes. In response to questions about how much pupils liked break and lunch times, there was an overwhelmingly positive response with 80% indicating that they were positive about it and only about 5% of pupils indicating that they disliked these breaks. This level of liking was higher than in relation to other parts of the school day asked about in a similar way (e.g., in relation to mealtimes and liking of school where the level of liking was lower and dislike a little higher). The vast majority of pupils therefore value breaktimes in school. These findings were almost identical to those of ten

85
years ago in 2006, and to even earlier surveys of pupils’ views (Blatchford, 1998), showing pupils have consistently liked and enjoyed breaktimes over time.
But pupils were also very clear in terms of their view about the length of breaks. A majority of pupils said that they felt that lunch time breaks should be extended (55%) while only a very small minority (2%) felt that it should be shortened. This stands in stark contrast with the actions of schools to shorten break times overall and especially the lunch break and suggests that pupils at least feel that they do not have sufficient time to engage with each other in free activities. It may not be unexpected that young children want more time to play, but surprisingly the view that lunch breaks need to be extended was more prevalent amongst older students (i.e., those at secondary school). This might be explained by the fact that lunch breaks are the shortest and have been most severely cut back. This suggests there is a strong connection between the reductions made by schools and pupils’ views and other findings that 40% of secondary school students felt that there was insufficient time to eat at lunchtime - an increase on the figures when asked the same question in 2006. Clearly secondary school students value lunchbreaks and wish that they were longer. In our report on the last survey in 2006, following reductions in the duration of lunchbreaks since 1995, we suggested that in some schools they had become too short. What we have seen in the 2017 survey is a further reduction in these times! This is despite pupils’ views and despite the implication that for some these will not allow sufficient time for the basics, for something to eat and a comfort break – let alone time to meet with friends to engage in some form of recreation. The clear implication is for serious questions to be asked about whether lunchbreaks at secondary level are now too short.
4.3 The importance of friendships in school An important area of the pupil survey related to their views on friendships in school. Similar to the views on liking of breaktimes, the vast majority of students felt that it was important to have time with friends in school. This view seemed to get stronger with age, possibly because once they get to secondary school there are more occasions where young people are not with friends (e.g., due to shorter breaks and more staggering of breaks, ability grouping in classes etc.), though also possibly because friendships take on an increased significance during adolescence (Bagwell & Schmidt, 2011).
Children and young people were also largely positive about having lots of friends in school, with only about 10% of pupils indicating that they felt it was not true that they had lots of friends in school. It is somewhat difficult to interpret what the results for this question mean given subjective nature of the notion of friendship. We argue that whether it reflects the reality of the situation or not, answers to this question do reflect the level of subjective confidence one has in friendships in school. Compared to the results for the same question in 2006, students at secondary school in 2017 appear less positive about having lots of friends. Proportionally fewer students indicated that they thought this was definitely true and nearly 1 in 10 thought this was probably or definitely not true – much higher than the 4% that expressed this view in 2006. These findings may reflect increased feelings of fragility or uncertainty in relation to friendships, possibly due to the reduced face-to-face time that young people have with their friends and peers. They may reflect reduced opportunities to spend time with friends in school and outside of school (to be discussed later), or due to possible insecurities in relationships prompted by social media. A similar decline since 2010 in happiness with friends was reported by the Good Childhood Report (2018). Further research may be usefully directed at examining peer friendships, social support and individual mental health needs.

86
4.4 Withholding breaks We started this discussion by indicating that breaktimes in primary and secondary schools are a universal experience. There are, however, times when pupils either miss a break through their own choice or more frequently because they are prevented from having a break. In both the school and pupil surveys we wanted to find out more about these times and the reasons why children missed breaks. To ensure we avoided misleading information about children being only slightly late outside of class, we asked schools only about those times when pupils missed a full break or lunch time. We were surprised by the results. Just over 60% of primary schools and just under 60% of secondary schools admitted that there are times when children may miss a full break or lunch. The principal reasons given for missing a break were most likely to be as part of a punishment for poor behaviour in class and/or during break or to catch up with class work or home work. Poor behaviour in class was the main reason in 90% of secondary schools and 84% or primary schools where pupils missed breaks. Secondary schools were more likely than primary schools to indicate catching up with class or homework, attendance at sports competitions and attendance of adult led clubs as reasons to miss a full break. A number of schools added that this was part of the school’s behaviour policy. The results of the pupil survey provided further insights into this matter with 77% of Year 5 pupils and 88% of Year 10 students reporting that they had at some point missed out on their break time. The main reason given by half of pupils was because others had misbehaved in class and a sizeable portion (28%) indicated it was because they had misbehaved in class. Around a quarter of pupils also indicated that they had missed out on breaks to complete class and/or homework. We think these findings are troubling. It understandable that schools feel the need to have behaviour policies and to have consequences to impose on pupils when they are disruptive or poorly behaved. The problem, however, is that it is very likely that those children who have behaviour and/ or social difficulties, or who are struggling at school, will be repeatedly prevented from having a break and spending time with peers and friends because of these behavioural sanctions. It is also likely that these are the young people that may benefit most from greater social contact with peers, and they are unlikely to become better behaved through being excluded from such contact. Those with repeated experience of missing breaks may find that their relationships with peers suffer as a result. The key question, though, is whether this practice, or the threat of it, really makes a difference to children’s behaviour, and whether in the long run it is counter-productive. Some research evidence suggests that this approach is an unproductive sanction with little positive effect on academic performance and a negative effect on student-teacher relations (Payne, 2015). Similarly, a policy statement from the American Academy of Pediatrics (201315), based on a review of research, states that breaktimes should not be withheld for punitive or academic reasons. It is of particular concern that there are times where teachers prevent a group/class of pupils from having a break due to the poor behaviour of one or two individuals. This may serve to pit children against each other, may exacerbate resentment, negative and mean behaviour directed at peers which of course is more likely to take place outside of class time, on the playground, or even outside of school (e.g., on-line). These are the very things that some schools say that they are trying to eradicate when they shorten break times. Children who have missed a break may thus get less physical exercise, time to play, be more resentful of or disrespectful towards their teachers and as a consequence be less likely to be able to concentrate in class. Those children missing a break to catch up with homework or classwork may become more tired and distractible. The overall result is that, although done with the best of intentions, the withholding of breaks as a sanction may result in some pupils becoming even less engaged with school, may increase negative behaviour towards peers and reduce respect for the teacher. The broader policy context is important. In the absence of clear policies or legislation about student entitlements to breaks (though, due to employment law, not the case for staff), some 15 This policy statement was subsequently reaffirmed in August 2016, see http://pediatrics.aappublications.org/content/138/5/e20162595

87
children may have few, or even no breaks, in a school day or over the course of a week. Though possibly rare, there are questions, as above, about whether this practice is effective or appropriate, but we also query whether it contravenes article 31 of the UN Convention on the Rights of the Child, to which the UK is a signatory. This is an issue that needs further research and wider debate but has clear implications for policy. Nevertheless, a main way to meet the requirements of Article 31, in terms of children’s right to relax, play and engage in other recreational activities, and other aspects of the convention, is to ensure that all children have an opportunity for an extended period of break time in each school day.
4.5 The value and problems of breaktime It is important to highlight here that the main reasons schools give for abolishing or reducing the length of breaks was to free up time for coverage of the curriculum and for more learning. This strongly highlights, maybe not surprisingly, that the main priority of schools is formal coverage of the curriculum and learning over and above the opportunities offered during break times. As we have seen this priority and government pressure to enhance progress has led schools to introduce more curriculum opportunities (in the form of clubs) both during break and lunch times and after school. Whether these clubs are optional for pupils is unclear. This provides a backdrop for asking about what school staff see as the value of break and lunch times.
When asked about the main value of breaktimes, the three most common responses from primary schools were the opportunity it provided for the release of energy and physical exercise (86%), for socialising with peers (84%), and the opportunity it provided to get fresh air (54%). In contrast to primary schools, in secondary schools the most common value of breaktime is that it provides an opportunity for students to eat and drink (71%), followed by time to release energy and get exercise (57%) and time to socialise (57%). What stands out, then, when comparing primary and secondary schools is the more functional view of breaks at secondary level as times for students to eat and drink and to a degree time for energy release, with less priority given to the social opportunities it provides. There was a degree of similarity between results for the 2017 and the 2006 surveys but marked difference with the 1995 survey. The first survey asked the question in quite a different way thus rendering the findings difficult to compare with the more recent surveys. Looking only at the changes since 2006, the proportion of schools in 2017 that identified breaktime as an important opportunity for pupils to get fresh air is double that in 2006. This might be in the light of recent concerns in the press, at the time of the survey, about how levels of pollution in inner cities were leading some schools to have breaktime indoors (Campbell & Halliday, 2014; City Matters, 2017) and campaigns by the National Trust, Project Dirt and OPAL (Outdoor Play and Learning), among others, to raise the profile of time spent outside playing and learning (e.g., Prisk & Cusworth, 2018). It might also reflect thinking about fresh air having a restorative function relative to concentration and re-engagement in class. By contrast, pupils’ responses to a similar question showed that the overwhelming majority of them valued breaktimes first and foremost as the opportunity it provided them to socialise with friends (86%). A majority of pupils also valued it in terms of the free time it afforded (62%) and the opportunity it provided students to eat and drink (48%). Primary pupils also valued the time it offered for playful activities. The positioning of time with friends as the most important value for children contrasts with the view of schools, though particularly with the largely functional view expressed by secondary schools of breaks as a time to eat, release energy and get physical exercise. We suggest that the important social function of time spent socialising with peers, whilst acknowledged, is undervalued by schools. For many pupils, these times represent the only regular time that they get to spend with friends where they can engage in activities of their own choosing and in a sustained way.

88
Schools and pupils were also at odds in their views in relation to physical exercise. This was highlighted as the most popular value of breaktime by staff at primary level and the second main value expressed by secondary staff but this came very low down on pupils’ list of values. This was particularly the case amongst secondary age groups, with only 16% highlighting it as a best thing about breaks. Changes in pupils’ views since the 2006 survey show that in 2017 they were half as likely to identify physical exercise as something they enjoyed about breaktimes. Subsequent questions in the pupil survey also showed that more than half of all pupils indicated that they were not physically active during breaks and this was particularly the case for secondary students and for girls. There is much research that tracks the decline in interest in physical activity beyond primary school. Pupils’ reduced valuing of breaktime as a time for physical exercise is of concern relative to recent efforts by schools to increase levels of physical exercise and in the light of ongoing anxieties about an obesity epidemic.
A reason given for shortening the length of breaks in some schools was to enable more physical exercise. This aim is understandable in the light of health concerns and the reluctance that some children have for engaging in physical activity and sport, but we argue that it is likely to be counterproductive to replace a part of the day that children value with more PE. Research in the US in the 1990s indicated that many schools had abolished recess in favour of more structured PE lessons without consideration of the potential consequences of this policy for children’s social development and learning. There are some suggestions that schools in the US are beginning to re-assess this policy (Jarrett, 2016), though the evidence is limited. Research on playgrounds in primary schools has indicated that the physical activity that many children spend the time engaged in with their peers can provide up to 40% of children’s daily exercise requirement and that this can be increased through careful playground design (Ridgers et al., 2006). At secondary level this may be difficult, given the shorter time periods and absence of space, resources and facilities available to support physical exercise via a range of activities. Abolishing breaktimes will mean that pupils will lose a valuable opportunity for physical exercise or in cases where breaktimes have been replaced by structured physical exercise – children will lose important informal opportunities to socialise freely with peers.
An area where schools and pupils were to a degree in agreement was the valuing of breaks as time for eating and drinking. This is also an area that had increased in prominence amongst school and student responses relative to 2006 data. This may reflect recent attention and campaigns to improve the quality of school meals and mealtimes. We know from our other research that pupils value mealtime experiences because these are further social times to spend with friends and that their joint experiences may be enhanced through enjoyable experiences of food (Baines & MacIntyre, forthcoming).
Overall, despite the overlap between schools and pupils, in views on the value of breaks as important times for eating and drinking, there is otherwise a disconnect between school staff views about the principle value of breaks and the things that children see as most important about break times. As we have highlighted the danger here is that schools reduce these times that are of importance to pupils, to do more of the things that are valued by staff and the school. We also found that a large majority of primary and secondary schools said that there were concerns and challenges with break times. Independent schools were much less likely to say there were challenges at breaktime, and there was an indication that approximately 20% fewer schools experienced challenges in relation to breaktimes in 2017 compared to 2006. Of those reporting challenges, the poor behaviour of certain students has remained the main concern for primary and secondary schools over the years. Also of concern were the overcrowding in the dinner hall and outside, and the quality of supervision at breaktime – issues that were also main challenging areas in 2006.

89
In terms of the problems that pupils identified with breaktimes, there was agreement with school staff that the main problem is the behaviour of certain pupils at breaktime, which a quarter of secondary school students and a half of primary school students raised as a problem. Other main concerns were for the lack of things to do, activities being banned/ not allowed, and at secondary level in particular, insufficient time to eat and drink and that the school grounds need improvement. There was therefore some consistency in school and pupil views on the challenges of breaktimes. Although both students and schools highlight the problems associated with the behaviour of a few students, it is important to note that this has not affected pupils’ very positive views of breaktimes and has not led them to suggest breaktime should be shortened. By contrast, schools highlight problem behaviour as a main reason for cutting back on breaks and preventing children from having a break (see ‘withholding breaks’ above for further discussion of this issue). We suggest that such strategies function to avoid the problems rather than deal with them directly and that these issues are likely to continue, if unchallenged, at other times, usually when children are outside of school or even online, where they are even harder to address. We suggest that there may be more positive and proactive approaches to dealing with these issues that bring the social, behavioural and moral dilemmas that face children on a daily basis into discussions within school.
Schools’ concerns about the overcrowding of the dining room and pupils’ concerns about having sufficient time to eat, again speak to the problem of the length of lunchtime at secondary level. The poor behaviour of some pupils might even be connected to the pressures on time to eat and overcrowding. These problems may be easily resolved by extending lunch times to ensure that they are more positive, leisurely social times where students can benefit from the time (e.g. for relaxing or getting physical exercise in the company of peers).
The concerns amongst pupils about the lack of things to do, the banning of activities and the poor state of school grounds at secondary level may well be related. These tie in with concerns expressed by schools, particularly at secondary level, about the suitability of the school grounds for breaktime activities and the generally lower quality of secondary school facilities and outdoor areas highlighted by secondary schools. It is likely that the largely functional view held by secondary schools along with short breaks and pressure on canteens has led to restrictions on time and freedom to engage in the activities that students want to engage in. Having dull, limiting and uninteresting playground spaces may mean that children do not make good use of their time and do not explore their interests in positive and constructive ways. Despite widespread reports of clubs and activities running at break times, there is a question about how regularly these run and whether, at secondary level at least, there is sufficient time for students to participate as well as have a meal and some time to socialise. There is also a sense, to be examined later in the section on supervision, at secondary and primary levels that supervision has increased, become more restrictive of what pupils are allowed to do during their breaks. It may be that this is due to well publicised concerns about safety.
Our findings show that schools could do more to address the needs and interests of children during breaks, to provide a range of positive opportunities, resources and activities for children to engage in. While important to acknowledge the different socio-economic circumstances of pupils in state and independent schools, it is interesting that many independent schools, that often offer an array of organised activities during longer break times that students can opt in to, indicated that there were few challenges at breaktimes. It is possible that in independent schools the wide range of activities on offer enable students to explore their interests and to try out new activities. State funded schools could do more to consider how break times and school playgrounds can be resourced and harnessed to help children to develop skills and to explore interests and activities of interest to themselves. There are many organisations (e.g., OPAL, Learning Through Landscapes, Scrapstore, among many others) that work with schools to provide resources and advice on how to make more of playground spaces to enhance positive playful activities and interactions as well as to

90
encourage physical exercise play. Schools could also do more to consult with pupils about the activities and spaces that they want.
4.6 Behaviour at breaktimes and out of school We have seen that one of the main perceived problems at breaktime, identified by staff and pupils alike, was the poor behaviour of certain individual pupils, who had problems socialising. This concern is something that has quite understandably impacted on school policies and management of breaktime. But in response to more specific questions about behaviour at breaktime it is notable that across all schools the majority believed that behaviour at breaktime over the past five years had either improved or stayed the same. There were differences between primary and secondary schools with primary schools more likely to say that standards of behaviour had improved and secondary schools more likely to say that behaviour had stayed the same. Furthermore, there were changes over time with more school staff in 2017 reporting a belief that behaviour had improved over the past 5 years and fewer reporting that it had declined than in 2006 or 1995. These views contrast with views on behaviour out of school, where a higher proportion of schools believe that behaviour outside school has stayed the same or declined and few saying it had improved. Nevertheless, it is interesting to note that in relation to the previous surveys, far fewer schools (20% fewer approx.) in 2017 compared to 2006 believed behaviour out of school had declined in the past 5 years and far more said they believed it had stayed the same. In comparison to 1995 around 30% fewer schools expressed the belief that behaviour had declined and more than 20% said it had remained the same.
In terms of the reasons given for a perceived decline in behaviour outside of school, many cite concerns about pupils being less respectful, a finding consistent with our previous surveys. School staff also highlighted concerns about the social competence of pupils and aggression and behaviour. Over time, and particularly in secondary schools, the perceived decline in behaviour is less likely to be attributed to aggression and the behaviour of certain individuals and far more likely to be attributed to pupils being less socially competent. It is unclear why this attribution has changed but it may have something to do with improved school policies on bullying and changing thinking in public discourse about the difficulties that young people face (e.g. in the light of increasing engagement with phones and devices).
It is difficult to account for differences in school staff perceptions of behaviour at breaktime and out of school. One big question must be over the accuracy of school staff judgements of pupil behaviour out of school, given that they are unlikely to have detailed knowledge of this. It is perhaps more likely to perceive behaviour to be worse out of school when in general one knows very little about it, except on the small number of cases when school staff are aware of misbehaviour. Interestingly, the difference in perceptions of behaviour in and out of school was also evident in the previous surveys, and the explanation advanced following the first survey in 1995 (Blatchford & Sumpner, 1996) may still hold, that is, it is possible that staff perceptions reflect their own position with regard to control over pupils. What we mean here is that a perception of behaviour improving at breaktime may reflect schools' responsibilities for it, and perhaps efforts to improve it, while it is easier to see that behaviour out of school has declined because it is not under their control and can be attributable to external factors (e.g., parenting and home circumstances). There may therefore be what psychologists call an attributional explanation for these data, in the sense that we tend to view more positively those things over which we have control and responsibility (and perhaps more knowledge), while we are more negative about those factors over which we have little control or responsibility (and perhaps knowledge). From this perspective changes in the attribution for poor behaviour outside of school from aggression to poor social competence may also reflect changing thinking about the nature of the difficulties that young people face.

91
Yet there is also the possibility that school staff may be accurate in their beliefs that behaviour out of school has largely remained the same or seen some decline, while in school it has remained the same or improved. If the latter is true, it may mean that the efforts on the part of schools to encourage pupils to be better behaved, along with their policies relative to bullying, attendance, breaktimes and opportunities to go off school premises during school hours (see later) and access to specific indoor areas is having an effect. It may also reflect the increase in adult supervision and adult led activities within school or the improvement in the quality of playground spaces. It might also be suggested that reductions to the length of breaktimes may have led to improvements in behaviour. However, this is unlikely to be the case because, where the reductions and changes to breaks have been strongest in 2017, that is in secondary schools, the prevalent view is that behaviour at break time has not changed. Either way, schools have made many changes and single factors, or their combination, may account for school staff views on behaviour. The results presented here on behaviour in and out of school are clearly open to interpretation; more research is required on pupils' social lives and behaviour out of school, against which to compare staff perceptions.
4.7 Supervision and organisation of breaktime and going off site The survey showed that the overall numbers of pupils to teachers and support staff were nearly twice as high (i.e., more pupils per adult) during lunchbreak in secondary schools compared to primary schools, but for morning break ratios were at similar levels. In primary schools, support staff were the main supervisors at morning and lunch time breaks, and at lunchtimes they outnumber teachers by more than 7 to 1. At secondary level, teachers were the main adults involved in supervision – outnumbering support staff by about 2 to 1 or more. Support staff were most likely to be involved in playground supervision in state funded schools and much less likely to be involved in supervision in independent schools, where teachers were the main providers of supervision for both morning and lunchtime breaks and particularly at secondary level.
An important result from this study is that since the last surveys in 1995 and 2006 there has been a substantial increase in the numbers of adults supervising at breaks both at primary and secondary levels. We have here to separate out teachers and support staff. While at primary level the numbers of teachers supervising has only increased slightly, at secondary level they have nearly doubled since 2006. Over the past two decades there has been a marked increase in the number of support staff in schools (Webster & Blatchford, 2018), and at primary level they are now the main supervisors at break and lunch times. At secondary level there are more support staff involved in supervision during morning breaks and levels seem to have increased slightly for coverage of morning breaks but has remained the same in relation to lunch breaks. It may be that support staff are deployed differently in secondary schools, at least in relation to lunch times.
This increase in adult supervisors at breaktime means there are fewer pupils per member of supervising staff, particularly in relation to morning break times. In 1995 in primary schools there were on average 86 pupils per supervisor, in 2006 this had reduced to 67 and in 2017 this figure has reduced further to 52 pupils per adult supervisor. A similar reduction is observed in secondary schools for both morning and lunch breaks where ratios have nearly halved since 2006. We need to be careful as the figures here may not take account of staggered breaks and lunch times, though this is unlikely to have much affected the overall trend over time. These findings are surprising and may be part of a response to ongoing concerns about inappropriate behaviour, and potential bullying amongst pupils at break times and concerns about safeguarding and health and safety of pupils. This might also be a result of the increased availability of adult support staff in primary and secondary schools as well as changes to school meal policy (e.g., universal access to free school meals for all KS1 pupils) which may have required further adult supervision to ensure timely throughput of children in the school dining areas.

92
As discussed earlier, this increase in supervision at breaktime might help explain why schools are now more positive about pupils’ behaviour at breaktimes. However, it is likely that this increase in adult supervision will lead to reduced freedoms for children, more reprimands and enforcement of rules in the light of concerns about ‘health and safety’ and inappropriate’ behaviour and this may explain pupils’ concern that many activities which are enjoyable are banned. One point to arise from the pupil survey is that although pupils themselves see that there are some problems at breaktime, they do not generally feel that there is a need for more adults to supervise them at lunchtime. Indeed, most thought the number was about right and a fifth thought there were already too many adults supervising them! A similar pattern was also found for the 2006 survey which indicates that it is certainly not the pupils that are calling for more supervision! In the light of debates about the importance of more adult directed activity (at least at primary level, and also secondary level – Margo et al. 2006), recent interest in and claims about the value of structured break times, where pupils are offered and must choose one from a set of activities, (Burgess, 2016) and of play workers that facilitate play, we asked new questions on the school survey about the nature of supervision during breaktimes. The majority of schools both primary and secondary reported that adults ‘supervised at a distance’ and that pupils were able to engage in self-chosen activities. Nearly half of primary schools arranged (formally and/or informally) adult led activities for pupils to participate in if they wished. Examples of this might be football, group skipping, physical exercise (e.g. daily mile or running club) and other clubs, or coordination of access to trim trails and climbing frames. Very few (2%) primary schools reported that their arrangements were along the lines of structured breaks where pupils were required to choose which activity to engage in. There are no data from previous surveys relating to the nature of supervision, so it is difficult to know whether this is an increase or not. However, given the slight increase in the provision of adult led clubs during breaktimes this may imply an increase in the offering of adult led activities though pupils are still allowed the freedom to choose to participate or not. Training and support of supervisors In the school survey we also asked about training and support for breaktime supervisors. Primary schools offered a combination of informal and formal approaches to support and training. The main informal approaches were regular meetings with supervisory staff and discussion as and when the need arose, but a large portion indicated that more formal training had been provided by private organisations or the local authority. Secondary schools, on the other hand, seem to limit training and support to more informal approaches through a fairly reactive ad-hoc mode of discussions and meetings ‘as and when required’, along with ‘discussions of job descriptions’. Nearly a fifth of secondary schools indicated that there was no training provided for supervisory staff. This is surprising as nearly a third of secondary schools also highlighted supervision as one of the main challenges at breaktimes. But this pattern is also perhaps consistent with the notion that secondary schools see breaktimes largely in functional terms as a time to eat, for release of energy or exercise and some fresh air before lessons resume in the afternoon. The 2017 findings are broadly similar to those reported in 2006, although there has been a reduction in supervisor training from LAs (presumably following the reduction of LA services and schools working with LAs), with only a very slight increase in its provision by private companies, and an increase in ‘no training’.
It can be difficult for schools to recruit and retain breaktime supervisory staff and this may mean that schools need to have a constant cycle of supervisory training. There can also be difficulties in getting support staff in for training and discussion – a problem made more difficult because it can involve attendance during their own, unpaid, time (Blatchford et al., 2012). There is also a danger of blaming supervisors, and questioning the quality of supervision, when the rates of pay and conditions of service of support staff are not necessarily sufficient to provide quality supervision. However, given

93
that breaktime, as we have seen, still takes up a sizeable part of the school day, we argue that supervision needs to be seen as important and worthy of as much planning and forethought as that given to supervision and teaching within the classroom. This would enable supervisors to strategically facilitate positive and constructive breaktime experiences that contribute to children’s development, that enable and support inclusion and ensure that staff know how to deal with conflicts, rule breaking and mean or unkind behaviour in a strategic fashion.
4.8 Activities at breaktime We also asked schools about activities that are available for pupils at breaktimes. This includes a wide range of opportunities provided by the school (informally or formally by supervisors) or by specialists coming in to school (e.g. play workers, music teachers etc.). The large majority of primary and secondary schools (approx. 87%) indicated that they provided activities for pupils at break and lunch times and that this had increased slightly since the 2006 survey. The most frequently cited activities were music and sports (team or individual sports) in both primary and secondary schools. Curriculum support/homework clubs were also prevalent across both phases of education. Secondary schools also offered clubs associated with computing/IT, drama/dance and art/design/crafts/cookery. It is unclear from the data how far these were formally organised activities and whether these ran all year round or were one-off activities offered at a certain point in time. Apart from a slight increase in the proportion of schools offering activities during breaktimes, there have been changes since 2006 in the activities offered. Particularly noticeable was a decline in the number of schools reporting that they offered opportunities for computing/IT/ coding and competitive board games such as chess. The decline in computing/IT/coding clubs might be due to its improved coverage within the national curriculum (from 2014). There was a noticeable decrease since 2006 in the proportion of secondary schools reporting curriculum support/homework clubs at breaktime but a marked increase in these sorts of clubs offered at primary level. It is also notable that there has been an increase in curriculum support/homework activities after school – at both primary and secondary levels. This increase is consistent with anecdotal reports of primary schools using breaks (and time after school) to help prepare pupils who are struggling academically for exams and Key Stage tests. The reduction in curriculum support activities at secondary level may be simply because there is not sufficient time during break to provide these activities and because of increased provision of such activities after school which does allow for longer sessions.
The pupil survey indicated that 9% of pupils that attended clubs during breaks attended homework clubs. In key examination years the figure might be higher. It is unclear from the results how far these clubs were optional and it may be that some pupils are required to attend them, for instance if they have not completed their homework or if they are struggling in their academic work. It might also be the case that some pupils that find it difficult to do homework at home use these times constructively, but this may prevent them from having a break at all and limit their ability to attend in subsequent lessons. The increase in curriculum support activities during breaktime at primary level is of concern. Pupils who attend these activities are missing out on what they themselves see as necessary and enjoyable breaks from the intensities of classroom learning, and an inadvertent consequence of this may even be they find it harder to focus on their studies later in the school day. This view is based on evidence that break times are important for engagement, attention and behaviour after the break (Barros et al., 2009; Pellegrini et al., 1995; Pellegrini, 2005) and the longer that pupils are required to concentrate and learn the more counterproductive this might be (Jarrett et al., 1998; Pellegrini et al., 1995). It is also of concern as these students may miss out on important social opportunities to engage with peers and friends. In some cases, the pupils who miss out may be

94
those who really need opportunities to develop socially. There may even be implications for children’s mental health and wellbeing since it is likely that those who are struggling academically or to complete homework at home may also be those that need social support from friends. The pupil survey also provides insights into the activities and clubs that pupils engage in at breaktime. While over two thirds of primary children indicated that they attended organised activities16, over two thirds of secondary students said that they did not attend such organised activities. It is unclear whether students choose not to attend clubs because they are not available, because they don’t appeal or because students would rather spend their time socialising with peers and friends. The concern among students about the lack of things to do at lunch time suggests that what is on offer may not appeal. On the other hand, general concern is that in order for pupils to pursue further learning opportunities (e.g., in music, sport, art, drama) they must forgo their break and time to socialise with peers. This again means that some students are getting less breaktime than others. Schools could think carefully about offering these opportunities as part of the formal school day or an extended school day. Schools may well benefit from working more closely with the student body, making the most of student voice, to identify the activities, resources and the nature of playground space that pupils want.
4.8.1 Access to mobile devices at school and during break As part of an interest in activities at break and lunch times, a question new to the 2017 survey and reflecting recent changes in technology and culture, was whether children were allowed to bring mobile devices to school and whether they were allowed to use them during breaks. This is a controversial area. In the school survey, the majority of primary schools indicated that pupils were not allowed to bring mobile devices to school and when they were allowed the devices were often held in the school office at least until the end of the school day. The situation in secondary schools was very different with only a quarter of schools indicating that mobile devices were not allowed in school. Given concerns in schools about cyberbullying, it was surprising that two fifths (42%) of schools that allowed mobile phones to be brought to school indicated that they could be used during breaks and 16% indicated that they could be used during mealtimes. Allowing the use of devices and phones during break times may mean that unkind behaviour and bullying may be harder for schools to police and to address. A number of high profile government ministers, including the chief inspector of Ofsted have indicated that mobile devices should not be allowed in classrooms or schools, but fall short of saying there should be an outright ban in school as a whole including at breaktimes (BBC, 2018). There have also been concerns about children’s game play on devices and how these might be related to mental health (in fact the World Health Organisation has recently classified device game play addiction as a mental health problem – Wakefield, 2018). If children are allowed greater access to devices during breaktimes this may become even more of a problem. On the other hand, there is a sense in which the problems associated with young people using mobile technology may be overstated and that in many respects young people use mobile technology for largely benign or positive social activities. Such devices have also become a common part of everyday life and in the light of the increased availability of a range of wearable technologies, it may be impractical to ban them. But there are also ways in which devices and new technologies might be usefully brought into playgrounds and during break times to enable pupils to engage in and develop new activities as well as re-development of more traditional games (Burn, 2014). There may be organisations that are interested in developing innovative ways of harnessing technology to provide opportunities in ways that are acceptable to the school and parent community. Game play
16 There is some question about the reliability of the findings for primary pupils. Although the question specifically asked about adult organised activities, Year 5 pupils may have interpreted it as asking about the activities they ‘play’ at breaktime rather than more formally organised adult led activities.

95
on devices during breaks in the school day may be a positive way to support the development of friendships and acceptance (e.g. amongst children who struggle to develop friendships, such as those with SEN). Console games have been, for a long time, a main topic of conversation and inspiration for imaginative play during breaks and at mealtimes, particularly amongst groups of boys (see Baines & Blatchford, 2011) and can sometimes be a reason for some children to be less accepted by peers (e.g., if they are not allowed devices/ access to certain games). Allowing supervised and supported access to games where peers and friends are involved during break or lunch times, and in certain circumstances, may lead to positive game use and gaming practices. There is therefore a need for further public debate, carefully considered school policy as well as research on the availability and use of mobile devices during break times for example as a source of distraction or conflict with staff and peers but also in terms of what they offer children in terms of social engagement and activities between peers.
4.8.2 Freedom of movement during break times The school survey asked questions about the freedoms that children have to move in and out of the school building during breaks, including during wet break times. Differences were evident across school phases in terms of access into school buildings during school breaks. We found that most primary schools expected pupils to stay out of the school buildings during all breaks, while most secondary schools allowed access to some or all areas of the school. During wet breaks at primary school, children were largely required to remain in their classrooms. But about 13% were allowed on to the playground during wet weather, though largely not on grassy areas. At secondary level, the majority of students were allowed out onto non-grassy areas during wet breaks and just over a quarter were allowed access to most areas of the school. There is then a higher degree of control at primary level in movements around the school grounds. This difference in the freedom of movement may be due to the larger school yard areas that are typical of secondary schools and a greater personal responsibility afforded older children during breaktimes as well as the difficulties associated with organising supervision that primary schools might encounter when allowing children outside during wet breaks.
The trends for the 2017 data were similar to the situation in 2006. Although there were signs then that primary schools were relaxing rules about going out, this trend has not continued. In secondary schools there have been some changes with an indication that schools are asserting greater control on the areas that students can go to with a reduction in the proportion of schools allowing students access to most areas and an increase in the proportion of schools allowing access to specific indoor areas. There are, however, organisations, programmes and campaigns (e.g., OPAL, Outdoor Classroom Day, The National Trust, Learning Through Landscapes) that are encouraging primary schools, at least, to allow children access to playing fields during the autumn and winter months with the construction of welly stores and outdoor covered areas and freedom of movement may change in the future. In the school survey we also explored the limits to freedom of movement at secondary level in terms of students being allowed off site during lunch times. This practice has been controversial given concerns about attendance, behaviour out of school, health and safety, bullying and the quality of food eaten at lunchtime. Also, there have been increased efforts by schools and policy makers to ensure students attend school and this has led to parental fines when students have not attended school for long periods. It is may be of little surprise that virtually none of the secondary schools that participated in this survey said that they now allow students to leave the school premises at lunchtimes. This is a substantial change in comparison to 2006 results which were in turn a decline from the 1995 figures. These findings indicate that there have been increases in the restrictions on the freedoms of students at secondary schools. Adolescents are now prevented from going off site during lunchtimes

96
and they are also increasingly restricted to particular areas both inside school buildings and out in school playgrounds. While there are clearly very good reasons for not allowing students to go off site at lunchtime, as already highlighted, when taken together with increases in the number of supervisors at breaktimes, the shortening of breaktimes and the provision of adult structured activities outside of school and during break, we suggest that the situation may be symptomatic of a wider culture within which young people are increasingly managed and controlled both in school and outside of school. While these changes constrain choice and freedoms, what is more important is that they prevent pupils from having to think and make important decisions for themselves, for being accountable for these choices and from learning important lessons from them. Such lessons are likely to be important for children to become autonomous, confident and resilient people (Gill, 2007; Shaw et al., 2013).
4.9 Suitability of school grounds at breaktime and facilities available Questions regarding the quality of the school ground for breaktime activities, supervision and teaching and learning outdoors led to interesting differences between primary and secondary schools and some marked changes since earlier surveys. Primary schools were very positive about the quality of their outdoor space for these things, with more than two thirds of schools rating their outdoor space as ‘good’. This is a marked shift from previous surveys where only half of schools, in 2006, and less than a third, in 1995, of schools expressed this view. Secondary schools were also more positive than previously about the quality of the school grounds for breaktime activities, supervision and outdoor learning. This is perhaps a surprising finding given the concerns about reductions in school funding and stories of schools having to sell off parts of their grounds. It is not possible to be sure about the reasons for this more positive view. There has, however, in recent times been increased funding for sports and grants available for new equipment, along with organisations that support schools with advice and also in seeking funding for development work, and these may have led to improvements in school grounds. It is also possible that schools are managing their sites more efficiently to enable better supervision. Secondary schools are slightly less positive about their sites for supervision and breaktime activities but even here only around 10% indicated that their site was poor.
Questions relating to the quality of particular school ground features show that over the past 10 years schools have paid much more attention to their outside provision and the quality of the equipment and facilities available. The proportion of primary schools with sheltered areas, quiet areas, fixed play equipment and designated sports areas seemed to have noticeably increased and the quality of these resources seems to have improved. However, few schools had packages of play materials such as ‘loose parts’, ‘scrap’ and other open-ended materials designed for creative play and when present these were often reported to be of poor quality. This may not be important as these are not necessarily supposed to be of ‘good quality’ however if this means that they can no longer be used effectively by children for play (e.g. dressing up materials are ripped or ruined) then they may need replacing. Secondary schools, on the other hand, report fewer resources than in 2006 but, with the exception of fixed and portable play equipment, indicate that the quality of these things is better. There have been particular improvements in the quality of benches and seating areas, greenery and planting, the playground and sports areas and multi-use games areas. Nevertheless, there is still room for improvement in both primary and secondary schools in terms of the improvement of the outdoor space, for instance in terms of places to sit and socialise, sheltered and quiet areas and potentially in relation to fixed and portable play equipment.
Primary schools were more likely than secondary schools to have worked with outside agencies to develop their school grounds, with more than half of primary and a fifth of secondary schools reporting that they had done this. However, this was lower than the figures for 2006. It may be that schools feel that their resources and equipment are of sufficient quality and that there is
97
little need for further improvements. Given the concerns raised by pupils about not having much to do (34% of pupils), that enjoyable activities were banned (26%), and that school grounds needed improvement (21%), there may be a difference of opinion between pupils and school staff about the quality of facilities and resources available. Far more pupils than in 2006 indicated that the school grounds needed improvement which suggests that this is an area of growing concern. When set alongside concerns about the health and level of physical activity of young people, and also worries about a decline in outside play and activities, more attention could be paid, especially at secondary level, to improving the school grounds and facilities available for pupils. Schools could be well advised to work with pupils to identify how outdoor spaces might be improved or enhanced so that they feel excited about their playground space and the school grounds. This might be as part of a wider dialogue between school staff and pupils about breaktime provision. At secondary level it is important to highlight that on entering Year 7 many children have moved from relatively richly resourced primary school playgrounds to school yards with little to offer in terms of playful activities, resources or spaces for play. There is maybe an assumption made by staff that at this age children no longer need to play or that school is only a place of work. It would be important for schools to explore pupils’ perspectives on this.
4.10 Clubs and activities before/after school Nearly all schools indicated that they organised some form of after school clubs. Secondary schools provided a broader range of activities than primary schools presumably because they are bigger and have the capacity to do so. While the proportion of primary schools offering after school clubs has slightly increased, the proportion of secondary schools offering them has slightly decreased. Of particular interest in this area is the marked increase in ‘breakfast clubs’ which are clubs provided before school starts. Over three quarters of primary schools and nearly two thirds of secondary schools organised breakfast clubs. This is a substantial increase on the 42% of primary schools that ran breakfast clubs in 2006. This was a relatively new thing in 2006 such that, tellingly, the question was not even asked of secondary schools at that time. Since this time there has been much interest in and support, including from the DFE and a range of charitable organisations, for the provision of breakfast clubs (e.g. Kellogg’s, 2014; Graham, Puts & Beadle 2017). These types of clubs usually fulfil two purposes – first they provide childcare before school to parents that need it and second, they often provide a breakfast, usually for disadvantaged children. In many cases parents pay for their children to attend these clubs but they can also be subsidised to a degree by the school and charities. Given the squeeze on school budgets there have been concerns about the ability of schools to continue sustaining clubs that provide breakfast (Burns, 2017). This is of concern because if they are withdrawn some children will go hungry. The increase in clubs before school may reflect recent financial pressures facing families but also changing work environments where employed parents wish to take their children to school earlier and collect them later (Simon, Owen, O’Connell & Brooks, 2018). This is also potentially very concerning because not only are many schools now providing 2 out of 3 meals per day, but some children arrive at school very early and leave late. It may be that for some children the family environment has much less of a presence and influence on their development, while life within school may be becoming the main context for their social and moral development and will be important in terms of relationships with adults and other children. In terms of the other types of clubs offered, as was the case previously, team sports activities were most likely to be offered by schools and arts and crafts, drama/ dance and music are all very popular at secondary and primary levels. The popularity of some clubs has fluctuated a little over time. In the latest 2017 survey the proportions of schools offering art/design/crafts/cookery have increased slightly. Perhaps surprisingly, given recent public concerns about the nature of computer knowledge, the proportion of schools offering coding/IT clubs have declined especially at secondary

98
level, possibly reflecting curriculum changes in terms of computer literacy and coding, whilst the organisation of Science clubs has markedly increased, especially at primary levels. Particularly noticeable is the marked increase in after school clubs involving curriculum support or homework clubs which have more than doubled at primary level. Whilst in the 2006 survey curriculum support clubs were the third most frequently offered after school club at secondary school, in 2017 there has been an increase on 2006 levels such that it is now the second most widely offered after school club. There has been much discussion about the prioritisation of English and Maths and the narrowing of the curriculum in schools. After school clubs have always been a way in which children can further broaden their interests in particular areas/ activities and while some of the main non-core curriculum areas seem to make up the areas offered these have not changed substantially since the previous survey. The increase in curriculum support and homework clubs highlights the increased pressures on students, now even after school, to undertake more academic learning. This is presumably for those children who may be struggling or who do not complete their homework at home and are thus required or wish to do it at school. The pupil survey revealed however, that only approximately 10% of pupils attending after school clubs attended clubs involving extra curriculum support. Figures may actually be higher as a number of pupils reported attending other academically focused activities after school, including preparation for examinations/ 11+ and may be yet higher for students in exam years not sampled by this questionnaire.
The fact that schools offer clubs says little about the extent to which children participate in them, so it was important to find out from pupils about the clubs that they attended after school. Results from the pupil survey indicated that primary pupils were nearly twice as likely to attend after school clubs as secondary school pupils. It may be that attendance of after school clubs during the primary years is in part due to a need on the part of parents for childcare beyond school hours. It might also be down to parents encouraging their children to explore different interests or as part of an opportunity to socialise with others and a chance to meet with friends. Once children get older and are more independent (thus are less likely to need childcare), they may have a smaller or more focused set of interests and pursue these independently or in clubs outside of school. The decline in after school club attendance during adolescence may be due to extended academic pressures arising out of preparation for examinations in Year 11, or declining interest. Compared to 2006 figures, there has been a substantial decline (nearly 30%) in young people attending after school clubs and activities. This might be due to the increasing focus on electronic devices and social media in young persons’ lives but may also be to do with the increased cost associated with attending such clubs. However, figures from a subsequent question about what pupils had done the day before indicated that about 10% of pupils attended a club immediately after school (presumably these were largely after school clubs). This was the same overall figure as in 2006. These results seem slightly at odds with the earlier decline in numbers of children attending after-school clubs but may represent a core of children who attend multiple clubs during the week. By far the most attended after school activities were those involving team sports or other sports. This was followed by music and drama/ dance. Other types of clubs were attended such as art/craft/design/cookery and homework/curriculum support. But far fewer pupils were involved in these clubs than implied by the figures for the school survey. It is likely that clubs involving team sports involve much higher numbers of pupils than other types of clubs on offer and this seems to include curriculum support activities which while offered by many schools do not involve that many students.
4.10.1 Clubs outside of school The student survey also asked about attendance of clubs outside of school. Interestingly about the same proportion of primary school pupils attended these clubs as after school clubs, but more

99
secondary school pupils attended clubs outside of school than after-school clubs. This may have something to do with these clubs often being run by specific organisations/ charities with much expertise in the particular area, but also that some of the clubs are not run by/in school (e.g. Youth organisations such as Scouts and Guides). However, since 2006 the proportions of pupils attending clubs outside of school has also declined with about 15% fewer pupils reporting attendance of these clubs outside of school. In terms of the types of activities that were prevalent in 2017, relatively similar results were found as for after school clubs. The most popular clubs being those involving team sports, though at lower levels than in school, and other types of sports, at higher levels than in school. Clubs involving arts/crafts etc had very little involvement outside of school, whereas drama/dance and music clubs had similar levels of involvement in and outside of school. There were slight gender differences in the accessing of clubs outside of school. As was the case in 2006, boys were slightly more likely to attend clubs outside of school with boys largely attending clubs with a sports focus and girls more interested in performing arts clubs. This may reflect ongoing interest in sports such as football whilst girls show less interest in pursuing extra-curricular activities, possibly choosing to spend their time focusing on their school work or socialising with friends. Alternatively, clubs available outside of school may not relate to the interests of girls as much as they do those of boys. Clubs both after and outside of school are likely to play an important part in some children’s lives, their social relationships, learning and social development (Tanner et al., 2016). There is relatively little research or understanding of the reasons and motivations for children and young people attending and participating in such clubs and how they may relate to children’s development. Clubs outside of school, particularly during adolescence, may provide children with a greater sense of independence and autonomy as well commitment to a particular area and are important opportunities to develop personal interests and feel part of organisations beyond school. Attendance of clubs may require parental support and commitment, particularly those outside of school and parents may be important as motivators or mediators in whether children participate in them. There is a need for further research to focus on the role of these clubs in children’s lives beyond school. Whilst personally fulfilling these provide extra skills and knowledge beyond that offered by school and their often less formal, non-exam focused non-obligatory nature may mean that they are more easily enjoyed and well placed to support the development of a variety of important ‘soft skills’ amongst children.
4.11 Social life after and outside of school The pupil survey also aimed to find out about other aspects of children’s social lives outside of school. Questions focused on where children went after school, what they did and who they spent time with, and in particular how time was spent with friends. In response to questions about where students went after school, nearly two thirds reported that they went straight home. Only a small proportion indicated that they went to a friend’s house or to another close family friend’s or relative’s house. In comparison to 2006, fewer young people travel to a friend’s house. In terms of the activities undertaken after school there was a wide range of different activities highlighted with going home and spending time watching TV or on a device, either without or with a friend, the most common. This question was interesting when compared to the same question in 2006; in 2017 similar proportions (14%) indicated that they did their homework but far fewer students said they spend time with friends after school. In fact, the numbers reporting playing or spending time with friends were half what they were in 2006. This is a substantial decline and of serious concern. A follow up question asked how often primary and secondary school students met up with friends and peers outside of school. Answers to this question in 2006 show that although the majority met with friends at least a few times per week, a quarter of pupils met with friends less

100
than once per week. These findings were consistent with responses to a similar question asked in Sweeps 4 and 5 of the Millennium Cohort Study where a quarter of pupils aged 7 (24.8%) and nearly a fifth of pupils aged 11 (19%) spent time with friends less than once per week (MCS, 2010, 2013). Our results for 2017 also showed that the level of children socialising with peers outside of school was much reduced on 2006 levels. Fewer students reported meeting with friends every night, and nearly half (compared to 25% in 2006) now reported that they saw their friends outside of school less than once per week (at the weekend or less regularly). These findings are very important and show a substantial change in children’s social lives and socialising patterns over the past 10 years. They also show that for nearly half of pupils, school and school breaktimes, in particular, are the main opportunities, maybe the only opportunities, for children to meet with and have sustained contact with their friends on a regular basis. One grey area, however, relates to the nature of school provision after school hours. Childcare provision and some clubs can allow more social and playful activity with peers than is offered by other more formal adult led clubs. This means that the survey may have under-estimated how much socialising goes on in school but outside of school hours. Clearly there is a need for further research to examine in greater depth children’s social lives both in and outside of school.
In terms of the nature of social networks of those that met with friends outside of school, these friends were predominantly children who went to the same school as them or a mixture of friends that attended their school and other peers that did not. Very few adolescents reported that they only met with children who did not go to their school. Boys seemed to prioritise their school friends slightly more than non-school based friends, whilst girls were more likely to value all of their friends equally.
How might these changes in socialising patterns be explained? One possible explanation might be that with increased parental choice of school, school friends may now live further apart. Reduced attendance of after school clubs might on the one hand allow more opportunities to meet with peers outside of school but on the other mean that peers leave school at different times. Given that levels of pupils undertaking homework straight after school seem consistent with findings for the 2006 survey, it seems unlikely that the levels of after school work have increased. It might be the case that the reduced freedoms afforded children, means that parents expect them to go straight home after school. Where previously children would informally ‘call’ for each other to meet up and/or play, now many children go on ‘play dates’, formally arranged by parents. Although the notion of a ‘play date’ may relate largely to younger children, it is nevertheless indicative of the changing society and thinking towards children’s play and socialising – as something to be formally agreed and arranged. Once in the home children are likely to engage with social media, TV and gaming devices. It is also possible that the reduction in freedoms afforded children and greater structuring of their time over the past decade combined with the opportunities provided by social media and online entertainment devices has led to a cultural shift such that even when students are afforded more independence they choose not to spend time directly with friends. It may be that children spend more time engaging with friends and peers online, such that there is no longer a need to physically meet with them. There is much evidence that pupils do engage with peers digitally and undertake joint activities, play and socialising (Isbister, 2013; Marsh, 2014). But there are ongoing questions about the nature, quality and depth of these interactions and the role they play in self and social development. This means that as a context where pupils can interact with friends and peers and develop important social skills, breaktimes may have become even more important.
These findings highlight the importance of school and in particular breaktimes as the main contexts in which children form and develop friendships with peers and where important social skills emerge and the central importance of school and breaktimes in children’s social lives.

101
4.12 Findings relative to main factors Differences between primary and secondary schools Findings from the school and pupil surveys identified consistent differences between primary and secondary schools. To summarise: in comparison to primary schools, secondary schools were more likely to:
• Have less total time for breaks, allocate less of the school day to breaks and have shorter lunchbreaks.
• Have shortened breaks, since 1995, by about 65 minutes per week (compared to 40-45 mins for primary schools).
• See the value of breaktime more in functional terms – as a time to eat and drink and for release of energy and exercise - rather than as an opportunity for socialisation.
• Identify problems at breaktime arising from overcrowding and the quality of supervision.
• Say that standards of behaviour at breaktime are unchanged over the past five years (but fewer secondary schools in 2017 in comparison with 2006 and 1995 think behaviour has declined).
• Say that standards of behaviour outside of school over the past five years are unchanged (but fewer secondary schools in 2017 in comparison with 2006 and 1995 think behaviour out of school has declined).
• Have more teaching staff and fewer support staff on duty at break and lunch times and have more pupils per supervisor at lunchtimes (though approximately the same ratio as for morning breaks)
• Have more supervisory staff on duty during breaktimes than in 2006 and 1995 (with average numbers of teaching staff supervising nearly double what they were in 2006)
• Supervise at a distance allowing students to engage in self-chosen activities (rather than set up activities for students to opt in to)
• Not provide training for supervisory staff and/or to rely on an informal approach to supervisor training and support (in contrast with primary schools which offer formal training and support, (e.g., training by outside agencies and regular meetings with senior staff). This difference had grown since 2006.
• See school grounds as less suitable for supervision, breaktime activities and teaching and learning (though perceptions of these things have improved since 2006).
• Not have facilities available for use at breaktime and to judge facilities as of poor quality.
• Have CCTV in the playground and designated sports areas; but not have areas of garden/ wildlife, shelter or for quiet in the playground
• Not have worked with outside agencies to improve the grounds or breaktime for pupils.
• To allow more freedom of movement during breaks to specific areas in school and access out on to the playground during wet weather (however freedom to move off premises even with parental permission has been largely stopped).
• To allow students to bring mobile devices in school and to use them during break and lunch times
We have also seen that secondary school students are more likely to say that breaks should be
made longer, there is not enough time to eat and drink, there are not enough things to do, fun activities are banned, and that the school grounds need repair.
All of this suggests that breaktime is seen as more of a problem in secondary schools but at the same time receives less attention, planning and development. Though challenges of breaktimes are

102
seen in terms of the behaviour of pupils, overcrowding, supervision and the school grounds, less effort is put into training and supporting staff, and providing facilities at breaktime. Secondary schools could provide more and better quality facilities, and attend more to the quality of the school grounds. They might do this through greater links with outside agencies but also by working with the student body to develop the outdoor space to enable students to undertake activities that they find interesting.
The fact that secondary schools have shorter breaktimes, especially the lunchbreak, suggests that rather than give thought to student’ experience and the school grounds, they have taken the simple approach of solving a perceived problem area by cutting back on it. It is true that they put on more specific activities and clubs during breaktime, but this would not seem to offset the other differences identified here and few students reported participating in clubs at breaktimes – possibly because of the lack of time. There is a clear contrast with the pupil experience: they like breaktimes as a chance to meet with friends and wish to see them extended and not cut back any further. Differences between independent and state funded schools Findings from the school survey identified differences between independent schools and state funded schools. Findings here are rather more tentative because of the lower response from independent schools and the variability in practices, nevertheless to summarise: in comparison to state funded schools, independent schools were more likely to:
• Start the school day earlier and finish later and have a longer school day overall.
• Have a larger proportion of the school day allocated to break time at Key Stages 3 and 4 (but not KS1 and 2)
• Have longer morning and lunch time breaks and more total time allocated to breaks overall at all Key Stages.
• Report that the quality of the outdoor space was good for breaktime activities and supervision (but less likely to have worked with outside providers to improve their school grounds).
• Have more teaching staff and fewer support staff supervising at lunch breaks in primary schools (and have fewer pupils per member of staff for morning but not lunchtime breaks)
• Have fewer staff supervising at morning and lunch breaks in secondary schools.
• Report running lunch time clubs and a wider range of clubs (including curriculum support) in secondary schools (though they were less likely to run clubs after school).
• Report at secondary level (but not primary level) that there were few challenges at breaktimes and that behaviour at break time was not perceived to have changed (it had not improved or declined) in the past 5 years.
There appear to be relatively few differences between independent schools and state funded
schools at the primary level and the longer breaks experienced by pupils in these stages at independent schools seem to be balanced out by a longer school day. Staff breaktime supervision arrangements in independent schools may reflect overall staffing arrangements and pupil roll within the school.
However, total breaktimes and as a proportion of the school day were much greater than in state funded secondary schools and seem to be little different from timings for breaks in primary schools. Furthermore, the longer lunchbreaks at independent secondary schools (or in some cases long afternoon breaks) are organised differently with these schools offering a wide range of optional activities/clubs during these times and thus all students participate in one club/ activity or another. It might be the case that these longer lunch times provide students with sufficient time to eat and socialise and a wide range of activities to choose from and to find sufficient things to do. State

103
funded secondary schools, with relatively little time during lunch break and no afternoon breaks, seem to offer these optional activities after school (thus outside of school hours) and as we know from the pupil survey only a minority of secondary students participate in these and thus miss out on extra-curricular activities. Wider structural demographic factors and breaktime The total amount of time for breaks at KS1 and KS2 varied across rural and urban locations, with rural schools reporting longer breaks than schools in urban areas. A similar pattern, though not significant, was evident for secondary schools. It is difficult to account for this difference except that schools in urban areas may be keen to avoid rush hour traffic and thus aim to end the school day earlier by allocating less time for breaks. An important finding was that the total duration of breaktimes, even after taking account the length of the school day, was negatively correlated with the proportion of pupils in state primary schools who receive free school meals. This pattern was not in evidence for state funded secondary schools. This means that primary schools with children from lower income backgrounds tended to have less time for breaks. We have already seen that pupils that attend independent schools have more total time for breaks, though this was at KS3 and 4. This highlights an important relationship between socioeconomic disadvantage and access to breaktimes. Bearing in mind long standing evidence linking poverty and pupil performance (e.g., Taylor, 2017), it is possible that schools with higher proportions of children receiving FSMs feel a pressure to allocate more time for learning than for breaks or to limit breaks in order to manage poor behaviour. Alternatively, given that schools in rural areas tend to have lower proportions of children in receipt of FSMs – this may be connected to the earlier relationship between urban/rural setting and total time for breaks. Either way, this finding is of particular concern as it indicates a level of inequality within society – that children attending schools with higher levels of children in receipt of FSM, and thus more pupils from poorer backgrounds, have less time for a break and thus less time for play and socialising with peers. This reflects similar findings in the USA documenting a relationship between time for recess and measures of deprivation (Ramstetter et al., 2010).
4.13 Conclusions and recommendations Our findings show that there is currently a lack of clarity about the purpose of break times in school and how they may contribute to the broader aims of school, education and development. Break times offer space, time and opportunities for a range of things (e.g., eating and drinking, physical activity, free social time, meeting with teachers, music tuition, clubs, and increasingly counselling, mental health and curriculum support) but this lack of clarity means that some schools feel that they can erode these times in favour of more time spent on the activities that are of central importance to staff in schools - the curriculum and learning in class. There are difficulties that can arise at breaktime and an enduring problem recognized by both school staff and pupils is worries about the poor behaviour of some pupils. It is therefore understandable if one solution involves limiting the contexts within which poor behaviour occurs most frequently or seeking to control it by increasing supervision. Yet, the overall impression arising out of the survey of pupils’ views about breaktime was at odds with one which stresses the problems that arise and the view that breaktime should be kept tightly managed and as short as possible. The vast majority of students viewed breaktime very positively and valued the social opportunities it allows, as well as the more functional (and social) opportunities for eating and drinking. Pupils would prefer break and lunch times to be longer and would like constraints on enjoyable activities, and the degree of supervision, to be eased. It is clear from our results that the lunchbreak and the afternoon break have been and continue to be cut back. This systematic reduction of school breaktimes is happening despite ongoing debates and media attention about physical health and obesity, and reduced opportunities

104
for play and increased concern about mental health, school food, safety, risk and resilience and young persons’ opportunities for socializing. It is also clear that supervision of breaktimes has increased. Students have less freedom of movement off school premises and movement is now constrained to very specific spaces within school. At secondary level, at least, there is little investment or valuing of these times as opportunities for young people to socialise and to develop their interests and themselves, through engagement with optional activities. The reductions of breaktimes identified here suggest that many pupils at secondary school would find it difficult to find the time to socialise with friends, have something to eat and drink and to achieve appropriate levels of physical activity.
A high proportion of schools report preventing pupils from having a break due to pupil poor behaviour or lack of application to studies and many pupils have experience of this. Breaks seem to be a token for control of behaviour and work in class/ homework rather than a universal right. Yet these times offer an important time out from lessons, an important time to connect with and support friends and to engage in activity (physical or otherwise) that may help pupils concentrate better when they return to class. There is increasing evidence that breaks can assist behaviour and concentration in class (Barros et al., 2009; Jarrett et al., 1998; Pellegrini & Davies, 1995; Rhea & Rivchun, 2018), possibly because of the physical activity or the recuperation that they afford. But the connections between break time length and attention have not been explored extensively or systematically through the use of robust research designs and much more could be done to examine these things relative to a range of academic and social-emotional and psychological outcomes. The physical, social and psychological opportunities afforded by breaktimes exist in virtually all schools in all communities. There are very good reasons for making more of these opportunities and thus extending breaktimes rather than cutting them back.
While there has been a shortening of time for break, and the level of supervision and control of pupils during breaktimes has increased there appears to be a trend that more schools report that behaviour at breaktime has improved and/or fewer report that it is declining. However, it would be a mistake to conclude that these are connected. First a similar trend in cuts to breaks was observed between 1995 and 2006 without change in terms of views of break time behaviour. Furthermore, where the reductions and changes have been strongest in 2017, in secondary schools, the prevalent view is that behaviour at break time has not changed. We have also seen marked improvements in the availability and quality of resources, at primary level, where most schools suggested behaviour had improved rather than at secondary level where there had been few improvements in resources and playground spaces. Nevertheless, there does need to be more research to examine the implications of the amount of time and quality of provision for breaks. We argue that there is scope for schools to use these times more effectively, to provide fun and challenging activities for pupils to choose and to engage with in their own terms with or without peers and friends. It is important that, despite the reported reductions and increased supervision, pupils say that the best thing about school is the chance to meet their friends – and it is breaktime that provides the main forum for their social life and social well-being at school. Although sometimes there can be a negative side. Social relations can be fractious, and the misery caused by bullying has to be dealt with. But breaktime is also a time when friends, not always in the same class, can meet, have fun, engage in playful activity in a relatively safe environment. It is a time when important social networks are formed and important social skills can be learned. It is a rare time when children can find freedom and a social life independent of the classroom, where the rules of conduct are more their own, and where activities stem from their own initiative. It is easy to assume that breaktime has little value for secondary pupils when all they seem to do is talk and hang around together. But this would be to underestimate the value of these informal contexts for social interaction and also for allowing the benefits that engaging with peers and friends can bring such as self-validation, social and emotional support, companionship and intimacy and a sense of belonging.
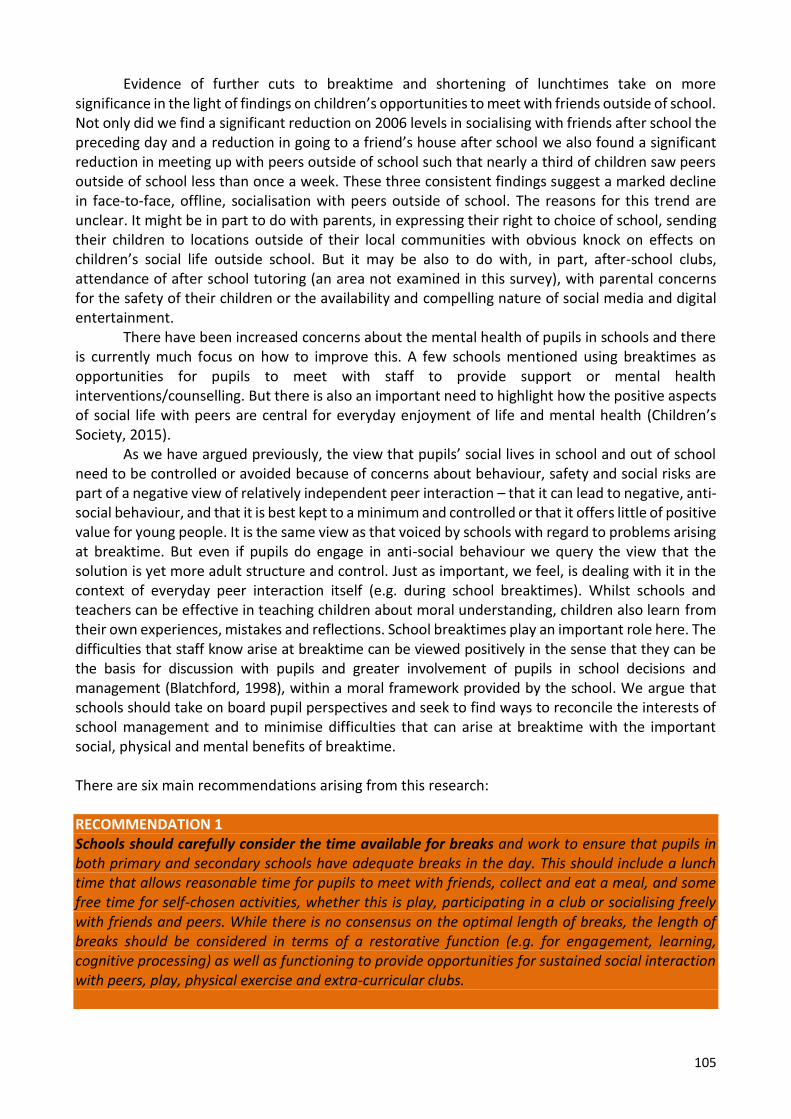
105
Evidence of further cuts to breaktime and shortening of lunchtimes take on more significance in the light of findings on children’s opportunities to meet with friends outside of school. Not only did we find a significant reduction on 2006 levels in socialising with friends after school the preceding day and a reduction in going to a friend’s house after school we also found a significant reduction in meeting up with peers outside of school such that nearly a third of children saw peers outside of school less than once a week. These three consistent findings suggest a marked decline in face-to-face, offline, socialisation with peers outside of school. The reasons for this trend are unclear. It might be in part to do with parents, in expressing their right to choice of school, sending their children to locations outside of their local communities with obvious knock on effects on children’s social life outside school. But it may be also to do with, in part, after-school clubs, attendance of after school tutoring (an area not examined in this survey), with parental concerns for the safety of their children or the availability and compelling nature of social media and digital entertainment.
There have been increased concerns about the mental health of pupils in schools and there is currently much focus on how to improve this. A few schools mentioned using breaktimes as opportunities for pupils to meet with staff to provide support or mental health interventions/counselling. But there is also an important need to highlight how the positive aspects of social life with peers are central for everyday enjoyment of life and mental health (Children’s Society, 2015).
As we have argued previously, the view that pupils’ social lives in school and out of school need to be controlled or avoided because of concerns about behaviour, safety and social risks are part of a negative view of relatively independent peer interaction – that it can lead to negative, anti-social behaviour, and that it is best kept to a minimum and controlled or that it offers little of positive value for young people. It is the same view as that voiced by schools with regard to problems arising at breaktime. But even if pupils do engage in anti-social behaviour we query the view that the solution is yet more adult structure and control. Just as important, we feel, is dealing with it in the context of everyday peer interaction itself (e.g. during school breaktimes). Whilst schools and teachers can be effective in teaching children about moral understanding, children also learn from their own experiences, mistakes and reflections. School breaktimes play an important role here. The difficulties that staff know arise at breaktime can be viewed positively in the sense that they can be the basis for discussion with pupils and greater involvement of pupils in school decisions and management (Blatchford, 1998), within a moral framework provided by the school. We argue that schools should take on board pupil perspectives and seek to find ways to reconcile the interests of school management and to minimise difficulties that can arise at breaktime with the important social, physical and mental benefits of breaktime. There are six main recommendations arising from this research: RECOMMENDATION 1 Schools should carefully consider the time available for breaks and work to ensure that pupils in both primary and secondary schools have adequate breaks in the day. This should include a lunch time that allows reasonable time for pupils to meet with friends, collect and eat a meal, and some free time for self-chosen activities, whether this is play, participating in a club or socialising freely with friends and peers. While there is no consensus on the optimal length of breaks, the length of breaks should be considered in terms of a restorative function (e.g. for engagement, learning, cognitive processing) as well as functioning to provide opportunities for sustained social interaction with peers, play, physical exercise and extra-curricular clubs.

106
RECOMMENDATION 2 Schools should aim to develop a policy on breaks in the school day. While breaktimes make up around 20% of the school day, they are overlooked, and this is reflected in the lack of school policy. A school policy should cover their nature and length, their staffing and training for break time supervision, making clear what the school hopes pupils will gain from breaks and how it is perceived that these times support children’s development, learning, and wellbeing. RECOMMENDATION 3 Schools should consult and work with pupils to enable them to have a say on break times, the activities and clubs on offer and how the outdoor space is set up, resourced and decorated so that playground activities can be engaging, interesting and fun. There are a number of organisations that provide useful advice on, and support for, improving opportunities during break times. Secondary schools, in particularly, should also try innovative ideas to enrich the quality of break times for pupils. Schools should consider providing adult led clubs/ extended learning opportunities as part of the school day or after school rather than during break times. RECOMMENDATION 4 Schools should reconsider the practice of withholding break time as an individual or group sanction or for pupils to complete work, especially if this is routinely used. This is taken for granted as a punishment, but there is evidence that this approach is likely to be counter-productive to children’s well-being generally, especially if regularly experienced. It is also important to note that although there appears to be no legislation requiring that pupils are allowed time for a break (in contrast to the situation for teachers), article 31 of the UN Convention on the Rights of the Child, to which the UK is a signatory, states that children have a right to play. Schools should consider alternative, constructive ways of motivating and sanctioning pupils and enabling them to finish academic work rather than withholding breaktimes. RECOMMENDATION 5 Schools should review their approach to the training of supervisors. Supervisor training should aim to support, manage and to strategically facilitate positive and constructive break time experiences that contribute to children’s wellbeing and their social and psychological development. Training should ensure that staff know how to manage everyday problems that can arise during breaks in an inclusive and strategic fashion. RECOMMENDATION 6 Policy makers should consider legislating for time for pupils to have breaks. Working adults, including teachers have a right to breaks but there is no equivalent policy for pupils. Legislation should convey an average expectation that ensures all pupils have regular and sustained periods of break time every day to undertake activities of their own choosing, with peers and in an outdoor space for the purpose of play, recreation and social development.

107
5 References Ahn, S., & Fedewa, A. L. (2011). A meta-analysis of the relationship between children’s physical
activity and mental health. Journal of Pediatric Psychology, 36(4), 385-397. American Academy of Pediatrics (2012) Policy statement on the crucial role of recess in school,
Pediatrics. 131(1), 183-188. APPG on a Fit and Healthy Childhood Reports on ‘Play’ (2015) and ‘Food in schools’ (2015)
available from: https://royalpa.files.wordpress.com/2018/04/play-a-report-by-the-all-party-parlimentary-group-on-fit-and-healthy-childhood_oct27.pdf
Bagwell, C.L., & Schmidt, M.E. (2011). Friendships in childhood & adolescence. New York: The Guilford Press.
Baines, E. & Blatchford, P. (2009). Sex differences in the structure and stability of children’s playground social networks and their overlap with friendship relations. British Journal of Developmental Psychology, 27, 743–760.
Baines, E. & Blatchford, P. (2011). Playground games and activities in school and their role in development. In A. D. Pellegrini (Ed.), The Oxford Handbook of the Development of Play. New York: Oxford University Press.
Baines, E. & Blatchford, P. (2012). Children’s independent mobility and travel to school. Published on line at: www.breaktime.org.uk/Publications.htm
Baines, E. & MacIntyre, H. (forthcoming). Children’s social experiences with peers during school mealtimes.
Barros, R. M., Silver, E. J., & Stein, R. E. (2009). School recess and group classroom behavior. Pediatrics, 123(2), 431-436.
BBC (2015, 21st June). Ofsted chief inspector backs ban on phones in schools. Retrieved from: https://www.bbc.co.uk/news/education-44553705
Beckford, M. (2007, May 7). School without play area bans break times. The Telegraph. Retrieved from: http://www.telegraph.co.uk/news/uknews/1550808/School-without-play-area-bans-break-times.html
Beresin, A. R. (2012). Play counts: Pedometers and the case for recess. International Journal of Play, 1(2), 131-138.
Beresin, A. (2016). Playing with time: towards a global survey of recess practices. International Journal of Play, 5(2), 159-165.
Beyler, N., Bleeker, M., James-Burdumy, S., Fortson, J., & Benjamin, M. (2014). The impact of Playworks on students' physical activity during recess: Findings from a randomized controlled trial. Preventive Medicine, 69, S20-S26.
Blatchford, P. (1998). Social life in school: pupils, experiences of breaktime and recess from 7 to 16 years. London: Falmer.
Blatchford, P. & Baines, E. (2006). A follow up national survey of breaktimes in primary and secondary schools (Report to Nuffield Foundation Ref: EDV/00399/G). Retrieved September 10, 2009, from http://www.breaktime.org.uk
Blatchford. P. & Baines, E. (2010). Peer relations in school. In K. Littleton, C. Wood & J. Kleine-Staarman (Eds) International Handbook of Psychology in Education. Bingley, UK: Emerald.
Blatchford, P. & Sumpner, C. (1998) What do we know about breaktime?: Results from a national survey of breaktime and lunchtime in primary and secondary schools. British Educational Research Journal, 24,79-94
Blatchford, P., Baines, E., & Pellegrini, A. (2003). The social context of school playground games: sex and ethnic differences and changes over time after entry to junior school. British Journal of Developmental Psychology, 21(4), 481-505.

108
Blatchford, P., Pellegrini, A., & Baines, E. (2016). The child at school: Interactions with peers and teachers. (2nd edition). London: Routledge
Blatchford, P., Russell, A. & Webster, R., (2012). Reassessing the impact of teaching assistants: how research challenges practice and policy. Abingdon, Oxon: Routledge.
Bukowski, W. M., Laursen, B., & Rubin, K. H. (Eds.). (2018). Handbook of peer interactions, relationships, and groups. Guilford Publications.
Burgess, L., (2016, 11th August). What’s better for primary pupils – structured breaktimes or free play? Teachwire, Retrieved from: http://www.teachwire.net/news/whats-better-for-primary-pupils-structured-breaktimes-or-free-play
Burn, A. (2014). Children’s playground games in the new media age. In A. Burn, & C. Richards, (Eds.) Children’s Games in the New Media Age: Childlore, Media and the Playground. Ashgate Press: Burlington, US.
Burns, J. (2017, 8th September). Teachers' funding fears for breakfast clubs, BBC, Retrieved from: https://www.bbc.co.uk/news/education-41191158
Campbell, D. & Halliday, J. (2014, 2nd April). Pupils should stay indoors at lunch to avoid smog, says UK government adviser. The Guardian, Retrieved from: https://www.theguardian.com/education/2014/apr/02/pupils-indoors-lunch-smog-uk-government-adviser
Carlson, J. A., Engelberg, J. K., Cain, K. L., Conway, T. L., Mignano, A. M., Bonilla, E. A., Geremia, C. & Sallis, J. F. (2015). Implementing classroom physical activity breaks: Associations with student physical activity and classroom behavior. Preventive Medicine, 81, 67-72.
Carpenter, H., Cummings, C., Dyson, A., Jones, L., Laing, K., Oseman, D., et al. (2010). Extended services evaluation: end of year one report. Research report DFE-RR016. London: DfE
Chanfreau, J., Tanner, E., Callanan M., et al. (2015). Out of school activities: understanding who does what. Research briefing on Nuffield Foundation research on ‘out of school activities and the education gap’.
Children’s Society (2015). The Good Childhood Report 2015. Retrieved from: http://www.childrenssociety.org.uk/what-we-do/resources-and-publications/the-good-childhood-report-2015
Children’s Society (2017). The Good Childhood Report 2017. Retrieved from: https://www.childrenssociety.org.uk/what-we-do/resources-and-publications/the-good-childhood-report-2017
Children’s Society (2018). The Good Childhood Report 2017. Retrieved from: https://www.childrenssociety.org.uk/what-we-do/resources-and-publications/the-good-childhood-report-2018
City Matters, (2017, 25th January). Bad air day for city as kids confined to class, City Matters, Retrieved from https://www.citymatters.london/very-high-pollution-london-school/
Collishaw S, Gardner F, Maughan B, Scott J & Pickles A (2012). Do Historical Changes in Parent–Child Relationships Explain Increases in Youth Conduct Problems? Journal of Abnormal Child Psychology, 40, 119–132
Delidou, E., Matsouka, O., & Nikolaidis, C. (2016). Influence of school playground size and equipment on the physical activity of students during recess. European Physical Education Review, 22(2), 215-224.
DOH, (2015). Future in mind: Promoting, protecting and improving our children and young people’s mental health and wellbeing. NHS England, Ref. No 02939.
DFE, (2011). Schools given freedom from Bureaucratic rules to have control over school day. Press release on 12th September 2011.
Gill, T. (2007). No fear: Growing up in a risk averse society. Calouste Gulbenkian Foundation.
109
Graham, N. Puts, E., & Beadle, S. (2017). Evaluation of Breakfast Clubs in Schools with High Levels of Deprivation, Research Report for DFE (DFE-RR651), Retrieved from: https://assets.publishing.service.gov.uk/government/uploads/system/uploads/attachment_data/file/603946/Evaluation_of_Breakfast_Clubs_-_Final_Report.pdf
Gray, P. (2011). The decline of play and the rise of psychopathology in children and adolescents, American Journal of Play, 3(4), 443-463.
Grugeon, E. (2005). Listening to learning outside the classroom: student teachers study playground literacies. Literacy, 39, 3–9.
Horridge, D. (2014, April 7). Put the play back into the playground. The Telegraph. Isbister, J. (2013). Exploring adolescents' use of social networking sites and their perceptions of
how this can influence their peer relationships. Doctoral thesis, Institute of Education, University of London. Available from http://discovery.ucl.ac.uk/10020745/
Jarrett, O. S., Maxwell, D. M., Dickerson, C., Hoge, P., Davies, G., & Yetley, A. (1998). Impact of recess on classroom behavior: Group effects and individual differences. The Journal of Educational Research, 92(2), 121-126.
Kellogg’s, (2014). An Audit of School Breakfast Club Provision in the UK: A Report by Kellogg’s. Retrieved from: https://www.kelloggs.co.uk/content/dam/europe/kelloggs_gb/pdf/R5_Kelloggs%20Breakfast%20Club%20Audit%20APSE.pdf
Kutnick, P., Hodgkinson, S., Sebba, J, Humphreys, S., Galton, M., Steward, S., Blatchford, P., & Baines, E. (2006). Pupil grouping strategies and practices at Key Stage 2 and 3: Case studies of 24 schools in England. RR796. DFES.
Ladd, G.W. (2005). Children’s peer relations and social competence: A century of progress. London: Yale University Press.
Layard, R. & Dunn, J. (2009). A good childhood: Searching for values in a competitive age. London: Penguin.
Luckin, R., Baines, E., Cukurova, M., & Holmes, W. (2017). Solved! Making the case for collaborative problem-solving. London: NESTA.
MacIntyre, H., & Baines, E. (2014). Context “Map” to support child interviews about school lunchtime experience. In V. Johnson, R. Hart, & J. Colwell (Eds.), Steps to Engaging Young Children in Research. Vol. 2: The Researcher Toolkit. Bernard van Leer Foundation and University of Brighton. From http://www.bernardvanleer.org/files/Steps-to-Engaging-Young-Children-in-Research-vol-2.pdf
Margo , J. & Dixon , M. with Pearce , N. & Reed , H. ( 2006 ). Freedom’s orphans: Raising youth in a changing world. London : Institute for Public Policy Research .
Marsh, J. (2014). Researching young children’s literacy practices in online virtual worlds: Cyber-ethnography and multi-method approaches. In Albers, M., Flint, A. & Holbrook, T. (eds) New methods in literacy research. (pp. 195-209). New York: Routledge.
McNamara, L., Gibson, J., Lakman, Y., Spadafora, N., Lodewyk, K., & Walker, M. (2018). The Influence of a Recess Intervention on Children’s Sense of Belonging and Enjoyment. Journal of Contemporary Issues in Education, 13(2), 37-54.
Millenium Cohort Study (2010). Sweep 4 Technical Report, see https://cls.ucl.ac.uk/cls-studies/millennium-cohort-study/mcs-age-7-sweep/
Millenium Cohort Study (2013). MCS Age 11 Technical Report, https://cls.ucl.ac.uk/cls-studies/millennium-cohort-study/mcs-age-11-sweep/
Nuffield Foundation (2012) Social trends and mental health: introducing the main findings London: Nuffield Foundation
NUT (2013). The NUT’s response to The National Curriculum Consultation. Retrieved from: www.teachers.org.uk/files/NUT_Resp_NC_Cons_2013_HH.doc

110
NUT (2015). Call for statutory entitlement to appropriate break and lunch times. NUT Annual Conference, Harrogate, April 2015.
Payne, R. (2015). Using rewards and sanctions in the classroom: pupils’ perceptions of their own responses to current behaviour management strategies. Educational Review, 67(4), 483-504.
Pellegrini, A. (2005). Recess: Its role in education and development. LEA Pellegrini, A. Huberty, P., & Jones, I. (1995). The effects of recess timing on children’s playground
and classroom behaviours. American Educational Research Journal, 32, 845 - 864 Play England, (2012). Fear of strangers and traffic stop children playing outdoors. Retrieved August
5th, 2012 from www.ncb.org.uk/news/fear-of-strangers-and-traffic-stop-children-playing-outdoors.
Pollard, A. (2012, Nov. 20). Narrowness and imbalance in National Curriculum design. IoE London Blog, 20th November. Retrieved from: https://ioelondonblog.wordpress.com/2012/11/20/ narrowness-and-imbalance-in-national-curriculum-design/
Prisk, C. & Cusworth, H. (2018). From muddy hands and dirty faces … to higher grades and happy places: Outdoor learning and play at schools around the world. Report on Outdoor Classroom Day. Retrieved from https://outdoorclassroomday.com/wp-content/uploads/2018/10/Muddy-hands-report-full.pdf
Ramstetter, C., Murray, R. & Garner, A., (2010). The crucial role of recess in school. Journal of School Health, 80, 517-526.
Rhea, D. J., & Rivchun, A. P. (2018, February). The LiiNK Project®: Effects of Multiple Recesses and Character Curriculum on Classroom Behaviors and Listening Skills in Grades K–2 Children. In Frontiers in Education (Vol. 3, p. 9). Frontiers.
Ridgers, N.D., Stratton, G. & Fairclough, S.J. (2006). Physical activity levels of children during school playtime. Sports Medicine, 36, 359-371.
Roberts, A., (2013, July 25). Classrooms on stilts, staggered playtimes and 8am-8pm teaching shifts. how one primary school is battling the bulge. The Evening Standard.
Shaw, B., Watson, B., Frauendienst, B., Redecker, A., Jones, T., Hillman, M. (2013). Children's independent mobility: a comparative study in England and Germany (1971-2010), Policy Studies Institute, London.
Simon, A., Owen, C., O’Connell, R., & Brooks, F. (2018). Changing trends in young people’s food behaviour and wellbeing in England in relation to family affluence between 2005 and 2014. Journal of Youth Studies, 21(5), 687-700.
Sluckin, A. (1981) Growing up in the playground: The social development of children. London: Routledge & Kegan Paul.
Smith, P. (2010). Children and Play. Wiley Blackwell. Smith, P. (2014). Understanding school bullying. Sage Publications. Tanner, E., Chanfreau, J., Callanan, M., Laing, K., Paylor, J., Skipp, A. & Todd, L. (2016). Can out of
school activities close the education gap? (Briefing Paper 4). Accessed at http://natcen.ac.uk/ media/1216036/can-out-of-school-activities-close-the-education-gap.pdf
Taylor, C. (2018). The reliability of free school meal eligibility as a measure of socio-economic disadvantage: Evidence from the millennium cohort study in Wales. British Journal of Educational Studies, 66(1), 29-51.
ukactive (2015). Generation inactive: An analysis of the UK's childhood inactivity epidemic and tangible solutions to get children moving. Retrieved from: https://www.ukactive.com/wp-content/uploads/2018/09/Generation-Inactive_1_ukactive.pdf
UNICEF (2007) Child poverty in perspective: An overview of child well-being in rich countries. Innocenti Report Card 7. Florence: UNICEF Innocenti Research Centre.
UNICEF (2013). Child Well-being in Rich Countries: A Comparative Overview, Innocenti Report Card 11, UNICEF Office of Research, Florence.

111
Veiga G., Leng W. D., Cachucho R., Ketelaar L., Kok J. N., Knobbe A., Neto C., & Rieffe C. (2017). Social competence at the playground: preschoolers during recess, Infant and Child Development,26: e1957. doi: 10.1002/icd.1957.
Wakefield, J. (2018, 2nd January). Gaming addiction classified as disorder by WHO, BBC Technology. Retrieved from: https://www.bbc.co.uk/news/technology-42541404
Webster, R., & Blatchford, P. (2019). Making sense of ‘teaching’,‘support’and ‘differentiation’: the educational experiences of pupils with Education, Health and Care Plans and Statements in mainstream secondary schools. European Journal of Special Needs Education, 34(1), 98-113.
Whitebread, D., Coltman, P., Jameson, H., & Lander, R. (2009). Play, cognition and self-regulation: What exactly are children learning when they learn through play? Educational and Child Psychology, 26(2), 40.

112
6 Appendices Appendix 1: Case studies In parallel with the survey of pupils’ views and experiences we undertook a small number of case studies. However due to space restrictions and the complexity of the survey findings we do not report on these here but provide a brief summary. Case study methods developed in the earlier Nuffield research and in other projects that we have undertaken (e.g. DISS and MAST projects – see Baines et al., 2015; Blatchford et al., 2012) were adapted for use in this study. The aim was to complement and expand information from the phase 1 national survey, in terms of the consequences of, and attitudes to, organisation and supervision during break and lunch times, the playground and lunchroom environment, rules for pupils and policies and practices on behaviour, the nature of extended school services, pupils’ freedoms and opportunities to socialise with friends and peers and to engage in organised activities during these times, and to examine pupil’s experiences of social life outside of school (e.g., to clarify the role of schools as a main context for the formation and development of friendships).
On the basis of surveys that were returned and interest in taking part in the case study phase of the study, a provisional list of schools that met our criteria for involvement was selected along with a list of reserves. The criteria related to: the duration of breaktimes (e.g. total length (long or short) or higher/lower frequency of breaks) and the nature of the breaktime environment (e.g. enriched playground environment, managed/structured environment/ presence of an array of school clubs).
In the event it was harder to recruit schools for case studies and the main list of schools and reserves were quickly exhausted. Each case study required letters to be sent home and shared with staff seeking permission for participation in the research (pupil and staff interviews) and a number schools felt subsequently that they could not support this part of the research due to the load on school administrators and the time required of staff. New potential case studies were selected and approached. However, this meant that some schools did not fit as clearly the criteria we had set. Eight case studies were undertaken (4 primary and 4 secondary) and two days spent in each school. Each case involved field note observations about the nature of break times and impressions of pupil experiences, semi-structured interviews with key members of school staff and playground supervisory staff as well as paired interviews/ focus groups with pupils in primary and secondary school respectively. We have used these approaches in our previous research on school meal times and grouping practices in schools and found them to be particularly productive for eliciting pupil experiences and perspectives on their social life in school (e.g. Kutnick et al., 2006; MacIntyre & Baines, 2014). Exact numbers of interviews and persons involved varied depending on the school and permissions, but each case study involved multiple interviews with staff and pupils as well as qualitative observations of the playground, communal areas and the dining room. The researchers kept field notes of their qualitative observations, contextual information, thoughts, views and impressions of pupils’ experiences during break and lunchtimes. The observation data provided background information and was used alongside data from the interviews with staff and pupils to make sense of experiences within the school.
Data from observations and interviews were drawn together into a single case study report for each school to report on experiences and views on the various stakeholders within each school context. Key themes were also identified across these reports to provide more general insights into the views and experiences of school staff and students in relation to breaks and social life in and outside of school. The case studies will be published as a separate report and available from www.breaktime.org.uk. What follows is a short pen portrait summary of each case study school.

113
School Pen portrait
Primary school P1
At this smaller than average rural village primary school, KS1 pupils have a morning and afternoon break of 15 minutes and a lunch break of 70 mins for Y1, 60 mins for Y2, 50 mins for Y3+4 and 40 mins for Y5+6. KS1 children therefore have some of the longest amount of break time at 90-100 mins and KS2 have some of the shortest 55 – 65 mins breaktimes documented in the survey. The playground was well resourced and selected pupils can attend a forest school club during break times. Supervisors are trained and receive informal guidance from senior leaders and largely supervise at a distance.
Primary school P2
At this medium to large urban, multi-ethnic primary school, pupils experience long breaks (KS1 pupils 105 mins; KS2 90 mins) with a 30 min morning break and a 60-75 minute lunch break. The medium sized playground areas have a rich array of fixed equipment, playground markings which afford a range of play activities. Each break there are also a wide range of more portable play resources, again enabling a wide range of constructive and imaginary play. There is a high ratio of supervisors to pupils. Supervision is more proactive and a number of structured adult led activities are offered while other supervisors often intervene in play to help and encourage the play along, or to involve children that are a little lost or on the fringes. There are a range of after school activities also offered.
Primary school P3
This large urban primary school with higher than average % in receipt of FSM runs a continental school day starting at 7.55 and finishing at 13.35. This is then followed by extended school day from 14.00 to 15.15 with a wide range of clubs offered to children that want them (about 2/3 of the school stay on for this). While KS1 runs like a conventional primary class with the same teacher for most lessons, KS2 has subject teaching with different teachers for each area. In terms of breaks for KS2, called ‘transitions’ – these are 5 minute comfort breaks between lessons (ie every hour). KS1 pupils have a 10 min break at about 9.30 and also at 10.30 (‘if they need one’). Pupils have a formal breaktime at 11:40 – 12:00. If children are staying for the extended day then they get another break at13.30 where they can have their lunch (but otherwise they have lunch during their first break at around 11.40). The playground space is relatively small and no field but does have a garden area, and a covered area.
Primary school P4
An average sized inner city mainstream state primary school serving a multi-ethnic and multi-lingual area of high deprivation. Nearly 1 in 5 students have a special educational need. Children have a 15 minute break in the morning followed by an hour long lunch break. KS1 pupils sometimes have an afternoon break (at the discretion of the teacher). Children also have ‘Golden Time’, a weekly period of 30 mins spent engaged in organised clubs or of free play (once per month) awarded to children that have engaged in expected (or better) behaviour. There are 2 playgrounds and a dining hall. One playground is situated on the roof of the school.

114
School Pen portrait
Secondary school S1
A smaller than average situated in a semi urban secondary school on the edge of a large city, with an average proportion of pupils in receipt of free school meals. Pupils predominantly come from the local area. The school has a hard top playground, sports courts and occasional green areas. There is a morning break of 20 mins for all students and a split lunch break of 30 mins for KS3 and then a subsequent 30 min break for KS4 pupils. The school day finishes at 14.35 (having started at 8.25) which is slightly earlier than other schools. The school runs a range of after school clubs and students are expected, though not required, to attend, though some have been cancelled because of insufficient numbers. Supervision is undertaken of inside and external areas by teachers and support staff.
Secondary school S2
A larger than average semi urban secondary school on the edge of a large town, with an school roll of nearly 2000 pupils and much lower than average proportion of pupils in receipt of free school meals (<5%). There is a break of 20 mins in the morning and then a lunch break of 60 minutes – totalling 80 minutes of break over a school day which is a lengthy amount of time compared to many other secondary schools. Many clubs are offered during break and lunch times and after school. Students have relative freedom to move about the large grounds inside and outside of the school, with access to 2-3 food outlets, their own form room where they can also eat and corridors (where they cannot eat). There are high expectations in relation to maintaining tidiness and good behaviour. Students are expected to self regulate or lose the freedom to access one space or another (e.g. form room). Supervision involves formal staff rota and also 3 senior leaders are on duty every day. Staff make an effort to be visible, personable and sociable. There is a sense of mutual respect and good student – staff relations. Mobile phones are not allowed to be used except by KS4+ students in the café which only they have access to.
Secondary school S3
An average to large urban secondary school situated on the fringes of a large city with a very high proportion of pupils in receipt of free school meals (>25%). The school has a fairly typical school day running from 8.15/8.45 – 15.10. There is a breaktime of 20 mins in the morning and then a split lunch of 30 mins where 3 year groups have lunch period at the same time. Students have access to a small canteen, an external hard top playground largely set up for sports, an indoor space for socialising with a few tables and chairs and each year group has a home room where students must be silent during lunch time. There are some clubs but there is little time to attend them – with most taking place during form group time and requiring special permission to attend. There is a place 2 be unit that students can access at lunchtime.
Secondary school S4
An average to large multi-ethnic urban secondary school situated on the fringes of a large city. The morning break is 15 mins and lunch breaks are 35 minutes. Students have access to a canteen where they must be sitting and eating. Otherwise students must remain outside on the playground and they have very limited access to indoor areas where they can socialise. Students have access to the library for silent study. There are no clubs or activities that take place during break or lunch times however there are activities for pupils to attend after school.

115
Appendix 2: Table 61. Length of different breaktimes (expressed as a category) at Key Stages 1 to 4 in relation to school type
KS1 KS2 KS3 KS4 A+F LA Indep A+F LA Indep A+F LA Indep A+F LA Indep
AM 10 1% 2% 2% 3% 15 85% 81% 32% 85% 81% 33% 20% 29% 6% 18% 28% 9% 20 11% 16% 32% 12% 17% 44% 68% 57% 53% 68% 57% 56%
25+ 4% 1% 37% 4% 1% 22% 12% 14% 38% 14% 15% 34%
Lunch Up to 35 1% 0% 5% 1% 0% 6% 23% 24% 24% 26%
36 - 44 1% 0% 1% 1% 29% 24% 9% 31% 28% 10% 45-54 10% 5% 21% 18% 28% 37% 12% 27% 33% 13% 55-64 75% 71% 58% 75% 75% 67% 19% 16% 44% 18% 14% 42%
65+ 13% 23% 36% 3% 6% 28% 1% 36% 1% 35%
PM 0 54% 44% 85% 87% 84% 89% 98% 100% 65% 98% 95% 59% 5 1% 1% 1% 1%
10 12% 16% 4% 6% 6% 2% 3% 15 33% 38% 15% 9% 9% 6% 6% 3% 13% 20 1% 1% 0% 3% 3%
25+ 1% 0% 6% 1% 21% 1% 22%
A+F = Academy and Free schools; LA = LA maintained schools; Indep.= Independent schools. Figures in bold and grey =>20%