Embed Size (px)
Citation preview

Statistician: Stephen Hughes ~ 0300 025 5060 ~ [email protected] This report is also available in Welsh
Enquiries from the press: 0300 025 8099 Public enquiries 0300 025 5050 Twitter: @statisticswales
School Census Results, 2018
25 July 2018
SFR 59/2018
The census data in this release relate to the position on Tuesday 16 January
2018. The teacher sickness absence data relates to the preceding calendar
year. These figures are not included in the School Census. This information is
collected directly from the local authorities in January each year.
Key results
Schools
Overall, there were 26 fewer Local Authority (LA) maintained schools than at
January 2017. This is mainly due to school mergers.
Pupils
There were 604 more pupils in LA maintained schools than at January 2017.
Free School Meals
The percentage of pupils aged 5-15 known to be eligible for free school meals
decreased by 0.4 percentage points since January 2017.
Class size
8.1 per cent of pupils (8,695) were in infant classes of over 30
pupils – down from 8.2 per cent (8,794) in January 2017.
2017 2018
LA Maintained Schools 1,547 1,521
All Schools 1,617 1,591
Nursery 11 11
Primary 1,287 1,261
Middle 10 13
Secondary 200 195
Special 39 41
Independent 70 70
2017 2018
466,508 467,112
2017 2018
17.8% 17.4%
About this release
An annual report that
presents data collected
from the School Census,
with additional
information on teacher
sickness absence.
It reports information for
the number of pupils by
age, gender, free school
meal eligibility, ethnicity
and special educational
needs (SEN), together
with information on the
number of schools,
teachers and support
staff.
In this release
Schools and pupils 2
Staff 9
Free School Meals 14
Ethnic background 16
Special Educational
Needs 17
Class size 20
Independent schools 22
Teacher sickness
absence 24

2
Schools and pupils
This section presents information on LA maintained schools and pupils. Local authorities meet their
expenditure partly from council tax and partly from general grants made by the Welsh Government.
The number of maintained Primary and Secondary schools continues to decrease, to 1,521 in
January 2018. However, the majority of the schools which closed have merged to form new schools.
The merging of Primary and Secondary schools into Middle schools started in 2012/13 and this
sector has grown each year since, rising to 13 in January 2018 from 10 in January 2017. (Table 1)
The local authority with the most schools was Cardiff with 126 and the local authority with the
fewest was Blaenau Gwent with 25 schools. (Table 1)
The total number of pupils in maintained schools was 467,112 in January 2018, an increase of
around 2,000 pupils since January 2014. (Table 3)
The Welsh Medium schools follow the same pattern as above, the merging of schools reducing
their total to 459 in January 2018. The total number of pupils in Welsh medium schools was
106,474 in January 2018, an increase of around 3,100 since January 2014. (Table 2)
Gwynedd had the highest number of Welsh medium schools (98 of 102 schools in Gwynedd),
followed by Carmarthenshire (74 of 112) and Isle of Anglesey (46 of 49). Blaenau Gwent had the
lowest number of Welsh medium schools (1 of 25). (Table 2)
Of the pupils aged under 5 in maintained schools in Wales, the majority of them were attending
school on a full time basis. (Table 4)
Chart 1: Number of pupils by age group, in maintained schools
0
50
100
150
200
250
'00 '01 '02 '03 '04 '05 '06 '07 '08 '09 '10 '11 '12 '13 '14 '15 '16 '17 '18
Nu
mb
er
of
pu
pil
s (t
ho
usa
nd
s)
Under 5 5 to 10 11 to 15 16 & over
The number of pupils aged under 5 has
decreased from 72,126 pupils in January
2017 to 70,564 pupils in January 2018.
The numbers of pupils aged 5 to 10 have
been increasing since 2011, to reach
213,059 in 2018. This reflects the
increasing birth rates in recent years.
The numbers of pupils aged 11 to 15
increased from 158,212 (January 2017) to
159,386 (January 2018). Prior to 2016,
they had been decreasing year on year
since 2004 again reflecting the
demographic consequence of lower birth
rates in the 2000s.

3
Table 1: Number of maintained schools by local authority, January 2018 (a)
Nursery Primary Middle Secondary Special (b) Total
Isle of Anglesey . 43 . 5 1 49
Gwynedd . 86 1 13 2 102
Conwy . 53 . 7 1 61
Denbighshire . 46 1 7 2 56
Flintshire . 64 . 11 2 77
Wrexham 1 58 . 9 1 69
Powys . 79 1 11 3 94
Ceredigion . 39 3 4 . 46
Pembrokeshire . 58 . 8 1 67
Carmarthenshire 1 97 . 12 2 112
Swansea . 79 . 14 2 95
Neath Port Talbot . 55 2 7 2 66
Bridgend . 48 . 9 2 59
The Vale of Glamorgan 2 44 1 7 1 55
Rhondda Cynon Taf . 102 1 16 4 123
Merthyr Tydfil 1 22 . 4 1 28
Caerphilly . 73 1 12 1 87
Blaenau Gwent . 19 2 2 2 25
Torfaen 1 26 . 6 1 34
Monmouthshire . 30 . 4 1 35
Newport 2 42 . 9 2 55
Cardiff 3 98 . 18 7 126
Wales 11 1,261 13 195 41 1,521
Wales – January 2017 11 1,287 10 200 39 1,547
Wales – January 2016 13 1,310 7 205 39 1,574
Wales – January 2015 13 1,330 6 207 39 1,595
Wales – January 2014 17 1,357 4 213 42 1,633
Source: School Census
(a) Nursery: age under 5. Primary: ages 3/4 to 10. Middle: ages 3/4 to 16/18. Secondary: ages 11 to 16/18.
(b) Special schools, both day and boarding, provide education for children with SEN who cannot be
educated satisfactorily in mainstream schools.

4
Table 2: Welsh medium schools and pupils by local authority, January 2018
Schools Pupils Schools Pupils Schools Pupils Schools Pupils
Isle of Anglesey 42 5,736 . . 4 2,899 46 8,635
Gwynedd 85 9,551 1 615 12 5,273 98 15,439
Conwy 22 2,501 . . 2 1,223 24 3,724
Denbighshire 16 2,385 . . 3 2,982 19 5,367
Flintshire 5 856 . . 1 502 6 1,358
Wrexham 8 1,775 . . 1 759 9 2,534
Powys 20 2,499 1 488 3 1,761 24 4,748
Ceredigion 34 3,330 3 2,194 3 1,762 40 7,286
Pembrokeshire 18 2,678 . . 1 882 19 3,560
Carmarthenshire 69 10,405 . . 5 5,485 74 15,890
Swansea 11 3,269 . . 2 1,704 13 4,973
Neath Port Talbot 9 1,970 1 1,323 . . 10 3,293
Bridgend 4 1,081 . . 1 623 5 1,704
The Vale of Glamorgan 6 1,689 1 1,120 . . 7 2,809
Rhondda Cynon Taf 16 4,717 1 639 3 2,513 20 7,869
Merthyr Tydfil 2 762 . . . . 2 762
Caerphilly 11 2,993 . . 1 1,625 12 4,618
Blaenau Gwent 1 256 . . . . 1 256
Torfaen 3 982 . . 1 888 4 1,870
Monmouthshire 2 396 . . . . 2 396
Newport 3 733 . . 1 159 4 892
Cardiff 17 5,625 . . 3 2,866 20 8,491
Wales 404 66,189 8 6,379 47 33,906 459 106,474
Wales – January 2017 420 66,612 6 4,247 49 34,986 475 105,845
Wales – January 2016 428 66,101 5 3,459 49 35,399 482 104,959
Wales – January 2015 435 65,460 4 2,448 50 36,485 489 104,393
Wales – January 2014 444 64,366 2 1,577 52 37,400 498 103,343
Source: School Census(a) Primary schools include Welsh Medium, Dual Stream and Transitional schools.
(b) Includes Welsh Medium and Bilingual schools.
Primary (a) Middle (b) Secondary (b) Total
Welsh medium schools: for further information please see these guidance notes.

5
Table 3: Number of pupils by age group in maintained schools, 2014-2018 (a)
2014 2015 2016 2017 2018
Nursery Under 5 1,353 1,076 1,019 866 815
5 and over 0 0 0 0 0
All ages 1,353 1,076 1,019 866 815
Primary Under 5 70,655 71,713 72,014 70,176 68,467
5 to 10 198,726 201,649 204,923 206,741 208,606
11 and over 40 38 17 23 22
All ages 269,421 273,400 276,954 276,940 277,095
Middle Under 5 268 330 415 836 1,044
5 to 10 660 970 1,104 2,294 2,925
11 to 15 2,278 2,695 3,337 5,463 7,331
16 and over 336 381 515 570 853
All ages 3,542 4,376 5,371 9,163 12,153
Secondary Under 16 157,840 154,445 152,284 150,618 149,922
16 and over 28,587 27,963 26,385 24,194 22,296
All ages 186,427 182,408 178,669 174,812 172,218
Special Under 5 238 245 245 248 238
5 to 10 1,185 1,225 1,297 1,399 1,525
11 to 15 1,933 1,979 2,001 2,111 2,114
16 and over 982 995 999 969 954
All ages 4,338 4,444 4,542 4,727 4,831
Total All ages 465,081 465,704 466,555 466,508 467,112
Source: School Census
(a) At January each year. Age as at 31 August in the previous year.

6
Table 4: Number of pupils aged under 5 in maintained schools by local authority,
January 2018 (a)
Boys Girls Total Boys Girls Total Boys Girls Total
Isle of Anglesey 380 381 761 331 321 652 711 702 1,413
Gwynedd 657 574 1,231 578 522 1,100 1,235 1,096 2,331
Conwy 574 553 1,127 522 531 1,053 1,096 1,084 2,180
Denbighshire 589 544 1,133 558 538 1,096 1,147 1,082 2,229
Flintshire 830 878 1,708 856 769 1,625 1,686 1,647 3,333
Wrexham 837 795 1,632 792 807 1,599 1,629 1,602 3,231
Powys 668 601 1,269 286 230 516 954 831 1,785
Ceredigion 434 420 854 180 193 373 614 613 1,227
Pembrokeshire 847 763 1,610 533 494 1,027 1,380 1,257 2,637
Carmarthenshire 1,590 1,540 3,130 373 353 726 1,963 1,893 3,856
Swansea 1,373 1,227 2,600 1,728 1,556 3,284 3,101 2,783 5,884
Neath Port Talbot 729 729 1,458 971 941 1,912 1,700 1,670 3,370
Bridgend 1,626 1,497 3,123 196 185 381 1,822 1,682 3,504
The Vale of Glamorgan 848 777 1,625 916 937 1,853 1,764 1,714 3,478
Rhondda Cynon Taf 2,423 2,411 4,834 519 508 1,027 2,942 2,919 5,861
Merthyr Tydfil 692 661 1,353 141 169 310 833 830 1,663
Caerphilly 1,145 1,206 2,351 1,188 1,122 2,310 2,333 2,328 4,661
Blaenau Gwent 442 426 868 480 423 903 922 849 1,771
Torfaen 570 569 1,139 519 474 993 1,089 1,043 2,132
Monmouthshire 465 415 880 244 226 470 709 641 1,350
Newport 1,060 959 2,019 996 880 1,876 2,056 1,839 3,895
Cardiff 2,177 1,971 4,148 2,355 2,270 4,625 4,532 4,241 8,773
Wales 20,956 19,897 40,853 15,262 14,449 29,711 36,218 34,346 70,564
Wales – January 2017 21,834 20,966 42,800 15,053 14,273 29,326 36,887 35,239 72,126
Wales – January 2016 22,379 21,568 43,947 15,183 14,563 29,746 37,562 36,131 73,693
Wales – January 2015 22,753 21,721 44,474 14,753 14,137 28,890 37,506 35,858 73,364
Wales – January 2014 22,425 21,352 43,777 14,825 13,912 28,737 37,250 35,264 72,514
Source: School Census
(a) Age as at 31 August 2017.
Full-time Part-time Total
This table has been re-designed to focus on the under 5 age group at local authority level following
increased interest in the early years of education.

7
Table 5: Pupil numbers by local authority, January 2018
Nursery Primary Middle Secondary Special Total Primary Middle Secondary Special Total
Isle of Anglesey . 5,909 . 3,717 92 9,718 4,501 . 3,165 72 7,738
Gwynedd . 9,673 615 6,492 215 16,995 7,442 533 5,753 157 13,885
Conwy . 9,051 . 6,530 221 15,802 6,885 . 5,342 165 12,392
Denbighshire . 8,744 472 6,105 277 15,598 6,543 393 5,354 216 12,506
Flintshire . 14,024 . 9,162 209 23,395 10,703 . 8,011 155 18,869
Wrexham 34 13,124 . 6,113 295 19,566 9,927 . 5,863 212 16,002
Powys . 9,460 488 6,992 267 17,207 7,701 394 6,021 198 14,314
Ceredigion . 4,441 2,194 2,948 . 9,583 3,425 1,744 2,368 . 7,537
Pembrokeshire . 10,694 . 6,500 155 17,349 8,059 . 5,715 120 13,894
Carmarthenshire 95 15,951 . 11,087 132 27,265 12,195 . 9,571 103 21,869
Swansea . 22,317 . 13,341 188 35,846 16,441 . 12,012 124 28,577
Neath Port Talbot . 12,205 2,829 5,651 244 20,929 8,964 2,494 5,461 223 17,142
Bridgend . 13,532 . 9,044 359 22,935 10,039 . 7,474 246 17,759
The Vale of Glamorgan 147 13,010 1,120 7,972 240 22,489 9,765 921 6,600 170 17,456
Rhondda Cynon Taf . 22,365 639 15,088 543 38,635 16,605 514 12,944 378 30,441
Merthyr Tydfil 78 5,830 . 2,833 174 8,915 4,264 . 2,832 118 7,214
Caerphilly . 17,191 901 10,169 147 28,408 12,609 759 9,267 98 22,733
Blaenau Gwent . 4,911 2,895 1,348 172 9,326 3,535 2,504 1,348 144 7,531
Torfaen 20 8,678 . 6,209 113 15,020 6,570 . 5,405 88 12,063
Monmouthshire . 6,823 . 4,787 32 11,642 5,473 . 3,926 32 9,431
Newport 150 15,420 . 10,014 182 25,766 11,688 . 8,382 143 20,213
Cardiff 291 33,742 . 20,116 574 54,723 25,294 . 17,108 477 42,879
Wales 815 277,095 12,153 172,218 4,831 467,112 208,628 10,256 149,922 3,639 372,445
Wales – January 2017 866 276,940 9,163 174,812 4,727 466,508 206,764 7,757 150,618 3,510 368,649
Wales – January 2016 1,019 276,954 5,371 178,669 4,542 466,555 204,940 4,441 152,284 3,298 364,963
Wales – January 2015 1,076 273,400 4,376 182,408 4,444 465,704 201,686 3,665 154,445 3,204 363,000
Wales – January 2014 1,353 269,421 3,542 186,427 4,338 465,081 198,765 2,938 157,840 3,118 362,661
Source: School Census(a) Age as at 31 August 2017.
Aged 5-15 (a)All pupils

8
Table 6: Full-time equivalent pupils by local authority, January 2018
Nursery Primary Middle Secondary Special Total
Isle of Anglesey . 5,583.5 . 3,717.0 91.5 9,392.0
Gwynedd . 9,142.5 596.0 6,492.0 214.5 16,445.0
Conwy . 8,528.0 . 6,530.0 217.5 15,275.5
Denbighshire . 8,201.0 468.5 6,105.0 275.0 15,049.5
Flintshire . 13,214.0 . 9,162.0 206.5 22,582.5
Wrexham 22.5 12,336.0 . 6,113.0 295.0 18,766.5
Powys . 9,202.5 488.0 6,992.0 266.5 16,949.0
Ceredigion . 4,300.5 2,148.0 2,948.0 . 9,396.5
Pembrokeshire . 10,180.5 . 6,500.0 155.0 16,835.5
Carmarthenshire 95.0 15,588.0 . 11,087.0 132.0 26,902.0
Swansea . 20,675.5 . 13,341.0 187.5 34,204.0
Neath Port Talbot . 11,286.0 2,792.5 5,651.0 243.5 19,973.0
Bridgend . 13,341.5 . 9,044.0 359.0 22,744.5
The Vale of Glamorgan 73.5 12,178.5 1,100.0 7,972.0 238.5 21,562.5
Rhondda Cynon Taf . 21,861.5 629.0 15,088.0 543.0 38,121.5
Merthyr Tydfil 66.5 5,686.5 . 2,833.0 174.0 8,760.0
Caerphilly . 16,053.0 884.0 10,169.0 147.0 27,253.0
Blaenau Gwent . 4,571.5 2,783.0 1,348.0 172.0 8,874.5
Torfaen 10.5 8,192.0 . 6,209.0 112.0 14,523.5
Monmouthshire . 6,588.0 . 4,787.0 32.0 11,407.0
Newport 75.5 14,557.0 . 10,014.0 181.5 24,828.0
Cardiff 145.5 31,577.0 . 20,116.0 572.0 52,410.5
Wales 489.0 262,844.5 11,889.0 172,218.0 4,815.5 452,256.0
Wales – January 2017 514.5 262,853.0 8,953.0 174,812.0 4,711.5 451,844.0
Wales – January 2016 593.0 262,615.0 5,280.0 178,669.0 4,525.0 451,682.0
Wales – January 2015 633.0 259,476.0 4,323.0 182,408.0 4,418.5 451,258.5
Wales – January 2014 785.0 255,691.5 3,496.5 186,426.5 4,311.5 450,711.0
Source: School Census
Full-time equivalent (FTE) pupil numbers count part-time pupils as 0.5.

9
Teachers and support staff
Chart 2: Number of qualified teachers in maintained schools
0
5
10
15
20
25
30
35
'00 '01 '02 '03 '04 '05 '06 '07 '08 '09 '10 '11 '12 '13 '14 '15 '16 '17 '18
Nu
mb
er
of
Te
ach
ers
(t
ho
usa
nd
s)
The number of qualified teachers in maintained schools in each local authority ranged between
3,147 in Cardiff, to 480 in Merthyr Tydfil. (Table 7)
There were 23,871 full-time equivalent qualified teachers in maintained schools, 39 fewer than at
January 2017. (Table 8)
The number of full-time equivalent qualified teachers in maintained schools was highest in
Cardiff at 2,853 teachers and lowest in Merthyr Tydfil at 456 teachers. (Table 8)
The number of teachers teaching either Welsh first language or other subjects through the
medium of Welsh in primary, middle and secondary schools was 5,515, up from 5,359 at January
2017. Data on the teaching of Welsh are available on StatsWales.
The pupil teacher ratio for all LA maintained schools was 18.9 in January 2018, unchanged from
January 2017. (Table 9)
Ceredigion had the lowest primary pupil teacher ratio at 19.2, and Rhondda Cynon Taf had the
highest at 25.1. The lowest secondary pupil teacher ratio was in Conwy at 15.4, and the highest
was in Pembrokeshire at 17.7. (Table 9)
The pupil teacher ratio was highest in primary schools at 22.0 and lowest in special schools at 6.7.
The pupil teacher ratio in secondary schools was 16.5. (Table 9)
There were 23,784 full-time equivalent support staff in maintained schools, up from 23,559 at
January 2017. (Table 10)
The number of qualified teachers in
2018 was 26,129 – the lowest number
since 2000. This is largely due to
school closures and amalgamations.
The number of qualified teachers has
remained fairly steady over the long
term – ranging between a peak of
28,461 in 2006 and a low of 26,129 in
2018.

10
Table 7: Number of qualified teachers by local authority, January 2018
Nursery Primary Middle Secondary Special Total
Isle of Anglesey . 306 . 246 13 565
Gwynedd . 513 39 442 27 1,021
Conwy . 477 . 457 28 962
Denbighshire . 425 31 395 35 886
Flintshire . 704 . 613 33 1,350
Wrexham 3 675 . 409 36 1,123
Powys . 544 37 483 43 1,107
Ceredigion . 268 148 192 . 608
Pembrokeshire . 514 . 402 24 940
Carmarthenshire 7 834 . 708 23 1,572
Swansea . 995 . 859 32 1,886
Neath Port Talbot . 572 171 361 42 1,146
Bridgend . 612 . 590 57 1,259
The Vale of Glamorgan 5 627 72 513 54 1,271
Rhondda Cynon Taf . 923 39 944 67 1,973
Merthyr Tydfil 3 276 . 178 23 480
Caerphilly . 768 57 681 33 1,539
Blaenau Gwent . 227 168 79 35 509
Torfaen 2 368 . 383 17 770
Monmouthshire . 334 . 300 9 643
Newport 5 712 . 623 32 1,372
Cardiff 20 1,668 . 1,354 105 3,147
Wales 45 13,342 762 11,212 768 26,129
Wales – January 2017 38 13,459 571 11,360 744 26,172
Wales – January 2016 48 13,558 373 11,727 747 26,453
Wales – January 2015 48 13,624 317 12,047 719 26,755
Wales – January 2014 59 13,670 236 12,378 721 27,064
Source: School Census

11
Table 8: Full-time equivalent qualified teachers by local authority, January 2018
Nursery Primary Middle Secondary Special Total
Isle of Anglesey . 278.8 . 231.6 13.0 523.3
Gwynedd . 448.3 36.3 411.4 25.6 921.6
Conwy . 423.3 . 424.5 26.2 874.0
Denbighshire . 371.1 26.5 369.2 33.3 800.0
Flintshire . 633.5 . 547.0 28.6 1,209.1
Wrexham 3.0 587.5 . 386.6 30.6 1,007.7
Powys . 447.7 35.5 432.2 38.6 954.1
Ceredigion . 224.4 132.4 172.2 . 529.0
Pembrokeshire . 449.6 . 366.4 21.6 837.6
Carmarthenshire 5.4 750.1 . 666.2 22.5 1,444.2
Swansea . 882.3 . 789.2 30.4 1,701.9
Neath Port Talbot . 516.7 163.3 341.5 39.4 1,060.9
Bridgend . 570.7 . 561.2 54.4 1,186.4
The Vale of Glamorgan 4.5 559.4 68.2 481.4 49.0 1,162.5
Rhondda Cynon Taf . 869.5 36.9 907.4 64.5 1,878.3
Merthyr Tydfil 3.0 257.1 . 172.6 23.0 455.7
Caerphilly . 714.0 52.0 632.2 31.4 1,429.6
Blaenau Gwent . 211.9 162.6 76.9 32.2 483.6
Torfaen 2.0 344.4 . 364.2 16.0 726.6
Monmouthshire . 288.5 . 275.1 9.0 572.6
Newport 4.6 645.3 . 579.3 30.2 1,259.4
Cardiff 16.4 1,466.9 . 1,270.3 99.0 2,852.7
Wales 38.9 11,940.8 713.7 10,458.7 718.6 23,870.6
Wales – January 2017 33.5 12,055.6 532.7 10,593.7 694.3 23,909.8
Wales – January 2016 42.3 12,170.8 345.2 10,983.9 693.6 24,235.8
Wales – January 2015 43.4 12,240.2 290.0 11,268.8 668.2 24,510.8
Wales – January 2014 52.8 12,308.2 221.7 11,578.8 660.9 24,822.5
Source: School Census
FTE of part-time teachers expresses the teachers’ service in hours as a proportion of a school week: 32.5
hours for maintained schools.

12
Table 9: Pupil teacher ratios within schools by local authority, January 2018
Nursery Primary Middle Secondary Special Total
Isle of Anglesey . 20.0 . 16.1 7.0 17.9
Gwynedd . 20.4 16.4 15.8 8.4 17.8
Conwy . 20.1 . 15.4 8.3 17.5
Denbighshire . 22.1 17.7 16.5 8.3 18.8
Flintshire . 20.9 . 16.8 7.2 18.7
Wrexham 7.5 21.0 . 15.8 9.6 18.6
Powys . 20.6 13.7 16.2 6.9 17.8
Ceredigion . 19.2 16.2 17.1 . 17.8
Pembrokeshire . 22.6 . 17.7 7.2 20.1
Carmarthenshire 17.5 20.8 . 16.6 5.9 18.6
Swansea . 23.4 . 16.9 6.2 20.1
Neath Port Talbot . 21.8 17.1 16.5 6.2 18.8
Bridgend . 23.4 . 16.1 6.6 19.2
The Vale of Glamorgan 16.4 21.8 16.1 16.6 4.9 18.5
Rhondda Cynon Taf . 25.1 17.1 16.6 8.4 20.3
Merthyr Tydfil 22.2 22.1 . 16.4 7.6 19.2
Caerphilly . 22.5 17.0 16.1 4.7 19.1
Blaenau Gwent . 21.6 17.1 17.5 5.3 18.4
Torfaen 5.3 23.8 . 17.0 7.0 20.0
Monmouthshire . 22.8 . 17.4 3.6 19.9
Newport 16.4 22.6 . 17.3 6.0 19.7
Cardiff 8.9 21.5 . 15.8 5.8 18.4
Wales 12.6 22.0 16.7 16.5 6.7 18.9
Wales – January 2017 15.4 21.8 16.8 16.5 6.8 18.9
Wales – January 2016 14.0 21.6 15.3 16.3 6.5 18.6
Wales – January 2015 14.6 21.2 14.9 16.2 6.6 18.4
Wales – January 2014 14.9 20.8 15.8 16.1 6.5 18.2
Source: School Census
Pupil Teacher Ratio (PTR): calculated by dividing the FTE number of pupils by the FTE number of qualified
teachers (head teachers, acting head teachers, assistant head teachers, deputy heads and other qualified
teachers).

13
Table 10: Full-time equivalent support staff by local authority, January 2018
Nursery Primary Middle Secondary Special Total
Isle of Anglesey . 318.8 . 173.7 34.3 526.8
Gwynedd . 478.0 29.5 234.6 79.8 821.9
Conwy . 411.6 . 228.2 109.0 748.9
Denbighshire . 439.5 21.4 256.8 106.1 823.8
Flintshire . 764.5 . 308.2 90.3 1,163.0
Wrexham 9.1 766.5 . 252.3 165.8 1,193.7
Powys . 459.4 19.5 233.2 117.7 829.8
Ceredigion . 294.5 191.1 157.6 . 643.2
Pembrokeshire . 676.4 . 299.8 83.7 1,059.9
Carmarthenshire 7.2 882.4 . 479.1 91.3 1,460.0
Swansea . 1,264.9 . 554.4 107.8 1,927.1
Neath Port Talbot . 636.5 104.7 177.2 112.2 1,030.6
Bridgend . 701.2 . 257.5 209.0 1,167.7
The Vale of Glamorgan 10.0 559.3 21.8 220.2 158.6 970.0
Rhondda Cynon Taf . 1,099.6 18.6 429.1 169.2 1,716.6
Merthyr Tydfil 7.6 285.4 . 77.8 64.5 435.4
Caerphilly . 877.9 26.5 307.9 98.0 1,310.2
Blaenau Gwent . 275.2 186.4 44.1 88.8 594.6
Torfaen 2.7 477.8 . 183.9 82.1 746.5
Monmouthshire . 396.4 . 148.6 17.6 562.6
Newport 12.8 722.7 . 358.8 95.9 1,190.1
Cardiff 21.4 1,861.2 . 782.8 196.1 2,861.5
Wales 70.8 14,649.8 619.5 6,165.8 2,278.0 23,783.9
Wales – January 2017 93.5 14,720.0 439.0 6,241.1 2,065.3 23,559.0
Wales – January 2016 76.1 15,032.1 250.5 6,531.8 2,104.4 23,994.9
Wales – January 2015 84.8 15,295.2 219.7 6,801.0 2,040.3 24,441.0
Wales – January 2014 104.0 15,095.2 153.4 6,980.8 2,021.1 24,354.5
Source: School Census

14
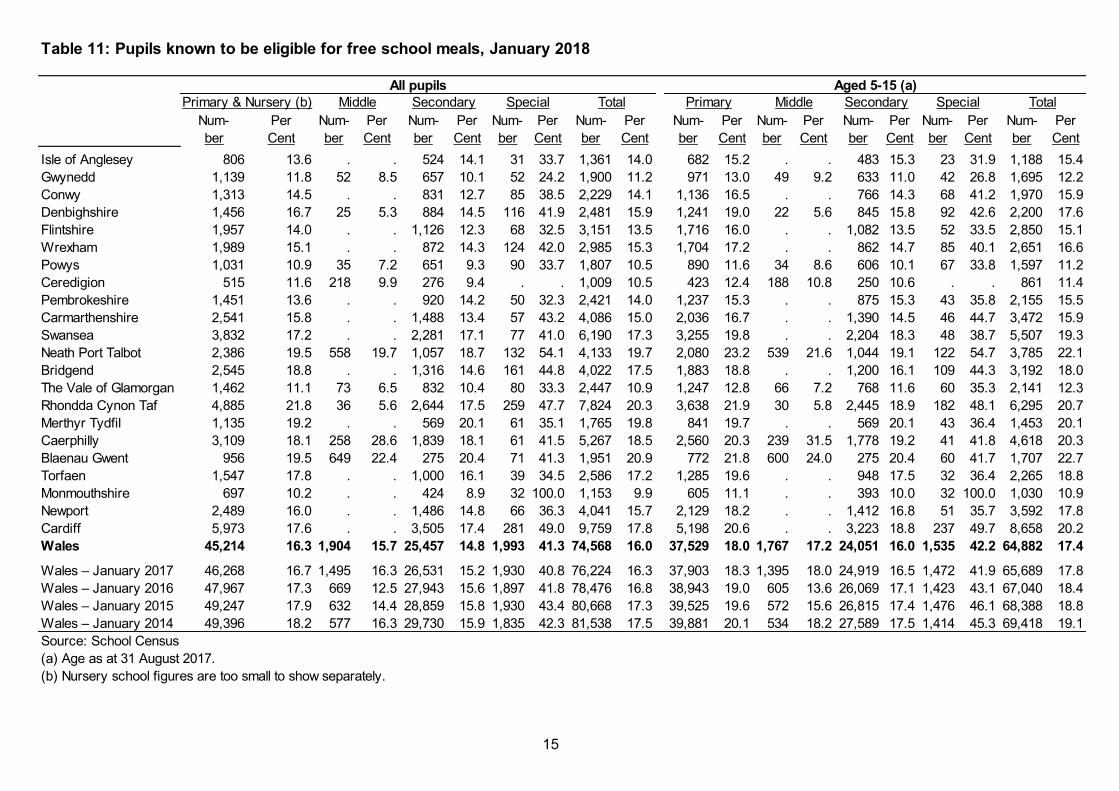
Free school meals (FSM) (Table 11)
Pupils are eligible for free school meals if their families are in receipt of certain benefits/support payments.
The number of pupils eligible for free meals has decreased from 76,224 pupils in January 2017 to
74,568 pupils in January 2018.
The percentage of pupils known to be eligible for free meals has decreased from 16.3 in January
2017 to 16.0 in January 2018.
The number of pupils aged 5-15 eligible for free meals has decreased from 65,689 pupils in
January 2017 to 64,882 pupils in January 2018.
The percentage of pupils aged 5-15 known to be eligible for free meals has decreased from 17.8
in January 2017 to 17.4 in January 2018.
The percentage of pupils known to be eligible for free meals was highest in special schools at 41.3
per cent of pupils and 42.2 per cent of pupils aged 5-15.
The number of pupils eligible for free meals was highest in Cardiff at 9,759 and lowest in
Ceredigion at 1,009.
Monmouthshire had the lowest percentage of pupils eligible for free meals at 9.9, and Blaenau
Gwent had the highest at 20.9.
The number of pupils aged 5-15 eligible for free meals was highest in Cardiff at 8,658 and lowest
in Ceredigion at 861.
Monmouthshire had the lowest percentage of pupils aged 5-15 eligible for free meals at 10.9, and
Blaenau Gwent had the highest at 22.7.
Chart 3: Percentage of pupils known to be eligible for free school meals
0
5
10
15
20
25
'04 '05 '06 '07 '08 '09 '10 '11 '12 '13 '14 '15 '16 '17 '18
% o
f e
lig
ible
pu
pil
s
All ages Aged 5-15
The percentage of pupils known
to be eligible for free school
meals in primary, middle,
secondary and special schools
has fluctuated over the last
decade, generally decreasing
from 2004 to 2008 and then
increasing year on year to 2011.
There has been a decrease
between 2013 and 2018.
15
Table 11: Pupils known to be eligible for free school meals, January 2018
Num- Per Num- Per Num- Per Num- Per Num- Per Num- Per Num- Per Num- Per Num- Per Num- Per
ber Cent ber Cent ber Cent ber Cent ber Cent ber Cent ber Cent ber Cent ber Cent ber Cent
Isle of Anglesey 806 13.6 . . 524 14.1 31 33.7 1,361 14.0 682 15.2 . . 483 15.3 23 31.9 1,188 15.4
Gwynedd 1,139 11.8 52 8.5 657 10.1 52 24.2 1,900 11.2 971 13.0 49 9.2 633 11.0 42 26.8 1,695 12.2
Conwy 1,313 14.5 . . 831 12.7 85 38.5 2,229 14.1 1,136 16.5 . . 766 14.3 68 41.2 1,970 15.9
Denbighshire 1,456 16.7 25 5.3 884 14.5 116 41.9 2,481 15.9 1,241 19.0 22 5.6 845 15.8 92 42.6 2,200 17.6
Flintshire 1,957 14.0 . . 1,126 12.3 68 32.5 3,151 13.5 1,716 16.0 . . 1,082 13.5 52 33.5 2,850 15.1
Wrexham 1,989 15.1 . . 872 14.3 124 42.0 2,985 15.3 1,704 17.2 . . 862 14.7 85 40.1 2,651 16.6
Powys 1,031 10.9 35 7.2 651 9.3 90 33.7 1,807 10.5 890 11.6 34 8.6 606 10.1 67 33.8 1,597 11.2
Ceredigion 515 11.6 218 9.9 276 9.4 . . 1,009 10.5 423 12.4 188 10.8 250 10.6 . . 861 11.4
Pembrokeshire 1,451 13.6 . . 920 14.2 50 32.3 2,421 14.0 1,237 15.3 . . 875 15.3 43 35.8 2,155 15.5
Carmarthenshire 2,541 15.8 . . 1,488 13.4 57 43.2 4,086 15.0 2,036 16.7 . . 1,390 14.5 46 44.7 3,472 15.9
Swansea 3,832 17.2 . . 2,281 17.1 77 41.0 6,190 17.3 3,255 19.8 . . 2,204 18.3 48 38.7 5,507 19.3
Neath Port Talbot 2,386 19.5 558 19.7 1,057 18.7 132 54.1 4,133 19.7 2,080 23.2 539 21.6 1,044 19.1 122 54.7 3,785 22.1
Bridgend 2,545 18.8 . . 1,316 14.6 161 44.8 4,022 17.5 1,883 18.8 . . 1,200 16.1 109 44.3 3,192 18.0
The Vale of Glamorgan 1,462 11.1 73 6.5 832 10.4 80 33.3 2,447 10.9 1,247 12.8 66 7.2 768 11.6 60 35.3 2,141 12.3
Rhondda Cynon Taf 4,885 21.8 36 5.6 2,644 17.5 259 47.7 7,824 20.3 3,638 21.9 30 5.8 2,445 18.9 182 48.1 6,295 20.7
Merthyr Tydfil 1,135 19.2 . . 569 20.1 61 35.1 1,765 19.8 841 19.7 . . 569 20.1 43 36.4 1,453 20.1
Caerphilly 3,109 18.1 258 28.6 1,839 18.1 61 41.5 5,267 18.5 2,560 20.3 239 31.5 1,778 19.2 41 41.8 4,618 20.3
Blaenau Gwent 956 19.5 649 22.4 275 20.4 71 41.3 1,951 20.9 772 21.8 600 24.0 275 20.4 60 41.7 1,707 22.7
Torfaen 1,547 17.8 . . 1,000 16.1 39 34.5 2,586 17.2 1,285 19.6 . . 948 17.5 32 36.4 2,265 18.8
Monmouthshire 697 10.2 . . 424 8.9 32 100.0 1,153 9.9 605 11.1 . . 393 10.0 32 100.0 1,030 10.9
Newport 2,489 16.0 . . 1,486 14.8 66 36.3 4,041 15.7 2,129 18.2 . . 1,412 16.8 51 35.7 3,592 17.8
Cardiff 5,973 17.6 . . 3,505 17.4 281 49.0 9,759 17.8 5,198 20.6 . . 3,223 18.8 237 49.7 8,658 20.2
Wales 45,214 16.3 1,904 15.7 25,457 14.8 1,993 41.3 74,568 16.0 37,529 18.0 1,767 17.2 24,051 16.0 1,535 42.2 64,882 17.4
Wales – January 2017 46,268 16.7 1,495 16.3 26,531 15.2 1,930 40.8 76,224 16.3 37,903 18.3 1,395 18.0 24,919 16.5 1,472 41.9 65,689 17.8
Wales – January 2016 47,967 17.3 669 12.5 27,943 15.6 1,897 41.8 78,476 16.8 38,943 19.0 605 13.6 26,069 17.1 1,423 43.1 67,040 18.4
Wales – January 2015 49,247 17.9 632 14.4 28,859 15.8 1,930 43.4 80,668 17.3 39,525 19.6 572 15.6 26,815 17.4 1,476 46.1 68,388 18.8
Wales – January 2014 49,396 18.2 577 16.3 29,730 15.9 1,835 42.3 81,538 17.5 39,881 20.1 534 18.2 27,589 17.5 1,414 45.3 69,418 19.1
Source: School Census
(a) Age as at 31 August 2017.
(b) Nursery school figures are too small to show separately.
SpecialSecondaryPrimary & Nursery (b) Middle
All pupils
Total
Aged 5-15 (a)
Primary Middle Secondary Special Total

16
Ethnic background
This is the ethnic group with which the pupil identifies her/himself.
Of the total number of pupils aged 5 or over at primary, middle, secondary and special schools in
Wales, January 2018, 88.5 per cent of pupils were identified as White British. This figure has been
falling slightly for each of the past five years with all other ethnic backgrounds showing increases
over the same period.
The number of pupils in the Any other White background group have increased by 3,400 since
2014 and Mixed ethnic background pupils have increased by 2,600 since 2014.
The percentage of pupils whose ethnic background was identified as minority ethnic origin was
11.0 and 0.5 per cent were unknown or not stated.
Of the pupils whose ethnic background was identified as Black, 80.7 per cent of them were
identified as Black African.
Table 12: Number of pupils aged 5 or over by ethnic background, January 2014-2018
Per Per Per Per Per
cent cent cent cent cent
Ethnic background Number (a) Number (a) Number (a) Number (a) Number (a)
White 364,260 92.8 363,031 92.5 362,290 92.2 362,721 92.0 363,528 91.7
White British 355,085 90.5 352,850 89.9 351,145 89.4 350,795 88.9 350,830 88.5
Traveller 346 0.1 378 0.1 385 0.1 389 0.1 433 0.1
Gypsy/ Roma 545 0.1 579 0.1 611 0.2 623 0.2 589 0.1
Any other White background 8,284 2.1 9,224 2.4 10,149 2.6 10,914 2.8 11,676 2.9
Mixed 9,337 2.4 9,872 2.5 10,592 2.7 11,166 2.8 11,947 3.0
White and Black Caribbean 2,172 0.6 2,227 0.6 2,314 0.6 2,374 0.6 2,456 0.6
White and Black African 1,120 0.3 1,244 0.3 1,398 0.4 1,524 0.4 1,691 0.4
White and Asian 2,115 0.5 2,212 0.6 2,351 0.6 2,436 0.6 2,594 0.7
Any other mixed background 3,930 1.0 4,189 1.1 4,529 1.2 4,832 1.2 5,206 1.3
Asian 8,696 2.2 8,914 2.3 9,185 2.3 9,341 2.4 9,592 2.4
Indian 1,830 0.5 1,931 0.5 2,056 0.5 2,130 0.5 2,200 0.6
Pakistani 2,866 0.7 2,947 0.8 3,009 0.8 3,057 0.8 3,081 0.8
Bangladeshi 3,064 0.8 3,119 0.8 3,188 0.8 3,203 0.8 3,273 0.8
Any other Asian background 936 0.2 917 0.2 932 0.2 951 0.2 1,038 0.3
Black 3,005 0.8 3,169 0.8 3,355 0.9 3,462 0.9 3,596 0.9
Black Caribbean 194 0.0 187 0.0 194 0.0 199 0.1 204 0.1
Black African 2,452 0.6 2,598 0.7 2,743 0.7 2,826 0.7 2,903 0.7
Any other Black background 359 0.1 384 0.1 418 0.1 437 0.1 489 0.1
Chinese 680 0.2 702 0.2 720 0.2 751 0.2 777 0.2
Any other ethnic group 4,145 1.1 4,451 1.1 4,639 1.2 5,006 1.3 5,180 1.3
Total with valid category 390,123 99.4 390,139 99.4 390,781 99.5 392,447 99.5 394,620 99.5
Unknown or not stated 2,444 0.6 2,201 0.6 2,081 0.5 1,935 0.5 1,928 0.5
All pupils 392,567 100.0 392,340 100.0 392,862 100.0 394,382 100.0 396,548 100.0
Source: School Census
(a) Of all pupils aged 5 or over.
2016 20182014 2015 2017
Please see these guidance notes for further information on categories and data collection methods.

17
Special Educational Needs (SEN)
A child has special needs if he or she has learning difficulties which requires special educational provision
to be made for him or her. A learning difficulty means that the child has significantly greater difficulty in
learning than most children of the same age or that the child has a disability that needs different educational
facilities from those that the school generally provides for children. Pupils with special educational needs
may have Statements issued by the LA or may have their needs identified by the school. In the latter case
they come under one of two further categories: School Action or School Action Plus.
i. Pupils with statements - Pupils for whom the Authority maintains a statement of special educational
needs under Part iv of the Education Act 1996. A statement may be issued by the LA after assessment of a
child’s needs.
ii. School Action - When a class or subject teacher identify that a pupil has special educational needs they
provide interventions that are additional to or different from those provided as part of the school’s usual
curriculum.
iii. School Action Plus - When the class or subject teacher and the Special Educational Needs Co-ordinator
are provided with advice or support from outside specialists, so that alternative interventions additional or
different to those provided for the pupil through 'School Action' can be put in place. The Special Educational
Needs Co-ordinator usually takes the lead although day-to-day provision continues to be the responsibility
of class or subject teacher.
From January 2017 maintained schools were allowed to report as many special educational needs
for a pupil as required. These reports are not ranked and therefore have no SEN type that can be
shown as a pupil’s ‘Major Need’. That means the data for SEN type shown in Table 14 are not
directly comparable with school census results published before 2017.
There were 105,625 pupils with special educational needs in maintained schools (22.6 per cent of
all pupils). (Table 13)
12.2 per cent of the pupils with special educational needs have Statements of SEN. (Table 13)
There were 137,845 reports of SEN type made – an average of 1.3 per pupil with SEN. (Table 14)
The most common type of need reported was ‘General Learning Difficulties’, representing 34.5 per
cent of pupils with some form of SEN. (Table 14)
The most common type of need reported for pupils with Statements of SEN was ‘Autistic Spectrum
Disorders’, representing 32.9 per cent of pupils with Statements of SEN, followed by Speech,
Language & Communication Difficulties (32.3 per cent). (Table 14)

18
Table 13: Pupils with special educational needs (SEN) in maintained schools by type of SEN provision and
local authority, January 2018
Number Number Number Number
of Incid- Place- of Incid- Place- of Incid- Place- of Incid- Place-
pupils ence (a) ment (b) pupils ence (a) ment (b) pupils ence (a) ment (b) pupils ence (a) ment (b)
Isle of Anglesey 1,011 0.2 1.7 866 0.2 2.5 320 0.1 2.5 2,197 0.5 2.1
Gwynedd 1,785 0.4 3.1 1,638 0.4 4.7 502 0.1 3.9 3,925 0.8 3.7
Conwy 1,705 0.4 2.9 1,745 0.4 5.0 319 0.1 2.5 3,769 0.8 3.6
Denbighshire 1,648 0.4 2.8 1,903 0.4 5.5 426 0.1 3.3 3,977 0.9 3.8
Flintshire 2,846 0.6 4.9 1,283 0.3 3.7 547 0.1 4.2 4,676 1.0 4.4
Wrexham 2,084 0.4 3.6 1,102 0.2 3.2 607 0.1 4.7 3,793 0.8 3.6
Powys 1,890 0.4 3.3 1,087 0.2 3.1 388 0.1 3.0 3,365 0.7 3.2
Ceredigion 1,968 0.4 3.4 601 0.1 1.7 136 - 1.1 2,705 0.6 2.6
Pembrokeshire 2,561 0.5 4.4 1,351 0.3 3.9 379 0.1 2.9 4,291 0.9 4.1
Carmarthenshire 4,048 0.9 7.0 2,520 0.5 7.2 831 0.2 6.4 7,399 1.6 7.0
Swansea 5,413 1.2 9.3 2,392 0.5 6.9 1,471 0.3 11.4 9,276 2.0 8.8
Neath Port Talbot 2,929 0.6 5.1 1,547 0.3 4.4 862 0.2 6.7 5,338 1.1 5.1
Bridgend 2,910 0.6 5.0 1,335 0.3 3.8 379 0.1 2.9 4,624 1.0 4.4
The Vale of Glamorgan 2,072 0.4 3.6 1,179 0.3 3.4 363 0.1 2.8 3,614 0.8 3.4
Rhondda Cynon Taf 6,289 1.3 10.9 2,529 0.5 7.3 1,049 0.2 8.1 9,867 2.1 9.3
Merthyr Tydfil 1,451 0.3 2.5 870 0.2 2.5 263 0.1 2.0 2,584 0.6 2.4
Caerphilly 2,939 0.6 5.1 2,119 0.5 6.1 712 0.2 5.5 5,770 1.2 5.5
Blaenau Gwent 888 0.2 1.5 958 0.2 2.8 254 0.1 2.0 2,100 0.4 2.0
Torfaen 1,626 0.3 2.8 1,575 0.3 4.5 212 - 1.6 3,413 0.7 3.2
Monmouthshire 910 0.2 1.6 835 0.2 2.4 262 0.1 2.0 2,007 0.4 1.9
Newport 2,445 0.5 4.2 2,067 0.4 5.9 900 0.2 7.0 5,412 1.2 5.1
Cardiff 6,515 1.4 11.2 3,295 0.7 9.5 1,713 0.4 13.3 11,523 2.5 10.9
Total 57,933 12.4 100.0 34,797 7.4 100.0 12,895 2.8 100.0 105,625 22.6 100.0
Source: School Census
(a) Incidence - the number of pupils expressed as a proportion of the total number of pupils on roll in maintained schools.
(b) Placement - the number of pupils expressed as a proportion of the total number of pupils within each SEN grouping in maintained schools.
e.g. Number of pupils with a statement of SEN divided by the total number of pupils with a statement of SEN in maintained schools.
Total
Percentage
School Action School Action Plus
Percentage Percentage Percentage
Statement

19
Table 14: Reports of Special Educational Needs (SEN) in maintained schools by type of need and SEN provision,
January 2018 (a) (b)
School School School
School Action State- School Action State- All School Action State-
SEN Type Action Plus ment Total Action Plus ment SEN Action Plus ment Total
Attention Deficit Hyperactivity Disorder 715 1,466 659 2,840 1.2 4.2 5.1 2.7 0.2 0.3 0.1 0.6
Autistic Spectrum Disorders 757 2,650 4,248 7,655 1.3 7.6 32.9 7.2 0.2 0.6 0.9 1.6
Behavioural, Emotional &
Social Difficulties 10,443 11,211 2,763 24,417 18.0 32.2 21.4 23.1 2.2 2.4 0.6 5.2
Dyscalculia 399 233 21 653 0.7 0.7 0.2 0.6 0.1 - - 0.1
Dyslexia 4,656 3,108 325 8,089 8.0 8.9 2.5 7.7 1.0 0.7 0.1 1.7
Dyspraxia 374 521 142 1,037 0.6 1.5 1.1 1.0 0.1 0.1 - 0.2
General Learning Difficulties 27,124 8,287 1,006 36,417 46.8 23.8 7.8 34.5 5.8 1.8 0.2 7.8
Hearing Impairment 798 1,712 612 3,122 1.4 4.9 4.7 3.0 0.2 0.4 0.1 0.7
Moderate Learning Difficulties 10,201 4,523 2,153 16,877 17.6 13.0 16.7 16.0 2.2 1.0 0.5 3.6
Multi-Sensory Impairment 20 53 105 178 - 0.2 0.8 0.2 - - - -
Physical & Medical Difficulties 1,854 3,202 2,169 7,225 3.2 9.2 16.8 6.8 0.4 0.7 0.5 1.5
Profound & Multiple Learning Difficulties 26 144 685 855 - 0.4 5.3 0.8 - - 0.1 0.2
Speech, Language &
Communication Difficulties 8,710 11,288 4,169 24,167 15.0 32.4 32.3 22.9 1.9 2.4 0.9 5.2
Severe Learning Difficulties 62 492 2,291 2,845 0.1 1.4 17.8 2.7 - 0.1 0.5 0.6
Visual Impairment 310 706 452 1,468 0.5 2.0 3.5 1.4 0.1 0.2 0.1 0.3
Source: School Census
(a) Please see Table 13 for the number and percentage of Pupils with SEN.
(b) From January 2017 maintained schools were allowed to report as many types of special educational need for a pupil as required and the ranking of those
needs was removed. The 'Major need' used in earlier publications no longer applies and therefore the figures are not directly comparable with previous years.
(c) The number of times each SEN type was reported e.g. if SEN types 'Dyslexia' and 'Dyspraxia' are reported for a pupil that pupil is counted twice,
once under each type. The number of SEN reports will therefore be greater than the number of pupils with SEN.
(d) The number of reports for pupils in each SEN provision expressed as a proportion of the total number of pupils within that SEN provision.
e.g. Number of SEN reports for pupils with a statement of SEN divided by the total number of pupils with a statement of SEN in maintained schools.
(e) The number of SEN reports for pupils expressed as a proportion of the total number of pupils on roll in maintained schools.
percentage of all pupils
(c) in each SEN provision (d) on roll (e)
Number of SEN Reports as a SEN Reports as a
SEN Reports percentage of the pupils

20
Class sizes in primary and middle schools
Infant classes of more than 30 pupils are unlawfully large unless specific circumstances called
‘exceptions’ are satisfied.
Infant (Table 15)
8.1 per cent of pupils (8,695) were in infant classes of over 30 pupils, down from 8.2 per
cent (8,794) in January 2017.
0.3 per cent of pupils (359) were in unlawfully large classes of over 30 pupils, down from
0.8 per cent (887) in January 2017.
Table 15: Infant class sizes in primary and middle schools (a)
Per Per PerNumber cent (b) Number cent (b) Number cent (b)
25.6 . 25.6 . 25.6 .
4,233 . 4,206 . 4,177 .
108,441 . 107,725 . 106,845 .
Classes 3,978 94.0 3,930 93.4 3,903 93.4
Pupils 100,245 92.4 98,931 91.8 98,150 91.9
Large Infant Classes (31 or more pupils) (d)
Classes 255 6.0 276 6.6 274 6.6
of which:
Lawfully large classes
with 'excepted' pupils (e) 241 5.7 249 5.9 263 6.3
Unlawfully large classes (f) 14 0.3 27 0.6 11 0.3
Pupils in large classes (g) 8,196 7.6 8,794 8.2 8,695 8.1
of which:
Lawfully large classes
with 'excepted' pupils (e) 7,706 7.1 7,907 7.3 8,336 7.8
Unlawfully large classes (f) 490 0.5 887 0.8 359 0.3
Source: School Census
(a)
(b) Percentage of all classes/pupils.
(c)
(d)
(e)
(f) Classes of 31 or more, excluding those large classes engaged in an excepted activity.
(g) Includes all pupils in large classes, including those with excepted activity.
Includes only those classes where there are pupils who have been admitted as exceptions making the
class size within the legal limit of 30 pupils or less.
2016 2017
Average class size
All classes
All pupils
The Schools Standards and Framework Act 1998 and associated regulations placed a statutory duty
on local authorities and governing bodies to limit the size of Reception classes to 30 from 1999;
Reception and Year 1 classes from 2000 and Reception, Year 1 and Year 2 from 2001. Mixed year or
mixed Key Stage classes are subject to the limit, where the majority of the class is made up of pupils in
the appropriate year groups; this includes mixed nursery/reception classes. In this table, where a class
has more than one teacher the number of pupils divided by the number of teachers determines if the
size is over 30.
At January each year.
2018
Classes (30 pupils or less) (c)
Both infant and junior classes with one teacher are allowed to have more than 30 children in very
specific circumstances. These are called exceptions. Exception categories for infant classes are
defined in the Schedule to the Education (Infant Class Sizes) (Wales) Regulations 1998, as amended
by the Education (Infant Class Sizes) (Wales) (Amendment) Regulations 2009. Exception categories
for junior classes are not set out in regulations but are enforced as part of the data collection.

21
Junior (Table 16)
12.3 per cent of junior classes (662) were regarded as large classes and had a total of
21,237 pupils (15.1 per cent of all pupils). This is more than at January 2017 when 590
classes (11.1 per cent) were considered large and they had a total of 18,914 (13.7 per cent
of all pupils).
Table 16: Junior class sizes in primary and middle schools (a)
Per Per Per
Number cent (b) Number cent (b) Number cent (b)
25.6 . 25.9 . 26.1 .
5,319 . 5,331 . 5,379 .
136,261 . 138,151 . 140,428 .
Classes (30 pupils or less)
Classes 4,779 89.8 4,741 88.9 4,717 87.7
Pupils 118,982 87.3 119,237 86.3 119,191 84.9
Large Junior Classes (31 or more pupils) (c)
Classes 540 10.2 590 11.1 662 12.3
of which:
With 'excepted' pupils (d) 400 7.5 424 8.0 481 8.9
Without 'excepted' pupils (e) 140 2.6 166 3.1 181 3.4
Pupils in large classes (f) 17,279 12.7 18,914 13.7 21,237 15.1
of which:
With 'excepted' pupils (d) 12,711 9.3 13,537 9.8 15,360 10.9
Without 'excepted' pupils (e) 4,568 3.4 5,377 3.9 5,877 4.2
Source: School Census
(a)
(b) Percentage of all classes/pupils.
(c)
(d)
(e) Classes of 31 or more, excluding those large classes engaged in an excepted activity.
(f) Includes all pupils in large classes, including those with excepted activity.
At January each year.
Both infant and junior classes with one teacher are allowed to have more than 30 children in very
specific circumstances. These are called exceptions. Exception categories for infant classes are
defined in the Schedule to the Education (Infant Class Sizes) (Wales) Regulations 1998, as amended
by the Education (Infant Class Sizes) (Wales) (Amendment) Regulations 2009. Exception categories
for junior classes are not set out in regulations but are enforced as part of the data collection. In this
table, where a class has more than one teacher the number of pupils divided by the number of teachers
determines if the size is over 30.
Includes only those classes where there are pupils who have been admitted as exceptions making the
class size within the legal limit of 30 pupils or less.
20182016 2017
Average class size
All classes
All pupils

22
Independent schools
Independent schools charge fees and may also be financed by individuals, companies or
charitable institutions. All independent schools in Wales have to register with the Welsh
Government.
There were 70 independent schools in Wales in January 2018, unchanged from January
2017. (Table 17)
There were 9,756 pupils at independent schools in January 2018, 2 per cent of all pupils in
Wales. (Table 17)
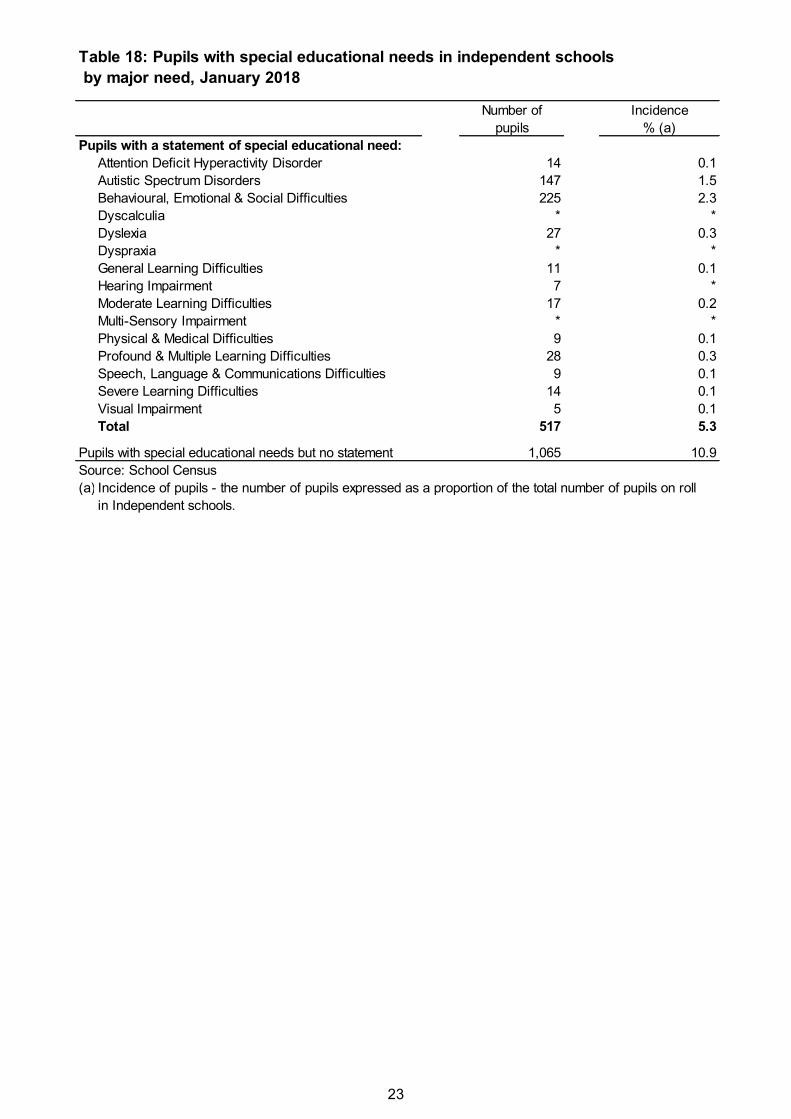
16.2 per cent of pupils at independent schools have some form of special educational need;
32.7 per cent of these pupils with SEN have statements of SEN. Of the pupils with
statements of special educational needs, 43.5 per cent had behavioural, emotional and
social difficulties as their major need and 28.4 per cent of pupils had autistic spectrum
disorders as their major need. (Table 18)
Table 17: Independent schools, January 2018
Schools Pupil-Teacher
Full-time Full-time Ratio
Number Number equivalent Number equivalent
Isle of Anglesey 2 133 109.5 16 13.3 8.2
Gwynedd 4 246 246.0 36 33.6 7.3
Conwy 2 539 539.0 108 92.1 5.9
Denbighshire 4 620 620.0 96 89.6 6.9
Flintshire 3 65 65.0 14 14.0 4.6
Wrexham 2 26 26.0 12 10.5 2.5
Powys 7 503 503.0 70 60.1 8.4
Ceredigion 0 . . . . .
Pembrokeshire 6 332 332.0 38 30.6 10.8
Carmarthenshire 4 789 789.0 108 100.6 7.8
Swansea 7 382 372.0 50 45.1 8.3
Neath Port Talbot 0 . . . . .
Bridgend 2 255 255.0 38 35.4 7.2
The Vale of Glamorgan 3 604 604.0 98 89.8 6.7
Rhondda Cynon Taf 0 . . . . .
Merthyr Tydfil 0 . . . . .
Caerphilly 2 148 148.0 18 14.3 10.4
Blaenau Gwent 0 . . . . .
Torfaen 0 . . . . .
Monmouthshire 5 1,472 1,460.5 209 188.6 7.7
Newport 2 535 529.5 69 63.3 8.4
Cardiff 15 3,107 3,107.0 372 324.7 9.6
Wales 70 9,756 9,705.5 1,352 1,205.5 8.1
Wales – January 2017 70 9,381 9,326.0 1,300 1,157.7 8.1
Wales – January 2016 66 8,880 8,805.5 1,285 1,106.2 8.0
Wales – January 2015 66 8,991 8,941.5 1,270 1,091.8 8.2
Wales – January 2014 70 8,603 8,524.0 1,260 1,084.0 7.9
Source: School Census
Pupils Qualified Teachers
FTE of part-time teachers expresses the teachers’ service in hours as a proportion of a school
week: 26 hours for independent schools.
23
Table 18: Pupils with special educational needs in independent schools
by major need, January 2018
Number of Incidence
pupils % (a)
Pupils with a statement of special educational need:
Attention Deficit Hyperactivity Disorder 14 0.1
Autistic Spectrum Disorders 147 1.5
Behavioural, Emotional & Social Difficulties 225 2.3
Dyscalculia * *
Dyslexia 27 0.3
Dyspraxia * *
General Learning Difficulties 11 0.1
Hearing Impairment 7 *
Moderate Learning Difficulties 17 0.2
Multi-Sensory Impairment * *
Physical & Medical Difficulties 9 0.1
Profound & Multiple Learning Difficulties 28 0.3
Speech, Language & Communications Difficulties 9 0.1
Severe Learning Difficulties 14 0.1
Visual Impairment 5 0.1
Total 517 5.3
Pupils with special educational needs but no statement 1,065 10.9
Source: School Census
(a) Incidence of pupils - the number of pupils expressed as a proportion of the total number of pupils on roll
in Independent schools.

24
Sickness absence of teachers
These figures are not collected as part of the School Census. This information is collected directly
from the local authorities in January each year. The data covers the sickness absence (including
unpaid absence) of qualified and unqualified teachers with permanent contracts or contracts of
more than 1 month, during the previous calendar year.
61 per cent of teachers took sickness absence during 2017, compared to 63 per cent in
2016.
The average annual number of sick-days per teacher taking sickness absence was 11 days
in 2017, unchanged from 2016.
The total number of sick-days taken by teachers during 2017 was 181,522 - this is over
7,600 days fewer than during 2016.
Table 19: Sickness absence of teachers in maintained schools,
1 January - 31 December (a) (b) 2013 2014 2015 2016 2017
Teachers taking a period of sickness absence (c):
Full-time teachers: Number 13,779 13,986 13,729 13,821 (r) 13,326Percentage 61 63 63 65 (r) 63
Part-time teachers: Number 2,955 3,150 3,102 3,186 (r) 3,203Percentage 53 56 55 55 (r) 56
Total teachers: Number 16,734 17,136 16,831 17,007 (r) 16,529Percentage 59 62 61 63 (r) 61
Average number of days lost due to sickness:per full-time teacher taking a period of sick leave 10 10 11 11 (r) 11per teacher (all full-time teachers) 6 7 7 7 (r) 7
Average number of days lost due to sickness:per part time teacher taking a period of sick leave 12 11 12 11 (r) 11per teacher (all part-time teachers) 6 6 7 6 (r) 6
Average number of days lost due to sickness:per teacher taking a period of sick leave 11 11 11 11 (r) 11per teacher (all teachers) 6 7 7 7 (r) 7
Sickness absences by duration (in days):
Full-time teachers: 5 days or less 44,666 45,852 43,499 45,077 (r) 43,2516 to 20 days 23,692 24,257 22,962 21,767 (r) 21,085more than 20 days 72,960 76,106 84,097 87,463 (r) 82,636Total (full-time) 141,318 146,215 150,557 154,307 (r) 146,971
Part-time teachers: 5 days or less 8,962 9,228 8,102 8,435 (r) 8,1806 to 20 days 5,634 5,456 5,629 5,114 (r) 5,772more than 20 days 21,420 20,486 22,869 21,288 (r) 20,599Total (part-time) 36,016 35,170 36,601 34,837 (r) 34,551
Total 177,334 181,385 187,157 189,144 (r) 181,522
Source: Local Authorities(a) Sickness absence (including unpaid absence) of qualified and unqualified teachers with permanent
contracts or contracts of more than 1 month.(b) 2014 was the first year teacher numbers were not collected from the STATS3 return. The percentage
of teachers taking a period of sickness absence has been calculated using PLASC data.Percentages in previous years have also been recalculated using PLASC data, including traineeson initial training courses. Link to previous data is attached:
Teachers in service, vacancies and sickness absence.
(c) Headcount, not full time equivalents.
(r) Figure revised July 2018.
25
Key quality information
Coverage and data sources
The census data in this release relates to all maintained and independent schools in Wales. The
teacher sickness absence data relates to all maintained schools only.
Pupil Level Annual School Census (PLASC) / School Census (STATS1 Return)
Schools’ data are derived from the Pupil Level Annual School Census returns and STATS 1
returns supplied by schools open on Census day in January each year. The returns are authorised
by headteachers and validated by Local Authorities. The teacher sickness absence data is
collected directly from the local authorities in January each year.
PLASC is an electronic collection of pupil and school level data provided by all maintained schools
in January each year. Schools record data on pupils and the school throughout the year in their
Management Information System (MIS) software. This data is collated into an electronic PLASC
return and submitted to the Welsh Government through DEWI, a secure online data transfer
system developed by the Welsh Government. Various stages of automated validation and sense-
checking are built into the process to ensure a high quality of data to inform policy making and
funding.
Independent schools in Wales complete an aggregate STATS1 return.
Teacher sickness absence annual returns
Schools provide sickness absence data to Local Authorities, which collate the data for the Welsh
Government collection. Local Authorities carry out their own validation, and are given the chance to
review data submitted for the previous year. In built validations in the data collection form compare
the new and previous year’s data, which highlights any significant changes and provides further
opportunity for data validation.
Many Local Authorities report system developments that have allowed this data to be captured
more accurately and timely than in previous years. This has increased the quality of the data
provided and sometimes results in revisions being made to previous years’ data.
Timeliness
The census data in this release relate to the position on Tuesday 16 January 2018. The teacher
sickness absence data relates to the preceding calendar year.
Revisions
Data for 2016 have been revised in this publication. Where data has been revised it will be clearly
marked with an (r).
We follow our statistical revisions policy.
Rounding: In tables where figures have been rounded to the nearest final digit there may be an
apparent discrepancy between the sum of the constituent items and the total as shown.

26
Symbols: The following symbols have been used throughout the publication:
.. not available
. not applicable
- the data item is not exactly zero but less than 0.05
* figure is less than 5, or is based on a figure less than 5.
Comparability: Other countries’ releases
Here is the latest available data for:
England
Statistics-school-and-pupil-numbers
Statistics-education-and-training-UK
Scotland
Education statistics
Northern Ireland
Education statistics
Related data for Wales
This release shows final data at Wales level for 2014 - 2018.
The previous census data published were for 2017, in the form of a Statistical First Release:
School Census Results, 2017, published on 26 July 2017.

27
Who are the key users of this data?
These statistics are used both within and outside the Welsh Government. Some of the key users
are:
Ministers and the Members Research Service in the National Assembly for Wales
Education policy in the Welsh Government
Other areas of the Welsh Government
Estyn
The research community
Students, academics and universities
Individual citizens and private companies.
What are the data used for?
These statistics are used in a variety of ways. Some examples of these are:
resource allocation in the Welsh Local Government Finance Settlement and the Pupil
Development Grant
advice to Ministers
the all-Wales education core data packs
to inform the education policy decision-making process in Wales including school
reorganisation
to inform ESTYN during school inspections
the education domain of the Welsh Index of Multiple Deprivation
as a basis for National School Categorisation
published on My Local School
to assist in research in educational attainment.

28
Definitions
LA maintained schools: schools maintained by the local authorities. The authorities meet their
expenditure partly from council tax and partly from general grants made by the Welsh Government.
Welsh medium schools: for further information please see these guidance notes.
Independent schools: schools which charge fees and may also be financed by individuals,
companies or charitable institutions.
Nursery schools: age under 5.
Primary schools: ages 3/4 to 10.
Middle schools: ages 3/4 to 16/18.
Secondary schools: ages 11 to 16/18.
Special schools: Special schools, both day and boarding, provide education for children with
SEN who cannot be educated satisfactorily in mainstream schools.
Full-time equivalent (FTE):
• FTE pupil numbers count part-time pupils as 0.5.
• FTE of part-time teachers expresses the teachers’ service in hours as a proportion of a
school week: 32.5 hours for maintained schools and 26 hours for independent schools.
Pupil Teacher Ratio (PTR): calculated by dividing the FTE number of pupils by the FTE
number of qualified teachers (head teachers, acting head teachers, assistant head teachers,
deputy heads and other qualified teachers).

29
National Statistics status
The United Kingdom Statistics Authority has designated these statistics as National Statistics, in
accordance with the Statistics and Registration Service Act 2007 and signifying compliance with
the Code of Practice for Statistics.
National Statistics status means that official statistics meet the highest standards of
trustworthiness, quality and public value.
All official statistics should comply with all aspects of the Code of Practice for Statistics. They are
awarded National Statistics status following an assessment by the UK Statistics Authority’s
regulatory arm. The Authority considers whether the statistics meet the highest standards of Code
compliance, including the value they add to public decisions and debate.
It is Welsh Government’s responsibility to maintain compliance with the standards expected of
National Statistics. If we become concerned about whether these statistics are still meeting the
appropriate standards, we will discuss any concerns with the Authority promptly. National Statistics
status can be removed at any point when the highest standards are not maintained, and reinstated
when standards are restored.
Well-being of Future Generations Act (WFG)
The Well-being of Future Generations Act 2015 is about improving the social, economic,
environmental and cultural well-being of Wales. The Act puts in place seven well-being goals for
Wales. These are for a more equal, prosperous, resilient, healthier and globally responsible Wales,
with cohesive communities and a vibrant culture and thriving Welsh language. Under section
(10)(1) of the Act, the Welsh Ministers must (a) publish indicators (“national indicators”) that must
be applied for the purpose of measuring progress towards the achievement of the Well-being
goals, and (b) lay a copy of the national indicators before the National Assembly. The 46 national
indicators were laid in March 2016.
Information on the indicators, along with narratives for each of the well-being goals and associated
technical information is available in the Well-being of Wales report.
Further information on the Well-being of Future Generations (Wales) Act 2015.
The statistics included in this release could also provide supporting narrative to the national
indicators and be used by public services boards in relation to their local well-being assessments
and local well-being plans.

30
Further details
The document is available at:
http://gov.wales/statistics-and-research/schools-census/?lang=en
Further data underlying the tables in this release are available through StatsWales.
Next update
July 2019 (provisional)
Period covered: The census data will relate to the position on Tuesday 15 January 2019. The
teacher sickness absence data will relate to the preceding calendar year.
We want your feedback
We welcome any feedback on any aspect of these statistics which can be provided by email to
Open Government Licence
All content is available under the Open Government Licence v3.0, except where otherwise stated.