Embed Size (px)
Citation preview
1
School Choice in Primary Schools:
Evidence from Wuppertal†
Andrea Riedel
Schumpeter School of Business and Economics, University of Wuppertal
Kerstin Schneider‡
Schumpeter School of Business and Economics, University of Wuppertal and CESifo
Claudia Schuchart
ZLB, University of Wuppertal
Horst Weishaupt
DIPF, Frankfurt
Preliminary version
February 2009
† Funding by the Deutsche Forschungsgemeinschaft (DFG) (SCHN 632/3-1) is gratefully acknowledged. The
authors like to thank the town council, the statistics department, the department for geo-data, the supervisory
school authority, and the principals of the primary schools in Wuppertal for their advice, encouragement,
patience, and the provision of the data for this research. ‡ Email: [email protected]
2
Abstract. In this paper we look at school choice in primary schools in Germany. The data
used is from Wuppertal, a major city in North-Rhine Westphalia (NRW), where school
districts were abolished in 2008 to allow for free school choice. Here we look at the situation
before 2008 to learn more about choice in the presence of school districts. It is not uncommon
to visit a primary school that is not the assigned public school. Moreover, parents choose
schools taking into account the distance to school, the quality of the school, and the
socioeconomic composition of the school. Families from disadvantaged neighborhoods tend
to send their children to the assigned school. A high percentage of migrants and/or
economically disadvantaged families in the school district, however, leads parents to choose
another school. Advantaged families make segregating choices, whereas disadvantaged
families tend to make integrating choices. The negative external effect of choice on the
composition of the not chosen school is significant and the level of segregation in the primary
schools is high and exceeds the level of residential segregation.
Keywords: Education system, segregation, school choice; migration; socioeconomic status.
JEL classification: I20, H75, J15.
3
1. Introduction
Unlike in other countries, school choice is not a prominent topic in education research
in Germany. It is commonly thought that at the primary school level there is no choice. At the
level of secondary schooling sorting is primarily driven by the rigid tracking system, where
students are allocated to the various tracks according to past performance or academic ability.
But school choice and ethnic school segregation exist in Germany, as was shown by Kristen
(2005), and clearly deserve more attention.
Past research and also the political discussion of the tracking system have pointed out
that the German school system leads to social and ethnic disintegration with strong effects of
the socio-economic background on performance in school (Entorf & Minoiu, 2005).
Interestingly, the focus of research and also the political debate has been more on tracking and
selection into secondary schools (Dustmann, 2004) or tertiary education than on earlier and
maybe even more important levels of schooling. This might be a shortcoming, as recent
literature points out the importance of early education and the associated high returns (Cunha,
Heckman, Lochner & Masterov, 2006). Pre-primary and primary education is important for
educational success and in particular for the opportunities of disadvantaged groups. In this
paper the focus is on primary education and in particular on the determinants and effects of
primary school choice in Germany.
School choice has been analyzed in numerous international studies. Choice is thought
to have a positive impact on competition between schools and therefore might increase the
quality of schooling (Hoxby, 2003). And also, choice can give parents a chance to find the
school that fits their preferences for education best. However, school choice has potential
negative effects as well. Choice might increase ethnic and social segregation (Burgess &
Briggs, 2006). Moreover, allowing parents to apply at a school of their choice, does not
mean that the child is accepted at the chosen school. The capacity of the school and the
distance to school remain the most important restrictions to choice. Furthermore, school
choice tends to be not practiced in disadvantaged families.
In particular in the US the issue of school choice has drawn considerable attention.
The intention of increased school choice by means of charter school programs was to reduce
racial and social segregation and to improve the chances for education of the more
disadvantaged groups (Hanushek, Kain, & Rivkin, 2002, Fryer & Levitt, 2004). The results
of many studies suggest the opposite (Lankfort & Wyckoff, 2001; Bifulco, Ladd & Ross,
2008). School choice tends to increase rather than to decrease segregation. Walsh (2008) does
4
not argue against this finding but claims that even without choice the within-school
heterogeneity is so low, that cream-skimming of the remaining high ability kids would not
have a sizable effect on those left behind. Echenique and Fryer (2006) and Echenique, Fryer,
& Kaufman (2006) also point to the fact that not only between school segregation but also
within school segregation matters. At percentage of more than 25 percent black students in a
school results in complete segregation, when looking at social interactions of the different
ethnic groups.
In this paper we look at school choice in a German context. The German education
system is strongly influenced by the federal structure of Germany. Each federal state can
decide on its schooling system. This has led to 16 education systems in Germany, with a lot of
variation between the federal states. For instance, each state decides on whether there should
be central exit exams (Jürges & Schneider, 2009) or how many tracks there are in secondary
education. Even the number of years in elementary school differs between the federal states
and there is no trend of convergence to a common education system in Germany. While the
federal system imposes substantial cost, the diversity within Germany leads to numerous
quasi-experimental situations that can be exploited for research.
One interesting feature of German federalism in schooling is that two German states
allow for public denomination schools, i.e., schools that are fully publically funded – just as
other public schools – but are (mostly) Catholic or Protestant schools. This gives parents a
choice not to send their children to the assigned public school even though there are school
districts. The two states are Lower Saxony (but only in some smaller regions) and North-
Rhine Westphalia (NRW). NRW is with a population of 18 Mio the largest German state and
it is very densely populated. In 2005 the NRW government decided to allow for more choice
by abolishing the school districts. The school year 2008/2009 was the first in which every
community had to enforce the new rule. The present paper is the first in a larger project in
which we evaluate the effects of school choice before and after abolishing the school districts.
The data used in this paper is from Wuppertal, a city with a population of about
350.000 that is located in NRW, south of the Ruhr area and east of the Rhineland. We have
information on the individual level that is enriched by data on the city block level, data on the
school district level, and data from the school statistics. To get a better understanding of
school choice under the system with school districts, this paper analyses the situation before
2008. It turns out that even with school districts, it is not uncommon to visit a primary school
that is not the assigned public school in the school district. Moreover, parents choose schools
5
taking into account the distance to school, the quality of the school, and the socio-economic
composition of the school.
In Section 2 give some more information on the institutional details of school choice
in NWR and also on Wuppertal. The data is described in Section 3 and in Section 4 we
explain our analytical strategy. Section 5 presents the results and we conclude and give an
outlook for future research in Section 6.
2. School choice in North-Rhine Westphalia: The situation before and after 2008
At first sight, there is rather limited school choice in German primary schools.
Students are assigned to a public school (Gemeinschaftsgrundschule) in a school district.
However, choice is not as limited as it appears to be. First, parents can apply for permission to
send their child to a different school (§39 SchulG-NRW (school law NRW)). They have to
come up with a convincing argument like a child care person in another school district. The
quality or the social composition of the school are not accepted reasons. The decision to
accept the application is made by the principals of the chosen school and often discussed with
the principal of the assigned school. To our knowledge, there is no research that analyzes the
permissions to visit a not assigned public primary school in Germany.
Second, there are public denomination schools (Bekenntnisschule) to which parents
can send their children. Public schools and public denomination schools do not charge school
fees. They are fully publically funded. In the following, we simply label them public schools
and denomination schools.
In addition to the public and the denomination schools, there are few private primary
schools, which however will be disregarded in this study. Private schools charge a school fee
and are often Waldorf schools, Montessori schools or private denomination schools with a
strong focus on the religious education. This is not the case with the public denomination
schools in NRW. Children in NRW have the right to attend a denomination school in their
community or a neighboring community, if the child belongs to that denomination (§26
SchulG-NRW). They might also be admitted to the denomination school if they don‟t belong
to the school‟s denomination, but the parents wish their child to be educated according to that
denomination. This is clearly a soft condition, which is not verifiable. Moreover, children of a
different denomination might be admitted if there is no school of the child‟s denomination
that can be reached. One commonly unknown feature of the public denomination school
system in NRW is that parents can vote to turn a public school into a public denomination
6
school (§27 SchulG-NRW). Hence, denomination schools exist in some but not all
municipalities. For instance the cities that are evaluated in the context of our larger school
choice project are the two neighboring cities Wuppertal and Solingen. Wuppertal has 356.000
inhabitants and runs 48 public primary schools, 11 Catholic schools, and 2 Protestant schools.
Solingen on the other hand has a population of 161.416 inhabitants and runs 24 primary
schools all of which are public schools. Denomination schools were disestablished in the
1965s by the local government in Solingen and were not reintroduced again.
Since the school year 2008/09 school districts for primary schools have been abolished
in NRW. Theoretically this should give parents free choice. However, the schools are given
fairly close guidelines on how to decide on admission. The distance to the chosen school is
the most important restriction. It is explicitly formulated in the law that students have the right
to be admitted to the closest school of the chosen school type (public or denomination), if the
capacity of the school permits (§ 46 SchulG). Interestingly – and this is not a result of the
school reform – it is stated in the NRW constitution that the economic or social background
must not be a criterion for admission to a school (Art. 10 LV NRW). But still, with the
demographic change, the number of school children is sinking, leaving more room for choice
and clearly also for increased competition between schools. Moreover, the new law might
affect parents in the two cities differently. Families in Wuppertal were always exposed to
choice, whereas choice in Solingen was much more limited.
The present paper is the first one to analyze the data collected and focuses on the
situation in Wuppertal before 2008. We use data from the official statistics on the level of the
school districts, data on the city block level, data from the school statistics and individual
level data from the schools, to get a first idea on the determinants of school choice.
Wuppertal is a city with a heterogeneous population. The unemployment rate in 2007 stood at
12.6 percent and the welfare dependence rate was 16.5 percent, which is above the German as
well as the NRW level. In this paper, we work with a slightly different definition of the
unemployment rate. We define the unemployment rate as the number of
unemployed/population between 16-65 years, since we have no information on dependent
employment in Wuppertal. According to that definition, unemployment was at 9 percent.
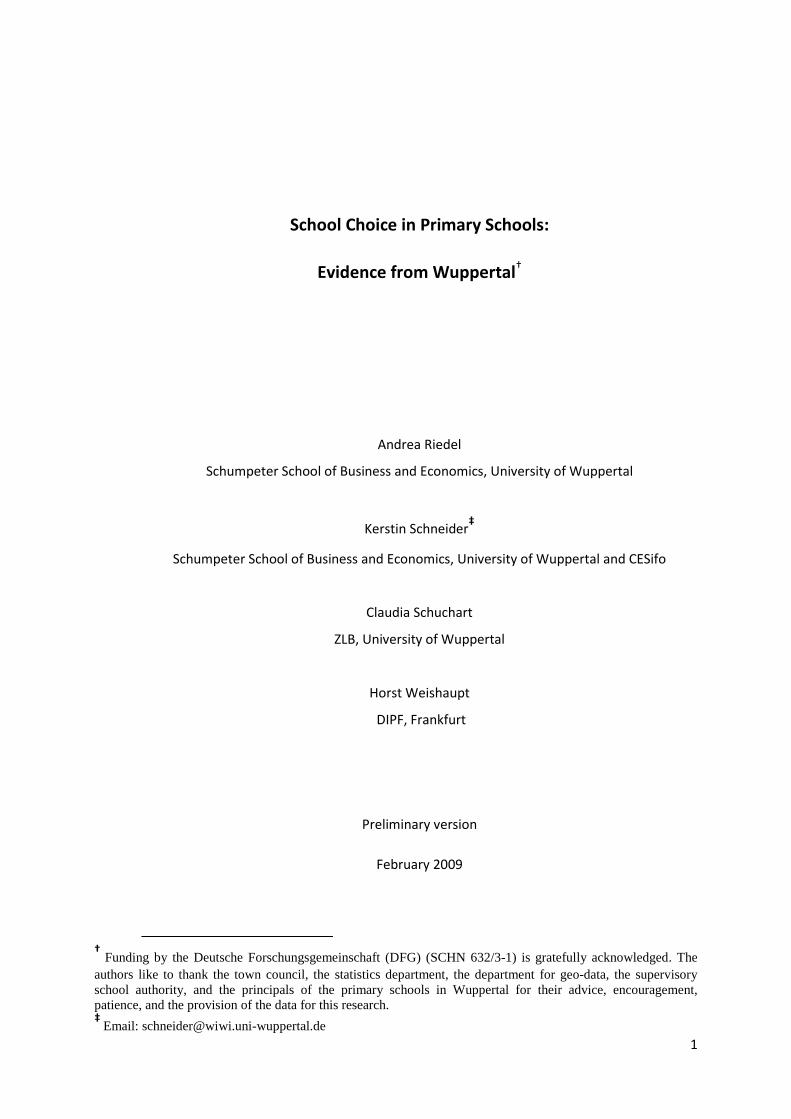
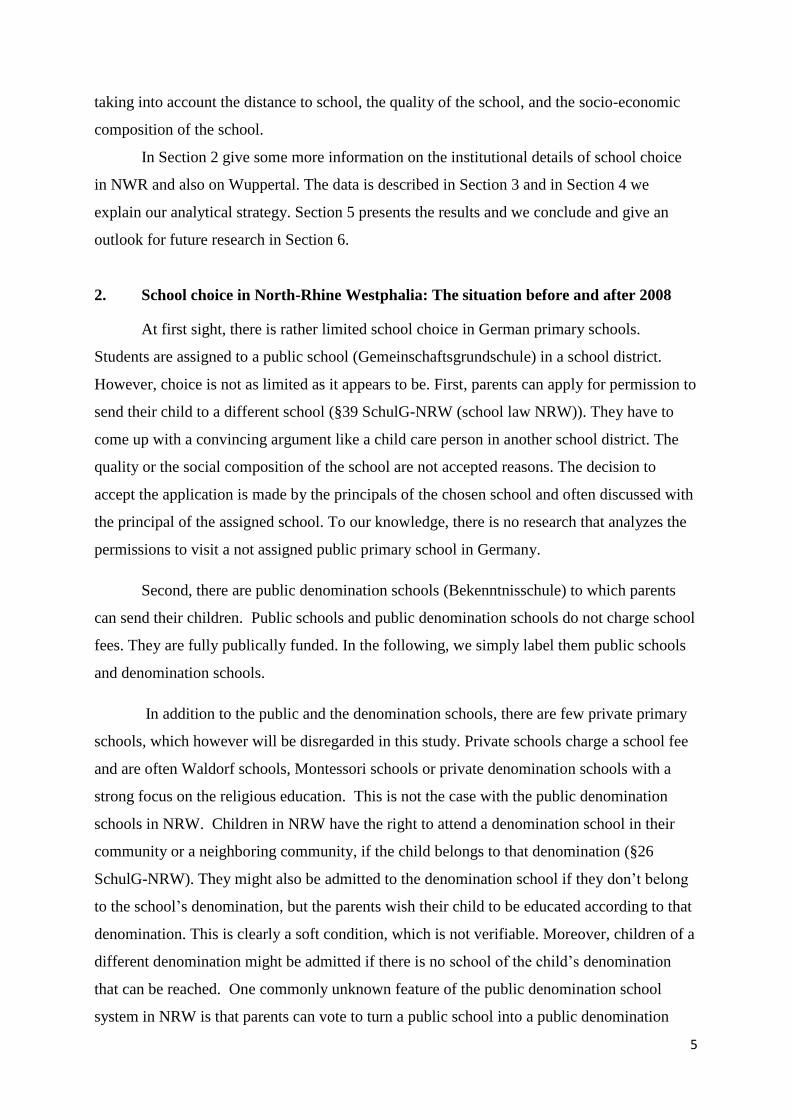
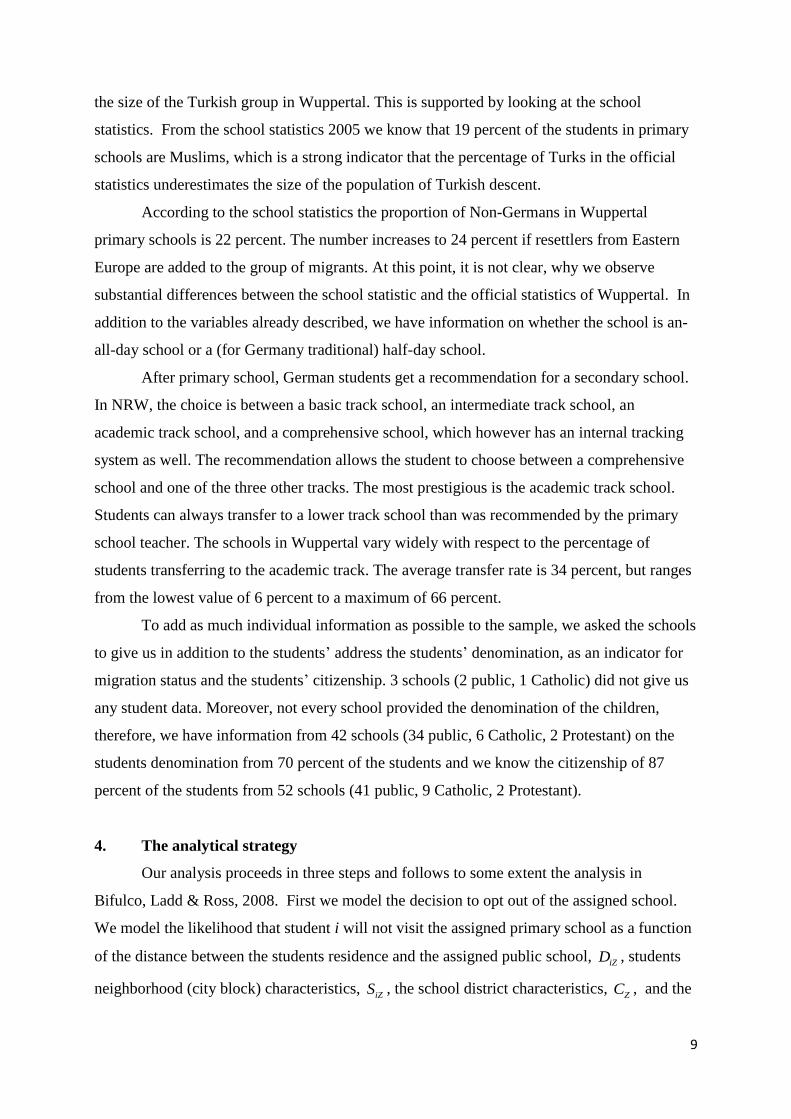
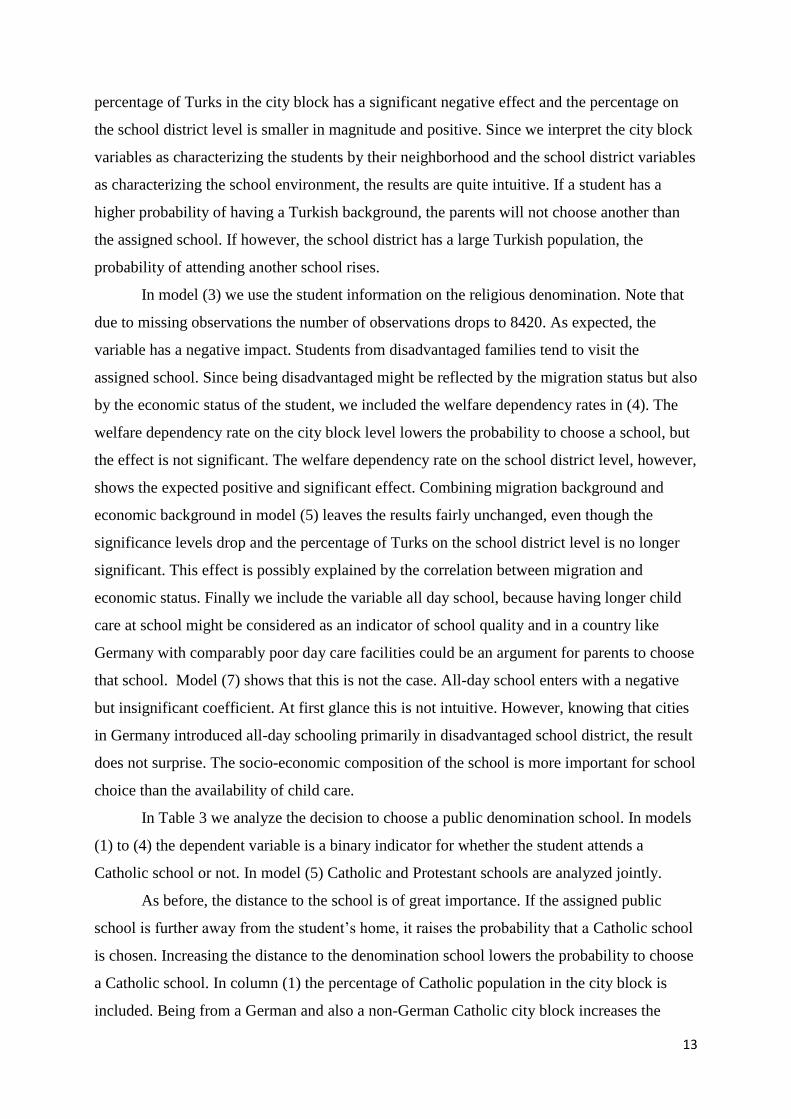
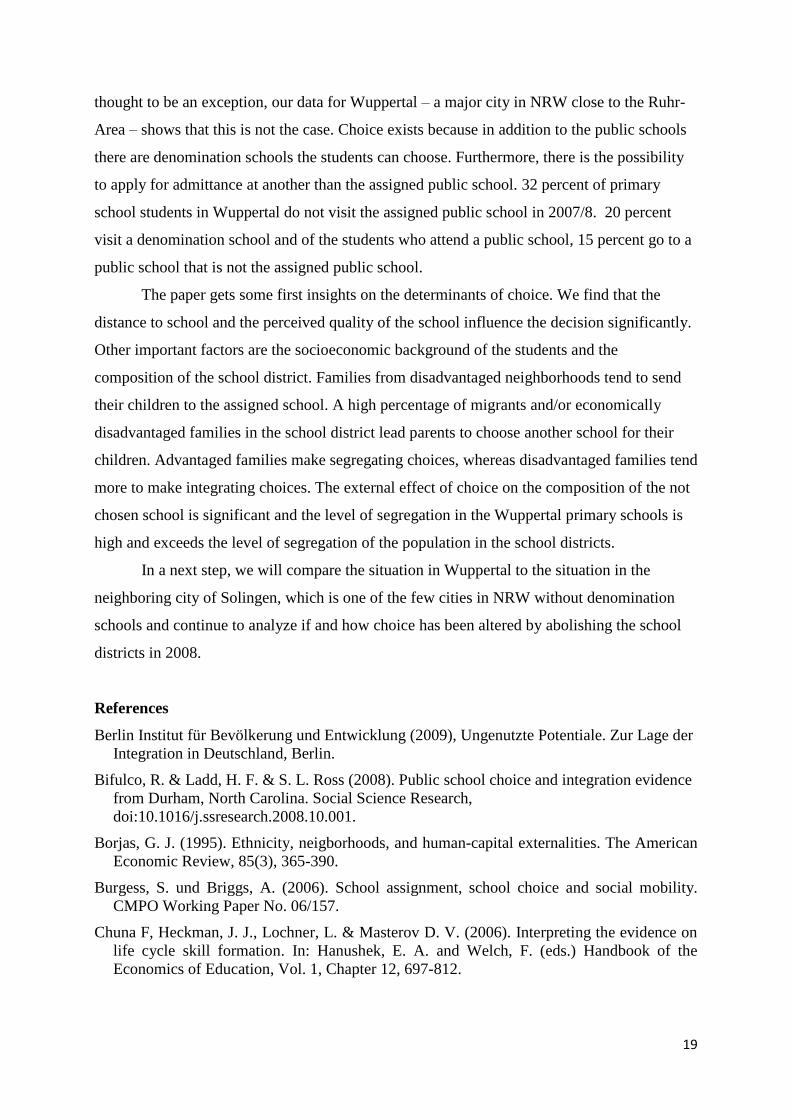
Figure 1 illustrates that Wuppertal is not only a city with economic problems, but also
a city with a lot of socioeconomic diversity. Just looking at the unemployment rates in the
school districts in Figure 1a, it shows that unemployment is in particular high in the middle
axis of the city around the famous Wuppertaler Schwebebahn (suspension line). The
7
suspension line is not only the city‟s landmark but also the most important element of the
public transportation system.
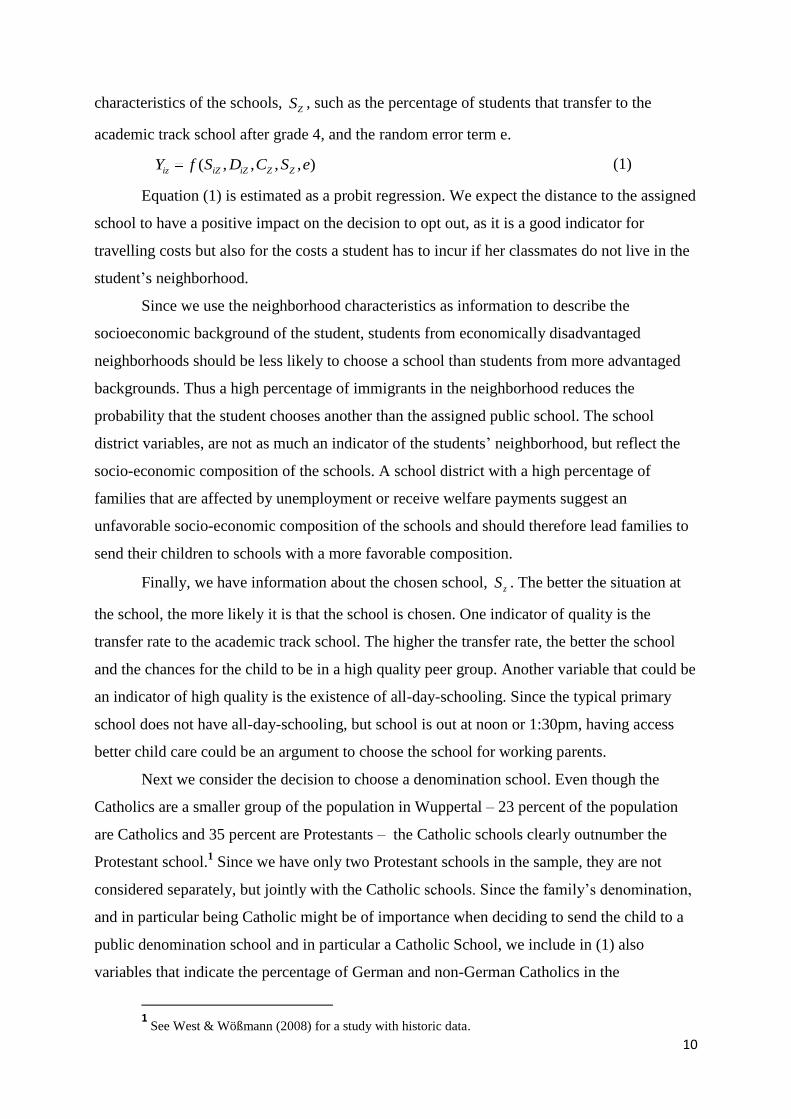
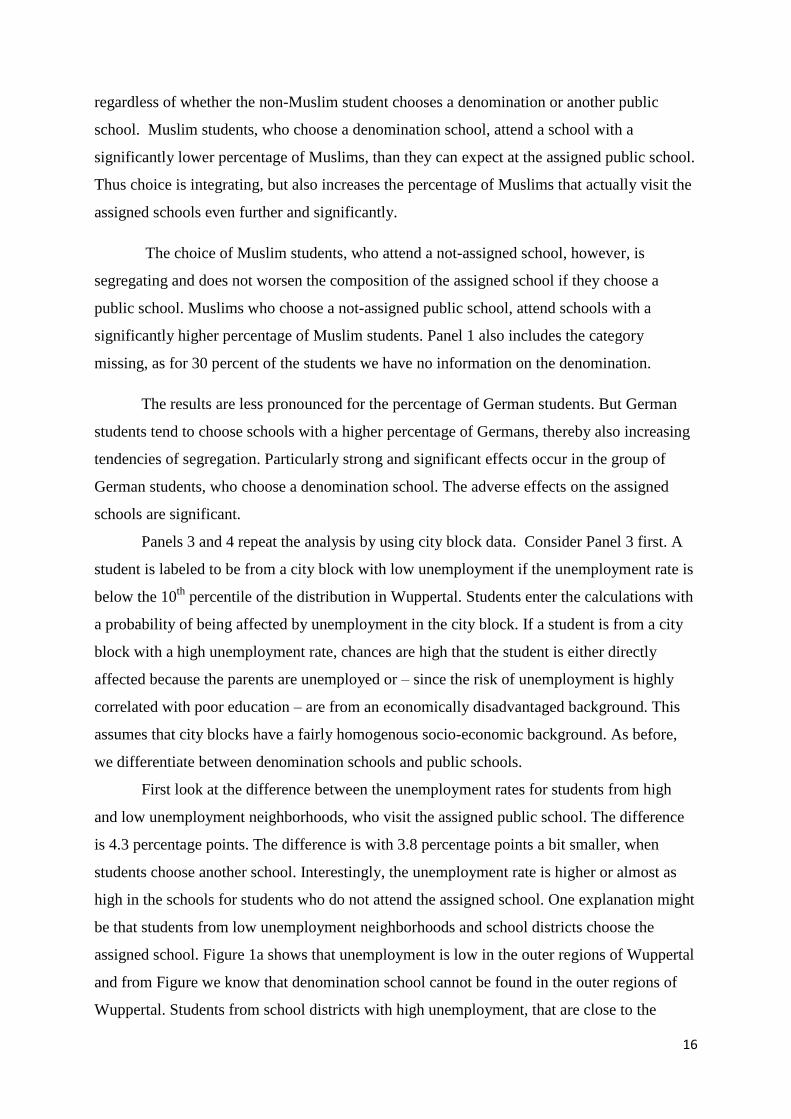
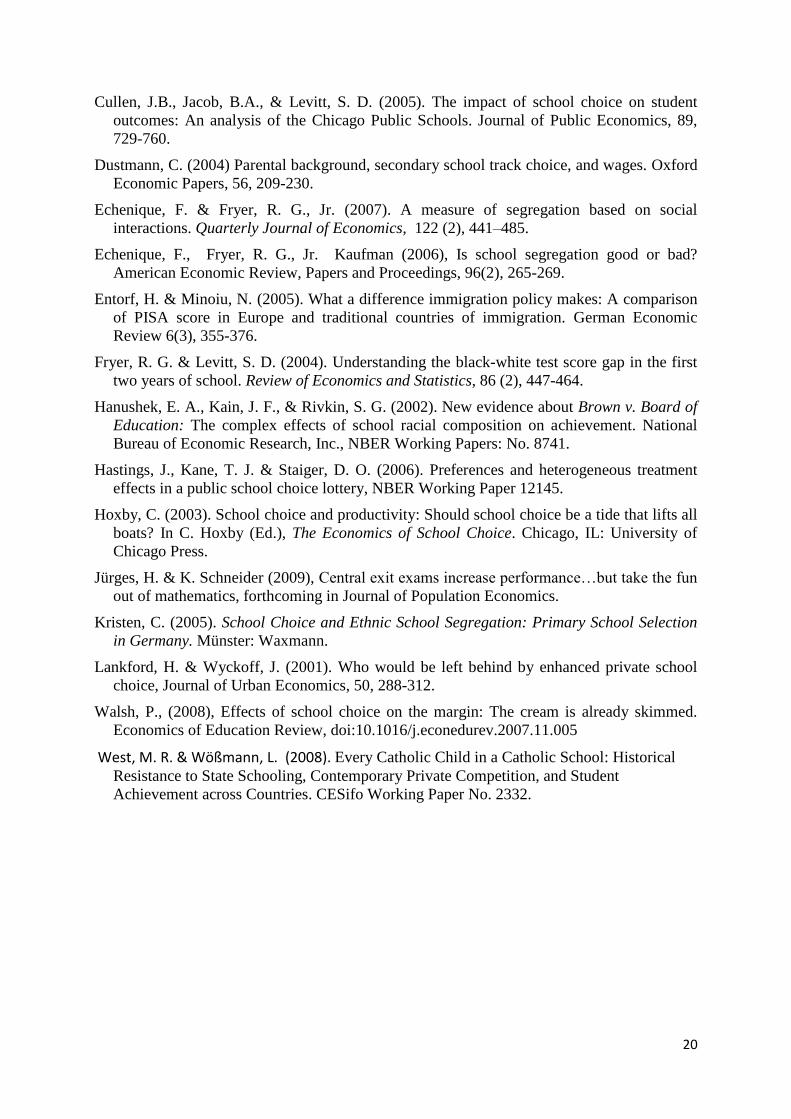
Unemployment drops considerably if one moves away from the suspension line, which
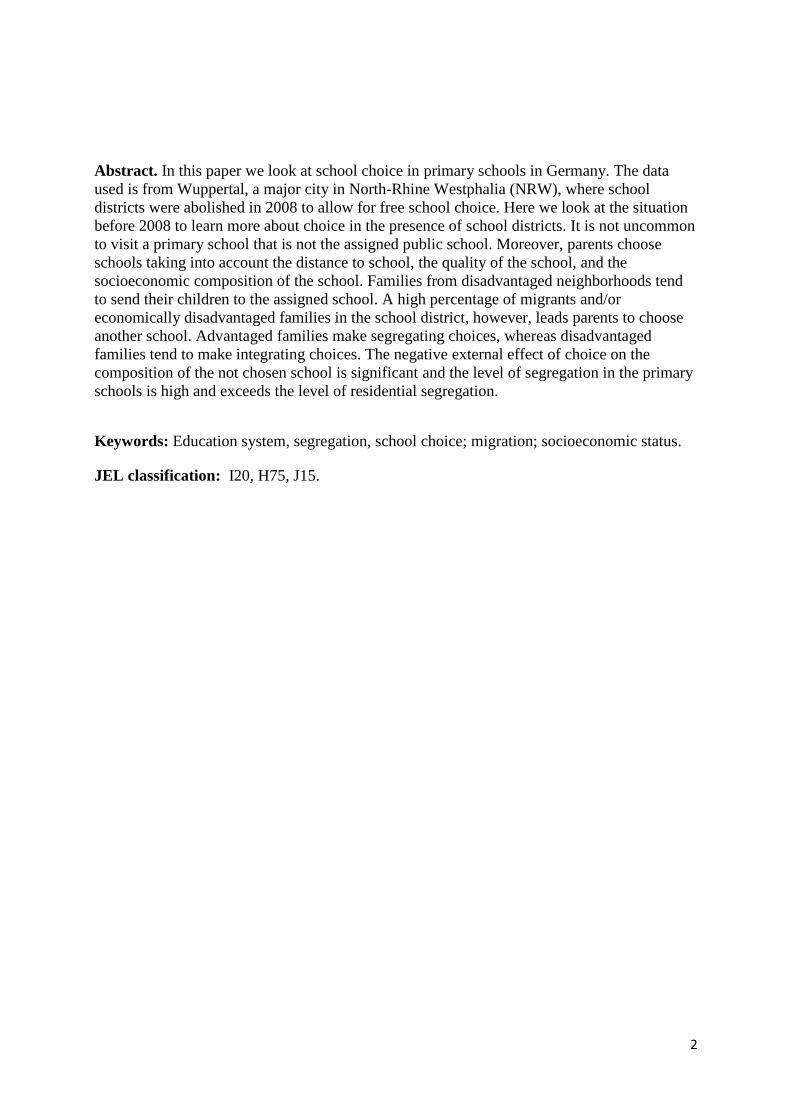
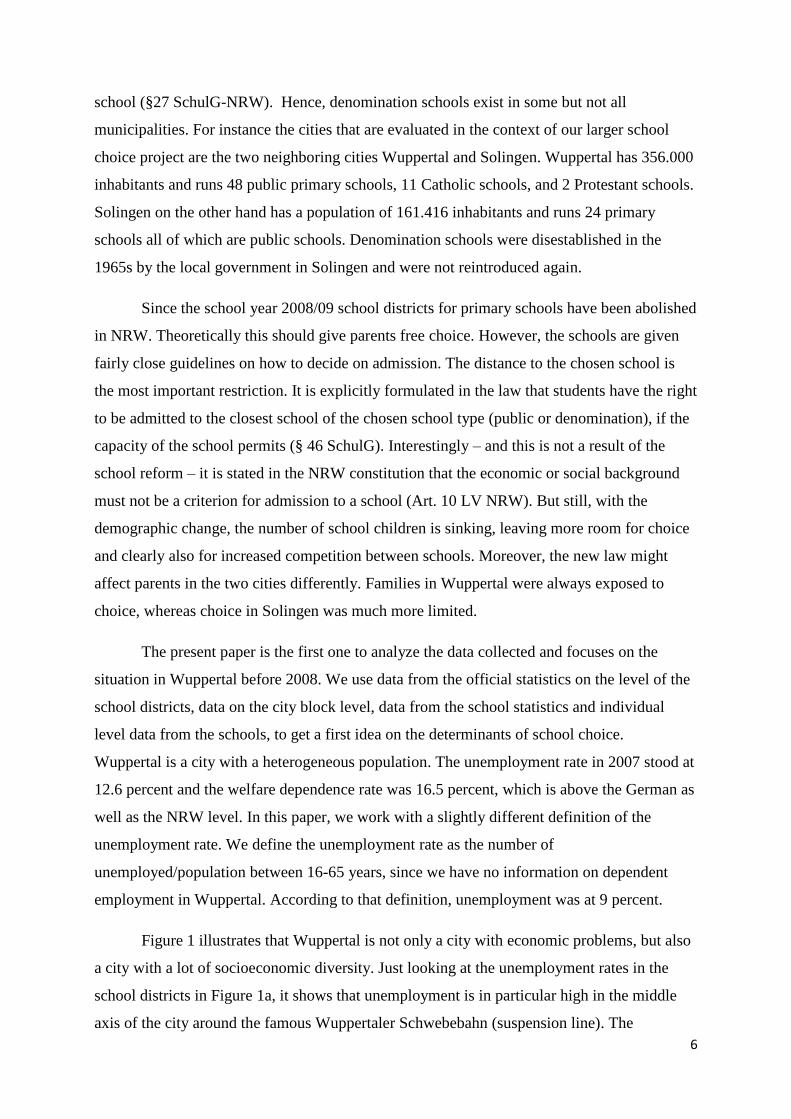
is in the Wupper valley, to the outer parts, the mountains of Wuppertal. A rather similar
picture is obtained, when looking at welfare dependency rates or the distribution of
immigrants in Wuppertal in Figure 1b. Furthermore, the parts of Wuppertal close to the axis
are more densely populated, when compared to the outer city regions.
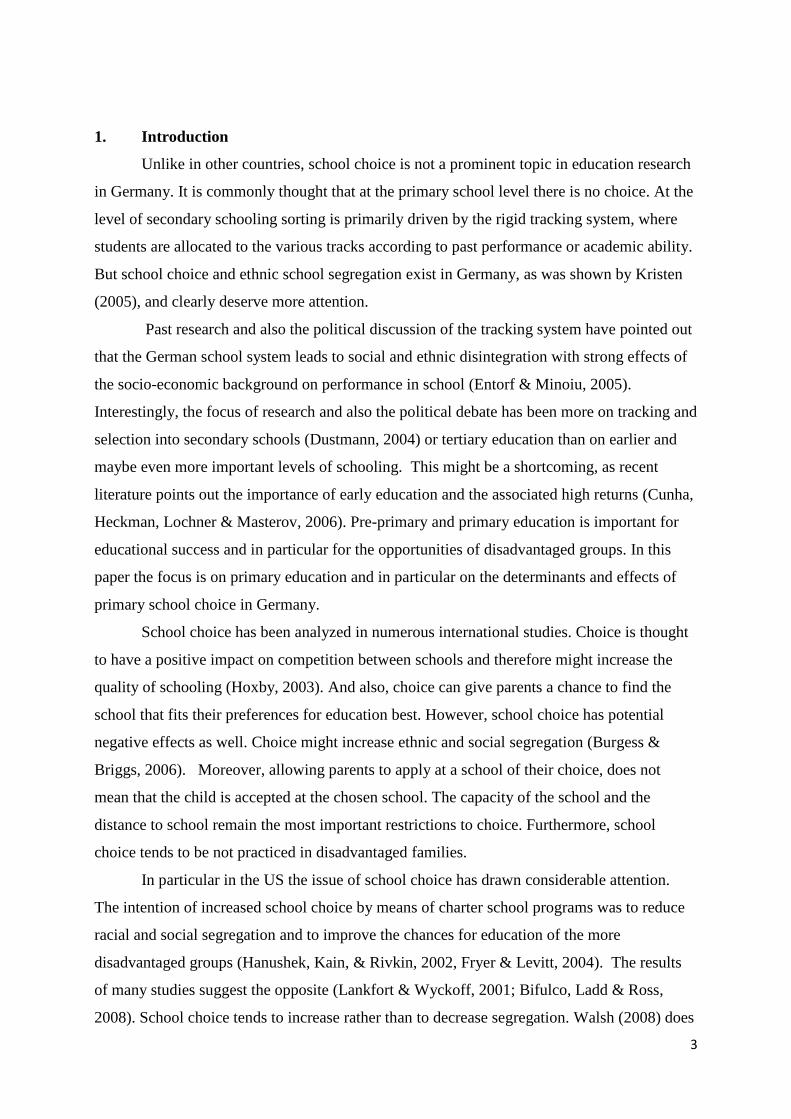
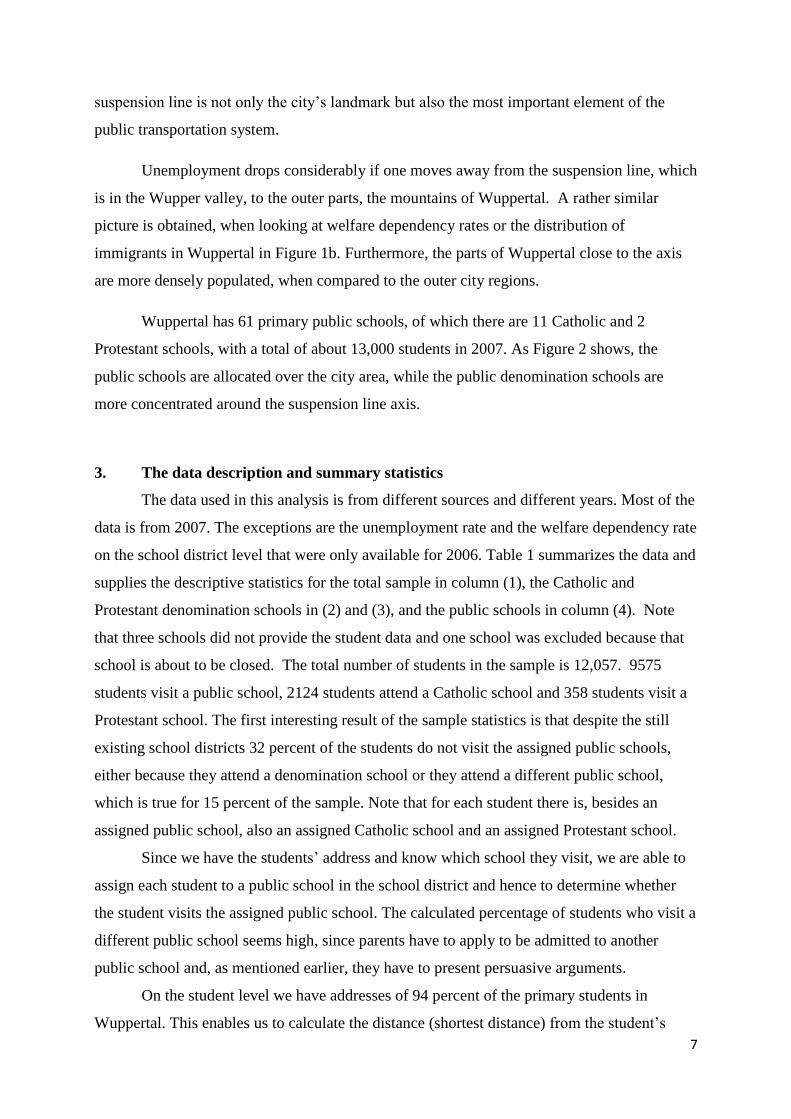
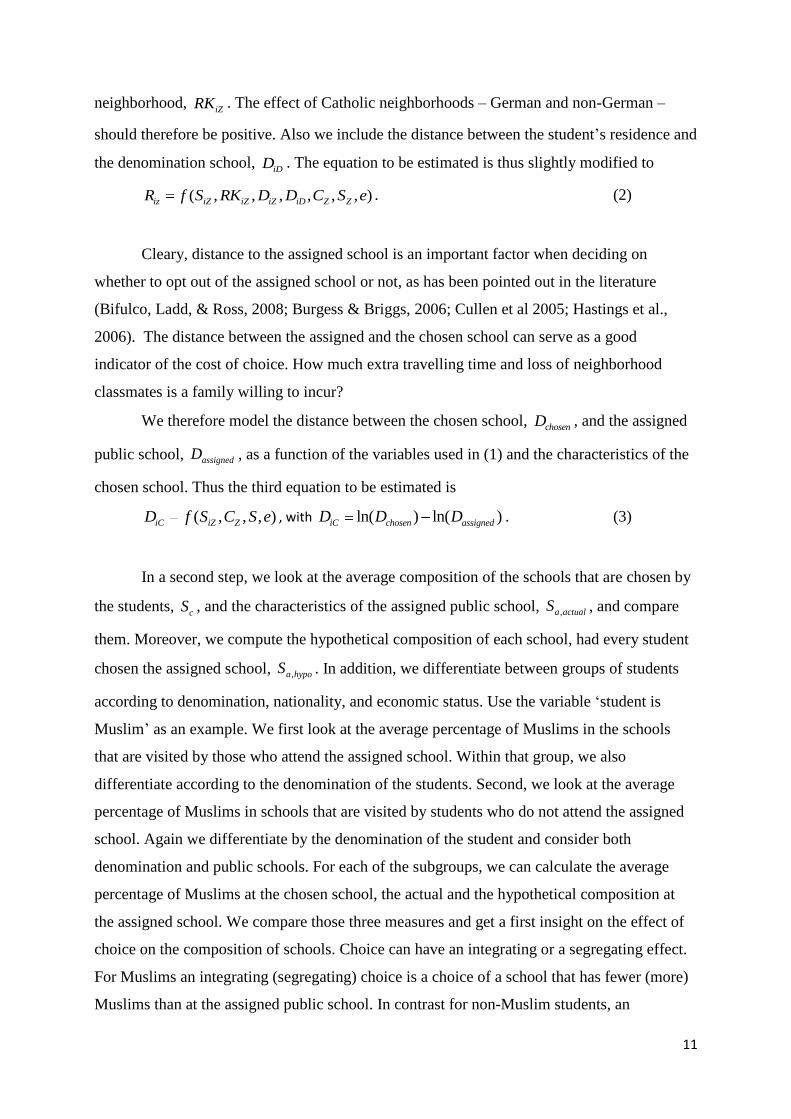
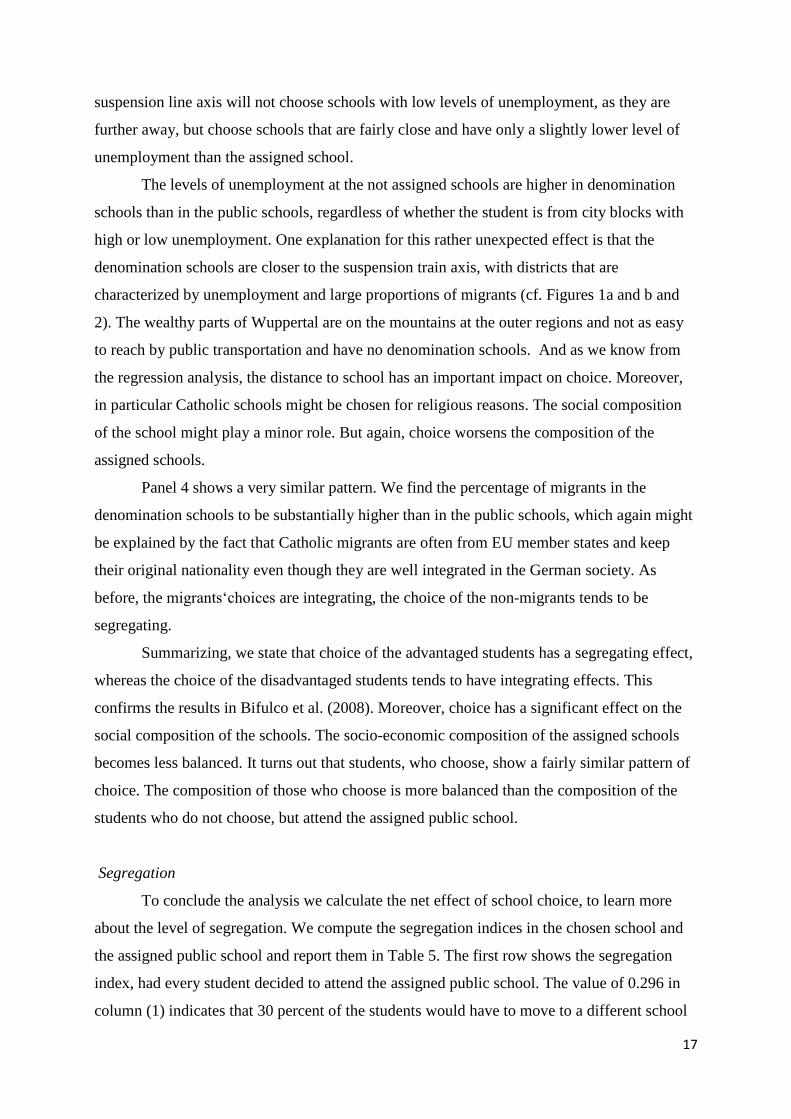
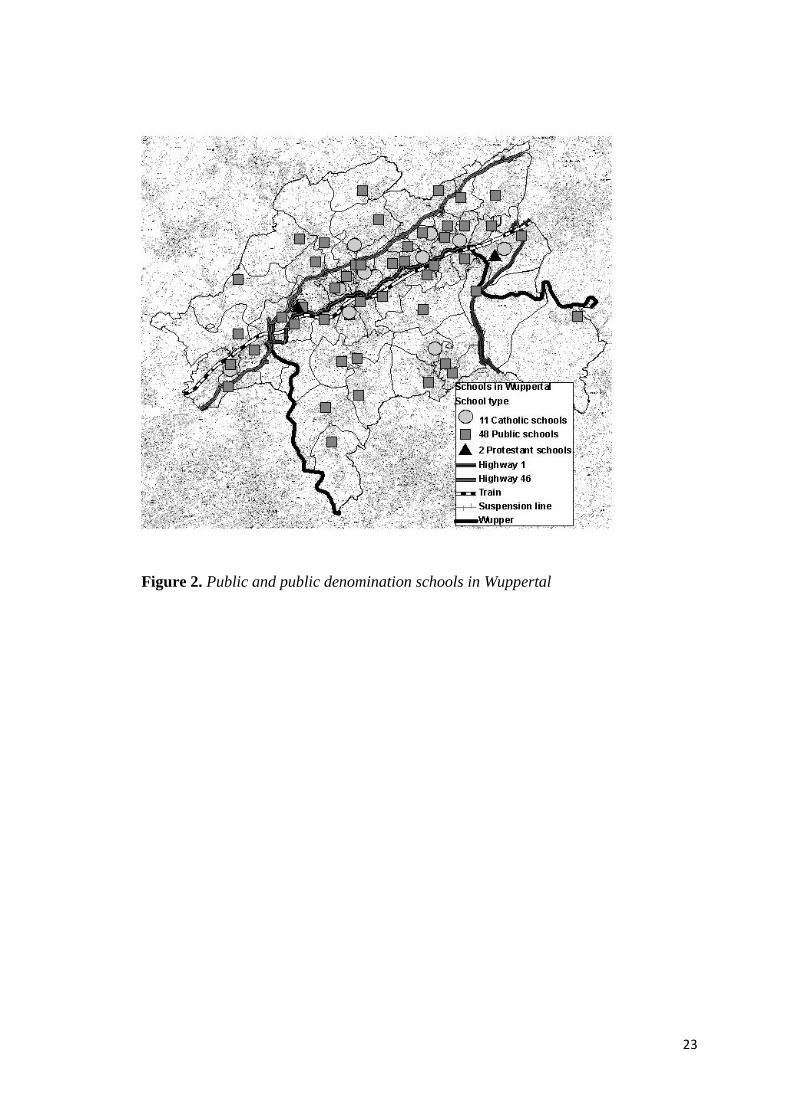
Wuppertal has 61 primary public schools, of which there are 11 Catholic and 2
Protestant schools, with a total of about 13,000 students in 2007. As Figure 2 shows, the
public schools are allocated over the city area, while the public denomination schools are
more concentrated around the suspension line axis.
3. The data description and summary statistics
The data used in this analysis is from different sources and different years. Most of the
data is from 2007. The exceptions are the unemployment rate and the welfare dependency rate
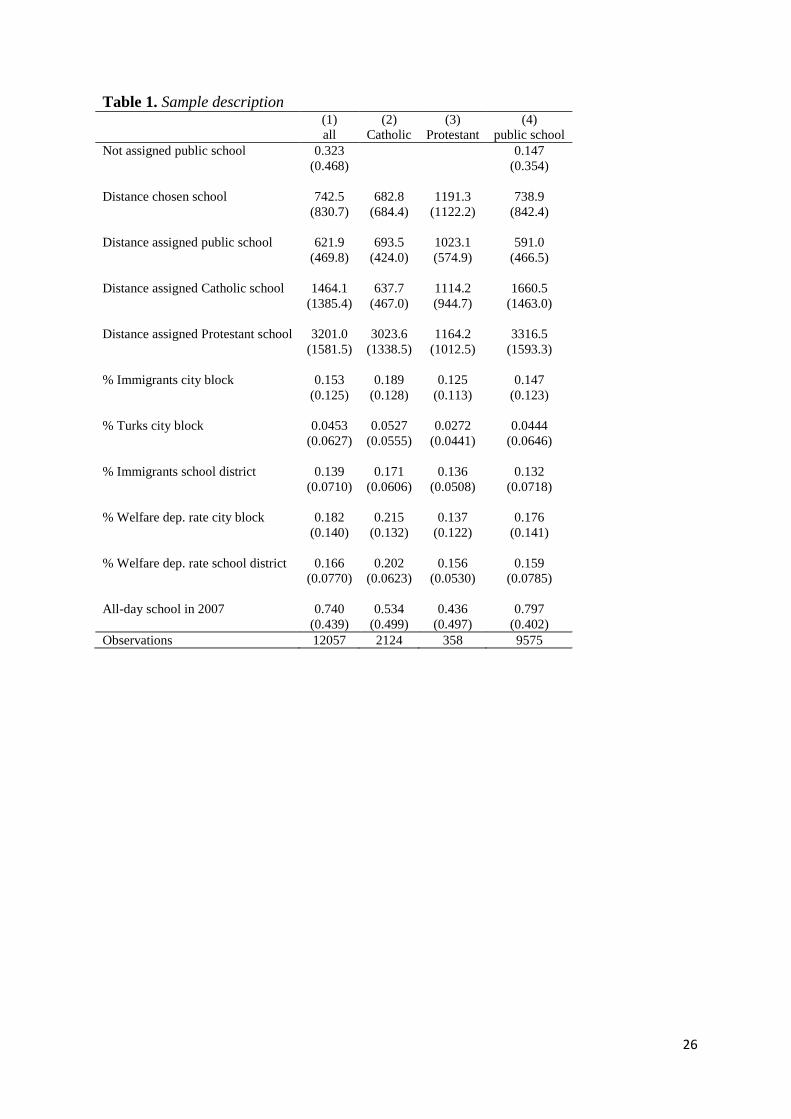
on the school district level that were only available for 2006. Table 1 summarizes the data and
supplies the descriptive statistics for the total sample in column (1), the Catholic and
Protestant denomination schools in (2) and (3), and the public schools in column (4). Note
that three schools did not provide the student data and one school was excluded because that
school is about to be closed. The total number of students in the sample is 12,057. 9575
students visit a public school, 2124 students attend a Catholic school and 358 students visit a
Protestant school. The first interesting result of the sample statistics is that despite the still
existing school districts 32 percent of the students do not visit the assigned public schools,
either because they attend a denomination school or they attend a different public school,
which is true for 15 percent of the sample. Note that for each student there is, besides an
assigned public school, also an assigned Catholic school and an assigned Protestant school.
Since we have the students‟ address and know which school they visit, we are able to
assign each student to a public school in the school district and hence to determine whether
the student visits the assigned public school. The calculated percentage of students who visit a
different public school seems high, since parents have to apply to be admitted to another
public school and, as mentioned earlier, they have to present persuasive arguments.
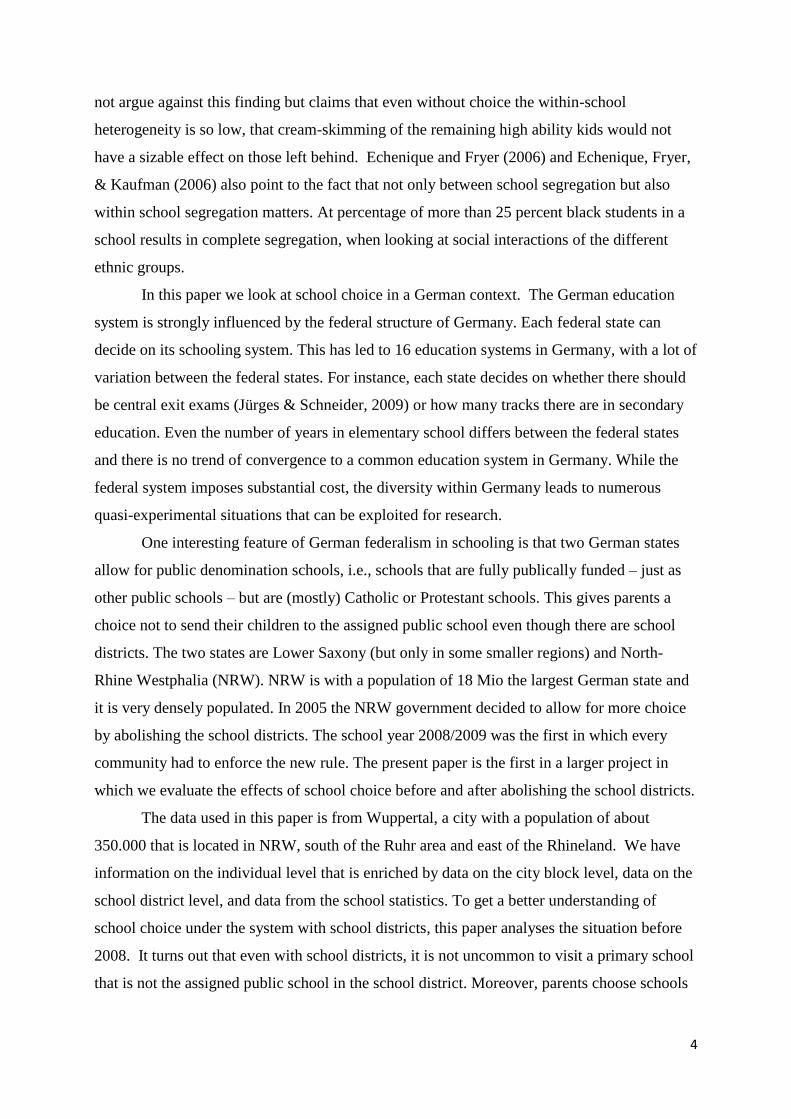
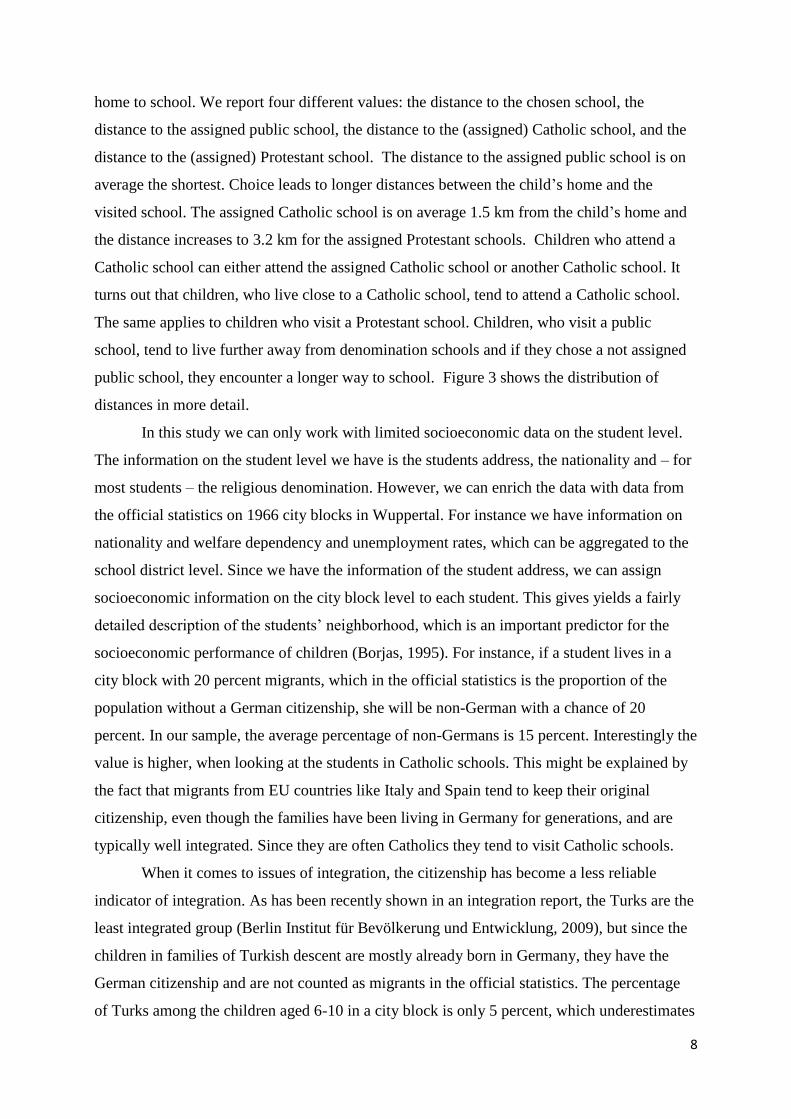
On the student level we have addresses of 94 percent of the primary students in
Wuppertal. This enables us to calculate the distance (shortest distance) from the student‟s
8
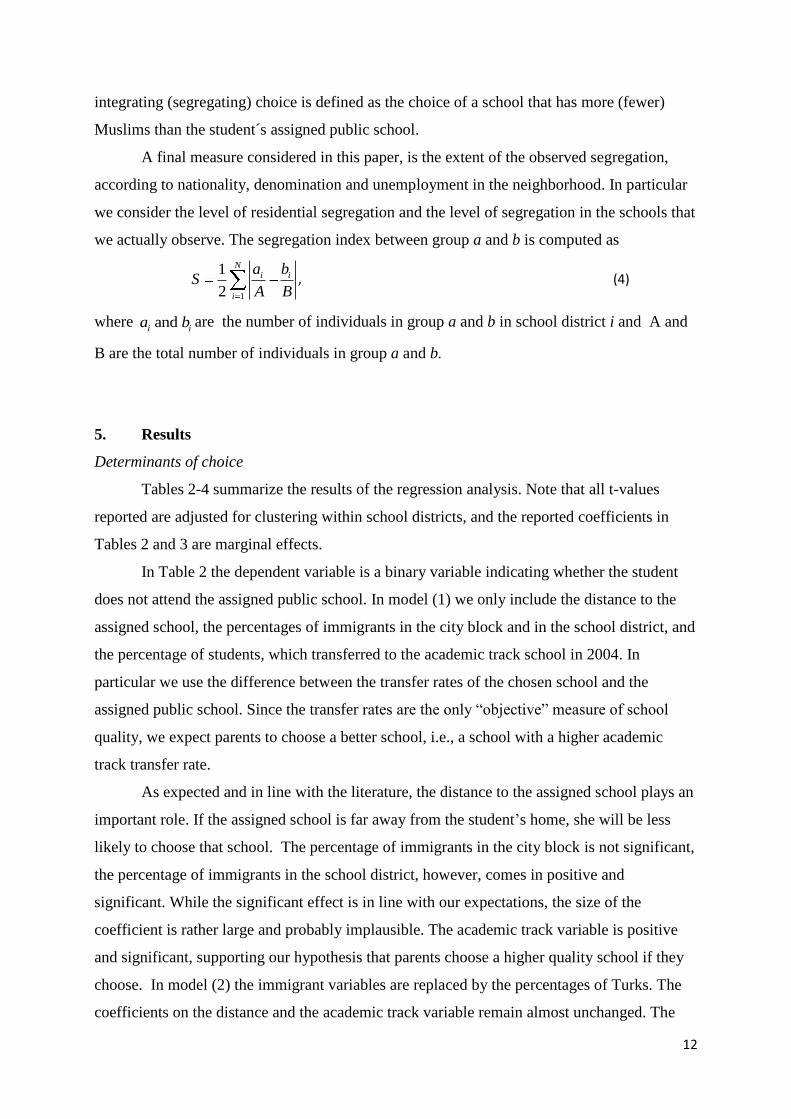
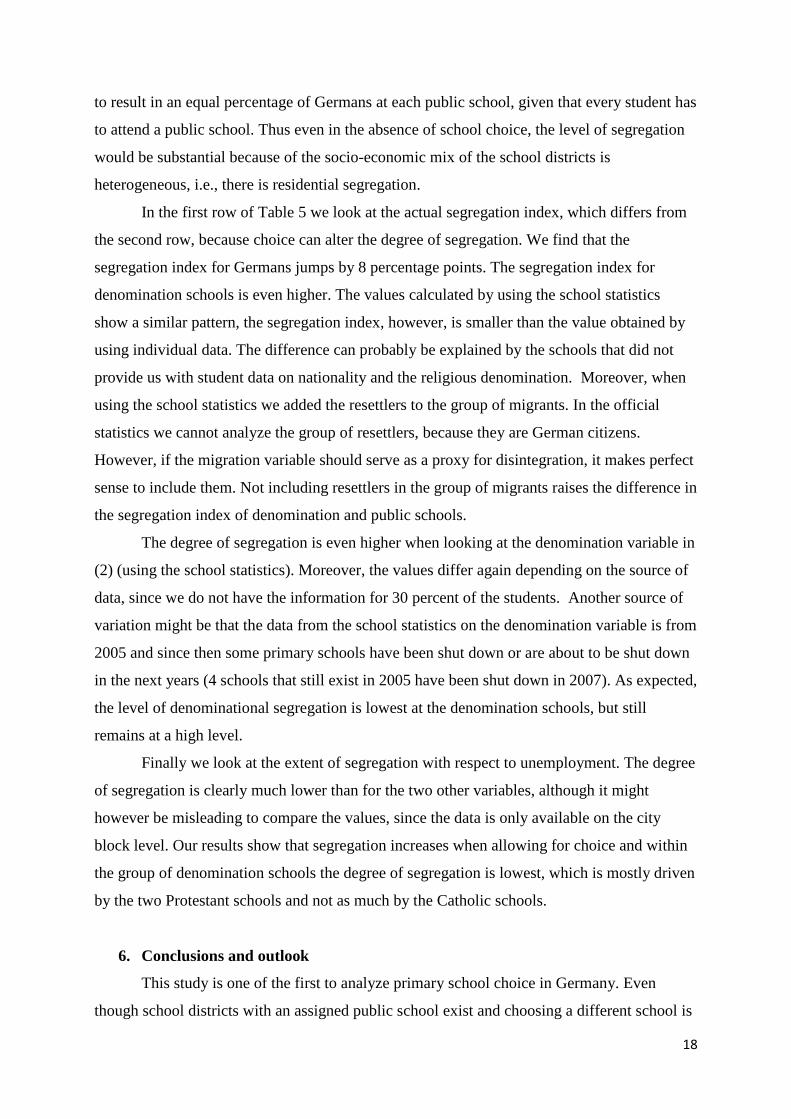
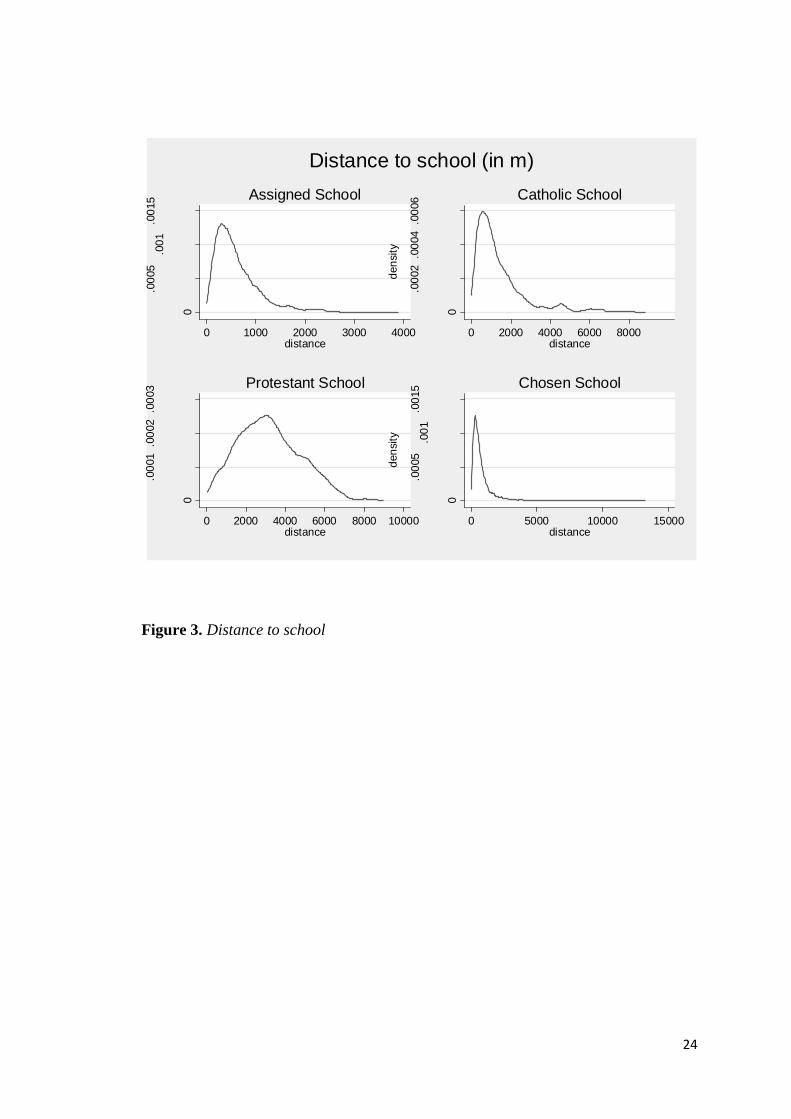
home to school. We report four different values: the distance to the chosen school, the
distance to the assigned public school, the distance to the (assigned) Catholic school, and the
distance to the (assigned) Protestant school. The distance to the assigned public school is on
average the shortest. Choice leads to longer distances between the child‟s home and the
visited school. The assigned Catholic school is on average 1.5 km from the child‟s home and
the distance increases to 3.2 km for the assigned Protestant schools. Children who attend a
Catholic school can either attend the assigned Catholic school or another Catholic school. It
turns out that children, who live close to a Catholic school, tend to attend a Catholic school.
The same applies to children who visit a Protestant school. Children, who visit a public
school, tend to live further away from denomination schools and if they chose a not assigned
public school, they encounter a longer way to school. Figure 3 shows the distribution of
distances in more detail.
In this study we can only work with limited socioeconomic data on the student level.
The information on the student level we have is the students address, the nationality and – for
most students – the religious denomination. However, we can enrich the data with data from
the official statistics on 1966 city blocks in Wuppertal. For instance we have information on
nationality and welfare dependency and unemployment rates, which can be aggregated to the
school district level. Since we have the information of the student address, we can assign
socioeconomic information on the city block level to each student. This gives yields a fairly
detailed description of the students‟ neighborhood, which is an important predictor for the
socioeconomic performance of children (Borjas, 1995). For instance, if a student lives in a
city block with 20 percent migrants, which in the official statistics is the proportion of the
population without a German citizenship, she will be non-German with a chance of 20
percent. In our sample, the average percentage of non-Germans is 15 percent. Interestingly the
value is higher, when looking at the students in Catholic schools. This might be explained by
the fact that migrants from EU countries like Italy and Spain tend to keep their original
citizenship, even though the families have been living in Germany for generations, and are
typically well integrated. Since they are often Catholics they tend to visit Catholic schools.
When it comes to issues of integration, the citizenship has become a less reliable
indicator of integration. As has been recently shown in an integration report, the Turks are the
least integrated group (Berlin Institut für Bevölkerung und Entwicklung, 2009), but since the
children in families of Turkish descent are mostly already born in Germany, they have the
German citizenship and are not counted as migrants in the official statistics. The percentage
of Turks among the children aged 6-10 in a city block is only 5 percent, which underestimates
9
the size of the Turkish group in Wuppertal. This is supported by looking at the school
statistics. From the school statistics 2005 we know that 19 percent of the students in primary
schools are Muslims, which is a strong indicator that the percentage of Turks in the official
statistics underestimates the size of the population of Turkish descent.
According to the school statistics the proportion of Non-Germans in Wuppertal
primary schools is 22 percent. The number increases to 24 percent if resettlers from Eastern
Europe are added to the group of migrants. At this point, it is not clear, why we observe
substantial differences between the school statistic and the official statistics of Wuppertal. In
addition to the variables already described, we have information on whether the school is an-
all-day school or a (for Germany traditional) half-day school.
After primary school, German students get a recommendation for a secondary school.
In NRW, the choice is between a basic track school, an intermediate track school, an
academic track school, and a comprehensive school, which however has an internal tracking
system as well. The recommendation allows the student to choose between a comprehensive
school and one of the three other tracks. The most prestigious is the academic track school.
Students can always transfer to a lower track school than was recommended by the primary
school teacher. The schools in Wuppertal vary widely with respect to the percentage of
students transferring to the academic track. The average transfer rate is 34 percent, but ranges
from the lowest value of 6 percent to a maximum of 66 percent.
To add as much individual information as possible to the sample, we asked the schools
to give us in addition to the students‟ address the students‟ denomination, as an indicator for
migration status and the students‟ citizenship. 3 schools (2 public, 1 Catholic) did not give us
any student data. Moreover, not every school provided the denomination of the children,
therefore, we have information from 42 schools (34 public, 6 Catholic, 2 Protestant) on the
students denomination from 70 percent of the students and we know the citizenship of 87
percent of the students from 52 schools (41 public, 9 Catholic, 2 Protestant).
4. The analytical strategy
Our analysis proceeds in three steps and follows to some extent the analysis in
Bifulco, Ladd & Ross, 2008. First we model the decision to opt out of the assigned school.
We model the likelihood that student i will not visit the assigned primary school as a function
of the distance between the students residence and the assigned public school, iZD , students
neighborhood (city block) characteristics, iZS , the school district characteristics,
ZC , and the
10
characteristics of the schools, ZS , such as the percentage of students that transfer to the
academic track school after grade 4, and the random error term e.
( , , , , )iz iZ iZ Z ZY f S D C S e (1)
Equation (1) is estimated as a probit regression. We expect the distance to the assigned
school to have a positive impact on the decision to opt out, as it is a good indicator for
travelling costs but also for the costs a student has to incur if her classmates do not live in the
student‟s neighborhood.
Since we use the neighborhood characteristics as information to describe the
socioeconomic background of the student, students from economically disadvantaged
neighborhoods should be less likely to choose a school than students from more advantaged
backgrounds. Thus a high percentage of immigrants in the neighborhood reduces the
probability that the student chooses another than the assigned public school. The school
district variables, are not as much an indicator of the students‟ neighborhood, but reflect the
socio-economic composition of the schools. A school district with a high percentage of
families that are affected by unemployment or receive welfare payments suggest an
unfavorable socio-economic composition of the schools and should therefore lead families to
send their children to schools with a more favorable composition.
Finally, we have information about the chosen school, zS . The better the situation at
the school, the more likely it is that the school is chosen. One indicator of quality is the
transfer rate to the academic track school. The higher the transfer rate, the better the school
and the chances for the child to be in a high quality peer group. Another variable that could be
an indicator of high quality is the existence of all-day-schooling. Since the typical primary
school does not have all-day-schooling, but school is out at noon or 1:30pm, having access
better child care could be an argument to choose the school for working parents.
Next we consider the decision to choose a denomination school. Even though the
Catholics are a smaller group of the population in Wuppertal – 23 percent of the population
are Catholics and 35 percent are Protestants – the Catholic schools clearly outnumber the
Protestant school.1 Since we have only two Protestant schools in the sample, they are not
considered separately, but jointly with the Catholic schools. Since the family‟s denomination,
and in particular being Catholic might be of importance when deciding to send the child to a
public denomination school and in particular a Catholic School, we include in (1) also
variables that indicate the percentage of German and non-German Catholics in the
1
See West & Wößmann (2008) for a study with historic data.
11
neighborhood, iZRK . The effect of Catholic neighborhoods – German and non-German –
should therefore be positive. Also we include the distance between the student‟s residence and
the denomination school, iDD . The equation to be estimated is thus slightly modified to
( , , , , , , )iz iZ iZ iZ iD Z ZR f S RK D D C S e . (2)
Cleary, distance to the assigned school is an important factor when deciding on
whether to opt out of the assigned school or not, as has been pointed out in the literature
(Bifulco, Ladd, & Ross, 2008; Burgess & Briggs, 2006; Cullen et al 2005; Hastings et al.,
2006). The distance between the assigned and the chosen school can serve as a good
indicator of the cost of choice. How much extra travelling time and loss of neighborhood
classmates is a family willing to incur?
We therefore model the distance between the chosen school, chosenD , and the assigned
public school, assignedD , as a function of the variables used in (1) and the characteristics of the
chosen school. Thus the third equation to be estimated is
( , , , )iC iZ ZD f S C S e , with ln( ) ln( )iC chosen assignedD D D . (3)
In a second step, we look at the average composition of the schools that are chosen by
the students, cS , and the characteristics of the assigned public school, ,a actualS , and compare
them. Moreover, we compute the hypothetical composition of each school, had every student
chosen the assigned school, ,a hypoS . In addition, we differentiate between groups of students
according to denomination, nationality, and economic status. Use the variable „student is
Muslim‟ as an example. We first look at the average percentage of Muslims in the schools
that are visited by those who attend the assigned school. Within that group, we also
differentiate according to the denomination of the students. Second, we look at the average
percentage of Muslims in schools that are visited by students who do not attend the assigned
school. Again we differentiate by the denomination of the student and consider both
denomination and public schools. For each of the subgroups, we can calculate the average
percentage of Muslims at the chosen school, the actual and the hypothetical composition at
the assigned school. We compare those three measures and get a first insight on the effect of
choice on the composition of schools. Choice can have an integrating or a segregating effect.
For Muslims an integrating (segregating) choice is a choice of a school that has fewer (more)
Muslims than at the assigned public school. In contrast for non-Muslim students, an
12
integrating (segregating) choice is defined as the choice of a school that has more (fewer)
Muslims than the student´s assigned public school.
A final measure considered in this paper, is the extent of the observed segregation,
according to nationality, denomination and unemployment in the neighborhood. In particular
we consider the level of residential segregation and the level of segregation in the schools that
we actually observe. The segregation index between group a and b is computed as
1
1
2
Ni i
i
a bS
A B, (4)
where and i ia b are the number of individuals in group a and b in school district i and A and
B are the total number of individuals in group a and b.
5. Results
Determinants of choice
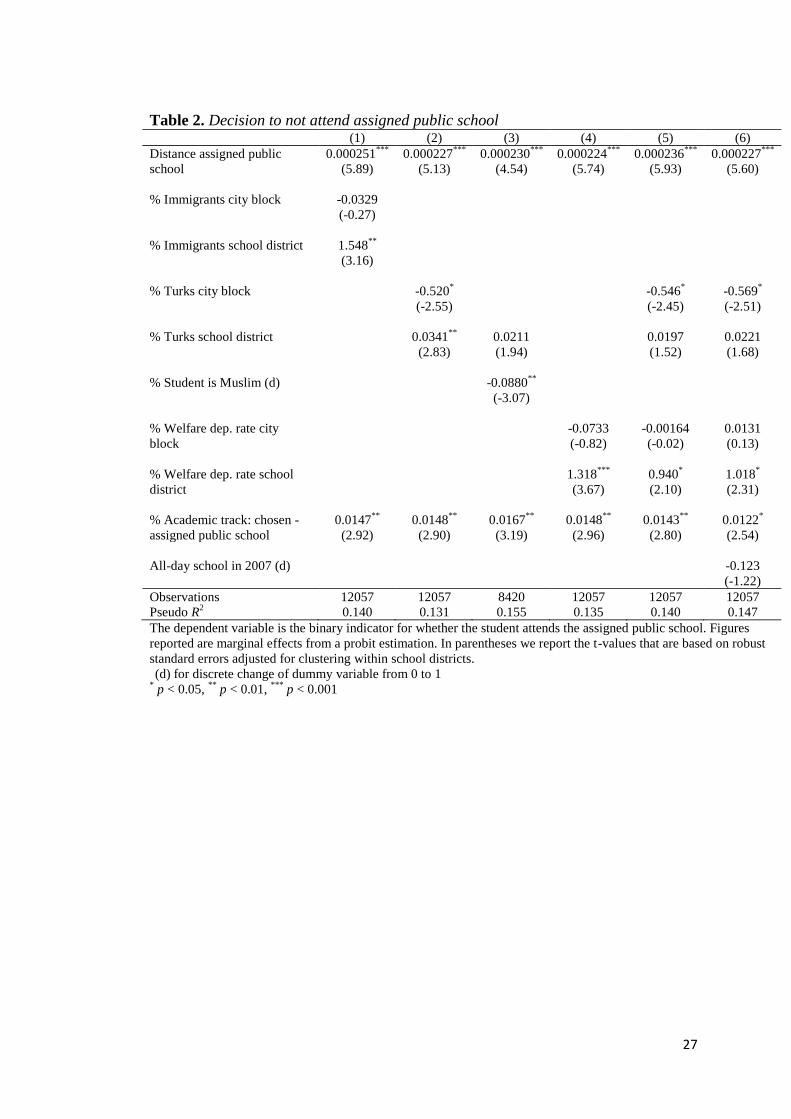
Tables 2-4 summarize the results of the regression analysis. Note that all t-values
reported are adjusted for clustering within school districts, and the reported coefficients in
Tables 2 and 3 are marginal effects.
In Table 2 the dependent variable is a binary variable indicating whether the student
does not attend the assigned public school. In model (1) we only include the distance to the
assigned school, the percentages of immigrants in the city block and in the school district, and
the percentage of students, which transferred to the academic track school in 2004. In
particular we use the difference between the transfer rates of the chosen school and the
assigned public school. Since the transfer rates are the only “objective” measure of school
quality, we expect parents to choose a better school, i.e., a school with a higher academic
track transfer rate.
As expected and in line with the literature, the distance to the assigned school plays an
important role. If the assigned school is far away from the student‟s home, she will be less
likely to choose that school. The percentage of immigrants in the city block is not significant,
the percentage of immigrants in the school district, however, comes in positive and
significant. While the significant effect is in line with our expectations, the size of the
coefficient is rather large and probably implausible. The academic track variable is positive
and significant, supporting our hypothesis that parents choose a higher quality school if they
choose. In model (2) the immigrant variables are replaced by the percentages of Turks. The
coefficients on the distance and the academic track variable remain almost unchanged. The
13
percentage of Turks in the city block has a significant negative effect and the percentage on
the school district level is smaller in magnitude and positive. Since we interpret the city block
variables as characterizing the students by their neighborhood and the school district variables
as characterizing the school environment, the results are quite intuitive. If a student has a
higher probability of having a Turkish background, the parents will not choose another than
the assigned school. If however, the school district has a large Turkish population, the
probability of attending another school rises.
In model (3) we use the student information on the religious denomination. Note that
due to missing observations the number of observations drops to 8420. As expected, the
variable has a negative impact. Students from disadvantaged families tend to visit the
assigned school. Since being disadvantaged might be reflected by the migration status but also
by the economic status of the student, we included the welfare dependency rates in (4). The
welfare dependency rate on the city block level lowers the probability to choose a school, but
the effect is not significant. The welfare dependency rate on the school district level, however,
shows the expected positive and significant effect. Combining migration background and
economic background in model (5) leaves the results fairly unchanged, even though the
significance levels drop and the percentage of Turks on the school district level is no longer
significant. This effect is possibly explained by the correlation between migration and
economic status. Finally we include the variable all day school, because having longer child
care at school might be considered as an indicator of school quality and in a country like
Germany with comparably poor day care facilities could be an argument for parents to choose
that school. Model (7) shows that this is not the case. All-day school enters with a negative
but insignificant coefficient. At first glance this is not intuitive. However, knowing that cities
in Germany introduced all-day schooling primarily in disadvantaged school district, the result
does not surprise. The socio-economic composition of the school is more important for school
choice than the availability of child care.
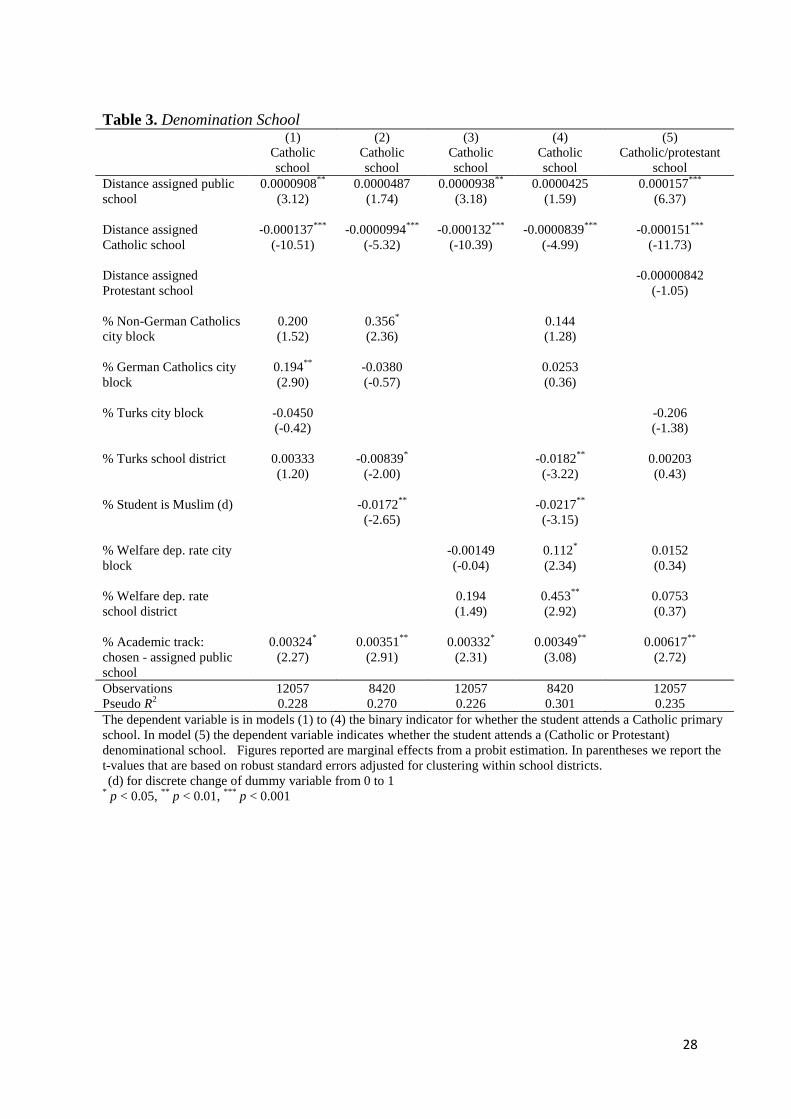
In Table 3 we analyze the decision to choose a public denomination school. In models
(1) to (4) the dependent variable is a binary indicator for whether the student attends a
Catholic school or not. In model (5) Catholic and Protestant schools are analyzed jointly.
As before, the distance to the school is of great importance. If the assigned public
school is further away from the student‟s home, it raises the probability that a Catholic school
is chosen. Increasing the distance to the denomination school lowers the probability to choose
a Catholic school. In column (1) the percentage of Catholic population in the city block is
included. Being from a German and also a non-German Catholic city block increases the

14
possibility to attend a Catholic school. The percentage of Turks turns out to be insignificant
and the academic track variable enters significantly. Thus parents appear to choose Catholic
schools because they are either from a Catholic background or because the school is better. In
column (2) we replace the percentage of Turks in the city block by the individual information
about the students‟ religion, i.e. whether the student is a Muslim. Not surprisingly, the
Turkish/Muslim variables enter with a negative and significant effect. Column (3) shows the
results, when the welfare dependency rates are included instead of the nationality /
denomination variables. The effect is insignificant. However, when including the
nationality/denomination variables together with the welfare variables, we find that lower
economic status, as measured by the welfare dependency rates, increases the probability to
visit a Catholic school and the effect on the non-German Catholics vanishes, which might be
due to some collinearity. When adding the Protestant schools and the Catholic schools the
socio-economic variables seize to be significant. The only variables that remain significant are
the distance variables except for the distance to the Protestant school and the academic track
variable that is almost doubled in size. A possible explanation for this result is that the choice
of a denomination school is not in the first place a choice against the assigned public school
but the school is chosen because it is more convenient to reach and the school appears to be of
better quality.
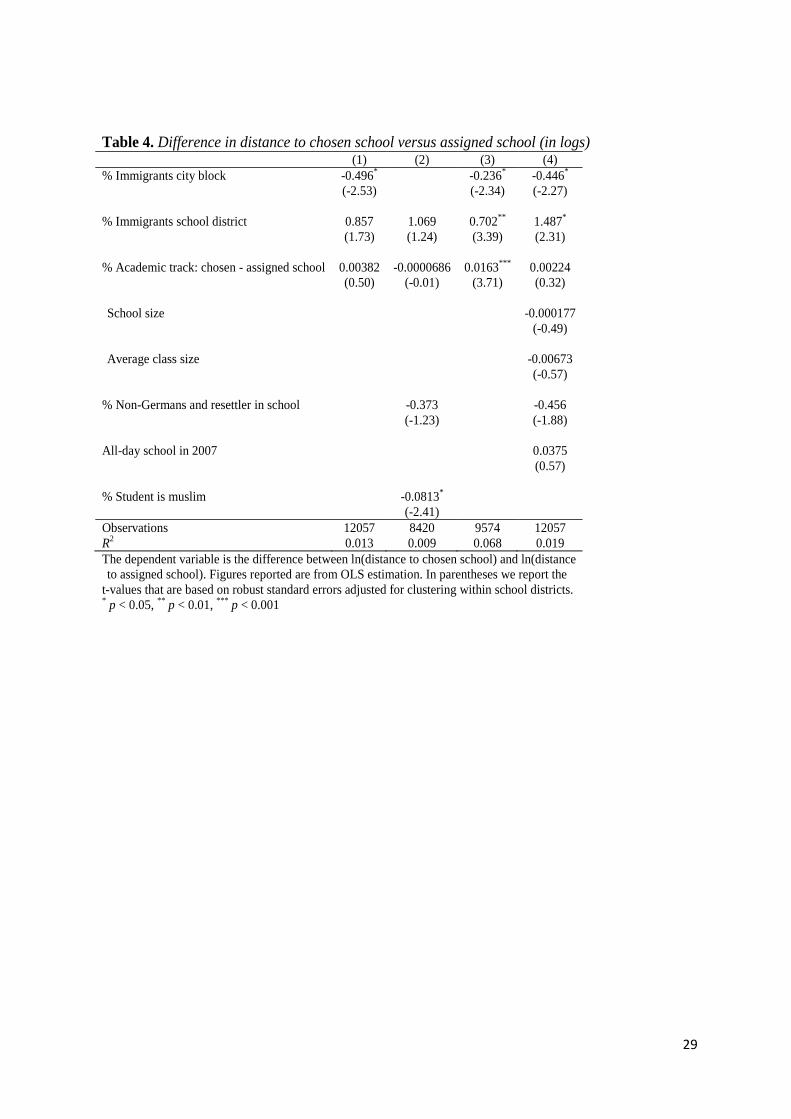
In Table 4 we report the results from a linear regression model to explain the
difference in the distance between the chosen school and the assigned school. The dependent
variable is the difference between ln(distance to chosen school) and ln(distance to assigned
school). The difference can be positive, when the chosen school is further away from the
child‟s home, it can be zero, if the chosen school is the assigned public school but also if the
chosen school, that is not the assigned school and the assigned school have the same address,
which is true for 2 schools (one public school shares the building with a Catholic school). If
the chosen school is closer than the assigned school, the difference might also be negative.
In column (1) all students are included in the regression. The percentage of immigrants
in the city block has a negative effect on the difference in distance. The interpretation is that
immigrants are less likely to incur additional travel costs by choosing a school. Immigrants at
the school district level have a positive but only marginally significant coefficient and the
academic track variable turns out to be insignificant. In model (2) we use the Muslim variable
instead of the city block immigrant variable and get a negative and significant effect. Note
that due to the missing observations are left with only 8409 observations. The school statistic
variable non-Germans and resettlers turns out to be insignificant.

15
In column (3) only public schools are included. The results now shows a negative and
significant effect of the city block migration variable and a positive and also significant effect
of the school district variable. Analyzing the public schools only, the academic track variable
is positive and significant. Parents are willing to pay the cost of travelling to school when the
school is a “better” school. Compared to the other models in Table 4 that show a rather poor
fit, the R2 increases. In column (4) we also include school size, average class size, and
whether a school is an all-day school. The school characteristics are all insignificant.
Choice and the composition of schools
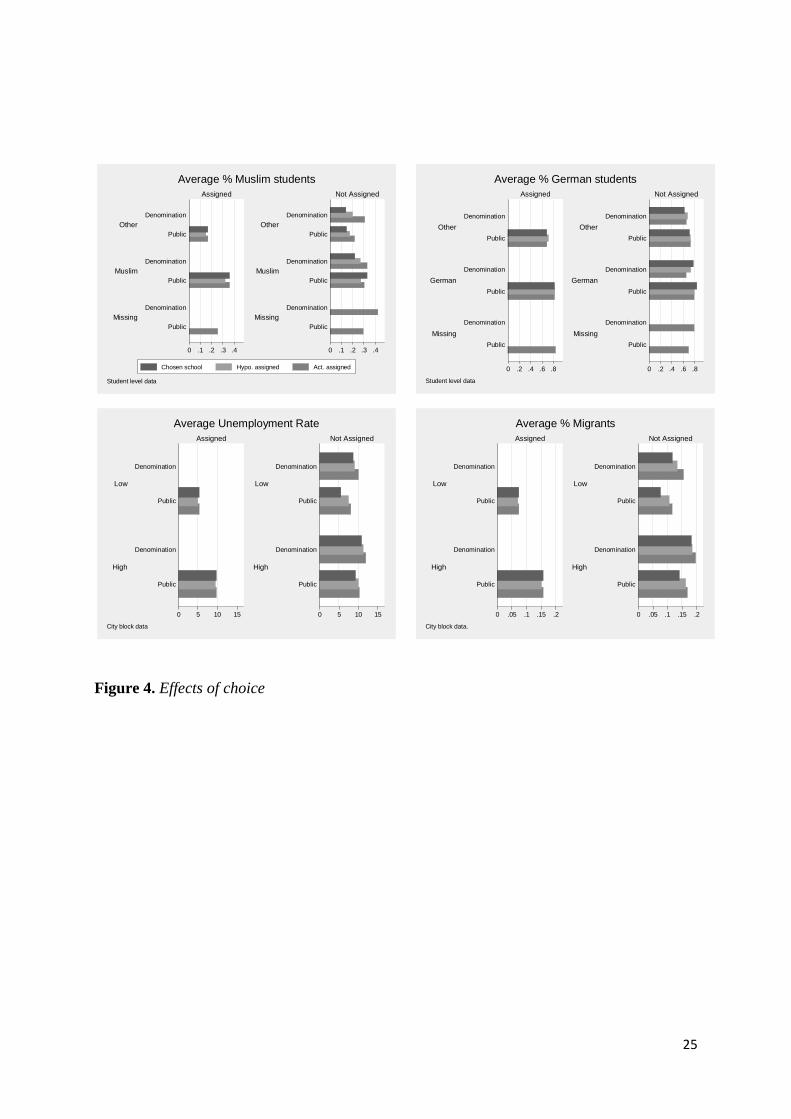
Next we look at the effect of choice on the composition of the schools. Figure 4
summarizes the analysis. In Panel 1 of Figure 4 we calculate the average percentage of
Muslim students under different scenarios. We differentiate between percentage Muslims at
the chosen school, the percentage that would prevail had every student chosen the assigned
public school, and finally the actual percentage of Muslims in the assigned school. In addition
we differentiate between students who visit the assigned public school (left hand side) and
students who visit another school (right hand side). Within these groups we further distinguish
between Muslim students and non-Muslim students and whether the school is a public or a
denomination school.
The interpretation of the figures is straight forward. First, we get insight into the
effects of choice on the composition of the assigned school, because students who choose
another school change the composition of the assigned school. If a non-Muslim does not
attend the assigned school, the percentage of Muslims will ceteris paribus increase. We label
this externality the composition effect. The composition effect is negative, whenever as a
result of choice, the percentage of students from disadvantaged groups increases. It is positive
if the percentage of disadvantaged students decreases. And second, we can see whether choice
is integrating or segregating. Choice is integrating if students from disadvantaged groups
choose a school with a higher percentage of advantaged students.
Students, who do not attend the assigned public school, and who are not Muslims,
have a negative effect on the composition of the assigned school. The chosen school has on
average a lower percentage of Muslim students than the counterfactual, i.e. the percentage of
Muslims had all students visited the assigned public school. And because choice worsens the
composition compared with the composition that results from residential segregation, the
actual percentage of Muslim students at the assigned public school is even higher. This is true
16
regardless of whether the non-Muslim student chooses a denomination or another public
school. Muslim students, who choose a denomination school, attend a school with a
significantly lower percentage of Muslims, than they can expect at the assigned public school.
Thus choice is integrating, but also increases the percentage of Muslims that actually visit the
assigned schools even further and significantly.
The choice of Muslim students, who attend a not-assigned school, however, is
segregating and does not worsen the composition of the assigned school if they choose a
public school. Muslims who choose a not-assigned public school, attend schools with a
significantly higher percentage of Muslim students. Panel 1 also includes the category
missing, as for 30 percent of the students we have no information on the denomination.
The results are less pronounced for the percentage of German students. But German
students tend to choose schools with a higher percentage of Germans, thereby also increasing
tendencies of segregation. Particularly strong and significant effects occur in the group of
German students, who choose a denomination school. The adverse effects on the assigned
schools are significant.
Panels 3 and 4 repeat the analysis by using city block data. Consider Panel 3 first. A
student is labeled to be from a city block with low unemployment if the unemployment rate is
below the 10th
percentile of the distribution in Wuppertal. Students enter the calculations with
a probability of being affected by unemployment in the city block. If a student is from a city
block with a high unemployment rate, chances are high that the student is either directly
affected because the parents are unemployed or – since the risk of unemployment is highly
correlated with poor education – are from an economically disadvantaged background. This
assumes that city blocks have a fairly homogenous socio-economic background. As before,
we differentiate between denomination schools and public schools.
First look at the difference between the unemployment rates for students from high
and low unemployment neighborhoods, who visit the assigned public school. The difference
is 4.3 percentage points. The difference is with 3.8 percentage points a bit smaller, when
students choose another school. Interestingly, the unemployment rate is higher or almost as
high in the schools for students who do not attend the assigned school. One explanation might
be that students from low unemployment neighborhoods and school districts choose the
assigned school. Figure 1a shows that unemployment is low in the outer regions of Wuppertal
and from Figure we know that denomination school cannot be found in the outer regions of
Wuppertal. Students from school districts with high unemployment, that are close to the
17
suspension line axis will not choose schools with low levels of unemployment, as they are
further away, but choose schools that are fairly close and have only a slightly lower level of
unemployment than the assigned school.
The levels of unemployment at the not assigned schools are higher in denomination
schools than in the public schools, regardless of whether the student is from city blocks with
high or low unemployment. One explanation for this rather unexpected effect is that the
denomination schools are closer to the suspension train axis, with districts that are
characterized by unemployment and large proportions of migrants (cf. Figures 1a and b and
2). The wealthy parts of Wuppertal are on the mountains at the outer regions and not as easy
to reach by public transportation and have no denomination schools. And as we know from
the regression analysis, the distance to school has an important impact on choice. Moreover,
in particular Catholic schools might be chosen for religious reasons. The social composition
of the school might play a minor role. But again, choice worsens the composition of the
assigned schools.
Panel 4 shows a very similar pattern. We find the percentage of migrants in the
denomination schools to be substantially higher than in the public schools, which again might
be explained by the fact that Catholic migrants are often from EU member states and keep
their original nationality even though they are well integrated in the German society. As
before, the migrants„choices are integrating, the choice of the non-migrants tends to be
segregating.
Summarizing, we state that choice of the advantaged students has a segregating effect,
whereas the choice of the disadvantaged students tends to have integrating effects. This
confirms the results in Bifulco et al. (2008). Moreover, choice has a significant effect on the
social composition of the schools. The socio-economic composition of the assigned schools
becomes less balanced. It turns out that students, who choose, show a fairly similar pattern of
choice. The composition of those who choose is more balanced than the composition of the
students who do not choose, but attend the assigned public school.
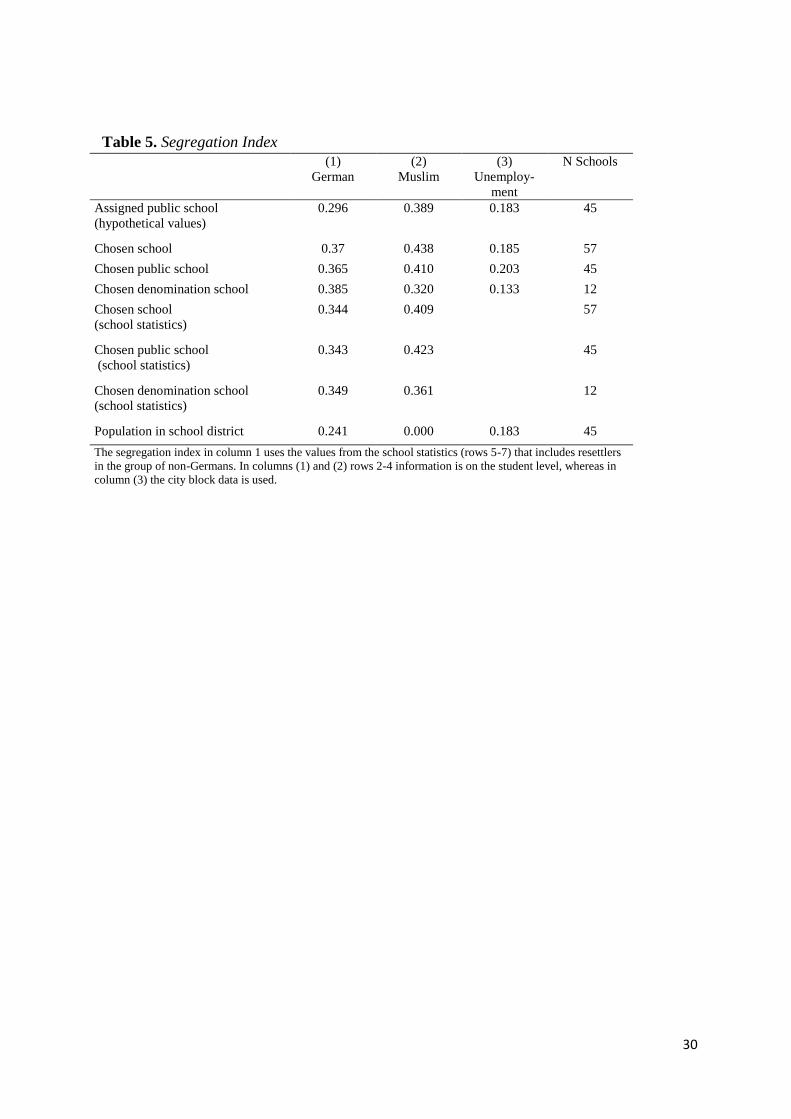
Segregation
To conclude the analysis we calculate the net effect of school choice, to learn more
about the level of segregation. We compute the segregation indices in the chosen school and
the assigned public school and report them in Table 5. The first row shows the segregation
index, had every student decided to attend the assigned public school. The value of 0.296 in
column (1) indicates that 30 percent of the students would have to move to a different school
18
to result in an equal percentage of Germans at each public school, given that every student has
to attend a public school. Thus even in the absence of school choice, the level of segregation
would be substantial because of the socio-economic mix of the school districts is
heterogeneous, i.e., there is residential segregation.
In the first row of Table 5 we look at the actual segregation index, which differs from
the second row, because choice can alter the degree of segregation. We find that the
segregation index for Germans jumps by 8 percentage points. The segregation index for
denomination schools is even higher. The values calculated by using the school statistics
show a similar pattern, the segregation index, however, is smaller than the value obtained by
using individual data. The difference can probably be explained by the schools that did not
provide us with student data on nationality and the religious denomination. Moreover, when
using the school statistics we added the resettlers to the group of migrants. In the official
statistics we cannot analyze the group of resettlers, because they are German citizens.
However, if the migration variable should serve as a proxy for disintegration, it makes perfect
sense to include them. Not including resettlers in the group of migrants raises the difference in
the segregation index of denomination and public schools.
The degree of segregation is even higher when looking at the denomination variable in
(2) (using the school statistics). Moreover, the values differ again depending on the source of
data, since we do not have the information for 30 percent of the students. Another source of
variation might be that the data from the school statistics on the denomination variable is from
2005 and since then some primary schools have been shut down or are about to be shut down
in the next years (4 schools that still exist in 2005 have been shut down in 2007). As expected,
the level of denominational segregation is lowest at the denomination schools, but still
remains at a high level.
Finally we look at the extent of segregation with respect to unemployment. The degree
of segregation is clearly much lower than for the two other variables, although it might
however be misleading to compare the values, since the data is only available on the city
block level. Our results show that segregation increases when allowing for choice and within
the group of denomination schools the degree of segregation is lowest, which is mostly driven
by the two Protestant schools and not as much by the Catholic schools.
6. Conclusions and outlook
This study is one of the first to analyze primary school choice in Germany. Even
though school districts with an assigned public school exist and choosing a different school is
19
thought to be an exception, our data for Wuppertal – a major city in NRW close to the Ruhr-
Area – shows that this is not the case. Choice exists because in addition to the public schools
there are denomination schools the students can choose. Furthermore, there is the possibility
to apply for admittance at another than the assigned public school. 32 percent of primary
school students in Wuppertal do not visit the assigned public school in 2007/8. 20 percent
visit a denomination school and of the students who attend a public school, 15 percent go to a
public school that is not the assigned public school.
The paper gets some first insights on the determinants of choice. We find that the
distance to school and the perceived quality of the school influence the decision significantly.
Other important factors are the socioeconomic background of the students and the
composition of the school district. Families from disadvantaged neighborhoods tend to send
their children to the assigned school. A high percentage of migrants and/or economically
disadvantaged families in the school district lead parents to choose another school for their
children. Advantaged families make segregating choices, whereas disadvantaged families tend
more to make integrating choices. The external effect of choice on the composition of the not
chosen school is significant and the level of segregation in the Wuppertal primary schools is
high and exceeds the level of segregation of the population in the school districts.
In a next step, we will compare the situation in Wuppertal to the situation in the
neighboring city of Solingen, which is one of the few cities in NRW without denomination
schools and continue to analyze if and how choice has been altered by abolishing the school
districts in 2008.
References
Berlin Institut für Bevölkerung und Entwicklung (2009), Ungenutzte Potentiale. Zur Lage der
Integration in Deutschland, Berlin.
Bifulco, R. & Ladd, H. F. & S. L. Ross (2008). Public school choice and integration evidence
from Durham, North Carolina. Social Science Research,
doi:10.1016/j.ssresearch.2008.10.001.
Borjas, G. J. (1995). Ethnicity, neigborhoods, and human-capital externalities. The American
Economic Review, 85(3), 365-390.
Burgess, S. und Briggs, A. (2006). School assignment, school choice and social mobility.
CMPO Working Paper No. 06/157.
Chuna F, Heckman, J. J., Lochner, L. & Masterov D. V. (2006). Interpreting the evidence on
life cycle skill formation. In: Hanushek, E. A. and Welch, F. (eds.) Handbook of the
Economics of Education, Vol. 1, Chapter 12, 697-812.
20
Cullen, J.B., Jacob, B.A., & Levitt, S. D. (2005). The impact of school choice on student
outcomes: An analysis of the Chicago Public Schools. Journal of Public Economics, 89,
729-760.
Dustmann, C. (2004) Parental background, secondary school track choice, and wages. Oxford
Economic Papers, 56, 209-230.
Echenique, F. & Fryer, R. G., Jr. (2007). A measure of segregation based on social
interactions. Quarterly Journal of Economics, 122 (2), 441–485.
Echenique, F., Fryer, R. G., Jr. Kaufman (2006), Is school segregation good or bad?
American Economic Review, Papers and Proceedings, 96(2), 265-269.
Entorf, H. & Minoiu, N. (2005). What a difference immigration policy makes: A comparison
of PISA score in Europe and traditional countries of immigration. German Economic
Review 6(3), 355-376.
Fryer, R. G. & Levitt, S. D. (2004). Understanding the black-white test score gap in the first
two years of school. Review of Economics and Statistics, 86 (2), 447-464.
Hanushek, E. A., Kain, J. F., & Rivkin, S. G. (2002). New evidence about Brown v. Board of
Education: The complex effects of school racial composition on achievement. National
Bureau of Economic Research, Inc., NBER Working Papers: No. 8741.
Hastings, J., Kane, T. J. & Staiger, D. O. (2006). Preferences and heterogeneous treatment
effects in a public school choice lottery, NBER Working Paper 12145.
Hoxby, C. (2003). School choice and productivity: Should school choice be a tide that lifts all
boats? In C. Hoxby (Ed.), The Economics of School Choice. Chicago, IL: University of
Chicago Press.
Jürges, H. & K. Schneider (2009), Central exit exams increase performance…but take the fun
out of mathematics, forthcoming in Journal of Population Economics.
Kristen, C. (2005). School Choice and Ethnic School Segregation: Primary School Selection
in Germany. Münster: Waxmann.
Lankford, H. & Wyckoff, J. (2001). Who would be left behind by enhanced private school
choice, Journal of Urban Economics, 50, 288-312.
Walsh, P., (2008), Effects of school choice on the margin: The cream is already skimmed.
Economics of Education Review, doi:10.1016/j.econedurev.2007.11.005
West, M. R. & Wößmann, L. (2008). Every Catholic Child in a Catholic School: Historical
Resistance to State Schooling, Contemporary Private Competition, and Student
Achievement across Countries. CESifo Working Paper No. 2332.
21
Figure 1a. Unemployment in the Wuppertal school districts (2006)
22
Figure 1b. Allocation of immigrants in Wuppertal (2007)
23
Figure 2. Public and public denomination schools in Wuppertal
24
0
.00
05
.00
1.0
015
den
sity
0 1000 2000 3000 4000distance
Assigned School
0
.00
02
.00
04
.00
06
den
sity
0 2000 4000 6000 8000distance
Catholic School0
.00
01
.00
02
.00
03
den
sity
0 2000 4000 6000 8000 10000distance
Protestant School
0
.00
05
.00
1.0
015
den
sity
0 5000 10000 15000distance
Chosen School
Distance to school (in m)
Figure 3. Distance to school
25
0 .1 .2 .3 .4 0 .1 .2 .3 .4
Missing
Muslim
Other
Missing
Muslim
Other
Public
Denomination
Public
Denomination
Public
Denomination
Public
Denomination
Public
Denomination
Public
Denomination
Assigned Not Assigned
Chosen school Hypo. assigned Act. assigned
Student level data
Average % Muslim students
0 .2 .4 .6 .8 0 .2 .4 .6 .8
Missing
German
Other
Missing
German
Other
Public
Denomination
Public
Denomination
Public
Denomination
Public
Denomination
Public
Denomination
Public
Denomination
Assigned Not Assigned
Student level data
Average % German students
0 5 10 15 0 5 10 15
High
Low
High
Low
Public
Denomination
Public
Denomination
Public
Denomination
Public
Denomination
Assigned Not Assigned
City block data
Average Unemployment Rate
0 .05 .1 .15 .2 0 .05 .1 .15 .2
High
Low
High
Low
Public
Denomination
Public
Denomination
Public
Denomination
Public
Denomination
Assigned Not Assigned
City block data.
Average % Migrants
Figure 4. Effects of choice
26
Table 1. Sample description (1) (2) (3) (4)
all Catholic Protestant public school
Not assigned public school 0.323
(0.468)
0.147
(0.354)
Distance chosen school 742.5
(830.7)
682.8
(684.4)
1191.3
(1122.2)
738.9
(842.4)
Distance assigned public school 621.9
(469.8)
693.5
(424.0)
1023.1
(574.9)
591.0
(466.5)
Distance assigned Catholic school 1464.1
(1385.4)
637.7
(467.0)
1114.2
(944.7)
1660.5
(1463.0)
Distance assigned Protestant school 3201.0
(1581.5)
3023.6
(1338.5)
1164.2
(1012.5)
3316.5
(1593.3)
% Immigrants city block 0.153
(0.125)
0.189
(0.128)
0.125
(0.113)
0.147
(0.123)
% Turks city block 0.0453
(0.0627)
0.0527
(0.0555)
0.0272
(0.0441)
0.0444
(0.0646)
% Immigrants school district 0.139
(0.0710)
0.171
(0.0606)
0.136
(0.0508)
0.132
(0.0718)
% Welfare dep. rate city block 0.182
(0.140)
0.215
(0.132)
0.137
(0.122)
0.176
(0.141)
% Welfare dep. rate school district 0.166
(0.0770)
0.202
(0.0623)
0.156
(0.0530)
0.159
(0.0785)
All-day school in 2007 0.740
(0.439)
0.534
(0.499)
0.436
(0.497)
0.797
(0.402)
Observations 12057 2124 358 9575
27
Table 2. Decision to not attend assigned public school (1) (2) (3) (4) (5) (6)
Distance assigned public
school
0.000251***
(5.89)
0.000227***
(5.13)
0.000230***
(4.54)
0.000224***
(5.74)
0.000236***
(5.93)
0.000227***
(5.60)
% Immigrants city block -0.0329
(-0.27)
% Immigrants school district 1.548**
(3.16)
% Turks city block
-0.520*
(-2.55)
-0.546*
(-2.45)
-0.569*
(-2.51)
% Turks school district
0.0341**
(2.83)
0.0211
(1.94)
0.0197
(1.52)
0.0221
(1.68)
% Student is Muslim (d)
-0.0880**
(-3.07)
% Welfare dep. rate city
block
-0.0733
(-0.82)
-0.00164
(-0.02)
0.0131
(0.13)
% Welfare dep. rate school
district
1.318***
(3.67)
0.940*
(2.10)
1.018*
(2.31)
% Academic track: chosen -
assigned public school
0.0147**
(2.92)
0.0148**
(2.90)
0.0167**
(3.19)
0.0148**
(2.96)
0.0143**
(2.80)
0.0122*
(2.54)
All-day school in 2007 (d)
-0.123
(-1.22)
Observations 12057 12057 8420 12057 12057 12057
Pseudo R2 0.140 0.131 0.155 0.135 0.140 0.147
The dependent variable is the binary indicator for whether the student attends the assigned public school. Figures
reported are marginal effects from a probit estimation. In parentheses we report the t-values that are based on robust
standard errors adjusted for clustering within school districts.
(d) for discrete change of dummy variable from 0 to 1 * p < 0.05,
** p < 0.01,
*** p < 0.001
28
Table 3. Denomination School (1) (2) (3) (4) (5)
Catholic
school
Catholic
school
Catholic
school
Catholic
school
Catholic/protestant
school
Distance assigned public
school
0.0000908**
(3.12)
0.0000487
(1.74)
0.0000938**
(3.18)
0.0000425
(1.59)
0.000157***
(6.37)
Distance assigned
Catholic school
-0.000137***
(-10.51)
-0.0000994***
(-5.32)
-0.000132***
(-10.39)
-0.0000839***
(-4.99)
-0.000151***
(-11.73)
Distance assigned
Protestant school
-0.00000842
(-1.05)
% Non-German Catholics
city block
0.200
(1.52)
0.356*
(2.36)
0.144
(1.28)
% German Catholics city
block
0.194**
(2.90)
-0.0380
(-0.57)
0.0253
(0.36)
% Turks city block -0.0450
(-0.42)
-0.206
(-1.38)
% Turks school district 0.00333
(1.20)
-0.00839*
(-2.00)
-0.0182**
(-3.22)
0.00203
(0.43)
% Student is Muslim (d)
-0.0172**
(-2.65)
-0.0217**
(-3.15)
% Welfare dep. rate city
block
-0.00149
(-0.04)
0.112*
(2.34)
0.0152
(0.34)
% Welfare dep. rate
school district
0.194
(1.49)
0.453**
(2.92)
0.0753
(0.37)
% Academic track:
chosen - assigned public
school
0.00324*
(2.27)
0.00351**
(2.91)
0.00332*
(2.31)
0.00349**
(3.08)
0.00617**
(2.72)
Observations 12057 8420 12057 8420 12057
Pseudo R2 0.228 0.270 0.226 0.301 0.235
The dependent variable is in models (1) to (4) the binary indicator for whether the student attends a Catholic primary
school. In model (5) the dependent variable indicates whether the student attends a (Catholic or Protestant)
denominational school. Figures reported are marginal effects from a probit estimation. In parentheses we report the
t-values that are based on robust standard errors adjusted for clustering within school districts.
(d) for discrete change of dummy variable from 0 to 1 * p < 0.05,
** p < 0.01,
*** p < 0.001
29
Table 4. Difference in distance to chosen school versus assigned school (in logs) (1) (2) (3) (4)
% Immigrants city block -0.496*
(-2.53)
-0.236*
(-2.34)
-0.446*
(-2.27)
% Immigrants school district 0.857
(1.73)
1.069
(1.24)
0.702**
(3.39)
1.487*
(2.31)
% Academic track: chosen - assigned school 0.00382
(0.50)
-0.0000686
(-0.01)
0.0163***
(3.71)
0.00224
(0.32)
School size
-0.000177
(-0.49)
Average class size
-0.00673
(-0.57)
% Non-Germans and resettler in school
-0.373
(-1.23)
-0.456
(-1.88)
All-day school in 2007
0.0375
(0.57)
% Student is muslim
-0.0813*
(-2.41)
Observations 12057 8420 9574 12057
R2 0.013 0.009 0.068 0.019
The dependent variable is the difference between ln(distance to chosen school) and ln(distance
to assigned school). Figures reported are from OLS estimation. In parentheses we report the
t-values that are based on robust standard errors adjusted for clustering within school districts. * p < 0.05,
** p < 0.01,
*** p < 0.001
30
Table 5. Segregation Index
(1)
German
(2)
Muslim
(3)
Unemploy-
ment
N Schools
Assigned public school
(hypothetical values)
0.296 0.389 0.183 45
Chosen school 0.37 0.438 0.185 57
Chosen public school 0.365 0.410 0.203 45
Chosen denomination school 0.385 0.320 0.133 12
Chosen school
(school statistics)
0.344 0.409 57
Chosen public school
(school statistics)
0.343 0.423 45
Chosen denomination school
(school statistics)
0.349 0.361 12
Population in school district 0.241 0.000 0.183 45
The segregation index in column 1 uses the values from the school statistics (rows 5-7) that includes resettlers
in the group of non-Germans. In columns (1) and (2) rows 2-4 information is on the student level, whereas in
column (3) the city block data is used.