Embed Size (px)
Citation preview
SCHOOL DISTRICT OF TOMS RIVER REGIONAL
TOMS RIVER REGIONAL SCHOOL BOARD Toms River, New Jersey
County of Ocean
COMPREHENSIVE ANNUAL FINANCIAL REPORT FOR THE FISCAL YEAR ENDED JUNE 30, 2012

COMPREHENSIVE ANNUAL FINANCIAL REPORT
OF THE
TOMS RIVER REGIONAL BOARD OF EDUCATION
TOMS RIVER, NEW JERSEY
FOR THE FISCAL YEAR ENDED JUNE 30, 2012
Prepared by
Toms River Regional Board of Education Business Office

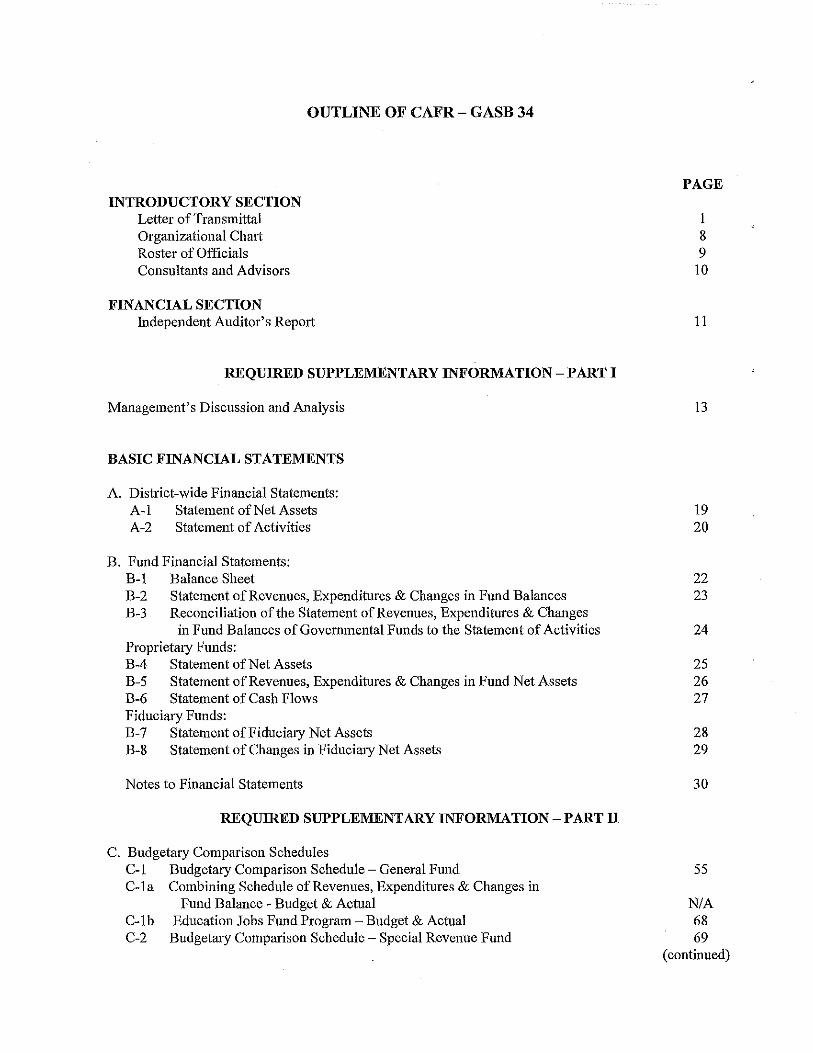
INTRODUCTORY SECTION Letter of Transmittal Organizational Chart Roster of Officials Consultants and Advisors
OUTLINE OF CAFR - GASB 34
FINANCIAL SECTION Independent Auditor's Report
REQUIRED SUPPLEMENTARY INFORMATION - PART I
Management's Discussion and Analysis
BASIC FINANCIAL STATEMENTS
A. District-wide Financial Statements: A-I Statement of Net Assets A-2 Statement of Activities
B. Fund Financial Statements: B-1 Balance Sheet B-2 Statement of Revenues, Expenditures & Changes in Fund Balances B-3 Reconciliation of the Statement of Revenues, Expenditures & Changes
in Fund Balances of Governmental Funds to the Statement of Activities Proprietary Funds: B-4 Statement of Net Assets B-5 Statement of Revenues, Expenditures & Changes in Fund Net Assets B-6 Statement of Cash Flows Fiduciary Funds: B-7 Statement of Fiduciary Net Assets B-8 Statement of Changes in Fiduci31Y Net Assets
Notes to Financial Statements
REQUIRED SUPPLEMENTARY INFORMATION - PART II
C. Budgetary Comparison Schedules C-I Budgetary Comparison Schedule - General Fund C-Ia Combining Schedule of Revenues, Expenditures & Changes in
C-Ib C-2
Fund Balance - Budget & Actual Education Jobs Fund Program - Budget & Actual Budget31y Comp31'ison Schedule - Special Revenue Fund
PAGE
I 8 9
10
11
13
19 20
22 23
24
25 26 27
28 29
30
55
N/A 68 69
(continued)
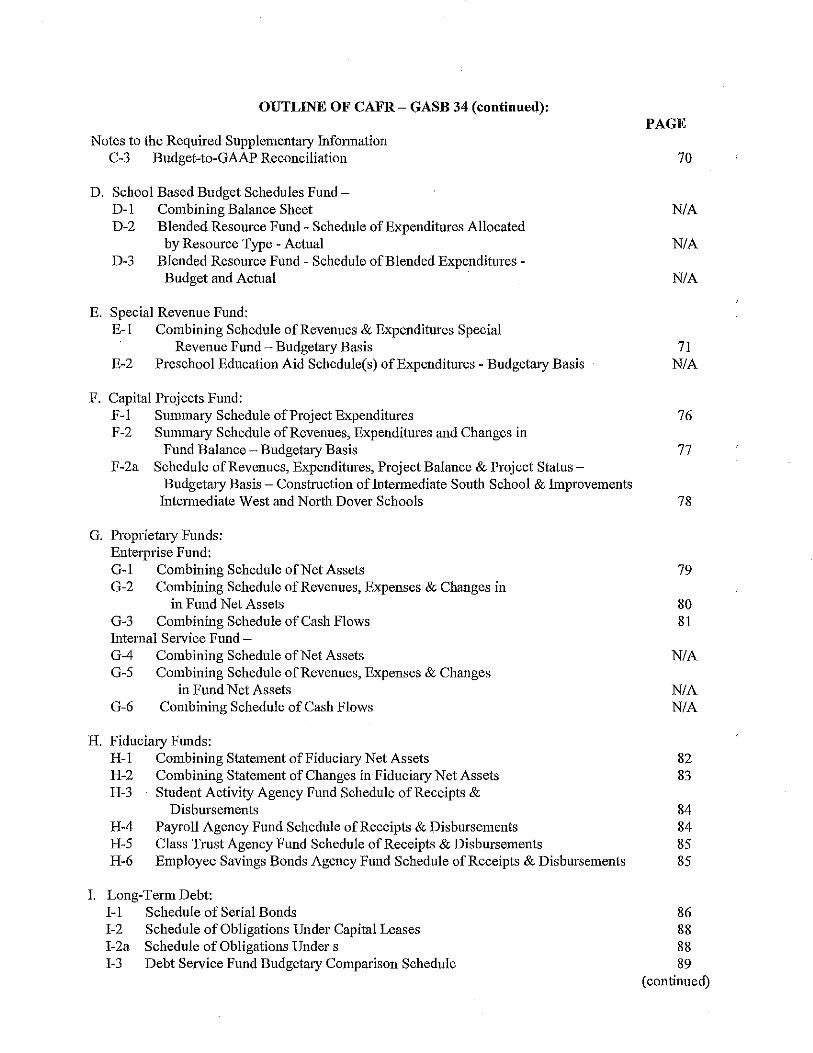
OUTLINE OF CAFR- GASB 34 (continned):
Notes to the Required Supplementary Information C-3 Budget-to-OAAP Reconciliation
D. School Based Budget Schedules Fund-D-\ Combining Balance Sheet D-2 Blended Resolli'ce Fund - Schedule of Expenditures Allocated
by Resource Type - Actual D-3 Blended Resolli'ce Fund - Schedule of Blended Expenditures -
Budget and Actual
E. Special Revenue Fund: E-l Combining Schedule of Revenues & Expenditures Special
Revenue Fund - Budgetary Basis E-2 Preschool Education Aid Schedule(s) of Expenditures - Budgetary Basis
F. Capital Projects Fund: F-l Summary Schedule of Project Expenditures F-2 Summary Schedule of Revenues, Expenditures and Changes in
Fund Balance - Budgetary Basis F-2a Schedule of Revenues, Expenditures, Project Balance & Project Status
Budgetary Basis - Construction ofIntel1nediate South School & Improvements Intermediate West and North Dover Schools
O. Proplietary Funds: Enterprise Fund: 0-1 Combining Schedule of Net Assets 0-2 Combining Schedule of Revenues, Expenses & Changes in
in Fund Net Assets 0-3 Combining Schedule of Cash Flows Internal Service Fund -0-4 Combining Schednle of Net Assets 0-5 Combining Schedule of Revenues, Expenses & Changes
in Fund Net Assets 0-6 Combining Schedule of Cash Flows
H. Fiduciary Funds: H-l Combining Statement of Fiduciary Net Assets H-2 Combining Statement of Changes in Fidnciary Net Assets H-3 Student Activity Agency Fund Schedule of Receipts &
Disbursements H-4 Payroll Agency Fund Schedule of Receipts & Disbursements H-5 Class Trust Agency Fund Schedule of Receipts & Disbursements H-6 Employee Savings Bonds Agency Fund Schedule of Receipts & Disbursements
I. Long-Term Debt: I-I Schedule of Serial Bonds 1-2 Schedule of Obligations Under Capital Leases 1-2a Schedule of Obligations Under s 1-3 Debt Service Fund Budgetary Comparison Schedule
PAGE
70
N/A
N/A
N/A
71 N/A
76
77
78
79
80 81
N/A
N/A N/A
82 83
84 84 85 85
86 88 88 89
(continued)
OUTLINE OF CAFR- GASB 34 (continued):
STATISTICAL SECTION (unaudited)
Financial Trends: J-I Net Assets by Component J -2 Changes in Net Assets J-3 Fund Balances - Govemmental Funds J-4 Changes in Fund Balances - Govemmental Funds J-5 General Fund Other Local Revenue by Source
Revenue Capacity: J-6 Assessed Value & Estimated Actual Value of Taxable Property J-7 Direct & Overlapping Property Tax Rates J-8 Principal Property Taxpayers J-9 Property Tax Levies & Collections
Debt Capacity: J-I0 Ratios of Outstanding Debt by Type J-II Ratios of General Bonded Debt Outstanding J-12 Direct & Overlapping Govemmental Activities Debt J-13 Legal Debt Margin Information
Demographic & Economic Information: J-14 Demographic & Economic Statistics J-15 Principal Employers
Operating Information: J-16 Full-Time Equivalent District Employees by FunctioniProgram J -17 Operating Statistics J-18 School Building Infonnation J-19 Schedule of Reqnired Maintenance J-20 Insurance Schedule
K SINGLE AUDIT SECTION K-I RepOit on Compliance and on Internal Control Over Financial Reporting
and Otber Matters Based on an Audit of Financial Statements Performed
PAGE
90 91 94 95 97
98 99 100 101
102 103 104 lOS
106 107
108 109 110 111 112
in Accordance With Government Auditing Standards 113 K-2 Report on Compliance with Requirements Applicable to Each Major Program
and on Intemal Control Over Compliance in Accordance with OMB Circular A-133 and New Jersey OMB Circular Letter 04-04 115
K-3 Schedule of Expenditures of Federal Awards, Schedule A 117 K-4 Schedule of Expenditures of State Financial Assistance, Schedule B 118 K-5 Notes to Schedules of Awards and Financial Assistance 119 K-6 Schedule of Findings and Questioned Costs 121 K-7 Summary Schedule of Prior Audit Findings 124
(concluded)

INTRODUCTORY SECTION
I
I
I
I
I
I
I
I
October 26,2012
Honorable President and Members of the Board of Education Toms River School District County of Ocean, New Jersey
Dear Board Members:
TOMS RIVER REGIONAL SCHOOLS
1144 Hooper Avenue, Toms River, NJ 08753 (732) 505-5510 (732) 505-5511
The comprehensive annual financial repOli of the Toms River School District for the fiscal year ending June 30,2012 is hereby submitted. Responsibility for both the accuracy of the data and completeness and fairness of the presentation, including all disclosures, rests with the management of the Board of Education (Board). To the best of our knowledge and belief, the data presented in this report is accurate in all material respects and is repOlied in a manner designed to fairly present the financial position and results of operations of the various funds and account groups of the District. All disclosures necessary to enable the reader to gain an nnderstanding of the District's fmancial activities have been inclnded.
The comprehensive annual financial report is presented in four sections: introductory, financial, statistical and single audit. The introductory section includes this transmittal letter, the District! s organizational chaIi aIld a list of principal officials. The financial section includes the basic financial statements and schedules, as well as the auditor's report thereon. The statistical section includes selected financial and demographic information, generally presented on a multi-year basis. The District is required to undergo an annual single audit in conformity with the provisions of the Single Andit Act of 1984 and the u.S. Office of Management and Budget Circular A-l33, "Audits of State and Local Governments ", and the state Treasury Circular Letter 04-04 OMB, "Single Audit Policy for Recipients of Federal Grants, State Grants and State Aid". Information related to this single audit, including the auditor's report on the internal control structure and COmpiiaI1Ce with applicable laws, regulations, findings and recommendations, is included in the single audit section of this report.
1) REPORTING ENTITY AND ITS SERVICES: The Toms River School District is an independent repOliing entity within the criteria adopted by the GASB as established by Statement No. 14. All funds and account groups of the District are included in this report. The Toms River Board of Education and all its schools constitute the District's reporting entity.
The District provides a full range of educational services appropriate to grade levels Pre-K through 12. These include regular, vocational and special education for children with special needs. The District Residential Enrolhnent for 2011-2012 school year decreased by 188.2 students over the previous year's ern-ollment. The
I
TOMS RIVER REGIONAL SCHOOLS
1144 Hooper Avenue, Toms River, NJ 08753 (732) 505-5510 (732) 505-5511
following details the changes in the student emollment of the District since 1989-90. These figures are based upon average daily emollment.
Average Daily Enrol1ment
Fiscal Year Stndent Enrol1ment # Students (+/-) Percent Change
1989-90 15,783.3 1990-91 15,759.3 -24.0 0.0015%-1991-92 15,938.3 +179.0 0.0114%+ 1992-93 15,986.7 +48.0 0.0030%+ 1993-94 16,197.4 +210.7 0.0132%+ 1994-95 16,513.1 +315.7 0.020%+ 1995-96 16,848.8 +335.7 0.021%+ 1996-97 17,168.6 +319.8 0.019%+ 1997-98 17,227.9 +59.3 0.0035%+ 1998-99 17,375.8 +147.9 0.0086%+ 1999-00 17,444.1 +68.3 0.0040%+ 2000-01 17,666.5 +222.5 0.0128%+ 2001-02 17,864.6 + 198.1 0.01 13%+ 2002-03 18,081.2 +216.6 0.0122%+ 2003-04 18,185.3 +104.1 0.0057%+ 2004-05 18,121.6 - 63.7 0.0035% -2005-06 17,851.4 - 270.2 0.0149% -2006-07 17,634.4 -217.0 0.0154%-2007-08 17,396.5 -237.9 0.0196%-2008-09 17,239.8 -156.7 0.00352%-2009-10 17,090.1 -149.7 0.00868%-2010-11 16,975.6 -114.5 0.00670%-2011-12 16,787.4 -188.2 0.0111%-
2. ECONOMIC CONDITION AND OUTLOOK: Local, state, aud federal economic conditions continue to create a relatively unstable and uncertain economic environment, for all entities, including the school district. Investment rates continue to be depressed and investment earnings are hovering at all time lows. The State of New Jersey has again delayed payment of the final two State Aid payments for the year, totaling $6,525,053 as of June 30, 2012. On the positive side, the District's solar initiatives continued to pay dividends to the taxpayers of the Toms River Regional School District through the sale of "Solar Renewable Energy Credits" and the production of om own electricity. CUlTently, the second phase of the district's solar initiative is nearly complete, and through a Power Purchase Agreement, the project will provide for lower
2
TOMS RIVER REGIONAL SCHOOLS
1144 Hooper Avenue, Toms River, NJ 08753 (732) 505-5510 (732) 505-5511
electricity costs as well as the replacement of the roofs at eleven (11) school district facilities at no cost to the taxpayers. Additionally, the District has stabilized future inflationary energy costs through the pmticipation in energy cooperatives for electric and gas resulting in favorable energy unit costs, as well as pmticipating in a demand-response progrmu which will further cUitail energy aud provide revenue to the school district. Finally, in August 2012 the district contracted with Energy Education Inc. for energy conservation services, which is expected to generate millions of dollars in savings in utility costs over the next several years.
The 2012-2013 School Budget was approved by the Board of Education in March 2012 and the budget as presented provides for a thorough and efficient education. Our district was one of the vast majority of school districts who moved the Board elections to November. Therefore, the annual public vote on the budget is no longer required provided that the budget is under the State-mandated cap. This change saved the district significant dollars in annual election costs. The increase in the overall tax levy (general and debt service levy) with the 2012-13 budget was 1.2%. Although the school tax levy increased only minimally, properly tax appeals and the effect on the ratable bases, coupled with the Department of Education's allocation of taxes between the constituent municipalities in the regional district, may cause additional pressure on the local taxpayers in some of our municipalities. The District is concerned about the status of the economy and the fiscal health of the State of New Jersey. Although the District will continue to strive to find fiscal efficiencies in all aspects of OUl· operation, we remain concerned about our level of surplus, the impact of the 2% properly tax cap, our allocation of State Aid and the effect of any legislation that could have a negative impact on the efficiency or quality of our school system.
3. MAJOR INITIATIVES:
High School Half-year course offerings: Course offerings in the Science, Fine Arts mld Cm·eer/Technology Departments of the high schools were updated, with the development of half-year courses in each area to better suit the interest levels of students and provide for smaller instructional units of high motivation. This was also completed to support the newly required state-mandated Personal Finance course.
Physical Education - option 2: Students are provided the opportunity to complete the required 150 minutes per week health component outside of traditional physical education class. Interscholastic athletic programs or approved outside physical activities can fulfill this requirement thereby permitting involved students an open class slot to further expand course options.
Partnership with Ocean Couuty College (OCC): A number of programs have been designed to SUppOit our partnership with OCC. The Write Connection pairs high school and collegiate level writers in peer review and editing of student composition. The Bridges Program offers the Accuplacer (placement test) to juniors with remediation possibilities for senior year in preparation of entry to OCC.
3
TOMS RIVER REGIONAL SCHOOLS
1144 Hooper Avenue, Toms River, NJ 08753 (732) 505-5510 (732) 505-5511
HSP A Preparation Lab/Tntorial: Identified students are given additional time with staff for Mathematics enrichment and reinforcement during an activity period within the school day. The goal is to offer these students support and assistance to meet proficiency and growth.
HSPA Preparation English 2190: Identified students aTe placed in an English class that enriches and reinforces both the English III curriculum and HSP A preparation. The goal is to offer these students SUppOlt and assistance to meet proficiency and growth.
Snmmeread: The existing Summeread program, where secondary level students aJ'e assigned a novel to read during the summer, was revised. The list of books was carefully scrutinized and condensed by a group of teachers and students to determine titles of high interest. Additionally, the high school program was deemed "mandatory"; all students must read at least one book (some courses required two) each summer and a complete a written, follow-up assignment.
Intermediate School Reading and writing across the curriculum: Science and Social Studies courses were infused with reading in content areas, open ended questions, mandatOly essay and quote based writing instruction. Teachers were provided with professional development opportunities in the integration of Language Alis and in using rubric scoring.
Quarterly assessments: Academic subject final exams were replaced by quatterly assessments. This practice allowed for more formative assessment during the school yeat· as instructional time gained from decreased test prepat·ation. Quarterly assessments at'e averaged into each marking period grades.
Anti-Bullying campaigus: Each school in the district established anti bullying teams. In addition, students, teachers and administrators worked collaboratively to develop new programs, strategies and promote ideas that foster positive school environments and discourage acts of hat'assment, intimidation and bullying.
Basic Skills 200 Club: Identified students are given additional time with their regular Language Arts and Math teachers during activity periods for enrichment and reinforcement. The goal is to offer these students support and assistance to meet proficiency and growth in Math and Language Arts.
Elementary School Language Arts: This year, the elementary schools continued refining the teaching of the writing program in grades 3-5 and exposed a limited number of 1" and 2nd grades to the program on a voluntruy basis. A series of summer workshops were devoted to a variety of topics within the program for which our teachers were
4
TOMS RIVER REGIONAL SCHOOLS
1144 Hooper Avenue, Toms Rivet, NJ 08753 (732) 505-5510 (732) 505-5511
requesting additional teaching approaches. The reading pilot of similar strategies was expanded to three more
elementary schools among various grade levels. These schools were Beachwood, Walnut Street School and Citta School. Similar workshops of best practices in reading were also offered this summer. In addition, this year the instructional supervisors have begnn to explore other samples of reading programs to update our current reading curriculum. Our goal is to select a new reading program for September 2013.
Math: This year the Everyday Math editions in use in our schools would have been several years old.
Although the concepts are still valid and serve us well as referenced by test scores, we decided to purchase the newest revised edition so that our curricular skills would be directly aligned to the new Core Content Standm'ds adopted by the state of New Jersey. Workshops were held this summer specific to each grade level and attendance at these workshops was close to 100 %. The attendmlce is testimony to our teachers' dedication and desire to keep their skills current and offer the best educational progrmns for our students.
Basic Skills: Identified students are given additional time with staff within a beforefafterschool model for enrichment and reinforcement. The goal is to offer these students support and assistance to meet proficiency mld growth in Math and Language Arts.
4. INTERNAL ACCOUNTING CONTROLS: Management is responsible for establishing and maintaining an internal control shucture designed to ensure that the assets of the Dish'ict are protected from loss, theft or misuse and to ensure that adequate accounting data are compiled to allow for the preparation of financial statements in conformity with generally accepted accounting principles (GAAP). The internal control sh'ucture is designed to provide reasonable, but not absolute, assurance that these objectives are met. The concept of reasonable assurance recognizes that: (1) the cost of a control should not exceed the benefits likely to be derived; and (2) the valuation of costs and benefits requires estimates and judgments by management.
As a recipient of federal and state finmlcial assistance, the District is also responsible for ensuring that an adequate internal control sh'ucture is in place to ensure compliance with applicable laws and regulations related to those programs. The District is also charged with the responsibility of periodic evaluation of this internal conh'ol sh·ucture.
As part of the Dish'ict's single audit described earlier, tests are made to detennine the adequacy of the internal control structure, including that portion related to federal and state financial assistmlce programs, as well as to determine that the District has complied with applicable laws and regulations.
5
TOMS RIVER REGIONAL SCHOOLS
1144 Hooper Avenue, Toms River, NJ 08753 (732) 505-5510 (732) 505-5511
5) BUDGETARY CONTROLS: In addition to internal accounting controls, the District maintains budgetary controls. The obj ective of these budgetary controls is to ensure compliance with legal provisions embodied in the annual appropriated budget approved by the voters of the District. Annual appropriated budgets are adopted for the general fund, the special revenue fund, and the debt service fund. Project-length budgets that are approved for capital improvements are accounted for in the capital projects fund. The final budget amount as amended for the fiscal year is reflected in the fmancial section.
An encumbrance accounting system is used to record outstanding purchase commitments on a line item basis. Open encumbrances at year-end are either canceled or are included as reappropriated of fund balance in the subsequent year. Those amounts to be reappropriated are reported as reservations of fund balance at June 30, 2012.
6) ACCOUNTING SYSTEM AND REPORTS: The District's accounting records reflect generally accepted accounting principles, as promulgated by the Governmental Accounting Standards Board (GASB). The accounting system of the District is organized on the basis of funds and account groups. These funds and account groups are explained in "Notes to the Financial Statement", Note I.
7) FINANCIAL INFORMATION AT FISCAL YEAR-END: As demonsh'ated by the various statements and schedules included in the fmancial section of this report, the District continues to meet its responsibility to ensure sound financial management.
8) DEBT ADMINISTRATION: As of June 30, 2012, long-term liabilities consist of:
Bonds Payable Capital Leases Payable Notes Payable Compensated Absences
Total
$67,394,000 455,380
3,197,210 14,572,145
$85.618,735
9) CASH MANAGEMENT: The inveshnent policy of the District is guided in large part by state statute as detailed in "Notes to the Financial Statements", Note 2, The District has adopted a cash management plan, which requires it to deposit public funds in public depositories protected from loss under the provisions of the Governmental Unit Deposit Protection Act ("GUDPA"), GUDPA was enacted in 1970 to protect Governmental Units from a loss of funds on deposit with a failed banking institution in New Jersey, The law
6
TOMS RIVER REGIONAL SCHOOLS
1144 Hooper Avenue, 'Toms River, NJ 08753 (732) 505·5510 (732) 505·5511
requires governmental units to deposit pub lic funds only in public depositories located in New Jersey, where the funds are secured in accordance with the Act.
10) RISK MANAGEMENT: The Board carries various forms of insurance, including but not limited to general liability, automobile liability and comprehensive/collision, hazard and theft insurance on property and contents, and fidelity bonds.
11) OTHER INFORMATION:
Independent Audit - State statutes require an annual audit by independent certified pnblic accountants or registered municipal accountants. In addition to meeting the requirements of the Single Audit Act of 1984 and the related OIVIB Circular A·133 and state Treasury Circnlar Letter 04·04 OMB, the auditor's report includes financial statements and combines individual fwd statements and schedules to ensure clear financial reporting. The auditors reports related specifically to the single audit are included in the single audit sectiou of this report.
12) ACKNOWLEDGMENTS:
We would like to express our appreciation to the members of the Toms River School Board for their concern in providing fiscal accountability to the citizens and taxpayers of the School District and thereby contributing their full Support to the development and maintenance of our financial operation. The preparation of this report could not have been accomplished without the efficient and dedicated services of OUr financial and accounting staff.
UJJ.r. ry ~. \d OJ)( bon. Wendy L. Saxton Board Secretmy
.•
7

00
JamesH Assistant Su.
• Grades 9-12 • Athletics • Central Regis • Security/SRO • Special Educa
luenstein Derintendent
ration ,/Safety Officers lion
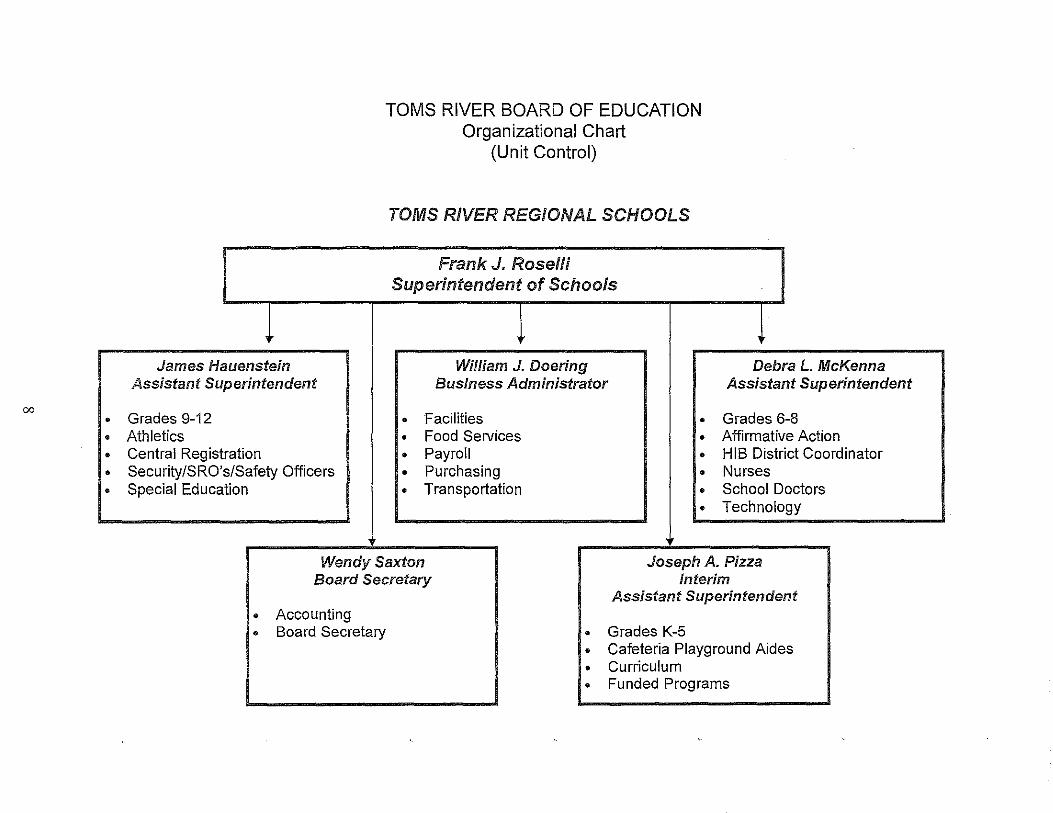
TOMS RIVER BOARD OF EDUCATION Organizational Chart
(Unit Control)
TOMS RIVER REGIONAL SCHOOLS
Frank J. Roselli Superintendent of Schools
William J. Doering Business Administrator
• Facilities • • Food Services • • Payroll • • Purchasing • • Transportation •
•
Debra L McKenna Assistant Superintendent
Grades 6-8 Affirmative Action HIB District Coordinator Nurses School Doctors Technology
Wendy Saxton Joseph A. Pizza Board Secretary Interim
Assistant Superintendent • Accounting • Board Secretary • Grades K-5
• Cafeteria Playground Aides • Curriculum • Funded Programs
-_ .. _---

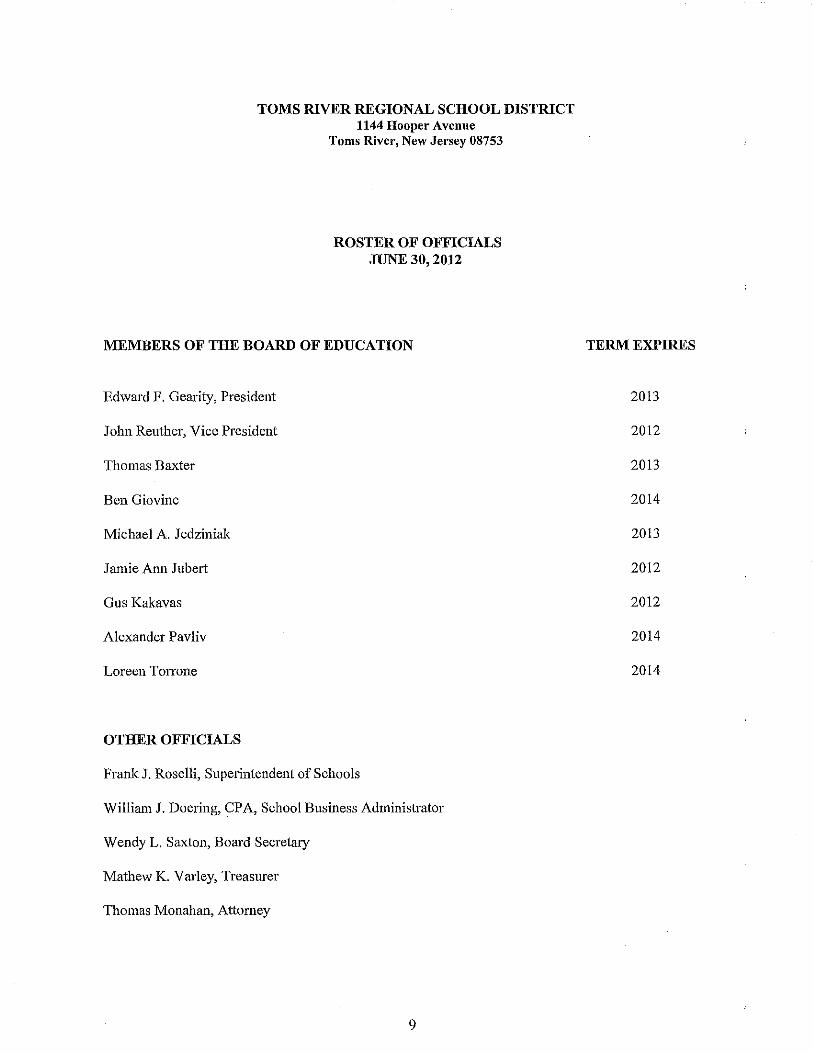
TOMS RIVER REGIONAL SCHOOL DISTRICT 1144 Hooper Avenue
Toms River, New Jersey 08753
ROSTER OF OFFICIALS JUNE 30, 2012
MEMBERS OF THE BOARD OF EDUCATION
Edward F. Gearity, President
John Renther, Vice President
Thomas Baxter
Ben Giovine
Michael A. Jedziniak
Jamie Ann Jubert
Gus Kakavas
Alexander Pavliv
Loreen Torrone
OTHER OFFICIALS
Frank J. Roselli, Superintendent of Schools
William J. Doering, CPA, School Business Administrator
Wendy L. Saxton, Board Secretary
Mathew K. V m'ley, Treasurer
Thomas Monahan, Attorney
9
TERM EXPIRES
2013
2012
2013
2014
2013
2012
2012
2014
2014
TOMS RIVER REGIONAL SCHOOL DISTRICT 1144 Hooper Avenue
Toms River, New Jersey 08753
CONSULTANTS AND ADVISORS
INDEPENDENT AUDITORS
Holman & Frenia, P. C. Frank B. Holman, III, CPA, PSA
10 Allen Street, Suite 2B Toms River, New Jersey 08753
ATTORNEY
Gilmore & Monahan, P. A. Thomas Monahau, Esq. 10 Allen Street, Suite 4
Toms River, New Jersey 08753
OFFICIAL DEPOSITORY
State of New Jersey Cash Mauagement Fund PO Box 182218
Columbus, Ohio 43218-2218
TDBank 1101 Hooper Avenue, CN 2050 Toms River, New Jersey 08754
Wells Fargo 40 Main Street
Toms River, New Jersey 08753
Shore Community Bank 1216 Route 37 East
Toms River, New Jersey 08753
PNC Bauk 1329 Hooper Avenue
Toms River, New Jersey 08753
Oceau First Bank 975 Hooper Avenue
Toms River, New Jersey 08753
NJ/ARM 821 Alexauder Road, Suite 11 0 Princeton, New Jersey 08540
10
FINANCIAL SECTION

.c. Certified Public Accountants & Consultants
, L
Administrative Office: 10 Allen Street, 5te. 2B, Toms River, NJ 08753' Tel: 732.797.1333
618 Stokes Road, Medford, NJ 08055' Tel: 609.953.0612 926 Main Street. Suite 103, Rome, PA 18837· Tel: 570.297.5090
795 Canton Street, Troy, PA 16947· Tel: 570.297.5090 holmanfrenia,com
INDEPENDENT AUDITOR'S REPORT
Honorable President and Members of the Board of Education
Toms River Regional School District County of Ocean Toms River, New Jersey 08753
We have audited the accompanying financial statements of the governmental activities, the business-type activities, each major fund and the aggregate remaining fund information of the Board of Education of the Toms River Regional School District, County of Ocean, State of New Jersey, as of and for the fiscal year ended June 30, 2012, which collectively comprise the District's basic financial statements as listed in the table of contents. These financial statements are the responsibility of the Board's management. Our responsibility is to express opinions on these financial statements based on our audit.
We conducted our audit in accordance with aUditing standards generally accepted in the United States of America; and the standards applicable to financial audits contained in Governmental Auditing Standards, issued by the Comptroller General of the United States; and audit requirements as prescribed by the Division of Finance, Department of Education, State of New Jersey. Those standards require that we plan and perfonn the audit to obtain reasonable assurance about whether the financial statements are free of material misstatement. An audit includes examining, on a test basis, evidence suppOiting the amounts and disclosures in the financial statements. An audit also includes assessing the accounting principles used and significant estimates made by management, as well as evaluating the overall financial statement presentation. We believe that our audit provides a reasonable basis for our opinions.
In our opinion, the financial statements referred to above present fairly, in all material respects, the respective financial position of the governmental activities, business-type activities, each major fund and the aggregate remaining fund information of the Board of Education of the Toms River Regional School District, County of Ocean, State of New Jersey, as of June 30, 2012, and the respective changes in financial position and cash flows, where applicable, for the year then ended in conformity with accounting principles generally accepted in the United States of America.
In accordance with Government Auditing Standards, we have also issued our report dated October 26, 2012, on our consideration of the Toms River Board of Education's internal control over financial repOiting and our tests of its compliance with certain provisions of laws, regulations, contracts and grant agreements and other matters. The purpose of that report is to describe the scope of our testing of internal control over financial reporting and compliance and the results of that testing, and not to provide an opinion on the internal control over financial reporting or on compliance. That report is an integral palt of our audit performed in accordance with Governmental Auditing Standards and should be considered in assessing the results of our audit.
Accounting principles generally accepted in the United States of America require that the management's discussion and analysis and budgetary comparison information on pages 13 through 18 and 55 through 69
11
be presented to supplement the basic financial statements. Such information, although not a part of the basic financial statements, is required by the Governmental Accounting Standards Board, who considers it to be an essential part of financial reporting for placing the basic financial statements in an appropriate operational, economic, or historical context. We have applied certain limited procedures to the required supplementary information in accordance with aUditing standards generally accepted in the United States of America, which consisted of inquiries of management about the methods of preparing the information and comparing the information for consistency with management's responses to our inquiries, the basic financial statements, and other knowledge we obtained during our audit of the basic financial statements. We do not express an opinion or provide any assurance on the information because the limited procedures do not provide us with sufficient evidence to express an opinion or provide any assurance.
Our audit was conducted for the purpose of forming opinions on the fmancial statements that collectively comprise the Toms River Board of Education's basic financial statements. The accompanying introductory section, and other supplementary information such as the combining and individual fund financial statements, long-term debt schedules and statistical information are presented for purposes of additional analysis and are not a required part of the financial statements. The accompanying schedule.of expenditures of federal and state fmancial assistance are presented for purposes of additional analysis as required by U.S. Office of Management and Budget Circular A-133, Audits of States, Local Governments, and Non-Profit Organizations and New Jersey OMB's Circular 04-04, Single Audit Policy for Recipients of Federal Grants, State Grants and State Aid respectively, and is also not a required part of the fmancial statements. The combining and individual fund fmancial statements, long-term debt schedules and the accompanying schedule of expenditures of federal and state financial assistance have been subjected to the auditing procedures applied in the audit of the basic financial statements and in our opinion, are fairly stated in all material "respects in relation to the basic fmancial statements taken as a whole. The introductOlY section and statistical information have not been SUbjected to the auditing procedures applied in the audit of the basic financial statements and, accordingly, we express no opinion on them.
Toms River, New Jersey October 26,2012
Respectfully Submitted,
HOLMAN & FRENIA, P. C.
Frank B. Holman, III Public School Accountant Certified Public Accountant No. 783
12
REQUIRED SUPPLEMENTARY INFORMATION - PART I
Management's Discussion and Analysis

TOMS RIVER BOARD OF EDUCATION
MANAGEMENT'S DISCUSSION AND ANALYSIS FOR THE FISCAL YEAR JUNE 30, 2012
UNAUDITED
Toms River Regional School District is a K-12 school District located in Ocean County, New Jersey. The Administration's Discussion and Analysis, a requirement of GASB 34, is intended to be the Toms River Regional School District Administration's discussion and analysis of the financial results for the fiscal year ended June 30,2012.
Generally accepted accounting principles (GAAP) according to GASB 34 reqnire the repOliing of two types of financial statements: District Wide Financial Statements and Fund Financial Statements. The intent of the MD&A is to look at the School Board's overall financial perfonnallce and to assist readers in assessing the financial position as a result of the year's operations. Celiain comparative information between the current year (2011-2012) and prior years, is required to be presented in the MD&A. Prioryear comparative data was presented in order to provide a more meaningful comparative analysis of the government wide data.
District Wide Financial Statements:
These statements al'e full accrual basis statements. They repOli all of the District's assets and liabilities, both shmi alld long-term, regardless of whether they al'e "clli'rently available" or not. For example, assets that are restricted for use in the Debt Funds solely for the payment of long term principal or interest al'e
grouped with unrestricted assets of the General Fund. Capital assets and long-term obligations of the District are repOlied in the Statement of Net Assets of the District wide finallcial statements.
Using This Comprehensive Annual Financial Report (CAFR):
This annual repOli consists of a series of financial statements and notes to those statements. These statements are orgallized so that the reader can understalld the Toms River Board of Education as an entire operating entity. The statements then proceed to provide an increasingly detailed look at specific financial activities.
The chali on the following page will provide an outline of the sections and information contained herein:
13
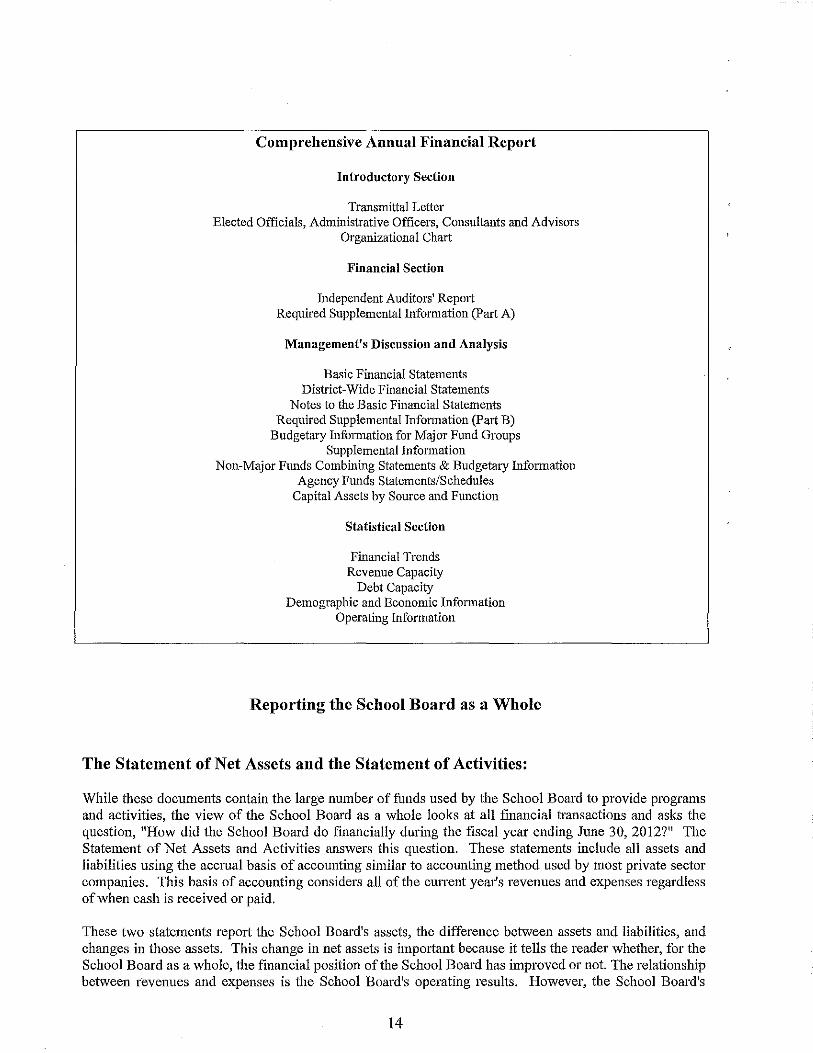
Comprehensive Annual Financial Report
Introductory Section
Transmittal Letter Elected Officials, Administrative Officers, Consultants and Advisors
Organizational Chart
Financial Section
Independent Auditors' Report Required Supplemental InfOlmation (Part A)
Management's Discussion and Analysis
Basic Financial Statements District-Wide Financial Statements
Notes to the Basic Financial Statements Required Supplemental Information (Part B)
Budgetary Information for Major Fund Groups Supplemental Information
Non-Major Funds Combining Statements & Budgetary Information Agency Funds Statements/Schedules
Capital Assets by Source and Function
Statistical Section
Financial Trends Revenue Capacity
Debt Capacity Demographic and Economic Information
Operating Information
Reporting the School Board as a Whole
The Statement of Net Assets and the Statement of Activities:
While these documents contain the large number of funds used by the School Board to provide programs and activities, the view of the School Board as a whole looks at all financial transactions and asks the question, "How did the School Board do financially during the fiscal year ending June 30, 20l2?" The Statement of Net Assets and Activities answers this question. These statements include all assets and liabilities using the accrual basis of accounting similar to accounting method used by most private sector companies. This basis of accounting considers all of the CUlTent year's revenues and expenses regardless of when cash is received or paid.
These two statements report the School Board's assets, the difference between assets and liabilities, and changes in those assets. This change in net assets is important because it tells the reader whether, for the School Board as a whole, the financial position of the School Board has improved or not. The relationship between revenues and expenses is the School Board's operating results. However, the School Board's
14
goal is to provide services to its students, not to generate profits as commercial entities do. One must consider many other non financial factors, such as the quality of the education provided and the safety of the schools to assess the overall health of the School Board.
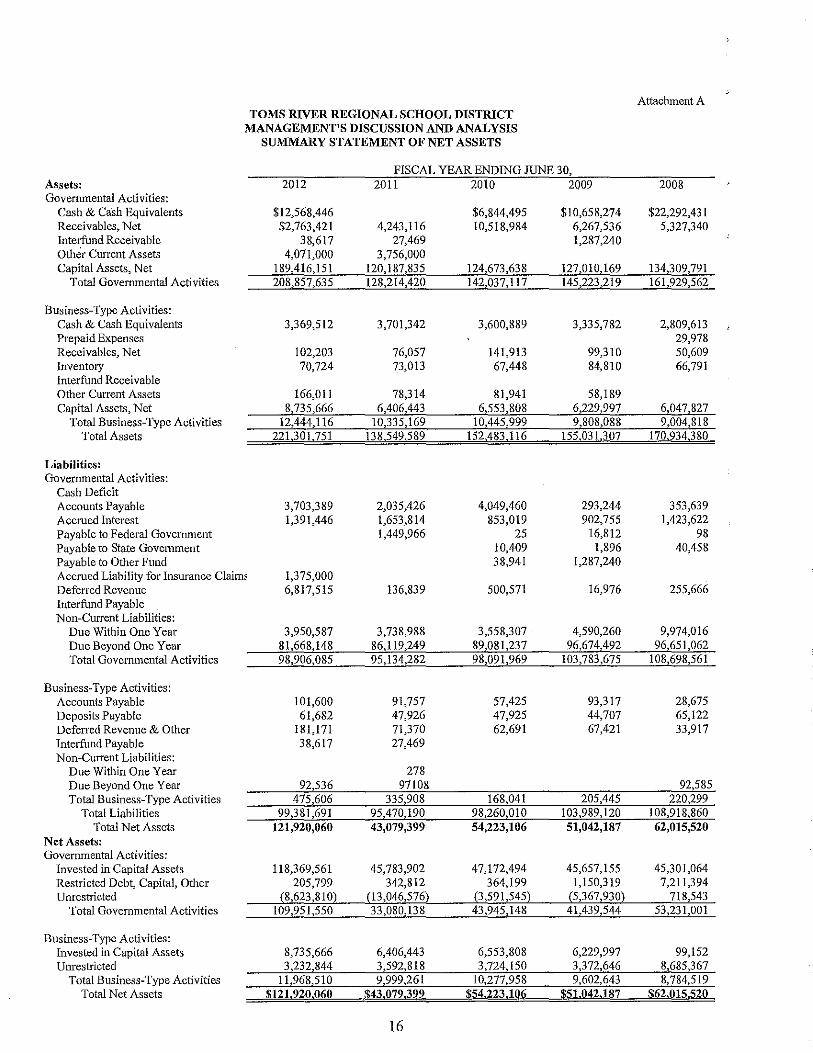
The Summary Statement of Net Assets (Attachment A) and summmy Statement of Activities (Attachment B) contain all of the School Board's services under Governmental activities including instruction, plant services, transportation, and business office operations. The statement also includes all business type activities inclnding food service, corporate center, and day care.
Financial Highlights:
This section should be read in conjnnction with Attachment A and Attachment B. Key financial highlights for the fiscal yem' ended June 30,2012, compm'ed to June 30,2011, m'e as follows:
From the summary Statement of Net Assets (Attachment A), the total net assets of the District went up from $43.1 million at Jnne 30, 2011 to $122 million at June 30, 20112 or an increase of $79 million. This is due primarily to the restatement of fixed assets to the values per the fixed asset appraisal which resulted in a prior period adjustment of $78.2 million. This adjustment was necessmy to adjust fixed asset values to reflect the contents of the annual fixed asset appraisal repmi (as opposed to relying on the accounting system tracking of fixed assets). This is a one-time adjustment and now additions and deletions of fixed assets will be mmually reconciled between the accounting system and the fixed asset appraisal report. In terms of increases in governmental assets, cash is up significantly due to an increase in fund balance and the Township of Toms River prepaying a portion of the July 2012 tax payment for $6.5 million which allowed the District to meet cash flow needs without having to borrow funds due to the State again delaying the final two State Aid payments. It should be noted that the District maintains reserve dollars (capital, maintenance, and emergency reserves) which has helped ensure adequate cash flow. Receivables are lower at June 30, 2012 due to us having a lm'ge SREC receivable mld larger grant receivables the prior year. The increase in capital assets was also attributable to the prior period adjustment. On the liability side for governmental activities, accounts payable is up significantly because the District has accrued the A-4 surcharge for multiple years for health insurance, whereby districts that do not participate in the State Health Benefits Plan must pay a fee (usually 2.5% of claims) to not participate in the plan. Also in 2011-12, the District shows deferred revenue primarily hecause the Township of Toms River prepaid the tax levy by $6.5 to help with the District's cash flow. Also in 2011-12, the District began to fund the IBNR (incurred but not reported) reserve for health insurmlce for $1.375 million. Through time, it would be fiscally prudent for the District to fund as much of the IBNR liability as possible.
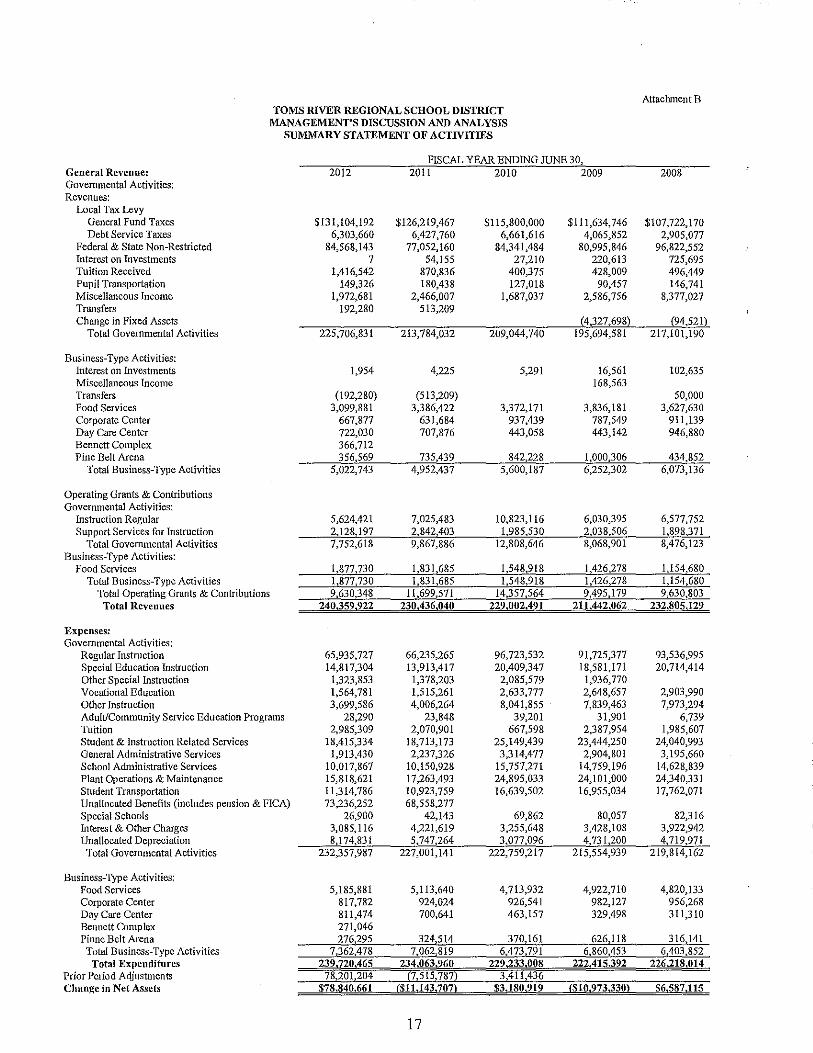
From the summm'y Statement of Activities (Attachment B), total expenditures for all our programs were $239.7 million for the school year 2011-2012. This is higher than the prior yem' of $234.1 million due to several factors, including the increase in depreciation expense, increases in pension and on-behalf TP AF pension cost, an increase in special education costs, health insurance costs, tuition costs and the summation of many smaller increases offset by a decrease in general and school level administrative costs, operations and maintenance costs and interest and other costs. It should be noted that with the 2011-12 governmental activities, benefits will be shown as unallocated, which correlates to how they are budgeted and recorded on CAFR schedule A-2. In terms of revenues, taxes, state aid, grants and other revenue sources resulted in a total revenue amount of $233.5 million, which is also higher than the prior year total revenue of $230.4 million. This is higher due to the increase in school taxes and tuition fees, as well as a significant increase in State Aid. The lower grant revenue is due the NCLB allocation reductions and the utilization of ARRA funds in the prior year. The difference between the expenditures and the revenues for 2011-12, coupled with the auditor's prior period adjustment of $78.2 million, resulted in the increase in net assets of $79 million compm'ed to the prior year.
15
Attachment A TOMS RIVER REGIONAL SCHOOL DISTRICT
MANAGEMENT'S DISCUSSION AND ANALYSIS SUMMARY STATEMENT OF NET ASSETS
FISCAL YEAR ENDING JUNE 30, Assets: 2012 2011 2010 2009 2008 Goverrunental Activities:
Cash & Cash Equivalents $12,568,446 $6,844,495 $10,658,274 $22,292,431 Receivables. Net $2,763,421 4,243,116 10,518,984 6,267,536 5,327,340 Interfund Receivable 38,617 27,469 1,287,240 Other Current Assets 4,071,000 3,756,000 Capital Assets, Net 189,416,151 120,187,835 124,673,638 127,010,169 134,309,791
Total Govemmental Activities 208,857,635 128,214,420 142,037,117 145,223,219 161,929,562
Business-Type Activities: Cash & Cash Equivalents 3,369,512 3,701,342 3,600,889 3,335,782 2,809,613 Prepaid Expenses 29,978 Receivables, Net 102,203 76,057 141,913 99,310 50,609 Inventory 70,724 73,013 67,448 84,810 66,791 Interfund Receivable Other Current Assets 166,011 78,314 81,941 58,189 Capital Assets, Net 8,735,666 6,406,443 6,553,808 6,229,997 6,047,827
Total Business-Type Activities 12,444,116 10,335,169 10,445,999 9,808,088 9,004,818 Total Assets 221,301.751 138,549,589 152,483,116 155,031,307 170,934,380
Liabilities: Governmental Activities:
Cash Deficit Accounts Payable 3,703,389 2,035,426 4,049,460 293,244 353,639 Accrued Interest 1,391,446 1,653,814 853,019 902,755 1,423,622 Payable to Federal Government 1,449,966 25 16,812 98 Payable to State Govemment 10,409 1,896 40,458 Payable to Other Fund 38,941 1,287,240 Accrued Liability for Insurance Claim~ 1,375,000 Deferred Revenue 6,817,515 136,839 500,571 16,976 255,666 Interfund Payable Non-Current Liabilities:
Due Within One Year 3,950,587 3,738,988 3,558,307 4,590,260 9,974,016 Due Beyond One Year 81,668,148 86,119,249 89,081,237 96,674,492 96,651,062 Total Govemmental Activities 98,906,085 95,134,282 98,091,969 103,783,675 108,698,561
Business-Type Activities: Accounts Payable 101,600 91,757 57,425 93,317 28,675 Deposits Payable 61,682 47,926 47,925 44,707 65,122 Deferred Revenue & Other 181,171 71,370 62,691 67,421 33,917 Interfund Payable 38,617 27,469 Non-Current Liabilities:
Due Within One Year 278 Due Beyond One Year 92,536 97108 92,585 Total Business-Type Activities 475,606 335,908 168,041 205,445 220,299
Total Liabilities 99,381,691 95,470,190 98,260,010 103,989,120 108,918,860 Total Net Assets 121,920,060 43,079,399 54,223,106 51,042,187 62,015,520
Net Assets: Governmental Activities:
Invested in Capital Assets 118,369,561 45,783,902 47,172,494 45,657,155 45,301,064 Restricted Debt, Capital, Other 205,799 342,812 364,199 1,150,319 7,211,394 Unrestricted (8,623,810) (13,046,576) (3,591,545) (5,367,930) 718,543
Total Governmental Activities 109,951,550 33,080,138 43,945,148 41,439,544 53,231,001
Business-Type Activities: Invested in Capital Assets 8,735,666 6,406,443 6,553,808 6,229,997 99,152 Unrestricted 3,232,844 3,592,818 3,724,150 3,372,646 8,685,367
Total Business-Type Activities 11,968,510 9,999,261 10,277,958 9,602,643 8,784,519 Total Net Assets $121.920,060 $43,079,399 $54,223,106 $51,042,187 $62,015,520
16
Attachment B TOMS RIVER REGIONAL SCHOOL DISTRICT
MANAGEMENT'S DISCUSSION AND ANALYSIS SUMMARY STATEMENT OF ACTIVITIES
FISCAL YEAR ENDING JUNE 30, General Revenue: 2012 2011 2010 2009 2008 Governmental Activities: Revenues:
Local Tax Levy General Fund Taxes $131,104,192 $126,219,467 $115,800,000 $111,634,746 $107,722,170 Debt Service Taxes 6,303,660 6,427,760 6,661,616 4,065,852 2,905,077
Federal & State Non-Restricted 84,568,143 77,052,160 84,341,484 80,995,846 96,822,552 Interest on Investments 7 54,155 27,210 220,613 725,695 Tuition Received 1,416,542 870,836 400,375 428,009 496,449 Pupil Transportation 149,326 180,438 127,018 90,457 146,741 Miscellaneous Income 1,972,681 2,466,007 1,687,037 2,586,756 8,377,027 Transfers 192,280 513,209 Change in Fixed Assets (4,327,698) (94,521)
Total Governmental Activities 225,706,831 213,784,032 209,044,740 195,694,581 217,101,190
Business-Type Activities: Interest on Investments 1,954 4,225 5,291 16,561 102,635 Miscellaneous Income 168,563 Transfers (192,280) (513,209) 50,000 Food Services 3,099,881 3,386,422 3,372,171 3,836,181 3,627,630 Corporate Center 667,877 631,684 937,439 787,549 911,139 Day Care Center 722,030 707,876 443,058 443,142 946,880 Bennett Complex 366,712 Pine Belt Arena 356,569 735,439 842,228 1,000,306 434,852
Total Business-Type Activities 5,022,743 4,952,437 5,600,187 6,252,302 6,073,136
Operating Grants & Contributions Governmental Activities:
Instruction Regular 5,624,421 7,025,483 10,823,116 6,030,395 6,577,752 Support Services for Instruction 2,128,197 2,842,403 1,985,530 2,038,506 1,898,371
Total Governmental Activities 7,752,618 9,867,886 12,808,646 8,068,901 8,476,123 Business-Type Activities:
Food Services 1,877,730 1,831,685 1,548,918 1,426,278 1,154,680 Total Business-Type Activities 1,877,730 1,831,685 1,548,918 1,426,278 1,154,680
Total Operating Grants & Contributions 9,630,348 11,699,571 14,357,564 9,495,179 9,630,803 Total Revenues 240,359,922 230,436,040 229,002,491 211,442,062 232,80;;,129
Expenses: Governmental Activities:
Regular Instruction 65,935,727 66,235,265 96,723,532 91,725,377 93,536,995 Special Education Instruction 14,817,304 13,913,417 20,409,347 18,581,171 20,714,414 Other Special Instruction 1,323,853 1,378,203 2,085,579 1,936,770 Vocational Education 1,564,781 1,515,261 2,633,777 2,648,657 2,903,990 Other Instruction 3,699,586 4,006,264 8,041,855 7,839,463 7,973,294 Adult/Community Service Education Programs 28,290 23,848 39,201 31,901 6,739 Tuition 2,985,309 2,070,901 667,598 2,387,954 1,985,607 Student & Instruction Related Services 18,415,334 18,713,173 25,149,439 23,444,250 24,040,993 General Administrative Services 1,913,430 2,237,326 3,314,477 2,904,801 3,195,660 School Administrative Services 10,017,867 10,150,928 15,757,271 14,759,196 14,628,839 Plant Operations & Maintenance 15,818,621 17,263,493 24,895,033 24,101,000 24,340,331 Student Transportation 11,314,786 10,923,759 16,639,502 16,955,034 17,762,071 Unallocated Benefits (includes pension & FICA) 73,236,252 68,558,277 Special Schools 26,900 42,143 69,862 80,057 82,316 Interest & Other Charges 3,085,116 4,221,619 3,255,648 3,428,108 3,922,942 Unallocated Depreciation 8,174,831 5,747,264 3,077,096 4,731,200 4,719,971
Total Governmental Activities 232,357,987 227,001,141 222,759,217 215,554,939 219,814,162
Business-Type Activities: Food Services 5,185,881 5,113,640 4,713,932 4,922,710 4,820,133 Corporate Center 817,782 924,024 926,541 982,127 956,268 Day Care Center 811,474 700,641 463,157 329,498 311,310 Bennett Camp lex 271,046 Pinne Belt Arena 276,295 324,514 370,161 626,118 316,141
Total Business-Type Activities 7,362,478 7,062,819 6,473,791 6,860,453 6,403,852 Total Expenditures 239,120,465 234,063,960 229,233,008 222,415,392 226,218,014
Prior Period Acljustments 78,201,204 (7,515,787) 3,411,436 Change in Net Assets $78,840,661 ($11,143,707) $3,180,919 ($10,973,330) $6,587,115
17
The District of Toms River remains committed to sound financial management practices in response to the challenges posed by a stagnant economy and the state budget crisis. Overall revenues are expected to remain relatively flat while costs are expected to continue to increase for salaries, healthcare, and rontine expenses. However, the District will continne to try to find new ways to fund, or will reallocate existing funding, to support programs that target student achievement. Our goal will continue to be to provide a qnality edncation for all of our students while maintaining a balanced and efficient budget.
18
BASIC FINANCIAL STATEMENTS

A. District-Wide Financial Statements

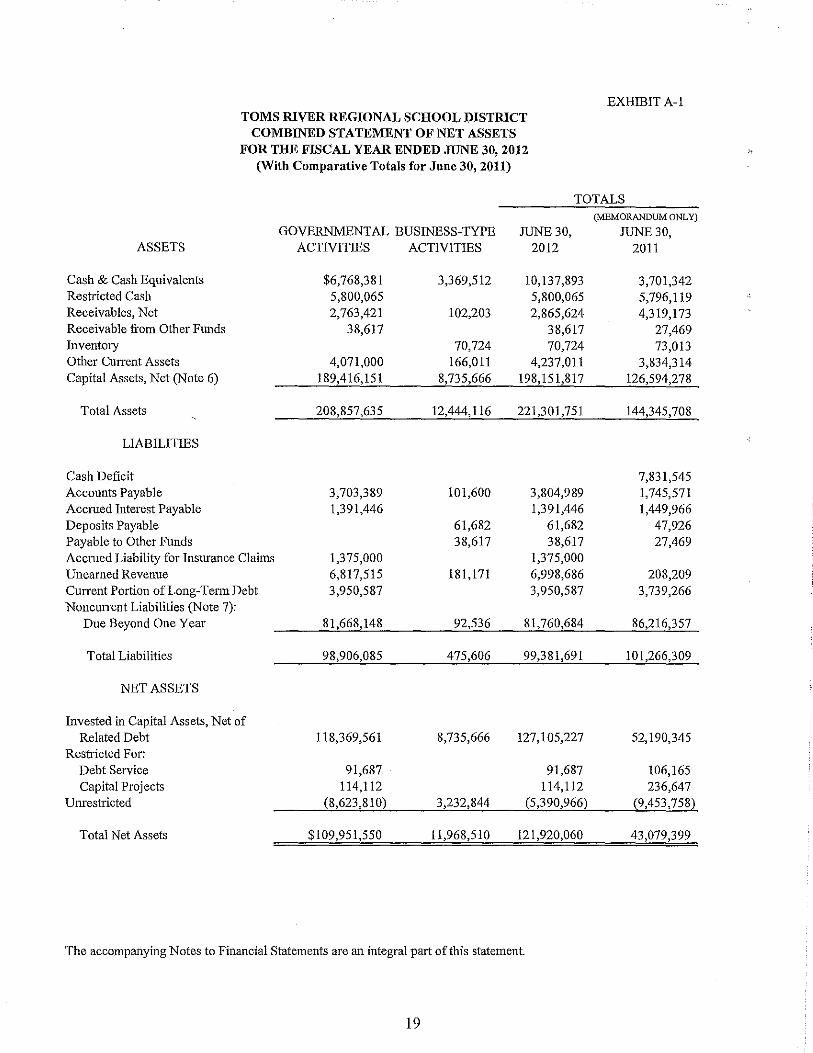
TOMS RIVER REGIONAL SCHOOL PlSTRICT COMBINED STATEMENT OF NET ASSETS
FOR THE FISCAL YEAR ENDED JUNE 30, 2012 (With Comparative Totals for June 30,2011)
EXHIBIT A-I
TOTALS (MEMORANDUM ONLY)
GOVERNMENTAL BUSINESS-TYPE JUNE 30, JUNE 30, ASSETS ACTIVITIES ACTIVITIES 2012 2011
Cash & Cash Equivalents $6,768,381 3,369,512 10,137,893 3,701,342 Restricted Cash 5,800,065 5,800,065 5,796,119 Receivables, Net 2,763,421 102,203 2,865,624 4,319,173 Receivable from Other Funds 38,617 38,617 27,469 Inventory 70,724 70,724 73,013 Other Cnrrent Assets 4,071,000 166,011 4,237,011 3,834,314 Capital Assets, Net (Note 6) 189,416,151 8,735,666 198,151,817 126,594,278
Total Assets 208,857,635 12,444,116 221,301,751 144,345,708
LIABILITIES
Cash Deficit 7,831,545 Accounts Payable 3,703,389 101,600 3,804,989 1,745,571 Accrued Interest Payable 1,391,446 1,391,446 1,449,966 Deposits Payable 61,682 61,682 47,926 Payable to Other Funds 38,617 38,617 27,469 Accrued Liability for Insurance Claims 1,375,000 1,375,000 Unearned Revenue 6,817,515 181,171 6,998,686 208,209 Current Portion of Long-Tenn Debt 3,950,587 3,950,587 3,739,266 Noncurrent Liabilities (Note 7):
Due Beyond One Year 81,668,148 92,536 81,760,684 86,216,357
Total Liabilities 98,906,085 475,606 99,381,691 101,266,309
NET ASSETS
Invested in Capital Assets, Net of Related Debt 118,369,561 8,735,666 127,105,227 52,190,345
Restricted For: Debt Service 91,687 91,687 106,165 Capital Projects 114,112 114,112 236,647
Unrestricted (8,623,810) 3,232,844 (5,390,966) (9,453,758)
Total Net Assets $109,951,550 11,968,510 121,920,060 43,079,399
The accompanying Notes to Financial Statements are an integral part of this statement.
19
N o
FUNCTIONSIPROGRAMS
Governmental Activities: Instruction:
Regular Special Education Other Special Instruction Vocational Education Other Instruction Adult/Continuing Education Prograrus
Support Services & Undistributed Costs: Tuition Student & Instruction Related Services General Administrative Services School Administrative Services Plant Operations & Maintenance Student Transportation Unallocated Benefits
Special Schools Interest on Long-Term Debt & Other Bond Costs Unallocated Depreciation
Total Governmental Activities
Business-Type Activities: Food Service Corporate Center Day Care Center Bennett Complex Pine Belt Arena
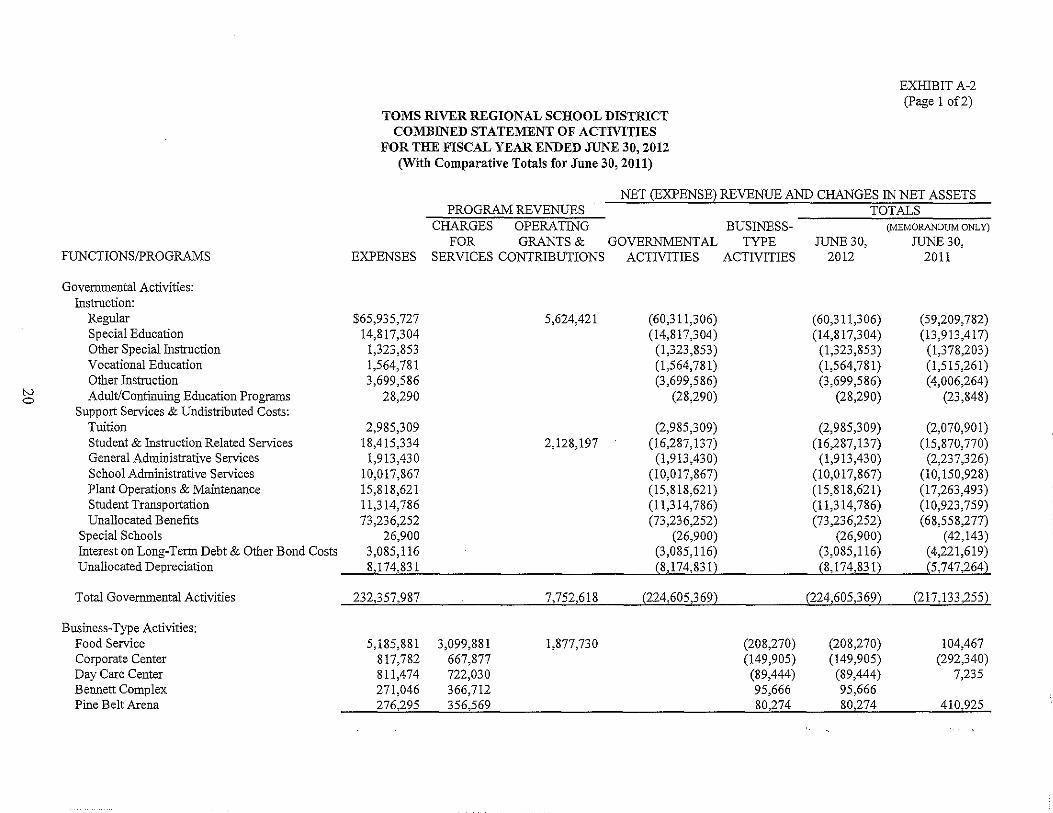
EXHIBIT A-2 (Page 1 of2)
TOMS RIVER REGIONAL SCHOOL DISTRICT COMBINED STATEMENT OF ACTIVITIES
FOR THE FISCAL YEAR ENDED JUNE 30, 2012 (With Comparative Totals for June 30, 2011)
NET (EXPENSE) REVENUE AND CHANGES IN NET ASSETS PROGRAM REVENUES TOTALS
CHARGES OPERATING BUSINESS- (MEMORANDUM ONLy)
FOR GRANTS & GOVERNMENTAL TYPE JUNE 30, JUNE 30, EXPENSES SERVICES CONTRIBUTIONS ACTIVITIES ACTIVITIES 2012 2011
$65,935,727 14,817,304 1,323,853 1,564,781 3,699,586
28,290
2,985,309 18,415,334 1,913,430
10,017,867 15,818,621 11,314,786 73,236,252
26,900 3,085,116 8,174,831
232,357,987
5,185,881 817,782 811,474 271,046 276,295
3,099,881 667,877 722,030 366,712 356,569
5,624,421
2,128,197
7,752,618
1,877,730
(60,311,306) (14,817,304) (1,323,853) (1,564,781) (3,699,586)
(28,290)
(60,311,306) (14,817,304) (1,323,853) (1,564,781) (3,699,586)
(28,290)
(59,209,782) (13,913,417)
(1,378,203) (1,515,261) (4,006,264)
(23,848)
(2,985,309) (2,985,309) (2,070,901) (16,287,137) (16,287,137) (15,870,770) (1,913,430) (1,913,430) (2,237,326)
(10,017,867) (10,017,867) (10,150,928) (15,818,621) (15,818,621) (17,263,493) (11,314,786) (11,314,786) (10,923,759) (73,236,252) (73,236,252) (68,558,277)
(26,900) (26,900) (42,143) (3,085,116) (3,085,116) (4,221,619) (8,J14,831)_ _ (8,174,Jlll) __ (5,747,264)
(224,605,369)_ _(224,6Q:;2§9)--..-ill7,133,255)
(208,270) (149,905) (89,444) 95,666 80,274
(208,270) (149,905) (89,444) 95,666 80,274
104,467 (292,340)
7,235
410,925
N -
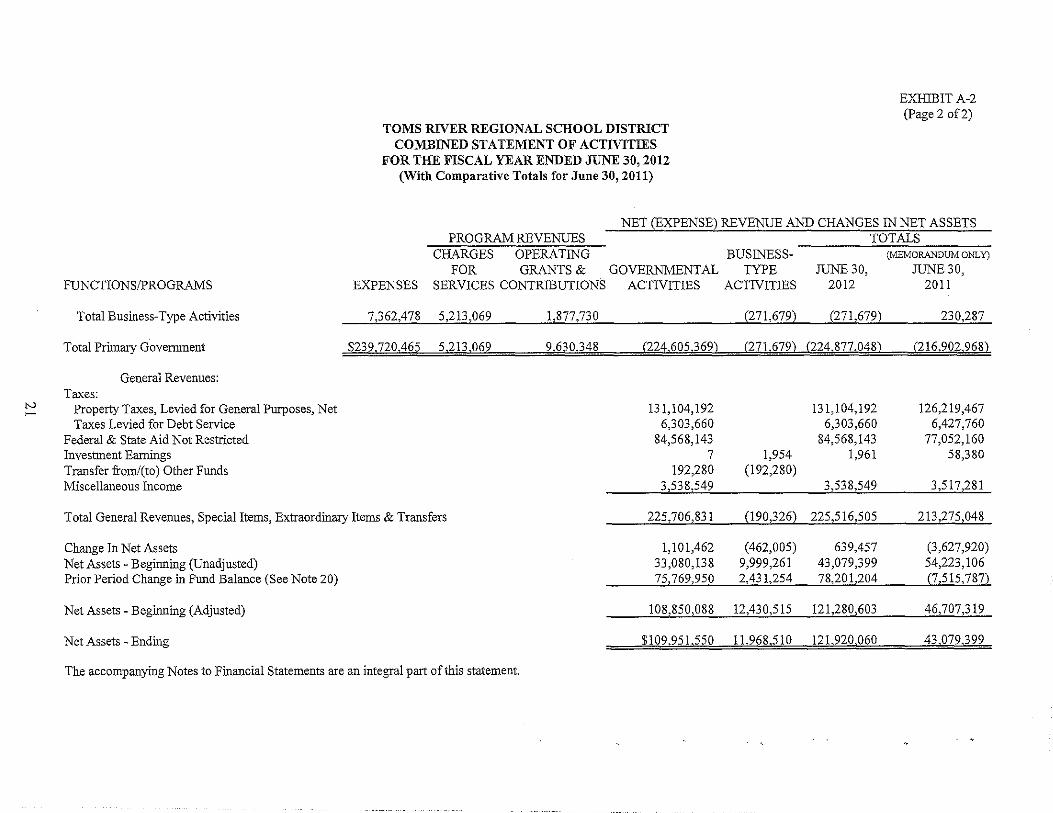
FUNCTIONSIPROGRAMS
Total B usiness-Type Activities
Total Primary Government
General Revenues: Taxes:
Property Taxes, Levied for General Purposes, Net Taxes Levied for Debt Service
Federal & State Aid Not Restricted Investment Earnings Transfer from/(to) Other Funds Miscellaneous Income
TOMS RIVER REGIONAL SCHOOL DISTRICT COMBINED STATEMENT OF ACTMTIES
FOR THE FISCAL YEAR ENDED JUNE 30, 2012 (With Comparative Totals for June 30, 2011)
EXIDBIT A-2 (Page 2 of2)
NET (EXPENSE) REVENUE AND CHANGES IN NET ASSETS PROGRAM REVENUES TOTALS
CHARGES OPERATING BUSINESS- (MEMORANDUM ONLY)
FOR GRANTS & GOVERNMENTAL TYPE JUNE 30, JUNE 30, EXPENSES SERVICES CONTRIBUTIONS ACTIVITIES ACTIVITIES 2012 2011
7,362,47_8 5,213,069 _ 1,B7,730_ _(ll1,672L(271,6T9} 230,287
$239,720,465 5,213,069 9.630,348 (224,605369) (271,679) (224.877,048) (216,902,968)
131,104,192 131,104,192 126,219,467 6,303,660 6,303,660 6,427,760
84,568,143 84,568,143 77,052,160 7 1,954 1,961 58,380
192,280 (192,280) 3,538,549 3,538,549 ____ 3,517,281
Total General Revenues, Special Items, Extraordinary Items & Transfers 225,706,831 --.il90,326) 225,516,505 213,275,048
Change In Net Assets 1,101,462 (462,005) 639,457 (3,627,920) Net Assets - Beginning (Unadjusted) 33,080,138 9,999,261 43,079,399 54,223,106 Prior Period Change in Fund Balance (See Note 20) 75,769,950 2,431,254_ 78,20L204 (7,515,787)
Net Assets - Beginning (Adjusted) 108,850,088 12,430,515 121,280.,603_ 4(j,1Q7,319
Net Assets - Ending $109,95L550 11,968,510 _ 121,920_,060_ _43,079,399
The accompanying Notes to Financial Statements are an integral part of this statement.

B. Fund Financial Statements

Governmental Funds

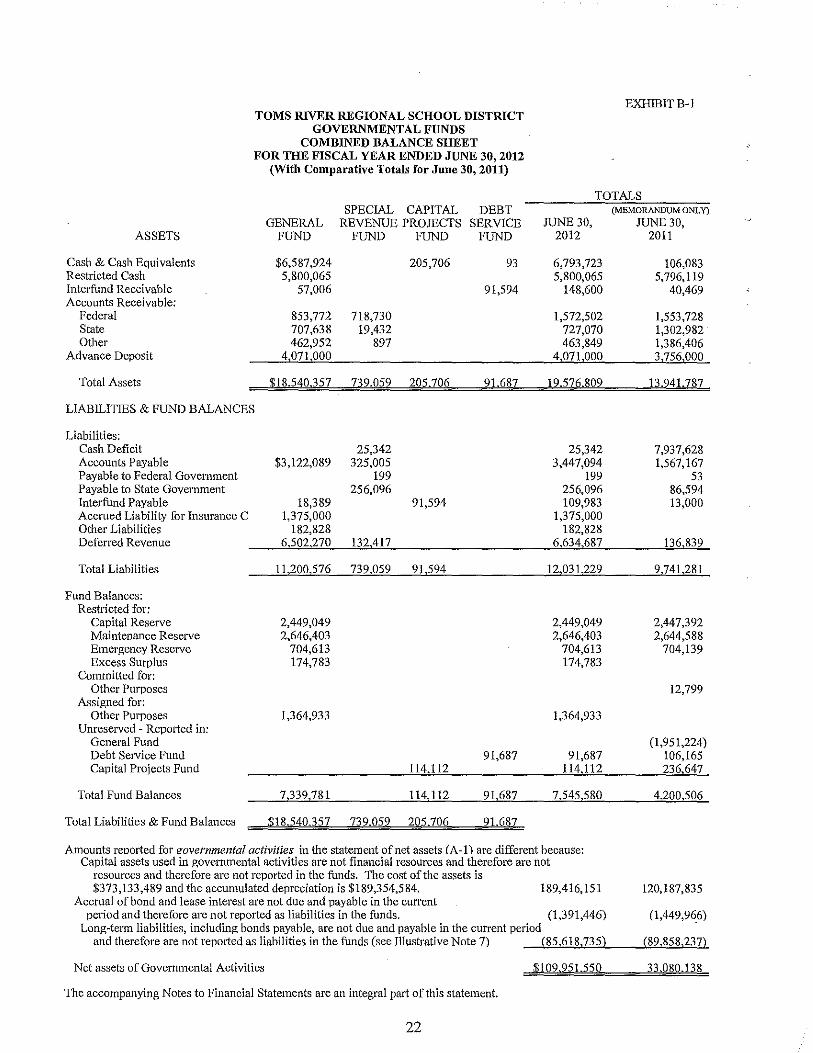
EXHIBIT B-1 TOMS RIVER REGIONAL SCHOOL DISTRICT
GOVERNMENTAL FUNDS COMBINED BALANCE SHEET
FOR THE FISCAL YEAR ENDED JUNE 30, 2012 (With Comparative Totals for June 30, 2011)
TOTALS SPECIAL CAPITAL DEBT (MEMORANDUM ONLy)
GENERAL REVENUE PROJECTS SERVICE JUNE 30, JUNE 30, ASSETS FUND FUND FUND FUND 2012 2011
Cash & Cash Equivalents $6,587,924 205,706 93 6,793,723 106,083 Restricted Cash 5,800,065 5,800,065 5,796,119 Interfund Receivable 57,006 91,594 148,600 40,469 Accounts Receivable:
Federal 853,772 718,730 1,572,502 1,553,728 State 707,638 19,432 727,070 1,302,982 Other 462,952 897 463,849 1,386,406
Advance Deposit 4,071,000 4,071,000 3,756,000
Total Assets $18.540,357 739,059 205.706 91687 19.516.809 13·241.787
LIABILITIES & FUND BALANCES
Liabilities: Cash Deficit 25,342 25,342 7,937,628 Accounts Payable $3,122,089 325,005 3,447,094 1,567,167 Payable to Federal Govel11ment 199 199 53 Payable to State Government 256,096 256,096 86,594 Interfund Payable 18,389 91,594 109,983 13,000 Accrued Liability for Insurance C 1,375,000 1,375,000 Other Liabilities 182,828 182,828 Deferred Revenue 6,502,270 132,417 6,634,687 136,839
Total Liabilities 11,200,576 739,059 91,594 12,031,229 9,741,281
Fund Balances: Restricted for:
Capital Reserve 2,449,049 2,449,049 2,447,392 Maintenance Reserve 2,646,403 2,646,403 2,644,588 Emergency Reserve 704,613 704,613 704,139 Excess Surplus 174,783 174,783
Committed for: Other Purposes 12,799
Assigned for: Other Purposes 1,364,933 1,364,933
Unreserved - Repmted in: General Fund (1,951,224) Debt Service Fund 91,687 91,687 106,165 Capital Projects Fund 114,112 114,112 236,647
Total Fund Balances 7,339,781 114,112 91,687 7,545,580 4,200,506
Total Liabilities & Fund Balances $18.540,357 739.052 205.706 91687
Amounts renorted for f!overnmental activities in the statement of net assets (A-I) are different because: Capital assets used in governmental activities are not financial resources and therefore are not
resources and therefore are not reported in the funds. The cost of the assets is $373,133,489 and the accumulated depreciation is $189,354,584. 189,416,151 120,187,835
Accrual of bond and lease interest are not due and payable in the current period and therefore are not reported as liabilities in the funds. (1,391,446) (1,449,966)
Long-tenTI liabilities, including bonds payable, are not due and payable in the current period and therefore are not reported as liabilities in the funds (see Illustrative Note 7) (85,618,735) (89,858,237)
Net assets of Governmental Activities $109,251550 33,080.138
The accompanying Notes to Financial Statements are an integral part of this statement.
22
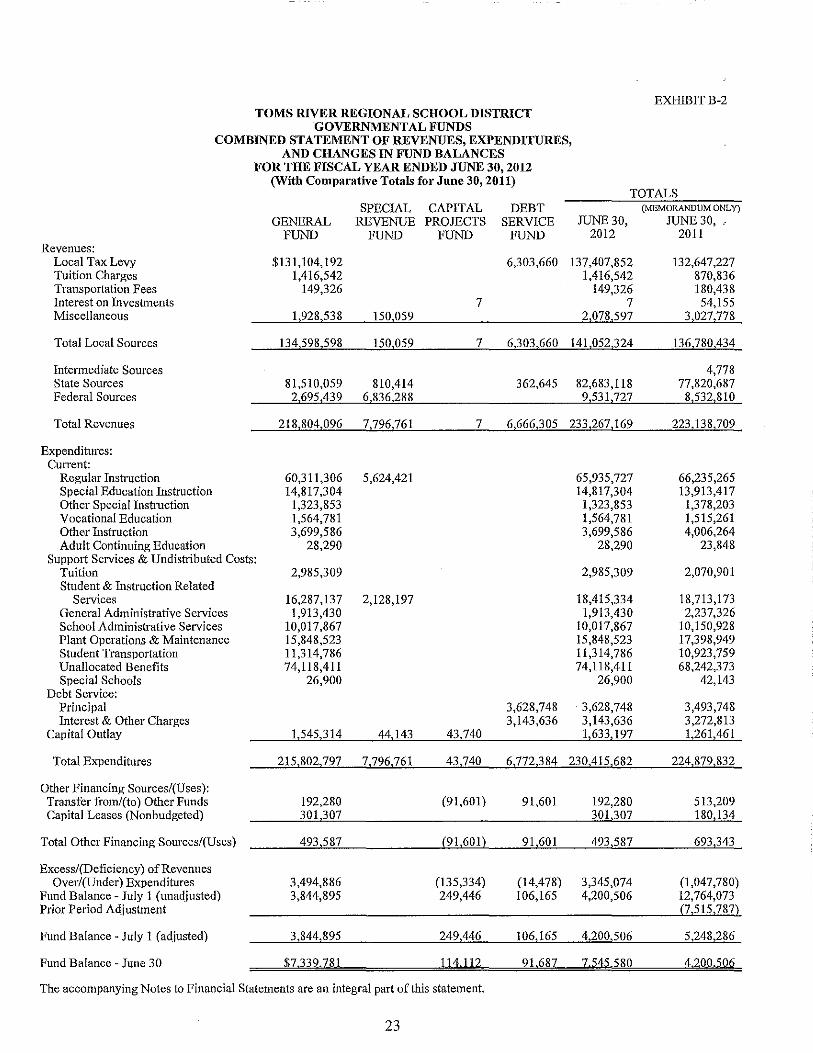
EXHIBIT B-2 TOMS RIVER REGIONAL SCHOOL DISTRICT
GOVERNMENTAL FUNDS COMBINED STATEMENT OF REVENUES, EXPENDITURES,
AND CHANGES IN FUND BALANCES FOR THE FISCAL YEAR ENDED JUNE 30, 2012
(With Comparative Totals for June 30, 2011) TOTALS
SPECIAL CAPITAL DEBT (MEMORANDUM ONLY)
GENERAL REVENUE PROJECTS SERVICE JUNE 30, JUNE 30, _-FUND FUND FUND FUND 2012 2011
Revenues: Local Tax Levy $131,104,192 6,303,660 137,407,852 132,647,227 Tuition Charges 1,416,542 1,416,542 870,836 Transportation Fees 149,326 149,326 180,438 Interest on Investments 7 7 54,155 Miscellaneous 1,928,538 150,059 2,078,597 3,027,778
Total Local Sources 134,598,598 150,059 7 6,303,660 141,052,324 136,780,434
Intermediate Sources 4,778 State Sources 81,510,059 810,414 362,645 82,683,118 77,820,687 Federal Sources 2,695,439 6,836,288 9,531,727 8,532,810
Total Revenues 218,804,096 7,796,761 7 6,666,305 233,267,169 223,138,709
Expenditures: Current:
Regular Instruction 60,311,306 5,624,421 65,935,727 66,235,265 Special Education Instruction 14,817,304 14,817,304 13,913,417 Other Special Instmction 1,323,853 1,323,853 1,378,203 Vocational Education 1,564,781 1,564,781 1,515,261 Other Instruction 3,699,586 3,699,586 4,006,264 Adult Continuing Education 28,290 28,290 23,848
Support Services & Undistributed Costs: Tuition 2,985,309 2,985,309 2,070,901 Student & Instruction Related
Services 16,287,137 2,128,197 18,415,334 18,713,173 General Administrative Services 1,913,430 1,913,430 2,237,326 School Administrative Services 10,017,867 10,017,867 10,150,928 Plant Operations & Maintenance 15,848,523 15,848,523 17,398,949 Student Transportation 11,314,786 11,314,786 10,923,759 Unallocated Benefits 74,118,411 74,118,411 68,242,373 Special Schools 26,900 26,900 42,143
Debt Service: Principal 3,628,748 3,628,748 3,493,748 Interest & Other Charges 3,143,636 3,143,636 3,272,813
Capital Outlay 1,545,314 44,143 43,740 1,633,197 1,261,461
Total Expenditures 215,802,797 7,796,761 43,740 6,772,384 230,415,682 224,879,832
Other Financing Sources/rUses): Transfer from/(to) Other Funds 192,280 (91,601) 91,601 192,280 513,209 Capital Leases (Nonbudgeted) 301,307 301,307 180,134
Total Other Financing Sources/rUses) 493,587 (91,601) 91,601 493,587 693,343
Excess/(Deficiency) of Revenues Over/(Under) Expenditures 3,494,886 (135,334) (14,478) 3,345,074 (1,047,780)
Fund Balance - July 1 (unadiusted) 3,844,895 249,446 106,165 4,200,506 12,764,073 Prior Period Adjustment (7,515,787)
Fund Balance - July 1 (adiusted) 3,844,895 249,446 106,165 4,200,506 5,248,286
Fund Balance - June 30 $7,339,781 114112 91,681 7545 580 4,200,506
The accompanying Notes to Financial Statements are an integral part of this statement.
23
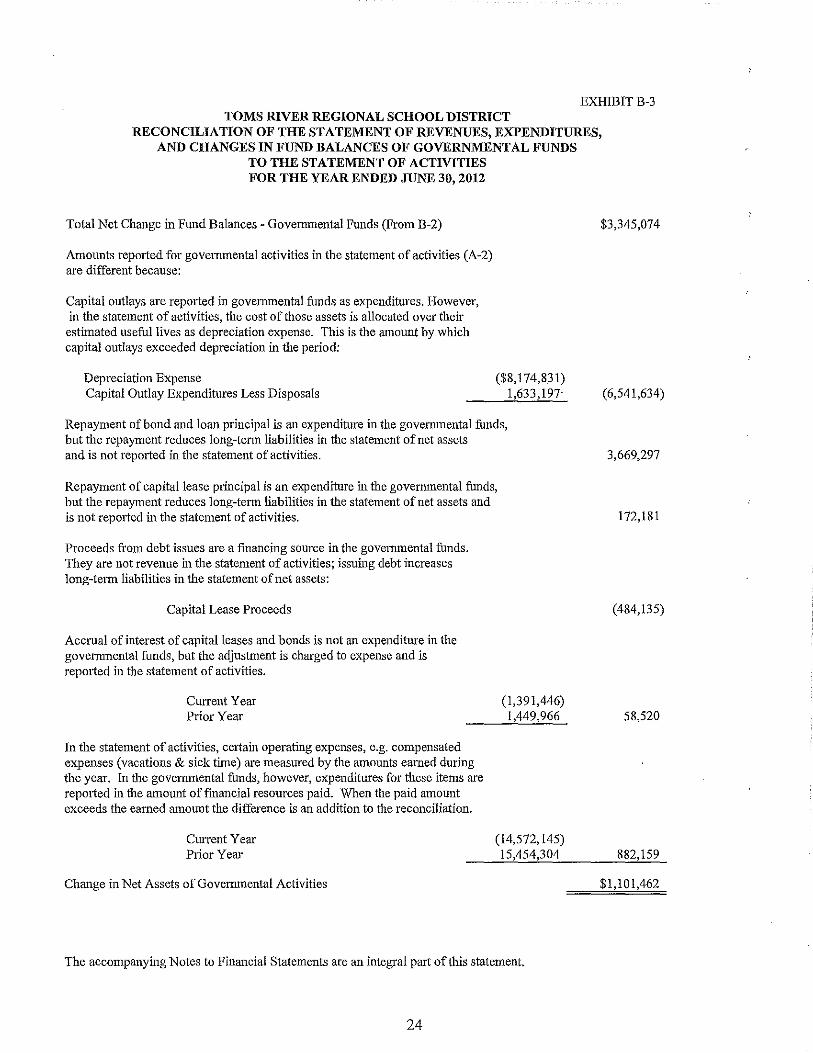
EXIDBITB-3 TOMS RIVER REGIONAL SCHOOL DISTRICT
RECONCILIATION OF THE STATEMENT OF REVENUES, EXPENDITURES, AND CHANGES IN FUND BALANCES OF GOVERNMENTAL FUNDS
TO THE STATEMENT OF ACTIVITIES FOR THE YEAR ENDED JUNE 30, 2012
Total Net Change in Fund Balances - Governmental Fnnds (From B-2)
Amounts reported for govemmental activities in the statement of activities (A-2) are different because:
Capital outlays are repOlted in governmental funds as expenditures. However, in the statement of activities, the cost of those assets is allocated over their estimated useful lives as depreciation expense. This is the amount by which capital outlays exceeded depreciation in the period:
Depreciation Expense Capital Outlay Expenditures Less Disposals
($8,174,831) 1,633,197'
Repayment ofbond and loan principal is an expenditure in the govenunental funds, but the repayment reduces long-tenn liabilities in the statement of net assets and is not reported in the statement of activities.
Repayment of capital lease principal is an expenditure in the govemmental funds, but the repayment reduces long-tenu liabilities in the statement of net assets and is not reported in the statement of activities.
Proceeds from debt issues are a fmancing source in the govemmental funds. They are not revenue in the statement of activities; issuing debt increases long-tenn liabilities in the statement of net assets:
Capital Lease Proceeds
Accrual of interest of capital leases and bonds is not an expenditure in the govemmental funds, but the adjustment is charged to expense and is reported in the statement of activities.
Cun'ent Year Prior Year
In the statement of activities, certain operating expenses, e.g. compensated expenses (vacations & sick time) are measured by the amonnts earned during the year. In the governmental funds, however, expenditures for these items are repOlted in the amount of financial resources paid. When the paid amount exceeds the earned amount the difference is an addition to the reconciliation.
(1,391,446) 1,449,966
CUlTent Year Prior Year
(14,572,145) 15,454,304
Change in Net Assets of Govemmental Activities
The accompanying Notes to Financial Statements are an integral part of this statement.
24
$3,345,074
(6,541,634)
3,669,297
172,181
(484,135)
58,520
882,159
$1,101,462

Proprietary Funds

tv V>
ASSETS Current Assets:
Cash & Cash Equivalents Accounts Receivable:
State Federal Other
Inventories Interfund Receivable Other Current Assets
Total Current Assets
Noncurrent Assets: Capital Assets, Net
Total Noncurrent Assets
Total Assets
LIABILITIES
Current Liabilities: Accounts Payable Deferred Revenue Compensated Absences Payable Tenant Security Deposits Other Current Liabilities Interfund Payable
Total Current Liabilities
NET ASSETS
Invested in Capital Assets, Net Unrestricted
Total N,l Assets
FOOD SERVICE
$1,154,562
1,782 62,443 37,978 70,724
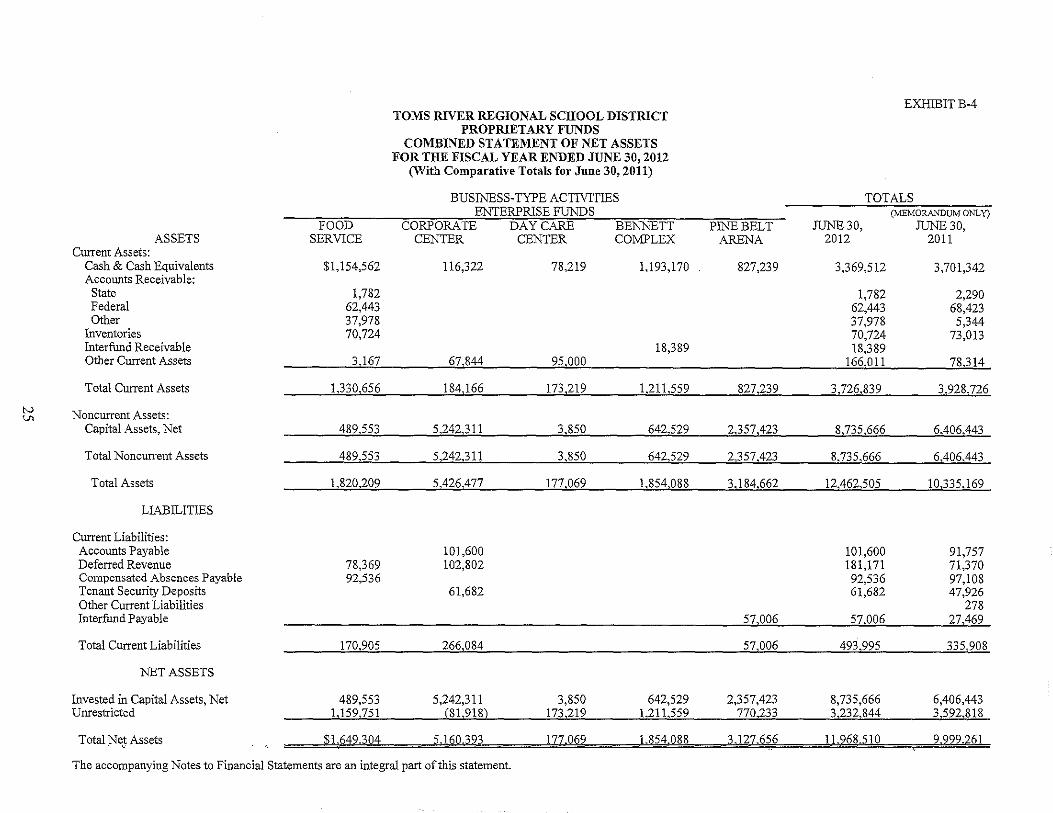
TOMS RIVER REGIONAL SCHOOL DISTRICT PROPRIETARY FUNDS
COMBINED STATEMENT OF NET ASSETS FOR THE FISCAL YEAR ENDED JUNE 30, 2012
(With Comparative Totals for June 30, 2011)
BUSINESS-TYPE ACTMTlES ENTERPRISE FUNDS
CORPORATE DAY CARE BENNETT CENTER CENTER COMPLEX
116,322 78,219 1,193,170
PINE BELT ARENA
827,239
EXHlBITB-4
TOTALS (MEMORANDUM ONLY)
JUNE 30, JUNE 30, 2012 2011
3,369,512
1,782 62,443 37,978 70,724
3,701,342
2,290 68,423 5,344
73,013 18,389 18,389
3,167 67,844 95,000 166,011 78,314
]J30,656 _ __ 1~4,lti6 _ lZJ,219_ 1,21l,559 827,239 3,726,839 3,928,726
489Si3 _ _ 5,232,3JJ _ _~,850_ _ 642,529 2,357,423 8,735,666 6,406,443
489,553 5,242,311 _3,850 __ 6±b529_ 2,357,423 8,735,666 6,406,443
U29,299_ _ 5,426,477__ 1'[7,062_ l,854>088 3,184,662 12,462,505 10,335,169
78,369 92,536
101,600 102,802
61,682
101,600 181,171 92,536 61,682
91,757 71,370 97,108 47,926
278 57,006 57,006 27,469
170,905 266,084 57,006 493,995 335,908
489,553 5,242,311 3,850 642,529 2,357,423 8,735,666 6,406,443 1,159,751 J81,918) _ 173,212 l,211,559 770,23?, 3,232,844 3,592,818
$1,649,304 5,160.393 __ 117.069 __1.854.088_ _ 3J27.65~ _ _~1,968,5~ __ --.9.9.9..2261
The accompanying Notes to Financial Statements are an integral part of this statement.
N 0\
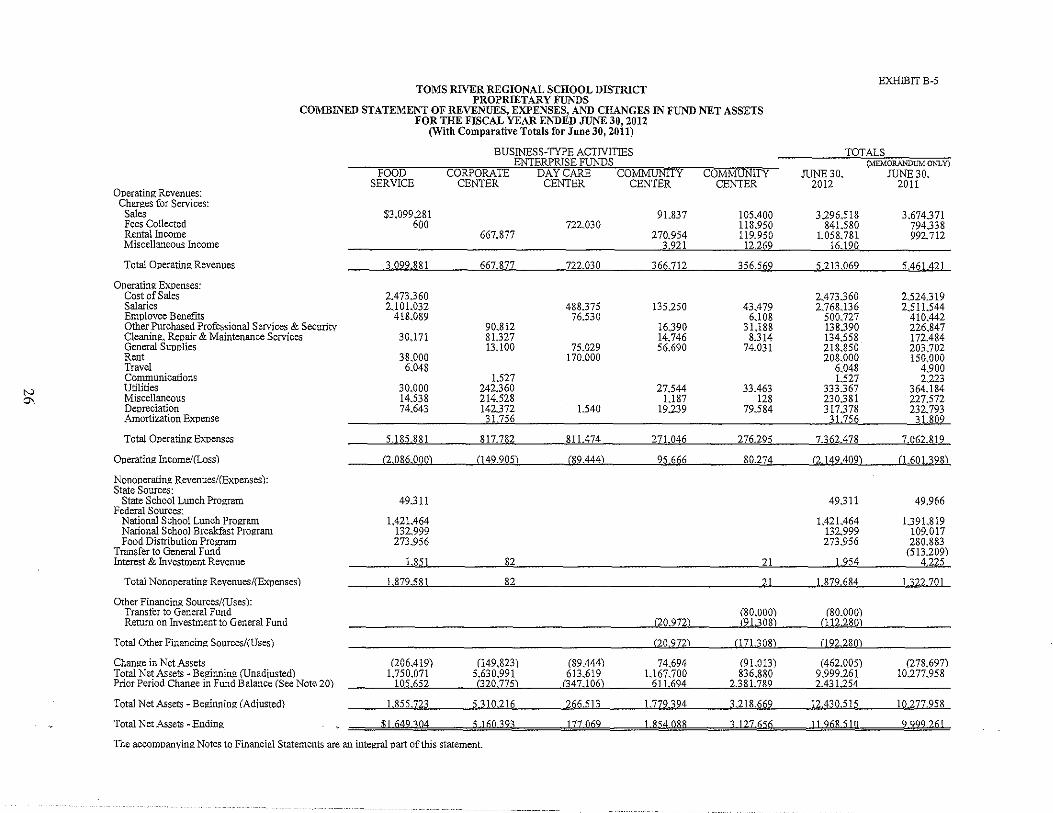
TOMS RIVER REGIONAL SCHOOL DISTRICT PROPRIETARY FUNDS
EXHIBITB-5
COMBINED STATEMENT OF REVENUES, EXPENSES, AND CHANGES IN FUND NET ASSETS FOR THE FISCAL YEAR ENDED JUNE 30, 2012
Operating Revenues: Charges for Services:
Sales Fees Collected Rental Income Miscellaneous Income
Total Operating Revenues
Operating Expenses: Cost of Sales Salaries Employee Benefits Other Purchased Professional Services & Security Cleaning. Repair & Maintenance Services General Supplies Rent Travel Communications Utilities Miscellaneous Depreciation Amortization Expense
Total Operating Expenses
Operating Income/(Loss)
Nonoperating Revenues/(Expenses): State Sources:
State School Lunch Program Federal Sources:
National School Lunch Program National School Breakfast Program Food Distribution Program
Transfer to General Fund Interest & Investment Revenue
Total Nonoperating Revenues/(Expenses)
Other Financing Sources/(Uses): Transfer to General Fund Retum on Investment to General Fund
Total Other Financing Sources!(Uses)
Change in Net Assets Total Net Assets - Beginning (Unadiusted) Prior Period Change in Fund Balance (See Note 20)
Total Net Assets - Beginning (Adiusted)
Total Net Assets - Ending
(With Comparative Totals for June 30, 2011)
BUSINESS-TYPE ACTNITIES TOTALS ENTERPRISE FUNDS (MEMORANDUM ONLy)
FOOD CORPORATE -DAYCARE COMMUNITY COMMUNITY CENTER
JUNE 30, JUNE 30, SERVICE CENTER CENTER CENTER 2012 2011
$3,099281 722,030 600 667,877
3.099.881
2,473360 2.101.032
418,089
30.171
38,000 6,048
30,000 14538 74.643
5.185.881
667.877
90.812 81.327 13.100
1.527 242,360 214528 142372 31.756
817.782
722.030
488375 76530
75,029 170,000
1.540
811.474
91.837
270,954 3921
366.712
135.250
16390 14,746 56,690
27544 1.187
19.239
271.046
105,400 3.296518 3.674371 118.950 841.580 794338 119,950 1,058,781 992-712 12,269 16.190
356.569 5213069 5461421
2,473360 2524319 43,479 2,768,136 2511544
6,108 500,727 410.442 31.188 138390 226,847 8,314 134558 172,484
74.031 218,850 203,702 208,000 150,000
6,048 4,900 1.527 2.223
33,463 333.367 364.184 128 230381 227572
79584 317,378 232,793 31756 31809
276,29L __ 7,l62,478 __ 7.062,819
(2.08"~000) _ (l49.9iJj) ___ (89,444L 95.666 80,274 (2.149,409) (1.601.398)
493 II 49311 49,966
1,421,464 1.421.464 1,391.819 132-999 132-999 109,017 273,956 273,956 280,883
(513.209) LS51 82 21 1.954 4.225
l.8J.2,581 __ 8~ 21 1.879.684 1.322.701
(80,000) (80.000) (20.972l_ _(9.L308) (]]2.280)
(20.9721 m1.308) (192.280)
(206,419) (149,823) (89.444) 74,694 (91.013) (462,005) l.750,071 5,630,991 613.619 IJ67,700 836,880 9.999,261
105652 mO.775) (347106) 6Il 694 2381789 2431254
(278,697) 10,277.958
1855723 5310216 266513 1779394 3218669 12430515 10.277958
$L6_49..304 _ 5J6O.393 _ 177_069 1.854_088 3_127.050 11.968.510 9_999.261
The accompanying Notes to Financial Statements are an integral part of this statement.
N -J
Cash Flows From Operating Activities: Receipts from Customers Payments to Emplovees Pavments for Employee Benefits Payments to Suppliers
Net Cash Provided/(Used) bv Operating Activities
Cash Flows From Noncaoital Financing Activities: State Sources Federal Sources Operating Subsidies & Transfers to Other Funds
Net Cash Provided/CUsed) bv Noncapital Financing Activities
Cash Flows From Capital & Related Financing Activities: Acquisition of Property & Construction Adiustments to Property & Construction Transfer to General Fund
Net Cash Provided/CUsed) by Capital & Related Financing Activities
Cash Flows From Investing Activities: Interest & Dividends
Net Cash Provided/(Used) by investing Activities
Net Increasel(Decrease) in Cash & Cash Equivalents Balances ~ Beginning of Year
Balances ~ End of Year
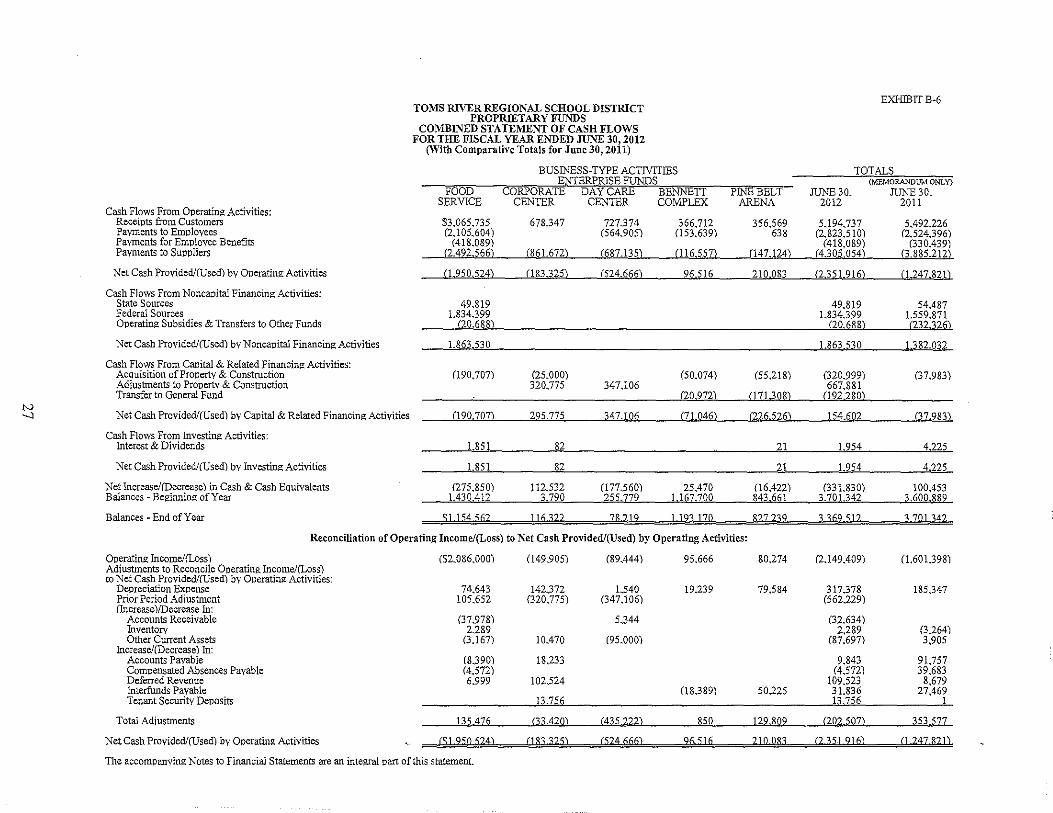
TOMS RIVER REGIONAL SCHOOL DISTRICT PROPRIETARY FUNDS
COMBINED STATEMENT OF CASH FLOWS FOR THE FISCAL YEAR ENDED JUNE 30, 2012
(With Comparative Totals for June 30, 2011)
BUSINESS-TYPE ACTIVITIES ENTERPRISE FUNDS
EXHlBITB-6
TOTALS (MEMORANPUMONLY)
FOOD SERVICE
CORPORATE DAYCARE BENNETT PINE BELT' ARENA
JUNE 30, JUNE 30, CENTER CENTER COMPLEX 2012 2011
$3,065,735 678347 721-374 366,712 356569 5,194.137 5.492,226 (2-105,604) (564,905) (153.639) 638 (2-823,510) (2,524,396)
(418,089) (418,089) (330.439) (2.492,566) (861672) (687135) CJl6557) (147.124) (4305054) 0.885212)
(1950.524) 083325) (524666) 96 516 210083 (2351916) (1247.821)
49,819 49,819 54.487 1.834399 1,834399 1559,871
aQ,688L .__ (20,68..8.1.. _ (232.326)
1.863,530
(190.707) (25,000) 320,775 347.106
1.863530 1382,032
(50,074) (55,218) (320,999) (37,983) 667,881
(20,972) C17DJl8) (192280)
Cl9Jl.707)_ --'195.77' _ 347.106 (71.046) (226526) 154.602 (37,983)
1.851 82 21 1.954 4225
1.851 82 21 1954 4,225
(275,850) 112532 (177560) 25.470 (16,422) (331.830) 100.453 1.430412 3.790 255,779 1167.700 843661 3,701342 3600,889
$ Ll54.56L _116322 78.219 Ll93170 827239 3309512 3701142
Reconciliation of Operating Income/(Loss) to Net Cash Provided/(Used) by Operating Activities:
Operating Income/(Loss) Adiustments to Reconcile Operating Income/(Loss) to Net Cash Provided/rosed) by Operating Activities:
Depreciation Expense Prior Period Adjustment (Increase)/Decrease In:
Accounts Receivable Inventory Other Current Assets
Increase/(Decrease) In: Accounts Payable Compensated Absences Payable Deferred Revenue Interfunds Payable Tenant Security Deposits
Total Adjustments
NetCash Providedl(Used) by Operating Activities
($2,086,000) 049,905) (89.444) 95,666 80,274 (2.149.409) 0,601398)
74.643 142.372 1,540 19,239 79584 317,378 185.347 105,652 020,775) (347,106) (562229)
(37,978) 5344 (32,634) 2,289 2,289 (3.264)
(3.167) 10.470 (95,000) (87,697) 3.905
(8.390) 18,233 9,843 91.757 (4572) (4572) 39,683 6,999 102524 109.523 8,679
08.389) 50,225 31.836 27.469 13,756 l3.756 1
135.476 (33.420) _ (435222) _ 850 129,809 (20250'1). 351.577
($1950524.) (183325) (524666) 96516 210083 (235.1 916) C1 24782D
The accompanving Notes to Financial Statements are an integral part of this statement.

Fiduciary Fund

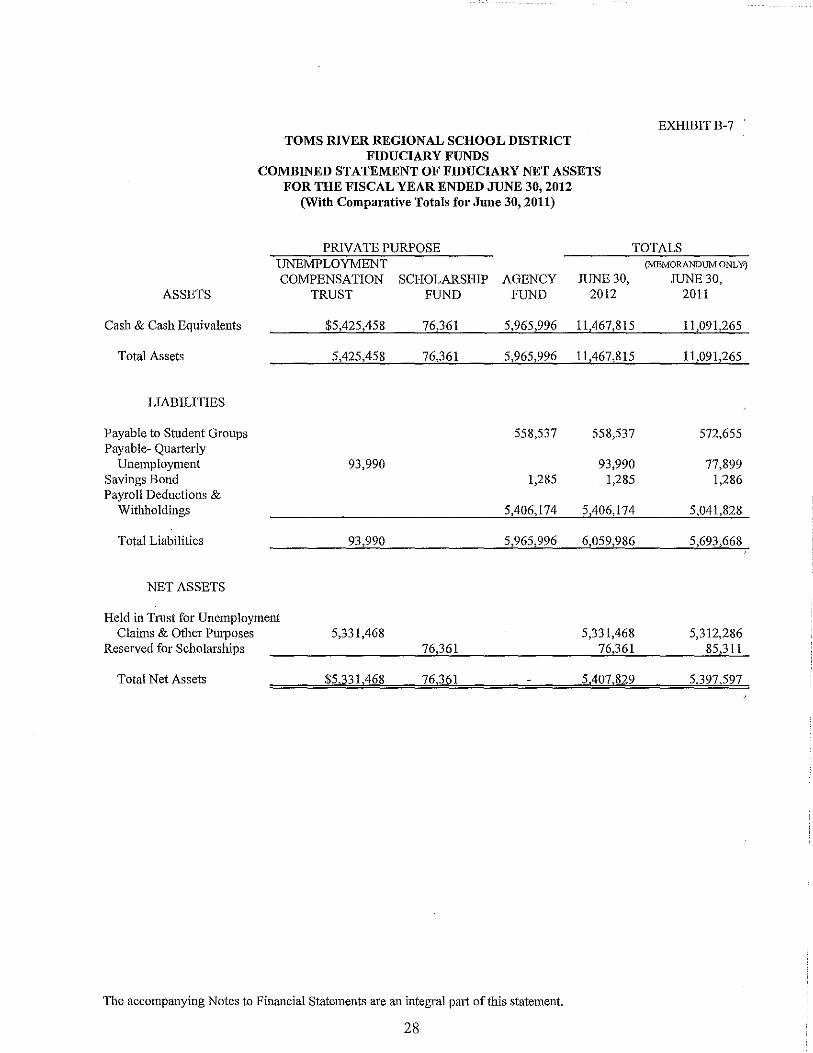
TOMS RIVER REGIONAL SCHOOL DISTRICT FIDUCIARY FUNDS
COMBINED STATEMENT OF FIDUCIARY NET ASSETS FOR THE FISCAL YEAR ENDED JUNE 30, 2012
(With Comparative Totals for June 30, 2011)
EXHIBITB-7
PRIVATE PURPOSE TOTALS UNEMPLOYMENT (MEMORANDUM ONL ¥)
COMPENSATION SCHOLARSHIP AGENCY JUNE 30, JUNE 30, ASSETS TRUST FUND FUND 2012 2011
Cash & Cash Equivalents $5,425,458 76,361 5,965,996 11,467,815 1l,091,265
Total Assets 5,425,458 76,361 5,965,996 11,467,815 11,091,265
LIABILITIES
Payable to Student Groups 558,537 558,537 572,655 Payable- Quarterly
Unemployment 93,990 93,990 77,899 Savings Bond 1,285 1,285 1,286 Payroll Deductions &
Withholdings 5,406,174 5,406,174 5,041,828
Total Liabilities 93,990 5,965,996 6,059,986 5,693,668
NET ASSETS
Held in Trust for Unemployment Claims & Other Purposes 5,331,468 5,331,468 5,312,286
Reserved for Scholarships 76,361 76,361 85,311
Total Net Assets $5,331,468 76,361 5,407,829 5,397,597
The accompanying Notes to Financial Statements are an integral part of this statement.
28
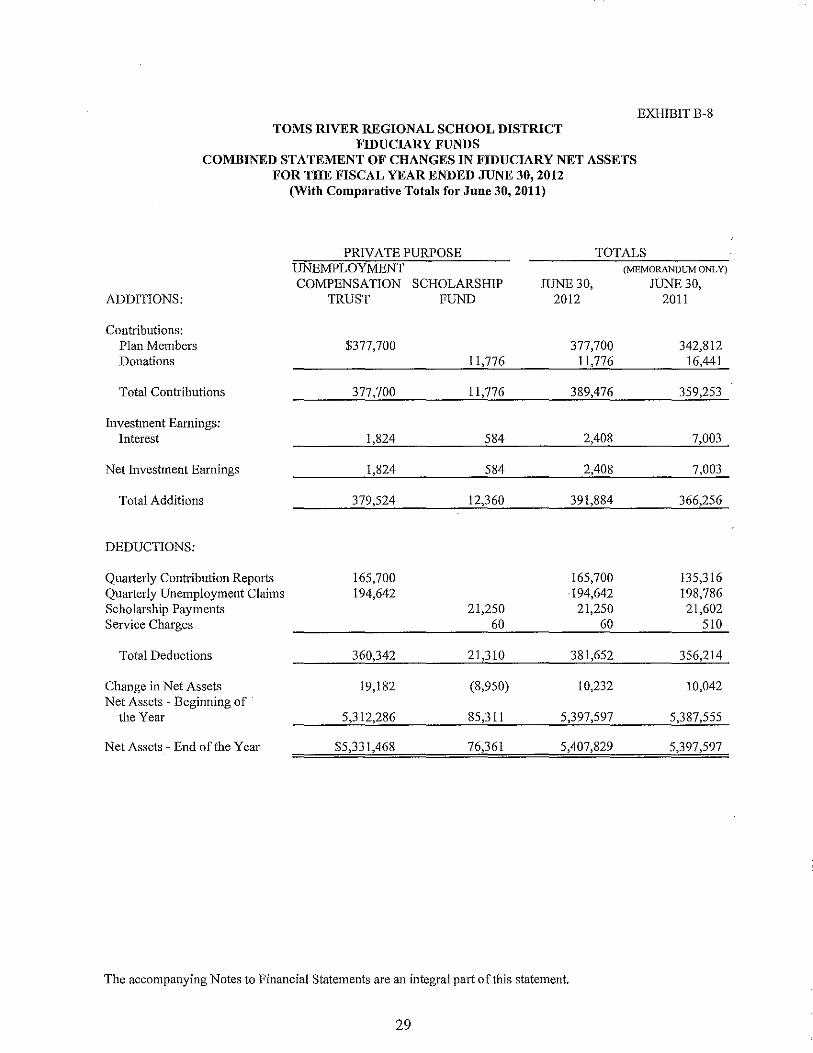
TOMS RIVER REGIONAL SCHOOL DISTRICT FIDUCIARY FUNDS
COMBINED STATEMENT OF CHANGES IN FIDUCIARY NET ASSETS FOR THE FISCAL YEAR ENDED JUNE 30, 2012
(With Comparative Totals for June 30,2011)
EXHIBITB-8
PRIVATE PURl'OSE TOTALS UNEMPLOYMENT (MEMORANDUM ONLY)
COMPENSATION SCHOLARSHIP JUNE 30, JUNE 30, ADDITIONS: TRUST FUND 2012 2011
Contributions: Plan Members $377,700 377,700 342,812 Donations 11,776 11,776 16,441
Total Contributions 377,700 11,776 389,476 359,253
Investment Eanlings: Interest 1,824 584 2,408 7,003
Net Investment Earnings 1,824 584 2,408 7,003
Total Additions 379,524 12,360 391,884 366,256
DEDUCTIONS:
Quarterly Contribution Reports 165,700 165,700 135,316 Quatierly Unemployment Claims 194,642 194,642 198,786 Scholarship Payments 21,250 21,250 21,602 Service Charges 60 60 510
Total Deductions 360,342 21,310 381,652 356,214
Change in Net Assets 19,182 (8,950) 10,232 10,042 Net Assets - Beginning of
the Year 5,312,286 85,311 5,397,597 5,387,555
Net Assets - End oftlle Year $5,331,468 76,361 5,407,829 5,397,597
The accompanying Notes to Finatlcia1 Statements are an integral part of this statement.
29
TOMS RIVER REGIONAL SCHOOL DISTRICT BOARD OF EDUCATION
NOTES TO THE FINANCIAL STATEMENTS JUNE 30, 2012

TOMS RIVER REGIONAL SCHOOL DISTRICT
NOTES TO THE FINANCIAL STATEMENTS JUNE 30, 2012
Note 1. Summary of Siguificant Acconnting Policies
The financial statements of the Toms River Regional School District ("District") have been prepared in confonnity with accountiug principles generally accepted in the United States of America ("GAAP") as applied to govemmentallmits. The Govennnental Accounting Standards Board ("GASB") is the accepted standard-setting body for establishing governmental accounting and financial repOiting principles. The GASB has issued codification of govermnental accounting and financial standards dated June 30, 2000. This codification and subsequent GASB pronouncements are recognized as generally accepted accounting principles for state and local government.
This fmancial report has been prepared in accordance with GASB Statement No. 34, Basic Financial Statements - Management's Discussion and Analysis - for State and Local Governments, issued in June 1999. Significant changes included in the Statement include the following:
• A Management's Discnssion and Analysis (MD&A) section providing an analysis of the District's overall financial position and results of its operations.
• Financial statements prepm'ed using full accmal accounting for all of the District's activities.
• A change in the fund financial statements to focus on the major funds.
Other GASB Statements are required to be implemented in conjunction with GASB Statement 34. Therefore, the District has implemented the following GASB Statements in prior fiscal years: Statement 33 - Accounting and Financial Reporting for Nonexchange Transactions; Statement 36 - Recipient Reporting for Certain Shared Nonexchange Revenues; Statement 37 - Basic Financial Statements - and Management's Discussion and Analysis -for State and Local Governments: Omnibus and Statement 38-Certain Financial Statement Note Disclosures; Statement 40 - Deposit and Investment Risk Disclosures and Statement 44 - Economic Condition Reporting - The Statistical Section; Statement 45 - Accounting and Reporting by Employers for Postemployment Benefits Other Than Pensions; and Statement 54 -Fund Balance Reporting and Governmental Fund Type Definitions.
These and other changes m'e reflected in the accompanying financial statements. The more significant of the District's accounting policies are described below:
A. Reporting Entity
The Toms River Regional School District is a Type II district located in the County of Ocean, State of New Jersey. As a Type II district, the School District functions independently through a Board of Education. The Bom'd consists of nine members elected to three-year terms and is responsible for the fiscal control of the District. A superintendent is appointed by the Board and is responsible for the administrative control of the District. .
30
TOMS RJV]J:R REGIONAL SCHOOL DISTRICT
NOTES TO THE FINANCIAL STATEMENTS (continned): JUNE 30, 2012
Note 1. Snmmary of Significant Acconnting Policies (continned):
Component units are legally separate organizations for which the School District is financially accountable. Component units may also include organizations that are fiscally dependent on the School District in that the School District approves their budget, the issuance of their debt, or the levy of taxes. The District has no component units. Flllthermore, the District is not includable in any other reporting entity on the basis of such criteria.
The District also applies Financial Accounting Standards Board pronouncements issued on or before November 30, 1989 to its governmental and business-type activities and proprietary funds provided they do not conflict with or contradict GASB pronouncements.
B. Basic Financial Statements - Government-wide Statements
The District's basic financial statements include both government-wide (reporting the District as a whole) and fund financial statements. The government-wide financial statements categorize primary activities as either govermnental or business-type.
The govermnent-wide statement of net assets is repOited on the full accrnal, economic reSOll1"ce basis, which recognizes all long-term assets and receivables as well as long-term debt and obligations. Governmental activities, which are nOimally suppOited by taxes and intergovenunental revenues, are reported separately from business-type activities, which rely on fees and charges for SUppOit. The District's net assets are repOited in three parts-invested in capital assets, net of related debt; restricted net assets; and unrestricted net assets.
The government-wide Statement of Activities reports both the gross and net costs of each of the District's functions. The net costs by function are normally supported by general revenues (property taxes, unrestricted intergovermnental revenues and investment income). The direct expenses of a given function or business segment, including depreciation expense, are offset by program revenues. Program revenues must be directly associated with the functional expense and includes charges for services, operating grants restricted to a specific function and capital grants and contributions.
The District does not allocate indirect costs. In creating the government-wide financial statements the District has eliminated interfund transactions.
The District maintains a policy of utilizing restricted resources fn'st in financing qualified activities.
C. Basic Financial Statements - Fund Financial Statements
The accollllts of the District are organized on the basis of funds and account groups, each of which is considered a separate accounting entity with a self-balancing set of accounts that comprise its assets, liabilities, fund balance, revenue and expendiwes. Governmental reSOll1"ces are allocated to and for individual funds based upon the purposes for which they are to be spent and the means by which spending activities are controlled. An account group, on the other hand, is a financial repOiting device designed to provide accountability for celtain assets and liabilities that are not recorded in the funds because they do
31
TOMS RIVER REGIONAL SCHOOL DISTRICT
NOTES TO THE FINANCIAL STATEMENTS (continned): JUNE 30, 2012
Note 1. Snmmary of Significant Acconnting Policies (continued):
C. Basic Financial Statements - Fund Financial Statements (continued):
not directly affect 1he expendable available financial resources. Funds are classified into tbree categories: governmental, proprietary and fiduciruy. Each category, in tum, is divided into separate "fund types."
Governmental Fund Types - Govemmental funds are those funds tln'ough which most of the District's functions are typically financed. The acquisition, use and balrulces or the District's expendable financial resources and the related current liabilities are accounted for tbrough govemmental funds.
General Fund: The general fund is the general operating fund of 1he District and is used to account for all expendable fmancial resources except 1hose required to be accounted for in another fund.
Special Revenue Fund: The District accounts for the proceeds of specific revenue sources (other than expendable trusts or major capital projects) that are legally restricted to expenditures for specified purposes in the special revenue funds.
Capital Projects Fund: The capital projects fund is used to account for all financial resources to be used for the acquisition or construction of major capital facilities (other thrul those financed by proprietruy funds.)
Debt Service Fund: The debt service fund is used to account for the accumulation of resources for, and the payment of principal and interest on bonds issued to finance major property acquisition, construction ruld inlprovement progrruns.
Proprietary Fund Types
Enterprise (Food Service) Fnnd: This enterprise fund accounts for all revenues 3lld expenses pertaining to cafeteria operations for all 18 schools, plus tl,e Cafe at 1144 Hooper Avenue. The food service fund is utilized to account for operations that are fmanced and operated in a manner similar to private business enterprises. The stated intent is that the cost (i.e. expenses including depreciation expense and indirect costs) of providing goods or services to the students on a continuing basis are financed or recovered primarily through user chru·ges.
Corporate Center: In April 1997 the District acquired a commercial office building for $6,347,009. The DistTict's administrative offices ru'e maintained and cuuently several ancillary school services are being incorporated. The District renovated vacant office space for use· as additional classrooms, day care facility and a cafe servicing bo1h school board ruld tenant employees.
The District has entered into contract with Atlantic Coast Reality Appraisal Group, Inc. to provide professional management services in connection wi1h the rental agreements with its commercial tenants.
32
TOMS RIVER REGIONAL SCHOOL DISTRICT
NOTES TO THE FINANCIAL STATEMENTS (continned): JllNE 30, 2012
Note 1. Snmmary of Significant Acconnting Policies (continned):
C. Basic Financial Statements - Fund Financial Statements (continued):
Daycare Center: The Daycare Center ("Center") is run as its own separate entity. The Center provides services primarily for District employees. The Center operates from September to June and is open 184 days per year.
John Bennett Athletic Complex: The John Bennett Athletic Complex is used as the gymnasium for Intennediate School East. The Complex is an air structure used for indoor track and sporting events that is also rented by outside pruties.
Pine Belt Arena: The Pine Belt Arena is on the campus of High School North and is a facility that is used as the high school gymnasium during school hours but is rented to other pruties for various sporting events, trade shows, and concerts during after school hours.
Fiduciary Fund Types
Trust and Agency Funds: The trust and agency fimds are used to account for assets held by the District on behalf of outside parties, including other governments, or on behalf of other funds within the District.
Expendable Trust Funds (Unemployment Compensation Insurance Fund aud Scholarship Fund): Expendable trust funds are used to account for assets held under the tenns of a formal trust agreement, whereby the District may make expenditures against both the trust principal and any interest earned thereon.
Agency Funds (payroll and Student Activities Fnnd): Agency funds are used to account for the assets that the District holds on behalf of others as their agent. Agency funds are custodial in nature and do not involve measurement of results of operations.
Account Groups
111 addition to the funds listed above, the District maintains two account groups as follows:
General Fixed Assets Account Group: All fixed assets used in governmental fimd type operations (general fixed assets) are accounted for in the general fixed assets account group, rather than in governmental funds. Fixed assets related to food service operations and the childcare programs are accounted for in the enterprise fund and are considered fund fixed assets.
General Long-Term Debt Account Group: All unmatured general long-tenn liabilities of the District (excluding those of proprietary fund types or trust funds) are accounted for in the general long-term debt account group. This includes serial bonds outstanding, which are expected to be financed from governmental funds, the outstanding principal balance on capital leases and the noncurrent portion of the liability for compensated absences.
33
TOMS RIVER REGIONAL SCHOOL DISTRICT
NOTES TO THE FINANCIAL STATEMENTS (continned): JUNE 30, 2012
Note 1. Snmmary of Significant Accounting Policies (continued):
D. Measurement Focus aud Basis of Accounting
Basis of accounting refers to the point at which revenues or expenditures/expenses are recognized in the accounts and reported in the financial statements. It relates to the timing of the measurements made regardless of the measurement focus applied. Governmental funds use the current financial resources focus and the governmental-wide statement uses the economic resources measurement focus.
Accrual
Governmental activity in the government-wide financial statements is presented on the accrual basis of acconnting. The accrual basis of accounting is also used for measuring financial position and operating results of proprietary fund types. Revennes are recognized when earned and expenses are recognized when incnlTed.
Modified Accrual
The modified accrual basis of acconnting is used for measuring the financial position and operating results of all governmental fund types, expendable trust funds and agency funds. Under the modified accrual basis of acconnting, revennes are recognized when they become both measurable and available. "Measurable" means the amount of the transaction can be determined and "available" means collectible within the CUl1·ent period, or soon enongh thereafter, to be used to pay liabilities of the cUlTent period. Expenditnres are recognized in the accounting period in which the fund liability is incurred, except for principal and interest on generallong-te!ID debt which are recorded when due.
Ad Valorem (Property) Taxes are susceptible to accrual. Under New Jersey State Statute, a municipality is required to remit to its School District the entire balance of taxes in the amount voted npon or certified, prior to the end of the school year. The District records the entire approved tax levy as revenue (accl1led) at the start of the fiscal year, since the revenue is both measnrable and available. The District is entitled to receive moneys under the established payment schedule and the unpaid amount is considered to be an "accounts receivable,"
E. BudgetsIBudgetary Control
Annnal appropriated budgets are prepared in the spring of each year for the general, special revenue and debt service funds. The budgets are submitted to the county office and are voted upon at the annual school election on or around the third Tuesday in April. Effective February 9, 2012, P.L.2011 c.202 eliminated the alUlUal voter referendum on budgets which met the statutory tax levy cap limitations and the board of edncation members aTe elected at the November general election. Budgets are prepm·ed using the modified accrual basis of acconnting. The legal level of bndgetary control is established at line item accounts within each fnnd. Line item acconnts are defined as the lowest (most specific) level of detail as established pursumlt to the minimum chart of acconnts referenced in NJ.A.G.6A:23-1.2. All budget amendments must be approved by School Board resolntion.
34
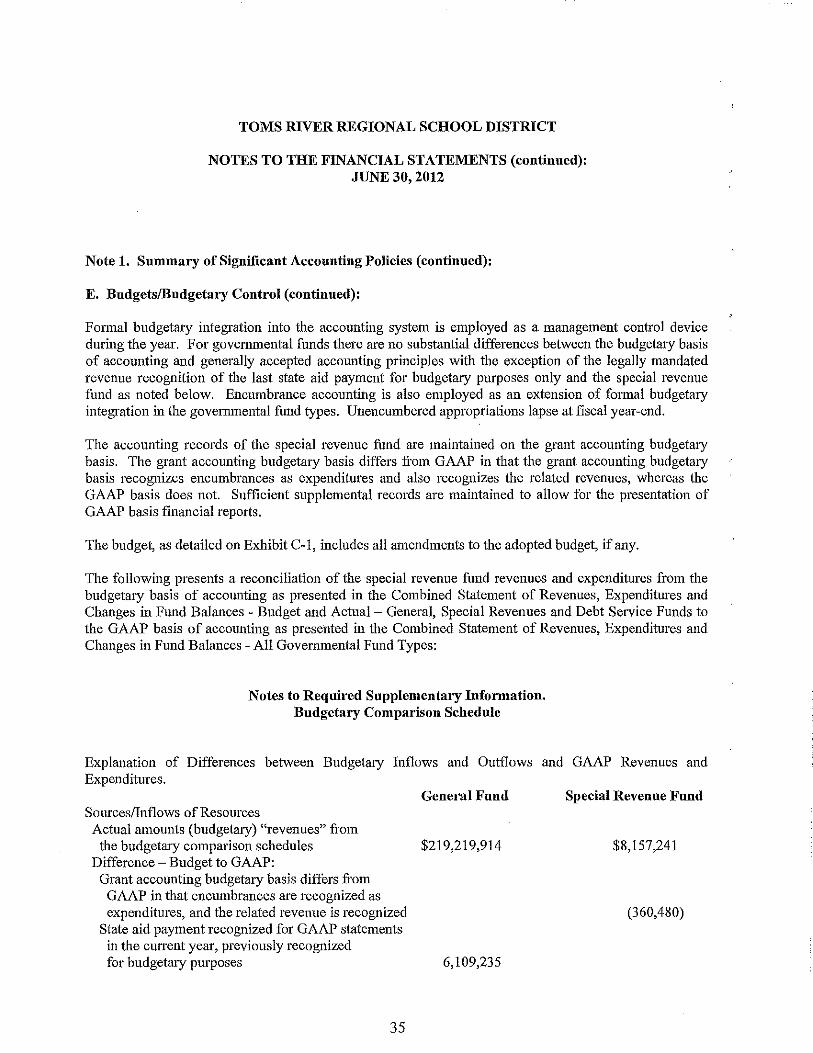
TOMS RIVER REGIONAL SCHOOL DISTRICT
NOTES TO THE FINANCIAL STATEMENTS (continued): JUNE 30, 2012
Note 1. Summary of Significant Accounting Policies (continued):
E. BudgetslBudgetary Control (continued):
Formal budgetruy integration into the accounting system is employed as a management control device during the year. For govermnental funds there are no substantial differences between the budgetary basis of accounting and generally accepted accounting principles with the exception of the legally mandated revenue recognition of the last state aid payment for bndgetary pnrposes only and the special revenue fund as noted below. Encumbrance accounting is also employed as an extension of fOlmal budgetary integration in the governmental fund types. Unencumbered appropriations lapse at fiscal year-end.
The accounting records of the special revenue fund are maintained on the grant accounting budgetary basis. The grant accounting budgetary basis differs fi'om GAAP in that the grant accounting budgetary basis recognizes encumbrances as expenditures and also recognizes the related revenues, whereas the GAAP basis does not. Sufficient supplemental records are maintained to allow for the presentation of GAAP basis financial reports.
The budget, as detailed on Exhibit C-l, includes all amendments to the adopted budget, if any.
The following presents a reconciliation of the special revenue fund revenues and expenditnres from the budgetary basis of accounting as presented in the Combined Statement of Revenues, Expenditnres and Changes in Fund Balances - Budget and Actual- General, Special Revenues and Debt Service Funds to the GAAP basis of accounting as presented in the Combined Statement of Revenues, Expenditures and Changes in Fund Balances - All Governmental Fund Types:
Notes to Required Supplementary Information. Budgetary Comparison Schedule
Explanation of Differences between Budgetmy Inflows and Outflows and GAAP Revenues and Expenditnres.
Genel'lll Fund Sonrces/Inflows ofResonrces Actual amounts (budgetary) "revenues" from
the budgetary comparison schedules $219,219,914 Difference - Budget to GAAP:
Grant accounting budgetary basis differs from GAAP in that encumbrances are l'ecognized as expenditures, and the related revenue is recognized
State aid payment recognized for GAAP statements in the current year, previously recognized for budgetmy purposes 6,109,235
35
Special Revenue Fund
$8,157,241
(360,480)
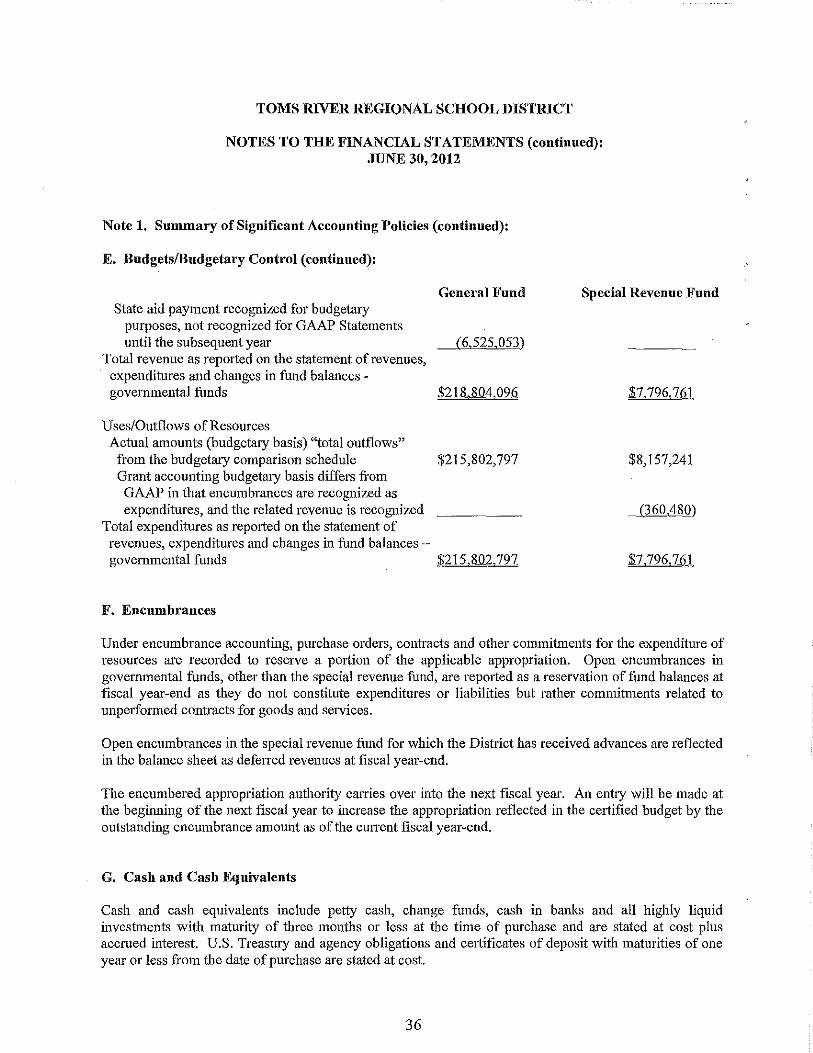
TOMS RIVER REGIONAL SCHOOL DISTRICT
NOTES TO THE FINANCIAL STATEMENTS (continned): JUNE 30, 2012
Note 1. Summary of Significant Accounting Policies (continued):
E. BudgetsIBudgetary Control (continued):
State aid payment recognized for budgetmy purposes, not recognized for GAAP Statements
General Fund
until the subsequent year (6,525,053) Total revenue as reported on the statement of revenues,
expenditures and changes in fund balances -governmental funds $218804,096
Uses/Outflows of Resources Actual atllounts (budgelaty basis) "total outflows"
from the budgetary comparison schedule $215,802,797 Grmlt accounting budgetmy basis differs from GAAP in that encumbrmlces are recognized as expenditures, and the related revenUe is recognized
Total expenditnres as reported on the statement of revenues, expenditures and changes in fillld balances -governmental funds $215,802797
F. Encumbrances
Special Revenue Fund
$7796,761
$8,157,241
(360,480)
$7796,761
Under encumbrance accounting, purchase orders, contracts and other commitments for the expenditure of resources are recorded to reserve a pOition of the applicable appropriation. Open encumbrances in governmental filllds, other than the special revenue fund, are repOited as a reservation of fund balances at fiscal year-end as they do not constitute expenditures or liabilities but rather commitments related to unperfonned contracts for goods and services.
Open encumbrances in the special revenue fimd for which the District has received advances are reflected in the balance sheet as deferred revenues at fiscal year-end.
The encumbered appropriation authority cmTies over into the next fiscal yem·. An entry will be made at the begiillling of the next fiscal year to increase the appropriation reflected in the certified budget by the outstanding encumbrance atllount as of the current fiscal yem·-end.
G. Cash and Cash Equivalents
Cash mld cash equivalents include petty cash, change funds, cash in banks and all highly liquid investments with maturity of three months or less at the time of purchase mld are stated at cost plus accmed interest. U.S. Treasury and agency obligations and certificates of deposit with maturities of one year or less from the date of purchase are stated at cost.
36
TOMS RIVER REGIONAL SCHOOL DISTRICT
NOTES TO THE FINANCIAL STATEMENTS (continned): JUNE 30, 2012
Note 1. Snmmary of Significant Acconnting Policies (continned):
G. Cash and Cash Equivalents (continued):
New Jersey School Districts are limited as to the types of investments and types of fmancial institutions they may invest in. New Jersey statute IBA:20-37 provides a list of permissible investments that may be purchased by New Jersey School Districts.
Additionally, the District has adopted a cash management plan that requires it to deposit public funds in public depositories protected from loss under the provisions of the Governmental Unit Deposit Protection Act ("GUDPA"). GUDPA was enacted in 1970 to protect Governmental Units from a loss of funds on deposit with a failed banking institution in New Jersey.
N.J.SA 17:9-41 et. seq. establishes the requirements for the security of deposits of governmental units. The statute requires that no governmental unit shall deposit public funds in a public depository unless such funds are secured in accordance with the Act. Public depositories include savings and loan institutions, banks (both +state and national banks) and savings banks, the deposits of which are federally insured. All public depositories must pledge collateral, having a market value at least equal to five percent of the average daily balance of collected public funds, to secure the deposits of Governmental Units. If a public depository fails, the collateral it has pledged, plus the collateral of all other public depositories, is available to pay the full amount of their deposits.
H. Short-Term Interfund ReceivableslPayables
Short-tenn interfund receivables/payables represent amounts that are owed, other than charges for goods or services rendered to/from a particular fWld in the District, and that are due within one yem".
I. Inventories
On the government-wide financial statements, inventories are presented at the lower of cost or market on a first-in, first-out basis, and are expensed when used.
Inventories in governmental funds are stated at cost by the first-in, first-out method. The purchase method is used to account for inventories. Under the purchase method, inventories are recorded as expenditures when purchased; however, an estimated value of inventories is being repOited as an asset in the general fund. The inventory in the general fund is equally offset by a fund balance reserve which indicates they do not constitute "available spendable resources" even though they are a component of net current assets. There was no material balance of inventory in governmental funds at June 30, 2012.
A physical inventory of the food services fund was taken as of Jlme 30, 2012. The inventory consisted of purchased commodities and supplies both valued using the first-in, first-out method. The District values government commodities at their estinlated fair market value and reports any unused commodities as deferred revenue.
37
TOMS RIVER REGIONAL SCHOOL DISTRICT
NOTES TO THE FINANCIAL STATEMENTS (continned): JUNE 30, 2012
Note 1. Snmmary of Significant Acconnting Policies (continned):
J. Prepaid Expenses
hI both the government-wide and fnnd financial statements, prepaid expenses are recorded as assets in the specific governmental fund in which the future benefit will be received.
K. Allowance for Uncollectible Acconnts
No allowance for nncolJectible accounts has been recorded as all amounts ru'e considered collectible.
L. Capital Assets
Capital assets purchased or acquired are capitalized at historical costs or estimated historical costs aud are reported in the applicable govermnental or business-type activities columns in the government-wide finmcial statements. Capital assets as defined by the District are those assets with an initial individual cost of more than $2,000 md an estimated useful life in excess of one year. Management has also elected to include certain homogenous asset categories with individual balmces less than $2,000 as composite groups for financial repOiting purposes. Donated capital assets are recorded at their estimated fair market valne at the date of donation.
The costs of normal maintenance and repairs that do not add to the value of the asset or materially extend the asset lives are not capitalized. Improvements are capitalized md depreciated over the remaining useful lives of the related capital assets.
Depreciation on all capital assets is provided on the straight-line basis over the estimated useful lives as follows:
Bnildings & Building Improvements Furniture & Fixtures Machinery & Equipment Vehicles
M. Long-Term Obligations
20 - 50 yeru's 7 - 20 yeru's 5 - 12 years 5 - 20 years
In the government-wide financial statements, md proprietary fund types in the fund financial statements, long-term debt and other long-term debt obligations are reported as liabilities in the applicable governmental activities or proprietary fund type statement of net assets. Bond premiums and disconnts, as well as issuance costs, are deferred and alllOitized over the life of the bond using the effective interest method. Bonds payable are reported net of the applicable bond premium or discount. Bond issumce costs are repOited as defelTed chru'ges md amOitized over the term of the related debt.
ill the fund finmcial statements, governmental fund types recognize bond premiums md discounts, as well as bond issumce costs, during the current period. The face amount of debt issued is repOited as other financing sources while discounts on debt issuances are repOited as other financing uses. Issuance costs, whether or not withheld from the actual debt proceeds received, are repOited as debt service expenditures.
38
TOMS RIVER REGIONAL SCHOOL DISTRICT
NOTES TO THE FINANCIAL STATEMENTS (continned): JUNE 30, 2012
Note 1. Snmmary of Significant Acconnting Policies (continned):
N. Compensated Absences for Vacation and Sick Leave
The District's employees are granted vacation and sick leave in vmying amounts under the District's personnel policies. In the event oftennination, an employee is reimbursed for accumulated vacation. Sick leave benefits provide for ordinary sick pay and begin vesting with the employee after four years of service.
The long-term liability for vested compensated absences of the governmental fund type is recorded in the government-wide financial statements as the benefits accrued to employees. As of June 30, 2012 the compensated absences liability for govermnental funds was $14,572,145.
The liability for vested compensated absences of the proprietary fund types is recorded within those funds as the benefits accrue to employees. As of June 30, 2012 the liability for compensated absences in the proprietary fund types was $92,536.
O. Deferred Revenne
Deferred revenue arises when assets m'e recognized before revenue recognition criteria have been satisfied. Property taxes for which there is an enforceable legal claim as of June 30, 2012, but which were levied to finance fiscal year 2012 operations, have been recorded as deferred revenue. Grants and entitlement received before the eligibility requirements are met are also recorded as deferred revenue.
P. Fnnd Eqnity
In the fund financial statements, governmental funds report reservations of fund balmlce for amounts that are not available for appropriation or are legally restricted by outside pmties. Designated fund balances represent plans for future use of finmlcial ""sources. Contributed capital represents the amount of fund capital contributed to the propriety funds from other funds.
Q. Net Assets
Net assets represent the difference between assets and liabilities in the government-wide financial statements. Net assets invested in capital assets m'e reported net of related debt and accumulated depreciation. Net assets are repOlted as restricted in the government-wide financial statements when there are limitations imposed on their nse through external restrictions imposed by creditors, grantors, laws or regulations of other governments.
R. Allocation of Indirect Expenses
The District reports all direct expenses by function in the Statement of Activities. Direct expenses are those that are clearly identifiable with a function. Indirect expenses are allocated to functions but are
39
TOMS RIVER REGIONAL SCHOOL DISTRICT
NOTES TO THE FINANCIAL STATEMENTS (continned): JUNE 30, 2012
Note 1. Summary of Significant Accounting Policies (continued):
R. Allocatiou of Indirect Expeuses (coutinued):
reported separately in the Statement of Activities. Employee benefits, including the employer's share of social security, workers compensation, and medical and dental benefits, were allocated based on salaries of that program. Depreciation expense, where practicable, is specifically identified by function and is included in the indirect expense column of the Statement of Activities. Depreciation expense that could not be attributed to a specific function is considered an indirect expense and is reported separately on the Statement of Activities. Interest on long-term debt is considered an indirect expense and is reported separately on the Statement of Activities.
S. Extraordinary and Special Items
Extraordinary items are transactions or events that are unusual in natnre and infrequent in occurrence. Special items are transactions or events that are within the control of management and are either unusual in nature or infrequent in occurrence. Neither of these types of transactions occurred during the fiscal year.
T. Memorandum Only - Total Columns
Total columns are captioned "Memorandum Only" to indicate that they are presented only to facilitate financial analysis. Data in these columns do not present financial position, results of operations or changes in financial position in conformity with accounting principles generally accepted in the United States of America. Neither are such data comparable to a consolidation.
U. Comparative Data
Comparative total data for the prior year had been presented in order to provide an understanding of changes to the District's financial position and operations. Certain 2011 amounts have been reclassified to conform to the 2012 presentation.
V. Use of Estimates
The preparation of financial statements in conformity with aCC01ll1ting principles generally accepted in the United States of America requires management to make estimates and assumptions that affect the reported amounts of assets and liabilities and disclosure of contingent assets and liabilities at the date of the financial statements and the repOited amounts of revenues and expenses during the repOiting period. Actual results could differ from those estimates.
W. Subsequent Events
The District has evaluated subsequent events occurring after June 30, 2012 tluuugh October 26, 2012, which is the date the financial statements were available to be issued.
40
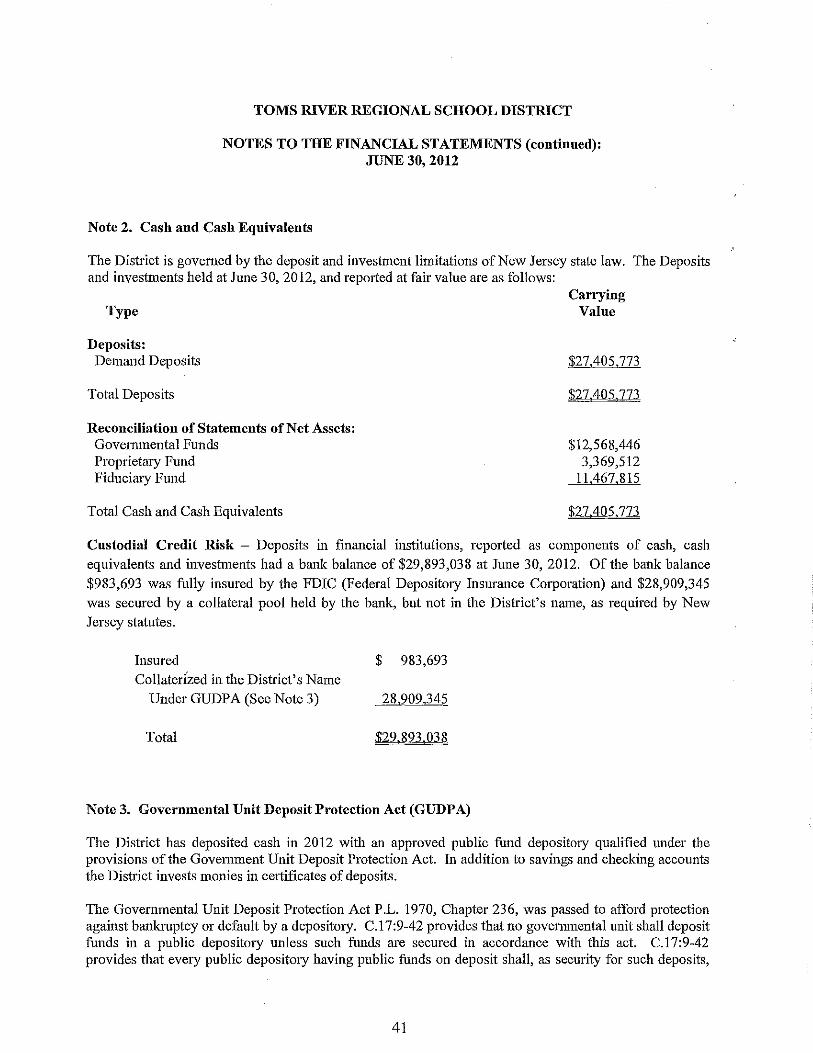
TOMS RIVER REGIONAL SCHOOL DISTRICT
NOTES TO THE FINANCIAL STATEMENTS (continned): JUNE 30, 2012
Note 2. Cash and Cash Equivalents
The District is governed by the deposit and investment limitations of New Jersey state law. The Deposits and investments held at June 30, 2012, and reported at fair value are as follows:
Type
Deposits: Demand Deposits
Total Deposits
Reconciliation of Statements of Net Assets: Govemmental Funds Proprietm'y Fund Fiducim'y Fund
Total Cash and Cash Equivalents
Carrying Value
$27,405.773
$27405773
$12,568,446 3,369,512
11,467,815
$27405.773
Custodial Credit Risk - Deposits in financial institutions, reported as components of cash, cash equivalents mId investments had a bank balffilce of $29,893,038 at June 30, 2012. Of the bank balance $983,693 was fnIly insured by the FDIC (Federal Depository Insurance Corporation) mId $28,909,345 was secured by a collateral pool held by the bank, but not iu the District's nmue, as reqnired by New Jersey statutes.
Insured Collaterlzed in the District's Name
Under GUDPA (See Note 3)
Total
$ 983,693
28,909,345
$29.893038
Note 3. Governmental Unit Deposit Protection Act (GUDPA)
The District has deposited cash in 2012 with an approved pnblic fund depository qualified under the provisions of the Govemment Unit Deposit Protection Act. In addition to savings and checking accounts the District invests monies in certificates of deposits,
The Govemmental Unit Deposit Protection Act P.L. 1970, Chapter 236, was passed to afford protection against bffilkruptcy or default by a depositOlY. C.17:9-42 provides that no governmental unit shall deposit funds in a public depository unless such funds m'e secured in accordance with this act. C.l7:9-42 provides that eVeJY public depositOlY having public funds on deposit shall, as security for such deposits,
41
TOMS RIVER REGIONAL SCHOOL DISTRICT
NOTES TO THE FINANCIAL STATEMENTS (continued): JUNE 30, 2012
Note 3. Governmental Unit Deposit Protection Act (GOOPA) (continued):
maintain eligible collateral having a maTket value at least equal to either (1) 5% of the average daily balance of collected public funds on deposit dUTing the 6 month period ending on the next preceding valuation date (June 30 or December 31) or (2) at the election of the depository, at least equal to 5% of the average balance of collected public funds on deposit on the first, eighth, fifteenth, and twenty-second days of each month in the 6 month period ending on the next preceding valuation date (Jnne 30 or December 31). No public depository shall be required to maintain any eligible collateral pursuant to this act as security for any deposit or deposits of any govel11mental unit to the extent such deposits ate insUTed by F.D.I.C. or any other U.S. agency which insUTes public depository funds.
No public depository shall at any time receive and hold on deposit for any period in excess of 15 days public funds of a govel11rnental unit(s) which, in the aggregate, exceed 75% of the capital funds of the depository, unless such depository shall, in addition to the security required to be maintained under the paragraph above, seCUTe such excess by eligible collateral with a maTket value at least equal to 100% of such excess.
In the event of a default, the Commissioner of Banking within 20 days after the default occurrence shall ascertain the amount of public funds on deposit in the defaulting depository and the amounts covered by federal deposit insurance and celiifY the amOlmts to each affected govermnental unit. Within 10 days after receipt of this certification, each unit shall fUl11ish to the Commissioner verified statements of its public deposits. The Commissioner shall ascertain the amount derived or to be derived from the liquidation of the collateral maintained by the defaulting depository and shall distribute such proceeds pro rata among the govel11mental nnits to satisfY the net deposit liabilities to such units.
If the proceeds of the sale of the collateral are insufficient to pay in full the liability to all affected governmental units, the Commissioner shall assess the deficiency against all other public depositories having public funds on deposit detennined by a formula determined by law. All sums collected by the Commissioner shall be paid to the governmental units having deposits in the defanlting depository in the propOliion that the net deposit liability to each such governmental unit bears to the aggregate of the net deposit liabilities to all such governmental nnits.
All public depositories are required to furnish information and repOlis dealing with public funds on deposit every six months, June 30th and December 31st, with the Commissioner of Banking. Any pnblic depository which refuses or neglects to give any information so requested may be excluded by the Commissioner from the right to receive pnblic funds for deposit until such time as the Commissioner shall ac1mowledge that such depository has furnished the information requested.
Upon review and approval of the Certification Statement that the public depository complies with statutory requirements, the Commissioner issues fonns approving the bank as a municipal depository. The District should request copies of these approval forms semiannually to assure that all depositories are complying with requirements.
42
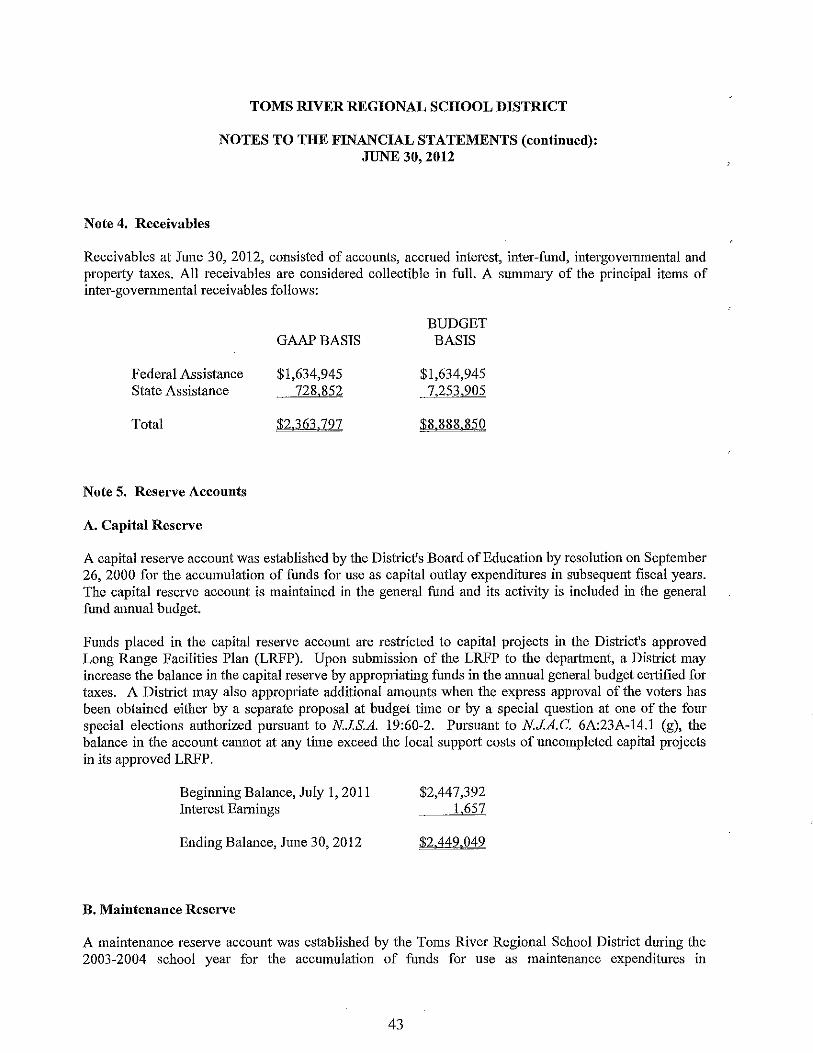
TOMS RIVER REGIONAL SCHOOL DISTRICT
NOTES TO THE FINANCIAL STATEMENTS (continued): JUNE 30, 2012
Note 4. Receivables
Receivables at June 30, 2012, consisted of accounts, accrued interest, inter-fund, intergovernmental and property taxes. All receivables are considered collectible in full. A summruy of the principal items of inter-governmental receivables follows:
Federal Assistance State Assistance
Total
Note 5, Reserve Accounts
A. Capital Reserve
GAAPBASIS
$1,634,945 728,852
$2363797
BUDGET BASIS
$1,634,945 7,253,905
$8888 850
A capital reserve account was established by the District's Board of Education by resolution on September 26, 2000 for the accumulation of funds for use as capital outlay expenditures in subsequent fiscal years. The capital reserve account is maintained in the general fund and its activity is included in the general fund annual budget.
Funds placed in the capital reserve account are restricted to capital projects in the District's approved Long Range Facilities Plan (LRFP). Upon submission of the LRFP to the deprutment, a District may increase the balance in the capital reserve by appropriating funds in the rurnual general budget certified for taxes. A District may also appropriate additional amounts when the express approval of the voters has been obtained either by a separate proposal at budget time or by a special question at one of the fonr special elections anthorized pursuant to N.J.S.A. 19:60-2. Pursnant to N.J.A.C. 6A:23A-14.1 (g), the balance in the account cannot at any time exceed the local support costs of uncompleted capital projects in its approved LRFP.
Beginning Balance, July 1, 2011 Interest Earnings
Ending Balance, June 30, 2012
B. Maintenance Reserve
$2,447,392 1,657
$2.449049
A maintenance reserve account was established by the Toms River Regional School District during the 2003-2004 school year for the accumulation of funds for use as maintenance expenditures in
43
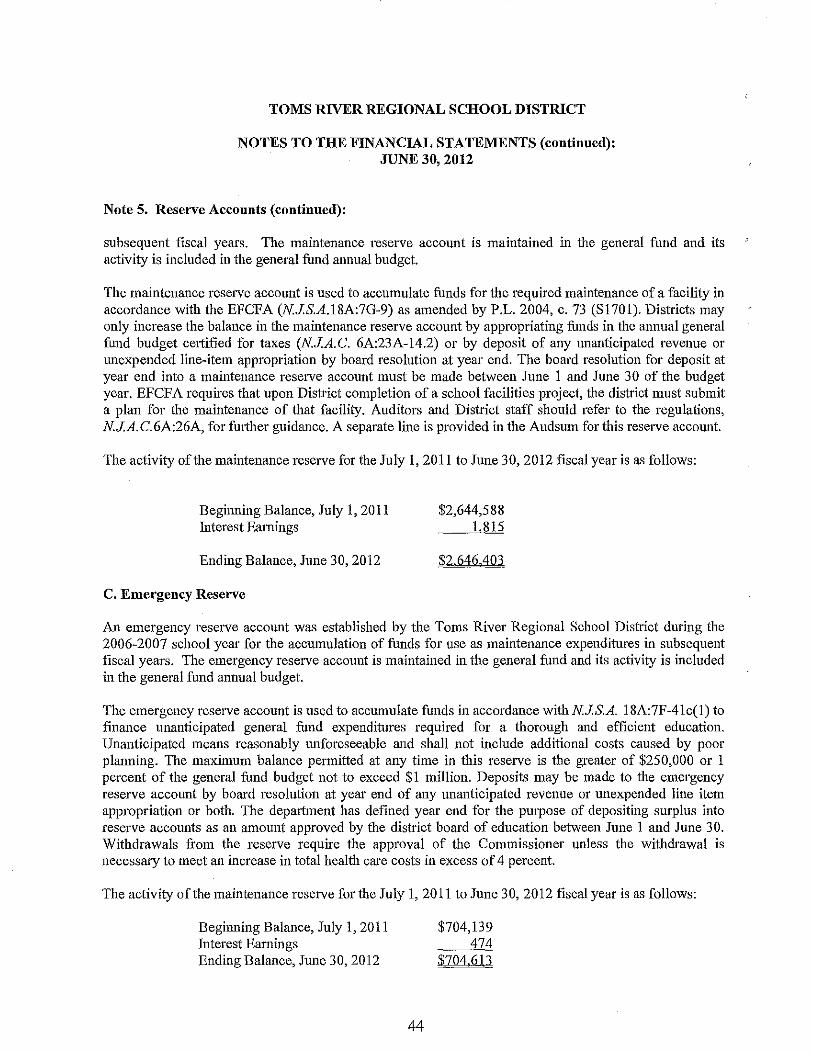
TOMS RIVER REGIONAL SCHOOL DISTRICT
NOTES TO THE FINANCIAL STATEMENTS (continued): JUNE 30, 2012
Note 5. Reserve Accounts (contiuued):
subsequent fiscal years. The maintenance reserve account is maintained in the general fund and its activity is included in the general fund annual bndget.
The maintenance reserve account is used to accumulate funds for the required maintenance of a facility in accordance with the EFCFA (NJ.S.A.18A:7G-9) as amended by P.L. 2004, c. 73 (SI701). Districts may only increase the balance in the maintenance reserve account by appropriating funds in the annual general fund budget celiified for taxes (NJ.A.C. 6A:23A-14.2) or by deposit of any unanticipated revenue or unexpended line-item appropriation by board resolution at year end. The board resolution for deposit at year end into a maintenance reserve account must be made between June I and June 30 of the budget year. EFCFA requires that upon District completion of a school facilities project, the district must submit a plan for the maintenance of that facility. Auditors and District staff should refer to the regulations, NJ.A. C. 6A:26A, for fmiher guidance. A separate line is provided in the Audsmn for this reserve account.
The activity of the maintenance reserve for the Jnly 1, 2011 to June 30, 2012 fiscal year is as follows:
Beginning Balance, July 1,2011 Interest Eamings
Ending Balance, June 30, 2012
C. Emergency Reserve
$2,644,588 1,815
$2646.403
An emergency reserve account was established by the Toms River Regional School District during the 2006-2007 school year for the accumulation of funds for use as maintenance expenditures in subsequent fiscal years. The emergency reserve account is maintained in the general fund and its activity is included in the general fund annual budget.
The emergency reserve account is used to accumulate funds in accordance with NJ.S.A. 18A:7F -41c(l) to finance unanticipated general fund expenditures required for a thorough and efficient education. Unanticipated means reasonably nnforeseeable and shall not include additional costs caused by poor planning. The maximum balance permitted at any time in this reserve is the greater of $250,000 or 1 percent of the general fund bndget not to exceed $1 million. Deposits may be made to the emergency reserve account by board resolution at year end of any unanticipated revenue or unexpended line item appropriation or both. The department has de:fmed year end for the purpose of depositing surplus into reserve accounts as an amount approved by the district boaI'd of education between June I and Jnne 30. Withdrawals from the reserve require the approval of the Commissioner unless the withdrawal is necessary to meet an increase in total health caTe costs in excess of 4 percent.
The activity of the maintenance reserve for the July 1, 2011 to June 30,2012 fiscal year is as follows:
Beginning Balance, July 1, 20 II Interest Eamings Ending Balance, Jnne 30, 2012
44
$704,139 474
$704,613
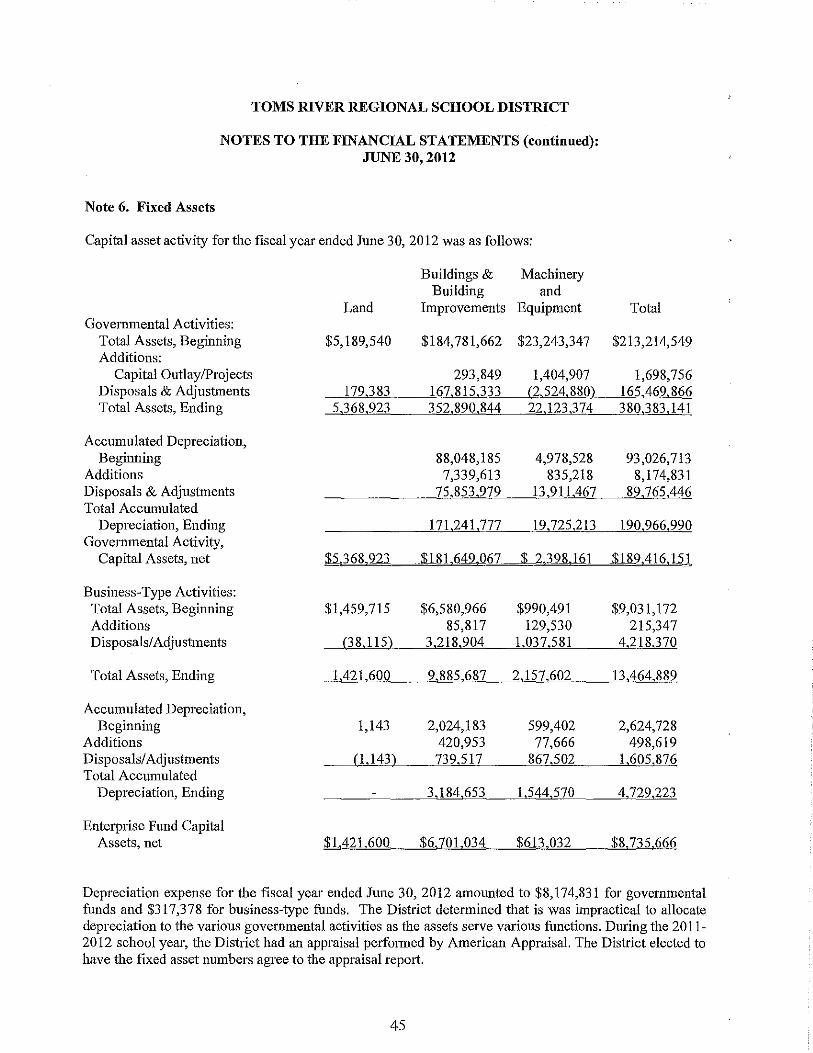
TOMS RIVER REGIONAL SCHOOL DISTRICT
NOTES TO THE FINANCIAL STATEMENTS (continned): JUNE 30, 2012
Note 6. Fixed Assets
Capital asset activity for the fiscal year ended June 30,2012 was as follows:
Buildings & Machinery Building and
Land Improvements Equipment Total Governmental Activities:
Total Assets, Beginning $5,189,540 $184,781,662 $23,243,347 $213,214,549 Additions:
CapitalOutlaylProjects 293,849 1,404,907 1,698,756 Disposals & Adjustments 179,383 167,815,333 (2,524,880} 165,469,866 Total Assets, Ending 5,368,923 352,890,844 22,123,374 380,383,141
Accumulated Depreciation, Beginning 88,048,185 4,978,528 93,026,713
Additions 7,339,613 835,218 8,174,831 Disposals & Adjnstments 75,853,979 13,911,467 89,765,446 Total Accumulated
Depreciation, Ending 171,241,777 19,725,213 190,966,990 Governmental Activity,
Capital Assets, net $5.368,923 $181.649067 $ 2.398 161 $189.416,151
Business-Type Activities: Total Assets, Beginning $1,459,715 $6,580,966 $990,491 $9,031,172 Additions 85,817 129,530 215,347 Disposals/Adjustments (38,115) 3,218,904 1,037,581 4,218.370
Total Assets, Ending 1.421,600 9,885,687 2,157,602 13.464,889
Accumulated Depreciation, Beginning 1,143 2,024,183 599,402 2,624,728
Additions 420,953 77,666 498,619 Disposals/Adjustments (1,143) 739,517 867,502 1,605,876 Total Accumulated
Depreciation, Ending 3,184,653 1,544,570 4,729,223
Enterprise Fuud Capital Assets, net .$1,421 600 $6,101 034 $613032 $8735,666
Depreciation expense for tile fiscal yea1' ended June 30, 2012 amounted to $8,174,831 for governmental funds and $317,378 for business-type funds. The District determined iliat is was impractical to allocate depreciation to the various governmental activities as the assets serve various functions. During the 2011-2012 school year, ilie District had an appraisal perfof111ed by American Appraisal. The District elected to have ilie fixed asset numbers agree to the appraisal report.
45
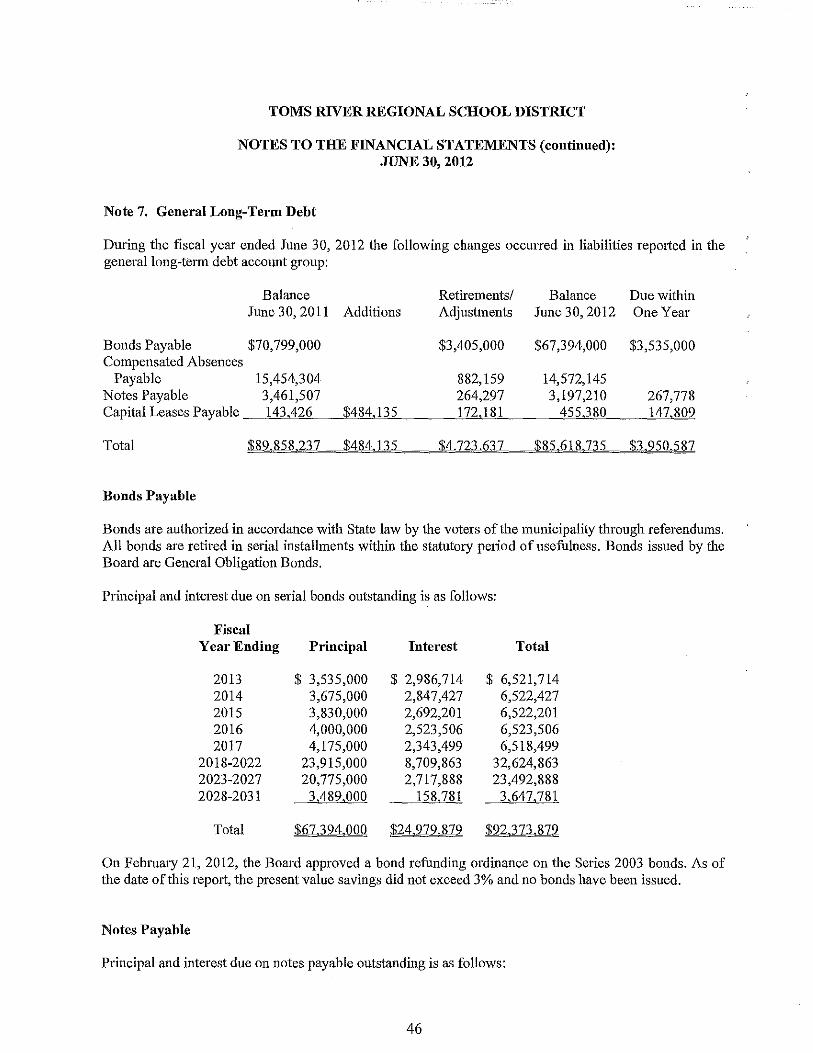
TOMS RIVER REGIONAL SCHOOL DISTRICT
NOTES TO THE FINANCIAL STATEMENTS (continned): J1JNE 30, 2012
Note 7. General Long-Term Debt
During the fiscal year ended June 30, 2012 the following changes occurred in liabilities reported in the general long-term debt account gronp:
Balance Retirements/ Balance Due within June 30, 2011 Additions Adjustments June 30, 2012 One Year
Bonds Payable $70,799,000 $3,405,000 $67,394,000 $3,535,000 Compensated Absences
Payable 15,454,304 882,159 14,572,145 Notes Payable 3,461,507 264,297 3,197,210 267,778 Capital Leases Payable 143,426 $484,135 172,181 455,380 147,809
Total $89858.237 $484.135 $4.723.637 $85618735 $3.950.587
Bonds Payable
Bonds are authorized in accordance with State law by the voters ofthe municipality throngh referendums. All bonds are retired in serial installments within the statutory pedod of nsefulness. Bonds issued by the Board are General Obligation Bonds.
Principal and interest due on serial bonds outstanding is as follows:
Fiscal Year Ending Principal Interest Total
2013 $ 3,535,000 $ 2,986,714 $ 6,521,714 2014 3,675,000 2,847,427 6,522,427 2015 3,830,000 2,692,201 6,522,201 2016 4,000,000 2,523,506 6,523,506 2017 4,175,000 2,343,499 6,518,499
2018-2022 23,915,000 8,709,863 32,624,863 2023-2027 20,775,000 2,717,888 23,492,888 2028-2031 3,489,000 158,781 3,647,781
Total $61,394 QOO $24,279,879 $92,313,812
On February 21, 2012, the Board approved a bond refunding ordinance on the Series 2003 bonds. As of the date of this repOlt, the present value savings did not exceed 3% and no bonds have been issued.
Notes Payable
Principal and interest due on notes payable outstanding is as follows:
46
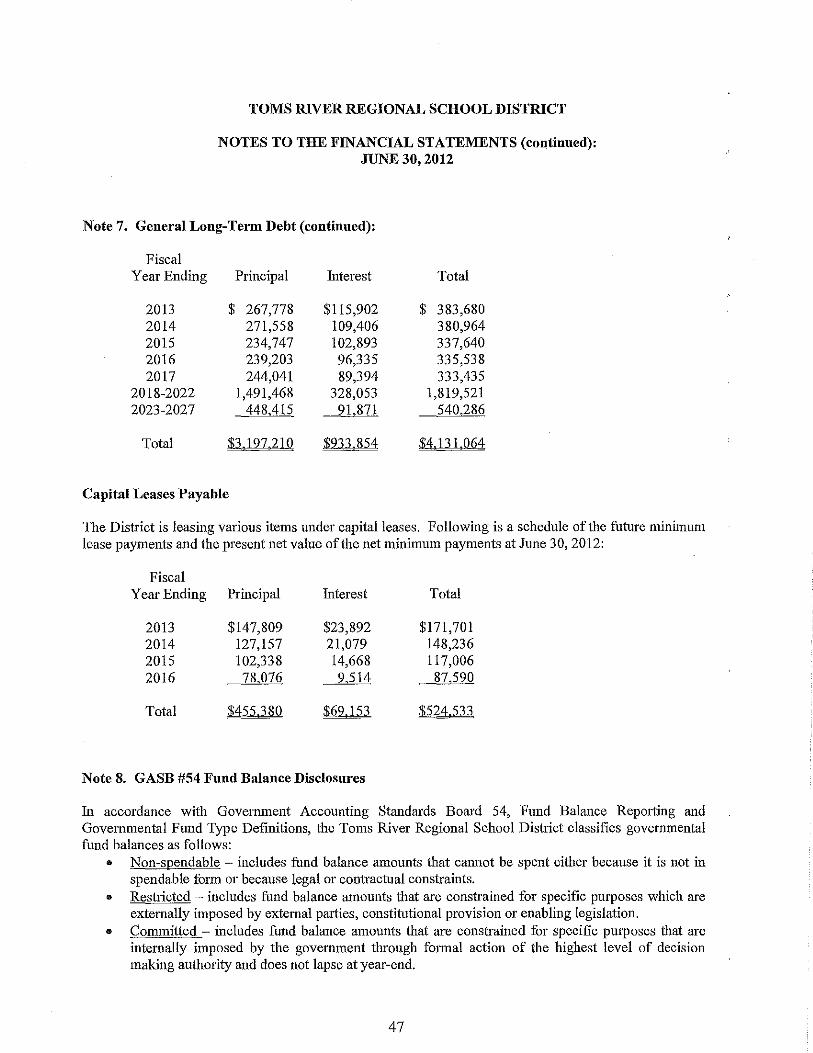
TOMS RIVER REGIONAL SCHOOL DISTRICT
NOTES TO THE FINANCIAL STATEMENTS (continued): JUNE 30, 2012
Note 7. General Long-Term Debt (continued):
Fiscal Year Ending Principal illterest Total
2013 $ 267,778 $115,902 $ 383,680 2014 271,558 109,406 380,964 2015 234,747 102,893 337,640 2016 239,203 96,335 335,538 2017 244,041 89,394 333,435
2018-2022 1,491,468 328,053 1,819,521 2023-2027 448,415 91,871 540,286
Total $3 197.210 $933854 $4.131.064
Capital Leases Payable
The District is leasing various items under capital leases. Following is a schedule of the future minimum lease payments and the present net value of the net minimum payments at June 30, 2012:
Fiscal Year Ending Principal illterest Total
2013 $147,809 $23,892 $171,701 2014 127,157 21,079 148,236 2015 102,338 14,668 117,006 2016 78.076 9.514 87,590
Total $455380 $62 153 $524533
Note 8. GASB #54 Fund Balance Disclosures
ill accordance with Government Accounting Standards Board 54, Fnnd Balance RepOliing and Governmental Fnnd Type Definitions, the Toms River Regional School District classifies governmental fund balances as follows:
• Non-spendable - includes fund balance amounts that cannot be spent either because it is not in spendable form or because legal or contractual constraints.
• Restricted - includes fund balance amounts that are constrained for specific purposes which are externally imposed by external parties, constitutional provision or enabling legislation.
• Committed - includes fund balance anlOunts that are constrained for specific purposes that are internally imposed by the government through fOlmal action of the highest level of decision making authority and does not lapse at year-end.
47
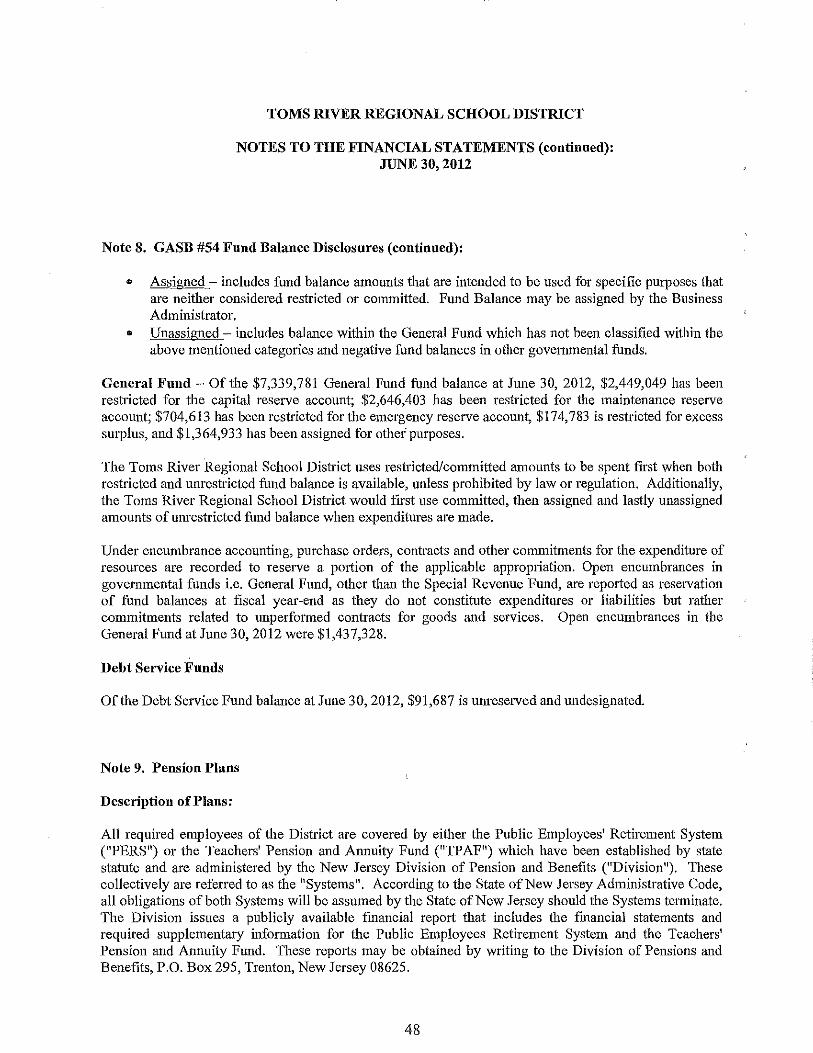
TOMS RIVER REGIONAL SCHOOL DISTRICT
NOTES TO THE FINANCIAL STATEMENTS (continned): JUNE 30, 2012
Note 8. GASB #54 Fnnd Balance Disclosures (continued):
• Assigned - inclndes fund balance amouuts that are intended to be used for specific purposes that are neither considered restricted or committed. Fund Balance may be assigned by the Business Administrator.
• Unassigned - includes balance within the General Fnnd which has not been classified within the above mentioned categories and negative fund balances in other govemmental funds.
General Fund - Of the $7,339,781 General Fund fund balance at June 30, 2012, $2,449,049 has been restricted for the capital reserve account; $2,646,403 has been restricted for the maintenance reserve account; $704,613 has been restricted for the emergency reserve account, $174,783 is restTicted for excess surplus, and $1,364,933 has been assigned for other'purposes.
The Toms River Regional School District uses restrictedlconunitted amounts to be spent first when both restricted and unrestricted fund balance is available, unless prohibited by law or regulation. Additionally, the Toms River Regional School District would fnst use committed, then assigned and lastly unassigned amounts of unrestricted flUld balance when expenditures are made.
Under encumbrance accounting, purchase orders, contracts and other commitments for the expenditure of reSOUTces are recorded to reserve a pOliion of the applicable appropriation. Open encumbrances in govemmental funds i.e. General Fund, other than the Special Revenue Fund, are repOlied as reservation of fund balances at fiscal year-end as they do not constitute expenditUTes or liabilities but rather commitments related to unperformed contracts for goods and services. Open encumbrances in the General Fund at June 30, 2012 were $1,437,328.
Debt Service Funds
Of the Debt Service Fund balance at June 30, 2012, $91,687 is umeserved and undesignated,
Note 9. Pensiou Plans
Description of Plans:
All required employees of the District are covered by either the Public Employees' Retirement System ("PERS") or the Teachers' Pension and Annuity Fund ("TPAF") which have been established by state statute and are administered by the New Jersey Division of Pension and Benefits ("Division"). These collectively are referred to as the "Systems". According to the State of New Jersey Administrative Code, all obligations of both Systems will be assumed by the State of New Jersey should the Systems telminate. The Division issues a publicly available fmancial report that iacludes the financial statements and required supplementary information for the Public Employees Retirement System and the Teachers' Pension and Annuity Fund. These repOlis may be obtained by writing to the Division of Pensions and Benefits, P.O. Box 295, Trenton, New Jersey 08625.
48
TOMS RIVER REGIONAL SCHOOL DISTRICT
NOTES TO THE FINANCIAL STATEMENTS (continued): JUNE 30, 2012
Note 9. Pension Plans (continned):
Teachers' Pension and Annuity Fund (TP AF)
The Teachers' Pension and Annuity Fnnd was established in Jauuary 1955 under the provlSlons of N.J.S.A. 18A:66 to provide retirement benefits, death, disability and meclical benefits to certain qualified members. The Teachers' Pension and Annuity Fund is considered a cost-sharing multiple-employer plan with a special funding sitnation, as under current statnte, all employer contributions are made by the State of New Jersey on behalf of the District and the System's other related non-contributing employers. Membership is mandatory for substantially all teachers and members of the professional staff certified by the State Board of Examiners, and employees of the Department of Education who have titles that are unclassified, professional and certified. The Public Employees' Retirement System was established in January, 1955 under the provisions of N.J.S.A. 43: 15A to provide retirement benefits, death, disability and medical benefits to cmtain qualified members. The Public Employees' Retirement System is a cost sharing multiple-employer plan. Membership is mandatory for substantially all full-time employees of the State of New Jersey or any county, municipality, school district, or public agency, provided the employee is not required to be a member of another state-administered retirement system or other state or local jurisdiction.
Vesting and Benefit Provisions
The vesting and benefit provisions for PERS are set by NJ.S.A. 43:15A and 43:3B, and N.J.S.A. 18A:6C for TP AF. All benefits vest after eight to ten years of service except for medical benefits that vest after 25 years of service. Retirement benefits for age and service are available at age 60 and are generally determined to be 1160 of the final average salary for each year of service credit, as defined. Final average salary equals the average salary for the final three years of service prior to retirement (or highest three years' compensation if other than the final three years). Members may seek early retirement after achieving 25 years of service or they may elect deferred retirement after achieving eight to ten years of service in which case benefits would begin the first day of the month after the member attains normal retirement age. The TP AF and PERS provide for specified medical benefits for members who retire after achieving 25 years of qualified service, as defllled, or under the disability provisions of the System. Members are always fully vested for their own contributions and, after three years of service credit, become vested for 2% of related interest earned on contributions. In the case of death before retirement, members' beneficiaries are entitled to full interest credited to the members' accounts. They may elect deferred retirement after achieving eight to ten years of service in which case benefits would begin the first day of the month after the memher attains normal retirement age. The TPAF and PERS provide for specified medical henefits for members who retire after achieving 25. years of qualified service, as defined, or under the disability provisions ofthe System.
Significant Legislation
During the fiscal year ended June 30, 1997, legislation was enacted authorizing tl,e New Jersey Economic Development Authority (the "Authority") to issue bonds, notes or other obligations for the purpose of financing, in full or in part, the State of New Jersey's portion of the unfunded accrued liability under the State of New Jersey retirement systems. Additional legislation enacted during the fiscal year ended June
49
TOMS RIVER REGIONAL SCHOOL DISTRICT
NOTES TO THE FINANCIAL STATEMENTS (continned): JUNE 30, 2012
Note 9. Pension Plans (continued):
30, 1997 (Chapter 115, P.L. 1997), the asset valuation method was changed from market related value to full-market value. This legislation also contains a provision to reduce the employee contribution rates under TPAP and PERS by % of 1 percent to 4.5 percent for calendar years 1998 and 1999, and to allow for a similar reduction in the employee's rate after calendar year 1999, providing excess valuation assets are available. The legislation also provided that the District's normal contribntions to the Pund might be rednced based on the revaluation of assets. Due to the recognition of the bond proceeds and the change in asset valuation method as a result of the enactment of Chapters 114 and 115, all unfunded accrued liabilities were eliminated, except for the unfunded liability for local early retirement incentive benefits, accordingly, the pension costs for TP AP and PERS were reduced.
Contribution Requirements
The contribution policy is set by N.J.S.A. 43:15A, Chapter 62, P.L. of 1994, Chapter 115, P.L. of 1997 and N.J.S.A. 18:66, and requires contributions by active members and contributing employers. Plan member and employer contributions may be amended by State of New Jersey legislation. TPAP and PERS provide for employee contributions of 5% of employees' ammal compensation, as defined. Employers are required to contribute at an actuarially detennined rate in both TP AF and PERS. The actuarially determined contribution includes funding for cost-of-living adjustments, noncontributOlY death benefits, and post-retirement medical premiums. Under current statute the Board is a non-contributing employer of the TP AF.
Three-Year Trend Information for PERS Annual Percentage Net
Year Pension ofAPC Pension Funding Cost (APC) Contributed Obligation
6/30/12 $3,375,594 100% $ -0-6/30/11 3,193,445 100% -0-6/30/10 2,485,760 100% -0-
Three-Year Trend Information for TP AF (paid on behalf of the District) Annual Percentage Net
Year Pension of APC Pension Fnnding Cost (APC) Contributed Obligation
6/30/12 6/30/11 6130/10
$8,577,970 6,045,900 5,872,675
100% 100% 100%
$ -0--0--0-
During the fiscal year ended June 30,2012, the State of New Jersey contributed $8,577,970 to the TPAP for normal and post-retirement medical benefits on behalf of the Board. Also, in accordance with N.J.S.A. 18A:66-66 the State of New Jersey reimbursed the Board $6,347,353 during the fiscal year ended June 30, 2012 for the employer's share of social security contributions for TPAP members as
50
TOMS RIVER REGIONAL SCHOOL DISTRICT
NOTES TO THE FINANCIAL STATEMENTS (continued): JUNE 30, 2012
Note 9. Pension Plans (continued):
calculated on their base salaries. These amounts have been included in the basic financial statements, and the combining and individual fund and account group statements and schedules as revenues and expenditures in accordance with GASB 34.
Note 10. Post-Retirement Benefits
Chapter 384 of Public Laws 1987 and Chapter 6 of Public Laws 1990 required Teachers' Pensions and Annuity Fund (TP AF) and the Public Employees' Retirement System (PERS), respectively, to fund postretirement medical benefits for those State Employees who retire after accumulating 25 years of credited service or on a disability retirement. P.L. 2007, c.I03 amended the law to eliminate the funding of postretirement medical benefits through the TPAF and PERS. It created separate funds outside of the pension plans for the funding and payment of post-retirement medical benefits for retired State employees and retired educational employees. As of June 30, 2011, there were 93,323 retirees eligible for postretirement medical benefits. The cost of these benefits is funded through contributions by the State in accordance with P.L. 1994, c.62. Funding of post-retirement medical premiums changed from a prefunding basis to a pay-as-you-go basis beginning in Fiscal Year 1994.
The State is also responsible for the cost attribntable to P.L. 1992, c.126, which provides free health benefits to members of PERS and the Alternate Benefit Program who retired from a bom'd of education or county college with 25 years of service. The State paid $144 million toward Chapter 126 benefits for 15,709 eligible retired members in Fiscal Year 2011.
Note 11. Deferred Compensation
The Board offers its employees a choice of various deferred compensation plans created in accordance with Internal Revenue Service Code Sectiou 403(b). The plans, which me administered by the entities listed below, permits participants to defer a pOltion of their salary until future years. Amounts defened under the plans m'e not available to employees until termination, retirement, death or unforeseen emergency. The plan administrators are as follows:
AIGNalic Legend GroupfNEA Progrmn Siracusa Benefits Progrmn Asset Management Services Group Lincoln Investment Planning Tom Seeley Agency
51
AXA Equitable McGuckin Financial Travelers Citistreet Discovery Financial MetLife
TOMS RIVER REGIONAL SCHOOL DISTRICT
NOTES TO THE FINANCIAL STATEMENTS (continned): JUNE 30, 2012
Note 12. Risk Management
The District is exposed to various risks of loss related to torts; theft of, damage to, and destruction of assets; errors and omissions; injuries to employees; and natmal disasters.
New Jersey Unemployment Compensation Insurance
The District has elected to fund its New Jersey Unemployment Compensation Insurance under the "Benefit Reimbursement Method". Under this plan, the District is required to reimburse the New Jersey
Unemployment Trust Fund for benefits paid to its former employees and charged to its account with the State. The District is billed quarterly for amounts due to the State. The following is a summary of District contributions, employee contributions, reimbnrsements to the State for benefits paid and the ending balance of the District's expendable trust fund for the CUlTent and previous two years:
Fiscal Year
2011-2012 2010-2011 2009-2010
Employee Contributions
$377,700 342,812 393,305
Property and Liability Insurance
Interest Eamed
$1,824 5,923
Amount Reimbursed
$360,342 334,102 371,046
Ending Balance
$5,331,468 5,312,286 5,297,653
The District maintains commercial insurance coverage for property, liability, student accident, and smety bonds. A complete schedule of insurance coverage can be fOUlld in the Statistical Section of this Comprehensive Annual Financial Report.
Note 13. Contingent Liabilities
Litigation
The Board is involved in several claims and lawsuits incidental to its operations. In the opinion of the administration and legal counsel, the ultimate resolution of these matters will not have a material adverse effect on the financial position of the District.
On October 21, 20 I 0, Superintendent of Schools, Michael J. Ritacco, tendered his letter of retirement. On the same date he was indicted by the U.S. Department of Justice. On April 5, 2012, Michael J. Ritacco plead guilty to mail fraud and tax evasion. Inevitably the indictment included 27 counts of bribery and corruption chal'ges. The Board of Education has requested the district administration and legal counsel to take the appropriate steps required to recover district funds should a claim or loss be identified. Unused sick days and vacation time accrued under Mr. Ritacco's contract totaled $63,125 and is being held at the directiou of the board, pending adjudication of such charges. All applicable insmance cal1'iers have been notified in cOmlection with a potential claim. No liability has been recorded in regm'ds to this matter as the potential loss cannot be ascertained at this time.
52
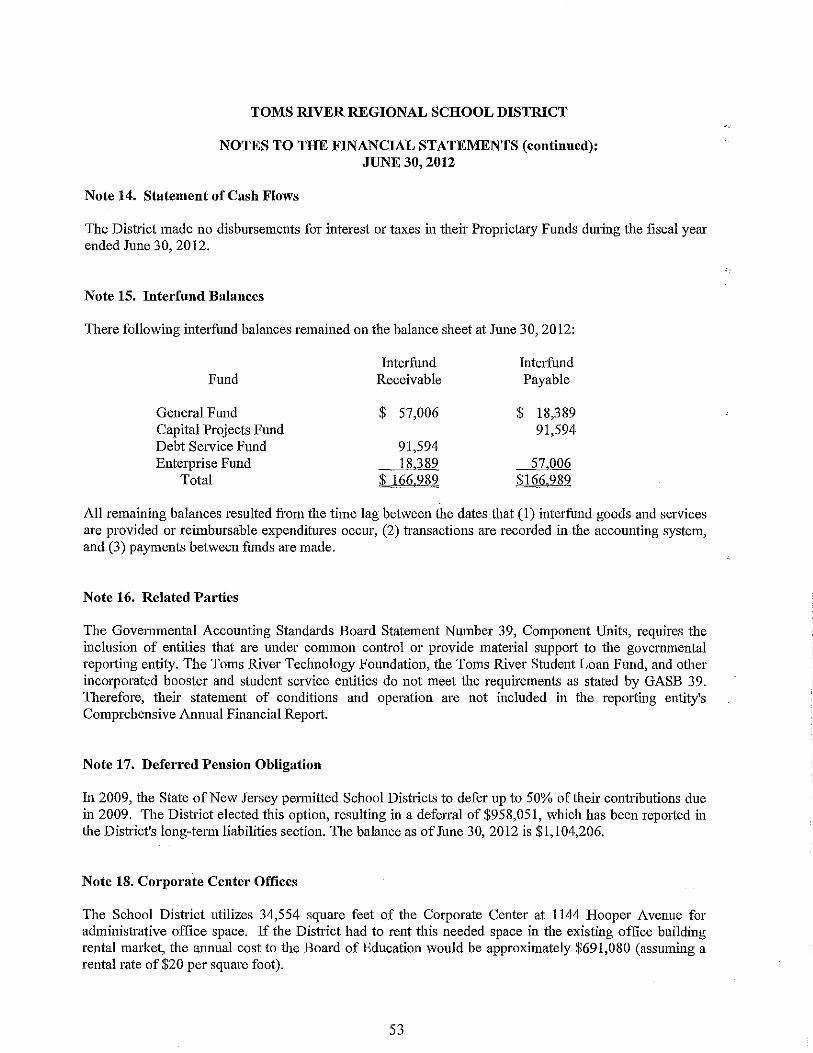
TOMS RIVER REGIONAL SCHOOL DISTRICT
NOTES TO THE FINANCIAL STATEMENTS (continned): JUNE 30, 2012
Note 14. Statement of Cash Flows
The District made no disbursements for interest or taxes in their Proprietary Funds dm-ing the fiscal year ended June 30, 2012.
Note 15. Interfund Balances
111ere following interfuud balances remained on the balance sheet at June 30, 2012:
Fund
General Fund Capital Projects Fund Debt Service Fund Enterprise Fund
Total
Interfuud Receivable
$ 57,006
91,594 18,389
$ 166.989
Interfund Payable
$ 18,389 91,594
57,006 $166.989
All remaining balances resulted fi'om the time lag between the dates that (1) interfund goods and services m'e provided or reimbursable expenditures OCClli", (2) transactions are recorded in the accounting system, and (3) payments between funds are made.
Note 16. Related Parties
The Governmental Accounting Standards Board Statement Number 39, Component Units, requires the inclusion of entities that are under common control or provide material support to the governmental reporting entity. The Toms River Technology Foundation, the Toms River Student Loan Fund, and other incorporated booster and student service entities do not meet the requirements as stated by GASB 39. Therefore, their statement of conditions and operation m'e not included in the reporting entity's Comprehensive Annual Financial Report.
Note 17. Deferred Pension Obligation
In 2009, the State of New Jersey permitted School Districts to defer np to 50% of their contributions due in 2009. The District elected this option, resulting in a deferral of $958,051, which has been reported in the District's long-telnt liabilities section. The balance as of June 30, 2012 is $1,104,206.
Note 18. Corporate Center Offices
The School District utilizes 34,554 square feet of the Corporate Center at 1144 Hooper Avenue for administrative office space. If the District had to rent this needed space in the existing office building rental market, the annual cost to the Board of Education would be approximately $691,080 (assuming a rental rate of $20 per square foot).
53
TOMS RIVER REGIONAL SCHOOL DISTRICT
NOTES TO THE FINANCIAL STATEMENTS (continued): JUNE 30, 2012
Note 19. Calculation of Excess Surplus
In accordance with N.J.S.A.18A:7F-7, as amended by P.L. 2004, c.73 (SI701), the designation for Reserved Fund Balance - Excess Surplus is a required calculation pursuant to the New Jersey Comprehensive Educational Improvement and Fiuancing Act of 1996 (CEIFA). New Jersey school districts are required to reserve General Fund fund balance at the fiscal year-end of June 30 ifthey did not appropriate a required minimum amount as budgeted fund balance in their subsequent years' budget. The District has excess fund balance of $174,783 at June 30, 2012.
Note 20. Prior Period Adjustment
The District had a fixed asset appraisal performed by American Appraisal as of June 30, 2012. The District elected to have the fixed asset numbers agree to the appraisal report. The fixed asset balances were adjusted to agree with the historical cost as determined by the appraisal. The cumulative effect of these adjustments has resulted in a prior period adjustment of $75,769,950 for Governmental Activities. The cumulative effect of these adjustments has resulted in a prior period adjustment of $2,431,254 for Business-Type Activities.
54

REQUIRED SUPPLEMENTARY INFORMATION - PART II

C. Budgetary Comparison Schedules

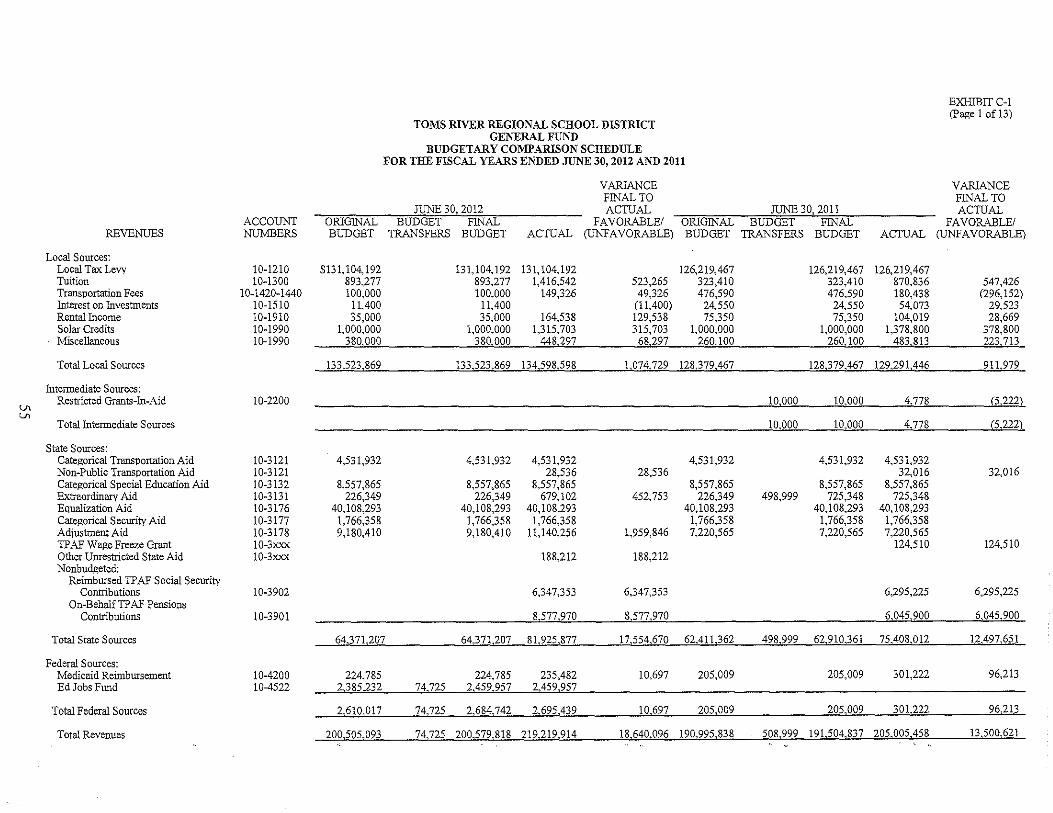
V> V>
REVENUES
Local Sources: Local Tax Levy Tuition Transportation Fees Interest on Investments Rental Income Solar Credits Miscellaneous
Total Local Sources
Intermediate Sources: Restricted Grants-In-Aid
Total Intennediate Sources
State Sources: Categorical Transportation Aid Non-Public Transportation Aid Categorical Special Education Aid Extraordinary Aid Equalization Aid Categorical Security Aid Adiustment Aid TP AF Wage Freeze Grant Other Unrestricted State Aid Nonbudgeted:
Reimbursed TP AF Social Security Contributions
On-BehalfTPAF Pensions Contributions
Total State Sources
Federal Sources: Medicaid Reimbursement Ed Jobs Fund
Total Federal Sources
Total Revenues
ACCOUNT NUMBERS
10-1210 10-1300
10-1420-1440 10-1510 10-1910 10-1990 10-1990
10-2200
10-3121 10-3121 10-3132 10-3131 10-3176 10-3177 10-3178 10-3xxx 10-3xxx
10-3902
10-3901
10-4200 10-4522
TOMS RIVER REGIONAL SCHOOL DISTRICT GENERAL FUND
BUDGETARY COMPARISON SCHEDULE
EXHIBIT C-I (page I of 13)
FOR THE FISCAL YEARS ENDED.TUNE 30, 2012 AND 2011
ORIGINAL BUDGET
JUNE 30, 2012 BUDGET FINAL
TRANSFERS BUDGET ACTUAL
VARIANCE FINAL TO ACTUAL
FAVORABLE! (UNFAVORABLE)
JUNE 30,2011 ORIGINAL BUDGET FINAL BUDGET TRANSFERS BUDGET ACTUAL
VARIANCE FINAL TO ACTUAL
FAVORABLE! (UNFAVORABLE)
$131,104,192 131,104,192 131,104,192 126,219,467 126,219,467 126,219,467 893,277 893,277 1,416,542 523,265 323,410 323,410 870,836 547,426 100,000 100,000 149,326 49,326 476,590 476,590 180,438 (296,152)
11,400 11,400 (! 1,400) 24,550 24,550 54,073 29,523 35,000 35,000 164,538 129,538 75,350 75,350 104,019 28,669
1,000,000 1,000,000 1,315,703 315,703 1,000,000 1,000,000 1,378,800 378,800 380,000 380,000 448,297 68,297 260,100 260,100 483,813 223,713
133,523,869 133,523,869 134598,598 1,074,729 128,379,467 128,379,467 129,291,446 911,979
10,000 10,000 4,778 (5,222)
10,000 10,000 4,778 (5,222)
4,531,932 4,531,932 4,531,932 4,531,932 4,531,932 4,531,932 28,536 28,536 32,016 32,016
8,557,865 8,557,865 8,557,865 8,557,865 8,557,865 8,557,865 226,349 226,349 679,102 452,753 226,349 498,999 725,348 725,348
40,108,293 40,108,293 40,108,293 40,108,293 40,108,293 40,108,293 1,766,358 1,766,358 1,766,358 1,766,358 1,766,358 1,766,358 9,180,410 9,180,410 11,140,256 1,959,846 7,220,565 7,220,565 7,220,565
124,510 124,510 188,212 188,212
6,347,353 6,347,353 6,295,225 6,295,225
8,577,970 8,577,970 6,045,900 6,045,900
64,371,207 64,371,207 81,925,877 17,554,670 62,411,362 498,999 62,910,361 75408,012 12497,651
224,785 224,785 235,482 10,697 205,009 205,009 301,222 96,213 2,385,232 74,725 2,459,957 2,459,957
2,610,017 74,725 2,684,742 2,695,439 10,697 205,009 205,009 301,222 96,213
200,505,093 74,725 200,579,818 219,219,914 18,640,096 190,995,838 508,999 191,504,837 205,005,458 13,500,621
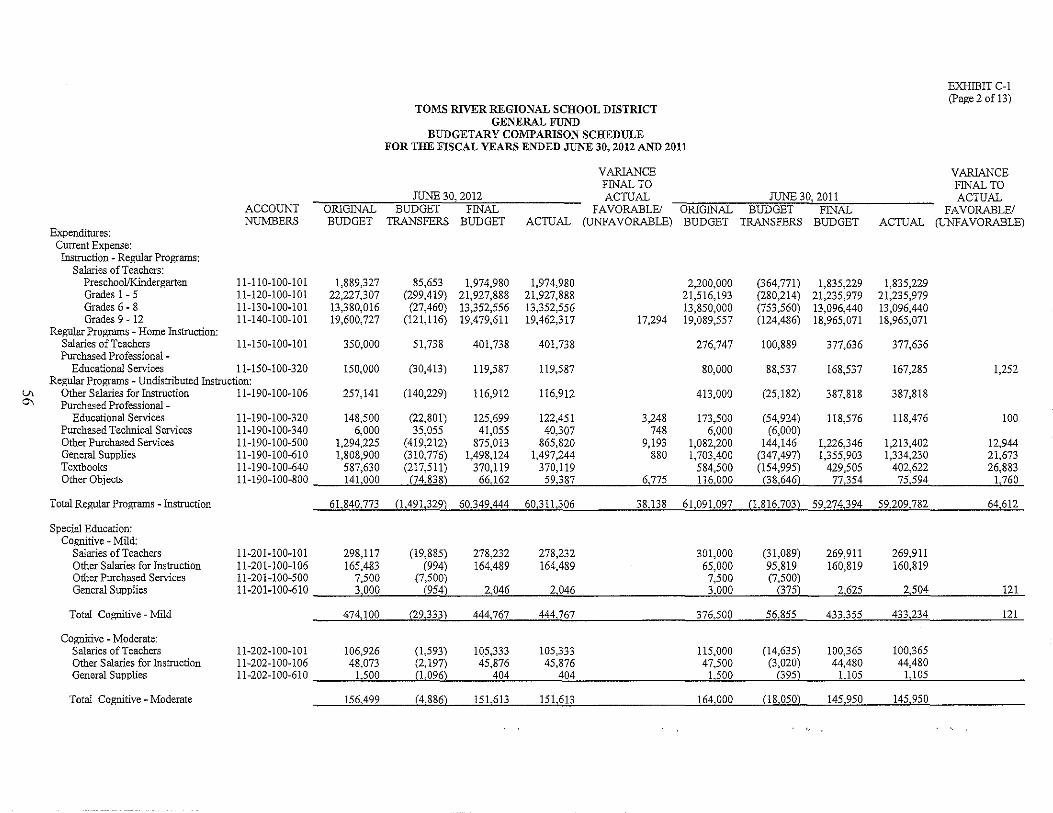
lh 0\
Expenditures: Current Expense: Instruction - Regular Programs:
Salaries of Teachers: Preschoo1l.Kindergarten Grades 1- 5 Grades 6 - 8 Grades 9 -12
Regular Programs - Home Instruction: Salaries of Teachers Purchased Professional -
Educational Services
ACCOUNT NUMBERS
11-110-100-101 11-120-100-101 11-130-100-101 11-140-100-101
11-150-100-101
11-150-100-320
ORIGINAL BUDGET
1,889,327 22,227,307 13,380,016 19,600,727
350,000
150,000
TOMS RIVER REGIONAL SCHOOL DISTRICT GENERAL FUND
BUDGETARY COMPARISON SCHEDULE FOR THE FISCAL YEARS ENDED JUNE 30, 2012 AND 2011
JUNE 30, 2012 BUDGET FINAL
TRANSFERS BUDGET ACTUAL
85,653 1,974,980 1,974,980 (299,419) 21,927,888 21,927,888
(27,460) 13,352,556 13,352,556 (121,116) 19,479,611 19,462,317
51,738 401,738 401,738
(30,413) 119,587 119,587
VARIANCE FINAL TO ACTUAL
FAVORABLE/ (UNFAVORABLE)
17,294
JUNE 30, 2011 ORIGINAL BUDGET FINAL BUDGET TRANSFERS BUDGET
2,200,000 (364,771) 1,835,229 21,516,193 (280,214) 21,235,979 13,850,000 (753,560) 13,096,440 19,089,557 (124,486) 18,965,071
276,747 100,889 377,636
80,000 88,537 168,537
ACTUAL
1,835,229 21,235,979 13,096,440 18,965,071
377,636
167,285
EXHIBIT C-l (page 2 of 13)
VARIANCE FINAL TO ACTUAL
FAVORABLE/ (UNFAVORABLE)
1,252 Regular Programs - Undistributed Instruction:
Other Salaries for Instruction Purchased Professional -
Educational Services Purchased Technical Services Other Purchased Services General Supplies Textbooks Other Objects
Total Regular Programs - Instruction
Special Education: Cognitive - Mild:
Salaries of Teachers Other Salaries for Instruction Other Purchased Services General Supplies
Total Cognitive - Mild
Cognitive - Moderate: Salaries of Teachers Other Salaries for Instruction General Supplies
Total Cognitive - Moderate
11-190-100-106 257,141 (140,229) 116,912 116,912 413,000 (25,182) 387,818 387,818
11-190-100-320 148,500 (22,801) 125,699 122,451 3,248 173,500 (54,924) 118,576 118,476 100 11-190-100-340 6,000 35,055 41,055 40,307 748 6,000 (6,000) 11-190-100-500 1,294,225 (419,212) 875,013 865,820 9,193 1,082,200 144,146 1,226,346 1,213,402 12,944 11-190-100-610 1,808,900 (310,776) 1,498,124 1,497,244 880 1,703,400 (347,497) 1,355,903 1,334,230 21,673 11-190-100-640 587,630 (217,511) 370,119 370,119 584,500 (154,995) 429,505 402,622 26,883 11-190-100-800 141,000 (J4M8) 66,162 59,387 6,775 116,000 (38,646) 77,354 75,594 1,760
61,840,773 0,491,329) 60,349,444 60,311,306 38,138 61,091,097 (1,816,703) 59,274,394 59,209,782 64,612
11-201-100-101 298,117 (19,885) 278,232 278,232 301,000 (31,089) 269,911 269,911 11-201-100-106 165,483 (994) 164,489 164,489 65,000 95,819 160,819 160,819 11-201-100-500 7,500 (7,500) 7,500 (7,500) 11-201-100-610 3,000 (954) 2,046 2,046 3,000 (375) 2,625 2,504 121
474,100 (29,333) 444,767 444,767 376,500 56,855 433,355 433,234 121
11-202-100-101 106,926 (1,593) 105,333 105,333 115,000 (14,635) 100,365 100,365 11-202-100-106 48,073 (2,197) 45,876 45,876 47,500 (3,020) 44,480 44,480 11-202-100-610 1,500 (1,096) 404 404 1,500 (395) 1,105 1,105
156,499 (4,886) 151,613 151,613 164,000 (18J QNL 145,950 145,950
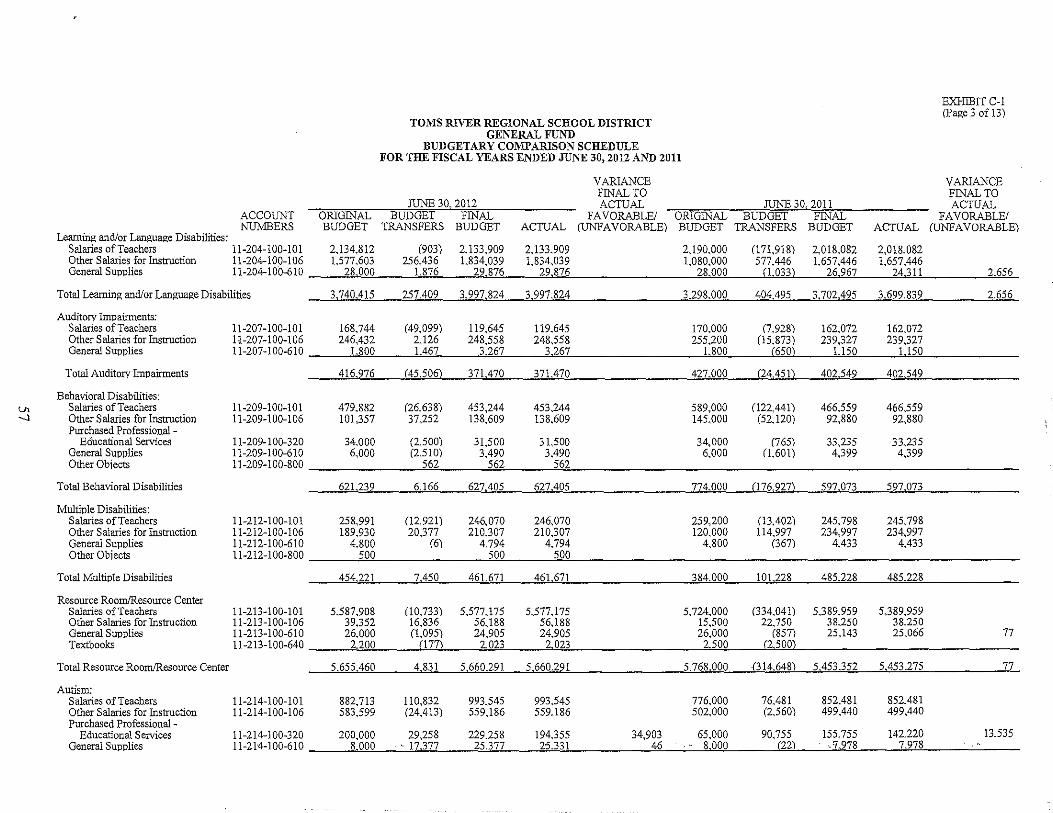
lh ----.l
Learning and/or Language Disabilities:
ACCOUNT NUMBERS
ORIGINAL BUDGET
TOMS RIVER REGIONAL SCHOOL DISTRICT GENERAL FUND
BUDGETARYCOMFARISONSCHEDULE FOR THE FISCAL YEARS ENDED JUNE 30, 2012 AND 2011
JUNE 30, 2012 BUDGET FINAL
TRANSFERS BUDGET ACTUAL
VARIANCE FINAL TO ACTUAL
FAVORABLEI (UNFAVORABLE)
JUNE 30, 2011 ORIGINAL BUDGET FINAL BUDGET TRANSFERS BUDGET ACTUAL
Salaries ofTeachers 11-204-100-101 2,134,812 (903) 2,133,909 2,133,909 2,190,000 (171,918) 2,018,082 2,018,082 Other Salaries for Instruction 11-204-100-106 1,577,603 256,436 1,834,039 1,834,039 1,080,000 577,446 1,657,446 1,657,446
EXHIBIT C-l (page 3 of 13)
VARIANCE FINAL TO ACTUAL
FAVORABLEI (UNFAVORABLE)
General Supplies 11-204-100-610 28,000 1876 29,876 29,876 28000 (1,033) 26967 24,311 2,656
Total Learning and/or Language Disabilities 3,740,415 257,409 3,997,824 3,997,824 3.298,000 404495 3,702,495 3,699,839 2,656
Auditorv Impairments: Salaries of Teachers Other Salaries for Instruction General Supplies
Total Auditory Impairments
Behavioral Disabilities: Salaries of Teachers Other Salaries for Instruction Purchased Professional-
Educational Services General Supplies Other Objects
Total Behavioral Disabilities
Multiple Disabilities: Salaries of Teachers Other Salaries for Instruction General Supplies Other Objects
Total Multiple Disabilities
Resource RoomfResource Center Salaries of Teachers Other Salaries for Instruction General Supplies Textbooks
Total Resource RoornJResource Center
Autism: Salaries of Teachers Other Salaries for Instruction Purchased Professional-
Educational Services General Supplies
11-207-100-101 168,744 (49,099) 119,645 119,645 170,000 (7,928) 162,072 162,072 11-207-100-106 246,432 2,126 248,558 248,558 255,200 (15,873) 239,327 239,327 11-207-100-610 1,800 1.467 3.267 3,267 1,800 (650) U50 U50
416,976 (45,500) 37\,470 371.470 427,000 (24,451) 402,549
11-209-100-101 479,882 (26,638) 453,244 453,244 11-209-100-106 101,357 37,252 138,609 138,609
11-209-100-320 34,000 (2,500) 31,500 31,500 11-209-100-610 6,000 (2,510) 3,490 3,490 11-209-100-800 562 562 562
589,000 145,000
34,000 6,000
(122,441) (52,120)
(765) (1,601)
466,559 92,880
33,235 4,399
402,549
466,559 92,880
33,235 4,399
621,239 6,166 627.405 627.405 774,000 (176,9271 597,073 597,073
11-212-100-101 258,991 (12,921) 246,070 246,070 11-212-100-106 189,930 20,377 210,307 210,307 11-212-100-610 4,800 (6) 4,794 4,794 11-212-100-800 500 500 500
259,200 120,000
4,800
(13,402) 114,997
(367)
245,798 234,997
4,433
245,798 234,997
4,433
454,221 7.450 461.671 461.671 384,000 101.228 485,228 485,228
11-213-100-101 5,587,908 (10,733) 5,577,175 5,577,175 5,724,000 (334,041) 11-213-100-106 39,352 16,836 56,188 56,188 15,500 22,750 11-213-100-610 26,000 (1,095) 24,905 24,905 26,000 (857) 11-213-100-640 2,200 (177) 2,023 2,023 2,500 (2,500)
5,389,959 38,250 25,143
5,389,959 38,250 25,066
5,655,460 4,831 5,660291 _, 5,660,291 _5,7<i1hQQ.0 _---.fll4,648) 5453352 5,453,275
11-214-100-101 11-214-100-106
882,713 583,599
110,832 (24,413)
993,545 559,186
993,545 559,186
776,000 502,000
76,481 (2,560)
852,481 499,440
852,481 499,440
77
77
11-214-100-320 11-214-100-610
200,000 29,258 229,258 194,355 34,903 65,000 90,755 155,755 142,220 13,535 8000 '. 17377 25,377 25331 46 8,000 (22) ·,7,978 7978
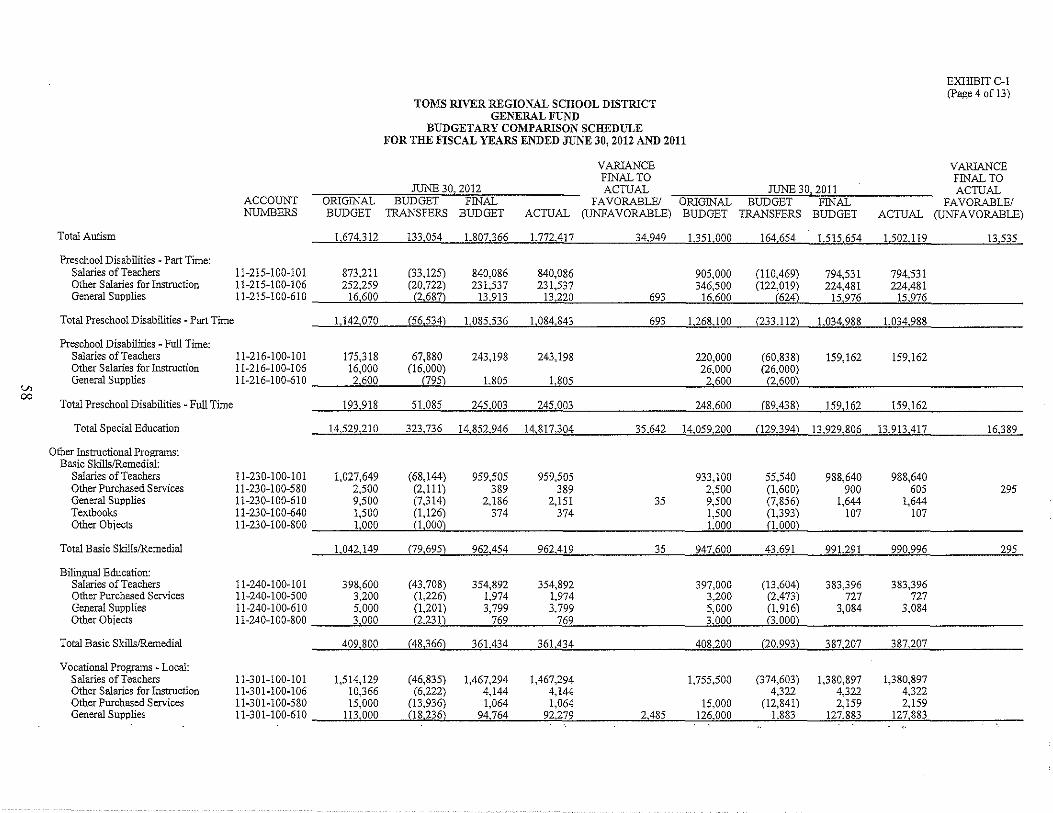
V> 00
Total Autism
Preschool Disabilities - Part Time: Salaries of Teachers Other Salaries for Instruction General Supplies
Total Preschool Disabilities - Part Time
Preschool Disabilities - Full Time: Salaries of Teachers Other Salaries for Instruction General Supplies
Total Preschool Disabilities - Full Time
Total Special Education
Other Instructional Programs: Basic SkillslRemedial:
Salaries of Teachers Other Purchased Services General Supplies Textbooks Other Objects
Total Basic SkillsJRemedial
Bilingual Education: Salaries of Teachers Other Purchased Services General Supplies Other Objects
Total Basic SkillsJRemedial
Vocational Programs - Local: Salaries of Teachers Other Salaries for Instruction Other Purchased Services General Supplies
ACCOUNT NUMBERS
ORIGINAL BUDGET
TOMS RIVER REGIONAL SCHOOL DISTRICT GEJ\'ERAL FUND
BUDGETARY COMPARISON SCHEDULE FOR THE FISCAL YEARS ENDED JUNE 30, 2012 AND 2011
JUNE 30,2012 BUDGET FINAL
TRANSFERS BUDGET ACTUAL
VARlANCE FINAL TO ACTUAL
FAVORABLE/ (UNFAVORABLE)
JUNE 30, 2011 ORIGINAL BUDGET FINAL BUDGET TRANSFERS BUDGET ACTUAL
EXHIBIT C-l (page 4 of 13)
VARlANCE FINAL TO ACTUAL
FAVORABLE/ (UNFAVORABLE)
1,674,312 133,054 1,807.366 1,772,417 34,949 1,351,000 164,654 1,515,654 1,502,119 13,535
11-215-100-101 11-215-100-106 11-215-100-610
873,211 (33,125) 840,086 840,086 905,000 (110,469) 794,531 794,531 252,259 (20,722) 231,537 231,537 346,500 (122,019) 224,481 224,481
16,600 (2,687) 13,913 13,220 693 16,600 (624) 15,976 15,976
1,142,070 (56,534) 1,085536 1,084,843 691_1,268,100 (233,112) 1,034,988 1,034,988
11-216-100-101 175,318 67,880 243,198 243,198 220,000 (60,838) 159,162 159,162 11-216-100-106 16,000 (16,000) 26,000 (26,000) 11-216-100-610 2,600 (795) 1,805 1,805 2,600 (2,600)
193,918 51~ ,_~45,003 245,003",,_ 248,600 (89,438) 159,162 159,162
14,529,210 323,736 14,852,946 14,817,304 35,642 14,059,200 (129,394) 13,929,806 13,913,417 16,389
11-230-100-101 1,027,649 (68,144) 959,505 959,505 933,100 55,540 11-230-100-580 2,500 (2,111) 389 389 2,500 (1,600) 11-230-100-610 9,500 (7,314) 2,186 2,151 35 9,500 (7,856) 11-230-100-640 1,500 (1,126) 374 374 1,500 (1,393) 11-230-100-800 1,000 (1,000) 1,000 (1,000)
988,640 900
1,644 107
988,640 605
1,644 107
295
1,042,149 (79,695) 962,454 962,419 35 947,600 43,691 991,291 990,996 295
11-240-100-101 398,600 (43,708) 354,892 354,892 397,000 (13,604) 11-240-100-500 3,200 (1,226) 1,974 1,974 3,200 (2,473) 11-240-100-610 5,000 (1,201) 3,799 3,799 5,000 (1,916) 11-240-100-800 3,000 (2,231) 769 769 3,000 (3,000)
383,396 727
3,084
383,396 727
3,084
409,800 (48,366) 361,434 361,434 408,200 (20,993) 387,207 387,207
11-301-100-101 1,514,129 (46,835) 1,467,294 1,467,294 1,755,500 (374,603) 1,380,897 1,380,897 11-301-100-106 10,366 (6,222) 4,144 4,144 4,322 4,322 4,322 11-301-100-580 15,000 (13,936) 1,064 1,064 15,000 (12,841) 2,159 2,159 11-301-100-610 113,000 (18,236) 94,764 92,279 2,485 126,000 1,883 127,883 127,883
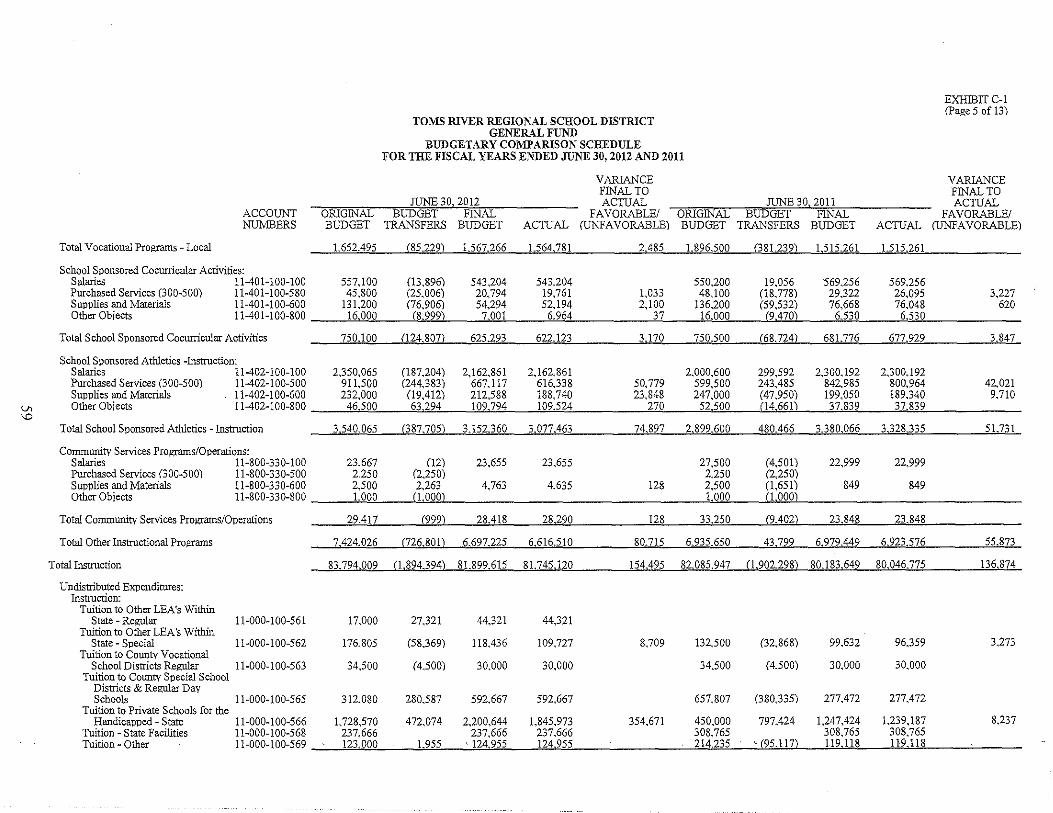
V> \0
Total Vocational Programs - Local
ACCOUNT NUMBERS
School Sponsored Cocurricular Activities: Salaries 11-401-100-100 Purchased Services (300-500) 11-401-100-580 Supplies and Materials 11-401-100-600 Other Obiects 11-401-100-800
Total School Sponsored Cocurricular Activities
School Sponsored Athletics -Instruction:
OIUGINAL BUDGET
1.652.495
TOMS RIVER REGIONAL SCHOOL DISTRICT GENERAL FUND
BUDGETARY COMPARISON SCHEDULE FOR THE FISCAL YEARS ENDED JUNE 30, 2012 AND 2011
JUNE 30, 2012 BUDGET FINAL
TRANSFERS BUDGET ACTUAL
VARIANCE FINAL TO ACTUAL
FAVORABLE/ (UNFAVORABLE)
JUNE 30, 2011 ORIGINAL BUDGET FINAL BUDGET TRANSFERS BUDGET ACTUAL
(85229) 1.567266 1.564,781 2.485 1896.500 (381239) 1,515.261 1,515.261
557.100 (13,896) 543,204 543,204 550,200 19,056 569,256 569.256 45,800 (25,006) 20,794 19,761 1,033 48,100 (18,778) 29,322 26,095
131,200 (76,906) 54,294 52,194 2,100 136.200 (59,532) 76,668 76,048 16,000 (8,999) 7001 6,964 37 16,000 (9,470) 6530 6,530
750,100 (124.807) 625.293 622.123 3,170 750.500 (68,724) 681.776 677,929
Salaries 11-402-100-100 2,350,065 (187,204) 2,162,861 2,162,861 2,000,600 299,592 2,300,192 2,300,192 Purchased Services (300-500) 11-402-100-500 911,500 (244,383) 667,117 616,338 50,779 599,500 243,485 842,985 800,964 Supplies and Materials 11-402-100-600 232,000 (19,412) 212,588 188,740 23,848 247,000 (47,950) 199,050 189.340 Other Obiects 11-402-100-800 46.500 63,294 109,794 109,524 270 52500 (14661) 37,839 37,839
EXHIBIT C-l (page 5 0[13)
VARIANCE FINAL TO ACTUAL
FAVORABLE/ (UNFAVORABLE)
3,227 620
3.847
42,021 9,710
Total School Sponsored Athletics - Instruction 3,540,065 (387.705) 3,152.360 3,077,463 74,897 2,899,600 _480,466._ 3,380,Q.66 3,12~,335 .__ ._ll,731
Community Services Programs/Operations: Salaries 11-800-330-100 23,667 (12) 23,655 23,655 27,500 (4,501) Purchased Services (300-500) 11-800-330-500 2,250 (2,250) 2,250 (2,250) Supplies and Materials 11-800-330-600 2,500 2,263 4,763 4,635 128 2,500 (1,651) Other Obiects 11-800-330-800 1.000 (1,000) 1.000 (1000)
29,417 (999) 28,418 28,290 128 33,250 (9,402)
22,999
849
23,848
22,999
849
23.848 Total Community Services Programs/Operations
Total Other Instructional Programs 7424,026 (726801) 6697.225 6616.510 80,715 6,935.650 43799 6.979,449 6923,576 55.873
Total Instruction 83794.009 (1,894394) 81.899615 81.745.120 154,495 82.085,947 (1.902298) 80183,649 80,046.775 136,874
Undistributed Expenditures: Instruction:
Tuition to Other LENs Within State - Regular 11-000-100-561 17,000 27,321 44,321 44,321
Tuition to Other LEA's Within State - Special 11-000-100-562 176,805 (58,369) ][8,436 109,727 8,709 132,500 (32,868) 99,632 96,359 3,273
Tuition to County Vocational SchoolDistricts Regular 11-000-100-563 34,500 (4,500) 30,000 30,000 34,500 (4,500) 30,000 30,000
Tuition to County Special School Districts & Regular Day Schools 11-000-100-565 312,080 280,587 592,667 592,667 657,807 (380,335) 277,472 277,472
Tuition to Private Schools for the Handicapped - State 11-000-100-566 1,728,570 472,074 2,200,644 1,845,973 354,671 450,000 797,424 1.247,424 1.239,187 8,237
Tuition - State Facilities 11-000-100-568 237,666 237,666 237,666 308,765 308,765 308,765 ,- . ---Tuition - Other 11-000-100-569 LL.j,VVV 1 ':;IJ:) '·IL4,':;IJ:) 1.L.4 '::IJJ 214.235 '. (95.117) Ll9,118 119.118
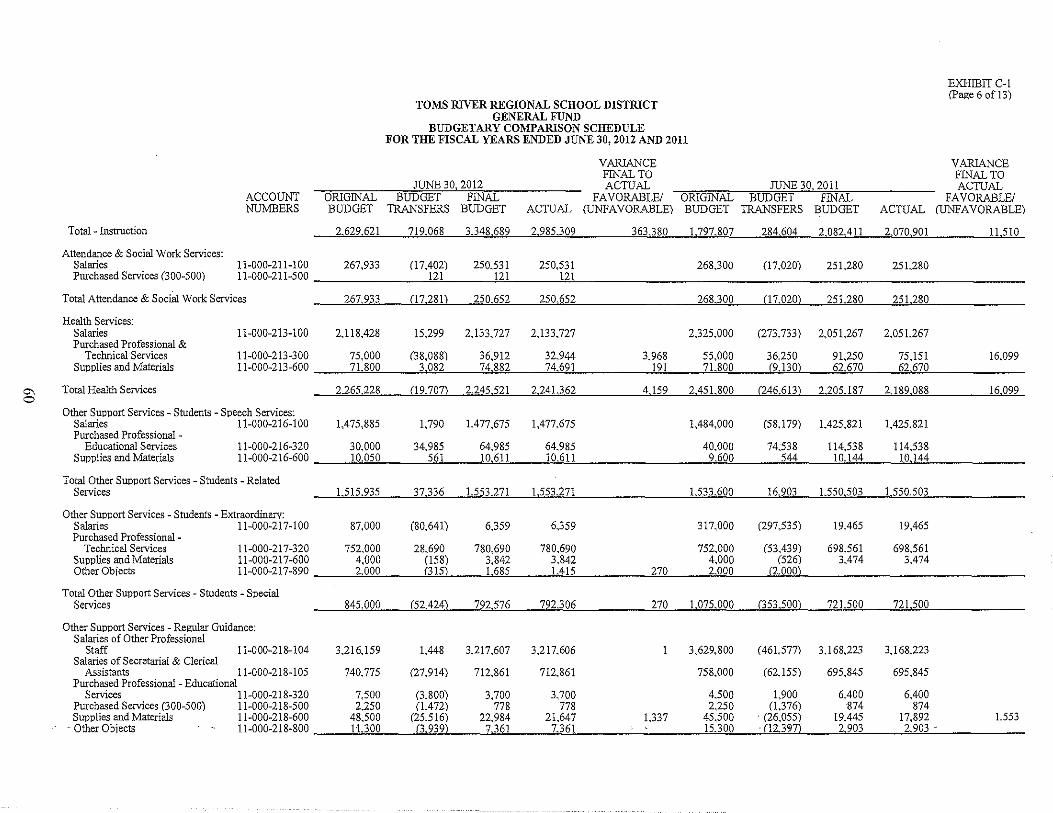
0"> o
ACCOUNT NUMBERS
ORIGINAL BUDGET
TOMS RIVER REGIONAL SCHOOL DISTRICT GENERAL FUND
BUDGETARY COMPARISON SCHEDULE FOR THE FISCAL YEARS ENDED JUNE 30, 2012 AND 2011
JUNE 30. 2012 BODGET FINAL
TRANSFERS BUDGET ACTUAL
VARIANCE FINAL TO ACTUAL
FAVORABLEI (UNFAVORABLE)
JUNE 30. 2011 ORIGINAL- BUDGET FINAL BUDGET TRANSFERS BUDGET ACTUAL
EXHIBIT C-l (page 6 of l3)
VARIANCE FINAL TO ACTUAL
FAVORABLEI (UNFAVORABLE)
T ota1- Instruction 2629621 719.068 3.348.689 2.985.309 363.380 1797,807 284604 2082,411 2070.901 11,510
Attendance & Social Work Services: Salaries 11-000-211-100 267.933 (17,402) 250.531 250.531 268,300 (l7.D20) 25l.280 251.280 Purchased Services (300-500) 11-000-211-500 121 121 121
Total Attendance & Social Work Services 267.933 (17 281) 250.652 250.652 268300 (17.020) 251280 25L280
Health Services: Salaries 11-000-2l3-100 2J18,428 15.299 2J33.727 2.133.727 2325.000 (273.733) 2.05L267 2.05l.267 Purchased Professional &
Technical Services Supplies and Materials
11-000-213-300 75.000 (38.088) 36.912 32.944 3.968 55.000 36.250 91,250 75.151 11-000-213-600 71,800 3,082 74.882 74.691 191 71,800 (9,l30) 62.670 62670
16.099
Total Health Services 2.265228 09.707) 2.245521 2.241,362 4.159 2451 800 (246613) 2.205.187 2189.088 16099
Other Support Services - Students - Speech Services: Salaries 11-000-216-100 1.475.885 1,790 1.477.675 1.477.675 1,484.000 (58.179) 1,425.821 1,425.821 Purchased Professional -
Educational Services 11-000-216-320 30.000 34.985 64.985 64.985 40.000 74.538 114.538 114.538 Supplies and Materials 11-000-216-600 10.050 561 10.611 10611 9600 544 10.144 10.144
Total Other Support Services - Students - Related Services 1515.935 37336 1.553.271 1,553.271 1,533.600 16.903 1.550,503 1,550,503
Other Support Services - Students - Extraordinary: Salaries 11-000-217-100 87.000 (80.641) 6,359 6,359 317.000 (297.535) Purchased Professional
Technical Services Supplies and Materials Other Objects
11-000-217-320 752.000 28.690 780.690 780.690 752.000 (53.439) 11-000-217-600 4.000 (158) 3.842 3.842 4.000 (526) 11-000-217-890 2.000 (3]5) 1685 1.415 270 2.000 (2.000)
19,465
698,561 3.474
19.465
698,561 3,474
Total Other Support Services - Students - Special Services 845.000 (52,424) 792576 792.306 270 1,075.000 (353500) 721,500 __ 721,500
Other Support Services - Regular Guidance: Salaries of Other Professional
Staff 11-000-21S-104 3.216.159 1,448 3.217.607 3.217.606 3.629.800 (461.577) 3.l68.223 3.168.223 Salaries of Secretarial & Clerical
Assistants 11-000-218-105 740.775 (27.914) 712.861 712.861 758.000 (62.155) 695.845 695.845 Purchased Professional - Educational
Services 11-000-218-320 7.500 (3.800) 3.700 3,700 4500 1.900 6.400 6.400 Purchased Services (300-500) 11-000-218-500 2.250 (1.472) 778 778 2.250 (1.376) 874 874 Supplies and Materials 11-000-218-600 48.500 (25516) 22.984 21.647 l.337 45500 . (26.055) 19,445 l7.892
- Other Objects 11-000-218-800 11.JVV (3.939) 7.361 7.361 15.300 . (]2,397) 2.903 2,903 -1.553
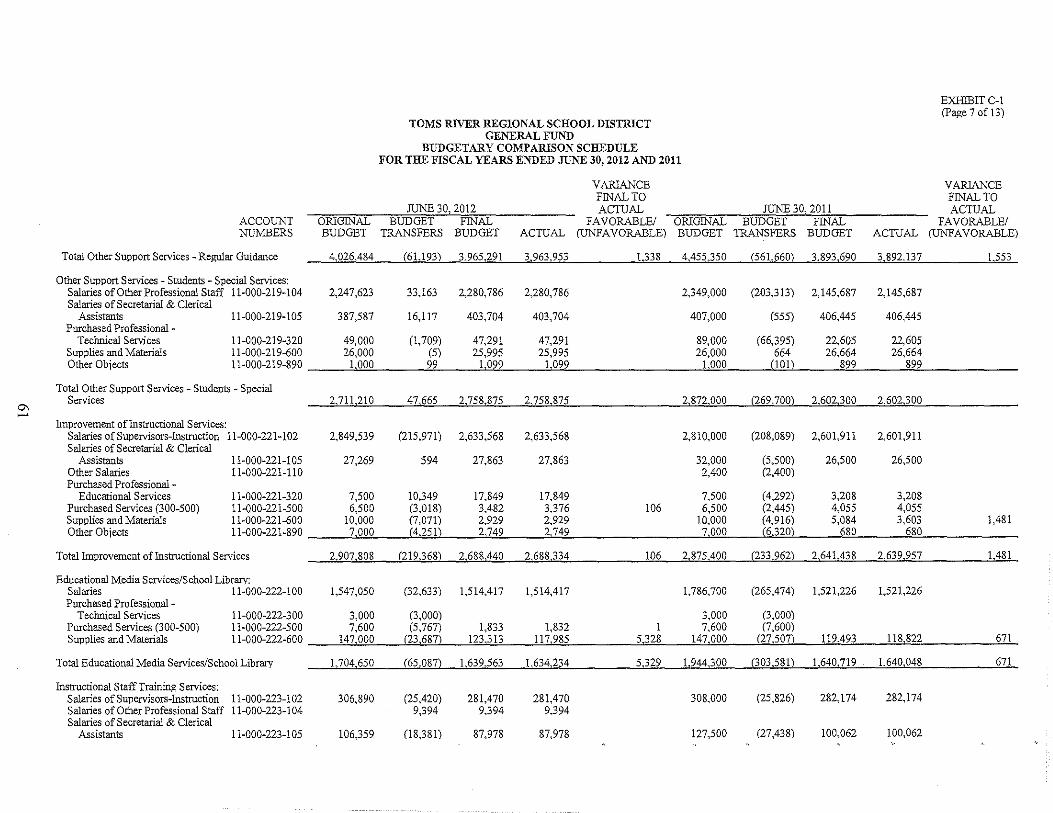
0\ ~
ACCOUNT NUMBERS
ORIGINAL BUDGET
TOMS RIVER REGIONAL SCHOOL DISTRICT GENERAL FUND
BUDGETARY COMPARISON SCHEDULE FOR THE FISCAL YEARS ENDED JUNE 30, 2012 AND 2011
JUNE 30, 2012 BUDGET FINAL
TRANSFERS BUDGET ACTUAL
VARIANCE FINAL TO ACTUAL
FAVORABLEI (UNFAVORABLE)
JUNE 30,2011 ORIGINAL BUDGET FINAL BUDGET TRANSFERS BUDGET ACTUAL
EXHIBIT C-l (page 7 of 13)
VARIANCE FINAL TO ACTUAL
FAVORABLEI (UNFAVORABLE)
Total Other Support Services - Regular Guidance 4,026,484 (61,193) 3,965,291 3,963,953 1,338 4,455,350 (561,660) 3,893,690 3,892,137 1,553
Other Support Services - Students - Special Services: Salaries of Other Professional Staff 11-000-219-104 Salaries of Secretarial & Clerical
Assistants 11-000-219-105
2,247,623
387,587
33,163 2,280,786 2,280,786
16,1l7 403,704 403,704
2,349,000
407,000
(203,313)
(555)
2,145,687 2,145,687
406,445 406,445 Purchased Professional
Teclmical Services Supplies and Materials Other Objects
11-000-219-320 49,000 (1,709) 47,291 47,291 89,000 (66,395) 22,605 22,605 11-000-219-600 26,000 (5) 25,995 25,995 26,000 664 26,664 26,664 11-000-219-890 1,000 99 1,099 1,099 1,000 (101) 899 899
Total Other Support Services - Students - Special Services 2,711,210 47,665 2,758,875 2,758,875 2,872,000 (269,700) 2,602,300 2,602,300
Improvement of Instructional Services: Salaries of Supervisors-Instruction 11-000-221-102 Salaries of Secretarial & Clerical
Assistants Other Salaries Purchased Professional-
Educational Services Purchased Services (300-500) Supplies and Materials Other Objects
11-000-221-105 11-000-221-110
11-000-221-320 11-000-221-500 11-000-221-600 11-000-221-890 f,VUU {4,:LJlJ L.,f4':) ,L,f4':J
Total Improvement of Instructional Services 2,907,808 (219,368) 2,688,440 2,688,334 106 2,875,400 (233.962) 2,641.438 2,639,957 1,481
Educational Media Services/School Library: Salaries 11-000-222-100 1,547,050 (32,633) 1,514,4l7 1,514,417 1,786,700 (265,474) 1,521,226 1,521,226
11-000-222-300 3,000 (3,000) 3,000 (3,000) 11-000-222-500 7,600 (5,767) 1,833 1,832 1 7,600 (7,600)
Purchased ProfessionalTeclmical Services
Purchased Services (300-500) Supplies and Materials 11-000-222-600 147,000 (23,687) 123,313 117,985 5,328 147,000 (27,507) 119,493 118,822 671
Total Educational Media Services/School Library
Instructional Staff Training Services: Salaries of Supervisors-Instruction 11-000-223-102 Salaries of Other Professional Staff 11-000-223-104 Salaries of Secretarial & Clerical
Assistants 11-000-223-105
1,704,650 (65,087) 1,639,563 1,634,234 5,329 1,944,300 (303,581) 1,640,719 1,640,048
306,890
106,359
(25,420) 9,394
(18,381)
281,470 9,394
87,978
281,470 9,394
87,978
308,000 (25,826) 282,174 282,174
127,500 (27,438) 100,062 100,062
671
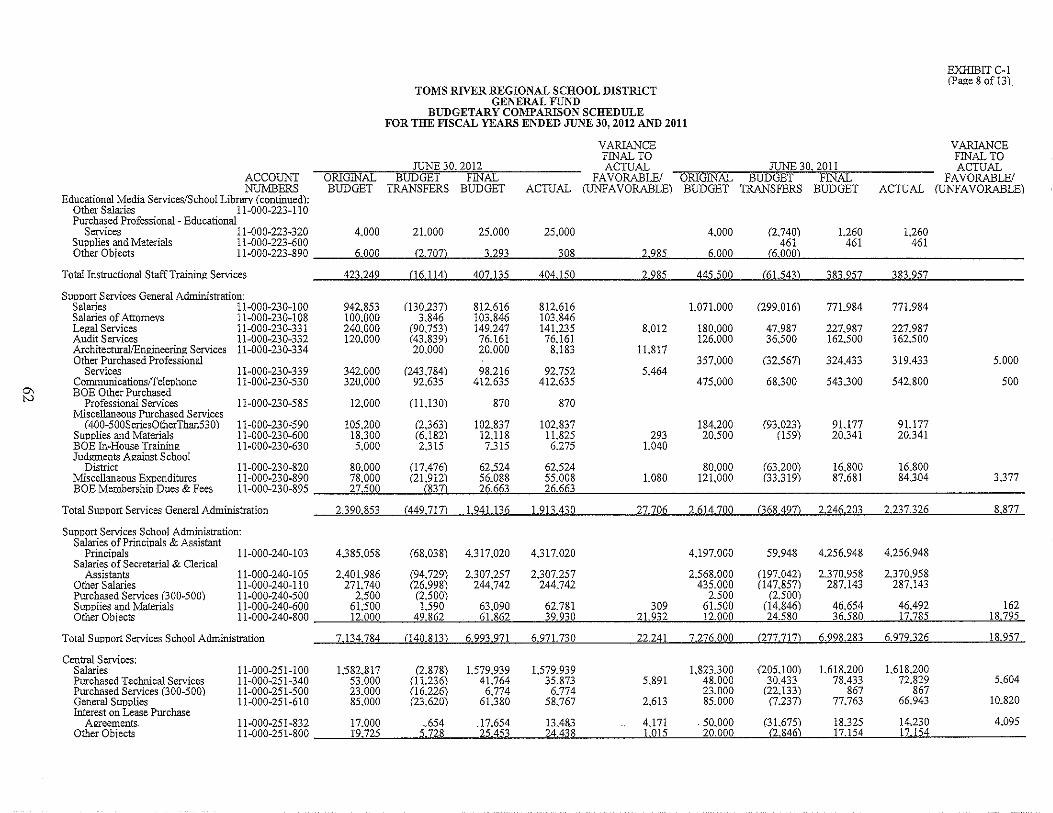
0'> N
ACCOUNT NUMEERS
Educational Media Services/School Library (continued); Other Salaries 11-000-223-110 Purchased Professional- Educational
Services 11-000-223-320 Supplies and Materials 11-000-223-600 Other Objects 11-000-223-890
Total Instructional Staff Training Services
Support Services General Administration: Salaries 1l-000-230-100 Salaries of Attorneys 11-000-230-108 Legal Services 11-000-230-331 Audit Services 11-000-230-332 ArchitecturallEngineering Services 11-000-230-334 Other Purchased Professional
Services Comrnunicationsrreleohone BOE Other Purchased
Professional Services Miscellaneous Purchased Services
(400-500S eriesOtherThan5 3 0) Supplies and Materials BOB In-House Training Judgments Against School
11-000-230-339 11-000-230-530
11-000-230-585
11-000-230'590 11-000-230-600 11-000-230-630
ORIGINAL BUDGET
TOMS RIVER REGIONAL SCHOOL DISTRICT GENERAL FUND
BUDGETARY COMPARISON SCHEDULE FOR THE FISCAL YEARS ENDED JUNE 30, 2012 AND 2011
JUNE 30, 2012 BUDGET FINAL
TRANSFERS BUDGET ACTUAL
VARlANCE FINAL TO ACTUAL
FAVORABLEI (UNFAVORABLE)
JUNE 30, 2011 ORlGINAt-BmTGET ..- FINAL BUDGET TRANSFERS BUDGET
4,000 21,000 25.000 25.000 4.000 (2.740) l,260 461 461
6000 (2 707) 3.293 308 2985 6.000 (6000)
423.249
942.853 100.000 240.000 120.000
342.000 320.000
12.000
105.200 18.300 5.000
(16.114) 407.135 404.150 2.985 445.500 (61543) 383.957
(130.237) 812.616 812.616 1,071.000 (299.016) 771.984 3.846 ID3.846 103.846
(90.753) 149.247 141.235 8.012 180.000 47.987 227.987 (43.839) 76.161 76.161 126.000 36,500 162.500 20.000 20.000 8.183 11,817
357.000 (32,567) 324,433 (243.784) 98.216 92.752 5.464
92.635 412.635 412.635 475.000 68.300 543.300
(lU30) 870 870
(2.363) 102.837 102.837 184.200 (93.023) 9U77 (6.182) 12.118 11.825 293 20,500 (159) 20.341 2.315 7,315 6.275 1,040
District 11-000-230-820 80.000 (17.476) 62.524 62.524 80.000 (63.200) 16.800 Miscellaneous ExPenditures BOE Membership Dues & Fees
11-000-230-890 78,000 (21,912) 56.088 55.008 11-000-230-895 27500 (837) 26.663 26663
1.080 121.000 (33.319) 87.681
EXHIBIT C-1 (Page 8 pf 13)
VARIANCE FINAL TO ACTUAL
FAVORABLEI ACTUAL (UNFAVORABLE)
l,260 461
383.957
771.984
227.987 162500
319.433
542.800
9U77 20.341
16.800 84304
5.000
500
3.377
Total Support Services General Administration 2.390853 (449717) 1941.136 1913 430 27706 2.614.700 (368.497) 2.246.203 2.237.326 8877
Support Services School Administration: Salaries of Principals & Assistant
Principals Salaries of Secretarial & Clerical
Assistants Other Salaries Purchased Services (300-500) Supplies and Materials
11-000-240-103
11-000-240-105 11-000-240-11 0 11-000-240-500 11-000-240-600
4.385.058
2.401.986 271.740
2,500 61.500
(68.038) 4.317.020 4.317.020
(94.729) 2.307.257 2.307.257 (26.998) 244.742 244.742
(2.500) l,590 63.090 62.781 309
Other Obiects 11-000-240-800 lLUUU 4~ /SoL oL/SoL j'i.'ijU LL'ijL
Total Support Services School Administration 7.134.784 (140.813) 6.993.971 6.971.730 22.241
Central Services: Salaries 11-000-251-100 1582.817 (2.8781 1.579.939 1.579.939 Purchased Teclmical Services 11-000-251-340 53.000 (11.236) 41.764 35.873 5.891 Purchased Services (300-500) 11-000-251-500 23.000 (16.226) 6.774 6.774 General SUPplies 11-000-251-610 85.000 (23.620) 6l,380 58.767 2.613 Interest on Lease Purchase
Agreements. 11-000-251-832 17.000 .. 654 .17.654 13.4&3 4.171 Other Obiects 11-000-251-800 19.725 5.728 25.453 24.438 1.015
4.197.000 59.948 4.256.948 4.256.948
2.568.000 (197.042) 2.370.958 2.370.958 435.000 (147.857) 287.143 287.143
2.500 (2,500) 6l,500 (14.846) 46.654 46.492 162 12.000 24.580 36580 17785 18.795
7.276.000 (277.717) 6.998.283 6,972326 18957
1.823.300 fl05.100) 1.618.200 1.618.200 48.000 30.433 78.433 72.829 5.604 23.000 (22.133) 867 867 85.000 (7.237) 77.763 66.943 10.820
.50.000 (31.675) 18.325 1<l230 4.095 20.000 (2.846) 17.154 17.154
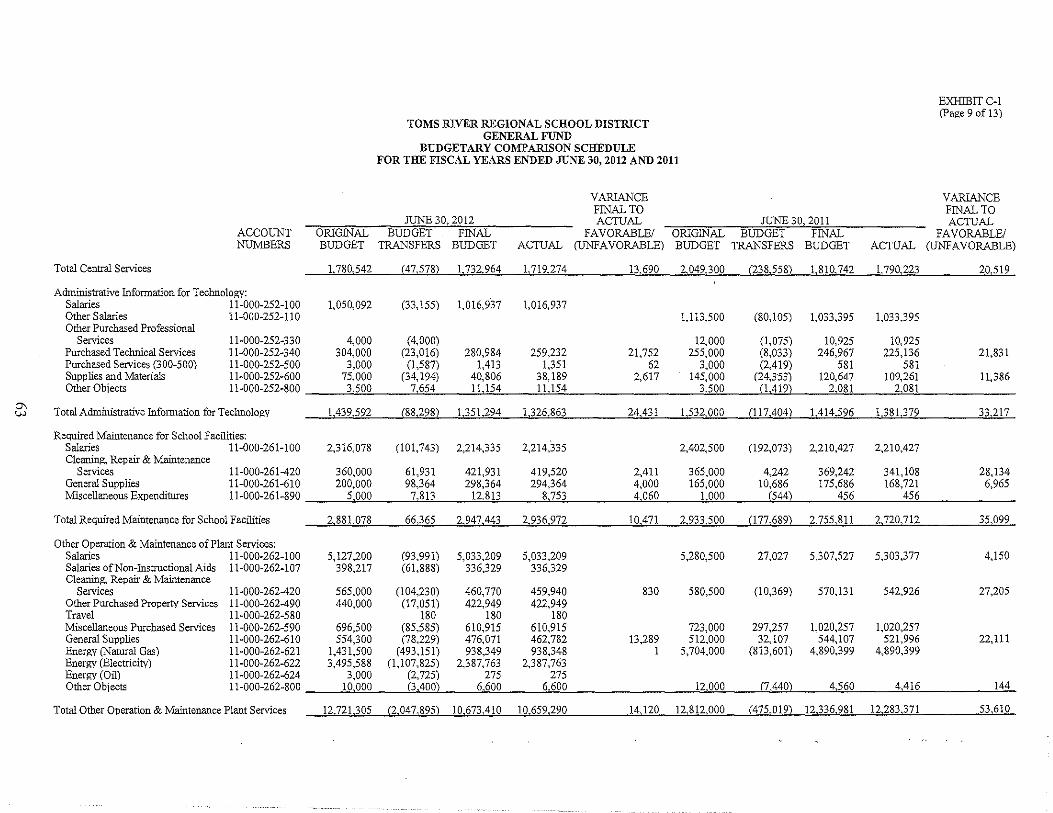
0\ w
ACCOUNT NUMBERS
ORlGINAL BUDGET
TOMS RIVER REGIONAL SCHOOL DISTRICT GENERAL FUND
BUDGETARY COMPARISON SCHEDULE FOR THE FISCAL YEARS ENDED JUNE 30, 2012 AND 2011
JUNE 30, 2012 BUDGET FINAL
TRANSFERS BUDGET ACTUAL
VARIANCE FINAL TO ACTUAL
FAVORABLEI (UNFAVORABLE)
JUNE 30,2011 ORlGINAL BUDGET FINAL BUDGET TRANSFERS BUDGET ACTUAL
EXHffi1TC-1 (Page 9 of 13)
VARIANCE FINAL TO ACTUAL
FAVORABLEI (UNFAVORABLE)
Total Central Services 1,780,542 (47,578) 1,732,964 1,719,274 13,690 2,049300 (238,558) 1,810,742 1,790,223 20,519
Administrative Information for Technology: Salaries 11-000-252-100 1,050,092 (33,155) 1,016,937 1,016,937 Other Salaries 11-000-252-110 1,113,500 (80,105) 1,033,395 1,033,395 Other Purchased Professional
Services Purchased Technical Services Purchased Services (300-500) Supplies and Materials Other Objects
11-000-252-330 4,000 (4,000) 12,000 (1,075) 10,925 10,925 11-000-252-340 304,000 (23,016) 280,984 259,232 21,752 255,000 (8,033) 246,967 225,136 11-000-252-500 3,000 (1,587) 1,413 1,351 62 3,000 (2,419) 581 581 11-000-252-600 75,000 (34,194) 40,806 38,189 2,617 145,000 (24,353) 120,647 109,261 11-000-252-800 3,500 7,654 11,154 11,154 3,500 (1,419) 2,081 2,081
21,831
11,386
Total Administrative Information for Technology 1,439,592 (88,298) 1,351,294 1,326,863 24,431 1,532,000 (117,404) 1,414,596 L381,379 33,217
Required Maintenance for School Facilities: (101,743) 2,214,335 2,214,335 Salaries 11-000-261-100 2,316,078 2,402,500 (192,073) 2,210,427 2,210,427
Cleaning, Repair & Maintenance Services
General Supplies Miscellaneous Expenditures
11-000-261-420 360,000 61,931 421,931 419,520 2,411 365,000 4,242 369,242 341,108 11-000-261-610 200,000 98,364 298,364 294,364 4,000 165,000 10,686 175,686 168,721 11-000-261-890 5,000 7,813 12,813 8,753 4,060 1,000 (544) 456 456
28,134 6,965
Total Required Maintenance for School Facilities 2,881,078 66,365 2,947,443 2,936,972 10,471 2,933,500 (177,689) 2,755,811 2,720,712 35,099
Other Operation & Maintenance of Plant Services: Salaries 11-000-262-100 Salaries of Non-Instructional Aids 11-000-262-107 Cleaning, Repair & Maintenance
Services Other Purchased Property Services Travel Miscellaneous Purchased Services General Supplies Energy (N a!ural Gas) Energy (Electricity) Energy (Oil)
11-000-262-420 11-000-262-490 11-000-262-580 11-000-262-590 11-000-262-610 11-000-262-621 11-000-262-622 11-000-262-624
5,127,200 398,217
565,000 440,000
696,500 554,300
1,431,500 3,495,588
3,000
(93,991) 5,033,209 5,033,209 (61,888) 336,329 336,329
(104,230) 460,770 459,940 (17,051) 422,949 422,949
180 180 180 (85,585) 610,915 610,915 (78,229) 476,071 462,782
(493,151) 938,349 938,348 (1,107,825) 2,387,763 2,387,763
(2,725) 275 275 Other Objects
• n ___
11-000-262-800 IV,VVV \,j,IfVV) O,QUV O,QVV
5,280,500 27,027 5,307,527 5,303,377 4,150
830 580,500 (10,369) 570,131 542,926 27,205
723,000 297,257 1,020,257 1,020,257 13,289 512,000 32,107 544,107 521,996 22,111
1 5,704,000 (813,601) 4,890,399 4,890,399
12,000 (7,440) 4,560 4,416 144
Total Other Operation & Maintenance Plant Services 12,721,305 (2,047,895) 10,673,410 10,659,290 14,120 12,812,000 (475,019) 12,336,981 12,283,371 53,610
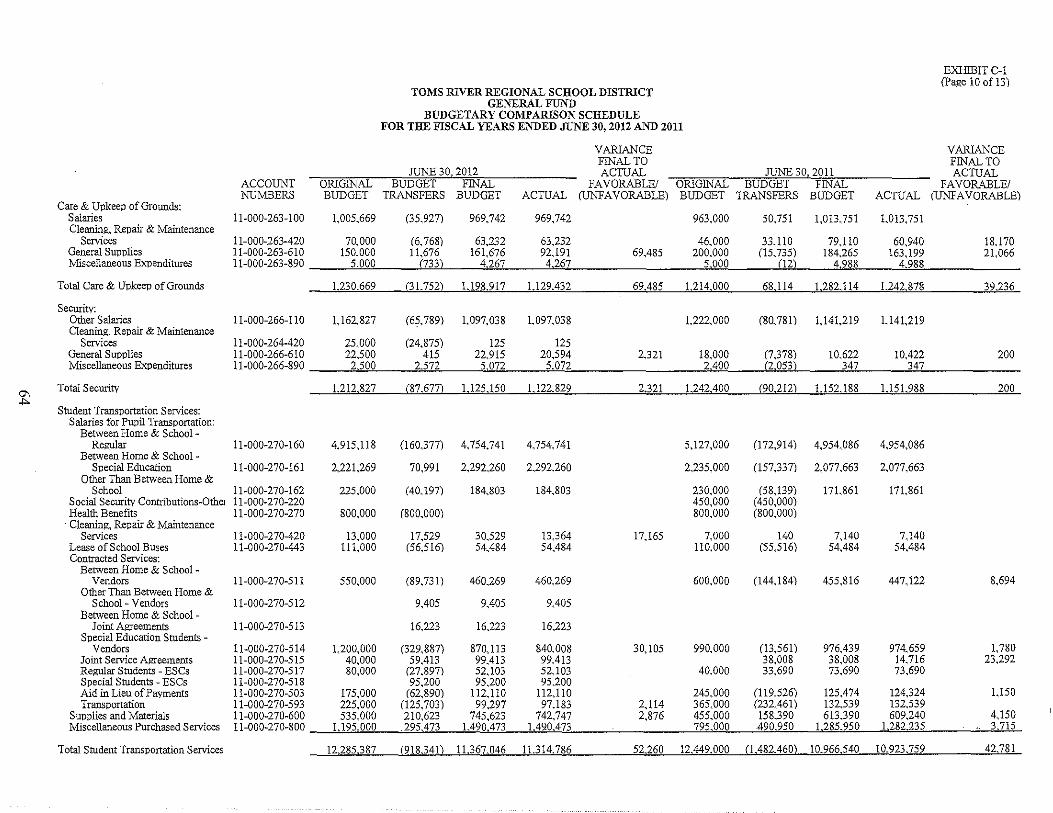
0\ ~
Care & Upkeep of Grounds: Salaries Cleaning, Repair & Maintenance
Services General Supplies Miscellaneous ExPenditures
Total Care & Upkeep of Grounds
Security: Other Salaries Cleaning, Repair & Maintenance
Services General Supplies Miscellaneous ExPenditures
Total Security
Student Transportation Services: Salaries for Pupil Transportation:
Between Home & SchoolRegular
Between Home & SchoolSpecial Education
Other Than Between Home & School
Social Security Contributions-Othel Health Benefits Cleaning, Repair & Maintenance
Services Lease of School Buses Contracted Services:
Between Home & SchoolVendors
Other Than Between Home & School- Vendors
Between Home & School -Joint Agreements
Special Education Students -Vendors
Joint Service Agreements Regular Students - ESCs Special Students - ESCs Aid in Lieu of Payments Transportation
Supplies and Materials Miscellaneous Purchased Services
Total Student Transportation Services
TOMS RIVER REGIONAL SCHOOL DISTRICT GENERAL FUND
BUDGETARY COMPARISON SCHEDULE FOR THE FISCAL YEARS ENDED JlJNE 30, 2012 AND 2011
VARIANCE FINAL TO
_ JUNE 30,2012 ACTUAL ACCOUNT ORIGINAL BUDGET FINAL FAVORABLEI
JUNE 30, 2011 ORIGINAL-BUDGET FINAL
NUMBERS BUDGET TRANSFERS BUDGET ACTUAL (UNFAVORABLE) BUDGET TRAN ,FERS BUDGET
11-000-263-100 1,005,669 (35,927) 969,742 969,742 963,000 50,751 1,013,751 1,013,751
11-000-263-420 70,000 (6,768) 63,232 63,232 46,000 33,110 79,110 60,940 11-000-263-610 150,000 11,676 161,676 92,191 69,485 200,000 (15,735) 184,265 163,199 11-000-263-890 5,000 17(3) 4267 4,267 5000 (12) 4,988 4,988
1,230,669 _ (31,752) 1J98,917 1,129.432 69,485 1,214,000 68,114 1,282,114 1,242,878
11-000-266-110 1,16].827 (65,789) 1,097,038 1,097,038 1,22].000 (80,781) 1,141,219 1,141,219
11-000-264-420 25,000 (24,875) 125 125 11-000-266-610 22,500 415 22,915 20,594 2,321 18,000 (7,378) 10,622 10,422 11-000-266-890 2,500 2572 5,072 5,072 2400 (2053) 347 347
EXHIBIT C-l (page 10 of 13)
VARIANCE FINAL TO ACTUAL
FAVORABLEI (UNFAVORABLE)
18,170 21,066
39,236
200
1,212 827 (87,677) 1125,150 1122,829 2.321 1,242,400 (90,212) 1,152,188 1151,988 200
11-000-270-160 4,915,118 (160,377) 4,754,741 4,754,741 5,127,000 (172,914) 4,954,086 4,954,086
11-000-270-161 2,221,269 70,991 2,292,260 2,292,260 2,235,000 (157,337) 2,077,663 2,077,663
11-000-270-162 225,000 (40,197) 184,803 184,803 230,000 (58,139) 171,861 171,861 11-000-270-220 450,000 (450,000) 11-000-270-270 800,000 (800,000) 800,000 (800,000)
11-000-270-420 13,000 17,529 30,529 13,364 17,165 7,000 140 7,140 7,140 11-000-270-443 111,000 (56,516) 54,484 54,484 110,000 (55,516) 54,484 54,484
11-000-270-511 550,000 (89,731) 460,269 460,269 600,000 (144,184) 455,816 447,122 8,694
11-000-270-512 9,405 9,405 9,405
11-000-270-513 16,223 16,223 16,223
11-000-270-514 1,200,000 (329,887) 870,113 840,008 30,105 990,000 (13,561) 976,439 974,659 1,780 11-000-270-515 40,000 59,413 99,413 99,413 38,008 38,008 14,716 23,292 11-000-270-517 80,000 (27,897) 52,103 52,103 40,000 33,690 73,690 73,690 11-000-270-518 95,200 95,200 95,200 11-000-270-503 175,000 (62,890) 112,110 112,110 245,000 (119,526) 125,474 124,324 1,150 11-000-270-593 225,000 (125,703) 99,297 97,183 2,114 365,000 (232,461) 132,539 132,539 11-000-270-600 535,000 210,623 745,623 742,747 2,876 455,000 158,390 613,390 609,240 4,150 11-000-270-800 1,195,000 .295.473 1,490,473 1,490,473 795,QQO 49Q,95~ 1,2_&':;,950 1,282.235 3,715
12.285387 (918.34]) 11.367,046 11.314,786 52260 12,449000 (1,482460) 10966540 10 923,759 42,781
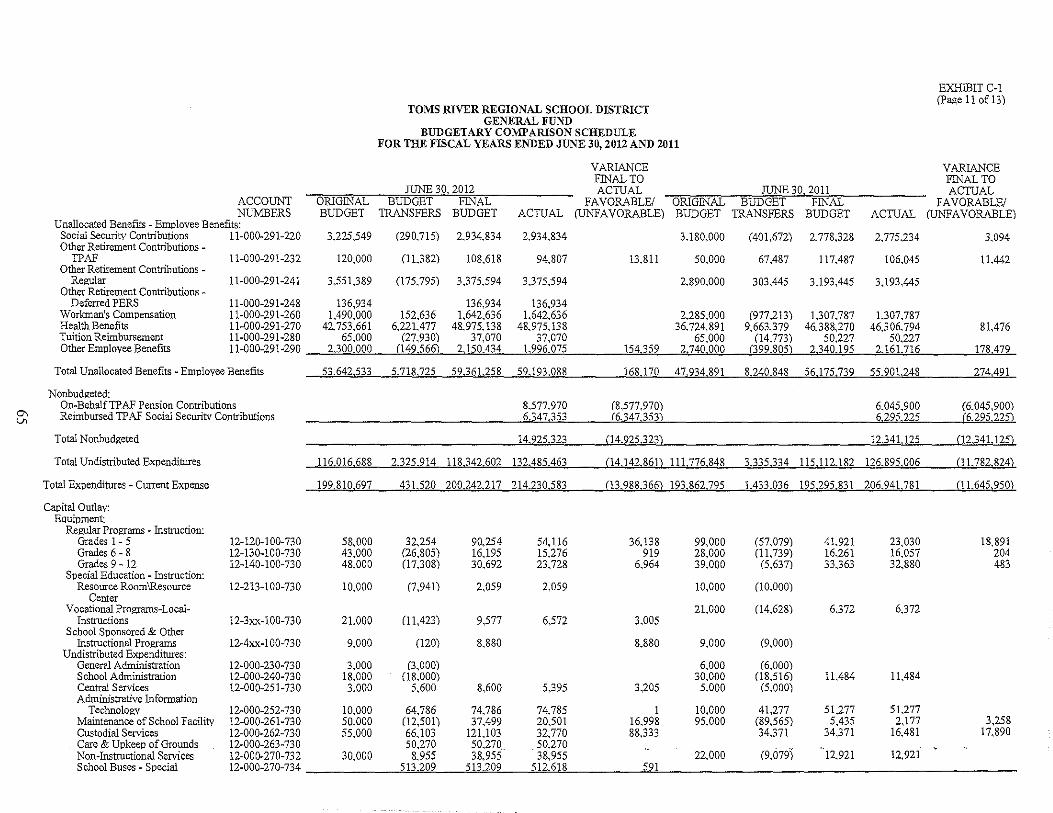
0, U>
ACCOUNT NUMBERS
Unallocated Benefits - Employee Benefits: Social Security Contributions 11-000-291-220 Other Retirement Contributions -
TPAF Other Retirement Contributions -
Regular Other Retirement Contributions -
Deferred PERS Worlanan's Compensation Health Benefits Tuition Reimbursement Other Emplovee Benefits
11-000-291-232
11-000-291-241
11-000-291-248 11-000-291-260 11-000-291-270 11-000-291-280 11-000-291-290
Total Unallocated Benefits - Employee Benefits
Nonbudgeted: On-BehalfTPAF Pension Contributions Reimbursed TP AF Social Security Contributions
Total Nonbudgeted
Total Undistributed Expenditures
Total Expenditures - Current ExPense
Capital Outlay: Equipment:
Regular Programs - Instruction: Grades 1- 5 Grades 6 - 8 Grades 9 - 12
Special Education - Instruction: Resource Room\R.esource
Center Vocational Programs-Local
Instructions School Sponsored & Other
Instructional Programs Undistributed Expenditures:
General Administration School Administration Central Services Administrative Information
Technology Maintenance of School Facility Custodial Services
12-120-100-730 12-130-100-730 12-140-100-730
12-213-100-730
12-3xx-100-730
12-4xx-100-730
12-000-230-730 12-000-240-730 12-000-251-730
12-000-252-730 12-000-261-730 12-000-262-730 12-000-263-730 12-000-270-732
ORIGINAL BUDGET
3,225,549
120,000
3,551,389
TOMS RIVER REGIONAL SCHOOL DISTRICT GENERAL FUND
BUDGETARY COMPARISON SCHEDULE FOR THE TISCAL YEARS ENDED JUNE 30, 2012 AND 2011
JUNE 30, 2012 BUDGET FINAL
TRANSFERS BUDGET ACTUAL
(290,715) 2,934,834 2,934,834
(11,382) 108,618 94,807
(175,795) 3,375,594 3,375,594
VARIANCE FINAL TO ACTUAL
FAVORABLEI (UNFAVORABLE)
13,811
JUNE 30, 2011 ORIGINAL BUDGET FINAL BUDGET TRANSFERS BUDGET ACTUAL
3,180,000
50,000
2,890,000
(401,672) 2,778,328 2,775,234
67,487 117,487 106,045
303,445 3,193,445 3,193,445
EXHIBIT C-1 (page 11 ofl3)
VARIANCE FINAL TO ACTUAL
FAVORABLEI (UNFAVORABLE)
3,094
11,442
136,934 136,934 136,934 1,490,000 152,636 1,642,636 1,642,636 2,285,000 (977,213) 1,307,787 1,307,787
42, 753,661 6,221,477 48,975,138 48,975,138 36,724,891 9,663,379 46,388,270 46,306,794 81,476 65,000 (27,930) 37,070 37,070 65,000 (14,773) 50,227 50,227
2,300,000 (149566) 2,150,434 1,996,075 154,359 2,740,000 (399,805) 2,340,195 2,161,716 178,479
53.642,533 5,718725 59,361,258 59,193,088 168170 47,934891 8,240,848 56,175,739 55901,248 274,491
8,577,970 (8,577,970) 6,045,900 (6,045,900) 6347,353 (6347,353) 6,295,225 16,295,225)
14,925,323 (14,925,323) 12,341,]25 (]2,341,]25)
116.016,688 2,325,914 118,342.602 132,485,463 (14,142,86]) 111 776,848 3,335,334 115112,182 126895,006 (11782,824)
199,810,697 431,520 200.242,217 214.230,583 (13,988,366) 193862,795 1,433,036 195,295,831 206,941,781 Cll,645,950)
58,000 32,254 90,254 54,116 43,000 (26,805) 16,195 15,276 48,000 (17,308) 30,692 23,728
10,000 (7,941) 2,059 2,059
21,000 (11,423) 9,577 6,572
9,000 (120) 8,880
3,000 (3,000) 18,000 (18,000) 3,000 5,600 8,600 5,395
10,000 64,786 74,786 74,785 50,000 (12,501) 37,499 20,501 55,000 66,103 121,103 32,770
50,270 50,270. 50,270 30,000 8,955 38,955 38,955
36,138 99,000 (57,079) 919 28,000 (11,739)
6,964 39,000 (5,637)
10,000 (10,000)
21,000 (14,628) 3,005
8,880 9,000 (9,000)
6,000 (6,000) 30,000 (18,516)
3,205 5,000 (5,000)
1 10,000 41,277 16,998 95,000 (89,565) 88,333 34,371
22,000 (9,079)
41,921 16,261 33,363
6372
11,484
51,277 5,435
34,371
12,921
23,030 16,057 32,880
6,372
11,484
51,277 2,177
16,481
12,921
18,891 204 483
3,258 17,890
Care & Upkeep of Grounds NonRInstructional Services School Buses - Special 513.209 513.209 12-000R270-734 )U L,U';;I .)U,L,U:t .)U,OHS )';;11
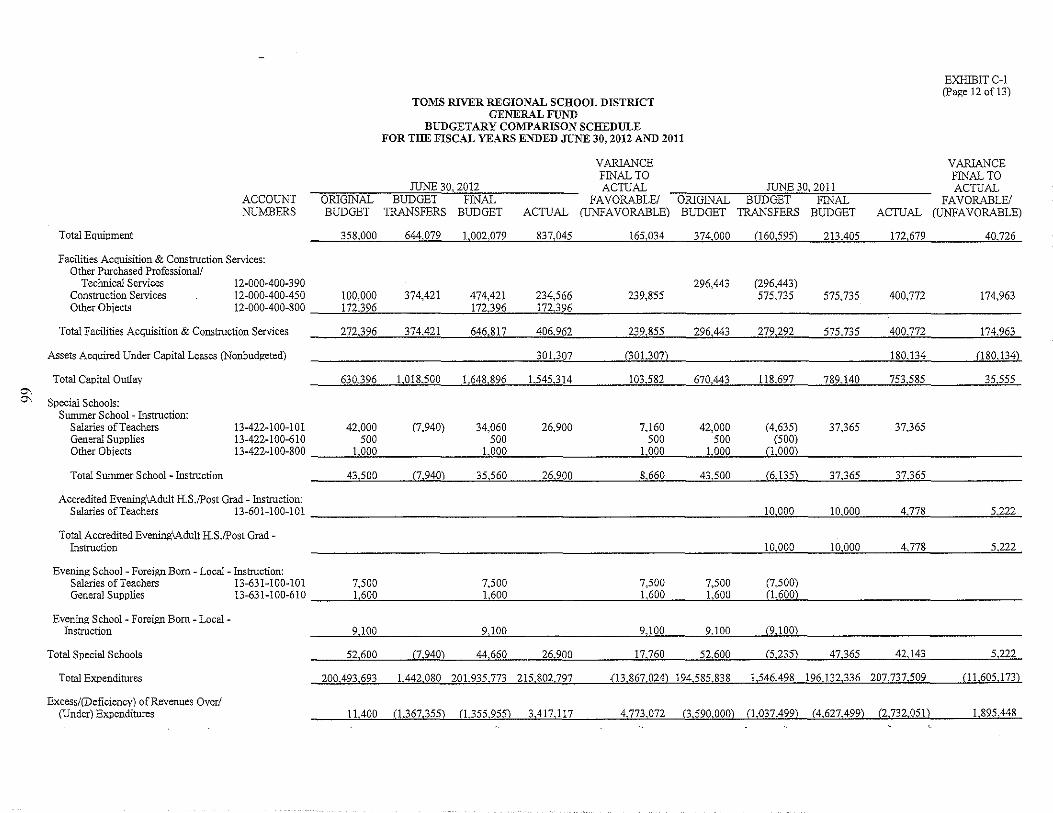
0\ 0\
ACCOUNT NUMBERS
ORIGINAL BUDGET
TOMS RIVER REGIONAL SCHOOL DISTRICT GENERAL FUND
BUDGETARY COMPARISON SCHEDULE FOR THE FISCAL YEARS ENDED .TUNE 30, 2012 MID 2011
JUNE 30, 2012 BUDGET FINAL
TRANSFERS BUDGET ACTUAL
VARIANCE FINAL TO ACTUAL
FAVORABLE/ (UNFAVORABLE)
JUNE 30, 2011 ORIGINAL BUDGET FINAL BUDGET TRANSFERS BUDGET ACTUAL
EXHillrrC-l (page 12 of 13)
VARIANCE FINAL TO ACTUAL
FAVORABLE/ (UNFAVORABLE)
Total Equipment 358,000 644,079 1,002,079 837,045 165,034 374,000 (160,595) 213,405 172,679 40,726
Facilities Acquisition & Construction Services: Other Purchased Professional!
Technical Services Construction Services Other Object<;
12-000-400-390 12-000-400-450 100,000 374,421 474,421 234,566 12-000-400-800 172,396 172,396 172,396
239,855 296,443 (296,443)
575,735 575,735 400,772 174,963
Total Facilities Acquisition & Construction Services 272,396 374,421 646,817 406,962 239,855 296,443 279,292 575,735 400,772 174,963
Assets Acquired Under Capital Leases (Nonbudgeted) 301,307 (301,307) 180,134 (180,134)
Total Capital Outlay 630,396 L018,500 L648,896 1,545,314 103,582 670,443 118,697 789,140 753,585 35,555
Special Schools: Summer School- Instruction:
Salaries of Teachers General Supplies Other Obiects
13-422-100-101 42,000 (7,940) 34,060 26,900 7,160 42,000 (4,635) 37,365 37,365 13-422-100-610 500 500 500 500 (500) 13-422-100-800 1,000 LOOO LOOO 1,000 (1,000)
Total Summer School-Instruction 43,500 (7,940) 35,560 26,900 8,660 43,500 (6135) 37,365 37,365
Accredited Evening\Adult H.S./Post Grad - Instruction: Salaries ofTeachers 13-601-100-101 10,000 10,000 4,778 5,222
Total Accredited Everung\Adult H.S.lPost Grad - 10,000 10,000 4,778 5,222 Instruction
Evening Scho01- Foreign. Born - Local- Instruction: Salaries ofTeachers 13-631-100-101 7,500 7,500 7,500 7,500 (7,500) General Supplies 13-631-100-610 L600 L600 L600 L600 (1,600)
Evening School- Foreign Born - Local-Instruction 9,100 9,100 9,100 9,100 (9,100)
Total Special Schools 52,600 (7,940) 44.660 26,900 17,760 52,600 (5,235) 47,365 42,143 5,222
Tota! Expenditures 200,493.693 1,442,080 20L935,773 215,802797 {13.867 024) 194,585.838 1,546,498 196 132.336 207.737,509 (11,605,173)
Excess/(Deficiency) of Revenues Over/ (UnderjExpenditures 11,400 (1,367,355) (1,355,955) 3,417,117 4,773,072 (3,590,000) (I,D37.499) (4,627,499) (2,732,051) 1,895,448
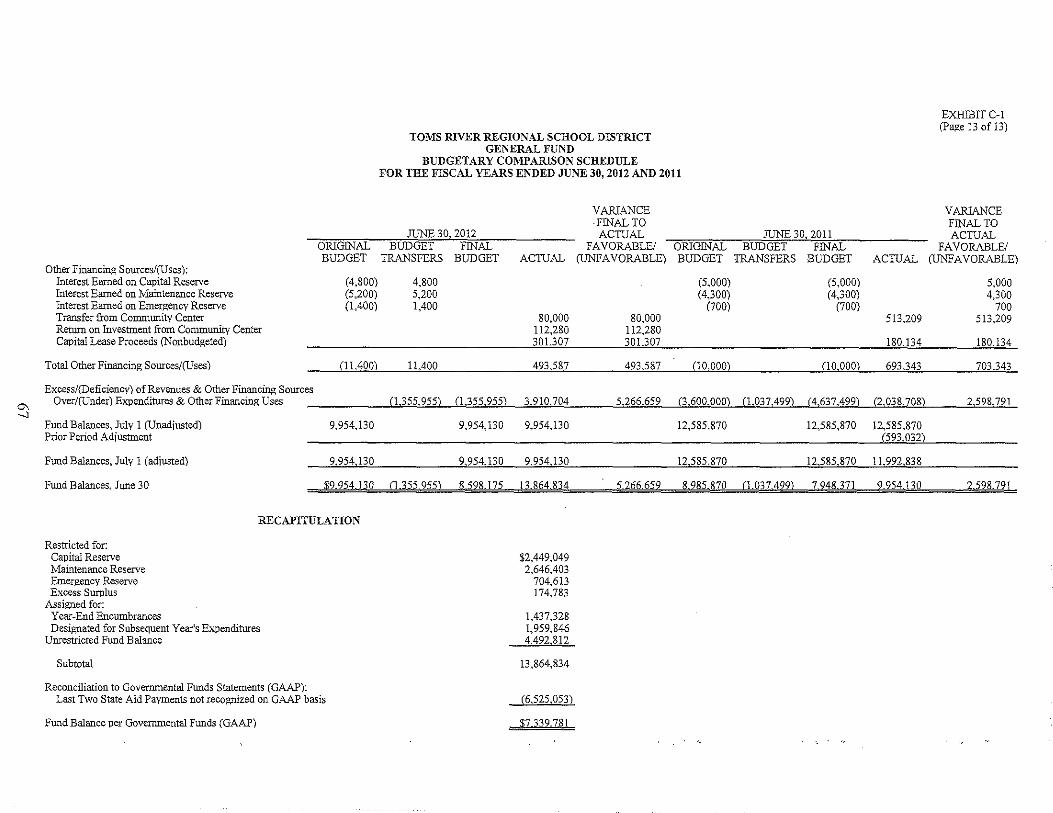
0\ -.J
Other Financing S ources/(U ses): Interest Earned on Capital Reserve Interest Earned on Maintenance Reserve Interest Earned on Emergency Reserve Transfer from Community Center Return on Investment from Community Center Capital Lease Proceeds (Nonbudgeted)
Total Other Financing Sources/(Uses)
Excess/(Deficiency) of Revenues & Other Financing Sources Over/(Uuder) Expenditures & Other Financing Uses
Fund Balances, July 1 (Unadiusted) Prior Period Adjustment
Fund Balances, July 1 (adiusted)
Fund Balances, June 30
ORIGINAL BUDGET
(4,800) (5,200) (1,400)
TOMS RIVER REGIONAL SCHOOL DISTRICT GENERAL FUND
BUDGETARY COMPARISON SCHEDULE FOR THE FISCAL YEARS ENDED JUNE 30, 2012 AND 2011
JUNE 30, 2012 BUDGET FINAL
TRANSFERS BUDGET
4,800 5,200 1,400
ACTUAL
VARlANCE FINAL TO ACTUAL
FAVORABLE! (UNFAVORABLE)
80,000 80,000 112,280 112,280
JUNE 30, 2011 ORIGINAL BUDGET FINAL BUDGET TRANSFERS BUDGET
(5,000) (4,300)
(700)
(5,000) (4,300)
(700)
ACTUAL
513,209
EXIilBIT C-I (Page 13 of 13)
VARIANCE FINAL TO ACTUAL
FAVORABLE! (UNFAVORABLE)
5,000 4,300
700 513,209
301olQ7 30U!l7_ 180,134 180,134
(11,400) 11,400 493,587 493,587 ClO,OOO) ClO,OOO) 693,343 703,343
CI,355,955) (1,355,955) 3,910,704 5,266,659 (3,600,000) (1,037,499) (4,637,499) (2,038,708) 2,598,791
9,954,130 9,954,130 9,954,130 12,585,870 12,585,870 12,585,870 (593,032)
9,954,130 9,954,130 9,954,130 12,585,870 12,585,870 11,992,838
$9.954130 (1355955) 859817513864834 5266.659 8985870 (1.037499) 7948371 9.954130 2598791
RECAPITULATION
Restricted for: Capital Reserve Maintenance Reserve Emergency Reserve Excess Surplus
Assigned for: Year-End Encumbrances Designated for Subsequent Year's Expenditures
Unrestricted Fund Balance
Subtotal
Reconciliation to Governmental Funds Statements (GAAP): Last Two State Aid Payments not recognized on GAAP basis
Fund Balance per Goverrunental Funds (GAAP)
$2,449,049 2,646,403
704,613 174,783
1,437,328 1,959,846 4,492,812
13,864,834
(6,525,053)
$7339781
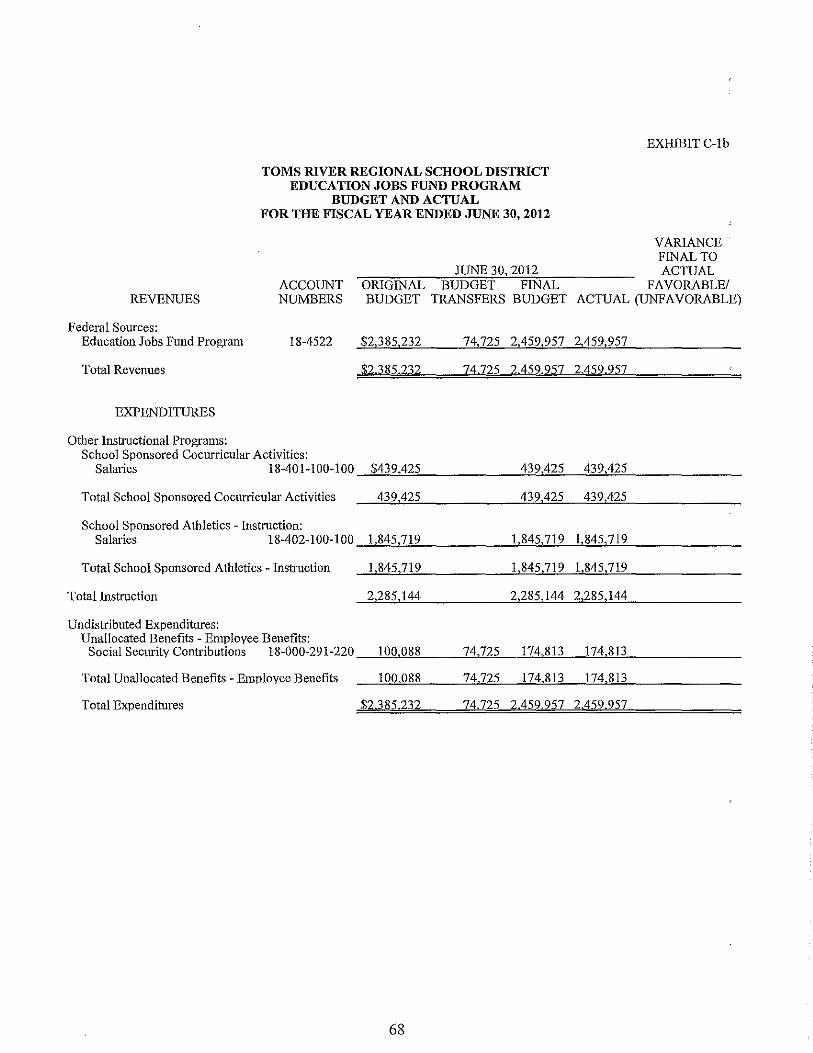
TOMS RIVER REGIONAL SCHOOL DISTRICT EDUCATION JOBS FUND PROGRAM
BUDGET AND ACTUAL FOR THE FISCAL YEAR ENDED JUNE 30, 2012
JUNE 30, 2012
EXHIBIT C-1b
VARIANCE' FINAL TO ACTUAL
REVENUES ACCOUNT NUMBERS
ORIGINAL BUDGET FINAL BUDGET TRANSFERS BUDGET
FAVORABLE/ ACTUAL (UNFAVORABLE)
Federal Sources: Educatiou Jobs Fund Program 18-4522 $2,385,232 74,725 2,459,957 2,459,957
Total Revenues $2385,232 74725 2.459,957 2.459957
EXPENDITURES
Other Instructional Programs: School Sponsored Cocurricular Activities:
Salaries 18-401-100-1 00 -'$"'4"'3"'9,,,42"'5'--_____ ==~____""""='__ _____ _ 439,425 439,425
439,425 439,425 Total School Sponsored Cocurricular Activities _...:4"'3cc9"',4"'2"'5 ______ ===_===-______ _ School Sponsored Athletics - Instruction:
1,845,719 1,845,719 Salaries 18-402-100-100 -"1"',8"'4"'5,"-7"'19'__ ____ -"'="-'-'''''--''''=''-"'"'--_____ _
Total School Sponsored Athletics - Instruction 1,845,719 1,845,719 1,845,719
Total Instruction 2,285,144 2,285,144 2,285,144
Undistributed Expenditures: Unallocated Benefits - Employee Benefits:
Social Security Contributions 18-000-291-220 _-'1"'0"'0.,;,0"'8"'8 __ --"-7 4"""-7,,,25,,--,,1-,-,7 4"',"'8"'13'--'-17"'4".,8"'1"'3'--_____ _
Total Unallocated Benefits - Employee Benefits 100,088 74,725 174,813 174,813
Total Expenditures $2385,232 74725 2459957 2.459.957
68
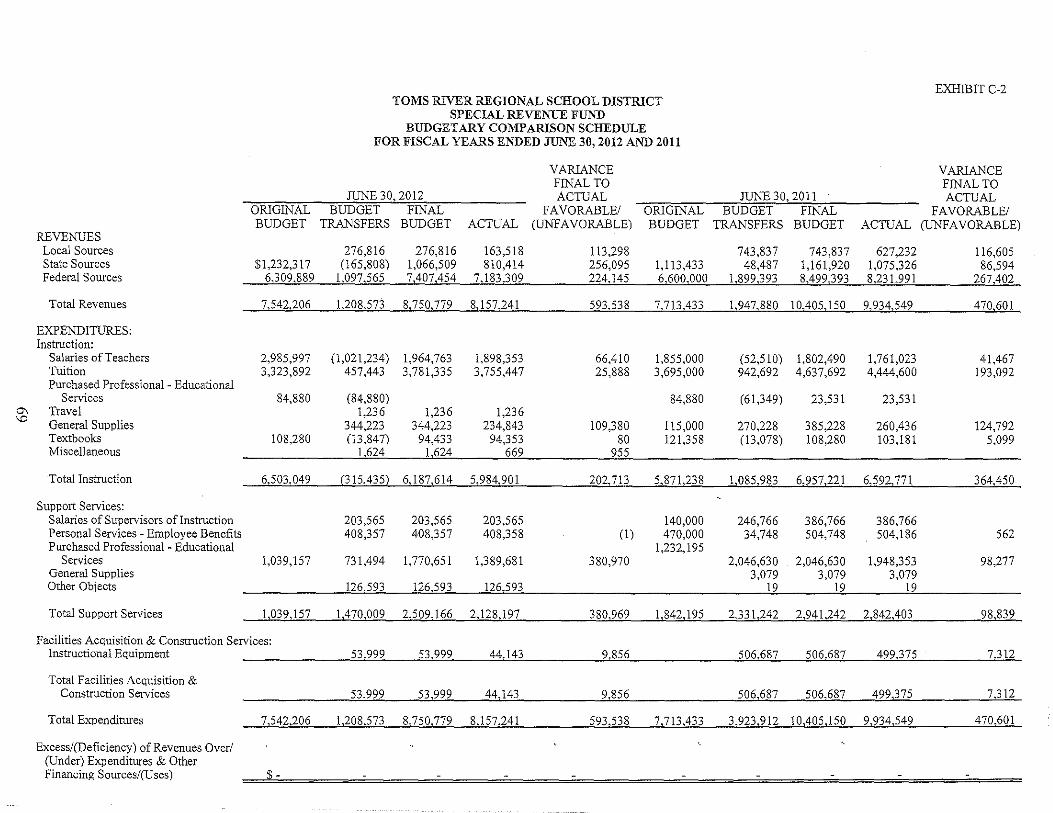
a, 'D
REVENUES Local Sources State Sources Federal Sources
Total Revenues
EXPENDITURES: Instruction:
Salaries of Teachers Tuition Purchased Professional - Educational
Services Travel General Supplies Textbooks Miscellaneous
Total Instruction
Support Services: Salaries of Supervisors of Instruction Personal Services - Employee Benefits Purchased Professional - Educational
Services General Supplies Other Obiects
Total Support Services
TOMS RIVER REGIONAL SCHOOL DISTRICT SPECIAL REVENUE FUND
BUDGETARY COMPARISON SCHEDULE FOR FISCAL YEARS ENDED JUNE 30, 2012 AND 2011
JUNE 30, 2012
VARIANCE FINAL TO ACTUAL JUNE 30,2011
ORIGINAL BUDGET FINAL FAVORABLE! (UNFAVORABLE)
ORIGINAL BUDGET FINAL BUDGET TRANSFERS BUDGET ACTUAL BUDGET TRANSFERS BUDGET
EXHIBIT C-2
VARIANCE FINAL TO ACTUAL
FAVORABLE! ACTUAL (UNFAVORABLE)
276,816 276,816 163,518 113,298 743,837 743,837 627,232 116,605 $1,232,317 (165,808) 1,066,509 810,414 256,095 1,113,433 48,487 1,161,920 1,075,326 86,594
6,309,889 1,097,565 7,407,454 7,183,309 224,145 6,600,000 1,899,393 8,499,393 8,231,991 267,402
7,542,206 1,208,573 8,750,779 8,157,241 593,538 7,713.433 1,947,880 10,405,150 9,934,549 470,601
2,985,997 (1,021,234) 3,323,892 457,443
84,880 (84,880) 1,236
344,223 108,280 (13,847)
1,624
1,964,763 3,781,335
1,236 344,223
94,433 1,624
1,898,353 3,755,447
1,236 234,843
94,353 669
66,410 25,888
109,380 80
955
1,855,000 (52,510) 3,695,000 942,692
84,880 (61,349)
115,000 270,228 121,358 (13,078)
1,802,490 4,637,692
23,531
385,228 108,280
1,761,023 4,444,600
23,531
260,436 103,181
41,467 193,092
124,792 5,099
6,503,049 (315,435) 6,187,614 5,984,901 202,713 5,871,238 1,085,983 6,957,221 6,592,771 364,450
203,565 203,565 203,565 140,000 246,766 386,766 386,766 408,357 408,357 408,358 (1) 470,000 34,748 504,748 504,186 562
1,232,195 1,039,157 731,494 1,770,651 1,389,681 380,970 2,046,630 2,046,630 1,948,353 98,277
3,079 3,079 3,079 126,593 126,593 126,593 19 19 19
1,039,157 1,470,009 2,509,166 2,128,197 380,969 1,842,195 2,331,242 2,941,242 2,842,403 98,839
Facilities Acquisition & Construction Services: Instructional Equipment
Total Facilities Acquisition & Construction Services
Total Expenditures
Excess!(Deficiency) of Revenues Over! (Under) Expenditures & Other Financing Sources/(Uses)
53,999 53,999 44,143 9,856 506,687 506,687 499,375 7,312
53,999 53,999 44,143 9,856 506,687 506,687 499,375 7,312
7,542,206 1,208,573 8,750,779 8,157,241 593,538 7,713,433 3,923,912 10,405,150 9,934,549 470,601
$-

NOTES TO REQUIRED SUPPLEMENTARY INFORMATION

I
I
I
I
I
I
I
I
I
I
I
I
I
I
I
I
I
I
I
I
I
I
I
I
I
I I
I
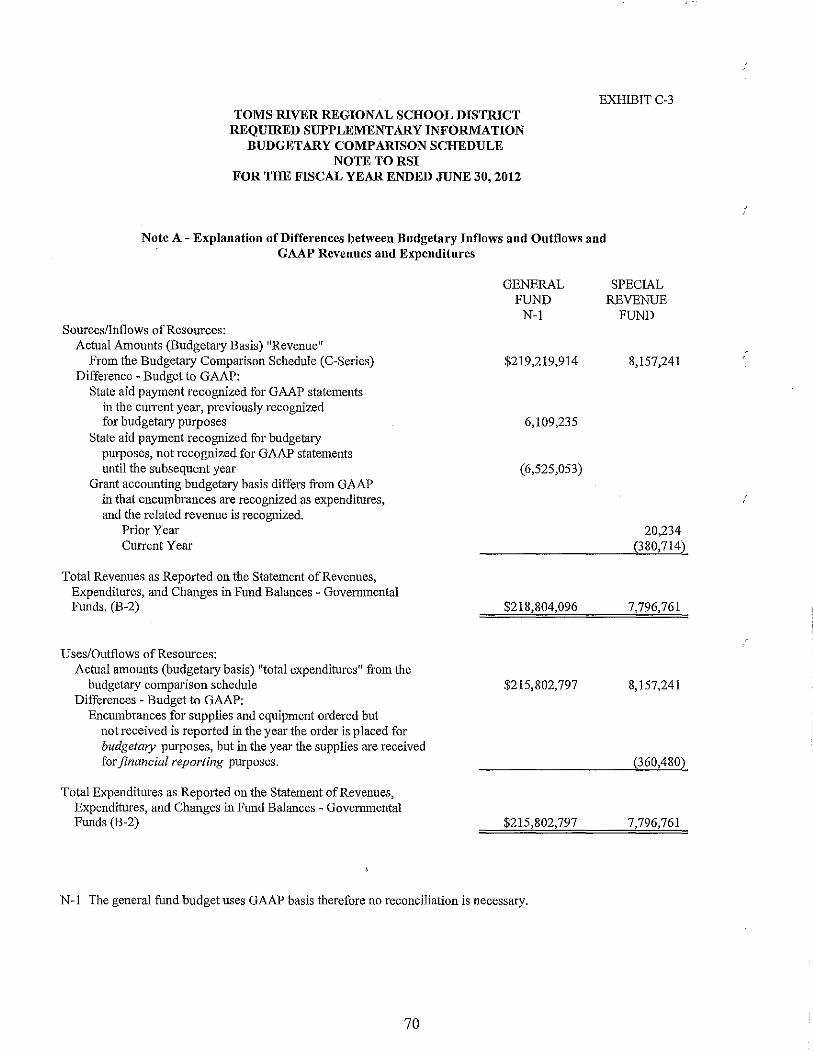
TOMS RIVER REGIONAL SCHOOL DISTRICT REQUIRED SUPPLEMENTARY INFORMATION
BUDGETARY COMPARISON SCHEDULE NOTE TO RSI
FOR THE FISCAL YEAR ENDED JUNE 30, 2012
EXHIBIT C-3
Note A - Explanation of Differences between Budgetary Inflows and Outflows and GAAP Revenues and Expenditures
Sources/Inflows of Resources: Actual Amounts (Budgetary Basis) "Revenue"
From the Budgetary Comparison Schedule (C-Series) Difference - Budget to GAAP:
State aid payment recognized for GAAP statements in the current year, previously recognized for budgetary purposes
State aid payment recognized for budgetalY purposes, not recognized for GAAP statements until the subsequent year
Grant accounting budgetalY basis differs from GAAP in that encumbrances are recognized as expenditures, aud the related revenue is recognized.
Prior Year Current Year
Total Revenues as Repolted on the Statement of Revenues, Expenditnres, aud Changes in Fund Balances - Governmental Funds. (B-2)
Uses/Outflows of Resources: Actual amounts (budgetary basis) "total expenditures" from the
budgetary comparison schedule Differences - Budget to GAAP:
Encumbrances for supplies and equipment ordered but not received is reported in the year the order is placed for budgetary purposes, but in the year the supplies are received for financial reporting purposes.
Total Expenditures as Reported on the Statement of Revenues, Expenditnres, and Chauges in Fund Balauces - Governmental Funds (B-2)
GENERAL FUND
N-J
$219,219,914
6,109,235
(6,525,053)
$218,804,096
$215,802,797
$215,802,797
N-I The general fund budget uses GAAP basis therefore no reconciliation is necessary.
70
SPECIAL REVENUE
FUND
8,157,241
20,234 (380,714)
7,796,761
8,157,241
(360,480)
7,796,761

OTHER SUPPLEMENTARY INFORMATION

D. School Based Budget Schedules
Not Applicable


E. Special Revenue Fund

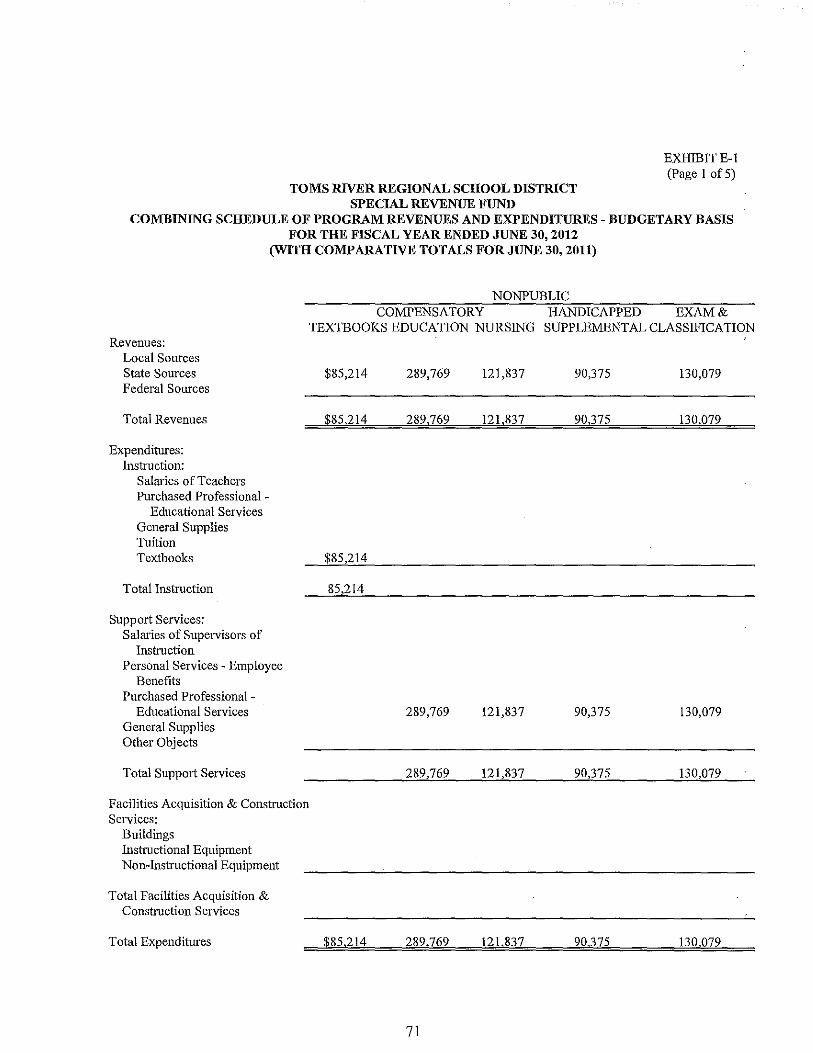
EXHlBITE-I (Page 1 of 5)
TOMS RIVER REGIONAL SCHOOL DISTRICT SPECIAL REVENUE FUND
COMBINING SCHEDULE OF PROGRAM REVENUES AND EXPENDITURES - BUDGETARY BASIS FOR THE FISCAL YEAR ENDED JUNE 30, 2012
(WITH COMPARATIVE TOTALS FOR JUNE 30, 2011)
NONPUBLIC COMPENSATORY HANDICAPPED EXAM &
TEXTBOOKS EDUCATION NURSING SUPPLEMENTAL CLASSIFICATION Revenues:
Local Sources State Sources $85,214 289,769 121,837 90,375 130,079 Federal Sources
Total Revenues $85,214 289,769 121,837 90,375 130,079
Expenditures: Instruction:
Salaries of Teachers Purchased Professional -
Educational Services General Supplies Tuition Textbooks $85,214
Total Instruction 85,214
Support Services: Salaries of Supervisors of
Instruction Personal Services - Employee
Benefits Purchased Professional -
Educational Services 289,769 121,837 90,375 130,079 General Supplies Other Objects
Total Support Services 289,769 121,837 90,375 130,079
Facilities Acquisition & Construction Services:
Buildings Instmctional Equipment Non-Instructional Equipment
Total Facilities Acquisition & Construction Services
Total Expenditures ~85,214 289,769 121,837 90,375 130,079
71
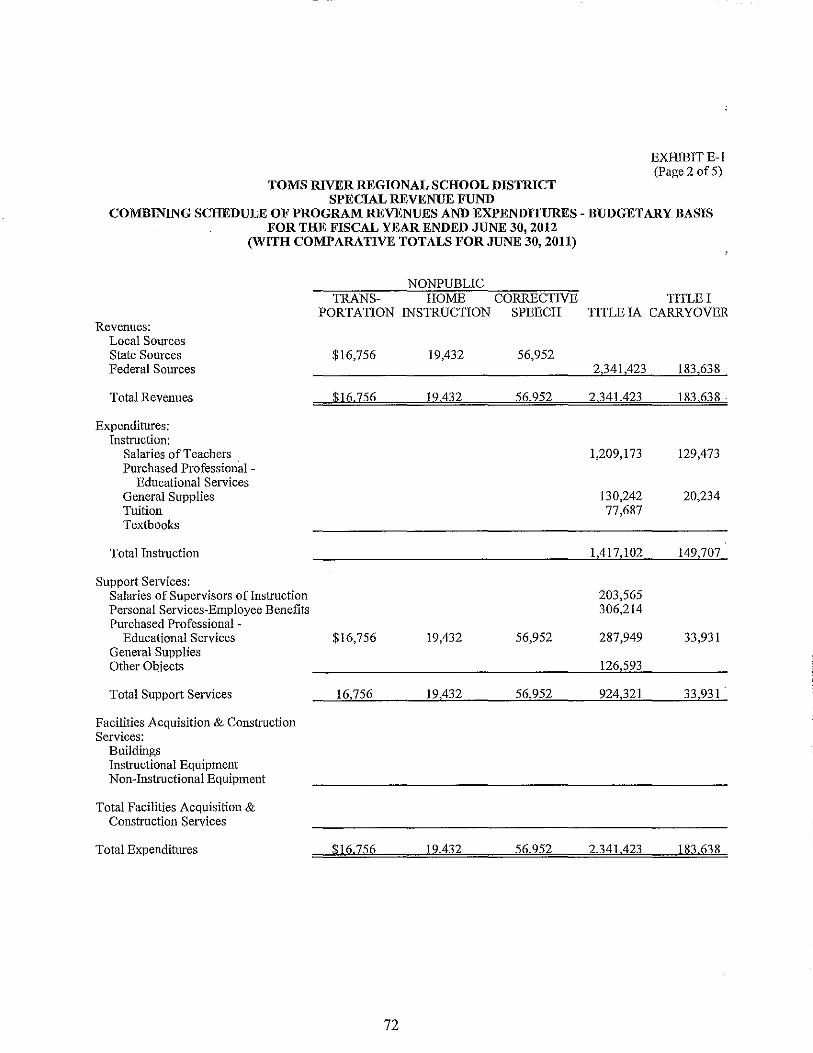
EXHIBITE-1 (Page 2 of5)
TOMS RIVER REGIONAL SCHOOL DISTRICT SPECIAL REVENUE FUND
COMBINING SCHEDULE OF PROGRAM REVENUES AND EXPENDITURES - BUDGETARY BASIS FOR THE FISCAL YEAR ENDED JUNE 30, 2012
(WITH COMPARATIVE TOTALS FOR JUNE 30, 2011)
NONPUBLIC TRANS- HOME CORRECTIVE TITLE I
PORTATION INSTRUCTION SPEECH TITLE IA CARRYOVER Revenues:
Local Sources State Sources $16,756 19,432 56,952 Federal Sources 2,341,423 183,638
Total Revenues $16756 19,432 56952 2341.423 183638 .
Expenditures: Instruction:
Salaries of Teachers 1,209,173 129,473 Purchased Professional -
Educational Services General Supplies 130,242 20,234 Tuition 77,687 Textbooks
Total Instruction 1,417,102 149,707
Support Services: Salaries of Supervisors of Instruction 203,565 Personal Services-Employee Benefits 306,214 Purchased Professional -
Educational Services $16,756 19,432 56,952 287,949 33,931 General Supplies Other Objects 126,593
Total Support Services 16,756 19,432 56,952 924,321 33,931
Facilities Acquisition & Construction Services:
Buildings Instructional Equipment Non-Instructional Equipment
Total Facilities Acquisition & Construction Services
Total Expenditures $16756 19,432 56252 2,341,423 183638
72
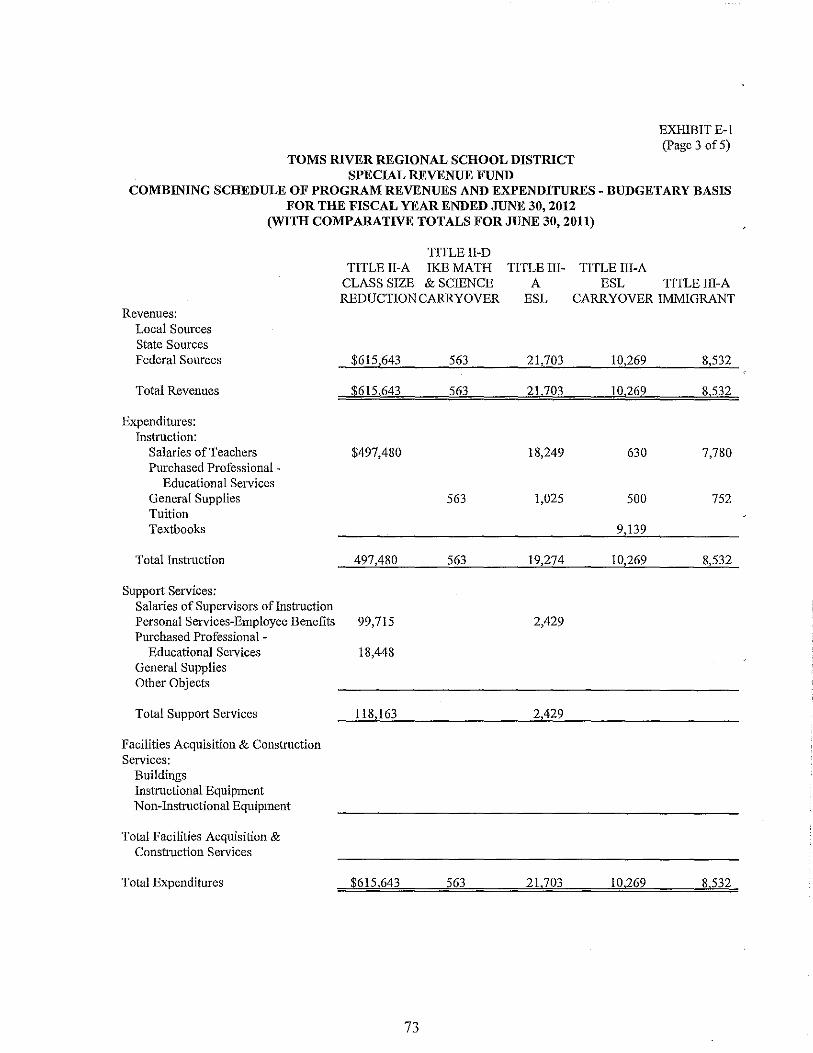
TOMS RIVER REGIONAL SCHOOL DISTRICT SPECIAL REVENUE FUND
EXHIBIT E-l (Page 3 of 5)
COMBINING SCHEDULE OF PROGRAM REVENUES AND EXPENDITURES - BUDGETARY BASIS FOR THE FISCAL YEAR ENDED JUNE 30, 2012
(WITH COMPARATIVE TOTALS FOR JUNE 30, 2011)
Revenues: Local Sources State Sources Federal Sources
Total Revenues
Expenditures: Instruction:
Salaries of Teachers Purchased Professional -
Educational Services General Supplies Tuition Textbooks
Total Instruction
Support Services: Salaries of Supervisors ofInstruction
TITLE II-D TITLE II-A IKE MATH
CLASS SIZE & SCIENCE REDUCTION CARRYOVER
$615,643 563
$615,643 563
$497,480
563
497,480 563
Personal Services-Employee Benefits 99,715 Purchased Professional -
Educational Services General Supplies Other Objects
Total Support Services
Facilities Acquisition & Construction Services:
Buildings Instructional Equipment Non-Instructional Equipment
Total Facilities Acquisition & ConstLuction Services
Total Expenditures
18,448
118,163
$615,643 563
73
TITLE III- TITLE III-A A ESL TITLE III-A
ESL CARRYOVER IMMIGRANT
21,703 10,269 8,532
21,703 10,269 8,532
18,249 630 7,780
1,025 500 752
9,139
19,274 10,269 8,532
2,429
2,429
21,703 10,269 8.532
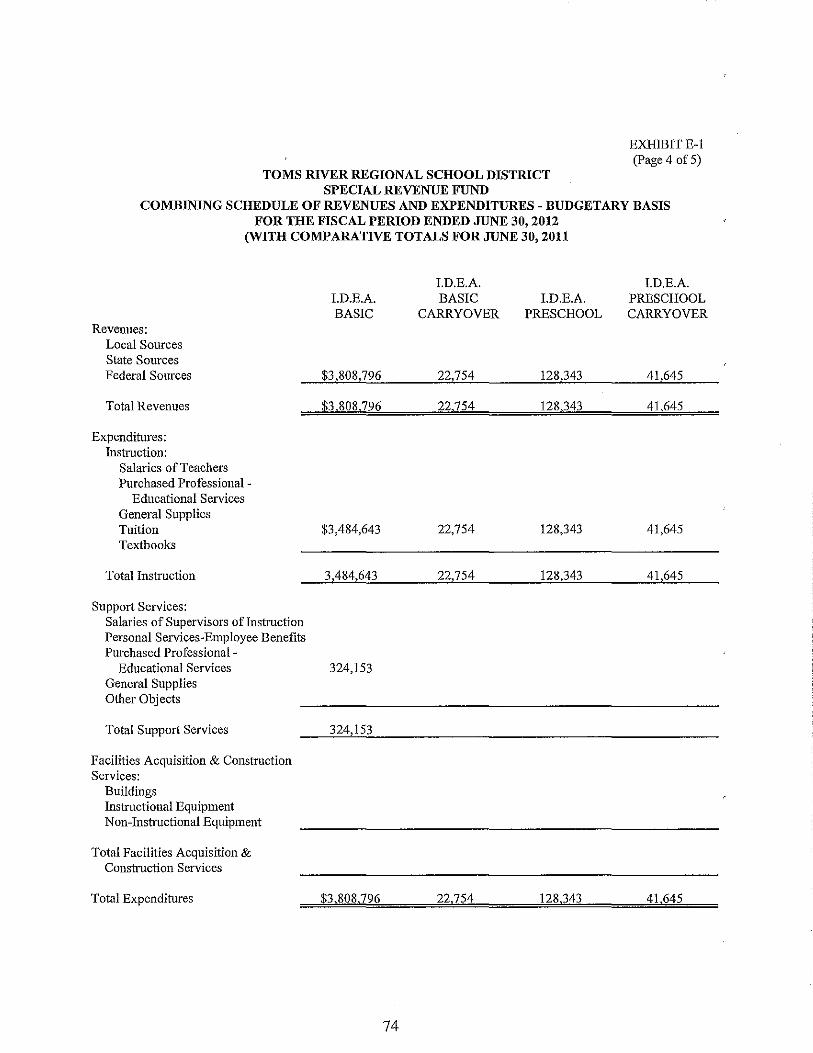
EXHIBITE-I (page 4 of5)
TOMS RIVER REGIONAL SCHOOL DISTRICT SPECIAL REVENUE FUND
COMBINING SCHEDULE OF REVENUES AND EXPENDITURES - BUDGETARY BASIS FOR THE FISCAL PERIOD ENDED JUNE 30, 2012
(WITH COMPARATIVE TOTALS FOR JUNE 30, 2011
I.D.E.A. I.D.E.A. I.D.E.A. BASIC I.D.E.A. PRESCHOOL BASIC CARRYOVER PRESCHOOL CARRYOVER
Revenues: Local Sources State Sources Federal Sources $3,808,796 22,754 128,343 41,645
Total Revenues $3.808.796 22.754 128.343 41,645
Expenditures: Instruction:
Salaries of Teachers Purchased Professional -
Educational Services General Supplies Tuition $3,484,643 22,754 128,343 41,645 Textbooks
Total Instruction 3,484,643 22,754 128,343 41,645
Support Services: Salaries of Supervisors of Iostruction Personal Services-Employee Benefits Purchased Professional -
Educational Services 324,153 General Supplies Other Objects
Total SUppOlt Services 324,153
Facilities Acquisition & Construction Services:
Buildings Instructional Equipment Non-Instructional Equipment
Total Facilities Acquisition & Consuuction Services
Total Expenditures $3,808,796 22,754 128,343 41,645
74
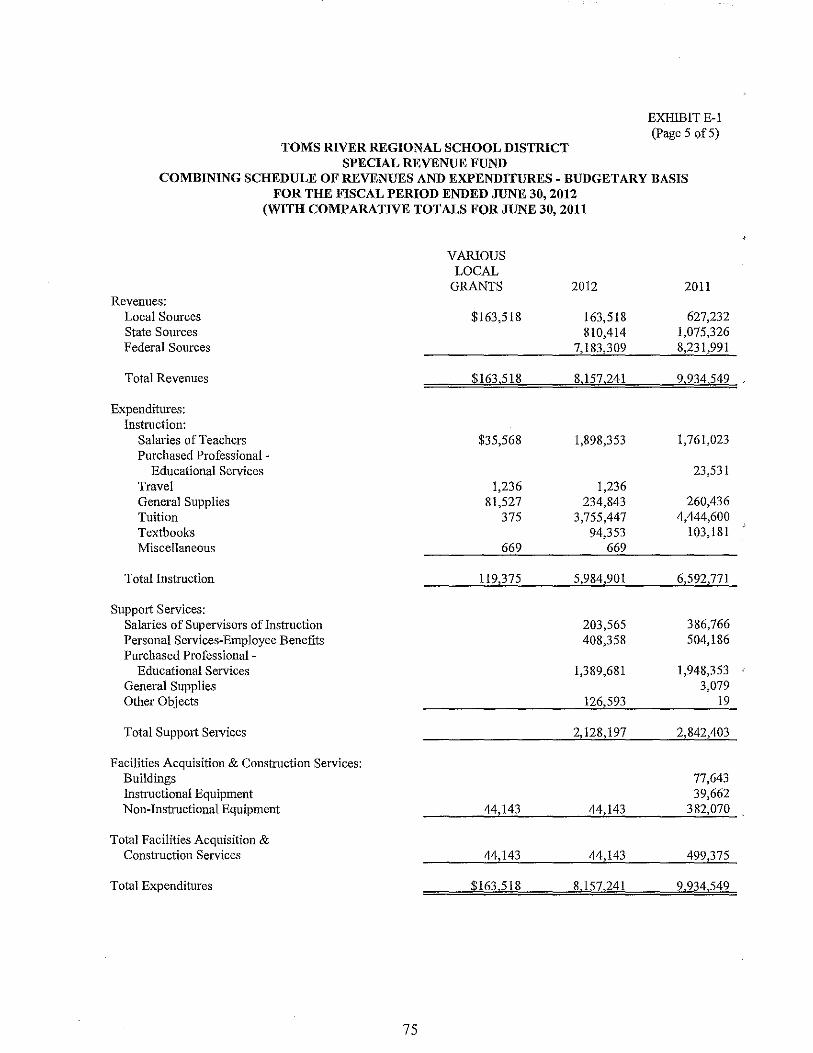
TOMS RIVER REGIONAL SCHOOL DISTRICT SPECIAL REVENUE FUND
EXHIBITE-l (Page 5 of5)
COMBINING SCHEDULE OF REVENUES AND EXPENDITURES - BUDGETARY BASIS FOR THE FISCAL PERIOD ENDED JUNE 30, 2012
(WITH COMPARATIVE TOTALS FOR JUNE 30, 2011
Revenues: Local Sources State Sources Federal Sources
Total Revenues
Expenditures: Instruction:
Salaries of Teachers Purchased Professional -
Educational Services Travel General Supplies Tuition Textbooks Miscellaneous
Total Instruction
Support Services: Salaries of Supervisors oflnstruction Personal Services-Employee Benefits Purchased Professional -
Educational Services General Supplies Other Objects
Total Support Selvices
Facilities Acquisition & Construction Services: Buildings Insnuctional Equipment Non-Instructional Equipment
Total Facilities Acquisition & Consuuction Services
Total Expenditures
75
VARIOUS LOCAL
GRANTS
$163,518
$163,518
$35,568
1,236 81,527
375
669
119,375
44,143
44,143
$163,518
2012
163,518 810,414
7,183,309
8,157,241
1,898,353
1,236 234,843
3,755,447 94,353
669
5,984,901
203,565 408,358
1,389,681
126,593
2,128,197
44,143
44,143
8,157,241
2011
627,232 1,075,326 8,231,991
9,934.549
1,761,023
23,531
260,436 4,444,600
103,181
6,592,771
386,766 504,186
1,948,353 3,079
19
2,842,403
77,643 39,662
382,070
499,375
9,934,549

F. Capital Projects Fund

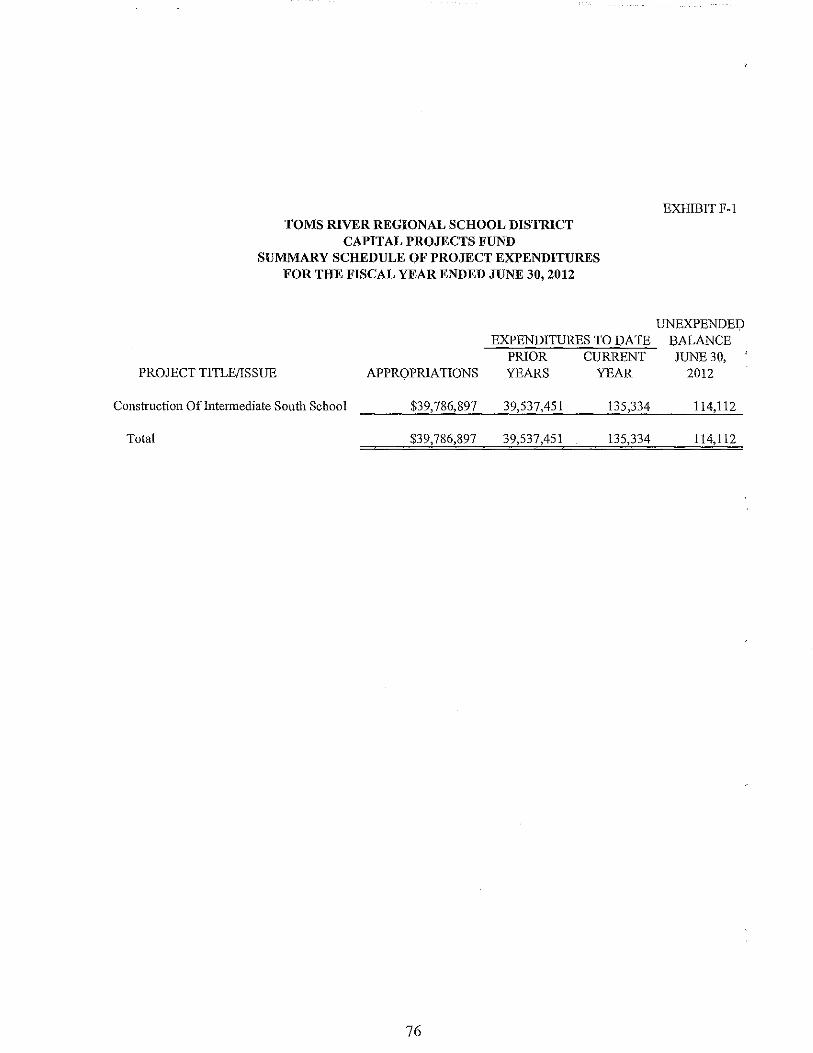
TOMS RIVER REGIONAL SCHOOL DISTRICT CAPITAL PROJECTS FUND
SUMMARY SCHEDULE OF PROJECT EXPENDITURES FOR THE FISCAL YEAR ENDED JUNE 30, 2012
EXHIBITF-I
UNEXPENDEI;l EXPENDITURES TO DATE BALANCE
PRIOR CURRENT JUNE 30, PROJECT TITLE/ISSUE APPROPRIATIONS YEARS YEAR 2012
Cons!mction Of Interrnediate South School $39,786,897 39,537,451 135,334 114,112
Total $39,786,897 39,537,451 135,334 114,112
76
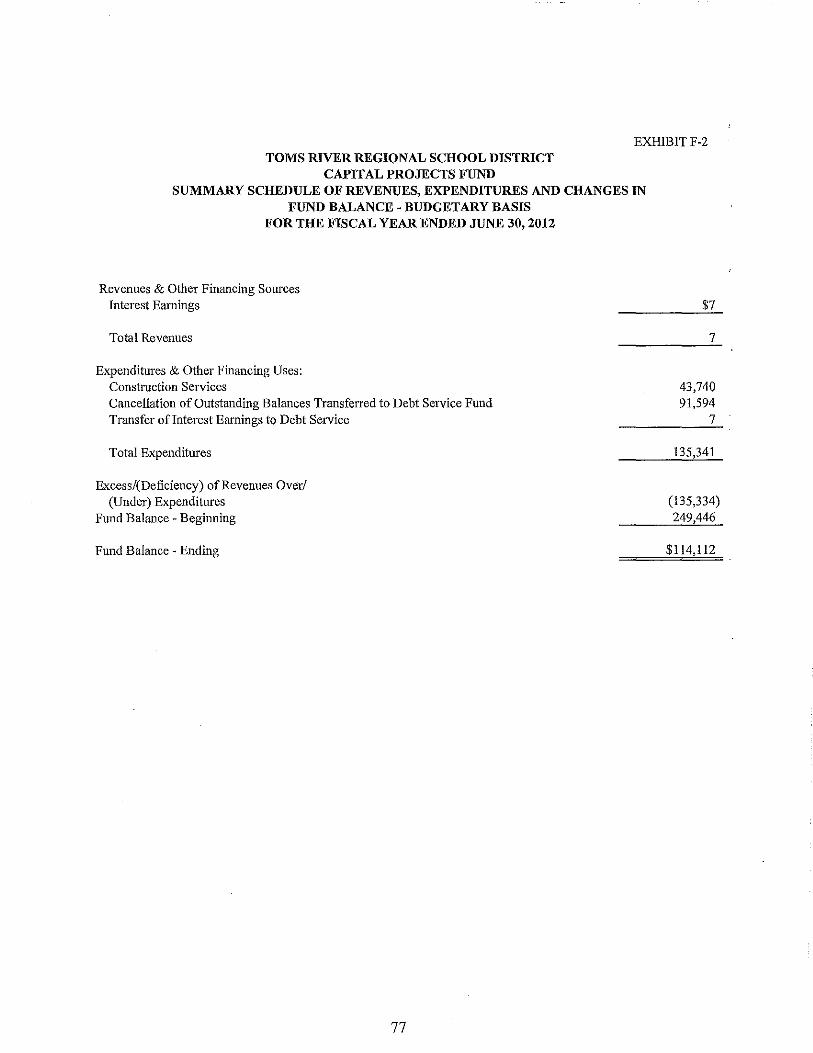
EXHIBITF-2 TOMS RIVER REGIONAL SCHOOL DISTRICT
CAPITAL PROJECTS FUND SUMMARY SCHEDULE OF REVENUES, EXPENDITURES AND CHANGES IN
FUND BALANCE - BUDGETARY BASIS FOR THE FISCAL YEAR ENDED JUNE 30,2012
Revenues & Other Financing Sources Interest Eamings
Total Revenues
Expenditures & Other Financing Uses: Construction Services Cancellation of Outstanding Balances Transferred to Debt Service Fund Transfer ofInterest Earnings to Debt Service
Total Expenditures
Excess!(Deficiency) of Revenues Over! (Under) Expenditures
Fund Balance - BegiIming
Fund Balance - Ending
77
$7
7
43,740 91,594
7
135,341
(135,334) 249,446
$114,112
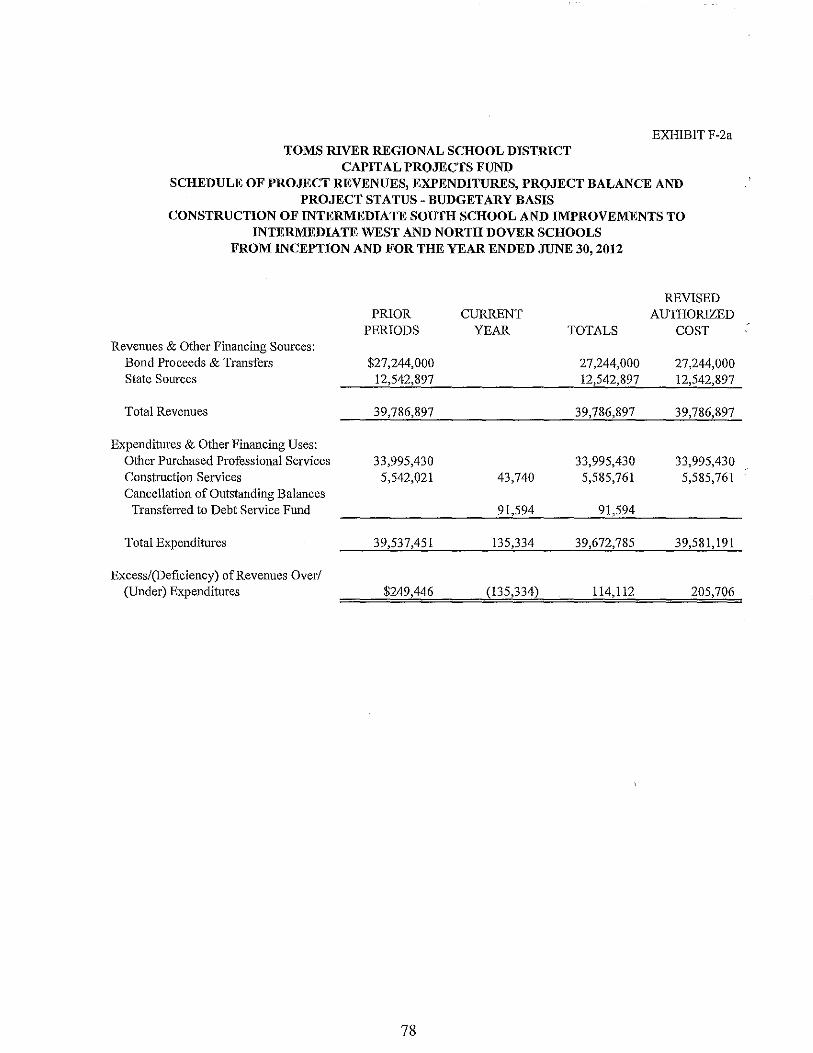
TOMS RIVER REGIONAL SCHOOL DISTRICT CAPITAL PROJECTS FUNJ;l
EXHIBIT F-2a
SCHEDULE OF PROJECT REVENUES, EXPENDITURES, PROJECT BALANCE ANJ;J
PROJECT STATUS - BUDGETARY BASIS CONSTRUCTION OF INTERMEDIATE SOUTH SCHOOL AND IMPROVEMENTS TO
INTERMEDIATE WEST AND NORTH DOVER SCHOOLS FROM INCEPTION AND FOR THE YEAR ENDED JUNE 30, 2012
REVISED PRIOR CURRENT AUTHORIZED
PERIODS YEAR TOTALS COST Revenues & Other Financing Sources:
Bond Proceeds & Transfers $27,244,000 27,244,000 27,244,000 State Sources 12,542,897 12,542,897 12,542,897
Total Revenues 39,786,897 39,786,897 39,786,897
Expenditures & Other Financing Uses: Other Purchased Professional Services 33,995,430 33,995,430 33,995,430 Construction Services 5,542,021 43,740 5,585,761 5,585,761 Cancellation of Outstanding Balances
Transferred to Debt Service Fund 91,594 91,594
Total Expenditures 39,537,451 135,334 39,672,785 39,581,191
Excess/(Deficiency) of Revenues Over/ (Under) Expenditures $249,446 (135,334) 114,112 205,706
78

G. Proprietary Funds

Enterprise Funds

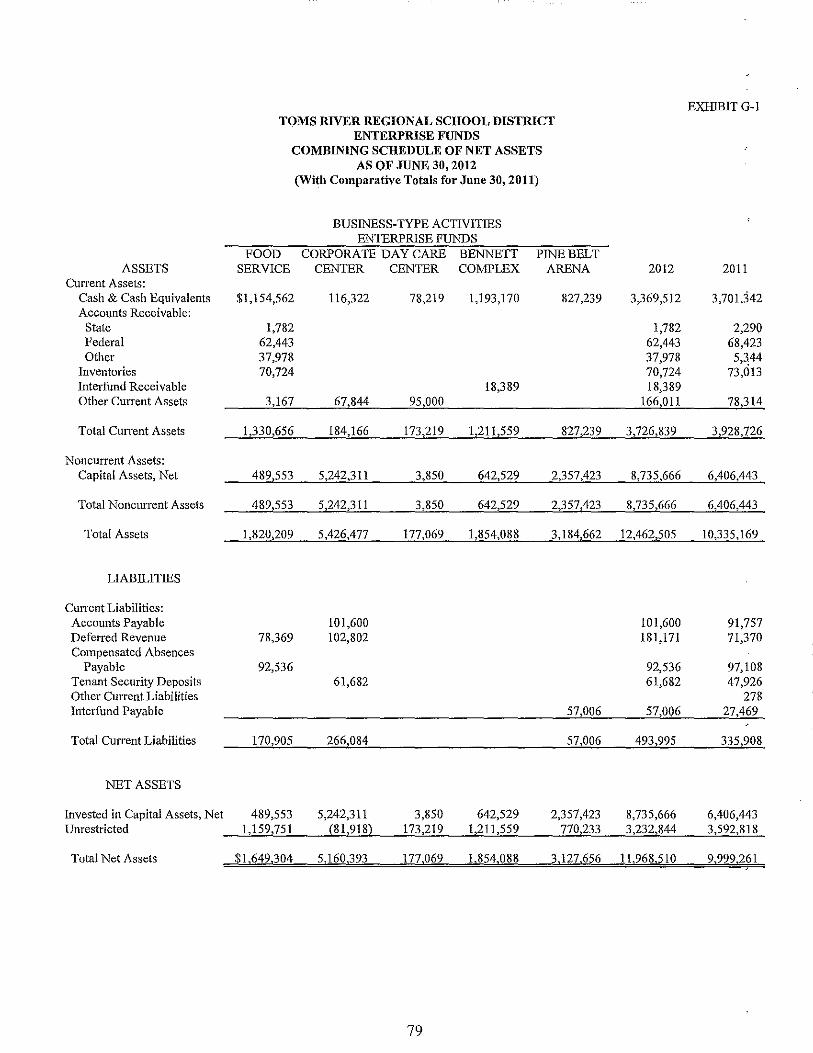
EXIllBITG-1 TOMS RIVER REGIONAL SCHOOL DISTRICT
ENTERPRISE FUNDS COMBINING SCHEDULE OF NET ASSETS
AS OF JUNE 30, 2012 (With Comparative Totals for June 30, 2011)
BUSINESS-TYPE ACTIVITIES ENTERPRISE FUNDS
FOOD CORPORATE DAY CARE BENNETT PINE BELT ASSETS SERVICE CENTER CENTER COMPLEX ARENA 2012 2011
Current Assets: Cash & Cash Equivalents $1,154,562 116,322 78,219 1,193,170 827,239 3,369,512 3,701,342 Accounts Receivable:
State 1,782 1,782 2,290 Federal 62,443 62,443 68,423 Other 37,978 37,978 5,344
Inventories 70,724 70,724 73,013 rnterfund Receivable 18,389 18,389 Other Current Assets 3,167 67,844 95,000 166,011 78,314
Total CUlTent Assets 1,330,656 184,166 173,219 1,211,559 827,239 3,726,839 3,928,726
Noncurrent Assets: Capital Assets, Net 489,553 5,242,311 3,850 642,529 2,357,423 8,735,666 6,406,443
Total Noncurrent Assets 489,553 5,242,311 3,850 642,529 2,357,423 8,735,666 6,406,443
Total Assets 1,820,209 5,426,477 177,069 1,854,088 3,184,662 12,462,505 10,335,169
LIABILITIES
Current Liabilities: Accounts Payable 101,600 101,600 91,757 Deferred Revenue 78,369 102,802 181,171 71,370 Compensated Absences
Payable 92,536 92,536 97,108 Tenant Security Deposits 61,682 61,682 47,926 Other Current Liabilities 278 Interfund Payable 57,006 57,006 27,469
Total Current Liabilities 170,905 266,084 57,006 493,995 335,908
NET ASSETS
Invested in Capital Assets, Net 489,553 5,242,311 3,850 642,529 2,357,423 8,735,666 6,406,443 Unrestricted 1,159,751 (81,918) 173,219 1,211,559 770,233 3,232,844 3,592,818
Total Net Assets ~1,649,304 5,160,393 177,069 1,854,088 3,127,656 11,968,510 9,999,261
79
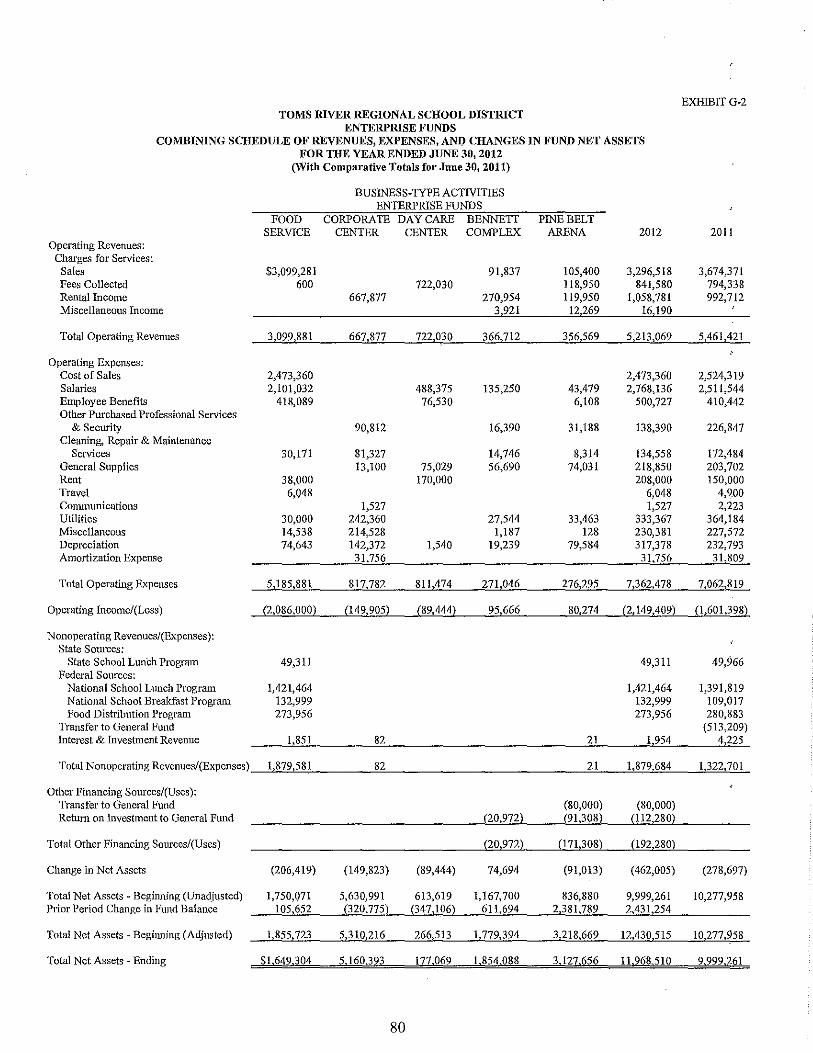
EXHIBITG-2 TOMS RIVER REGIONAL SCHOOL DISTRICT
ENTERPRISE FUNDS COMBINING SCHEDULE OF REVENUES, EXPENSES, AND CHANGES IN FUND NET ASSETS
FOR THE YEAR ENDED JUNE 30, 2012 (With Comparative Totals for June 31), 2011)
BUSINESS-TYPE ACTIVITIES ENTERPRISE FUNDS
FOOD CORPORATE DAYCARE BENNETT PINE BELT SERVICE CENTER CENTER COMPLEX ARENA 2012 201 I
Operating Revenues: Charges for Services:
Sales $3,099,281 91,837 105,400 3,296,518 3,674,371 Fees Collected 600 722,030 118,950 841,580 794,338 Rental Income 667,877 270,954 119,950 1,058,781 992,712 Miscellaneous Income 3,921 12,269 16,190
Total Operating Revenues 3,099,881 667,877 722,030 366,712 356,569 5,213,069 5,461,421
Operating Expenses: Cost of Sales 2,473,360 2,473,360 2,524,319 Salaries 2,101,032 488,375 135,250 43,479 2,768,136 2,511,544 Employee Benefits 418,089 76,530 6,108 500,727 410,442 Other Purchased Professional Services
& Security 90,812 16,390 31,188 138,390 226,847 Cleaning, Repair & Maintenance
Services 30,171 81,327 14,746 8,314 134,558 172,484 General Supplies 13,100 75,029 56,690 74,031 218,850 203,702 Rent 38,000 170,000 208,000 150,000 Travel 6,048 6,048 4,~.00 Communications 1,527 1,527 2,223 Utilities 30,000 242,360 27,544 33,463 333,367 364,184 Miscellaneous 14,538 214,528 1,187 128 230,381 227,572 Depreciation 74,643 142,372 1,540 19,239 79,584 317,378 232,793 Amortization Expense 31,756 31,756 31,809
Total Operating Expenses 5,185,881 817,782 811,474 271,046 276,295 7,362,478 7,062,819
Operating Income/(Loss) (2,086,000) (149,905) (89,444l 95,666 80,274 (2,149,409l (1,601,398)
Nonoperating Revenues/(Expenses): State Sources:
State School Lun'ch Program 49,311 49,311 49,966 Federal Sources:
National School Lunch Program 1,421,464 1,421,464 1,391,819 National School Breakfast Program 132,999 132,999 109,017 Food Distribution Program 273,956 273,956 280,883
Transfer to General Fund (513,209) Interest & Investment Revenue 1,851 82 21 1,954 4,225
Total Nonoperating Revenues/(Expenses) 1,879,581 82 21 1,879,684 1,322,701
Other Financing Sources/(Uses): Transfer to General Fund (80,000) (80,000) Return on Investment to General Fund (20,972l (91,308) (ll2,28Ol
Total Other Financing Sources/(Uses) (20,972l (171,308) (192,280)
Change in Net Assets (206,419) (149,823) (89,444) 74,694 (91,013) (462,005) (278,697)
Total Net Assets - Beginning (Unadjusted) 1,750,071 5,630,991 613,619 1,167,700 836,880 9,999,261 10,277,958 Prior Period Change in Fund Balance 105,652 (320,775) (347,106) 611,694 2,381,789 2,431,254
Total Net Assets - Begilming (AdJusted) 1,855,723 5,310,216 266,513 1,779,394 3,218,669 12,430,515 10,277,958
Total Net Assets - Ending $1,649,304 5 160,393 177 069 1 854.088 3,127,656 11,968510 9,999,261
80
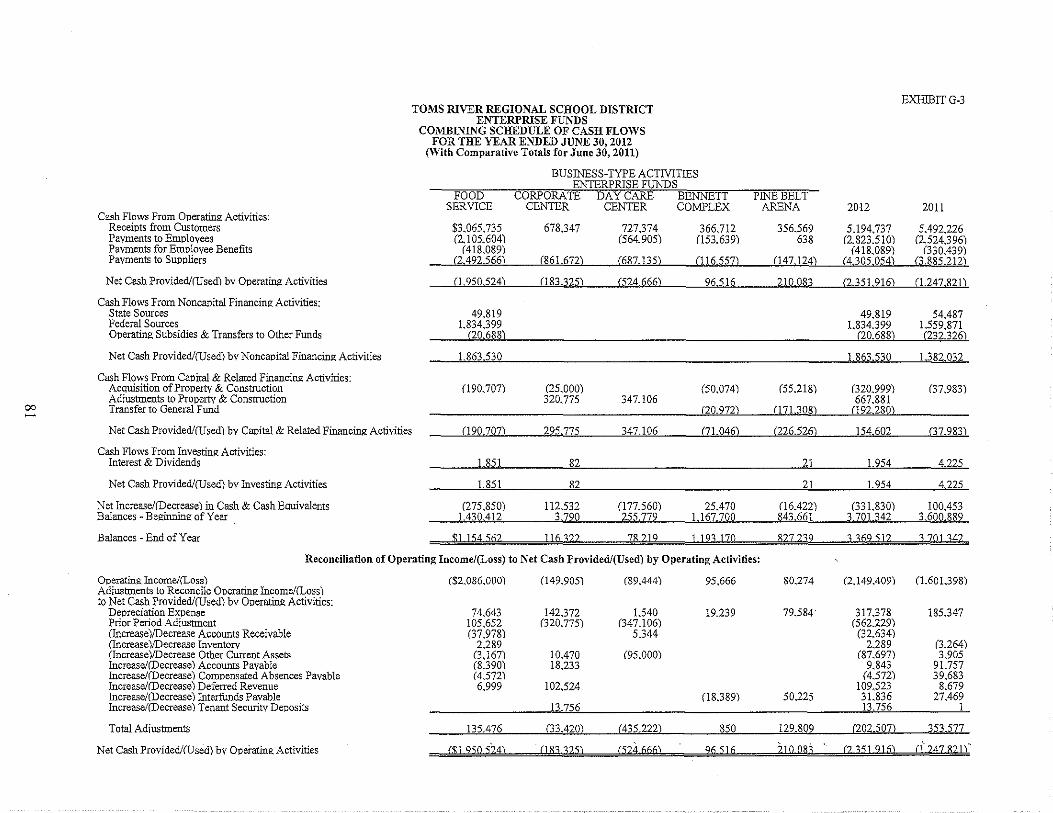
00 ~
EXHIBITG-3 TOMS RIVER REGIONAL SCHOOL DISTRICT
ENTERPRISE FUNDS
Cash Flows From Operating Activities: Receipts from Customers PaYments to Employees Payments for Emplovee Benefits Payments to Suppliers
Net Cash Provided/CUsed) by Operating Activities
Cash Flows From Noncapital Financing Activities: State Sources Federal Sources Operating Subsidies & Transfers to Other Funds
Net Cash Provided/CUsed) bv Noncaoital Financing Activities
Cash Flows From Capital & Related Financing Activities: Acquisition of Property & Construction Adiustments to Property & Construction Transfer to General Fund
Net Cash Provided/(Used) by Capital & Related Financing Activities
Cash Flows From Investing Activities: Interest & Dividends
Net Cash Provided/(Used) bv Investing Activities
Net Increase/(Decrease) in Cash & Cash Equivalents Balances - Beginning of Year
Balances - End of Year
COMBINING SCHEDULE OF CASH FLOWS FOR THE YEAR ENDED JUNE 30, 2012
(With Comparative Totals for June 30, 2011)
FOOD SERVICE
BUSINESS-TYPE ACTIVITIES ENTERPRlSE FUNDS
CORPORATE DAYCARE BENNETT CENTER CENTER COMPLEX
PINE BELT ARENA 2012 2011
$3,065,735 678,347 727,374 366,712 356,569 5.194,737 5.492,226 (2,105,604) (564,905) (153,639) 638 (2,823.510) (2,524.396)
(418,089) (418,089) (330.439) (2.492,566) (861.672) (687135) Cl16557) (147124) (4305054) 13,885.212)
(1950524) (183.325) (524666) 96516 210 083 (2.351916) (1.247821)
49.819 49.819 54.487 1.834.399 1.834.399 1.559,871
(20.688) (20.688) (232.326)
1.863.530
(190,707) (25,000) 320,775 347.106
1.863.530 1.382.032
(50,074) (55.218) (320,999) (37.983) 667.881
(20.972) .DIL1ll8) (192.280)
(190,707) 295.775 347.106 C71 046) (226.526) 154602 (37.983)
1.851
1.851
(275,850) 1.430.412
82
82
112532 3,790
(177560) 255,779
25.470 1.167,700
21
21
(16.422) 843.661
1.954
1.954
(331.830) 3.701.342
4.225
4,225
100.453 3,600.889
~1l5451i2 116.122 7R219 1191170 R27239 1109512 DOU42
Reconciliation of Operating Income/(Loss) to Net Cash Provided/(Used) by Operating Activities:
Operating Income/(Loss) Adiustments to Reconcile Operating Income/CLoss) to Net Cash Provided/(Used) bv Operating Activities:
Depreciation Expense Prior Period Adiustment (Increase )/Decrease Accounts Receivable (lncrease)!Decrease Inventorv (Increase)!Decrease Other Current Assets Increase/(Decrease) Accounts Pavable Increase/(Decrease) Compensated Absences Pavable Increase/(Decrease) Deferred Revenue Increase/(Decrease) Interfimds Pavable Increase/(Decrease) Tenant Security Deposits
Total Adiustments
Net Cash Provided/CUsed) bv Operating Activities
($2,086,000) (149.905) (89,444) 95,666 80.274 (2,149.409) (1.601.398)
74,643 142,372 1.540 19,239 79,584 317,378 185,347 105,652 (320,775) (347,106) (562.229) (37,978) 5.344 (32,634)
2,289 2,289 (3.264) (3,167) 10.470 (95,000) (87,697) 3,905 (8.390) 18.233 9,843 91.757 (4572) (4572) 39,683 6,999 102524 109,523 8,679
(18,389) 50,225 31,836 27.469 13.756 13,756 1
135.476 (33.420) (435,222) 850 129,809 (202.507) 3,1577
($J 950524) (]83325) (524666) 96516 210083 (?351916) cf24782J)"

Internal Service Fund
Not Applicable

H. Fiduciary Fund

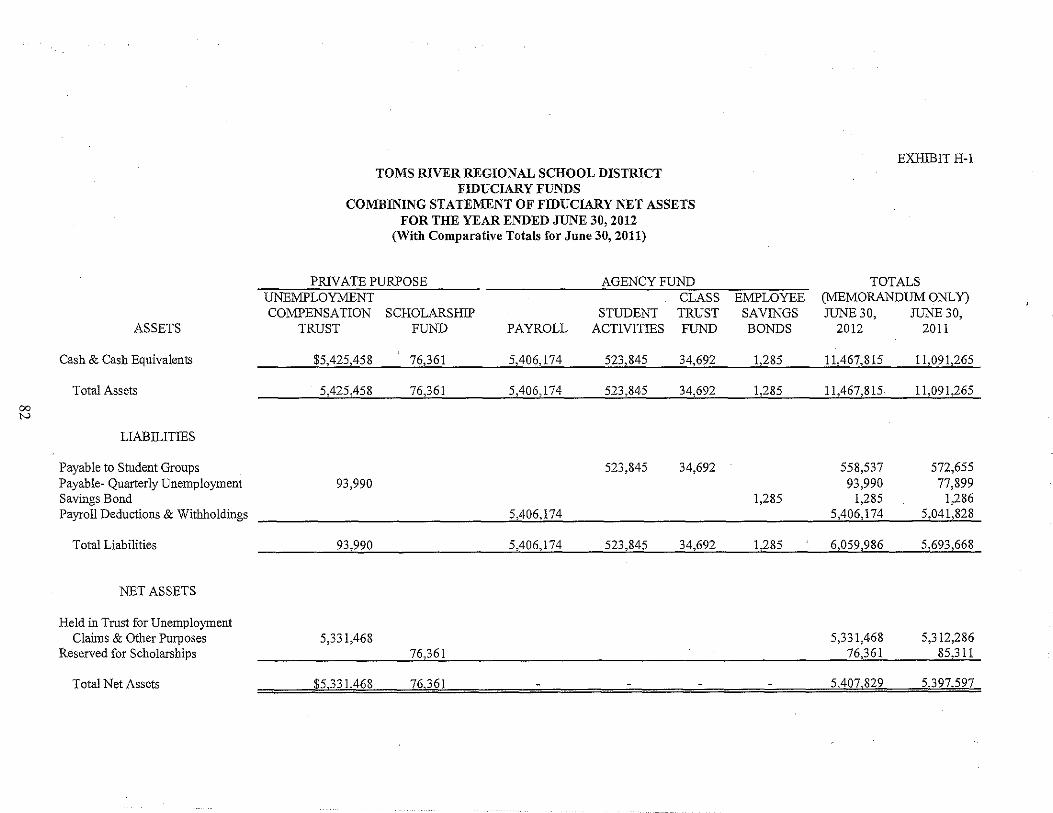
00 tv
TOMS RIVER REGIONAL SCHOOL DISTRICT FIDUCIARY FUNDS
COMBINING STATEMENT OF FIDUCIARY NET ASSETS FOR THE YEAR ENDED JUNE 30, 2012
(With Comparative Totals for June 30,2011)
EXHIBIT H-1
PRIVATE PURPOSE AGENCY FUND TOTALS UNEMPLOYMENT CLASS EMPLOYEE (MEMORANDUM ONLY) COMPENSATION SCHOLARSHIP STUDENT TRUST SAVINGS JUNE 30, JUNE 30,
ASSETS TRUST FUND PAYROLL ACTIVITIES FUND BONDS 2012 2011
Cash & Cash Equivalents $5,425,458 76,361 5,406,174 523,845 34,692 1,285 11,467,815 11,091,265
Total Assets 5,425,458 76,361 5,406,174 523,845 34,692 1,285 11,467,815 11,091,265
LIABILITIES
Payable to Student Groups 523,845 34,692 558,537 572,655 Payab1e- Quarterly Unemployment 93,990 93,990 77,899 Savings Bond 1,285 1,285 1,286 Payroll Deductions & Withholdings 5,406,174 5,406,174 5,041,828
Total Liabilities 93,990 5,406,174 523,845 34,692 1,285 6,059,986 5,693,668
NET ASSETS
Held in Trust for Unemployment Claims & Other Purposes 5,331,468 5,331,468 5,312,286
Reserved for Scholarships 76,361 76,361 85,311
Total Net Assets $5331.468 76361 _ - __ .. 5,407,829 5397,597
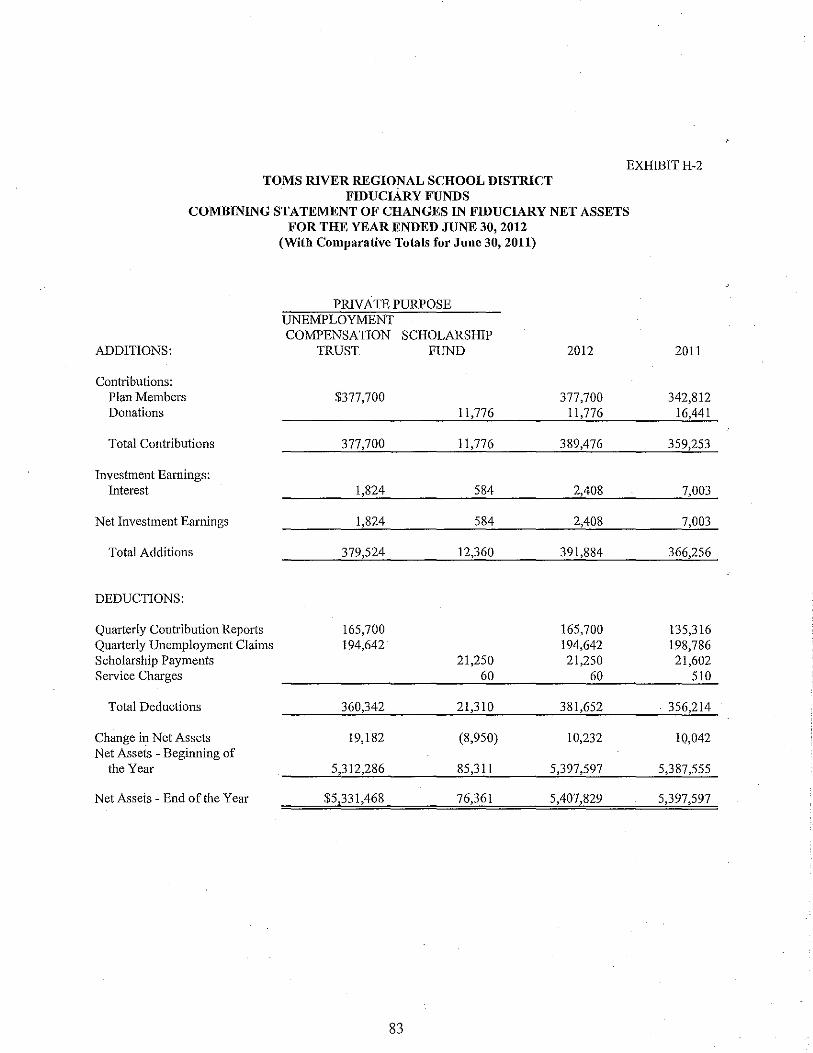
EXHIBITH-2 TOMS RIVER REGIONAL SCHOOL DISTRICT
FIDUCIARY FUNDS COMBINING STATEMENT OF CHANGES IN FIDUCIARY NET ASSETS
FOR THE YEAR ENDED JUNE 30, 2012 (With Comparative Totals for June 30, 2011)
PRIVATE PURPOSE UNEMPLOYMENT COMPENSATION SCHOLARSHIP
ADDITIONS: TRUST FUND 2012
Contributions: Plan Members $377,700 377,700 Donations 11,776 11,776
Total Contributions 377,700 11,776 389,476
Investment Earnings: Interest 1,824 584 2,408
Net Investment Earnings 1,824 584 2,408
Total Additions 379,524 12,360 391,884
DEDUCTIONS:
Quarterly Contribution Reports 165,700 165,700 Qnarterly Unemployment Claims 194,642 194,642 Scholarship Payments 21,250 21,250 Service Charges 60 60
Total Deductions 360,342 21,310 381,652
Change in Net Assets 19,182 (8,950) 10,232 Net Assets - Beginning of
the Year 5,312,286 85,311 5,397,597
Net Assets - End of the Year $5,331,468 76,361 5,407,829
83
2011
342,812 16,441
359,253
7,003
7,003
366,256
135,316 198,786 21,602
510
. 356,214
10,042
5,387,555
5,397,597
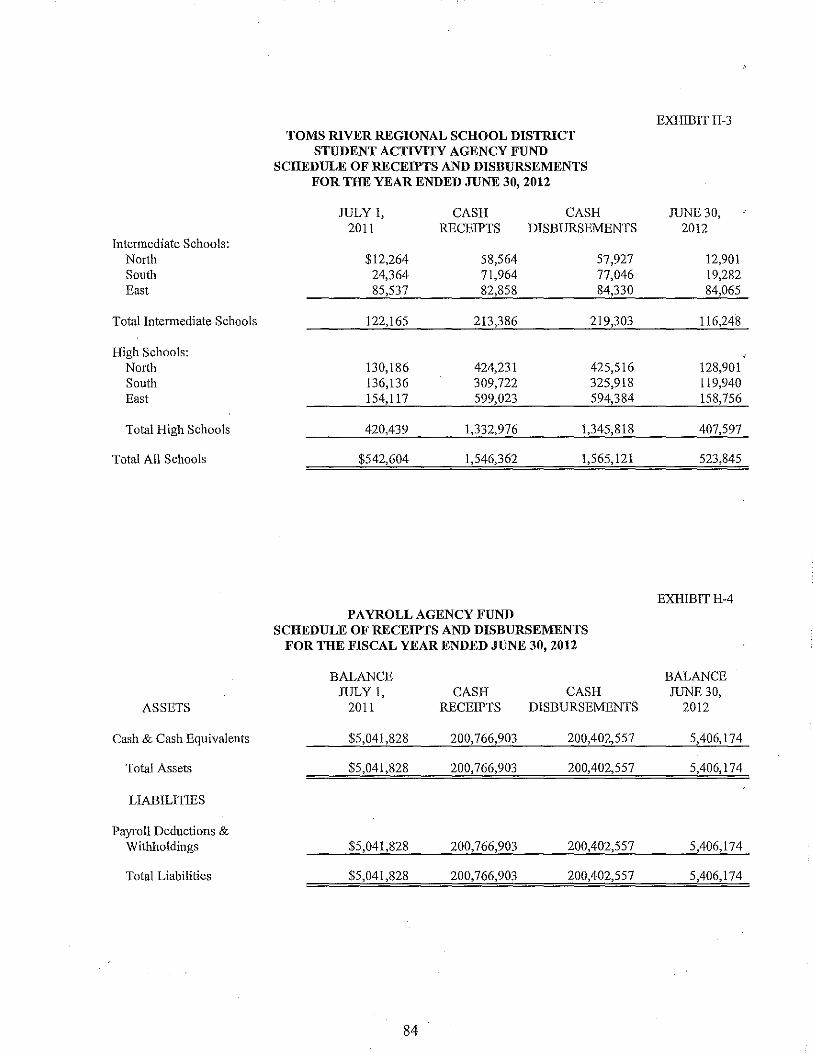
EXHIBlTH-3 TOMS RIVER REGIONAL SCHOOL DISTRICT
STUDENT ACTIVITY AGENCY FUND SCHEDULE OF RECEIPTS AND DISBURSEMENTS
FOR THE YEAR ENDED JUNE 30, 2012
JULY 1, CASH CASH JUNE 30, 2011 RECEIPTS DISBURSEMENTS 2012
Intermediate Schools: North $12,264 58,564 57,927 12,901 South 24,364 71,964 77,046 19,282 East 85,537 82,858 84,330 84,065
Total Intennediate Schools 122,165 213,386 219,303 116,248
High Schools: North 130,186 424,231 425,516 128,901 South 136,136 309,722 325,918 119,940 East 154,117 599,023 594,384 158,756
Total High Schools 420,439 1,332,976 1,345,818 407,597
Total All Schools $542,604 1,546,362 1,565,121 523,845
EXHIBITH-4 PAYROLL AGENCY FUND
SCHEDULE OF RECEIPTS AND DISBURSEMENTS FOR THE FISCAL YEAR ENDED JUNE 30, 2012
BALANCE BALANCE JULY 1, CASH CASH JUNE 30,
ASSETS 2011 RECEIPTS DISBURSEMENTS 2012
Cash & Cash Equivalents $5,041,828 200,766,903 200,402,557 5,406,174
Total Assets $5,041,828 200,766,903 200,402,557 5,406,174
LIABILITIES
Payroll Deductions & Withholdings $5,041,828 200,766,903 200,402,557 5,406,174
Total Liabilities $5,041,828 200,766,903 200,402,557 5,406,174
84
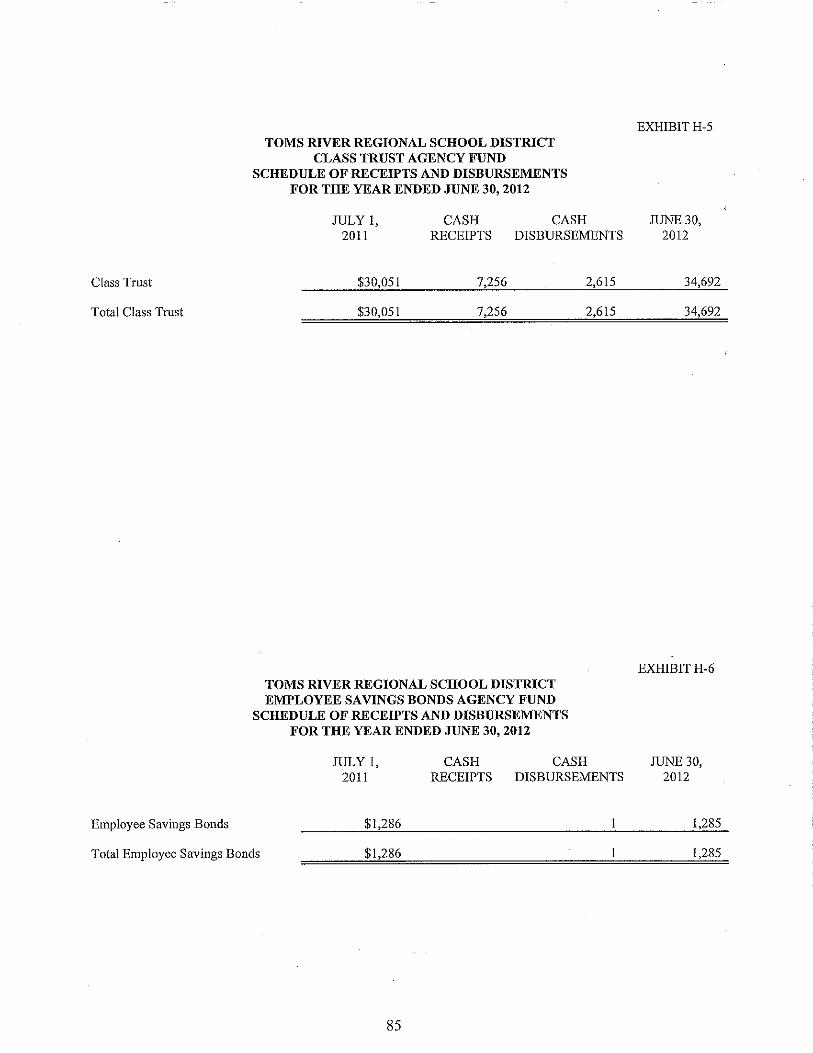
Class Trust
Total Class Trust
Employee Savings Bonds
TOMS RIVER REGIONAL SCHOOL DISTRICT CLASS TRUST AGENCY FUND
SCHEDULE OF RECEIPTS AND DISBURSEMENTS FOR THE YEAR ENDED JUNE 30, 2012
JULY I, 2011
CASH CASH RECEIPTS DISBURSEMENTS
$30,051 7,256
$30,051 7,256
TOMS RIVER REGIONAL SCHOOL DISTRICT EMPLOYEE SAVINGS BONDS AGENCY FUND
SCHEDULE OF RECEIPTS AND DISBURSEMENTS FOR THE YEAR ENDED JUNE 30, 2012
2,615
2,615
JULY I, 2011
CASH CASH RECEIPTS DISBURSEMENTS
$1,286
Total Employee Savings Bonds $1,286
85
EXHIBITH-5
JUNE 30, 2012
34,692
34,692
EXHIBITH-6
JUNE 30, 2012
1,285
1,285

1. Long-TermDebt

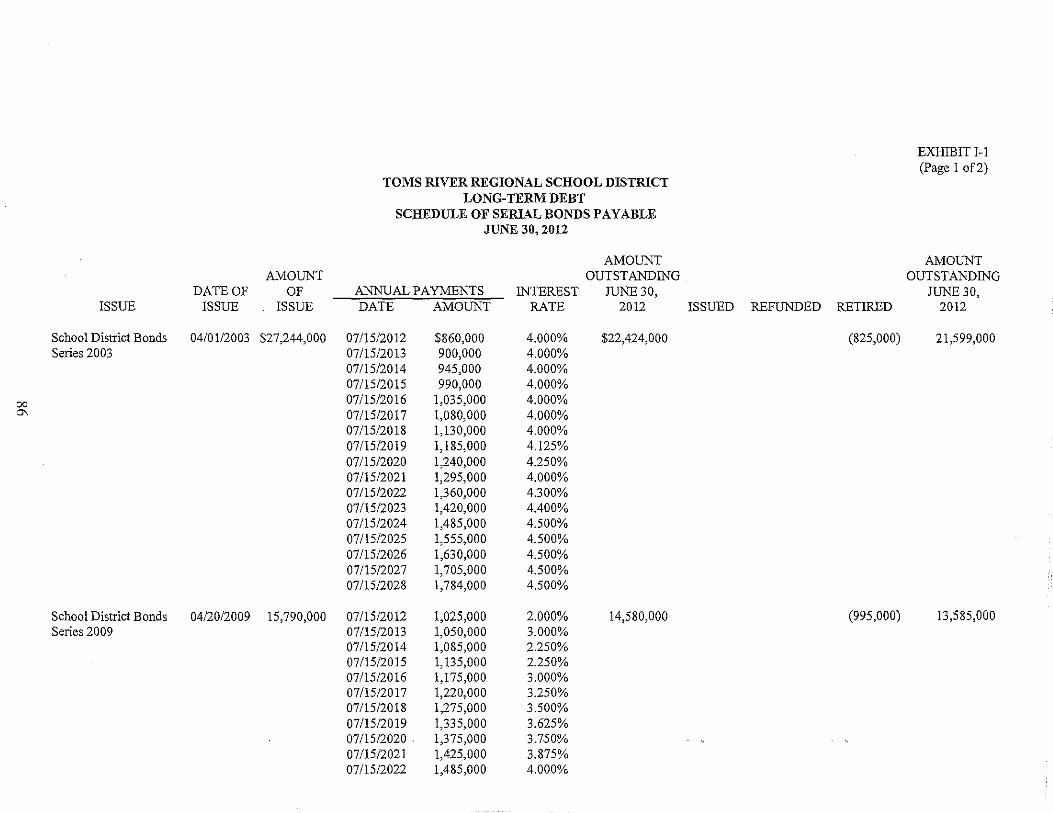
EXillBITI-1 (page 1 of2)
TOMS RIVER REGIONAL SCHOOL DISTRICT LONG-TERM DEBT
SCHEDULE OF SERIAL BONDS PAYABLE JUNE 30, 2012
AMOUNT AMOUNT AMOUNT OUTSTANDING OUTSTANDING
DATE OF OF ANNUAL PAYMENTS INTEREST JUNE 30, JUNE 30, ISSUE ISSUE ISSUE DATE AMOUNT RATE 2012 ISSUED REFUNDED RETIRED 2012
School District Bonds 04/0112003 $27,244,000 07/15/2012 $860,000 4.000% $22,424,000 (825,000) 21,599,000 Series 2003 07/15/2013 900,000 4.000%
07115/2014 945,000 4.000% 07115/2015 990,000 4.000%
00 07/15/2016 1,035,000 4.000% 0\ 07/15/2017 1,080,000 4.000%
07/15/2018 1,130,000 4.000% 07115/2019 1,185,000 4.125% 07115/2020 1,240,000 4.250% 07/15/2021 1,295,000 4.000% 07/15/2022 1,360,000 4.300% 07/15/2023 1,420,000 4.400% 07/15/2024 1,485,000 4.500% 07/15/2025 1,555,000 4.500% 07/15/2026 1,630,000 4.500% 07/1512027 1,705,000 4.500% 07115/2028 1,784,000 4.500%
School District Bonds 04/20/2009 15,790,000 07115/2012 1,025,000 2.000% 14,580,000 (995,000) 13,585,000 Series 2009 07/15/2013 1,050,000 3.000%
07/15/2014 1,085,000 2.250% 07115/2015 1,135,000 2.250% 07/15/2016 1,175,000 3.000% 07/15/2017 1,220,000 3.250% 0711512018 1,275,000 3.500% 07/15/2019 1,335,000 3.625% 07/15/2020 . 1,375,000 3.750% 07115/2021 1,425,000 3.875% 07/15/2022 1,485,000 4.000%
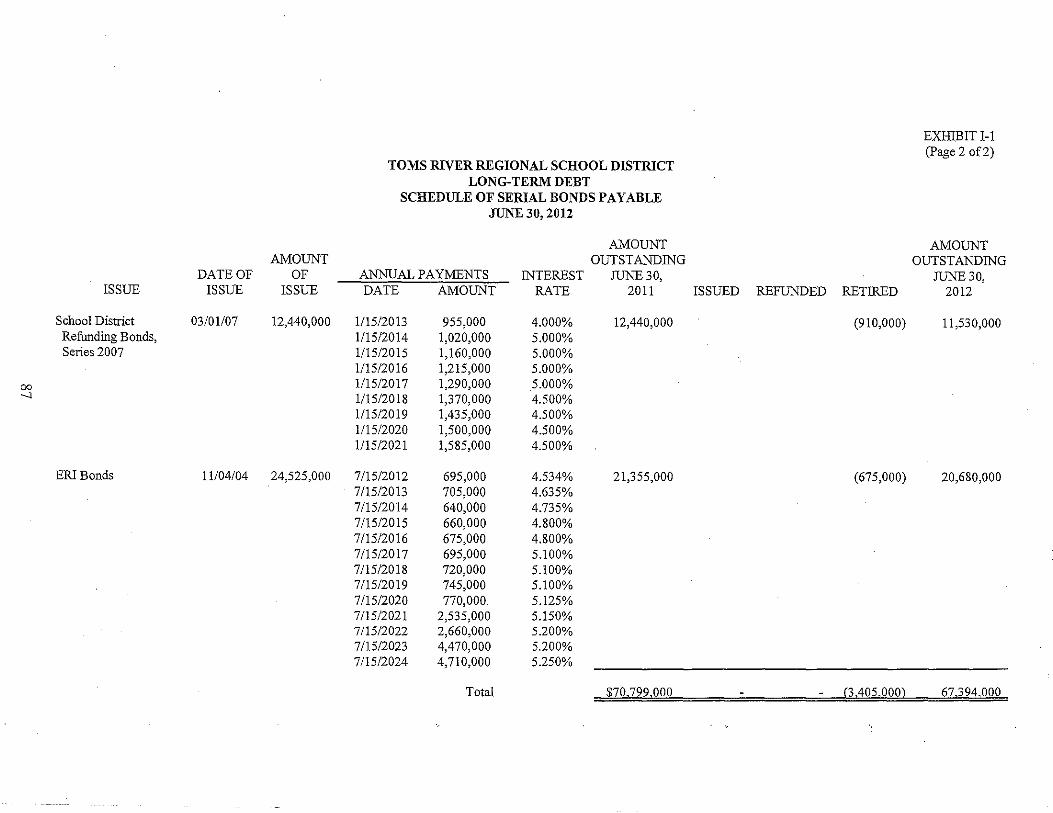
00 ....,
ISSUE
School District Refunding Bonds, Series 2007
ERIBonds
DATE OF ISSUE
03/01107
AMOUNT OF
ISSUE
12,440,000
11104/04 24,525,000
TOMS RIVER REGIONAL SCHOOL DISTRICT LONG-TERM DEBT
SCHEDULE OF SERIAL BONDS PAYABLE JUNE 30, 2012
ANNUAL PAYMENTS
AMOUNT OUTSTANDING
INTEREST ruNE 30, DATE AMOUNT RATE 2011 ISSUED REFUNDED RETIRED
1/15/2013 955,000 4.000% 12,440,000 (910,000) 1115/2014 1,020,000 5.000% 1/15/2015 1,160,000 5.000% 1115/2016 1,215,000 5.000% 1/15/2017 1,290,000 5.000% 1115/2018 1,370,000 4.500% 1/15/2019 1,435,000 4.500% 1115/2020 1,500,000 4.500% 1115/2021 1,585,000 4.500%
7115/2012 695,000 4.534% 21,355,000 (675,000) 7/15/2013 705,000 4.635% 7/1512014 640,000 4.735% 7/15/2015 660,000 4.800% 7/15/2016 675,000 4.800% 7/15/2017 695,000 5.100% 7115/2018 720,000 5.100% 7/15/2019 745,000 5.100% 7/15/2020 770,000. 5.125% 7115/2021 2,535,000 5.150% 7115/2022 2,660,000 5.200% 7/15/2023 4,470,000 5.200% 7115/2024 4,710,000 5.250%
EXHIBITI-l (Page 2 of2)
AMOUNT OUTSTANDING
ruNE 30, 2012
11,530,000
20,680,000
Total $70.799,000 (3,405,000) 67,394,000
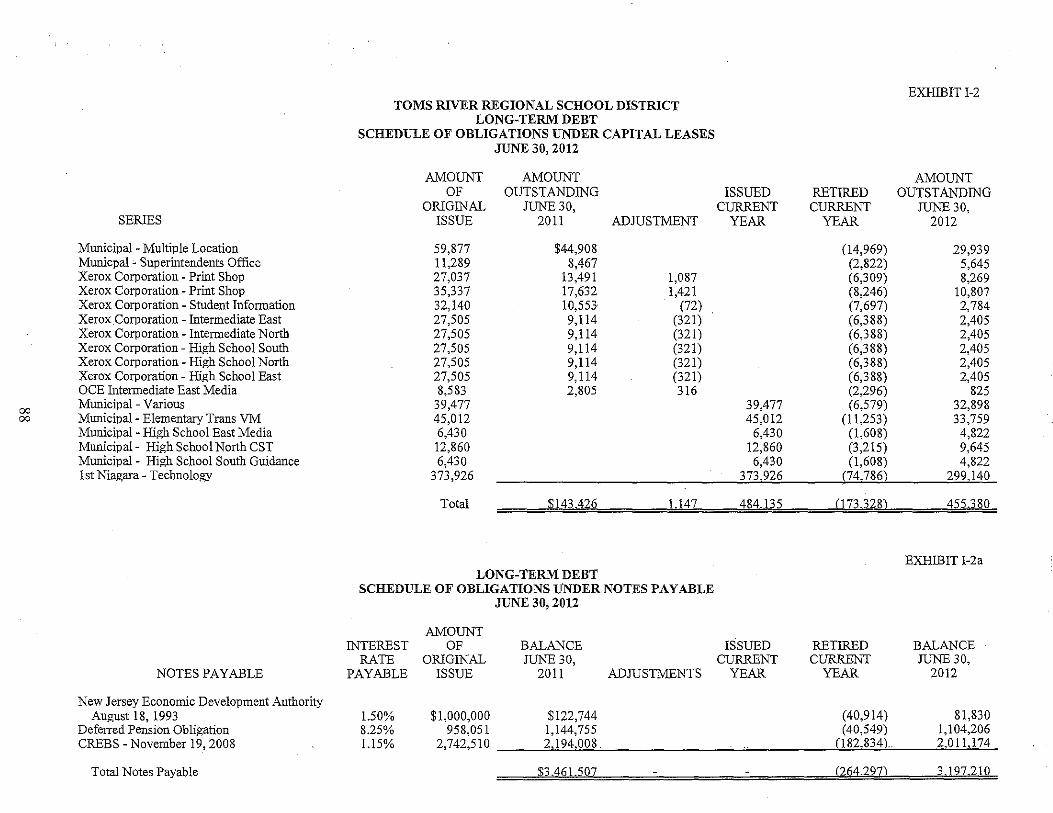
00 00
SERIES
Municipal - Multiple Location Municpal - Superintendents Office Xerox Corporation - Print Shop Xerox Corporation - Print Shop Xerox Corporation - Student Information Xerox Corporation - Intermediate East Xerox Corporation - Intermediate North Xerox Corporation - High School South Xerox Corporation - High School North Xerox Corporation - High School East OCE Intermediate East Medi. Municipal- Various Municipal- Elementary Trans VM Municipal - High School East Media Municipal - High School North CST Municipal - High School South Guidance 1st Niagara - Technology
NOTES PAYABLE
New Jersey Economic Development Authority August 18, 1993
Deferred Pension Obligation CREBS - November 19,2008
Total Notes Payable
TOMS RIVER REGIONAL SCHOOL DISTRICT LONG-TERM DEBT
SCHEDULE OF OBLIGATIONS UNDER CAPITAL LEASES JUNE 30, 2012
AMOUNT OF
ORIGINAL ISSUE
59,877 1l,289 27,037 35,337 32,140 27,505 27,505 27,505 27,505 27,505 8,583
39,477 45,012 6,430 12,860 6,430
373,926
AMOUNT OUTSTANDING
JUNE 30, 20ll ADJUSTMENT
$44,908 8,467
13,491 17,632 10,553 9,1l4 9,1l4 9,1l4 9,1l4 9,1l4 2,805
1,087 1,421
(72) (321) (321) (321) (321) (321) 316
ISSUED CURRENT
YEAR
RETIRED CURRENT
YEAR
EXHIBIT 1-2
AMOUNT OUTSTANDING
JUNE 30, 2012
(14,969) 29,939 (2,822) 5,645 (6,309) 8,269 (8,246) 10,807 (7,697) 2,784 (6,388) 2,405 (6,388) 2,405 (6,388) 2,405 (6,388) 2,405 (6,388) 2,405 (2,296) 825
39,477 (6,579) 32,898 45,012 (1l,253) 33,759
6,430 (1,608) 4,822 12,860 (3,215) 9,645
6,430 (1,608) 4,822 373,926 (74,786) 299,140
Total $1'13,426 ___1.l4L_484,135_fl73328L_ _45i380
EXHIBIT 1-2. LONG-TERM DEBT
SCHEDULE OF OBLIGATIONS UNDER NOTES PAYABLE JUNE 30, 2012
INTEREST RATE
PAYABLE
1.50% 8.25% 1.15%
AMOUNT OF
ORIGINAL ISSUE
BALANCE JUNE 30,
20ll ADmSTMENTS
ISSUED CURRENT
YEAR
RETIRED CURRENT
YEAR
BALANCE JUNE 30,
2012
$1,000,000 $122,744 (40,914) 81,830 958,051 1,144,755 (40,549) 1,104,206
2,742,510 2,194,008 (182,834). 2,01l,174
$3.461.507 (264297L_~.19~210
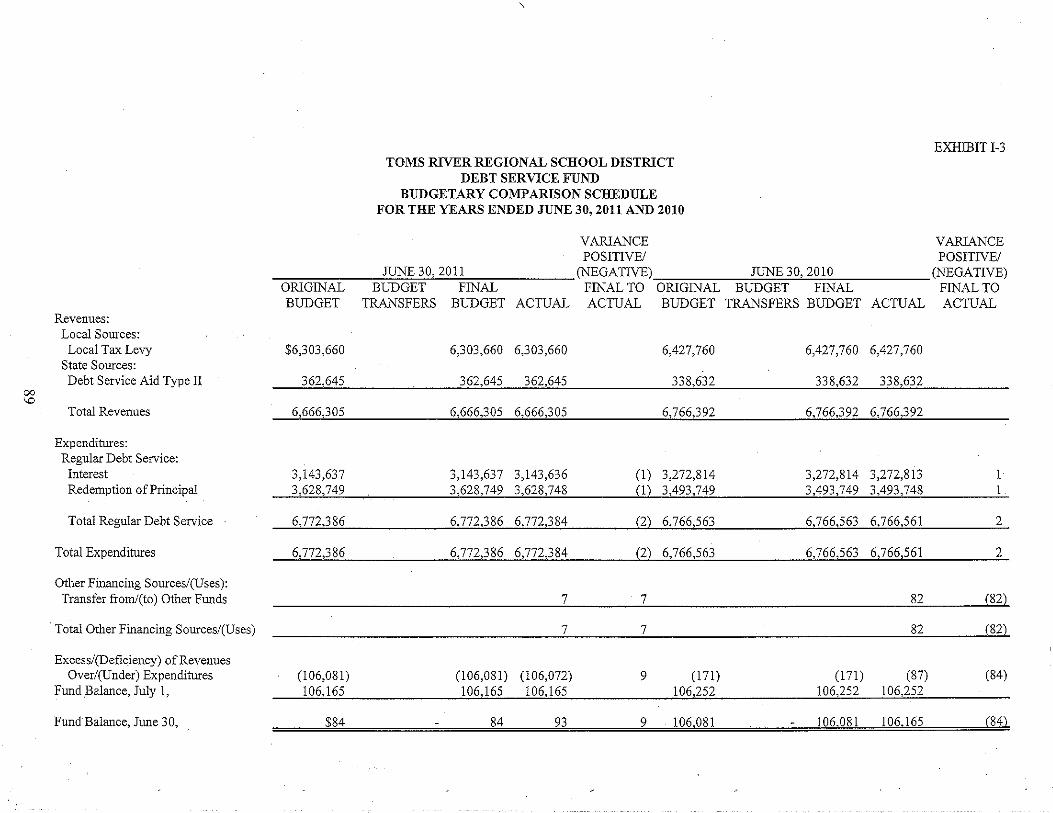
00 \0
Revenues: Local Sources:
Local Tax Levy State Sources: Debt Service Aid Type II
Total Revenues
Expenditures: Regular Debt Service:
Interest Redemption of Principal
Total Regular Debt Service
Total Expenditures
Olber Financing Sources!(Uses): Transfer from/(to) Other Funds
. Total Olber Financing Sources!(Uses)
Excess!(Deficiency) of Revenues Over!(Under) Expenditures
FundBalance, July I,
Fund Balance, June 30,
TOMS RIVER REGIONAL SCHOOL DISTRICT DEBT SERVICE FUND
BUDGETARY COMPARISON SCHEDULE FOR THE YEARS ENDED JUNE 30,2011 AND 2010
VARJANCE POSITIVE!
JUNE 30, 2011 (NEGATIVE) JUNE 30, 2010
EXHIBITI-3
ORIGINAL BUDGET FINAL FINAL TO ORIGINAL BUDGET FINAL
VARIANCE POSITIVE!
(NEGATIVE) FINAL TO
ACTUAL ACTUAL BUDGET TRANSFERS BUDGET ACTUAL ACTUAL BUDGET TRANSFERS BUDGET
$6,303,660 6,303,660 6,303,660 6,427,760 6,427,760 6,427,760
362,645 362,645 362,645 338,632 338,632 338,632
6,666,305 6,666,305 6,666,305 6,766,392 .6,766,392 __ (;,766,392
3,143,637 3,143,637 3,143,636 (I) 3,272,814 3,272,814 3,272,813 I 3,628,749 3,628,749 3,628,748 (I) 3,493,749 3,493,749 3,493,748 I
6,772,386 6,772,386 6,772,384 (2) 6,766,563 6,766,563 6,766,561 2
6,772,386 6,772,386 6,772,384 (2) 6,766,563 6,766,563 6,766,561 2
7 7 82 .®.
7 7 82 .®.
(106,081) (106,081) (106,072) 9 (171) (171) (87) (84) 106,165 106,165 106,165 106,252 106,252 106,252
$84 84 93 9 106,081 106,081 106,165 (84)
STATISTICAL SECTION (Unaudited)

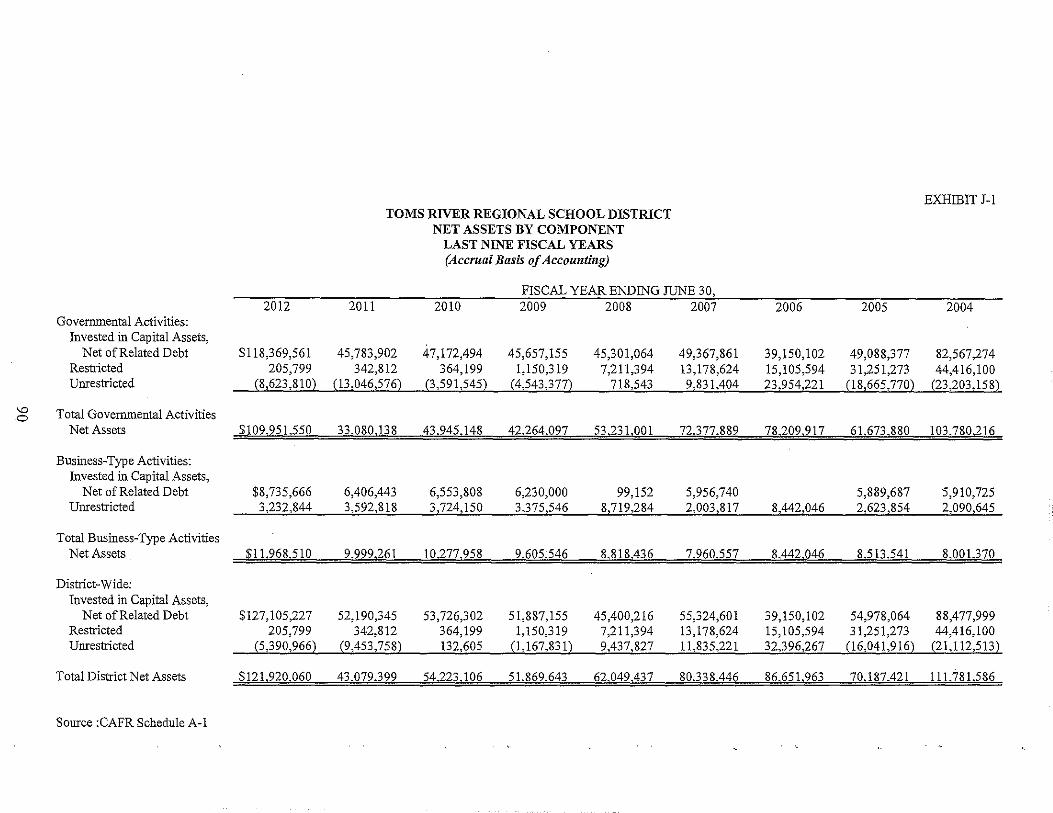
'" o
Governmental Activities: Invested in Capital Assets,
Net of Related Debt Restricted Unrestricted
Total Governmental Activities
2012 2011
TOMS RIVER REGIONAL SCHOOL DISTRICT NET ASSETS BY COMPONENT
LAST NINE FISCAL YEARS (Accrual Basis of Accounting)
FISCAL YEAR ENDING JUNE 30, 2010 2009 2008 2007
EXHIBIT I-I
2006 2005 2004
$1l8,369,561 45,783,902 47,172,494 45,657,155 45,301,064 49,367,861 39,150,102 49,088,377 82,567,274 205,799 342,812 364,199 1,150,319 7,211,394 13,178,624 15,105,594 31,251,273 44,416,100
(8,623,810) (13,046,576) (3,591,545) (4,543,377) 718,543 9,831,404 23,954,221 (18,665,770) (23,203,158)
Net Assets $109,951,550 33,080,138 43.945.148 42264.097 53.231,001 72,377.889 78.209,917 61,673.880 103,780216
Business-Type Activities: Invested in Capital Assets,
Net of Related Debt Unrestricted
Total Business-Type Activities Net Assets
District-Wide: Invested in Capital Assets,
Net of Related Debt Restricted Unrestricted
Total District Net Assets
Source :CAFR Schedule A-I
$8,735,666 3,232,844
6,406,443 3,592,818
6,553,808 3,724,150
6,230,000 3,)75,546
99,152 8,719,284
5,956,740 2,003,817 8,442,046
5,889,687 2,623,854
5,910,725 2,090,645
$11,968.510 9,999.261 10277,958 9.605.546 8,818,436 7.960.557 8,442.046 8.513,541 8,001.370
$127,105,227 52,190,345 53,726,302 51,887,155 45,400,216 55,324,601 39,150,102 54,978,064 88,477,999 205,799 342,812 364,199 1,150,319 7,211,394 13,178,624 15,105,594 31,251,273 44,416,100
(5,390,966) (9,453,758) 132,605 (1,167,831) 9,437,827 11,835,221 32,396,267 (16,041,916) (21,112,513)
$121,920,060 43.079.399 54223.106 51,869.643 62.049,437 80.338,446 86.651,963 70.187,421 111,781.586
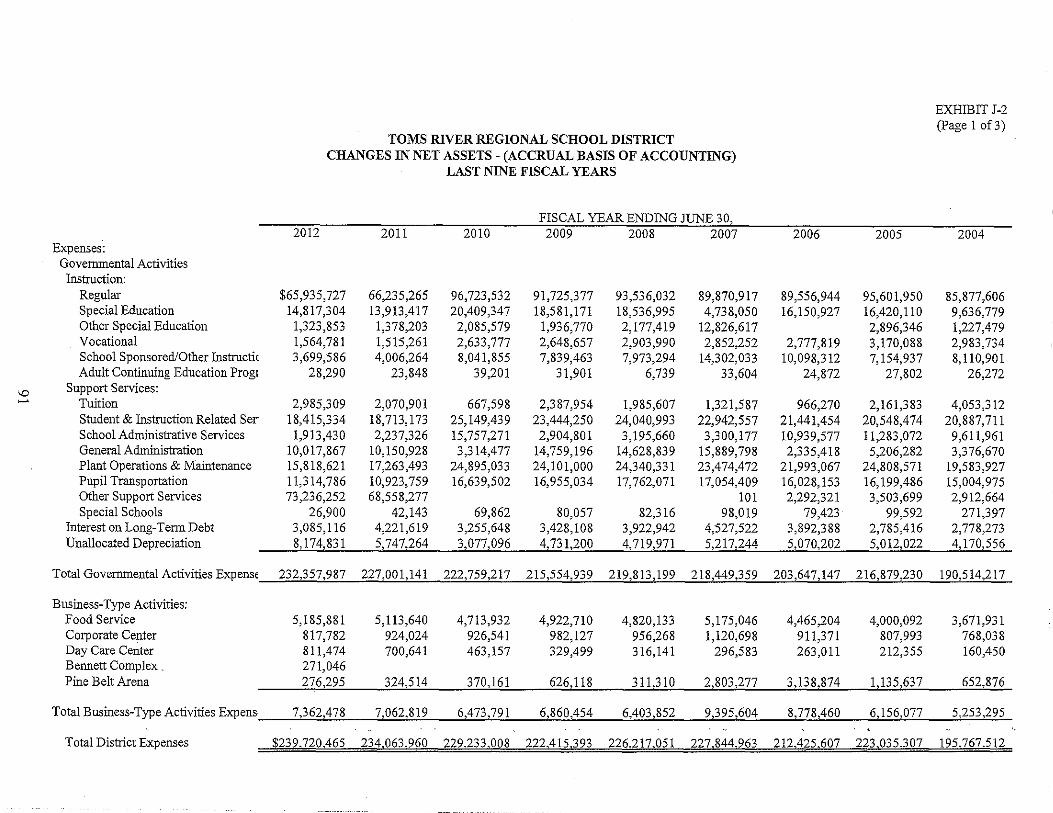
EXHIBIT J-2 (Page 1 of3)
TOMS RIVER REGIONAL SCHOOL DISTRICT CHANGES IN NET ASSETS - (ACCRUAL BASIS OF ACCOUNTING)
LAST NINE FISCAL YEARS
FISCAL YEAR ENDING JUNE 30, 2012 2011 2010 2009 2008 2007 2006 2005 2004
Expenses: Governmental Activities
Instruction: Regular $65,935,727 66,235,265 96,723,532 91,725,377 93,536,032 89,870,917 89,556,944 95,601,950 85,877,606 Special Education 14,817,304 13,913,417 20,409,347 18,581,171 18,536,995 4,738,050 16,150,927 16,420,110 9,636,779 Other Special Education 1,323,853 1,378,203 2,085,579 1,936,770 2,177,419 12,826,617 2,896,346 1,227,479 Vocational 1,564,781 1,515,261 2,633,777 2,648,657 2,903,990 2,852,252 2,777,819 3,170,088 2,983,734 School Sponsored/Other Instructic 3,699,586 4,006,264 8,041,855 7,839,463 7,973,294 14,302,033 10,098,312 7,154,937 8,110,901 Adult Continuing Education ProgI 28,290 23,848 39,201 31,901 6,739 33,604 24,872 27,802 26,272
'" Support Services:
~ Tuition 2,985,309 2,070,901 667,598 2,387,954 1,985,607 1,321,587 966,270 2,161,383 4,053,312 Student & Instruction Related Ser 18,415,334 18,713,173 25,149,439 23,444,250 24,040,993 22,942,557 21,441,454 20,548,474 20,887,711 School Administrative Services 1,913,430 2,237,326 15,757,271 2,904,801 3,195,660 3,300,177 10,939,577 11,283,072 9,611,961 General Administration 10,017,867 10,150,928 3,314,477 14,759,196 14,628,839 15,889,798 2,335,418 5,206,282 3,376,670 Plant Operations & Maintenance 15,818,621 17,263,493 24,895,033 24,101,000 24,340,331 23,474,472 21,993,067 24,808,571 19,583,927 Pupil Transportation 11,314,786 10,923,759 16,639,502 16,955,034 17,762,071 17,054,409 16,028,153 16,199,486 15,004,975 Other Support Services 73,236,252 68,558,277 101 2,292,321 3,503,699 2,912,664 Special Schools 26,900 42,143 69,862 80,057 82,316 98,019 79,423 99,592 271,397
Interest on Long-Tenn Debt 3,085,116 4,221,619 3,255,648 3,428,108 3,922,942 4,527,522 3,892,388 2,785,416 2,778,273 Unallocated Depreciation 8,174,831 5,747,264 3,077,096 4,731,200 4,719,971 5,217,244 5,070,202 5,012,022 4,170,556
Total Governmental Activities Expens, 232,357,987 227,001,141 222,759,217 215,554,939 219,813,199 218,449,359 203,647,147 216,879,230 190,514,217
Business-Type Activities: Food Service 5,185,881 5,113,640 4,713,932 4,922,710 4,820,133 5,175,046 4,465,204 4,000,092 3,671,931 Corporate Center 817,782 924,024 926,541 982,127 956,268 1,120,698 911,371 807,993 768,038 Day Care Center 811,474 700,641 463,157 329,499 316,141 296,583 263,011 212,355 160,450 Bennett Complex, 271,046 Pine Belt Arena 276,295 324,514 370,161 626,118 311,310 2,803,277 3,138,874 1,135,637 652,876
Total Business-Type Activities Expens, 7,362,478 7,062,819 6,473,791 6,860,454 6,403,852 9,395,604 8,778,460 6,156,077 5,253,295
Total District Expenses .. _$239,n0,465._Z34,063,96L 229,233,0..08 222,415,393 226,217,051 227,844,9.63 212,125,607 223,035,3JlL 195,767,512
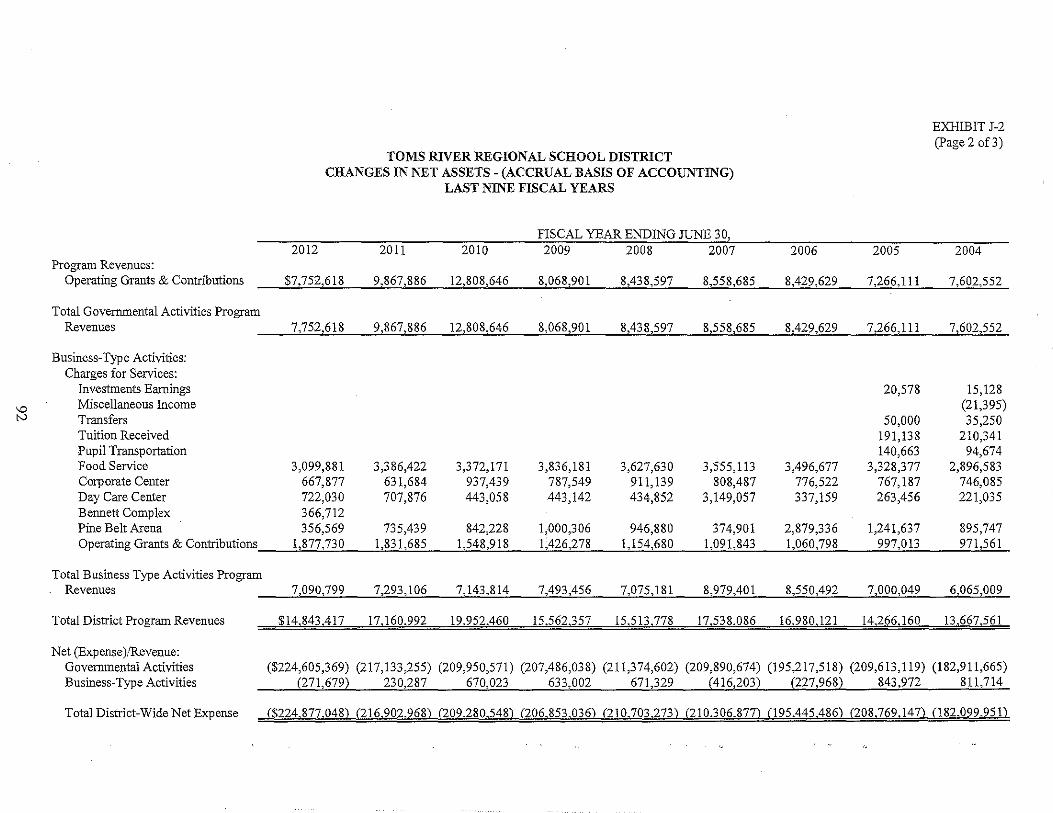
'-0 tv
Program Revenues: Operating Grants & Contributions
Total Governmental Activities Program Revenues
Business-Type Activities: Charges for Services:
Investments Earnings Miscellaneous Income Transfers Tuition Received Pupil Transportation Food Service Corporate Center Day Care Center Bennett Complex Pine Belt Arena Operating Grants & Contributions_
Total Business Type Activities Program Revenues
Total District Program Revenues
Net (Expense)/Revenue:
TOMS RIVER REGIONAL SCHOOL DISTRICT CHANGES IN NET ASSETS - (ACCRUAL BASIS OF ACCOUNTING)
LAST NINE FISCAL YEARS
FISCAL YEAR ENDING JUNE 30, 2012 2011 2010 2009 2008 2007
$7,752,618 9,867,886 12,808,646 8,068,901 8,438,597 8,558,685
7,752,618 9,867,886 12,808,646 8,068,901 8,438,597 8,558,685
3,099,881 3,386,422 3,372,171 3,836,181 3,627,630 3,555,113 667,877 631,684 937,439 787,549 911,139 808,487 722,030 707,876 443,058 443,142 434,852 3,149,057 366,712 356,569 735,439 842,228 1,000,306 946,880 374,901
1,877,730 1,8:31,685 1,548,918_ 1;426,278 1,154,680 1,091,843
7,090,799 7,293,106 7,143,814 7,493,456 7,075,181 8,979,401
$14,843.417 17,160,992 19,952.460 15,562,357 15,513,778 17,538,086
2006 2005
8,429,629 7,266,111
8,429,629 7,266,111
20,578
50,000 191,138 140,663
3,496,677 3,328,377 776,522 767,187 337,159 263,456
2,879,336 1,241,637 1,0(j0,79lL 337,013
8,550,492 7,000,049
16,980,121 14,266,160_
EXHIBIT J-2 (Page 2 of3)
2004
7,602,552
7,602,552
15,128 (21,395) 35,250
210,341 94,674
2,896,583 746,085 221,035
895,747 971,561
6,065,009
]J,Q!)7,561
Govermnental Activities ($224,605,369) (217,133,255) (209,950,571) (207,486,038) (211,374,602) (209,890,674) (195,217,518) (209,613,119) (182,911,665) Business-Type Activities (271,679) 230,287 670,023 633,002 671,329 (416,203) (227,968) 843,972 811,714
Total District-Wide Net Expense -1$.224,877,048) (216,902,968) (209,280,548) (206,853,036) (210,703,273U210,3_06,87TL (]95A45,4!lQl (;108,769,147) Cl82,099,951l
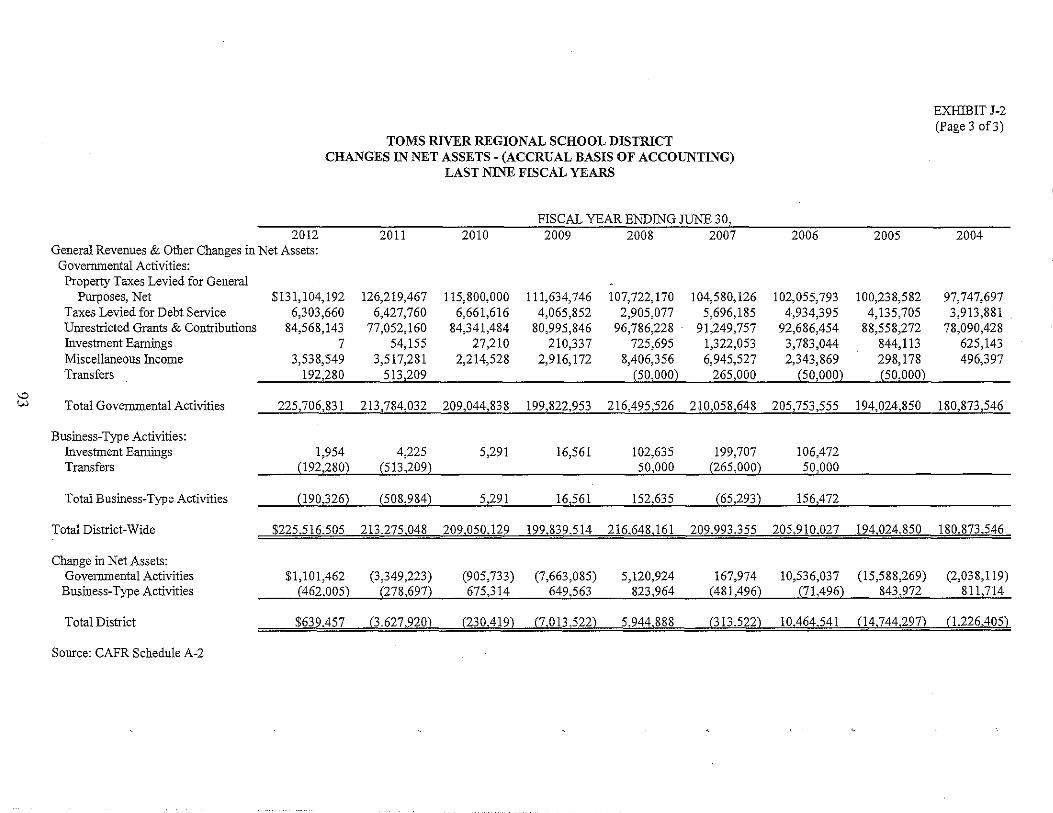
\D
TOMS RIVER REGIONAL SCHOOL DISTRICT CHANGES IN NET ASSETS - (ACCRUAL BASIS OF ACCOUNTING)
LAST NINE FISCAL YEARS
FISCAL YEAR ENDING JUNE 30, 2012
General Revenues & Other Changes in Net Assets: 2011 2010 2009 2008 2007
Governmental Activities: Property Taxes Levied for General
Purposes, Net Taxes Levied for Debt Service Unrestricted Grants & Contributions Investment Earnings Miscellaneous Income Transfers
$131,104,192 126,219,467 6,303,660 6,427,760
84,568,143 77,052,160 7 54,155
3,538,549 3,517,281 192,280 513,209
115,800,000 111,634,746 107,722,170 104,580,126 6,661,616 4,065,852 2,905,077 5,696,185
84,341,484 80,995,846 96,786,228 91,249,757 27,210 210,337 725,695 1,322,053
2,214,528 2,916,172 8,406,356 6,945,527 (50,000) 265,000
2006 2005
102,055,793 100,238,582 4,934,395 4,135,705
92,686,454 88,558,272 3,783,044 844,113 2,343,869 298,178
(50,000) (50,000)
EXHIBIT J-2 (Page 3 of3)
2004
97,747,697 3,913,881
78,090,428 625,143 496,397
W Total Governmental Activities 225,706,831 213,784,032 209,044,838 199,822,253~,495,526 210,058,648 205,753,55~4,024,850 180,873,546
Business-Type Activities: Investment Earnings Transfers
Total Business-Type Activities
Total District-Wide
Change in Net Assets: Governmental Activities Business-Type Activities
Total District
Source: CAFR Schedule A-2
1,954 4,225 5,291 16,561 102,635 199,707 106,472 (192,280) (513,209) 50,000 (265,000) 50,000
(190,326) . (508,984L 5,291 16,561 152,635 (65,293) 156,472
$225.516.505 213,275,048 209,050,129 199,839514 216,648,161 209,993,355 205,910,027 194,024,850 180,873,546
$1,101,462 (3,349,223) (905,733) (7,663,085) 5,120,924 167,974 10,536,037 (462,005_) _(278,697) 675,314 n_---.-M9,563 823,964 (481,496) Q1,496)
(15,588,269) 843,972
(2,038,119) 811,714
$6.3~,457 (3,627,920) (230,419) (7,013,522) 5,944,888 (313,522) IQ,4(j4,54L---.U4,744,297). (1.226,4Qil
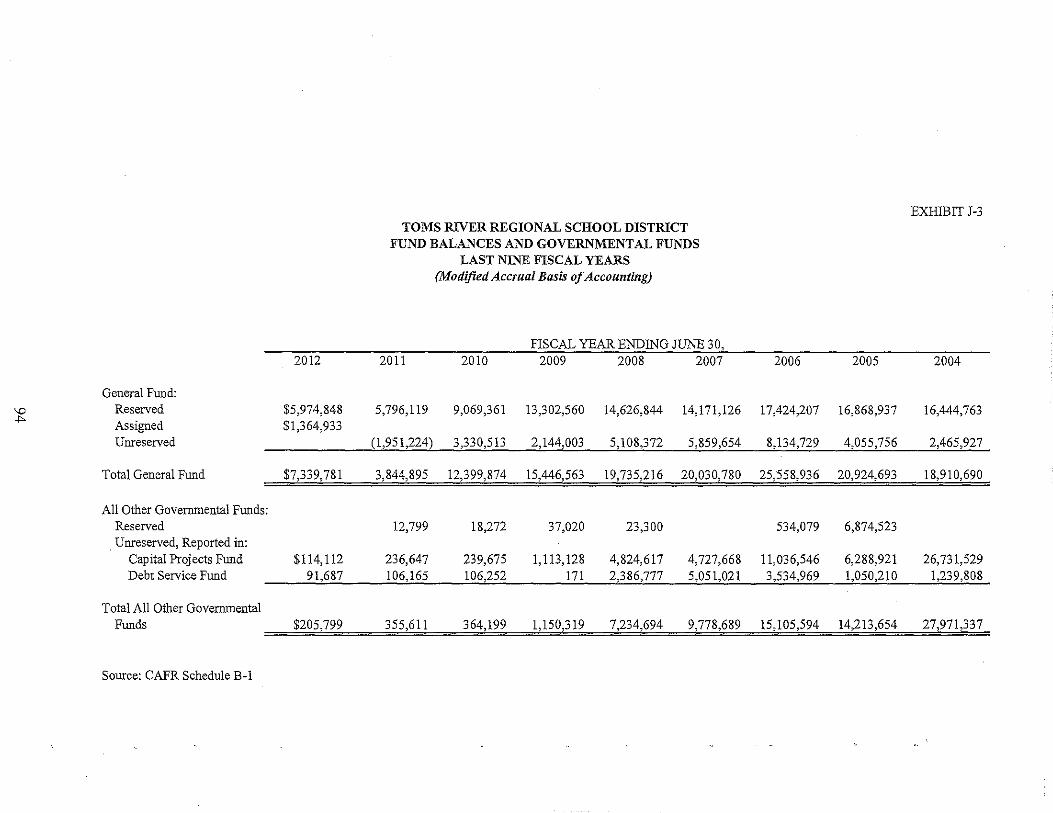
General Fund: \0 Reserved ..,.
Assigned Unreserved
Total General Fund
All Other Governmental Funds: Reserved Unreserved, Reported in:
Cap itaJ Proj ects Fund Debt Service Fund
Total All Other Governmental Funds
Source: CAFR Schedule B-1
TOMS RIVER REGIONAL SCHOOL DISTRICT FUND BALANCES AND GOVERNMENTAL FUNDS
LAST NINE FISCAL YEARS (Modified Accrual Basis of Accou/lti/lg)
FISCAL YEAR ENDING JUNE 30, --_ .. _-_ .. -
2012 2011 2010 2009 2008 2007
$5,974,848 5,796,119 9,069,361 13,302,560 14,626,844 14,171,126 $1,364,933
(1,951,224) 3,330,513 2,144,003 5,108,372 5,859,654
$7,339,781 3,844,895 12,399,874 15,446,563 19,735,216 20,030,780
12,799 18,272 37,020 23,300
$114,112 236,647 239,675 1,113,128 4,824,617 4,727,668 91,687 106,165 106,252 171 2,386,777 5,051,021
$205,799 355,611 364,199 1,150,319 7,234,694 9,778,689
EXIDBIT J-3
2006 2005 2004
17,424,207 16,868,937 16,444,763
8,134,729 4,055,756 2,465,927
25,558,936 20,924,693 18,910,690
534,079 6,874,523
11,036,546 6,288,921 26,731,529 3,534,969 1,050,210 1,239,808
15,105,594 14,213,654 27,971,337
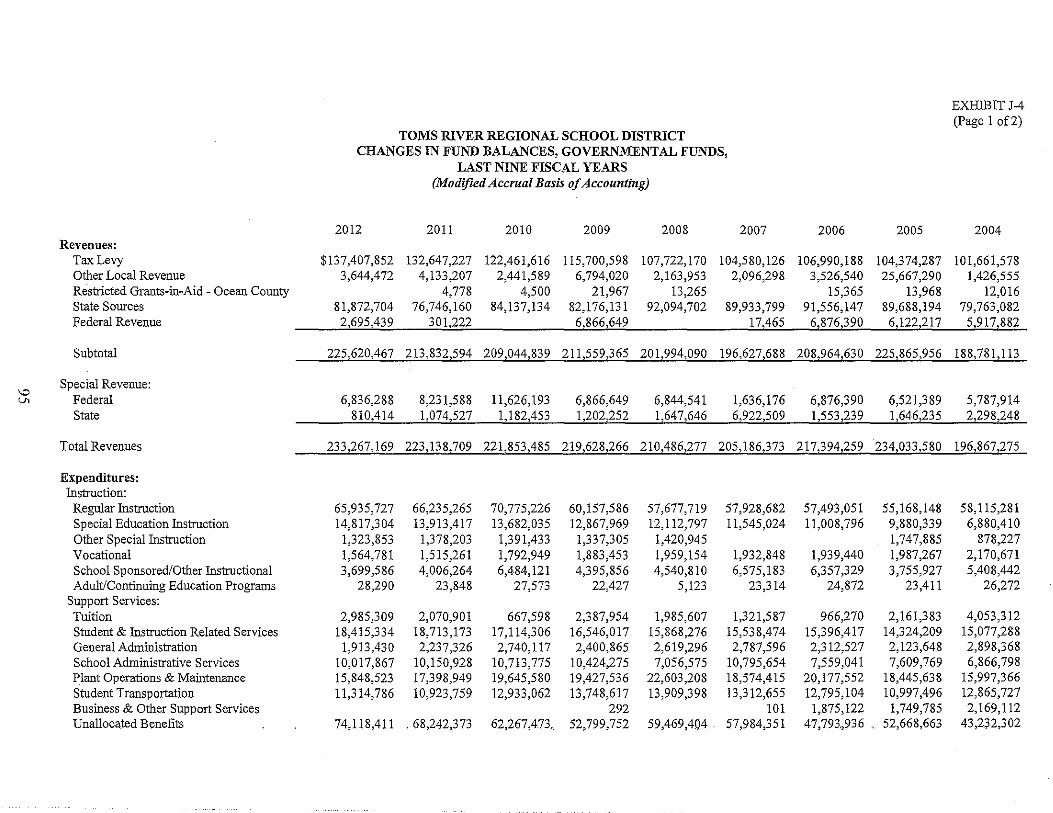
EXHIBIT J-4 (Page 1 of2)
TOMS RIVER REGIONAL SCHOOL DISTRICT CHANGES IN FUND BALANCES, GOVERNMENTAL FUNDS,
LAST NINE FISCAL YEARS (Modified Accrual Basis oj Accounting)
2012 2011 2010 2009 2008 2007 2006 2005 2004 Revenues:
Tax Levy $137,407,852 132,647,227 122,461,616 115,700,598 107,722,170 104,580,126 106,990,188 104,374,287 101,661,578 Other Local Revenue 3,644,472 4,133,207 2,441,589 6,794,020 2,163,953 2,096,298 3,526,540 25,667,290 1,426,555 Restricted Grants-in-Aid - Ocean County 4,778 4,500 21,967 13,265 15,365 13,968 12,016 State Sources 81,872,704 76,746,160 84,137,134 82,176,131 92,094,702 89,933,799 91,556,147 89,688,194 79,763,082 Federal Revenue 2,695,439 301,222 6,866,649 17,465 6,876,390 6,122,217 5,917,882
Subtotal 225,620,467 213,832,594 209,044,839 211,559,365 201,994,090 196,627,688 208,964,630 225,865,956 188,781,113
\0 Special Revenue:
v. Federal 6,836,288 8,231,588 11,626,193 6,866,649 6,844,541 1,636,176 6,876,390 6,521,389 5,787,914 State 810,414 1,074,527 1,182,453 1,202,252 1,647,646 6,922,509 1,553,239 1,646,235 2,298,248
Total Revenues 233,267,169 223,138,709 221,853,485 219,628,266 210,486,277 205,186,373 217,394,259_ 234,033,5_80 19§,867,275
Expenditures: Instruction:
Regular Instruction 65,935,727 66,235,265 70,775,226 60,157,586 57,677,719 57,928,682 57,493,051 55,168,148 58,115,281 Special Education Instruction 14,817,304 13,913,417 13,682,035 12,867,969 12,112,797 11,545,024 11,008,796 9,880,339 6,880,410 Other Special Instruction 1,323,853 1,378,203 1,391,433 1,337,305 1,420,945 1,747,885 878,227 Vocational 1,564,781 1,515,261 1,792,949 1,883,453 1,959,154 1,932,848 1,939,440 1,987,267 2,170,671 School Sponsored/Other Instructional 3,699,586 4,006,264 6,484,121 4,395,856 4,540,810 6,575,183 6,357,329 3,755,927 5,408,442 Adult/Continuing Education Programs 28,290 23,848 27,573 22,427 5,123 23,314 24,872 23,411 26,272
Support Services: Tuition 2,985,309 2,070,901 667,598 2,387,954 1,985,607 1,321,587 966,270 2,161,383 4,053,312 Student & Instruction Related Services 18,415,334 18,713,173 17,114,306 16,546,017 15,868,276 15,538,474 15,396,417 14,324,209 15,077,288 General Administration 1,913,430 2,237,326 2,740,117 2,400,865 2,619,296 2,787,596 2,312,527 2,123,648 2,898,368 School Administrative Services 10,017,867 10,150,928 10,713,775 10,424,275 7,056,575 10,795,654 7,559,041 7,609,769 6,866,798 Plant Operations & Maintenance 15,848,523 17,398,949 19,645,580 19,427,536 22,603,208 18,574,415 20,177,552 18,445,638 15,997,366 Student Transportation 11,314,786 10,923,759 12,933,062 13,748,617 13,909,398 13,312,655 12,795,104 10,997,496 12,865,727 Business & Other Support Services 292 101 1,875,122 1,749,785 2,169,112 Unallocated Benefits 74,118,411 . 68,242,373 62,267,473. 52,799,752 59,469,404. 57,984,351 47,793.,936 . 52,668,663 43,23.2,302
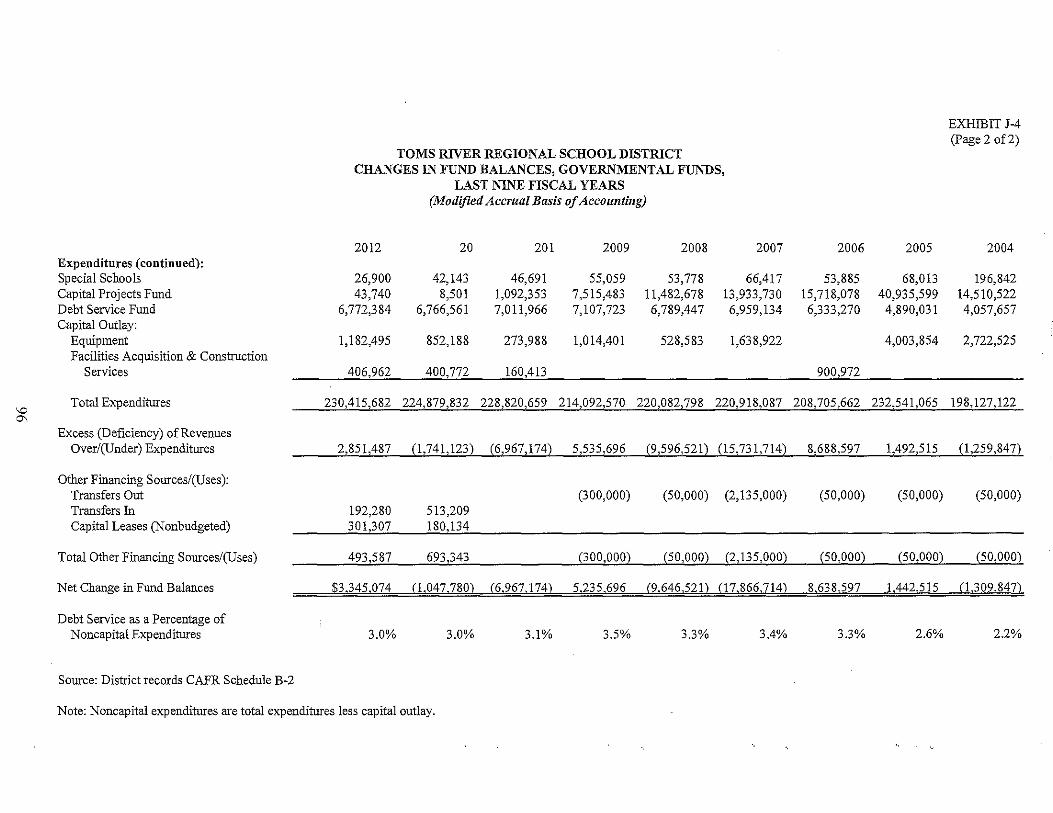
'-D a,
Expenditures (continued): Special Schools Capital Projects Fund Debt Service Fund Capital Outlay:
Equipment Facilities Acquisition & Construction
Services
Total Expenditmes
Excess (Deficiency) of Revenues Over/(Under) Expenditmes
Other Financing Sources/(Uses): Transfers Out Transfers In Capital Leases (Nonbudgeted)
Total Other Financing Sources/rUses)
Net Change in Fund Balances
Debt Service as a Percentage of Noncapital Expenditures
Source: District records CAFR Schedule B-2
TOMS RIVER REGIONAL SCHOOL DISTRICT CHANGES IN FUND BALANCES, GOVERNMENTAL FUNDS,
LAST NINE FISCAL YEARS (Modified Accrual Basis of Accounting)
2012 20 201 2009 2008
26,900 42,143 46,691 55,059 53,778
2007
66,417 43,740 8,501 1,092,353 7,515,483 11,482,678 13,933,730
6,772,384 6,766,561 7,011,966 7,107,723 6,789,447 6,959,134
1,182,495 852,188 273,988 1,014,401 528,583 1,638,922
406,962 400,772 160,413
2006 2005
53,885 68,013 15,718,078 40,935,599 6,333,270 4,890,031
4,003,854
900,972
230,4j5,68L 224,819,832 _228,8~,659 ~ 14,09l,570 120,08:2,]98~:W,918,Q87 2Q8,705,§62 232,541,065
EXHIBIT J-4 (Page 2 of2)
2004
196,842 14,510,522 4,057,657
2,722,525
198,127,122
2,~1,487 _ (1,l41,123)_ (6,967,174) _ 5,535~696 _(9,596,521) (15,731,114)_8,688,297_~,492,515 (1,259,847)
192,280 301,307
493,587
513,209 180,134
693,343
(300,000) (50,000) (2,135,000) (50,000) (50,000) (50,000)
(300,000) (50,000) (2,135,000) (50,QOO) _ (50,000)_ (SO,OOOl
$3.345,074 (1,047,780) (6,967,174) 5,235,696 (9.646,521) (17,866,114) . 8,638,597 J,442,~5 --.a,3Q9,847)
3.0% 3.0% 3.1% 3.5% 3.3% 3,4% 3.3% 2.6% 2.2%
Note: Noncapital expenditmes are total expenditmes less capital outlay.
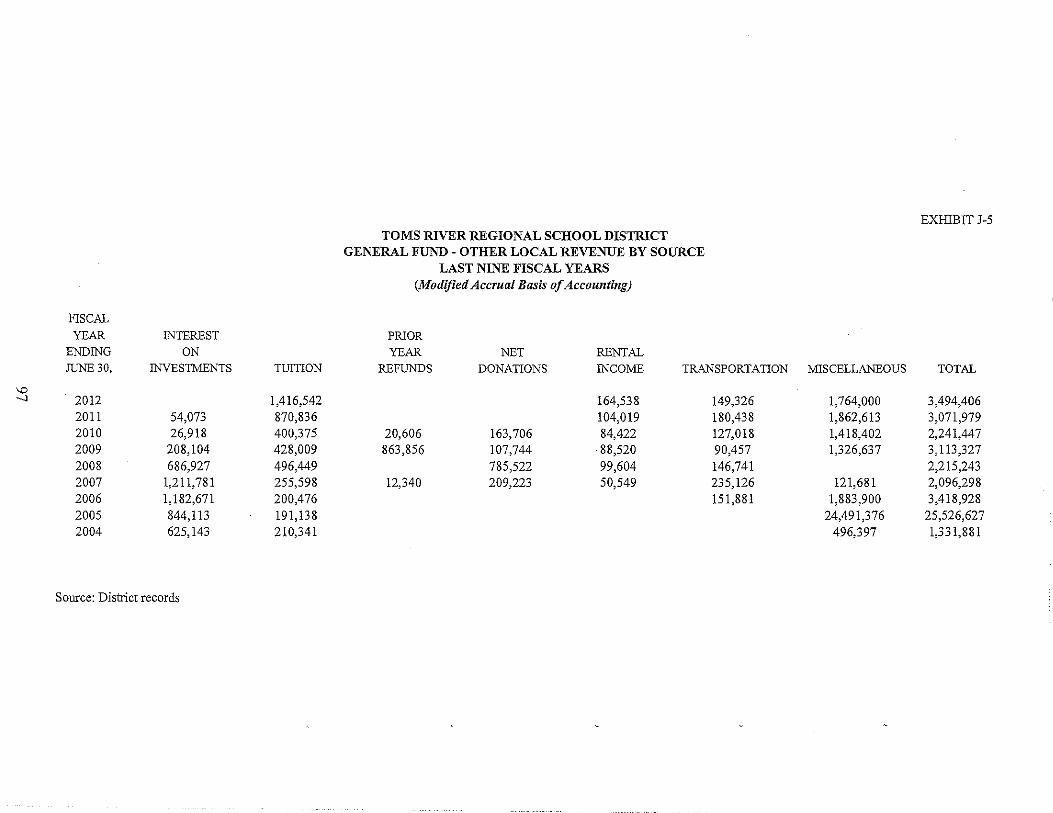
EXHIBIT J-5 TOMS RIVER REGIONAL SCHOOL DISTRICT
GENERALFUND-OTHERLOCALREVENUEBYSOURCE LAST NINE FISCAL YEARS
(Modified Accrual Basis of Accounting)
FISCAL YEAR INTEREST PillOR
ENDING ON YEAR NET RENTAL JUNE 30, INVESTMENTS TUITION REFUNDS DONATIONS INCOME TRANSPORTATION MISCELLANEOUS TOTAL
"" --J 2012 1,416,542 164,538 149,326 1,764,000 3,494,406 2011 54,073 870,836 104,019 180,438 1,862,613 3,071,979 2010 26,918 400,375 20,606 163,706 84,422 127,018 1,418,402 2,241,447 2009 208,104 428,009 863,856 107,744 ·88,520 90,457 1,326,637 3,113,327 2008 686,927 496,449 785,522 99,604 146,741 2,215,243 2007 1,211,781 255,598 12,340 209,223 50,549 235,126 121,681 2,096,298 2006 1,182,671 200,476 151,881 1,883,900 3,418,928 2005 844,113 191,138 24,491,376 25,526,627 2004 625,143 210,341 496,397 1,331,881
Source: District records
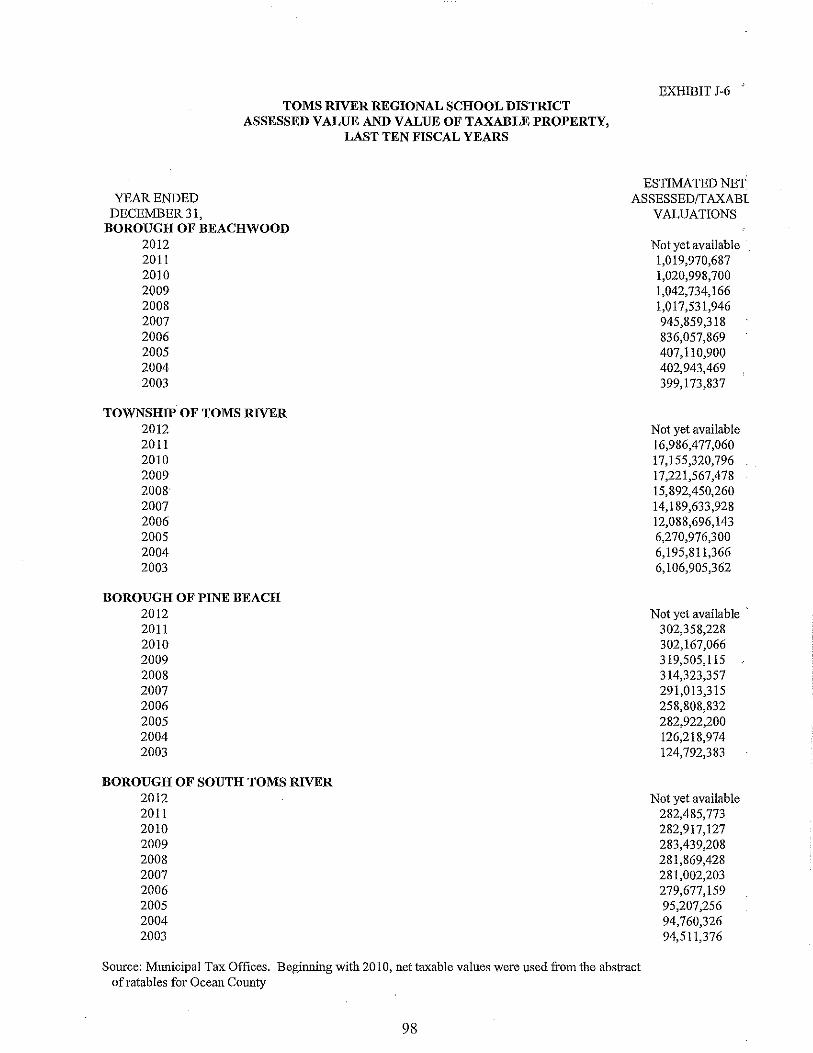
YEAR ENDED DECEMBER 31,
TOMS RIVER REGIONAL SCHOOL DISTRICT ASSESSED VALUE AND VALUE OF TAXABLE PROPERTY,
LAST TEN FISCAL YEARS
BOROUGH OF BEACHWOOD 2012 2011 2010 2009 2008 2007 2006 2005 2004 2003
TOWNSHIP OF TOMS RIVER 2012 2011 2010 2009 2008 2007 2006 2005 2004 2003
BOROUGH OF PINE BEACH 2012 2011 2010 2009 2008 2007 2006 2005 2004 2003
BOROUGH OF SOUTH TOMS RIVER 2012 2011 2010 2009 2008 2007 2006 2005 2004 2003
EXHIBIT J -6 '
ESTIMATED NET ASSESSED/TAXABI
VALUATIONS
Not yet available 1,019,970,687 1,020,998,700 1,042,734,166 1,017,531,946 945,859,318 836,057,869 407,110,900 402,943,469 399,173,837
Not yet available 16,986,477,060 17,155,320,796 17,221,567,478 15,892,450,260 14,189,633,928 12,088,696,143 6,270,976,300 6,195,811,366 6,106,905,362
Not yet available . 302,358,228 302,167,066 319,505,115 314,323,357 291,013,315 258,808,832 282,922,200 126,218,974 124,792,383
Not yet available 282,485,773 282,917,127 283,439,208 281,869,428 281,002,203 279,677,159 95,207,256 94,760,326 94,511,376
Source: Municipal Tax Offices. Beginning with 2010, net taxable values were used from the abstract of ratables for Ocean County
98

EXHIBIT J-7 TOMS RIVER REGIONAL SCHOOL DISTRICT
DIRECT ANI> OVERLAPPING PROPERTY TAX RATES LAST TEN FISCAL YEARS
(Rate per $100 of Assessed Value)
ASSESSMENT SCHOOL OCEAN COUNTY YEAR DISTRICT TOWNSHIP & OTHER TOTAL
BOROUGH OF BEACHWOOD 2012 0.730 0.650 0.344 1.724 2011 0.731 0.622 0.337 1.690 2010 0.716 0.585 0.334 1.635 2009 0.666 0.559 0.320 1.545 2008 0.627 0.533 0.316 1.476 2007 0.590 0.492 0.303 1.385 2006 1.134 1.445 0.696 3.275 2005 1.408 1.028 0.671 3.107 2004 1.388 0.932 0.637 2.957 2003 1.357 0.878 0.614 2.849
TOWNSHIP OF TOMS RIVER 2012 0.778 0.412 0.348 1.538 2011 0.739 0.377 0.335 1.451 2010 0.706 0.347 0.317 1.370 2009 0.634 0.290 0.308 1.232 2008 1.636 0.816 0.825 3.277 2007 1.577 0.679 0.805 3.061 2006 1.587 0.700 0.765 3.052 2005 1.559 0.671 0.745 2.975 2004 1.546 0.495 0.713 2.754 2003 1.525 0.492 0.697 2.714
BOROUGH OF PINE BEACH 2012 0.785 0.499 0.370 1.654 2011 0.785 0.484 0.361 1.630 2010 0.738 0.469 0.347 1.554 2009 0.700 0.465 0.338 1.503 2008 0.651 0.460 0.333 1.444 2007 0.637 0.441 0.326 1.404 2006 0.629 0.419 0.307 1.355 2005 0.629 0.392 0.253 1.274 2004 1.341 0.617 0.519 2.477 2003 1.402 0.600 0.630 2.632
BOROUGH OF SOUTH TOMS RIVER 2012 0.725 0.951 0.335 2.011 2011 0.732 0.888 0.338 1.958 2010 0.696 0.862 0.341 1.899 2009 0.643 0.786 0.320 1.749 2008 0.602 0.749 0.318 1.669 2007 0.557 0.675 0.294 1.526 2006 0.521 0.617 0.262 1.400 2005 1.426 1.656 0.587 3.669 2004 1.406 1.550 0.639 3.595 2003 1.392 1.237 0.632 3.261
Source: Starting with 2010, Ocean County Board of Taxation, breakdown oftax rates
99
EXHIBIT J-8 TOMS RIVER REGIONAL SCHOOL DISTRICT
PRINCIPAL PROPERTY TAX PAYERS, CURRENT YEAR AND NINE YEARS AGO
TAXPAYER
TAXABLE ASSESSED
VALUE
2012 % OF TOTAL
DISTRICT NET ASSESSED
RANK VALUE
BOROUGH OF BEACHWOOD
NOT AVAILABLE
TOWNSHIP OF TOMS RIVER
NOT AVAILABLE
BOROUGH OF PINE BEACH
NOT AVAILABLE
BOROUGH OF SOUTH TOMS RIVER
NOT AVAILABLE
100
2003
TAXABLE ASSESSED
TAXPAYER VALUE RANK
% OF TOTAL DISTRICT NET
ASSESSED VALUE
BOROUGH OF BEACHWOOD
NOT AVAILABLE
TOWNSHIP OF TOMS RIVER
NOT AVAILABLE
BOROUGH OF PINE BEACH
NOT AVAILABLE
BOROUGH OF SOUTH TOMS RIVER
NOT AVAILABLE
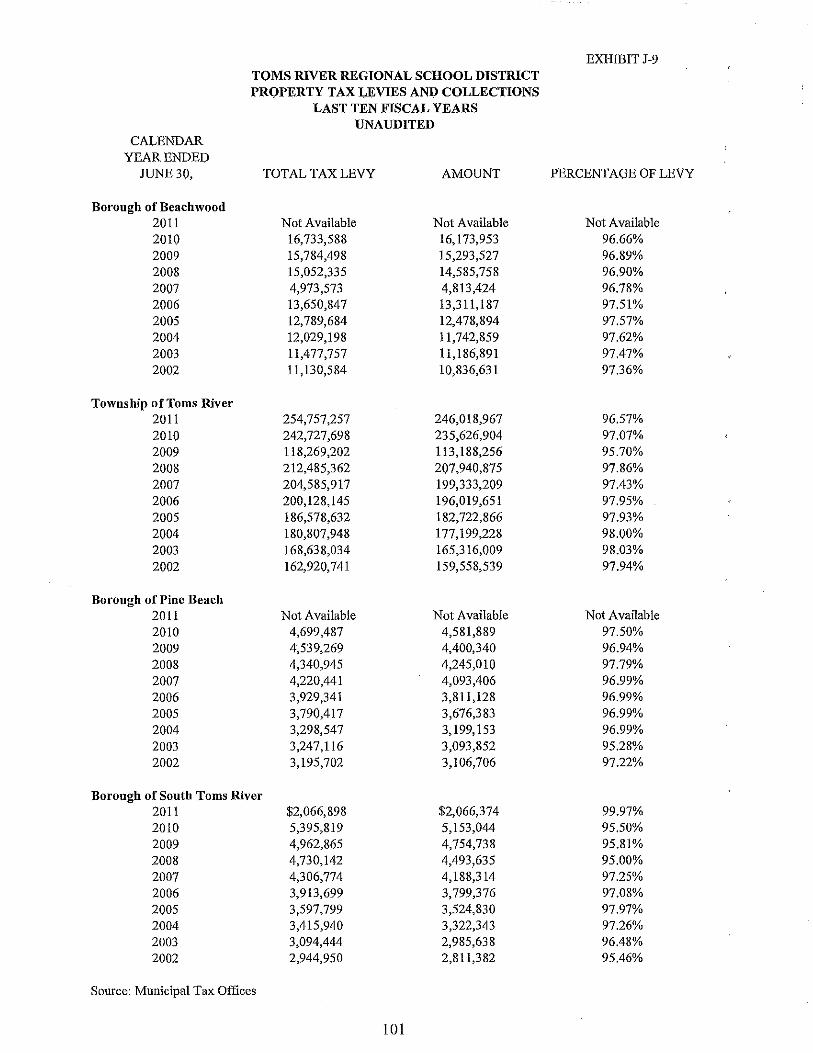
EXHIBIT J-9 TOMS RIVER REGIONAL SCHOOL DISTRICT PROPERTY TAX LEVIES AND COLLECTIONS
LAST TEN FISCAL YEARS UNAUDITED
CALENDAR YEAR ENDED
JUNE 30, TOTAL TAX LEVY AMOUNT PERCENTAGE OF LEVY
Borough of Beachwood 2011 Not Available Not Available Not Available 2010 16,733,588 16,173,953 96.66% 2009 15,784,498 15,293,527 96.89% 2008 15,052,335 14,585,758 96.90% 2007 4,973,573 4,813,424 96.78% 2006 13,650,847 13,311,187 97.51% 2005 12,789,684 12,478,894 97.57% 2004 12,029,198 11,742,859 97.62% 2003 11,477,757 11,186,891 97.47% 2002 11,130,584 10,836,631 97.36%
Township of Toms River 2011 254,757,257 246,018,967 96.57% 2010 242,727,698 235,626,904 97.07% 2009 118,269,202 113,188,256 95.70% 2008 212,485,362 207,940,875 97.86% 2007 204,585,917 199,333,209 97.43% 2006 200,128,145 196,019,651 97.95% 2005 186,578,632 182,722,866 97.93% 2004 180,807,948 177,199,228 98.00% 2003 168,638,034 165,316,009 98.03% 2002 162,920,741 159,558,539 97.94%
Borough of Pine Beach 2011 Not Available Not Available Not Available 2010 4,699,487 4,581,889 97.50% 2009 4,539,269 4,400,340 96.94% 2008 4,340,945 4,245,010 97.79% 2007 4,220,441 4,093,406 96.99% 2006 3,929,341 3,811,128 96.99% 2005 3,790,417 3,676,383 96.99% 2004 3,298,547 3,199,153 96.99% 2003 3,247,116 3,093,852 95.28% 2002 3,195,702 3,106,706 97.22%
Borough of South Toms River 2011 $2,066,898 $2,066,374 99.97% 2010 5,395,819 5,153,044 95.50% 2009 4,962,865 4,754,738 95.81% 2008 4,730,142 4,493,635 95.00% 2007 4,306,774 4,188,314 97.25% 2006 3,913,699 3,799,376 97.08% 2005 3,597,799 3,524,830 97.97% 2004 3,415,940 3,322,343 97.26% 2003 3,094,444 2,985,638 96.48% 2002 2,944,950 2,811,382 95.46%
Source: Municipal Tax Offices
101
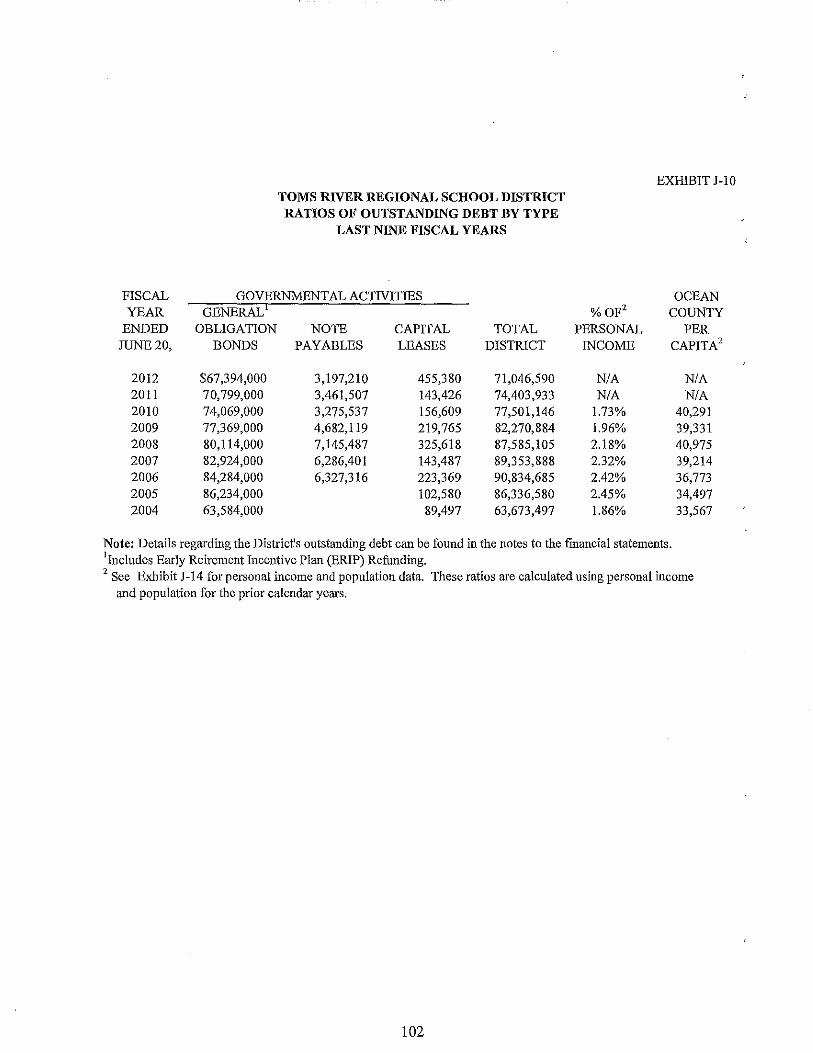
FISCAL YEAR
ENDED JUNE 20,
2012 2011 2010 2009 2008 2007 2006 2005 2004
TOMS RIVER REGIONAL SCHOOL DISTRICT RATIOS OF OUTSTANI)ING I)EBT BY TYPE
LAST NINE FISCAL YEARS
GOVERNMENTAL ACTIVITIES GENERAL'
OBLIGATION NOTE CAPITAL TOTAL BONDS PAYABLES LEASES DISTRICT
$67,394,000 3,197,210 455,380 71,046,590 70,799,000 3,461,507 143,426 74,403,933 74,069,000 3,275,537 156,609 77,501,146 77,369,000 4,682,119 219,765 82,270,884 80,114,000 7,145,487 325,618 87,585,105 82,924,000 6,286,401 143,487 89,353,888 84,284,000 6,327,316 223,369 90,834,685 86,234,000 102,580 86,336,580 63,584,000 89,497 63,673,497
EXHIBIT J-IO
OCEAN %OF2 COUNTY
PERSONAL PER INCOME CAPITA2
N/A N/A N/A N/A
1.73% 40,291 1.96% 39,331 2.18% 40,975 2.32% 39,214 2.42% 36,773 2.45% 34,497 1.86% 33,567
Note: Details regarding the District's outstanding debt can be found in the notes to the fmancial statements. 'Includes Early Reirement Iocentive Plan (ERIP) Refunding. 2 See Exhibit J-14 for personal income and population data. These ratios are calculated using personal income
and population for the prior calendar years.
102
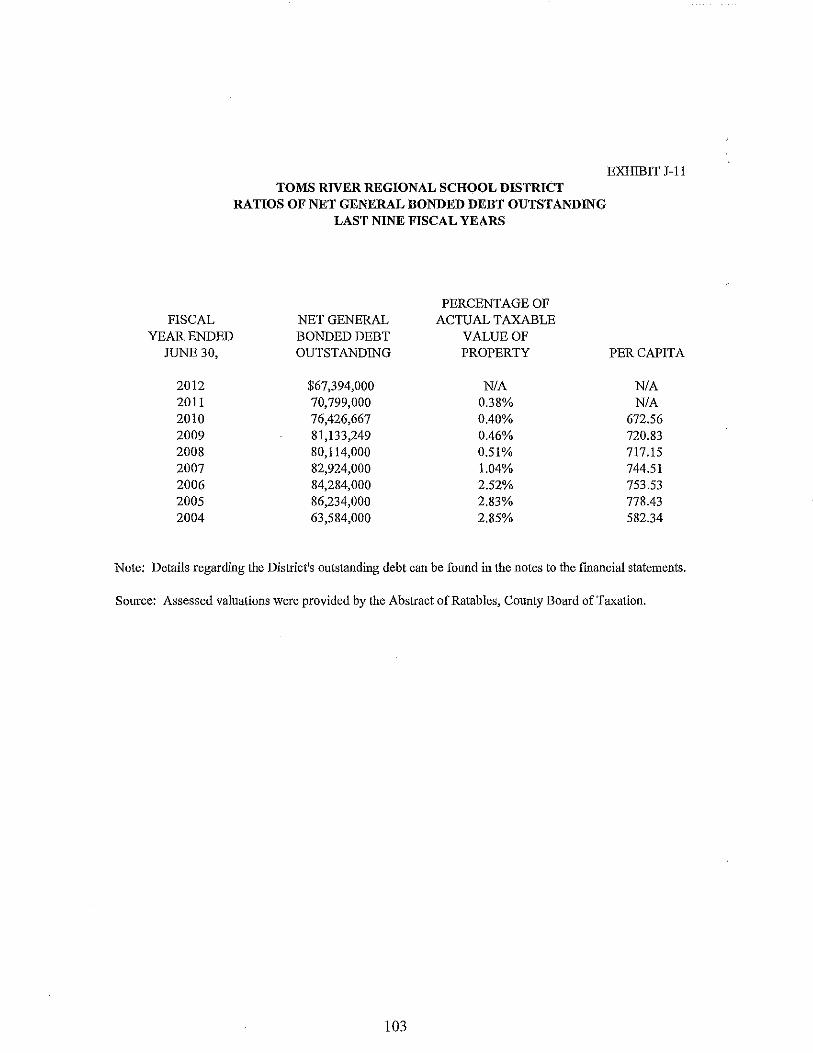
FISCAL YEAR ENDED
JUNE 30,
2012 2011 2010 2009 2008 2007 2006 2005 2004
TOMS RIVER REGIONAL SCHOOL DISTRICT RATIOS OF NET GENERAL BONDED DEBT OUTSTANDING
LAST NINE FISCAL YEARS
PERCENTAGE OF NET GENERAL ACTUAL TAXABLE BONDED DEBT VALUE OF OUTSTANDING PROPERTY
$67,394,000 N/A 70,799,000 0.38% 76,426,667 0.40% 81,133,249 0.46% 80,114,000 0.51% 82,924,000 1.04% 84,284,000 2.52% 86,234,000 2.83% 63,584,000 2.85%
EXHIBIT J-11
PER CAPITA
N/A N/A
672.56 720.83 717.15 744.51 753.53 778.43 582.34
Note: Details regarding the District's ontstanding debt can be fonnd in the notes to the fmaneial statements.
Sonrce: Assessed valnations were provided by the Abstract of Ratables, Connty Board of Taxation.
103
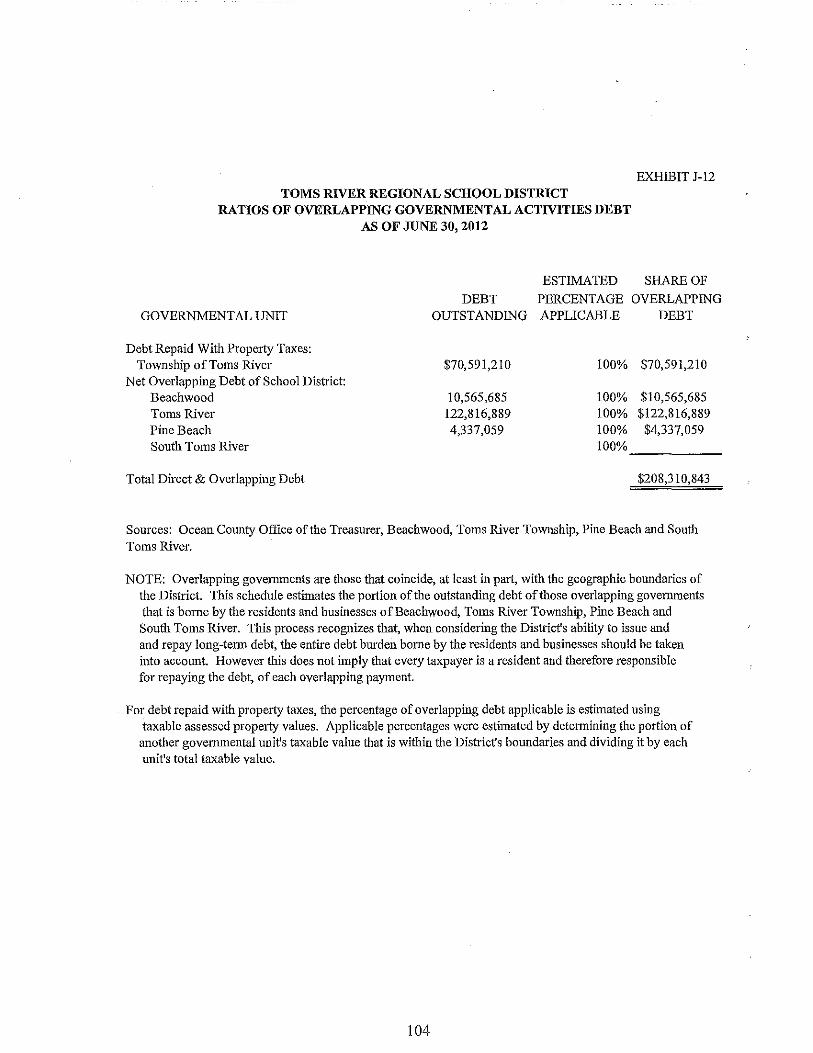
TOMS RIVER REGIONAL SCHOOL DISTRICT RATIOS OF OVERLAPPING GOVERNMENTAL ACTIVITIES DEBT
AS OF JUNE 30, 2012
ESTIMATED
EXHIBIT J-12
SHARE OF
DEBT PERCENTAGE OVERLAPPING GOVERNMENTAL UNIT
Debt Repaid With Property Taxes: Township of Toms River
Net Overlapping Debt of School District: Beachwood Toms River Pine Beach South Toms River
Total Direct & Overlapping Debt
OUTSTANDING
$70,591,210
10,565,685 122,816,889 4,337,059
APPLICABLE DEBT
100% $70,591,210
100% $10,565,685 100% $122,816,889 100% $4,337,059 100%
$208,310,843
Sources: Ocean County Office of the Treasurer, Beachwood, Toms River Township, Pine Beach and South Toms River.
NOTE: Overlapping govemments are those that coincide, at least in part, with the geographic boundaries of the District. This schedule estimates the portion of the outstanding debt of those overlapping govemments that is borne by the residents and businesses of Beachwood, Toms River Township, Pine Beach and South Toms River. This process recognizes that, when considering the District's ability to issue and and repay long-term debt, the entire debt burden bome by the residents and businesses should be taken into account. However this does not imply that every taxpayer is a resident and therefore responsible for repaying the debt, of each overlapping payment.
For debt repaid with property taxes, the percentage of overlapping debt applicable is estimated using taxable assessed property values. Applicable percentages were estimated by deteImining the portion of another govemmental unit's taxable value that is within the District's boundaries and dividing it by each unit's total taxable value.
104
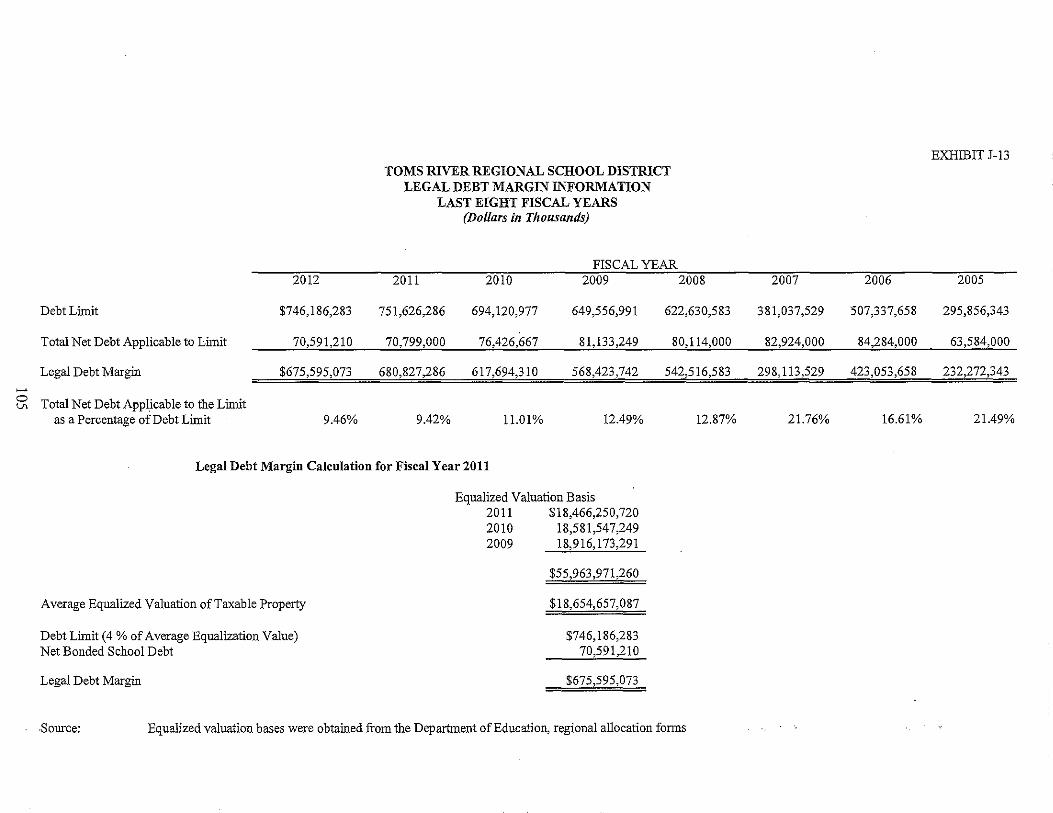
Debt Limit
Total Net Debt Applicable to Limit
Legal Debt Margin
-~ Total Net Debt Applicable to tbe Limit as a Percentage of Debt Limit
2012
$746,186,283
70,591,210
$675,595,073
9.46%
TOMS RIVER REGIONAL SCHOOL DISTRICT LEGAL DEBT MARGIN INFORMATION
LAST EIGHT FISCAL YEARS (Dollars in Thousands)
FISCAL YEAR 2011 2010 2009 2008
751,626,286 694,120,977 649,556,991 622,630,583
70,799,000 76,426,667 81,133,249 80,114,000
680,827,286 617,694,310 568,423,,]42 542,516,583
9.42% 11.01 % 12.49% 12.87%
Legal Debt Margin Calculation for Fiscal Year 2011
Average Equalized Valuation of Taxable Property
Debt Limit (4 % of Average Equalization Value) Net Bonded School Debt
Legal Debt Margin
Equalized Valuation Basis 2011 $18,466,250,720 2010 18,581,547,249 2009 18,916,173,291
$55,963,971,260
$18,654,657,087
$746,186,283 70,591,210
$675,595,073
·Source: Equalized valuation bases were obtained from tbe Department of Education, regional allocation forms
EXHIBIT J-13
2007 2006 2005
381,037,529 507,337,658 295,856,343
82,924,000 84,284,000 63,584,000
298,113,529 423,053,658 232,272,343
21.76% 16.61% 21.49%
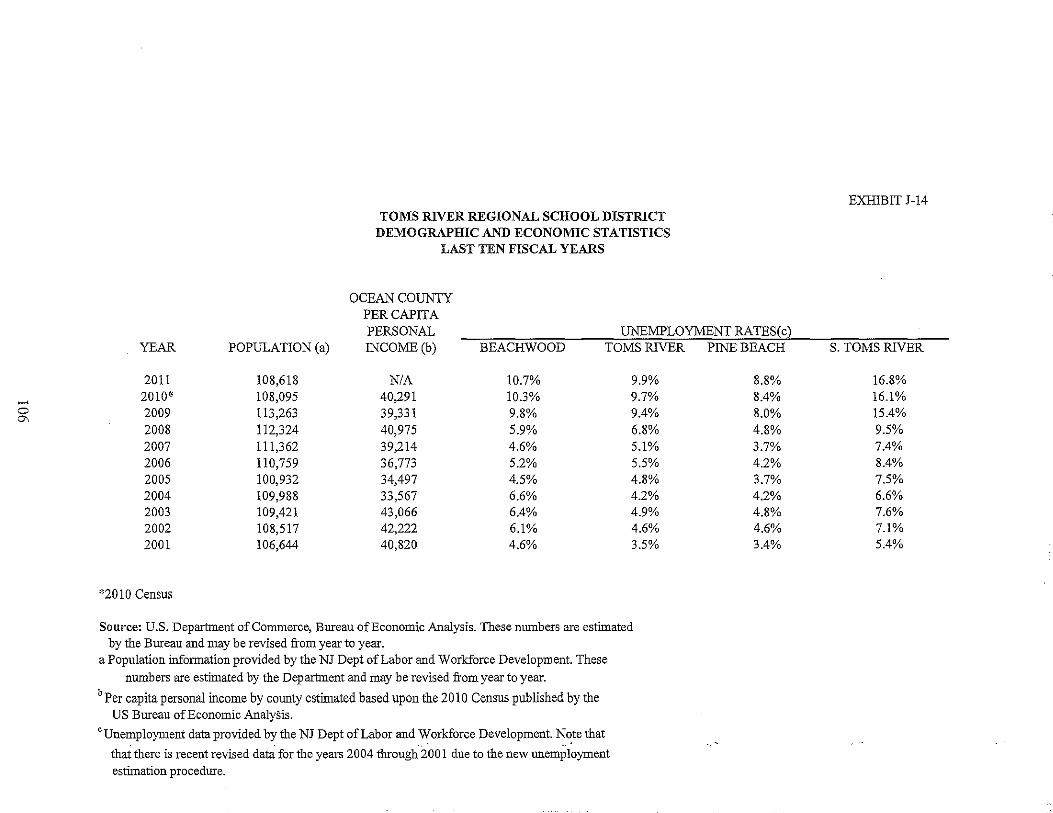
>-' 0 0\
TOMS RIVER REGIONAL SCHOOL DISTRICT DEMOGRAPHIC AND ECONOMIC STATISTICS
LAST TEN FISCAL YEARS
OCEAN COUNTY PER CAPITA PERSONAL UNEMPLOYMENT RATES( c)
YEAR POPULATION (a) INCOME (b) BEACHWOOD TOMS RIVER
2011 108,618 N/A 10.7% 9.9% 2010' 108,095 40,291 10.3% 9.7% 2009 113,263 39,331 9.8% 9.4% 2008 112,324 40,975 5.9% 6.8% 2007 111,362 39,214 4.6% 5.1% 2006 110,759 36,773 5.2% 5.5% 2005 100,932 34,497 4.5% 4.8% 2004 109,988 33,567 6.6% 4.2% 2003 109,421 43,066 6.4% 4.9% 2002 108,517 42,222 6.1% 4.6% 2001 106,644 40,820 4.6% 3.5%
*2010 Census
Source: U.S. Department of Commerce, Bureau of Economic Aualysis. These numbers are estimated by the Bureau and may be revised from year to year.
a Population information provided by the NJ Dept of Labor and Workforce Development. These numbers are estimated by the Department and may be revised from year to year.
b Per capita personal income by county estimated based upon the 2010 Census published by the US Bureau of Economic Aualysis.
'Unemployment data provided by the NJ Dept of Labor and Workforce Development. N~te that
that there is recent revised data for the years 2004 through 200 1 due to the new unemployment estimation procedure.
PlNEBEACH
8.8% 8.4% 8.0% 4.8% 3.7% 4.2% 3.7% 4.2% 4.8% 4.6% 3.4%
EXHIBIT J-14
S. TOMS RJVER
16.8% 16.1% 15.4% 9.5% 7.4% 8.4% 7.5% 6.6% 7.6% 7.1% 5.4%
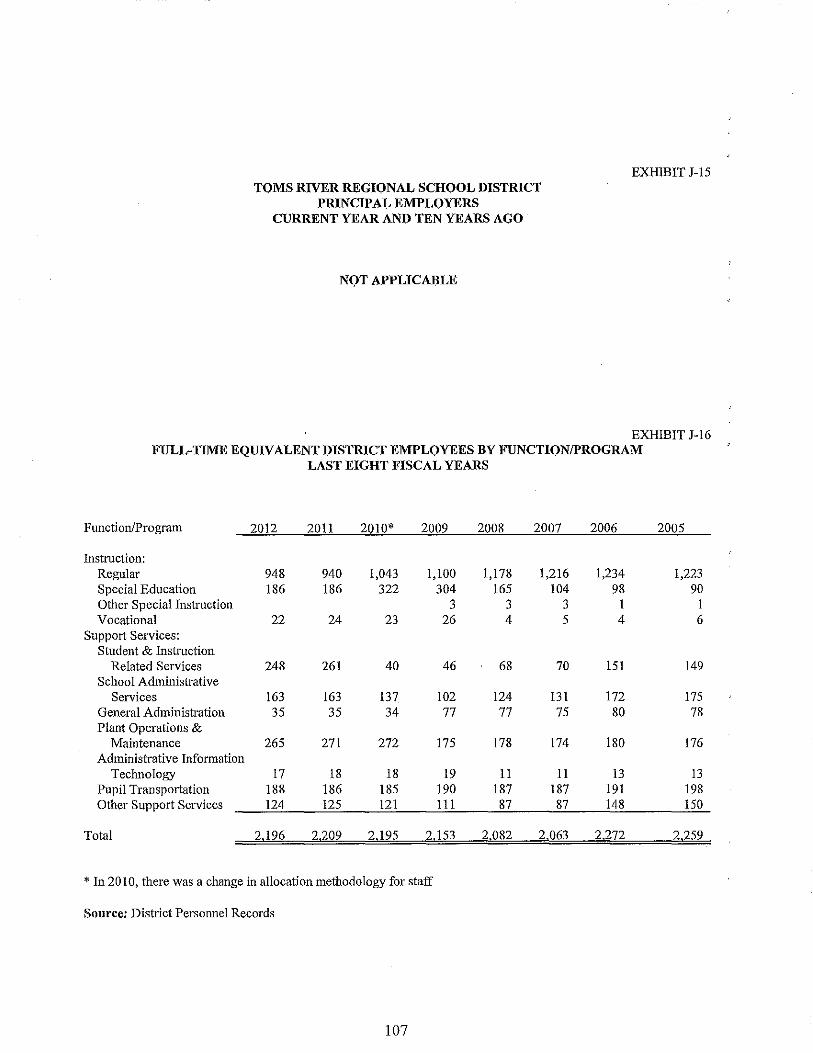
TOMS RIVER REGIONAL SCHOOL DISTRICT PRINCIPAL EMPLOYERS
CURRENT YEAR ANO TEN YEARS AGO
NOT APPLICABLE
EXHIBIT J-15
EXHIBIT J-16 FULL-TIME EQUIVALENT OISTRICT EMPLOYEES BY FUNCTIONIPROGRAM
LAST EIGHT FISCAL YEARS
Function/Program 2012 2011 2010' 2009 2008 2007 2006 2005
Instruction: Regular 948 940 1,043 1,100 1,178 1,216 1,234 1,223 Special Education 186 186 322 304 165 104 98 90 Other Special Instruction 3 3 3 I I Vocational 22 24 23 26 4 5 4 6
Support Services: Student & Instruction
Related Services 248 261 40 46 68 70 151 149 School Administrative
Services 163 163 137 102 124 131 172 175 General Administration 35 35 34 77 77 75 80 78 Plant Operations &
Maintenance 265 271 272 175 178 174 180 176 Administrative Information
Technology 17 18 18 19 11 11 13 \3 Pupil Transportation 188 186 185 190 187 187 191 198 Other Support Services 124 125 121 III 87 87 148 150
Total 2,196 2,209 2,195 2,153 2,082 2,063 2.272 2,259
* In 20 I 0, there was a change in allocation methodology for staff
Source: District Personnel Records
107
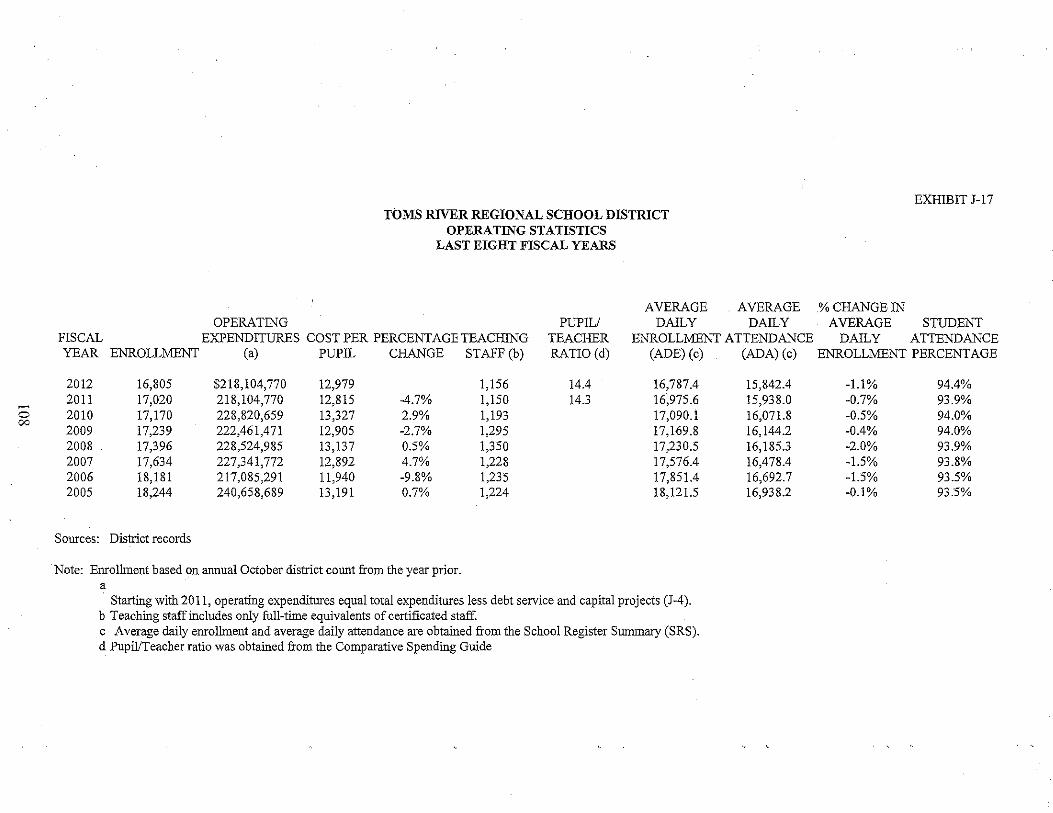
-0 00
OPERATING
TOMS RIVER REGIONAL SCHOOL DISTRICT OPERATING STATISTICS
LAST EIGHT FISCAL YEARS
AVERAGE PUPIL/ DAILY
AVERAGE DAILY
FISCAL EXPENDITURES COST PER PERCENTAGE TEACHING TEACHER ENROLLMENT ATTENDANCE YEAR ENROLLMENT (a) PUPIL CHANGE
2012 16,805 $218,104,770 12,979 2011 17,020 218,104,770 12,815 -4.7% 2010 17,170 228,820,659 13,327 2.9% 2009 17,239 222,461,471 12,905 -2.7% 2008 17,396 228,524,985 13,137 0.5% 2007 17,634 227,341,772 12,892 4.7% 2006 18,181 217,085,291 11,940 -9.8% 2005 18,244 240,658,689 13,191 0.7%
Sources: District records
Note: Enrolhnent based on annual October district count from the year prior. a
STAFF (b) RATIO (d) (ADE) (c)
1,156 14.4 16,787.4 1,150 14.3 16,975.6 1,193 17,090.1 1,295 17,169.8 1,350 17,230.5 1,228 17,576.4 1,235 17,851.4 1,224 18,121.5
Starting with 2011, operating expenditures equal total expenditures less debt service and capital projects (J-4). b Teaching staff includes only full-time equivalents of certificated staff. c Average daily enrolhnent and average daily attendance are obtained from the School Register Summary (SRS). d PnpillTeacher ratio was obtained from the Comparative Spending Guide
(ADA) (c)
15,842.4 15,938.0 16,071.8 16,144.2 16,185.3 16,478.4 16,692.7 16,938.2
EXIDBIT J-17
% CHANGE IN AVERAGE STUDENT
DAILY ATTENDANCE ENROLLMENT PERCENTAGE
-1.1% 94.4% -0.7% 93.9% -0.5% 94.0% -0.4% 94.0% -2.0% 93.9% -1.5% 93.8% -1.5% 93.5% -0.1% 93:5%
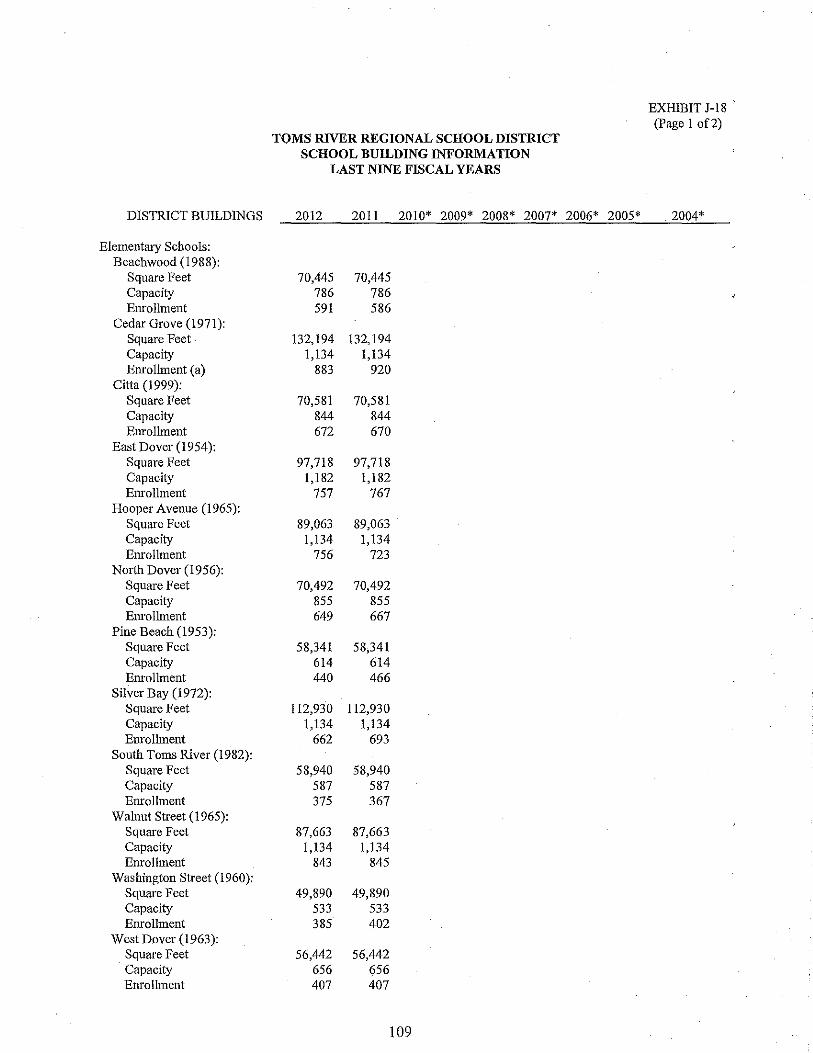
DISTRICT BUILDINGS
Elementmy Schools: Beachwood (1988):
Square Feet Capacity Eurollment
Cedar Grove (1971): Square Feet Capacity Eurollment (a)
Citta (1999): Square Feet Capacity Emollment
East Dover (1954): Square Feet Capacity Eurollment
Hooper Avenue (1965): Square Feet Capacity Emollment
North Dover (1956): Square Feet Capacity Emolhnent
Pine Beach (1953): Square Feet Capacity Emollment
Silver Bay (1972): Square Feet Capacity Emollment
South Toms River (1982): Square Feet Capacity Enrollment
Walnut Street (1965): Square Feet Capacity Enrollment
Washington Street (1960): Square Feet Capacity Enrollment
West Dover (1963): Square Feet Capacity Enrollment
TOMS RIVER REGIONAL SCHOOL DISTRICT SCHOOL BUILDING INFORMATION
LAST NINE FISCAL YEARS
2012 2011 2010* 2009* 2008* 2007* 2006* 2005*
70,445 70,445 786 786 591 586
132,194 132,194 1,134 1,134
883 920
70,581 70,581 844 844 672 670
97,718 97,718 1,182 1,182
757 767
89,063 89,063 1,134 1,134
756 723
70,492 70,492 855 855 649 667
58,341 58;341 614 614 440 466
112,930 112,930 1,134 1,134
662 693
58,940 58,940 587 587 375 367
87,663 87,663 1,134 1,134
843 845
49,890 49,890 533 533 385 402
56,442 56,442 656 656 407 407
109
EXHIBIT J-18 (page I of2)
2004*
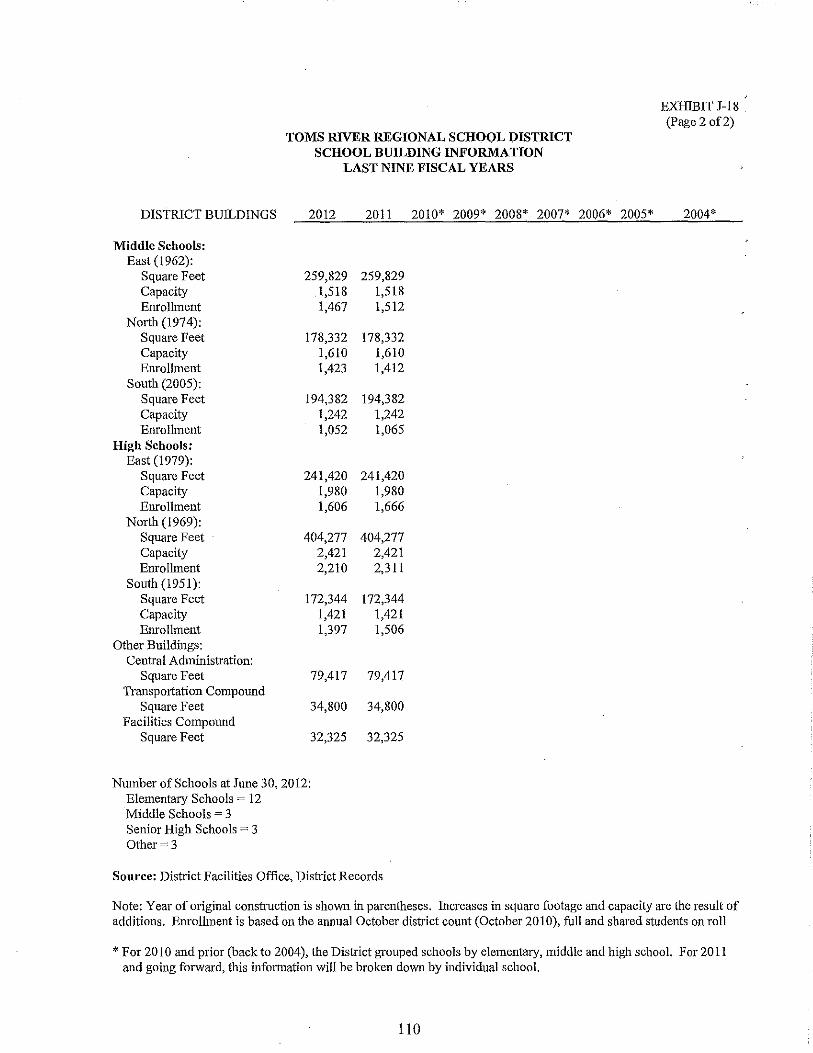
DISTRICT BUILDINGS
Middle Schools: East (1962):
Square Feet Capacity Enrollment
North (1974): Square Feet Capacity Enrollment
South (2005): Square Feet Capacity Enrollment
High Schools: East (1979):
Square Feet Capacity Enrollment
North (! 969): Square Feet Capacity Enrolhnent
South (1951): Square Feet Capacity Enrollment
Other Buildings: Central Administration:
Square Feet Transportation Compomld
Square Feet Facilities Compound
Square Feet
TOMS RIVER REGIONAL SCHOOL DISTRICT SCHOOL BUILDING INFORMATION
LAST NINE FISCAL YEARS
2012 2011 2010* 2009* 2008* 2007* 2006* 2005*
259,829 259,829 1,518 1,518 1,467 1,512
178,332 178,332 1,610 1,610 1,423 1,412
194,382 194,382 1,242 1,242 1,052 1,065
241,420 241,420 1,980 1,980 1,606 1,666
404,277 404,277 2,421 2,421 2,210 2,311
172,344 172,344 1,421 1,421 1,397 1,506
79,417 79,417
34,800 34,800
32,325 32,325
Number of Schools at June 30, 2012: Elementary Schools = 12 Middle Schools = 3 Senior High Schools = 3 Other=3
Source: District Facilities Office, District Records
EXHIBIT J-18 . (Page 2 of2)
2004*
Note: Year of original construction is shown in parentheses. Increases in square footage and capacity are the result of additions. Eruollment is based on the annual October district count (October 2010), full and shared students on roll
* For 20 I 0 and prior (back to 2004), the District grouped schools by elementary, middle and high school. For 2011 and going forward, this infonnation will be broken down by individual school.
110
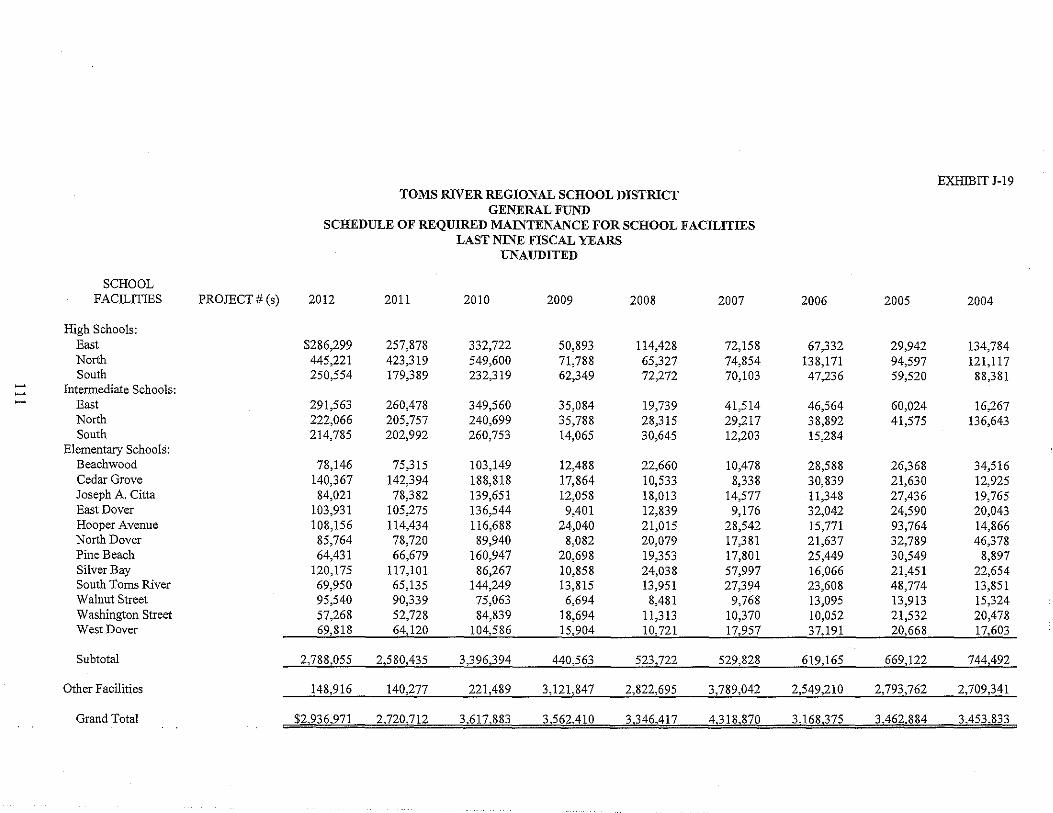
EXHIBIT J-19 TOMS RIVER REGIONAL SCHOOL DISTRICT
GENERAL FUND SCHEDULE OF REQUIRED MAINTENANCE FOR SCHOOL FACILITIES
LAST NINE FISCAL YEARS UNAUDITED
SCHOOL FACILITIES PROJECT # (s) 2012 2011 2010 2009 2008 2007 2006 2005 2004
High Schools: East $286,299 257,878 332,722 50,893 114,428 72,158 67,332 29,942 134,784 North 445,221 423,319 549,600 71,788 65,327 74,854 138,171 94,597 121,117 South 250,554 179,389 232,319 62,349 72,272 70,103 47,236 59,520 88,381 - Intermediate Schools: -- East 291,563 260,478 349,560 35,084 19,739 41,514 46,564 60,024 16,267 North 222,066 205,757 240,699 35,788 28,315 29,217 38,892 41,575 136,643 South 214,785 202,992 260,753 14,065 30,645 12,203 15,284
Elementary Schools: Beachwood 78,146 75,315 103,149 12,488 22,660 10,478 28,588 26,368 34,516 Cedar Grove 140,367 142,394 188,818 17,864 10,533 8,338 30,839 21,630 12,925 Joseph A. Cilta 84,021 78,382 139,651 12,058 18,013 14,577 11,348 27,436 19,765 East Dover 103,931 105,275 136,544 9,401 12,839 9,176 32,042 24,590 20,043 Hooper Avenue 108,156 114,434 116,688 24,040 21,015 28,542 15,771 93,764 14,866 North Dover 85,764 78,720 89,940 8,082 20,079 17,381 21,637 32,789 46,378 Pine Beach 64,431 66,679 160,947 20,698 19,353 17,801 25,449 30,549 8,897 Silver Bay 120,175 117,101 86,267 10,858 24,038 57,997 16,066 21,451 22,654 South Toms River 69,950 65,135 144,249 13,815 13,951 27,394 23,608 48,774 13,851 Walnut Street 95,540 90,339 75,063 6,694 8,481 9,768 13,095 13,913 15,324 Washington Street 57,268 52,728 84,839 18,694 11,313 10,370 10,052 21,532 20,478 West Dover 69,818 64,120 104,586 15,904 10,721 17,957 37,191 20,668 17,603
Subtotal 2,788,055 2,580,435 3,396,394 440,563 523,722 529,828 619,165 669,122 744,492
Other Facilities 148,916 140,277 221,489 3,121,847 2,822,695 3,789,042 2,549,210 2,793,762 2,709,341
Grand Total $20236,971_ 2,720,712 3,617,883 3,562,410 3,346,417 4,318,870 3,168,375 3,462,884 _ 3,453,833
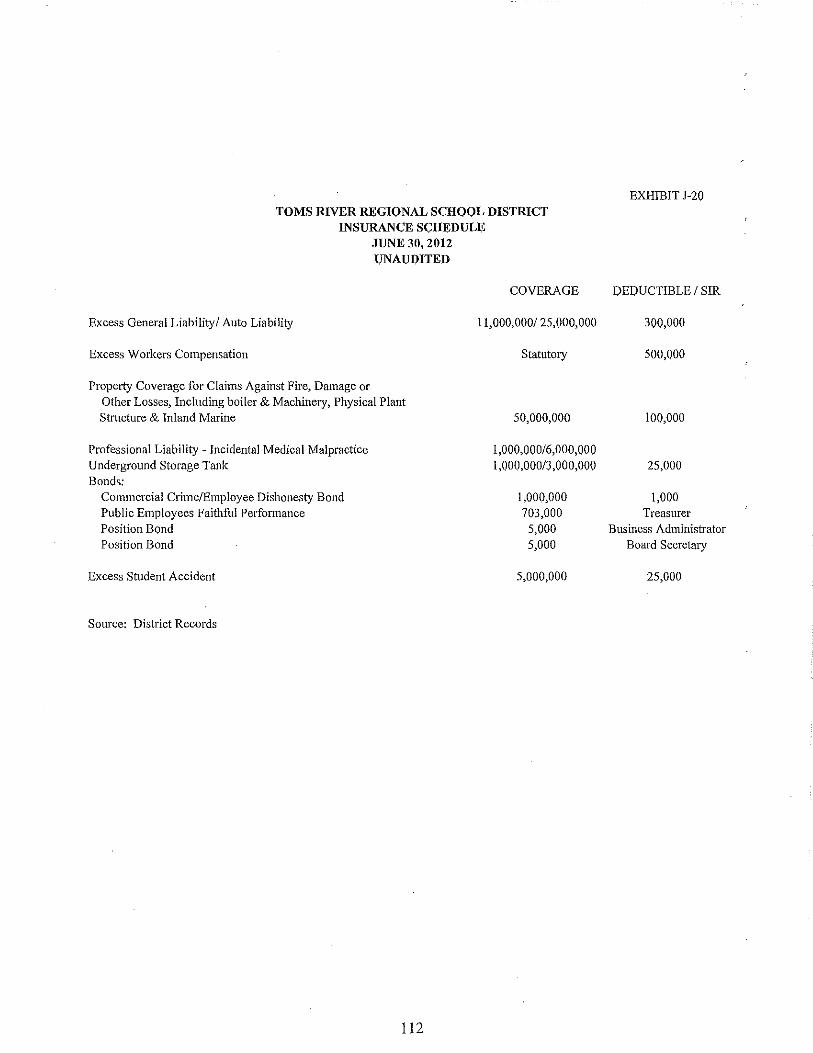
TOMS RIVER REGIONAL SCHOOL DISTRICT rnSURANCESCHEDULE
JUNE 30, 2012 UNAUDITED
Excess General Liabilityl Auto Liability
Excess Workers Compensation
Property Coverage for Claims Against Fire, Damage or Other Losses, Including boiler & Machinery, Physical Plant Structure & Inland Marine
Professional Liability - Incidental Medical Malpractice Underground Storage Tank Bonds:
Commercial Crime/Employee Dishonesty Bond Public Employees Faithful Performance Position Bond Position Bond
Excess Student Accident
Source: District Records
112
COVERAGE
11,000,000/25,000,000
StatutOlY
50,000,000
1,000,000/6,000,000 1,000,000/3,000,000
1,000,000 703,000
5,000 5,000
5,000,000
EXHIBIT J-20
DEDUCTIBLE 1 SIR
300,000
500,000
100,000
25,000
1,000 Treasurer
Business Administrator Board Secretary
25,000
I
I I
1
I
I
1
I
I
I
I
I
I
SINGLE AUDIT SECTION

.c. Certified Public Accountants & Consultants
Administrative Office: 10 Allen Street, St •. 2B, Toms River, NJ 08753' Tel: 732.797'.1333
618 Stokes Road. Medford. NJ 08055· Tel: 609.953.0612 926 Main Street, Suite 103, Rome, PA 18837· Tel: 570297.5090
795 Canlon Street, Troy, PA 16947' Tel: 570.297.5090 holmanfrenia.com
EXHIBITK-I REPORT ON INTERNAL CONTROL OVER FINANCIAL REPORTING
AND ON COMPLIANCE AND OTHER MATTERS BASED ON AN AUDIT OF FINANCIAL STATEMENTS PERFORMED IN ACCORDANCE WITH
GOVERNMENT AUl)lTING STANDARDS
Honorable President and Members oftbe Board of Education
Toms River Regional School District County of Ocean Toms River, New Jersey 08753
We have audited the financial statements of tbe Board of Education of the Toms River Regional School District, County of Ocean, State of New Jersey, as of and for the fiscal year ended June 30, 2012, and have issued our report tbereon dated October 26, 2012, We conducted our audit in accordance with auditing standards generally accepted in tbe United States of America; the standards applicable to financial audits contained in Government Auditing Standards, issued by the Comptroller General of the United States; and audit requirements as prescribed by the Division of Finance, Department of Education, State of New Jersey.
Internal Control Over Financial Reporting
Management of Board of Education of the Toms River Regional School District is responsible for establishing and maintaining effective internal control over financial reporting. hI planning and performing our audit, we considered Board of Education of the Toms River Regional School District's internal control over financial reporting as a basis for designing our aUditing procedures for the purpose of expressing our opinion on the financial statements. Accordingly, we do not express an opinion on the effectiveness of the Organization's internal control over financial reporting.
A deficiency in internal control exists when the design or operation of a control does not allow management or employees, in tbe normal course of performing their assigned functions, to prevent, or detect and correct misstatements on a timely basis. A material weakness is a deficiency, or a combination of deficiencies, in internal contl'ol such that there is a reasonable possibility that a material misstatement of the entity's financial statements will not be prevented, or detected and corrected on a timely basis.
Our consideration of internal control over financial reporting was for the limited purpose described in the first paragraph of this section and was not designed to identifY all deficiencies in internal control over financial repOiting that might be deficiencies, significant deficiencies, or material wealmesses. We did not identifY any deficiencies in inte11lal control over financial reporting that we consider to be material wealmesses, as defined above. However, we identified ce1tain deficiencies in inte11lal control over financial reporting, described in the accompanying schedule of findings and questioned costs that we considel'to be significant deficiencies in inte11lal control over financial repotting as Finding No.'s: 2012-02, 2012-03, 2012-04 and 2012-05. A significant deficiency is a deficiency, or a combination of deficiencies in internal control that is less severe than a material wealmess, yet important enough to merit attention by those chal'ged with governance.
113
Compliance and Other Matters
As pmt of obtaining reasonable assurance about whether the Board of Education of the Toms River Regional School District's financial statements m'e fl'ee of material misstatement, we performed tests of its compliance with certain provisions of laws, regulations, contracts and grant agreements, noncompliance with which could have a direct and material effect on the determination of fmancial statement amounts. However, providing an opinion on compliance with those provisions was not an objective of our audit, imd accordingly, we do not express such an opinion. The results of our tests disclosed no instances of noncompliance or other matters that are required to be reported under Government Auditing Standards.
Toms River Regional School District's response to the findings identified in our audit is described in the accompanying general comments and recommendations. We did not audit Toms River Regional School District's response and, accordingly, we express no opinion on it ..
We noted certain matters that we repOlted to the management of the Toms River Regional School District in a separate Auditor's Management Report on Administrative Findings - Financial, Compliance and Performance dated October 26,2012.
This report is intended solely for the information of the audit committee, management, the Bom'd of Education of the Toms River Regional School District, the New Jersey State Department of Education and other state and federal awarding agencies and pass-through entities and is not intended to 1;le and should not be used by anyone other than these specified pmties.
Toms River, New Jersey October 26,2012
Respectfully Submitted,
HOLMAN & FRENIA, P. C.
Frank B. Holman, III Public School Accountant Certified Public Accountant No. 783
114
.c. Certified Public Accountants & Consultants
Administrative Office: 10 Allen Street, Ste. 2B, Toms River, NJ 08753' Tel: 732.797.1333
618 Slakes Road. Medford. NJ 08055· Tel: 609.953.0612 926 Main Street, Suite 103, Rome, PA 18837' Tel: 570.297.5090
795 Canton Stree~ Troy, PA 16947' Tel: 570.297.5090 holmanfrenia.com
EXHIBITK-2 REPORT ON COMPLIANCE WITH REQUIREMENTS THAT COULD HAVE A DIRECT AND
MATERIAL EFFECT ON EACH MAJOR PROGRAM AND ON INTERNAL CONTROL OVER COMPLIANCE IN ACCORDANCE WITH
OMB CIRCULAR A-133 AND NEW JERSEY OMB CIRCULAR 04-04
Honorable President and Members of the Board of Education
Toms River Regional School District County of Ocean Toms River, New Jersey 08753
Compliance
We have audited the compliance of the Board of Education of the Toms River Regional School District, in the County of Ocean, State of New Jersey, with the types of compliance requirements described in tbe US. Office of Management and Budget (OME) Circular A-J33 Compliance Supplement and the New Jersey Grants Compliance Supplement that could have a direct and material effect on each of its major federal and state programs for the fiscal year ended June 30, 2012. The Board of Education of the Toms River Regional School District's major federal and state programs are identified in the summary of auditor's results section of the accompanying schedule of findings and questioned costs. Compliance with the requirements of laws, regulations, contracts and grants that could have a direct and material effect on each of its major federal and state programs is the responsibility of the Board of Education of the Toms River Regional School District's management. Our responsibility is to express an opinion on the Board of Education of the Toms River Regional School District's compliance based on our audit.
We conducted our audit of compliance in accordance with auditing standards generally accepted in the United States of America; the standards applicable to financial audits contained in Government Auditing Standards, issued by the Comptroller General of the United States; the audit requirements as prescribed by the Division of Finance, Department of Education, State of New Jersey; OMB Circular A-I33 Audits of States, Local Governments and Non-Profit Organizations; and New Jersey OMB's Circular 04-04, Single Audit Policy for Recipients of Federal Grants, State Grants and State Aid. Those standards, OMB Circular A-I33 and New Jersey OMB's Circular 04-04, require that we plan and perform the audit to obtain reasonable assnrance about whether noncompliance with the types of compliance requirements referred to above that could have a direct and material effect on a major federal or state program occurred. An audit includes examining, on a test basis, evidence about Board of Education of the Toms River Regional School District's compliance with those requirements and performing snch other procedures as we considered necessary in the circumstances. We believe that our audit provides a reasonable basis for our opinion. Our audit does not provide a legal determination on the Board of Education of the Toms River Regional School District's compliance with those requirements.
In our opinion, the Board of Education of the Toms River Regional School District, County of Ocean, State of New Jersey, complied, in all material respects, with the requirements referred to above that could have a direct and material effect on each of its major federal or state programs for the year ended June
115
30, 2012. The results of our auditiug procedures disclosed no instances of noncompliance with those requirements, which are required to be reported in accordance with OMB Circular A-133 or New Jersey OMB's Circular 04-04.
Internal Control Over Compliance
The management of the Board of Education of the Toms River Regional School District is responsible for establishing and maintaining effective internal control over compliance with requirements of laws, regulations, contracts and grants that conld have a direct and material effect on maj or federal and state programs. In planning and performing our audit, we considered the Board of Education of the Toms River Regional School District's internal control over compliance with requirements that could have a direct and material effect on a major federal or state program in order to determine our auditing procedures for the propose of expressing our opinion on compliance, but not for the purpose of expressing an opinion on the effectiveness of internal control over compliance. Accordingly, we do not express an opinion on the effectiveness of the Board of Education of the Toms River Regional School District's internal control over compliance.
A deficiency in internal control over compliance exists when the design or operation of a control over compliance does not allow management or employees, in the normal course of perfonning their assigned functions, to prevent, or detect and correct, noncompliance with a type of compliance requirement of a federal or state program on a timely basis. A material weakness in internal control over compliance is a deficiency, or combination of deficiencies, in internal control over compliance, such that there is a reasonable possibility that material noncompliance with a type of compliance requirement of a federal or state program will not be prevented, or detected and corrected, on a timely basis.
Our consideration of the internal control over financial reporting was for the limited purpose described in the first paragraph of this section and would not necessarily identifY all deficiencies in the internal control that might be significant deficiencies or material weaknesses. We did not identifY any deficiencies in internal control over compliance that we consider to be material weaknesses, as defined above.
This report is intended for the information of the management of the Board of Education of the Toms River Regional School District, the New Jersey State Department of Education, other state and federal awarding agencies and pass-through entities and is not intended to be and should not be used by anyone other than these specified parties.
Toms River, New Jersey October 26, 2012
Respectfully Submitted,
HOLMAN & FRENIA, P. C.
Frank B. Holman, III Public School Accountant Certified Public Accountant No. 783
116
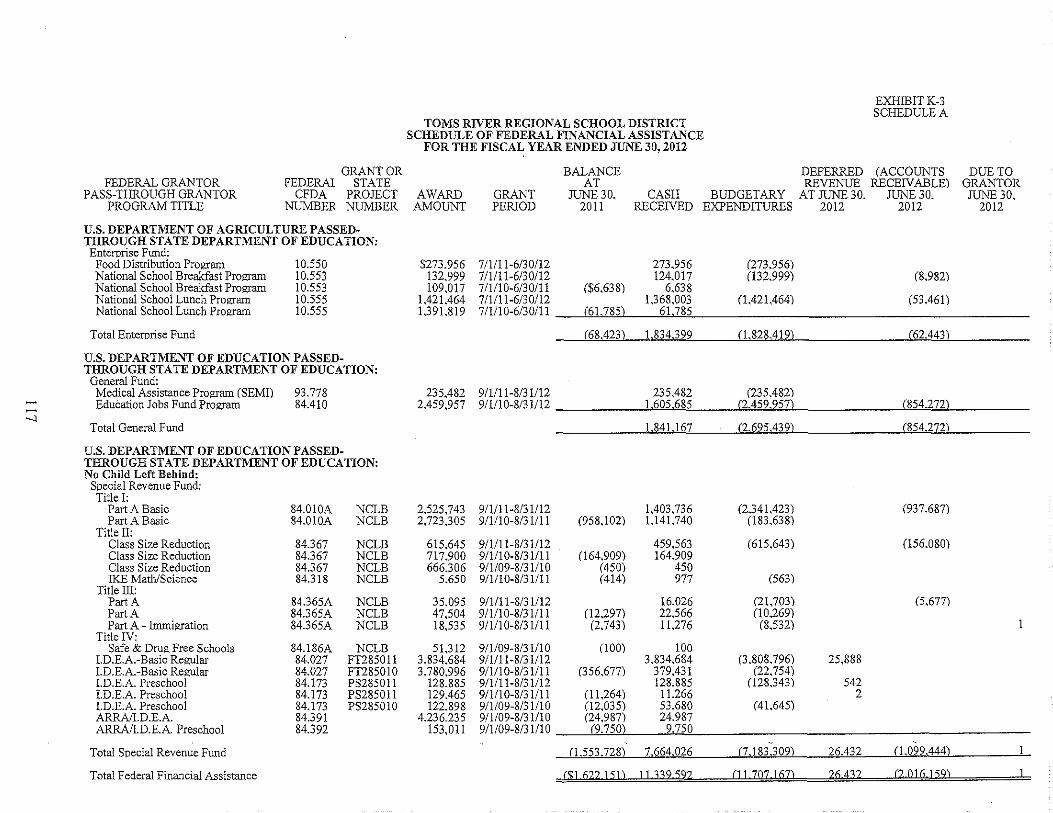
---..)
GRANTOR f'EDERAI STATE
TOMS RIVER REGIONAL SCHOOL DISTRICT SCHEDULE OF FEDERAL FINANCIAL ASSISTANCE
FOR THE FISCAL YEAR ENDED JUNE 30, 2012
EXHIBITK-3 SCHEDULE A
DEFERRED (ACCOUNTS REVENUE RECEIVABLE) FEDERAL GRANTOR
PASS-THROUGH GRANTOR PROGRAM TITLE
CFDA PROJECT AWARD GRANT PERJOD
BALANCE AT
JUNE 30, 2011
CASH BUDGETARY AT JUNE 30, JUNE 30, NUMBER NUMBER AMOUNT RECEIVED EXPENDITURES 2012 2012
u.s, DEPARTMENT OF AGRICULTURE PASSEDTHROUGH STATE DEPARTMENT OF EDUCATION: Enterprise Fund:
Food Distribution Program National School Breakfast Program National School Breakfast Program National School Lunch Program National School Lunch Program
Total Enterprise Fund
10550 10,553 10,553 10,555 10.555
U,S, DEPARTMENT OF EDUCATION PASSEDTHROUGH STATE DEPARTMENT OF EDUCATION:
General Fund: Medical Assistance Program (SEMI) 93.778 Education Jobs Fund Program 84.410
Total General Fund
U.s. DEPARTMENT OF EDUCATION PASSEDTHROUGH STATE DEPARTMENT OF EDUCATION: No Child Left Behind:
Special Revenue Fund: Title I:
Part A Basic Part A Basic
Title II: Class Size Reduction Class Size Reduction Class Size Reduction IKE Math/Science
Title Ill: Part A Part A Part A - Immigration
Title IV: Safe & Drug Free Schools
!.D.E.A.-Basic Regular !.D.E.A.-Basic Regular LD.E.A. Preschool !.D.E.A. Preschool LD.E.A. Preschool ARRAlLD.E.A. ARRAII.D.E.A. Preschool
Total Special Revenue Fund
Total Federal Financial Assistance
84.010A 84.010A
84.367 84.367 84.367 84.318
84.365A 84.365A 84.365A
84.186A 84.027 84.027 84.173 84.173 84.173 84.391 84.392
NCLB NCLB
NCLB NCLB NCLB NCLB
NCLB NCLB NCLB
NCLB FT285011 FT285010 PS285011 PS285011 PS285010
$273,956 711111-6/30/12 273,956 132,999 7/1111-6/30/12 124,017 109,017 711/10-6/30111 ($6,638) 6,638
1,421,464 711111-6/30112 l,368,003 l,391,819 7/1110-6/30/11 (61,785) 61,785
(273,956) (132,999)
(1,421,464)
(8,982)
(53.461)
(68.423) 1.834.399 (1,828,419) (62,443)
235,482 911111-8/31112 235,482 (235,482) 2,459,957 9/1110-8/31112 1.605,685 (2,459,957) (854.272)
1,84l,l67 (2.695.439) (854,272)
2,525,743 911/11-8/31/12 1,403.736 (2,341,423) (937,687) 2,723,305 911110-8/31111 (958,102) l,l41.740 (183,638)
615,645 911111-8/31112 459,563 (615,643) (156,080) 717,900 9/111 0-8/31111 (164,909) 164,909 666,306 911109-8/31110 (450) 450
5,650 9/1110-8/31111 (414) 977 (563)
35,095 911/11-8131/12 16,026 (21,703) (5,677) 47,504 911/10-8/31111 (12,297) 22,566 (10,269) 18,535 911110-8/31111 (2,743) 11,276 (8,532)
5l,312 9/1109-8/31110 (100) 100 3,834.684 9/1111-8/31112 3,834,684 (3,808,796) 25,888 3,780,996 9/111 0-8/31111 (356,677) 379.431 (22,754)
128,885 911111-8/31112 128,885 (128,343) 542 129,465 91111 0-8/31111 (11,264) 1l,266 2 122,898 911109-8/31110 (12,035) 53,680 (41,645)
4,236,235 911109-8/31/10 (24,987) 24,987 153,011 911109-8/3111 ° (9.750) 9,750
'.
(1.553.728) 7.664.026 (7,183.309) 26.432 (1,099,444)
($1.622.151) II 332592 (]] 1Q1 ] 61) 26432 (20]6152)
DUB TO GRANTOR JUNE 30,
2012
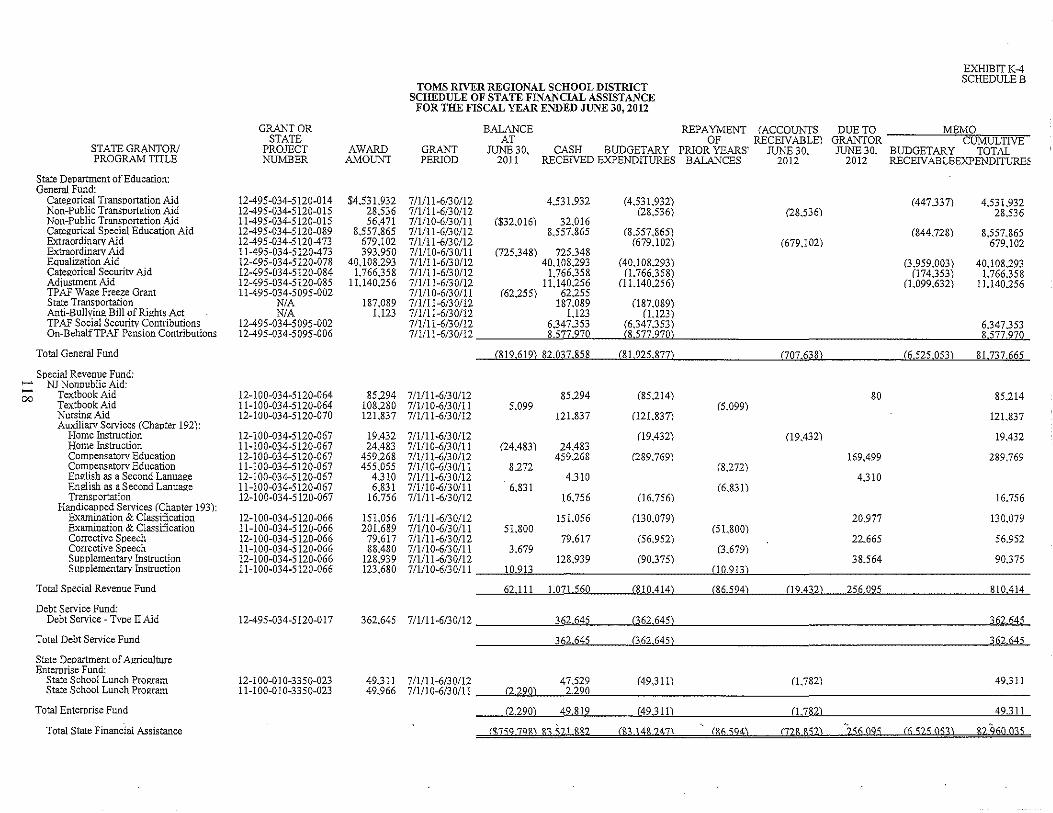
STATE GRANTOR! PROGRAM TITLE
State Department of Educat ion : General Fund:
Categorical Transportation Aid Non-Public Transportation Aid Non-Public Transportation Aid Categorical Special Education Aid Extraordinary Aid Extraordinary Aid Equalization Aid Categorical Security Aid Adiustment Aid TPAF Wage Freeze Grant State Transportation Anti-Bullving Bill of Rights Act TP AF Social Security Contributions On-BehalfTPAF Pension Contributions
Total General Fund
Special Revenue Fund: i--"" NJ Noooublic Aid: ;;; Textbook Aid
Textbook Aid Nursing Aid Auxiliary Services (Chapter 192,:
Home Instruction Home Instruction Compensatory Education Compensatory Education English as a Second Lanuage English as a Second Lanuage Transportation
Handicapped Services (Chapter 193): Examination & Classification Examination & Classification Corrective Speech Corrective Speech Supplementary Instruction Supplementary Instruction
Total Special Revenue Fund
Debt Service Fund: Debt Service - Type II Aid
Total Debt Service Fund
State Department of Agriculture Enterorise Fund:
State School Lunch Program State School Lunch Program
Total Enterprise Fund
Total State Financial Assistance
GRANTOR STATE
PROJECT NUMBER
12-495-034-5120-014 12-495-034-5120-015 11-495-034-5120-015 12-495-034-5120-089 12495 -034-51204 73 11-495-034-5120-473 12-495-034-5120-078 12-495-034-5120-084 12-495-034-5120-085 11-495-034-5095-002
N/A N/A
12-495-034-5095-002 12-495-034-5095-006
12-100-034-5120-064 11-100-034-5120-064 12-100-034-5120-070
12-100-034-5120-067 11-100-034-5120-067 12-100-034-5120-067 11-100-034-5120-067 12-100-034-5120-067 11-100-034-5120-067 12-100-034-5120-067
12-100-034-5120-066 11-100-034-5120-066 12-100-034-5120-066 11-100-034-5120-066 12-100-034-5120-066 11-100-034-5120-066
12-495-034-5120-017
12-100-010-3350-023 11-100-010-3350-023
AWARD AMOUNT
$4,531.932 28,536 56.471
8,557,865 679,102 393,950
40,108293 1,766.358
1 Ll40256
187,089 U23
85,294 108,280 121,837
19,432 24,483
459268 455,055
4.310 6,831
16_756
151.056 201.689
79,617 88,480
128,939 123,680
TOMS RIVER REGIONAL SCHOOL DISTRICT SCHEDULE OF STATE FINANCIAL ASSISTANCE
FOR THE FISCAL YEAR ENDED JUNE 30, 2012
REPAYMENT (ACCOUNTS OF RECEIVABLE)
GRANT PERIOD
BALANCE AT
JUNE 30, 2011
CASH BUDGETARY PRIOR YEARS' JUNE 30, RECEIVED EXPENDITURES BALANCES 2012
711111-6/30/12 4,531.932 (4,531.932) 711111-6/30/12 (28,536) (28,536) 7/111 0-6/3 0111 ($32,016) 32,016 711111-6/30112 8,557_865 (8,557,865) 711111-6/30/12 (679,102) (679,102) 711110-6/30111 (725.348) 725.348 711111-6/3 0112 40,108,293 (40,108,293) 711111-6/30/12 1,766.358 (1,766,358) 711111-6/30112 11,140,256 OU40,256) 7/1/10-6/30/11 (62255) 62,255 711/11-6/30/12 187,089 087,089) 7/1/11-6/30/12 U23 (1.123) 711111-6/30/12 6.347.353 (6.347.353) 7/1/11-6/30/12 8,577970 .. __ .(8,577,970)
EXHIBITK-4 SCHEDULEB
DUE TO MEMO GRANTOR CUMULTIVE JUNE 30, BUDGETARY TOTAL
2012 RECEIVABLEEXPENDITUREE
(447.337) 4,531,932 28,536
(844,728) 8,557,865 679,102
(3,959,003) 40,108,293 (174,353) 1,766.358
(1.099,632) lU40256
6.347.353 8,577.970
(819619) 82,037.858 (81925,8771 (707638) (6525053) 81.737665
711/11-6/30/12 7/1/10-6/30/11 711/11-6/30/12
7/1111-6/30/12 7/1110-6/30/11 7/1/11-6/30/12 7/1/10-6/30/11 7/1111-6/30/12 7/1I10-6/301ll 7/1111-6/30/12
7/1111-6/30/12 7/1110-6/30/11 7/1111-6/30/12 7/1/10-6/30/11 7/1111-6/30/12 7/111 0-6/3 0/11
85,294 5,099
12LS37
(24,483) 24,483 459268
8272 4.310
6,831 16,756
151.056 5L800
79,617 3,679
128,939 10.913
(85,214)
(12LS371
09,432)
(289,769)
06,756)
(130,079)
(56,952)
(90.375)
(5,099)
(8,272)
(6_831)
(5L800)
(3.679)
00,913)
09,432)
80
169,499
4.310
20,977
22.665
38,564
62 III 1.071 560 (810414) (86594) Cl9.432) 256095
85,214
12LS37
19,432
289,769
16,756
130.079
56.952
90.375
810.414
362.645 7/1/11-6/30112 362.645 (362645) 362.645
362.645 (362,645) 362.645
49.311 7/1/11-6/30/12 47,529 (49,311) 0.782) 49.311 49.966 7/1/10-6/30/11 (2290) 2.290
(2290) 49,819 . (49.311) 0.782) 49.311
($75979B\ 83521 BR2 (£3 ]4% 24]\ <86594\ (72& &52) ')56 Q95 (6525053\ R2 '960 035
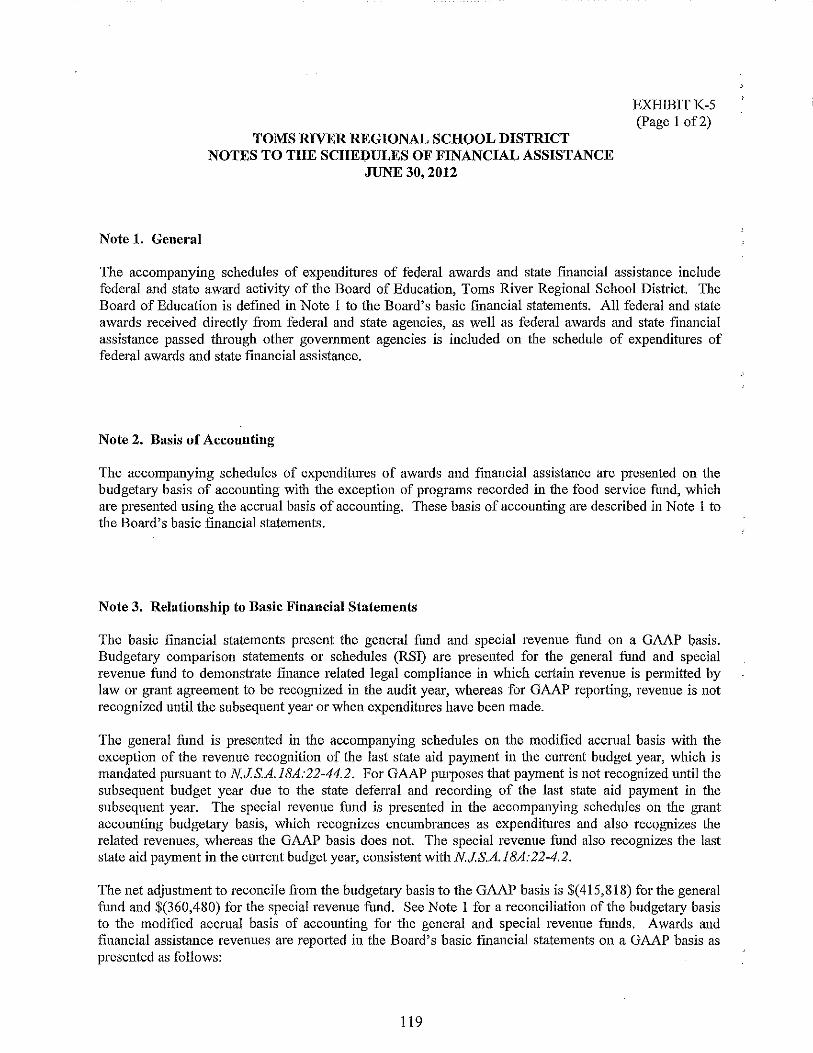
Note 1. General
TOMS RIVER REGIONAL SCHOOL DISTRICT NOTES TO THE SCHE1)ULES OF FINANCIAL ASSISTANCE
JUNE 30, 2012
EXHIBITK-5 (Page I of2)
The accompanying schedules of expenditnres of federal awaTds and state fmancial assistance include federal and state award activity of the Board of Education, Toms River Regional School District. The Board of Education is defined in Note I to the Board's basic fmancial statements. All federal and state awards received directly fi·om federal and state agencies, as well as federal awards and state financial assistance passed thmugh other government agencies is included on the schedule of expenditures of federal awards and state fmancial assistance.
Note 2. Basis of Acconnting
The accompanying schedules of expenditures of awards and financial assistance are presented on the budgetary basis of accounting with the exception of programs recorded in the food service fund, which are presented using the accrual basis of accounting. These basis of accounting m·e described in Note I to the Board's basic financial statements.
Note 3. Relationship to Basic Financial Statements
The basic financial statements present the general fund and special revenue fimd on a GAAP basis. Budgetm·y comparison statements or schedules (RSI) are presented for the general fimd and special revenue fund to demonstrate finance related legal compliance in which certain revenue is permitted by law or grant agreement to be recognized in the audit year, whereas for GAAP reporting, revenue is not recognized until the snbsequent yem· or when expenditures have been made.
The general fimd is presented in the accompmwing schedules on the modified accrual basis with the exception of the revenue recognition of the last state aid payment in the current budget year, which is mandated pursumlt to N.J.S.A.IBA:22-44.2. For GAAP pUl"jJoses that payment is not recognized until the subsequent budget yem· due to the state defen·al and recording of the last state aid payment in the subsequent year. The special revenue fund is presented in the accompmwing schedules on the grant accounting budgetm·y basis, which recognizes encumbrances as expenditures mld also recQgnizes the related revenues, whereas the GAAP basis does not. The special revenue fund also recognizes the last state aid payment in the current budget year, consistent with N.J.S.A.IBA:22-4.2.
The net adjustment to reconcile from the budgetary basis to the GAAP basis is $(415,818) for the general fund and $(360,480) for the special revenue fund. See Note I for a reconciliation of the budgetary basis to the modified accrual basis of accounting for the general and special revenue funds. Awards and financial assistmlCe revenues are reported in the Bom·d's basic finmlCial statements on a GAAP basis as presented as follows:
119
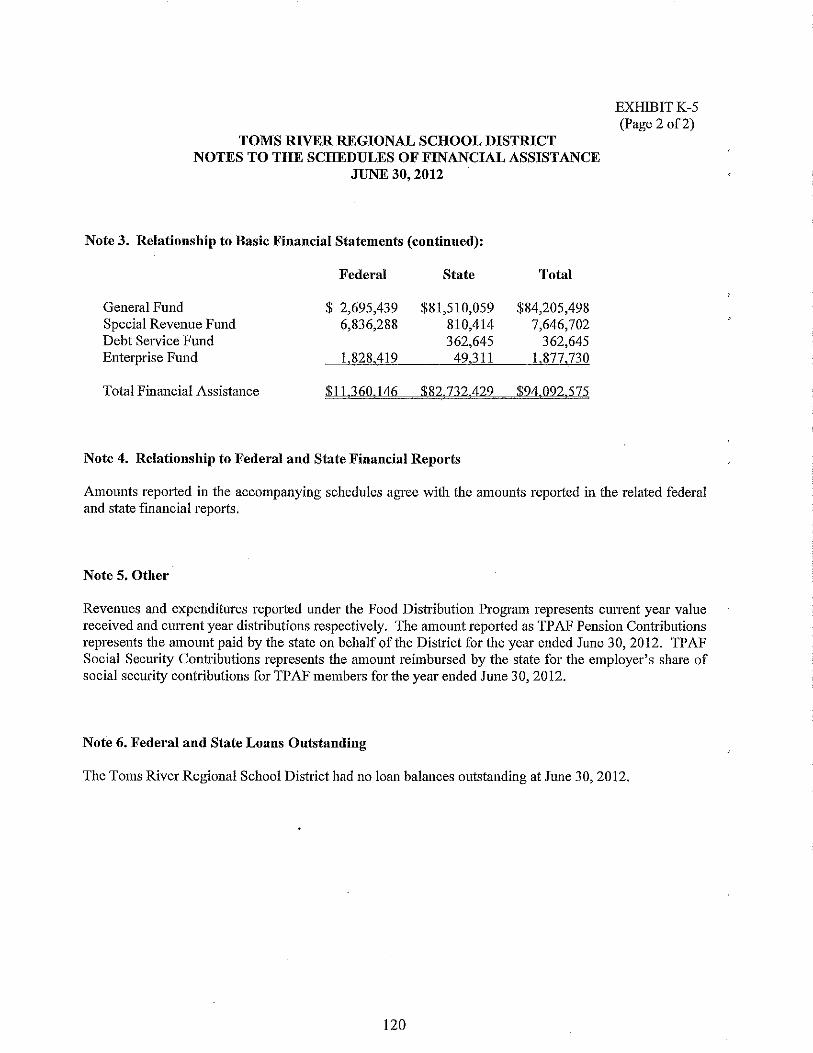
TOMS RIVER REGIONAL SCHOOL DISTRICT NOTES TO THE SCHEDULES OF FINANCIAL ASSISTANCE
JUNE 30, 2012
Note 3. Relationship to Basic Financial Statements (continned):
Federal State Total
General Fund $ 2,695,439 $81,510,059 $84,205,498 Special Revenue Fund 6,836,288 810,414 7,646,702 Debt Service Fund 362,645 362,645 Enterprise Fund 1,828,419 49,311 1,877,730
Total Financial Assistance $11360146 $82732429 $94092575
Note 4. Relationship to Federal and State Financial Reports
EXHIBITK-5 (Page 2 of 2)
Amounts reported in the accompanying schedules agree with the amounts reported in the related federal and state fmancial reports.
Note 5. Other
Revenues and expenditures reported under the Food Distribution Program represents cmrent year value received and current year distributions respectively. The amount reported as TPAF Pension Contributions represents the amouut paid by the state on behalf of the District for the year ended June 30, 2012. TPAF Social Security Contributions represents the amount reimbursed by the state for the employer's share of social security contributions for TPAF members for the year ended June 30, 2012.
Note 6. Federal and State Loans Outstanding
The Toms River Regional School District had no loan balances outstanding at June 30, 2012.
120
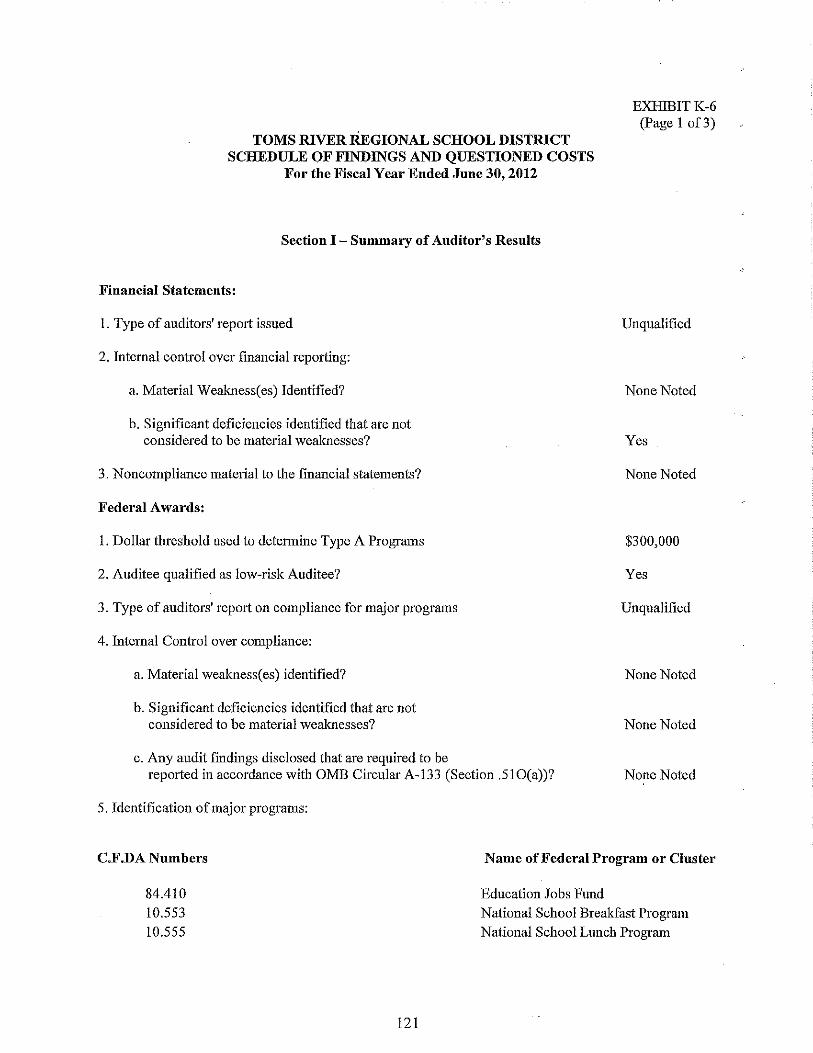
TOMS RIVER REGIONAL SCHOOL DIStRICT SCHEDULE OF FINDINGS AND QUESTIONED COSTS
For the Fiscal Year Ended June 30, 2012
Section I - Summary of Auditor's Results
Financial Statements:
1. Type of auditors' repOlt issued
2. Internal control over financial reporting:
a. Material Weakuess( es) Identified?
b. Significant deficiencies identified that are not considered to be material wealmesses?
3. Noncompliance material to the financial statements?
Federal Awards:
1. Dollar threshold used to determine Type A Programs
2. Anditee qualified as low-risk Auditee?
3. Type of auditors' repOlt on compliance for major programs
4. Internal Control over compliance:
a. Material weakness( es) identified?
b. Significant deficiencies identified that are not considered to be material weaknesses?
c. Any audit findings disclosed that are required to be reported in accordauce with OMB Circular A-l33 (Section .510(a))?
5. Identification of major programs:
EXHlBITK-6 (Page I of3)
Uuqualified
None Noted
Yes
None Noted
$300,000
Yes
Unqualified
None Noted
None Noted
None Noted
C.F.DA Numbers Name of Federal Program or Cluster
84.410 10.553 10.555
121
Education Jobs Fund National School Breakfast Program National School Lunch Program
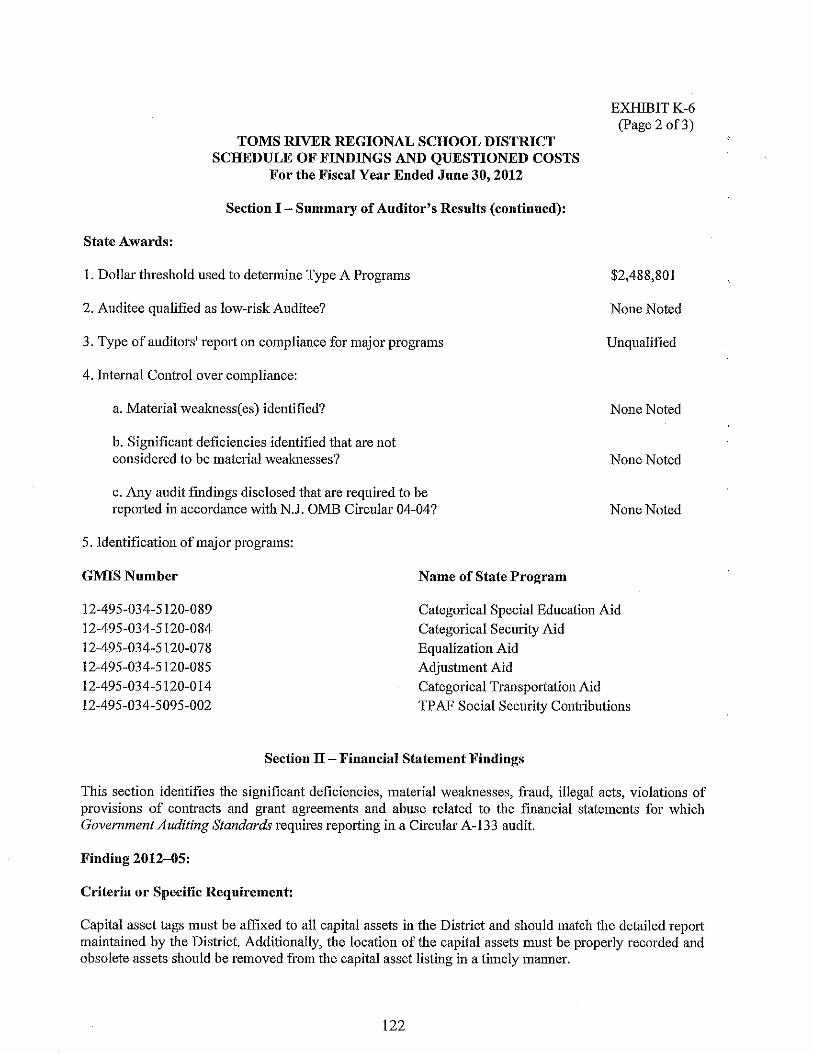
TOMS RIVER REGIONAL SCHOOL DISTRICT SCHEDULE OF FINDINGS AND QUESTIONED COSTS
For the Fiscal Year Ended June 30, 2012
Section I - Summary of Auditor's Results (continued):
State Awards:
I. Dollar threshold used to determine Type A Programs
2. Auditee qualified as low-risk Auditee?
3. Type of auditors' repOli on compliance for major programs
4. Internal Control over compliance:
a. Material weakness( es) identified?
b. Significant deficiencies identified that are not considered to be material wealmesses?
c. Any audit findings disclosed that are required to be repOlied in accordance with N.J. OMB Circular 04-04?
5. Identification of major programs:
GMISNumber Name of State Program
EXHIBITK-6 (Page 2 of3)
$2,488,801
None Noted
Unqualified
None Noted
None Noted
None Noted
12-495-034-5120-089 12-495-034-5120-084 12-495-034-5120-078 12-495-034-5120-085 12-495-034-5120-014 12-495-034-5095-002
Categorical Special Education Aid Categorical Security Aid Equalization Aid Adjustment Aid Categorical TranspOliation Aid TP AF Social Security Contribntions
Section 11- Fiuancial Statement Findings
This section identifies the significant deficiencies, material wealmesses, fraud, illegal acts, violations of provisions of contracts and grant agreements and abuse related to the financial statements for which Government Auditing Standards requires reporting in a Circular A-l33 audit.
Finding 2012-05:
Criteria or Specific Requirement:
Capital asset tags must be affixed to all capital assets in the District and should match the detailed repOli maintained by the DistTict. Additionally, the location of the capital assets must be properly recorded and obsolete assets should be removed from the capital asset listing in a timely manner.
122
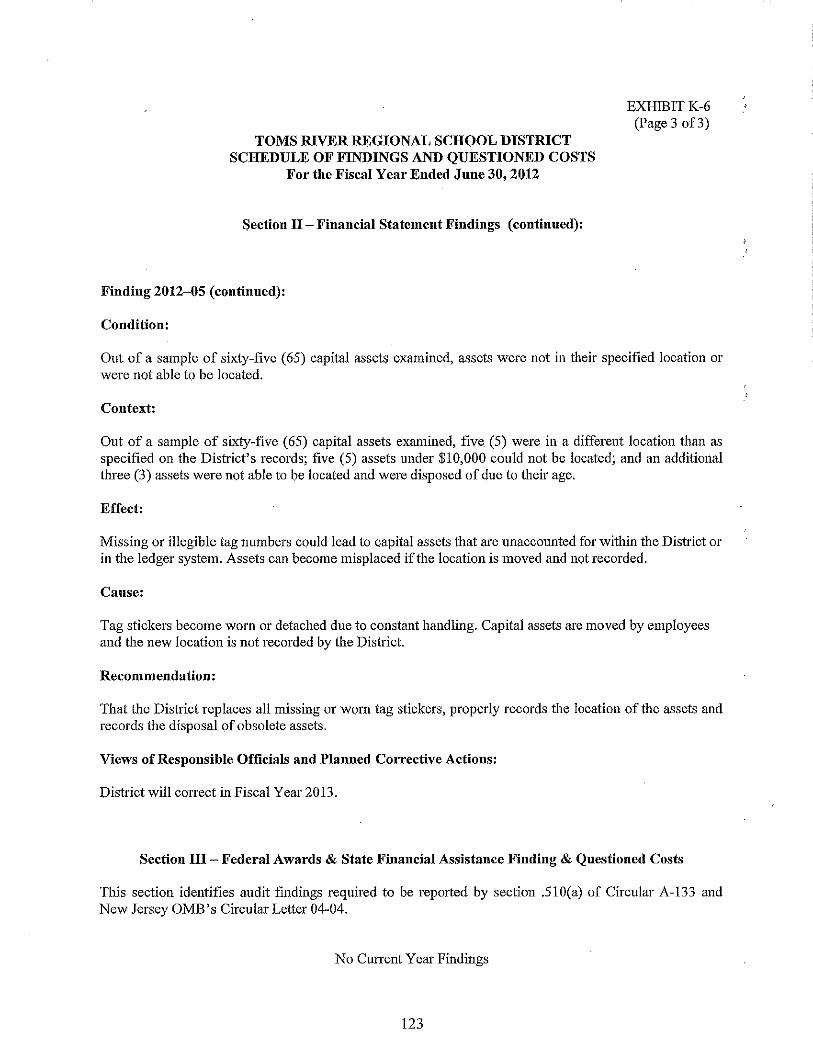
TOMS RIVER REGIONAL SCHOOL DISTRICT SCHEDULE OF FINDINGS AND QUESTIONED COSTS
For the Fiscal Year Ended June 30, 2012
Section II - Financial Statement Findings (continued):
Finding 2012-{)5 (continued):
Condition:
EXHIBITK-6 (Page 300)
Out of a sample of sixty-five (65) capital assets examiued, assets were uot in their specified location or were not able to be located.
Context:
Out of a sample of sixty-five (65) capital assets examined, five (5) were in a different location than as specified on the District's records; five (5) assets under $10,000 could not be located; and an additional three (3) assets were not able to be located and were disposed of due to their age.
Effect:
Missing or illegible tag numbers could lead to capital assets that aTe unaccounted for within the District or in the ledger system. Assets can become misplaced if the location is moved and not recorded.
Cause:
Tag stickers become worn or detached due to constant handling. Capital assets aTe moved by employees and the new location is not recorded by the District.
Recommendation:
That the District replaces all missing or worn tag stickers, properly records the location of the assets and records the disposal of obsolete assets.
Views of Responsible Officials and Planned Corrective Actions:
District will correct in Fiscal Yeru· 2013.
Section ill - Federal Awards & State Financial Assistance Finding & Questioned Costs
This section identifies audit findings reqnired to be repOlted by section .510(a) of Circulru· A-133 and New Jersey OMB's Circular Letter 04-04.
No Cunent Year Findings
123
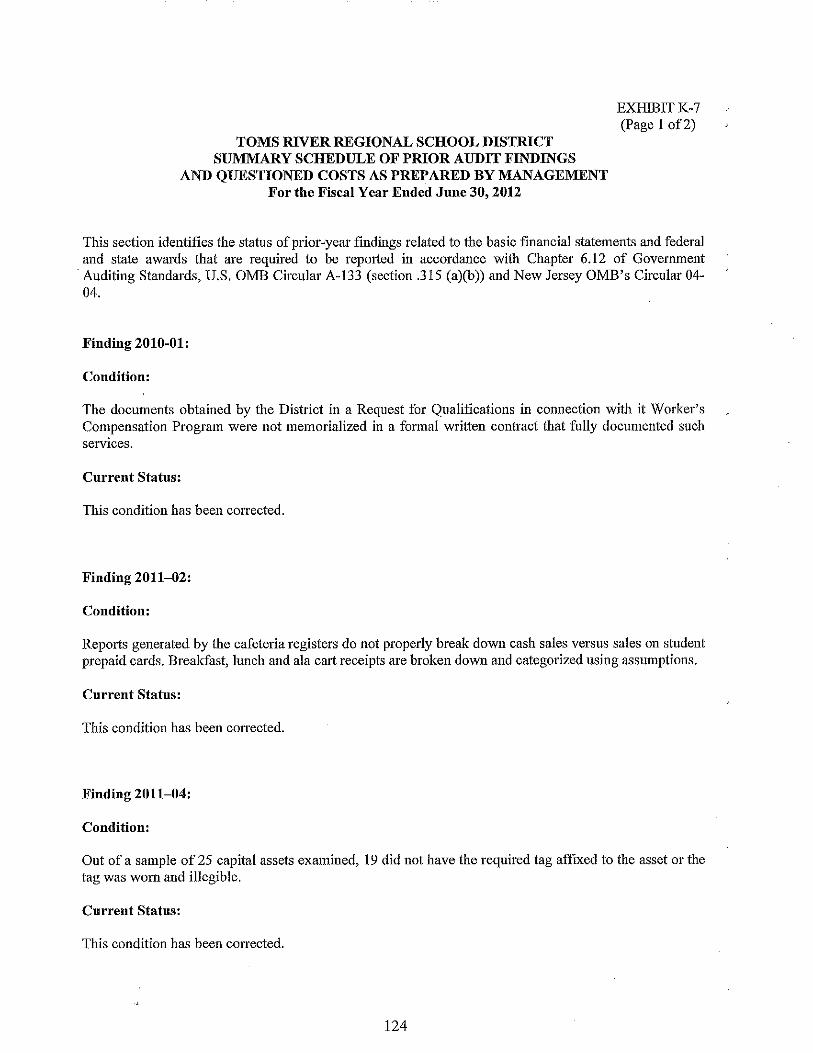
TOMS RNER REGIONAL SCHOOL DISTRICT SUMMARY SCHEDULE OF PRIOR AUDIT FINDINGS
AND QUESTIONED COSTS AS PREPARED BY MANAGEMENT For the Fiscal Year Ended June 30, 2012
EXHIBITK-7 (Page I of2)
This sectiou identifies the status of prior-year findiugs related to the basic financial statements and federal and state awards that are required to be reported in accordance with Chapter 6.12 of Govemment
. Auditing Standards, U.S. OMB Circular A-J33 (section .315 (a)(b)) and New Jersey OMB's Circular 04-04.
Finding 2010-01:
Condition:
The documents obtained by the District in a Request for Qualifications in connection with it Worker's Compensation Program were not memorialized in a formal written contract that fully documented such servICes.
Current Status:
This condition has been corrected.
Finding 2011-02:
Condition:
Reports generated by the cafeteria registers do not properly break down cash sales versus sales on student prepaid cards. Breakfast, lnnch and ala cmi receipts m·e broken down and categorized using assumptions.
Current Status:
This condition has been corrected.
Finding 2011-04:
Condition:
Out of a sample of 25 capital assets examined, 19 did not have the required tag affixed to the asset or the tag was W011l and illegible.
Current Statns:
This condition has been corrected.
124
TOMS RIVER REGIONAL SCHOOL DISTRICT SUMMARY SCHEDULE OF PRIOR AUDIT FINDINGS
EXHIBITK-7 (Page 2 of2)
AND QUESTIONED COSTS AS PREPARED BY MANAGEMENT (continned): For the Fiscal Year Ended Jnne 30, 2011
Finding 2011-05:
Condition:
Out of a sample of 25 capital assets examined, one concert lighting fixture could not be located within the District.
Current Status:
Although progress has been made, this condition has not been corrected.
125