Embed Size (px)
Citation preview
[24]
EDUCATION LAW INTO PRACTICE
SCHOOL DISTRICT RATES OF 504-ONLYSTUDENTS: The NEXT UPDATE*
byPERRY A. ZIRKEL, PH.D., J.D., LL.M. & GINA L. GULLO, ED.D.**
This article addresses the school district level as a follow-up to a recentpublished analysis of the U.S. Department of Education’s Civil Rights DataCollection (CRDC)1 that focused on the state2 rates of ‘‘504-only’’3 studentsfor the most recent available year, which is 2017-18.4 Along with finding anational rate of 2.71%, the state-rates analysis found percentages in 2017-18ranging from a top group consisting of New Hampshire (6.32%), Texas(6.00%), Louisiana (5.64%), and Vermont (5.48%) to a bottom tier consist-ing of Nebraska (1.18%), Wisconsin (1.08%), New Mexico (1.00%), andMississippi (0.65%).5 The national rate represented a continuing increase foreach biennium since 2009-10, which was the first full school year after theexpanded eligibility standards of the Americans with Disabilities Act (ADA)amendments went into effect.6
Method
The purpose of this analysis is to provide the district-level rates of§ 504-only students in 2017-18. As such, this analysis parallels a district-level
* This article was published in West’s Edu-cation Law Reporter v. 385, pp. 24–33(2021).
** Dr. Zirkel is university professor emeritusof Education and Law, Lehigh University,Bethlehem, PA. He is a past president ofthe Education Law Association. Dr. Gullo isassistant director for education services atthe Pennsylvania State Education Associa-tion. We acknowledge with appreciation Su-sanna Oo, Associate Analyst, CRDC Part-ner Support Center, for her diligent andtransparent responses to our multiple inqui-ries regarding the CRDC data.
1. On a biannual basis starting in 2009-10,the Department has provided these data forthe nation’s public schools based on a longsurvey form. For the CRDC website, seehttps://ocrdata.ed.gov/.
2. Perry A. Zirkel & Gina L. Gullo, StateRates of 504-Only Students in Public Schools:The Next Update, 385 Ed. Law Rep. 14(2021).
3. In light of the broader definition of dis-ability under § 504 than under the Individu-als with Disabilities Education Act (IDEA),‘‘§ 504-only’’ refers to the students whoqualify for eligibility and receive servicesunder § 504 but not under the IDEA. Morespecifically, these students are typicallyidentifiable because they have documenta-tion commonly referred to as a 504 planrather than the individualized educationplan (IEP) that the IDEA requires. Id. at 14& n.7.
4. For the initially released (October 15,2020) public-use data file, see https://www2.ed.gov/about/offices/list/ocr/docs/2017-18-crdc-data.zip.
5. Zirkel & Gullo, supra note 2, at 18.
6. 42 U.S.C § 12102(1)(A) (2018). The ex-pansion applied to the second and thirdessential eligibility elements: (1) physical ormental impairment that (2) substantiallylimits (3) one or more major life activities.

[25]
EDUCATION LAW REPORTER
sequel to the state rates for the previous biennial data.7 More specifically, theprevious article examined the 2015-16 data for school districts with enroll-ments of more than 1250 students, identifying (a) the fifty districts with thehighest prevalence rates of § 504-only students, which ranged from 9.77% to15.53%, and (b) a random sample of the 327 districts that reported havingzero § 504-only students.8
The source for this analysis is the CRDC public-use data file,9 whichincludes the most complete set of § 504-only enrollment data along with ahost of other variables for each public school in the nation.10 The procedurefollows the three relatively straightforward steps of the 2015-16 district-levelanalysis. The first step was to omit the school districts with enrollments offewer than 1250 students.11 The reasons for excluding the smaller districtswere that (1) they included a large concentration of atypical entities, such asdetention, early learning, and transition centers,12 and (2) due to their limitedsize (including several serving only one student), rather routine fluctuationsin the number of § 504-only students would result in seemingly substantialchanges in their percentage rates. The second step was to extract theenrollment and § 504-only figures for each of the remaining districts,calculate the resulting percentage rate for each one, and then arrange themin descending order of their § 504-only percentages. Finally, in light of theplanned focus on over- and under-identification,13 the third step was to limitthe examination here to the top and bottom segments of the percentagerange. The slight refinement of the procedure from 2015-16 was to select thedistricts with the highest enrollments rather than a random representation asthe sample of the bottom group.14
See, e.g., Perry A. Zirkel, The ADAA and ItsEffect on Section 504 Students, 22 J. SPECIAL
EDUC. LEADERSHIP 3 (2009). The effectivedate of the amendments was January 1,2009. Congress incorporated in these revi-sions directly in § 504. 29 U.S.C.§ 705(20)(B) (2018).
7. Perry A. Zirkel, School District Rates of504-Only Students, 356 Ed. Law Rep. 11(2018).
8. Id. at 12–13.
9. See supra note 4. The initial-release dataused in this analysis mirrors data used forthe previous parallel analysis, supra note 7.A secondary data release, scheduled forSpring 2021, will include corrections basedon district-submissions and data-quality out-reach. E-mails from Susanna Oo, AssociateAnalyst, CRDC Partner Support Center, toGina L. Gullo (Nov. 23, 2020, 4:59 PM ESTand Dec. 2, 2020, 5:27 PM EST) (on filewith author).
10. The response rate of the governmentsurvey for this data set was 99.9%. JuliaBloom-Weltman & Clover Quigley, CRDC2017-18 Technical Documentation 5 (2020),https://ocrdata.ed.gov/assets/downloads/DataNotes 2017-18 CRDC.pdf. Nevertheless, thisCRDC public-use data are subject to poten-
tial errors. See Zirkel & Gullo, supra note 2,at 17.
11. Although rational, this selected minimumnumber was ad hoc rather than being auniform or compelling standard. The public-use data file is readily available for morecomplete and detailed review and analysis.
12. However, as tradeoff, this minimum sizealso resulted in a limited representation ofalternative schools and, to a lesser extent,charter schools due to their smaller averagesize, particularly compared at the districtrather than school level. The average size ofalternative schools and charter schools inthe U.S. in 2017-18 was approximately 90and 437 students, respectively. NATIONAL
CENTER FOR EDUCATION STATISTICS, DIGEST OF
EDUCATION STATISTICS T216.20 (2019), https://nces.ed.gov/programs/digest/d19/tables/dt19 216.20.asp (for alternative school aver-age); NATIONAL CENTER FOR EDUCATION STA-
TISTICS, DIGEST OF EDUCATION STATISTICS
T216.30 (2019), https://nces.ed.gov/programs/digest/d19/tables/dt19 216.30.asp (forcharter school average).
13. Zirkel & Gullo, supra note 2, at 21.
14. The reason is that the reported lack ofany § 504-only students is particularly sub-ject to question for those districts with thehighest enrollments.

[26]
SCHOOL DISTRICT RATES
Top Group
The top group was limited to the fifty sizeable15 school districts with thehighest rates of § 504-only students.16 In the initial array of the qualifyingdistricts, we checked the top five districts primarily because all but the one inthe middle of them had not been in the top fifty two years earlier, and thatthird-place district had been twenty-second in 2015-16.17 E-mails with thecentral offices of these districts18 resulted in confirmations for two of them19
and corrections for the other three.20 The corrections eliminated those threefrom the top group, causing their sequential replacement with the next threedistricts in percentage order.21
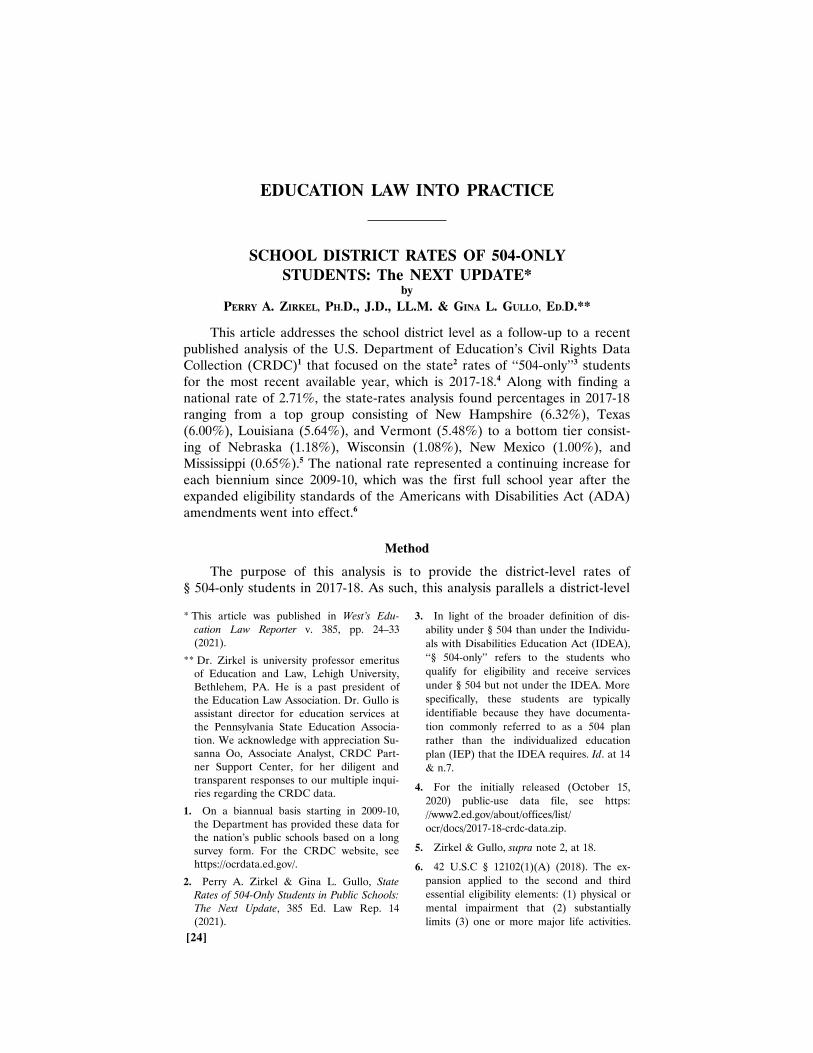
Table 1 identifies the top fifty school districts, referred to generically as‘‘local education agencies,’’ in rank order, along with their state, enrollment,and percentage rate. The two other features of this table are (1) shading inthe state column to show whether the district rate noticeably correlates withthe state rate,22 and (2) addition of an asterisk to identify charter schoolentities.23
A review of Table 1 reveals that the fifty schools range from a high of16.72%, which is slightly more than six times the national average, down to11.35%, which is slightly more than four timesthe national average.24 The
15. ‘‘Sizeable’’ here refers simply to thosewith enrollments of over 1250 students. Seesupra text accompanying note 11.
16. As in the relatively brief predecessor arti-cle, the number fifty was based on spacelimitations.
17. The cumulatively reinforcing reasonswere that (1) the percentage of the first-place district was an outlier, and (2) thestates of location for the majority of thesefive the states were in the bottom group.
18. Prior to contacting districts, we consultedwith the CRDC representative, who con-firmed that these were the results that thesedistricts reported. E-mail from Susanna Oo,Associate Analyst, CRDC Partner SupportCenter, to Gina L. Gullo (Nov. 23, 2020,4:59 PM EST) on file with author).
19. E-mail from Bruce Law, Superintendent,Twp. High Sch. Dist. 113 (Illinois) to PerryA. Zirkel (Nov. 24, 2020, 13:39 EST); e-mailfrom Perry A. Zirkel to James Kaishian,Superintendent, Briarcliff Manor UnionFree Sch. Dist., (Dec. 23, 2020, 14:06 EST)(on file with author).
20. E-mail from Loralei Krum, Admin. Ass’tto the Superintendent, Paola Unified Sch.Dist. (Nebraska), to Perry A. Zirkel (Nov.23, 2020, 14:58 EST) (correcting rate from16.28% to 6.01%); e-mail from Mitch Bar-tholomew, Superintendent, York Pub. Sch.
(Nebraska), to Perry A. Zirkel (Nov. 19,2020, 14:49 EST) (correcting rate from23.70% to .0029%); e-mail from GerardPoole, Superintendent, Shoreham WadingRiver Cent. Sch. Dist. (New York), to PerryA. Zirkel (Dec. 4, 2020, 10:28 EST) (cor-recting rate from 23.70% to .0029%) (onfile with author).
21. The replacement districts are those listedat ranks 48–50 in Table 1.
22. The background of the cell in the statecolumn differentiated to show whether thedistrict is in the top third (designated bydark gray), middle third (designated by lightgray), or bottom third (designated by white)of the states according to their 2017-18 ratesof § 504-only students. Zirkel & Gullo, su-pra note 2, at 22–23.
23. For districts neither expressly namedcharters or regular local education agencies,we checked the website to determine thestatus.
24. Although the ratio remained the same,the increase from the corresponding rangeof the top group in 2015-16 (Zirkel, supranote 7, at 12) ranged from 1.19% to 1.58%for the districts at ranks 1 and 50, respec-tively, compared with the increase of .42%from 2.29 (2015-16) to 2.71% (2017-18) inthe overall rate for the 50 states and theDistrict of Columbia.

[27]
EDUCATION LAW REPORTER
aforementioned25 shading of the state column suggests a notable correlationbetween these districts and their state § 504-only rates; forty-five of the fiftyschools were in high-rate states,26 and two of the remaining five states were inthe middle rather than bottom group.27 Finally, the entries in the localeducation agency column reveal that only three of the top districts werecharter schools.28
Bottom GroupThe selection for the bottom group was more problematic due to the
space limitations against listing all 243 sizeable districts reporting29 not asingle § 504-only student. As a result, Table 2 is limited to a sample of fifty ofthese districts in order of descending enrollments.
Table 2 shows that some of these districts have particularly high enroll-ments; indeed, fifteen of them have more than 10,000 students, and the firsttwo have enrollments well above 25,000 students.30 For these highest-enroll-ment districts the complete absence of any § 504-only students seriously callsinto question their identification or reporting practices. The shading in thestate column suggests a much more limited correlation between the districtand state § 504-only rates in the bottom than in the top group;31 only a slightmajority of the schools were in the bottom third of the states, with theremainder in states that were in the top (n=7) or intermediate (n=17) thirdsof states.32 Finally, only one of the districts in the zero § 504 sample was acharter school.33
Interpretation and ConclusionsThe primary finding of this district-level follow-up analysis is the strik-
ingly wide variance in the rates of § 504-only students, ranging from almost17% to 0% of the student population of districts with an enrollment of morethan 1250 students. In the top group, the ratio between the national average
25. See supra note 22 and accompanying text.
26. Texas accounted for two thirds of theforty-two states, which paralleled its predo-minance in 2015-16. Zirkel, supra note 7, at13 n.17. Moreover, as Table 1 shows, someof these Texas school districts have stagger-ingly high enrollments, with the most ex-treme being one with more than 100,000students.
27. However, the state groups were thirds,thus representing a much wider segmentthan the top fifty districts. Moreover, a cor-relation coefficient would much more pre-cisely take into account the individual posi-tions within the entire state and district lists.
28. Similarly, during 2015-16 only one of thetop fifty districts was a charter school. Zirk-el, supra note 7, at 18.
29. The public-use data file reported twoadditional districts as ‘‘data missing’’ overall,thus including their § 504-only enrollments.These districts are not included in our countof those reporting zero § 504-only students.
30. The bottom group in the 2015-16 analysisconsisted of 327 districts in comparison tothe 243 districts in this 2017-18 analysis,with some having high enrollments. Zirkel,supra note 7, 19-20.
31. See supra text accompanying notes 25-27.The 2015-16 analysis also found a lessercorrelation for the bottom group, but thesampling procedure for the bottom groupwas not the same. Zirkel, supra note 7, at14. The lack of randomness here limits in-ferences about the generalizability of thecorrelation.
32. Texas accounted for four of the sevenhigh-enrollment states in this group, andGeorgia accounted for seven of the seven-teen intermediate-enrollment states.
33. The 2015-16 analysis found more charterschools (n=3) in the bottom group, but thedifference is likely attributable to that sam-ple being random and thus not having themoderate skew against their generallysmaller enrollments in this analysis (supranote 12). In any event, due to the 1250-stu-

[28]
SCHOOL DISTRICT RATES
and each district’s percentage is so pronounced as to not only pose practicaldifficulties of implementing the resulting requirements of § 504 and theADA,34 but also suggest likely systemic over-identification.35
The bottom end is equally noteworthy. The finding of 243 schooldistricts with enrollments over 1250 students that reportedly each do not haveany identified § 504 student seems to suggest a dramatically significantpattern of suspected under-identification. In light of the broad definition ofdisability under § 504, as liberalized in the ADA amendments of 2008 andthe resulting ADA regulations of 2016,36 it seems highly improbable that adistrict with an enrollment of over 1250 students would not have a singlestudent with diabetes, Crohn’s disease, a life-threatening allergy, or severeasthma in addition to students with ADHD, Asperger syndrome, or anxietydisorders who did not qualify under the IDEA but nevertheless have aresulting substantial limitation on interacting with others, concentration, orother qualifying major life activity.37 The alternative explanation, which mayapply to some of these districts, although not negating systemic under-identification more generally, is the lack of accurate district inputting on thelong CRDC survey form.38
Moreover, as the shading in Tables 1 and 2 show, these remarkably highand low rates in comparison to the national prevalence of 2.71% appear inthe majority of these districts, particularly in the top group, to extendsystemically to the state level. Yet, for the remainder of these districts,especially but not exclusively in the zero group, the identification or reportingissues appear to be endemic to the district or schools within it.39
dent cut-off for the districts, any inferencesabout the relationship to charter school sta-tus are reserved for the follow-up school-level analysis.
34. These legal requirements include notonly procedural safeguards, such as periodicreevaluations and impartial hearings, butalso substantive services that extend wellbeyond classroom accommodations. E.g., 34C.F.R. §§ 104.3-104.36. The ADA adds afew specialized requirements, such as ser-vice animals and effective communications.28 C.F.R. §§ 35.136 and 35.171 (2019). Ad-ditionally, unlike the IDEA, neither Section504 nor the ADA provides any federal fund-ing, and no state thus far has appropriatedfunding for 504-only students. See Zirkel &Gullo, supra note 2, at 15.
35. The typical explanations that districts of-fer for such high rates include leveling theplaying field and being proactive for diag-noses. E.g., Douglas Belkin & Tawnell D.Hobbs, More Students Are Getting SpecialHelp in Grades K-12, WALL ST. J., July 3,2018, https://www.wsj.com/articles/more-students-are-getting-special-help-in-grades-k-12-1530646260. However, these ra-tionales amount to rationalizations becausethey ignore (1) the specific eligibility stan-
dards of § 504, particularly the essentialelement of a substantial limitation in rela-tion to most people in the general popula-tion; (2) the availability of general educationinterventions, without the formalities andtransaction costs of § 504, for such accom-modations; and (3) the unwarranted advan-tages of extra time on the SAT, an accom-modation that has reportedly doubled since2010. Douglas Belkin, Jennifer Levitz, &Melissa Korn, Many More Students, Especial-ly the Affluent, Get Extra Time to Take theSAT, WALL ST. J., May 21, 2019, https://www.wsj.com/articles/many-more-students-especially-the-affluent-get-extra-time-to-take-the-sat-11558450347.
36. 29 U.S.C. § 705(20) (2018); 28 C.F.R.§ 35.108 (2019).
37. Unlike § 504, the IDEA has a restrictedset of impairments and requires a resultingneed for special education. 20 U.S.C.§ 1401(3) (2018); 34 C.F.R. § 300.8 (2019).
38. For limited examples of such reportingerrors, see supra note 20 and accompanyingtext.
39. As an example of the differences in thestate-district relationship, Texas, which isthe second-place state in § 504 rates, isamply represented in both the top and bot-

[29]
EDUCATION LAW REPORTER
To the likely extent that that these polar samplings signal a more generalpattern of over- and under-identification, such practices are likely attribut-able to insufficient awareness of and adherence to the specific eligibilitycriteria under § 504.40 For the adherence side, a non-negligible part of theproblem is attributable to local or larger school culture that seeks competitiveadvantage in response to the federal accountability legislation in states thatuse timed tests for their assessments of academic achievement41 or, morefrequently, both contributes and succumbs to parental pressures for providingextra time and other accommodations for their child.42 Although parental anddistrict wealth, particularly in relation to extra time on high stakes testing, isa contributing factor,43 the explanation for the district variance in prevalencerates among school districts is more complex, extending to the state andschool levels.44
On the scholarly level, this article repeats the earlier recommendationfor multivariate quantitative research and case-study qualitative research toexplore the reasons for the variance at the district level.45 On the practicallevel, this article also reinforces the message of its predecessor analyses thatpublic school leaders should provide more careful attention to professionaldevelopment and systematic procedures adhering to the legal standards foreligibility under § 504.46 Finally, similarly following the previous pattern,47 thefollow-up of this article will extend the analysis to the school level.
tom § 504-rate groups of school districts.See supra notes 26 and 32.
40. For an eligibility form that summarizesthese criteria, including the interpretivestandards of the ADA amendments, seeperryzirkel.com. For a related discussion,see Perry A. Zirkel, Avoiding Under- andOver-Identification of 504-Only Students: Pit-falls and Handholds, 359 Ed. Law Rep. 715,716 (2018).
41. See, e.g., Lyn Olsen, The New TestingLandscape: How State Assessments AreChanging under the Federal Every StudentSucceeds Act (Sept. 2019), https://www.future-ed.org/the-new-testing-landscape-state-assessments-under-essa/.
42. See, e.g., Tiffany Rowe Chavez, Habitusand Access: How the Elite Get Their Col-leges of Choice 96-102 (Oct. 31, 2019)(Ed.D. dissertation, Concordia UniversityChicago), https://search.proquest.com/openview/2fe76b59ca5836dcbfe088741650fbaf/1.pdf?pq-origsite=gscholar&cbl=18750&diss=y (finding cultural, ethical, and prac-
tical problems in a case study of a high§ 504-rate district).
43. E.g., id.; Belkin, Levitz & Korn, supranote 35; Perry A. Zirkel & John M. Weath-ers, K-12 Students Eligible Solely under Sec-tion 504: Updated National Incidence Data,27 J. DISABILITY POL’Y STUD. 67, 71 (2016).
44. Various wealthy districts are scattered atvarious points from the top to bottomgroups of § 504-only prevalence rates, sug-gesting that other factors that are reflectedin the variance at not only the state levelbut also and more dramatically at the schoollevel, play a contributing and interactingrole.
45. Zirkel, supra note 7, at 16.
46. Id.
47. Perry A. Zirkel, School District Rates of504-Only Students, 356 Ed. Law Rep. 11(2018); Perry A. Zirkel, Public School Ratesof 504-Only Students, 356 Ed. Law Rep. 1(2018); Perry A. Zirkel & Tiedan Huang,State Rates of 504-Only Students in K-12Public Schools: An Update, 354 Ed. LawRep. 621 (2018).

[30]
SCHOOL DISTRICT RATES
[31]
EDUCATION LAW REPORTER

[32]
SCHOOL DISTRICT RATES

[33]
EDUCATION LAW REPORTER