Embed Size (px)
Citation preview
School food: top marks
A summary report on food in schools research in Northern Ireland
School food: top marks
A summary report on food in schools research in Northern Ireland
AuthorsGillian Gilmore, Diana Gossrau-Breen, Lindsay MacDonald, Laura Taylor and Laura McGowan.
This report should be cited as:Gilmore G, Gossrau-Breen D, MacDonald L, Taylor L and McGowan L. School food: top marks. A summary report on food in schools research in Northern Ireland. Belfast: Public Health Agency, 2010.
Contents page
List of tables ....................................................................................................................................... 4
List of figures ..................................................................................................................................... 5
Food in schools research – overview and recommendations ............. 6
Background ....................................................................................................................................... 10
School food: top marks programme ......................................................................... 12
Aim ..................................................................................................................................................... 12
Objectives ........................................................................................................................................ 12
Research methods ...................................................................................................................... 13
Aim ..................................................................................................................................................... 13
Objectives ........................................................................................................................................ 13
Survey recruitment ......................................................................................................................... 14
Presentation of results .................................................................................................................... 15
Results Section 1: Healthy eating knowledge, attitudes and behaviour ... 17
Current eating habits ..................................................................................................................... 17
Knowledge of healthy eating ........................................................................................................ 17
Promoting healthy messages and lifestyles .............................................................................. 19
Section 2: Nutrition policies and standards within the school setting ..................................................................................................................................................... 21
Nutrition policies ............................................................................................................................. 21
Attitudes to nutrition in the school setting ................................................................................ 22
Support for nutritional standards ................................................................................................ 23
Compliance with nutrition standards ......................................................................................... 23
Section 3: Nutritional standards for school lunches ................................. 26
School meal uptake ........................................................................................................................ 26
The school meal experience ......................................................................................................... 27
Staff, pupils’ and parents’ opinions of school meals .............................................................. 29
Attitudes to school meals ............................................................................................................. 30
Choice ............................................................................................................................................... 31
Cost and value for money ............................................................................................................. 32
Queues .............................................................................................................................................. 32
The dining environment ................................................................................................................. 33
Addressing the needs of FSM pupils ........................................................................................ 33
Section 4: Nutritional standards for other food and drinks in schools ................................................................................................................................................... 35
Breakfast ........................................................................................................................................... 35
Break time snacks and drinks ...................................................................................................... 36
After school clubs ........................................................................................................................... 39
Sources of food provision ............................................................................................................. 39
Access to food and drinks outside school ............................................................................... 40
Discussion .......................................................................................................................................... 42
Nutritional standards – stage of implementation .................................................................... 42
Support for and awareness of nutritional initiatives ................................................................ 42
Dietary behaviour during the school day ................................................................................... 43
Access to foods contravening the standards .......................................................................... 43
Economic implications of nutritional standards ....................................................................... 43
Making effective changes ............................................................................................................. 44
Supplying practical motivating information ............................................................................... 44
Mechanisms to motivate behaviour change ............................................................................. 45
References ......................................................................................................................................... 47
Appendix .............................................................................................................................................. 49
List of tables page
Table 1: Response rates for each stakeholder group (total and by school sector) .............. 15
Table 2: Barriers to pupils’ healthy eating as reported by pupils and parents ....................... 19
Table 3: Healthy eating policies or guidelines followed in school as reported by principals
(prompted) ............................................................................................................................. 21
Table 4: Staff and parents’ views on healthy eating in the school setting .............................. 22
Table 5: Top five key issues principals experienced in implementing nutritional standards
(unprompted) ......................................................................................................................... 24
Table 6: Top five key reasons principals provided for the increase/maintenance or decrease
in school meal uptake (prompted) .................................................................................... 27
Table 7: Specific changes to the school meal experience as reported by principals ........... 28
Table 8: Pupils’ reasons for preferred lunch option ...................................................................... 29
Table 9: Factors that would encourage post-primary pupils to eat school meals
(prompted) ............................................................................................................................. 31
Table 10: Source of break time foods ................................................................................................ 38
Table 11: Source of break time drinks ............................................................................................... 38
Table 12: Impact of food outlets outside school as identified by teachers and governors ... 40
Appendix
Table 13: Breakfast club foods – food and drinks provided at breakfast clubs as reported by
parents, and food and drinks consumed at breakfast clubs as reported by primary
and post-primary pupils ....................................................................................................... 49
Table 14: After school clubs – food and drinks provided at after school clubs as reported by
parents, and food and drinks consumed at after school clubs as reported by primary
and post-primary pupils ....................................................................................................... 50
Table 15: School canteen/cafeteria – food and drink available in the school canteen/cafeteria
as reported by principals and food and drink purchased from this source as
reported by post-primary pupils ........................................................................................ 51
Table 16: Products available in vending machines and tuck shops as reported by principals and
products purchased from these sources as reported by post-primary pupils ............... 52
4
List of figures page
Figure 1: Proportion of stakeholders correctly identifying the recommended daily intake of
fruit and vegetables .............................................................................................................. 18
Figure 2: Support for the introduction of healthier foods in school (by parents) and nutritional
standards (by school staff) ................................................................................................. 23
Figure 3: Proportion of principals indicating full compliance with nutritional standards for
lunches (N=287) and other food in schools (N=250) ................................................. 24
Figure 4: Impact of nutritional standards on school meal uptake: principals’ views
(N=290) .................................................................................................................................. 26
Figure 5: Changes to the school meal experience as reported by principals (N=298) ........ 28
Figure 6: The main areas of dissatisfaction with school meals among primary (N=1,120 and
post-primary (N=2,143) pupils .......................................................................................... 30
Figure 7: Source of break time snacks for primary (N=1,096) and post-primary
(N=2,111) pupils .................................................................................................................. 36
Figure 8: Foods consumed by primary (N=1,126) and post-primary (N=2,148) pupils at
break time ............................................................................................................................... 36
Figure 9: Drinks consumed by primary (N=1,126) and post-primary (N=2,148) pupils at
break time ............................................................................................................................... 37
5
6
Food in schools research – overview and recommendations
Nutritional standards for school lunches were introduced in Northern Ireland in September 2007, with standards for other food and drinks in schools being launched in the following year (April 2008) through the School food: top marks programme. This programme is a joint venture by the Department of Education (DE), the Department of Health, Social Services and Public Safety (DHSSPS) and the Public Health Agency (PHA). These standards were introduced to ensure that all food and drinks provided throughout the school setting make a significant contribution to childhood and adolescent nutrition.
Pupils have various set opportunities to eat during the school day. The main opportunities are at break and lunch time; however, a growing number of schools offer breakfast or after school clubs, where food may also be eaten. The food eaten at each of these opportunities may have come from a variety of venues either within the school (canteens, cafes, vending machines, tuck shops or school catering service) or outside it (from home or local shops).
This research has highlighted the barriers that schools have experienced in implementing the nutritional standards. In particular, it identifies the potential adverse impact that external sources of food may have on pupils’ healthy eating practices within the school setting. It also illustrates how the accessibility of food and drinks contradicting the standards, within the school, may limit the success of the standards. This report further emphasises how practical constraints within the school meals system, such as queues, can negatively influence pupils’ uptake of healthy foods.
Given these findings, it is imperative that programmes to develop healthy eating practices inside and outside of school recognise, and act upon, the initial knowledge, attitudes, motivators and barriers that children and young people experience in regard to healthy eating, both in general and specifically within the school environment. Age appropriate healthy eating programmes and strategies need to be developed which increase their knowledge, minimise the barriers and maximise the motivating factors that they experience both within and outside the school setting.
In addition, healthy eating programmes need to ensure that all potential educators or gatekeepers of childhood and adolescent nutrition (including school staff and parents) have correct and up-to-date nutrition information and practical skills to ensure that they can positively impact on young people’s nutrition and be seen as a positive role model. These factors must be addressed at the core of the School food: top marks programme and in doing so it is anticipated this will facilitate a number of processes including:• more ready acceptance of healthier foods within and outside the school setting;• less likelihood of food and drinks contravening the standards being brought from home or
outside school;• promotion of school meal uptake;• encouragement of an overall healthy eating ethos within the school and outside the school
as a social norm;• minimal influence on school income from the removal of high fat foods and sugary drinks
from, for example, vending machines or school meals.
This research has highlighted a number of recommendations to aid the implementation of the School food: top marks programme.
7
1. Schools need to understand the content of the nutritional standards and to be clear about their role, and that of others, in this implementation process. Although the implementation documents launched since this research took place will facilitate this understanding, supplementing these documents with training workshops would be beneficial for all school staff: governors, principals, teachers and catering team. These workshops should be used to highlight the challenges some schools have in implementing standards and practical mechanisms to address these problems (see further recommendations). Schools which have fully implemented the standards should be closely involved in the development of these workshops and examples of best practice from within these schools should be showcased.
2. All school based stakeholders were able to identify that they had a role in influencing pupils’ nutrition and that a whole school approach was necessary to facilitate this process. However, some issues arose in relation to the support among key staff groups internal to the school environment. Effective internal communication is a key driver in implementing a whole school approach and it is recommended that regular liaison needs to occur between all school staff including boards of governors, principals, teachers and catering teams. This should include regular communication forums or meetings to ensure all parties are sharing information on progress made with the implementation of the standards, as well as how any difficulties in implementing standards can be resolved. Schools should be further encouraged to set up wider consultation groups to include not only school based staff but also pupils (of a variety of ages) and parents. These groups should be used to engage and involve pupils and parents actively in the evolving supply and promotion of healthier school food.
3. Schools should ensure that food and drinks sold in vending machines and tuck shops comply with the nutritional standards. This was an area in which compliance with the standards was much weaker. It is recommended that more regular monitoring of school activity in this area is introduced, considering the role of school catering service and what additional sanction (if any) could be applied to those schools that contravene the standards. This research has also found wide variation in the proportion of compliant/non-compliant foods served at breakfast and after school clubs, which suggests these clubs should also be monitored and inspected. In addition, this monitoring process should be extended to developing and listing performance indicators for individual schools to monitor their own success in implementing the standards.
4. The promotion of healthy eating within schools can only succeed with the support of parents. Given this, schools need to be further supported to engage with parents. It is recommended that DE alongside the health sector liaise to produce information for parents on nutritional standards within schools, and the role parents can play in implementing these standards, for example, by providing healthy foods for break and lunch. Parents have also suggested that healthy eating recipes and information on cooking cheap and healthy meals would be welcomed. Communication between schools and parents must be ongoing and it is recommended that schools regularly update parents on all issues around school food. This should include information on current initiatives, promotion of the school meals service and regular information bulletins on the school menus.
8
5. It is acknowledged that communication with parents may be difficult and this research has identified that it is somewhat limited at present to parents of children in primary school and better educated parents. Various modes of communication should be tested with parents, including leaflets and letters sent either directly to parents or disseminated via pupils. In addition, more active methods of engagement should be used, such as inviting parents to be part of school food consultation groups, offering taster sessions of school meals at parent evenings or sports events, and healthy eating information sessions.
6. In line with having a whole school approach to healthy eating, it is recommended that DE and ELBs work closely with schools to help them establish the practical needs of their customers (parents and pupils) in relation to school meals and other food in school. To this end, schools should be provided with adequate tools and training support to facilitate carrying out an audit of school food to identify problems or issues with school meals or other food in school. As part of this auditing process, it is vital that schools consult with pupils, parents and all school staff.
7. The limited choice available within the school meal was often highlighted as an issue for pupils. DE and ELBs should therefore work closely with schools and catering management teams to ensure schools are able to offer a wide variety of school meals which meet the standards. Consideration needs to be given to providing choice which is priced competitively and offering a range of foods from traditional school lunches to ‘grab and go’ snacks and ‘meal deals’.
8. Much concern was expressed about the cost of school meals, particularly among parents. It is therefore recommended that consideration be given to how cost increases in school meal provision can be minimised in the short to medium term to allow the impact of the changes, brought about through the introduction of the standards, to become embedded within the school catering service. In addition the nutritional value of school meals should be promoted to parents.
9. Queuing was the other major issue raised in relation to school meals. Schools need to look at their internal systems for lunchtime management to determine if staggering lunch breaks is feasible, a solution which would not only alleviate the queuing problems but also provide more valuable time for pupils to eat their lunch. If schools are able to stagger lunches, timetable permitting, they should consider staggering on a year group basis and hence not exposing younger children to the peer influence of older pupils with much higher consumption of high fat foods and high sugar drinks. Schools should also look closely at the mechanisms for purchasing foods, for example pre-ordering, use of snack bars, as an alternative technique for reducing queues.
10. Given the deficiencies and excesses in pupils’ diet highlighted throughout this research it is suggested a promotional campaign is instigated to inform and motivate them to eat healthily. This research suggests that such a campaign should address the impact of good/poor nutrition on health, for example, pupils specifically mentioned obesity as one of the outcomes of poor nutrition which would motivate them to make dietary changes. This in turn suggests that a focus on the short and medium-term impact of poor diet, as opposed to the long-term effects, may provide additional impact in this group. This research also suggests that other topics which need to be addressed include promoting the benefits of breakfast, regular drinking of water and healthy snacking at break time, increasing fruit and vegetables and decreasing the intake of high fat foods and sugary drinks. Additional campaigns could advertise more pictorially the specific foods on offer within the school meal as a mechanism to boost uptake.
9
11. It is recommended the actual messages and visuals used within school campaigns should be tested for their message clarity and motivation to instigate behaviour change with a range of sub populations of pupils, especially those who display poorer eating habits, eg boys and those in the lower social classes. In addition, given the decline in healthy eating habits observed with age, an intensive campaign should be targeted towards those in post-primary schools especially in Years 8 and 9. It is also of vital importance that messages to promote information to pupils are delivered by mechanisms that pupils relate to, for example, posters. The advantage of this type of mechanism is that posters can be displayed at multiple points throughout the school and relay messages not only to pupils but also to all school staff and visitors.
12. Information campaigns should be supported by resources for teachers which can be used within the classroom setting to reinforce the health messages being delivered to pupils. These resources need to focus not only on written information, but also to encompass interactive components, for example, videos on the impact of poor nutrition as a discussion tool, teaching cooking skills, web based delivery mediums.
13. Information and motivation campaigns are not enough to instigate changes in dietary behaviour. These must be accompanied by practical factors to encourage uptake of healthy foods which negate the peer influence barrier that young people experience in trying to eat healthily. This should include the incorporation of initiatives such as healthy eating days or healthy breaks schemes into schools. It is recommended that regional schemes should be developed with accompanying resources for schools and parents to guide schools in delivering and implementing such schemes, ensuring uniformity of the health messages being delivered to pupils, teachers and parents.
10
Background
Dietary behaviour plays a critical role in an individual’s current and future health status, with the eatwell plate model illustrating the optimum balance of dietary components necessary to maintain good health.1 It is the modification of this balance which impacts on our health status, with eating patterns that are rich in fruit and vegetables found to reduce the risk of obesity, heart disease and some cancers.2,3 Conversely, diets rich in saturated fat and sugar have an opposing impact increasing the risk of obesity and cardiovascular disease.2,4
Achieving a healthy balanced diet is important throughout the life course. However, given that many diseases, for example cardiovascular disease, begin early in life, childhood is a vital stage for good nutrition.5 Not only is this a time of rapid growth, development and activity, but the impact childhood nutrition may have on adult health also accentuates the importance of a balanced diet at this stage of life in the prevention of chronic disease.6,7
Local evidence suggests that children’s diets are far from balanced, with only 15% of post-primary children (aged 11–16) usually eating five or more portions of fruit or vegetables each day.7 In contrast, just over a quarter (27%) of children in this age group consume sweets, chocolate bars or biscuits once a day, with 33% of children in this age group consuming these foods more than once a day.8
These findings are perhaps unsurprising, given that the Hastings report commissioned by the Food Standards Agency concluded that children’s food promotion is dominated by television advertising, in the main promoting pre-sugared breakfast cereals, confectionery, savoury snacks, soft drinks and, latterly, fast-food outlets.9 The consequences of this are, however, evident in the poor health displayed even among very young children in Northern Ireland. For example, over a fifth of all children starting primary school here are classified as overweight or obese, a figure which is continually rising.10
This constant increase in obesity levels resulted in the establishment of a cross departmental taskforce, Fit Futures, which aimed to identify priorities for action to prevent the rise in levels of overweight and obesity in children and young people.
The Fit Futures taskforce highlighted that the knowledge, attitudes and skill sets of a variety of key groups and individuals including school employees, parents and children themselves were important in influencing children’s nutrition choices.11 However, the report also recognised that the potential positive influence schools have in providing health education to children may be somewhat undermined by the conflicting foods and drinks children have access to, within the school setting. This included other food and drinks provided within school tuck shops, and vending machines as well as within the school meal.11
The Fit Futures report, therefore, called for a food in schools programme to be established to include a resourced, inspected programme to introduce food and nutrient based standards for all food in schools. This programme would build upon the consultation document ‘Catering for healthier lifestyles’, which proposed compulsory nutritional standards for school meals first published by the Department of Education (DE) in 2001.12 These nutritional standards were initially piloted and evaluated within 105 schools in 2004/2005.13
11
In 2006 the DE issued proposals for updated nutritional standards for school lunches, as well as new proposals for nutritional standards for other food and drinks in schools. The additional standards aim to address some of the issues highlighted in the previous evaluation of school standards, regarding the wide availability of less desirable food and drink choices through, for example, tuck shops and vending machines. The new nutritional standards for school lunches were made compulsory from September 2007 and in April 2008 were extended to include all food and drinks provided in schools under the branding School food: top marks.14,15
This report briefly outlines the overarching aims and objectives of the School food: top marks programme and presents summary findings from research carried out with school staff, parents and children (the full research report is available on application from the Public Health Agency). This research was designed to help ascertain the extent to which the standards are implemented and determine stakeholders’ current attitudes to school food. The research also undertook to understand the motivators and barriers that children experience in eating healthily in a bid to identify information needs or mechanisms to facilitate the implementation of the nutritional standards.
12
School food: top marks programme
AimTo ensure that all food and drinks provided throughout the school setting makes a significant contribution to childhood nutrition and schools are supported in the development of knowledge and skills necessary for children and young people to make healthier choices.
Objectives• To raise public awareness of the significant contribution that food and beverages make to
health in both the short and the long term.• To ensure that food available through the school dining room and all other food opportunities
(eg breakfast clubs, vending machines, tuck shops) meets the nutritional standards for school lunches and other food and drinks.
• To increase uptake of school meals, particularly among those entitled to free school meals.• To encourage an increased uptake of healthier options offered through school meals and
other sources within school, eg vending, tuck shops, breakfast clubs.• To encourage parents of school children to consider the eating patterns of the wider family
and to adopt healthy eating habits.• To provide schools and other stakeholders with training and resources which will encourage
the development of knowledge and skills necessary to make healthier choices.
13
Research methods
AimTo gather information regarding attitudes and perceptions of food in schools including healthy eating and school meals with a variety of populations including principals, school governors, teachers, parents, children, and catering staff within schools and Education and Library Boards (ELBs).
Objectives• To assess the attitudes of school teaching staff, catering staff, principals, school governors,
children and parents with regard to: - food in schools; - healthy eating; - uptake of school meals/free school meals and how this can be influenced; - current policies and practices; - meal time environment; - acceptability of changes to school meals; - targets for change.
• To gather information about the practical aspects of food in schools and lunch time arrangements from principals, teaching staff, catering supervisors and children.
• To assess other influencing factors in the relevant groups such as: - school polices, eg formal nutrition policy, policy on leaving school premises at lunch time; - any existing health initiatives, in particular healthy eating initiatives such as healthy snacks schemes (eg Smart Snacks or Boost Better Breaks), fruit tuck shops, and school nutrition action groups, bans on certain foods and drinks; - existence of, number and type of vending machines, location of mobile or fixed catering facilities close to school; - existence of other food sources within the school, eg breakfast club, tuck shop, and what is available/provided here.
To meet the aims and objectives, a mixed methods approach using quantitative and qualitative methodology was used to gather views from a range of stakeholder and user groups.
Quantitative• Surveys of: - school principals in primary/post-primary schools; - teaching staff in primary/post-primary schools; - chairpersons of boards of governors of primary/post-primary schools; - pupils in primary/post-primary schools; - parents of primary/post-primary school pupils.
Qualitative• Focus groups with catering managers, nutritional standards coordinators, and area
managers and supervisors;• Focus groups and telephone interviews with school based catering staff.
14
Survey recruitment
Principals, teachers and chairs of boards of governors
Principals, teachers and chairs of board of governors were recruited through schools. A random sample of primary schools (N=500), all post-primary schools (N=228) and 11 special schools were invited by letter to take part in the research, encompassing a total of 739 schools. Each school received three questionnaires, one for each of the three stakeholder groups (principals, teachers and chairs of boards of governors). For those who did not initially reply, reminder letters were sent two to four weeks after the initial mail-out to encourage response rates.
Parents and childrenParents and children were recruited through contact with schools. Initially, a sample of 90 schools was selected (45 primary schools and 45 post-primary schools). Samples of primary and post-primary schools were selected proportionately by ELB area (NEELB, SEELB, WELB, BELB, and SELB), school management type (maintained, controlled, voluntary/integrated) and school size. The proportion of pupils in receipt of free school meals (<10%, 10-25%, >25% FSM) was also taken into consideration with the aim of over-sampling schools with >25% FSM entitlement to better explore issues around uptake of free school meals. Matching reserve samples of 45 primary and 45 post-primary schools were also drawn. In the event, due to the poor response from the post-primary sector, all 228 schools in this sector were invited to participate.
Those schools contacted to facilitate the parents and children’s research, were initially invited by letter and followed up with telephone calls. To encourage participation, each participating school was offered vouchers worth £100 for school equipment. In cases where schools declined the invitation to participate, replacement schools were selected from the reserve sample which matched the characteristics of the original schools (ie ELB, school management type, and FSM).
Those schools who agreed to facilitate the parents and children surveys (N=36 primary schools, N=55 post-primary schools) were provided with questionnaire packs which they either mailed directly to parents or sent home via children. In post-primary schools, parents were invited to participate in the survey if their children were in one of the two selected classes across year groups 8 to 12 completing the pupil survey. At primary school level, the parents of children from two year groups drawn from across all primary (P1 to P7) classes were selected to participate. Parents were given the options of mailing their completed questionnaire to the consultant directly or getting their child to return it to the school.
In primary schools, the survey was conducted with P6 and P7 children due to the self report nature of the survey and the higher reading ability of these year groups. Primary schools were asked to select one P6 and one P7 class to take part in this survey. Each school was sent the appropriate number of questionnaires for the selected classes.
Post-primary schools were sent a set of instructions relating to the survey, listing two year groups across Years 8 to 12 to be selected for the purposes of the survey, with schools given the choice of which classes would participate. Most schools requested not to select Year 12 classes due to exams, so only one Year 12 class participated. Each school was provided with 70 questionnaires (35 per class).
15
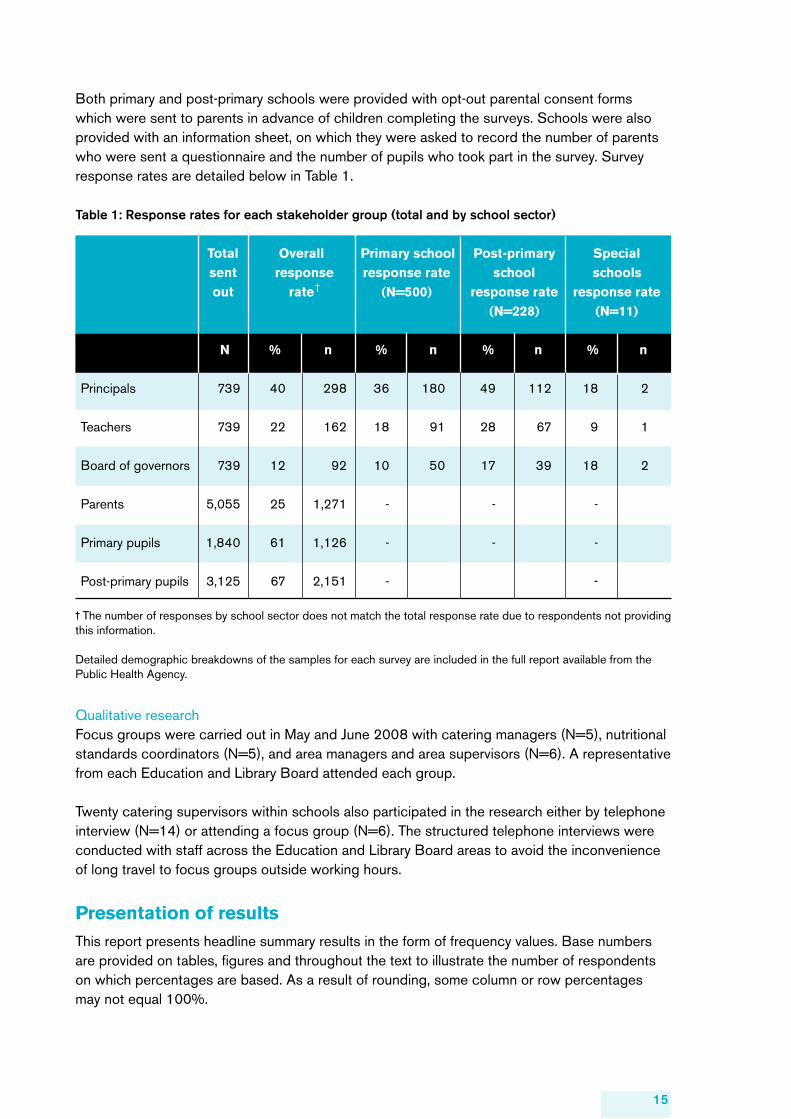
Both primary and post-primary schools were provided with opt-out parental consent forms which were sent to parents in advance of children completing the surveys. Schools were also provided with an information sheet, on which they were asked to record the number of parents who were sent a questionnaire and the number of pupils who took part in the survey. Survey response rates are detailed below in Table 1.
Table 1: Response rates for each stakeholder group (total and by school sector)
Total Overall Primary school Post-primary Special sent response response rate school schools out rate (N=500) response rate response rate (N=228) (N=11)
N % n % n % n % n
Principals 739 40 298 36 180 49 112 18 2
Teachers 739 22 162 18 91 28 67 9 1
Board of governors 739 12 92 10 50 17 39 18 2
Parents 5,055 25 1,271 - - -
Primary pupils 1,840 61 1,126 - - -
Post-primary pupils 3,125 67 2,151 - -
The number of responses by school sector does not match the total response rate due to respondents not providing this information.
Detailed demographic breakdowns of the samples for each survey are included in the full report available from the Public Health Agency.
Qualitative researchFocus groups were carried out in May and June 2008 with catering managers (N=5), nutritional standards coordinators (N=5), and area managers and area supervisors (N=6). A representative from each Education and Library Board attended each group.
Twenty catering supervisors within schools also participated in the research either by telephone interview (N=14) or attending a focus group (N=6). The structured telephone interviews were conducted with staff across the Education and Library Board areas to avoid the inconvenience of long travel to focus groups outside working hours.
Presentation of results This report presents headline summary results in the form of frequency values. Base numbers are provided on tables, figures and throughout the text to illustrate the number of respondents on which percentages are based. As a result of rounding, some column or row percentages may not equal 100%.
16
Response rates varied substantially between questions. In this report, upper case N is used to denote the number of respondents who answered a specific question, for example ‘those children who took school dinners (N=633) were asked…’. In some cases where the number of respondents was small, for individual responses we present the number of respondents as well as or instead of a percentage, and in this case we use lower case n, for example ‘Forty governors replied, and 25% (n=10) agreed that…’.
Where appropriate, statistical analysis was carried out using Chi-square techniques to identify associations between groups. Analysis of variance was used to determine difference in means. Where significant differences are evident between groups these are highlighted throughout this report. Significant differences are only examined within each group of respondents (eg principals, primary pupils) and not between them. Levels of significance are denoted in tables or within the text by asterisks and/or the associated p value – *p≤0.05, **p≤0.01, ***p≤0.001.
In the following sections, the term ‘school based stakeholders’ is used when referring to principals, teachers, and chairs of boards of governors collectively. For brevity, we will refer to the chairs of boards of governors as simply ‘governors’. Similarly, ‘catering management team’ refers to catering managers, nutritional standards coordinators, and area managers/supervisors.
17
Section 1: Healthy eating knowledge, attitudes and behaviour
Current eating habits All or almost all (99–100%) school based stakeholders and parents (99%) surveyed agreed that it is important that children eat healthily (principals N=293, teachers N=161, governors N=92, parents N=1,256). However, nearly nine in ten parents (N=1,249) already considered their children eat healthily, an observation in contradiction to much dietary evidence.8,16 This positive perception of health was also found among pupils with a large proportion of pupils reporting their current eating habits to be quite or very healthy (82% primary, N=1,108, 74% post-primary, N=2,073). Those more likely to describe the food that they normally eat as healthy were found to be:
• in primary school (82%), in contrast to post-primary school (74%); • a post-primary pupil aged under 14 (78%) in comparison to a post-primary pupil, aged 14+
(69%) (p≤0.001);• a girl in either primary (85% girls vs. 79% boys, p≤0.05), or post-primary (75% girls, vs.
71% boys, p≤0.001) school; • attending a grammar rather than a secondary school (70% secondary vs. 79% grammar,
p≤0.001);• attending a larger rather than a smaller post-primary school (<750 pupils, 69%: 750+
pupils, 78%, p≤0.001); • attending primary or post-primary schools with the lower levels of free school meal ratio
(primary: <10% FSM, 81%; 10-25% FSM, 86%; >25% FSM, 75%) and (post-primary: <10% FSM, 78%; 10-25% FSM, 75%; >25% FSM, 65%, p≤0.001).
Despite a large majority of pupils describing their eating habits as quite or very healthy, over two thirds of pupils (68% primary, N=1,108, 80% post-primary, N=2,063) reported they could eat more healthily. The majority of principals (89%, N=294), teachers (86%, N=161) and governors (77%, N=92) shared this view. Although a high proportion of parents (N=1,247) also acknowledged their child could eat more healthily (82%) this view was more commonplace among parents from the lower social classes (ABC1, 84%: C2DE, 89%, p≤0.05). Furthermore, parents tended to report it was more difficult to control what their children ate in school rather than at home.
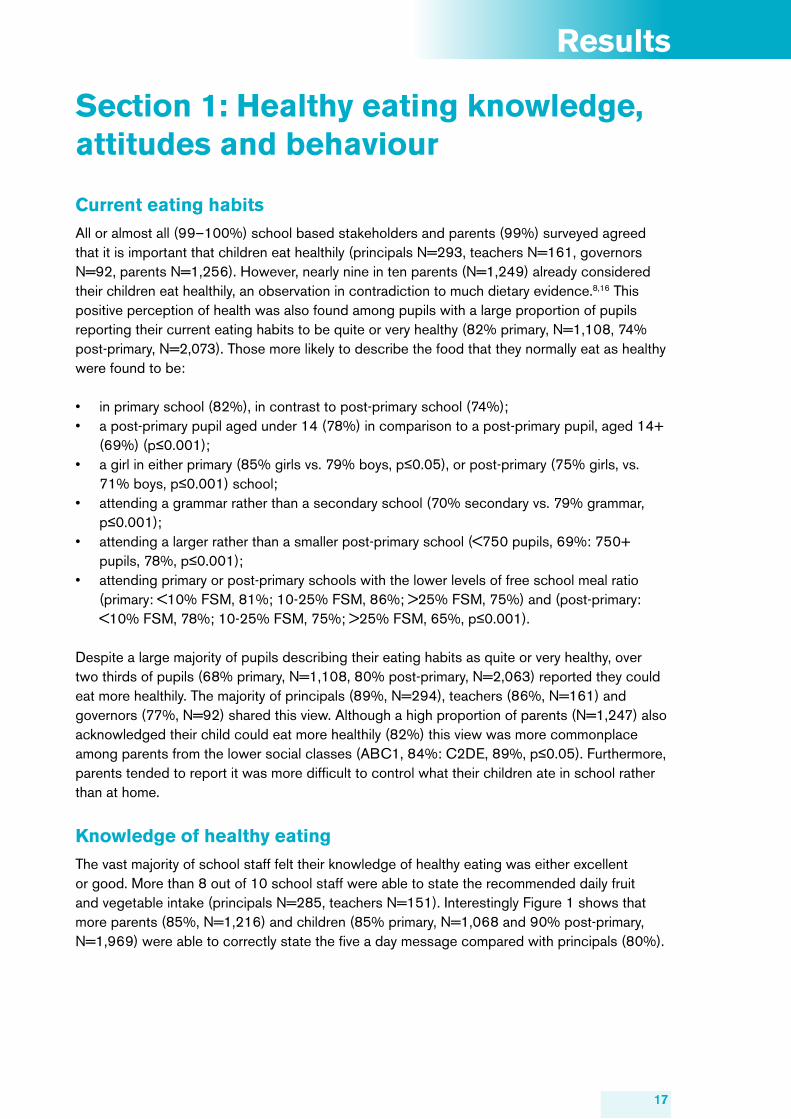
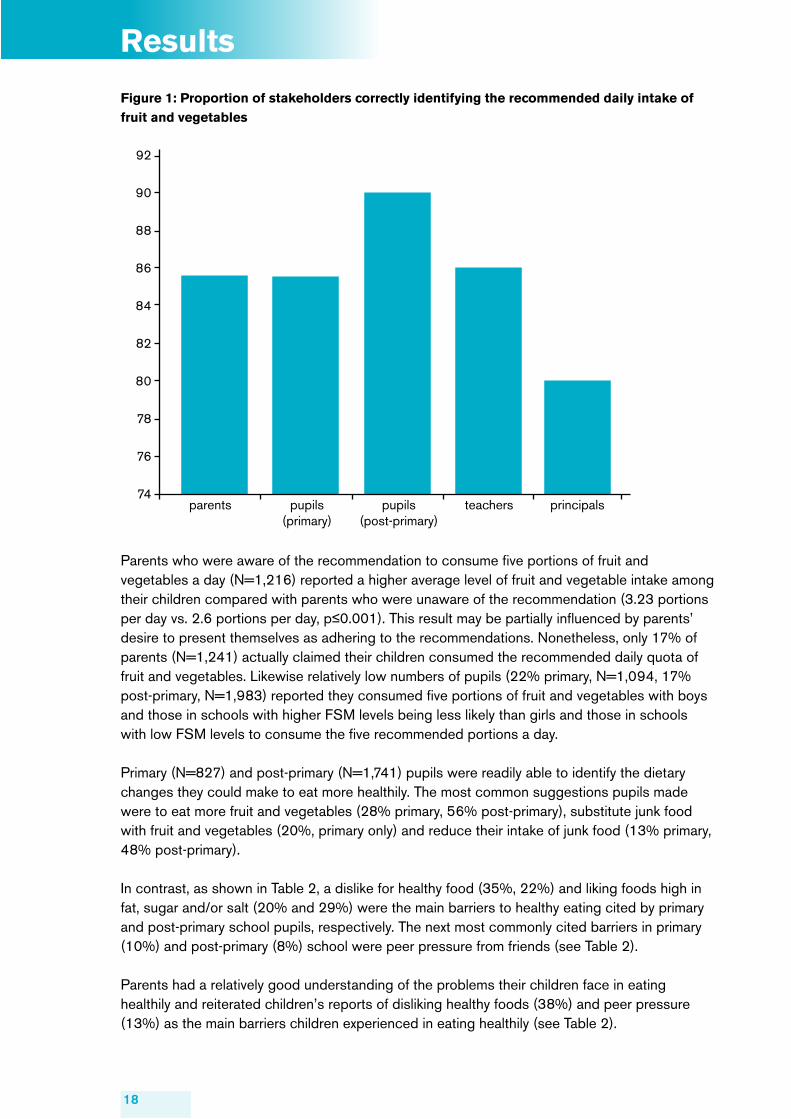
Knowledge of healthy eatingThe vast majority of school staff felt their knowledge of healthy eating was either excellent or good. More than 8 out of 10 school staff were able to state the recommended daily fruit and vegetable intake (principals N=285, teachers N=151). Interestingly Figure 1 shows that more parents (85%, N=1,216) and children (85% primary, N=1,068 and 90% post-primary, N=1,969) were able to correctly state the five a day message compared with principals (80%).
Results
18
Results
Figure 1: Proportion of stakeholders correctly identifying the recommended daily intake of fruit and vegetables
Parents who were aware of the recommendation to consume five portions of fruit and vegetables a day (N=1,216) reported a higher average level of fruit and vegetable intake among their children compared with parents who were unaware of the recommendation (3.23 portions per day vs. 2.6 portions per day, p≤0.001). This result may be partially influenced by parents’ desire to present themselves as adhering to the recommendations. Nonetheless, only 17% of parents (N=1,241) actually claimed their children consumed the recommended daily quota of fruit and vegetables. Likewise relatively low numbers of pupils (22% primary, N=1,094, 17% post-primary, N=1,983) reported they consumed five portions of fruit and vegetables with boys and those in schools with higher FSM levels being less likely than girls and those in schools with low FSM levels to consume the five recommended portions a day.
Primary (N=827) and post-primary (N=1,741) pupils were readily able to identify the dietary changes they could make to eat more healthily. The most common suggestions pupils made were to eat more fruit and vegetables (28% primary, 56% post-primary), substitute junk food with fruit and vegetables (20%, primary only) and reduce their intake of junk food (13% primary, 48% post-primary).
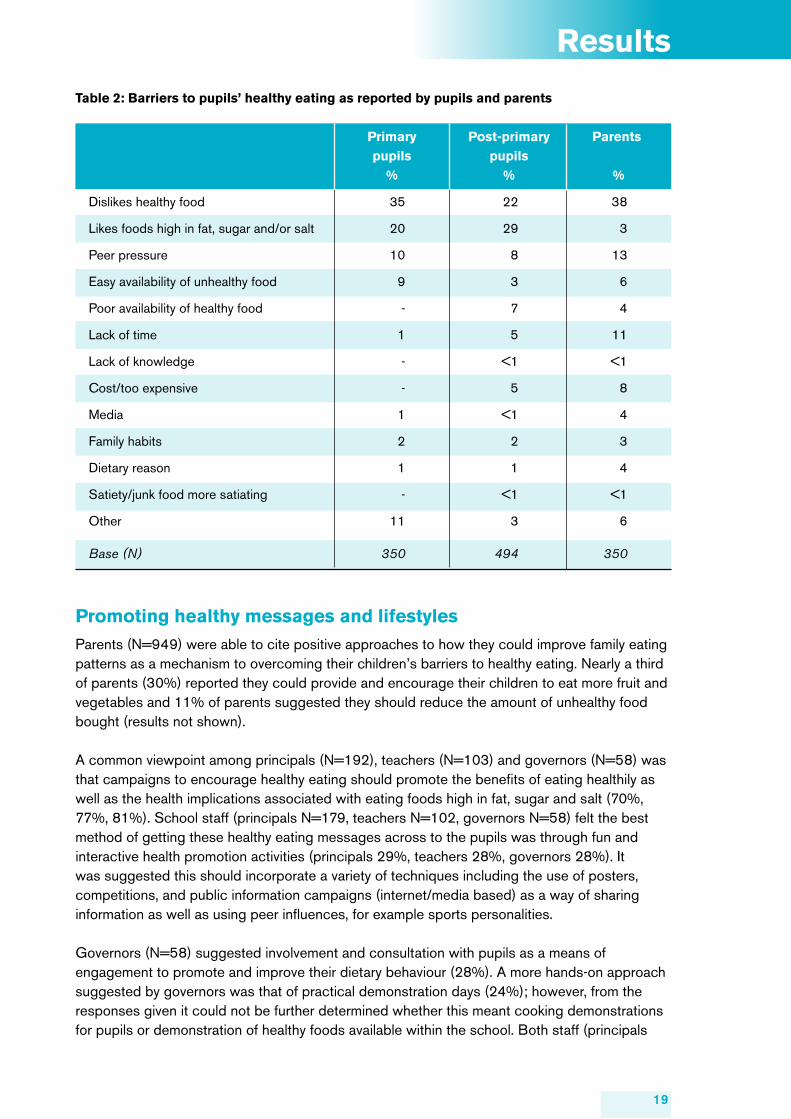
In contrast, as shown in Table 2, a dislike for healthy food (35%, 22%) and liking foods high in fat, sugar and/or salt (20% and 29%) were the main barriers to healthy eating cited by primary and post-primary school pupils, respectively. The next most commonly cited barriers in primary (10%) and post-primary (8%) school were peer pressure from friends (see Table 2).
Parents had a relatively good understanding of the problems their children face in eating healthily and reiterated children’s reports of disliking healthy foods (38%) and peer pressure (13%) as the main barriers children experienced in eating healthily (see Table 2).
92
90
88
86
84
82
80
78
76
74parents pupils
(primary)pupils
(post-primary)teachers principals
19
Results
Table 2: Barriers to pupils’ healthy eating as reported by pupils and parents
Primary Post-primary Parents pupils pupils % % %
Dislikes healthy food 35 22 38
Likes foods high in fat, sugar and/or salt 20 29 3
Peer pressure 10 8 13
Easy availability of unhealthy food 9 3 6
Poor availability of healthy food - 7 4
Lack of time 1 5 11
Lack of knowledge - <1 <1
Cost/too expensive - 5 8
Media 1 <1 4
Family habits 2 2 3
Dietary reason 1 1 4
Satiety/junk food more satiating - <1 <1
Other 11 3 6
Base (N) 350 494 350
Promoting healthy messages and lifestyles Parents (N=949) were able to cite positive approaches to how they could improve family eating patterns as a mechanism to overcoming their children’s barriers to healthy eating. Nearly a third of parents (30%) reported they could provide and encourage their children to eat more fruit and vegetables and 11% of parents suggested they should reduce the amount of unhealthy food bought (results not shown).
A common viewpoint among principals (N=192), teachers (N=103) and governors (N=58) was that campaigns to encourage healthy eating should promote the benefits of eating healthily as well as the health implications associated with eating foods high in fat, sugar and salt (70%, 77%, 81%). School staff (principals N=179, teachers N=102, governors N=58) felt the best method of getting these healthy eating messages across to the pupils was through fun and interactive health promotion activities (principals 29%, teachers 28%, governors 28%). It was suggested this should incorporate a variety of techniques including the use of posters, competitions, and public information campaigns (internet/media based) as a way of sharing information as well as using peer influences, for example sports personalities.
Governors (N=58) suggested involvement and consultation with pupils as a means of engagement to promote and improve their dietary behaviour (28%). A more hands-on approach suggested by governors was that of practical demonstration days (24%); however, from the responses given it could not be further determined whether this meant cooking demonstrations for pupils or demonstration of healthy foods available within the school. Both staff (principals
20
Results
N=179, teachers N=102, governors N=58) and parents (N=1,105) felt that health promotion, in particular healthy eating, needs to be included in the curriculum (14%, 27%, 28%, 13% respectively). However, parents acknowledged that the example they set may be the most effective mechanism to get messages across to children (30%).
When post-primary school pupils (N=1,667) were asked to consider the best way of getting healthy eating messages across to their age group a mixed response was received, with some focusing on how messages should be delivered and others on the message content. Pupils confirmed television advertising/posters would be the best method of informing them of healthy eating messages (31%), with healthy eating days in school also mentioned by a sizeable proportion (13%). In addition pupils identified that demonstrating the impact of eating healthily or unhealthily (18%), or using videos and pictures to illustrate the impact of poor dietary behaviour on health would be motivating (15%). Pupils made particular reference to obesity as an immediate impact of poor dietary behaviour that they could relate to.
21
Results
Section 2: Nutrition policies and standards within the school setting
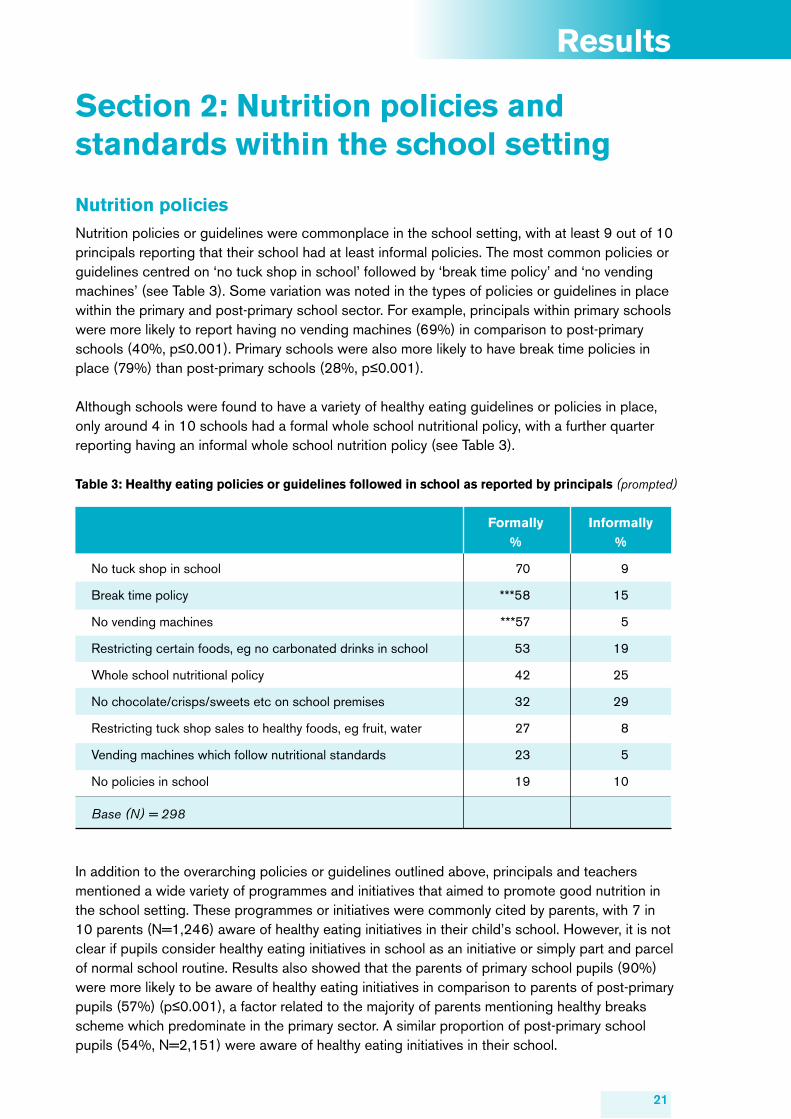
Nutrition policiesNutrition policies or guidelines were commonplace in the school setting, with at least 9 out of 10 principals reporting that their school had at least informal policies. The most common policies or guidelines centred on ‘no tuck shop in school’ followed by ‘break time policy’ and ‘no vending machines’ (see Table 3). Some variation was noted in the types of policies or guidelines in place within the primary and post-primary school sector. For example, principals within primary schools were more likely to report having no vending machines (69%) in comparison to post-primary schools (40%, p≤0.001). Primary schools were also more likely to have break time policies in place (79%) than post-primary schools (28%, p≤0.001).
Although schools were found to have a variety of healthy eating guidelines or policies in place, only around 4 in 10 schools had a formal whole school nutritional policy, with a further quarter reporting having an informal whole school nutrition policy (see Table 3).
Table 3: Healthy eating policies or guidelines followed in school as reported by principals (prompted)
Formally Informally % %
No tuck shop in school 70 9
Break time policy ***58 15
No vending machines ***57 5
Restricting certain foods, eg no carbonated drinks in school 53 19
Whole school nutritional policy 42 25
No chocolate/crisps/sweets etc on school premises 32 29
Restricting tuck shop sales to healthy foods, eg fruit, water 27 8
Vending machines which follow nutritional standards 23 5
No policies in school 19 10
Base (N) = 298
In addition to the overarching policies or guidelines outlined above, principals and teachers mentioned a wide variety of programmes and initiatives that aimed to promote good nutrition in the school setting. These programmes or initiatives were commonly cited by parents, with 7 in 10 parents (N=1,246) aware of healthy eating initiatives in their child’s school. However, it is not clear if pupils consider healthy eating initiatives in school as an initiative or simply part and parcel of normal school routine. Results also showed that the parents of primary school pupils (90%) were more likely to be aware of healthy eating initiatives in comparison to parents of post-primary pupils (57%) (p≤0.001), a factor related to the majority of parents mentioning healthy breaks scheme which predominate in the primary sector. A similar proportion of post-primary school pupils (54%, N=2,151) were aware of healthy eating initiatives in their school.
22
Results
Six in ten parents (N=1,245) were aware that their child’s school restricted certain foods and drinks and over half of parents (59%, N=1,239) were aware of changes in food provision that have taken place in the school. More than half of this latter group of parents (N=696) indicated that these changes had centred on a better variety and choice of healthy foods. Parents who reported being aware of food restrictions and changing nutrition practices in school were more likely to have a higher educational status (p≤0.05).
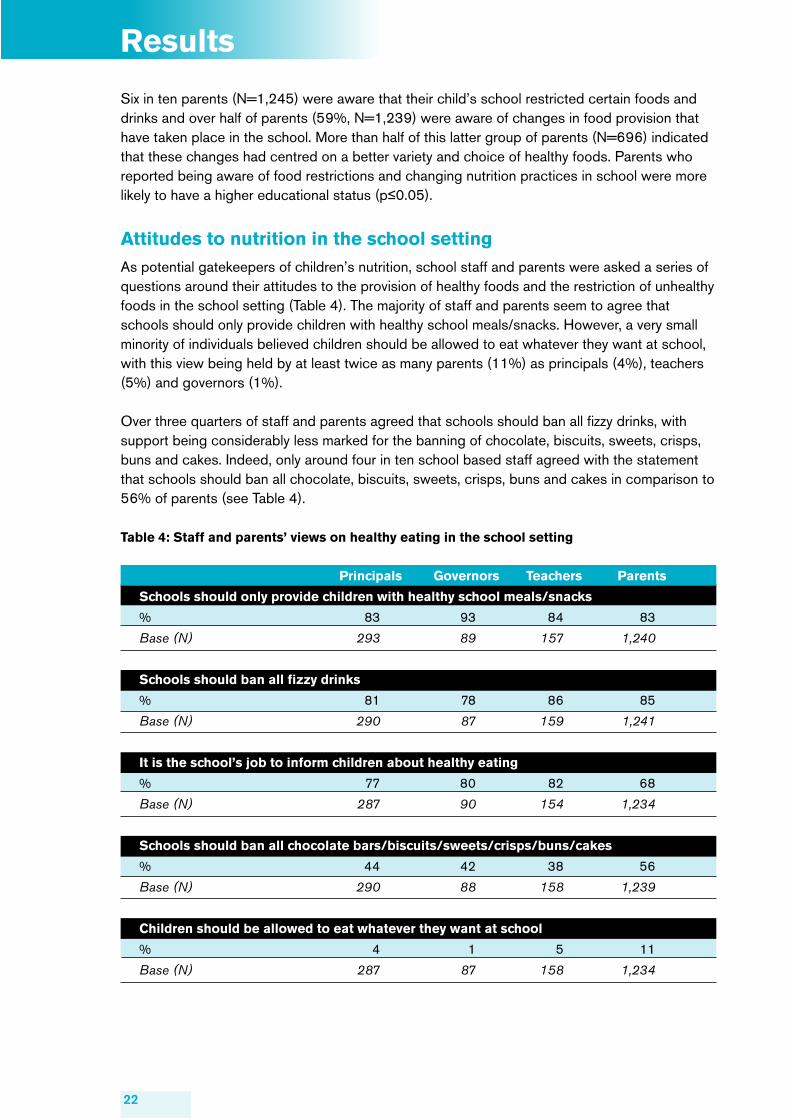
Attitudes to nutrition in the school settingAs potential gatekeepers of children’s nutrition, school staff and parents were asked a series of questions around their attitudes to the provision of healthy foods and the restriction of unhealthy foods in the school setting (Table 4). The majority of staff and parents seem to agree that schools should only provide children with healthy school meals/snacks. However, a very small minority of individuals believed children should be allowed to eat whatever they want at school, with this view being held by at least twice as many parents (11%) as principals (4%), teachers (5%) and governors (1%).
Over three quarters of staff and parents agreed that schools should ban all fizzy drinks, with support being considerably less marked for the banning of chocolate, biscuits, sweets, crisps, buns and cakes. Indeed, only around four in ten school based staff agreed with the statement that schools should ban all chocolate, biscuits, sweets, crisps, buns and cakes in comparison to 56% of parents (see Table 4).
Table 4: Staff and parents’ views on healthy eating in the school setting
Principals Governors Teachers Parents
Schools should only provide children with healthy school meals/snacks
% 83 93 84 83
Base (N) 293 89 157 1,240
Schools should ban all fizzy drinks
% 81 78 86 85
Base (N) 290 87 159 1,241
It is the school’s job to inform children about healthy eating
% 77 80 82 68
Base (N) 287 90 154 1,234
Schools should ban all chocolate bars/biscuits/sweets/crisps/buns/cakes
% 44 42 38 56
Base (N) 290 88 158 1,239
Children should be allowed to eat whatever they want at school
% 4 1 5 11
Base (N) 287 87 158 1,234
23
Results
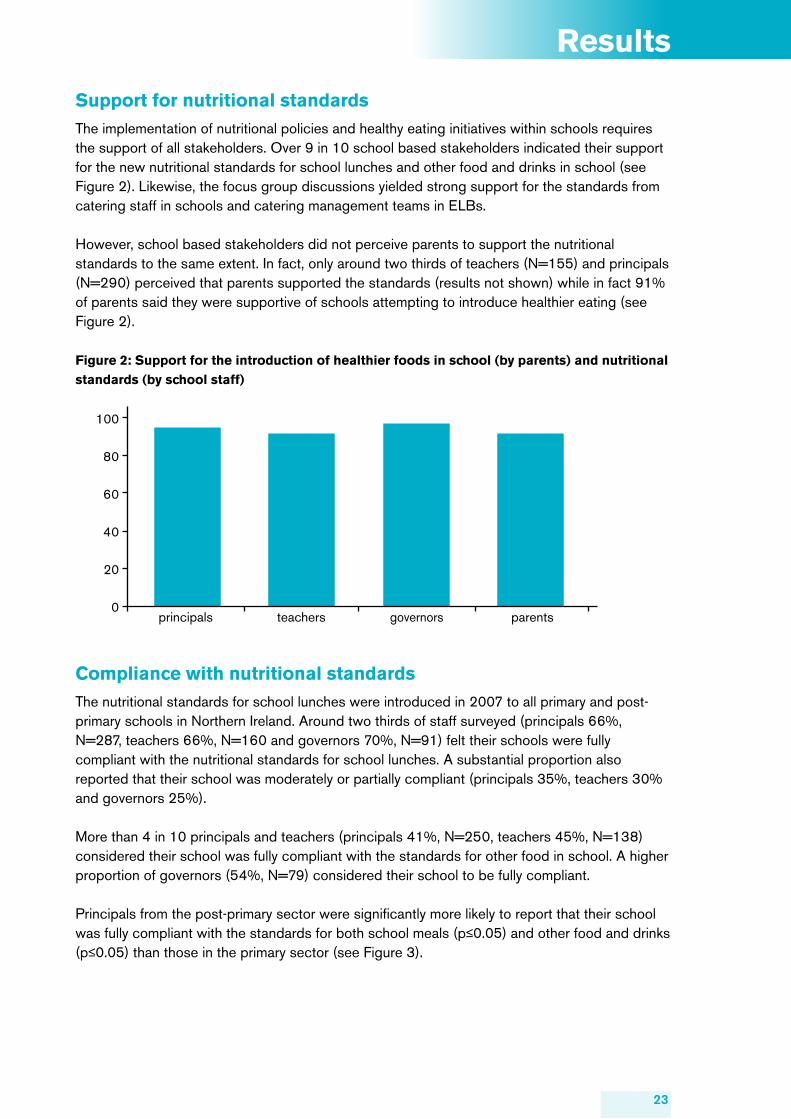
Support for nutritional standards The implementation of nutritional policies and healthy eating initiatives within schools requires the support of all stakeholders. Over 9 in 10 school based stakeholders indicated their support for the new nutritional standards for school lunches and other food and drinks in school (see Figure 2). Likewise, the focus group discussions yielded strong support for the standards from catering staff in schools and catering management teams in ELBs.
However, school based stakeholders did not perceive parents to support the nutritional standards to the same extent. In fact, only around two thirds of teachers (N=155) and principals (N=290) perceived that parents supported the standards (results not shown) while in fact 91% of parents said they were supportive of schools attempting to introduce healthier eating (see Figure 2).
Figure 2: Support for the introduction of healthier foods in school (by parents) and nutritional standards (by school staff)
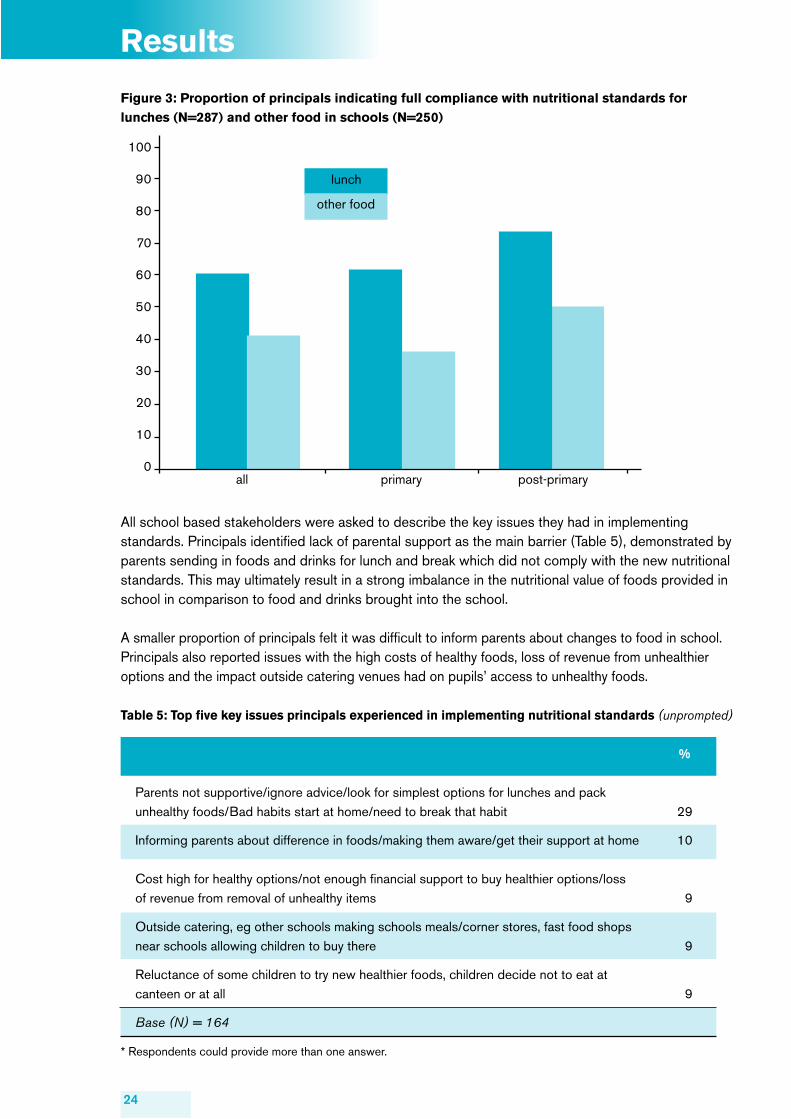
Compliance with nutritional standardsThe nutritional standards for school lunches were introduced in 2007 to all primary and post-primary schools in Northern Ireland. Around two thirds of staff surveyed (principals 66%, N=287, teachers 66%, N=160 and governors 70%, N=91) felt their schools were fully compliant with the nutritional standards for school lunches. A substantial proportion also reported that their school was moderately or partially compliant (principals 35%, teachers 30% and governors 25%).
More than 4 in 10 principals and teachers (principals 41%, N=250, teachers 45%, N=138) considered their school was fully compliant with the standards for other food in school. A higher proportion of governors (54%, N=79) considered their school to be fully compliant.
Principals from the post-primary sector were significantly more likely to report that their school was fully compliant with the standards for both school meals (p≤0.05) and other food and drinks (p≤0.05) than those in the primary sector (see Figure 3).
100
80
60
40
20
0principals teachers governors parents
24
Results
Figure 3: Proportion of principals indicating full compliance with nutritional standards for lunches (N=287) and other food in schools (N=250)
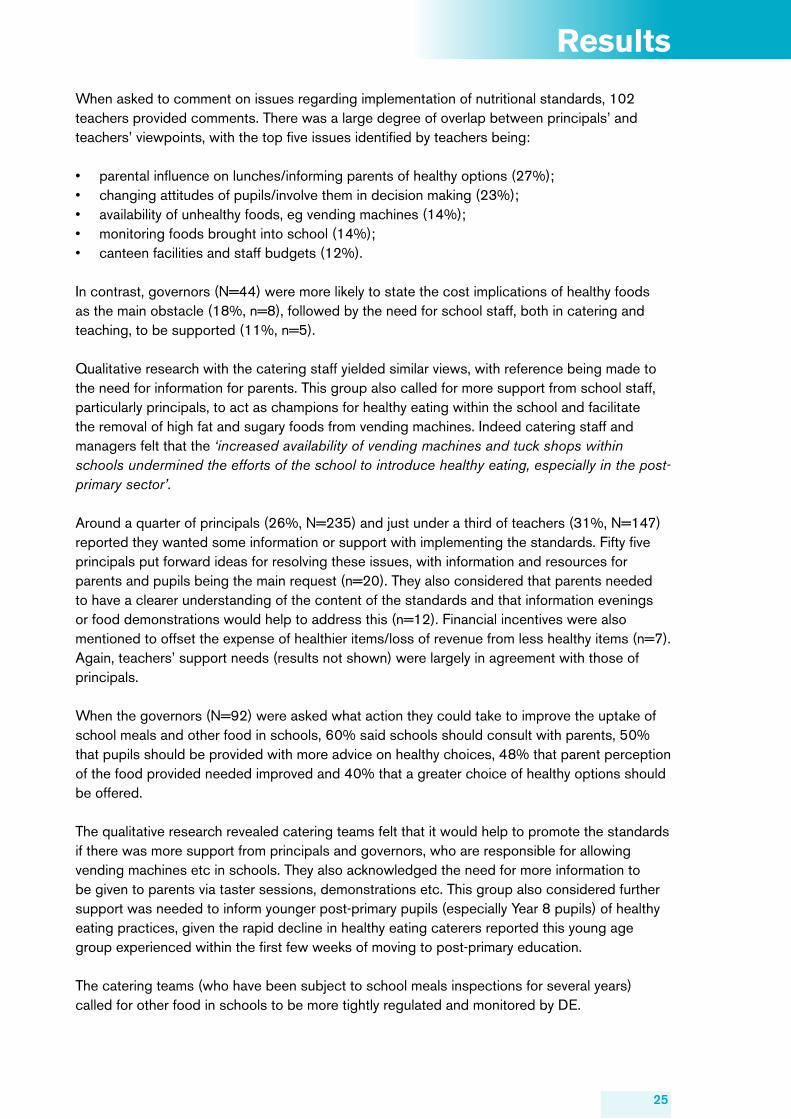
All school based stakeholders were asked to describe the key issues they had in implementing standards. Principals identified lack of parental support as the main barrier (Table 5), demonstrated by parents sending in foods and drinks for lunch and break which did not comply with the new nutritional standards. This may ultimately result in a strong imbalance in the nutritional value of foods provided in school in comparison to food and drinks brought into the school.
A smaller proportion of principals felt it was difficult to inform parents about changes to food in school. Principals also reported issues with the high costs of healthy foods, loss of revenue from unhealthier options and the impact outside catering venues had on pupils’ access to unhealthy foods.
Table 5: Top five key issues principals experienced in implementing nutritional standards (unprompted)
%
Parents not supportive/ignore advice/look for simplest options for lunches and pack unhealthy foods/Bad habits start at home/need to break that habit 29
Informing parents about difference in foods/making them aware/get their support at home 10
Cost high for healthy options/not enough financial support to buy healthier options/loss of revenue from removal of unhealthy items 9
Outside catering, eg other schools making schools meals/corner stores, fast food shops near schools allowing children to buy there 9
Reluctance of some children to try new healthier foods, children decide not to eat at canteen or at all 9
Base (N) = 164
* Respondents could provide more than one answer.
100
90
80
70
60
50
40
30
20
10
0all primary post-primary
other food
lunch
25
Results
When asked to comment on issues regarding implementation of nutritional standards, 102 teachers provided comments. There was a large degree of overlap between principals’ and teachers’ viewpoints, with the top five issues identified by teachers being:
• parental influence on lunches/informing parents of healthy options (27%);• changing attitudes of pupils/involve them in decision making (23%);• availability of unhealthy foods, eg vending machines (14%);• monitoring foods brought into school (14%);• canteen facilities and staff budgets (12%).
In contrast, governors (N=44) were more likely to state the cost implications of healthy foods as the main obstacle (18%, n=8), followed by the need for school staff, both in catering and teaching, to be supported (11%, n=5).
Qualitative research with the catering staff yielded similar views, with reference being made to the need for information for parents. This group also called for more support from school staff, particularly principals, to act as champions for healthy eating within the school and facilitate the removal of high fat and sugary foods from vending machines. Indeed catering staff and managers felt that the ‘increased availability of vending machines and tuck shops within schools undermined the efforts of the school to introduce healthy eating, especially in the post-primary sector’.
Around a quarter of principals (26%, N=235) and just under a third of teachers (31%, N=147) reported they wanted some information or support with implementing the standards. Fifty five principals put forward ideas for resolving these issues, with information and resources for parents and pupils being the main request (n=20). They also considered that parents needed to have a clearer understanding of the content of the standards and that information evenings or food demonstrations would help to address this (n=12). Financial incentives were also mentioned to offset the expense of healthier items/loss of revenue from less healthy items (n=7). Again, teachers’ support needs (results not shown) were largely in agreement with those of principals.
When the governors (N=92) were asked what action they could take to improve the uptake of school meals and other food in schools, 60% said schools should consult with parents, 50% that pupils should be provided with more advice on healthy choices, 48% that parent perception of the food provided needed improved and 40% that a greater choice of healthy options should be offered.
The qualitative research revealed catering teams felt that it would help to promote the standards if there was more support from principals and governors, who are responsible for allowing vending machines etc in schools. They also acknowledged the need for more information to be given to parents via taster sessions, demonstrations etc. This group also considered further support was needed to inform younger post-primary pupils (especially Year 8 pupils) of healthy eating practices, given the rapid decline in healthy eating caterers reported this young age group experienced within the first few weeks of moving to post-primary education.
The catering teams (who have been subject to school meals inspections for several years) called for other food in schools to be more tightly regulated and monitored by DE.
26
Results
Section 3: Nutritional standards for school lunches
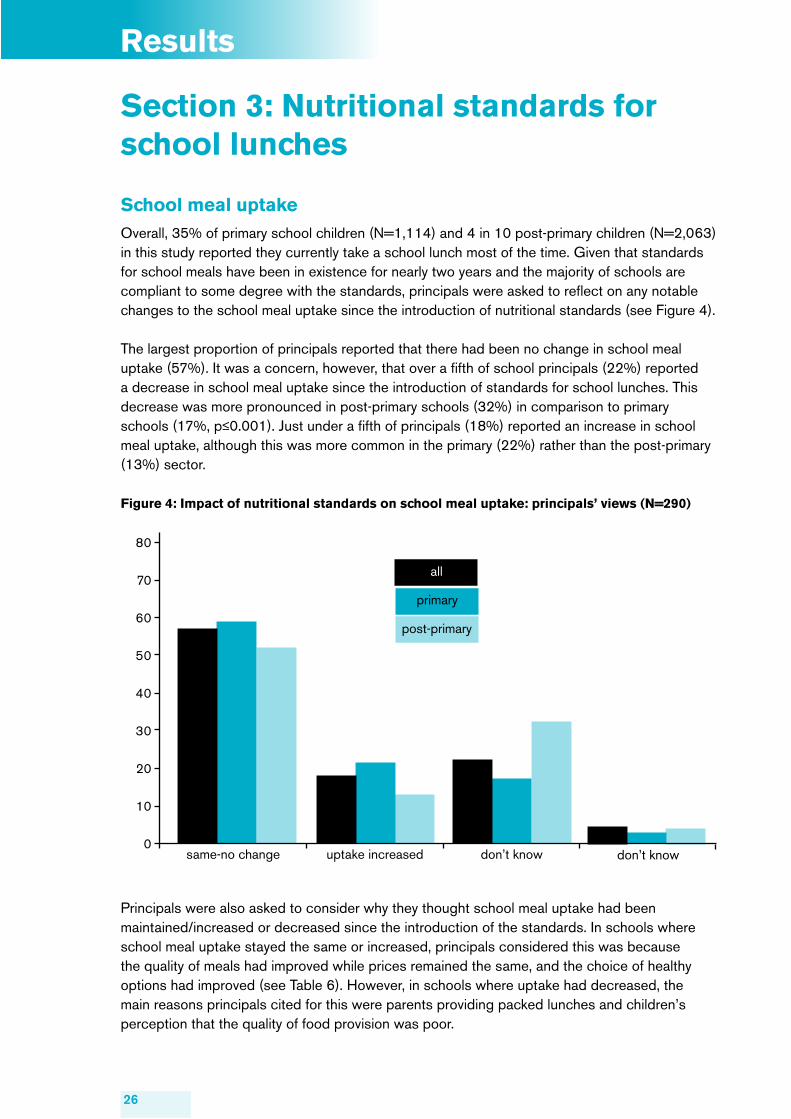
School meal uptakeOverall, 35% of primary school children (N=1,114) and 4 in 10 post-primary children (N=2,063) in this study reported they currently take a school lunch most of the time. Given that standards for school meals have been in existence for nearly two years and the majority of schools are compliant to some degree with the standards, principals were asked to reflect on any notable changes to the school meal uptake since the introduction of nutritional standards (see Figure 4).
The largest proportion of principals reported that there had been no change in school meal uptake (57%). It was a concern, however, that over a fifth of school principals (22%) reported a decrease in school meal uptake since the introduction of standards for school lunches. This decrease was more pronounced in post-primary schools (32%) in comparison to primary schools (17%, p≤0.001). Just under a fifth of principals (18%) reported an increase in school meal uptake, although this was more common in the primary (22%) rather than the post-primary (13%) sector.
Figure 4: Impact of nutritional standards on school meal uptake: principals’ views (N=290)
Principals were also asked to consider why they thought school meal uptake had been maintained/increased or decreased since the introduction of the standards. In schools where school meal uptake stayed the same or increased, principals considered this was because the quality of meals had improved while prices remained the same, and the choice of healthy options had improved (see Table 6). However, in schools where uptake had decreased, the main reasons principals cited for this were parents providing packed lunches and children’s perception that the quality of food provision was poor.
post-primary
primary
all
80
70
60
50
40
30
20
10
0same-no change uptake increased don’t know don’t know
27
Results
Table 6: Top five key reasons principals provided for the increase/maintenance or decrease in school meal uptake (prompted)
Key reasons for increase/maintenance % Key reasons for decrease %
Improved meal quality offset by prices being held constant 44 Parents providing packed lunches 60
Provision of more healthy options 44 Pupils’ perception of poor quality provision 51
No change in price of school meals 27 More ‘healthy’ options resulting in pupils bringing in packed lunches 49
Better trained staff 19 Increase in prices due to inflation (wages etc) 33
Media coverage of school meals 17 Pupil numbers stayed same, but pupils purchasing meals less frequently than last year 33
Base (N) = 216 Base (N) = 63
Principals who indicated that their school lunch service is fully compliant with the new nutritional standards were more likely to report an increase in uptake of school meals (22% vs. 12%, p≤0.05) compared with those who indicated that their school is either moderately or partially compliant. While 23% of fully compliant schools reported a decrease in uptake, slightly fewer (18%) moderately/partially compliant schools shared this experience.
The school meal experienceThe uptake of school meals is dependent on a variety of factors which collectively make up the meal experience. For this study, the following factors were considered, adapted from those used in research elsewhere. • The physical dining environment: space, furniture, plates/cutlery, ambience.• Lunch time management: time available, lunch time activities, queuing, ability to go off site.• Food/presentation: menu marketing, choice available, food presentation.• Relations between all staff and pupils: supervision, stigma, behaviour management, pupils’
sense of ownership of dining space, advice to pupils.• Education.17
The majority of principals (89%, N=252), teachers (83%, N=157), governors (87%, N=92), and indeed all of the catering staff and managers involved in the qualitative research, agreed that you can influence school meal uptake by improving the meal experience. Principals in post-primary schools (97%) were more likely to agree than those in primary schools (89%). This is supported by the fact that post-primary schools were substantially more likely to have reviewed the meal experience than primary schools (as reported by teachers, 63% vs. 49%, p≤0.05).
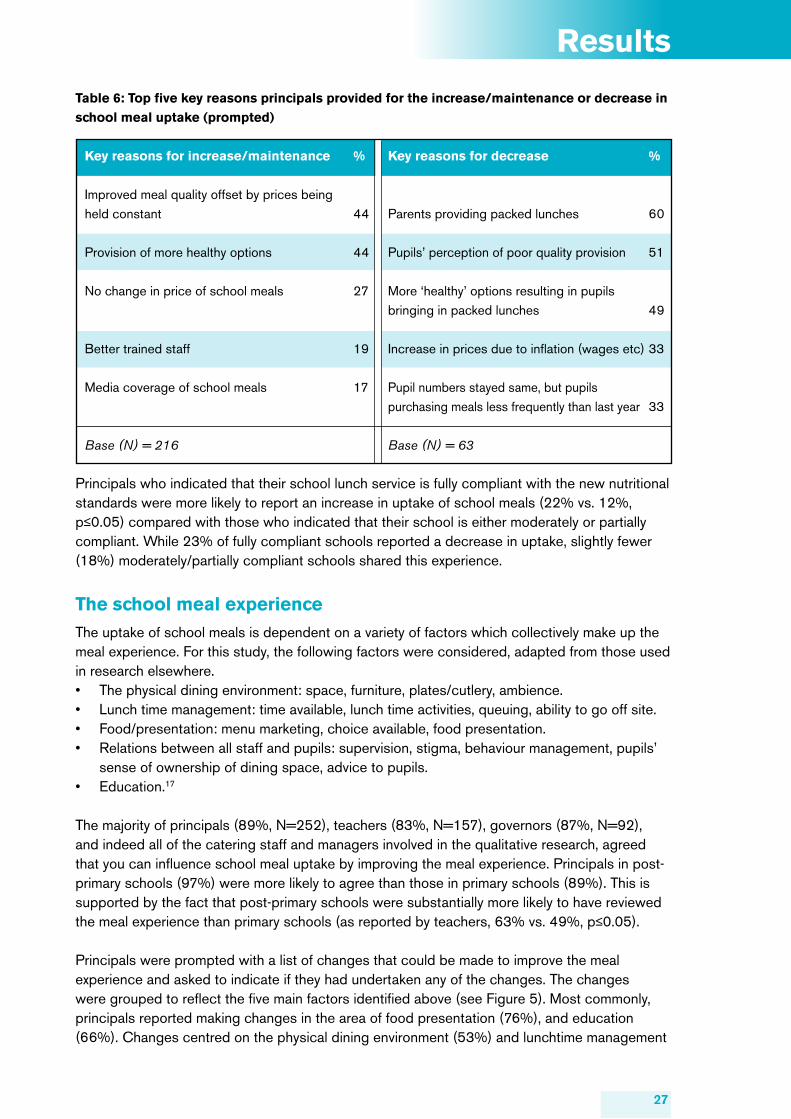
Principals were prompted with a list of changes that could be made to improve the meal experience and asked to indicate if they had undertaken any of the changes. The changes were grouped to reflect the five main factors identified above (see Figure 5). Most commonly, principals reported making changes in the area of food presentation (76%), and education (66%). Changes centred on the physical dining environment (53%) and lunchtime management
28
Results
procedures (46%) were the least likely to have been implemented, possibly because they presented more practical and financial challenges.
Figure 5: Changes to the school meal experience as reported by principals (N=298)
Within each of the five categories, the top two/three individual changes carried out are illustrated below in Table 7. It is interesting to note that while the majority of schools had stated previously that they had reviewed the meal experience, only 30% of principals reported consulting with pupils on the menu. Table 7: Specific changes to the school meal experience as reported by principals %
Increased choice of food 55
Change in menu promotion 52
Consultation with pupils on menu 30
Introduction of other activities to increase learning about healthy food 58
Introduction of other activities to promote healthier eating 57
Introduction of dining room rules 41
Training of supervision staff on behaviour management 24
Introduction of teachers eating with pupils 21
Changes in furnishings (cutlery, plates, tables, chairs etc) 30
Change in design of dining area 23
Change in queuing procedure/management 28
Introduction of staggering 24
Change in time allocated for eating/playing during lunchtime 18
Change in paying procedures 17
Base (N) 298
80
70
60
50
40
30
20
10
0food
presentationeducation relations
between staff and pupils
physical dining experience
lunch management
Food presentation choice/labelling
Nutrition education
Relationship between staff (of all types) and children
Physical dining environment
Lunchtime management
29
Results
Teachers (N=162) were also provided with a list of changes that have occurred in relation to pupils’ meal experience. The top answers were as follows:• 62% of teachers said they now provide more advice and links to the curriculum for pupils
regarding healthy choices.• 57% specifically stated that food quality had been improved.• 51% stated that there has been a greater choice of healthy options.• 47% stated there had been changes in terms of promotion of school meals and other food
in schools.• Around 30% of teachers also indicated that work had been done to try to improve parents’
and pupils’ perceptions of school meals.
To ensure that standards for school meals impact on the nutrition of as many pupils as possible, it is vital to ensure school meal uptake is maintained or increased within schools. To address this key issue, it is important to understand why pupils choose to have a school meal or packed lunch, what the main areas of dissatisfaction are with the school lunch and what users feel would improve their experience of the school meal and, hence, improve uptake.
Staff, pupils’ and parents’ opinions of school meals Pupils were asked to specify, from a range of options, why they choose to have either a school meal or packed lunch. Primary and post-primary pupils based this decision primarily on whether they liked the food (see Table 8).
Choice (24%), followed by parents insisting on it (18%) were the next most popular reasons primary school pupils choose to have a school lunch, whereas post-primary pupils stated their friends eating a school lunch (31%), and having a good choice of food were the main reasons (22%) for having a school lunch.
However, a cause for concern was that those who took packed lunch were significantly more likely than those taking school lunches to say this option gave more choice (47%, primary only, p≤0.001), was healthier (22%, primary and 35%, post-primary p≤0.001), was better value for money (33% post-primary only, p≤0.001) and quicker (41%, post-primary only, p≤0.001).
Table 8: Pupils’ reasons for preferred lunch option
Primary Post-primary
School meal Packed lunch School meal Packed lunch
Like it 58 57 58 49
Good choice 24 ***47 22 29
Friends eat meals 15 24 31 23
Healthier choice 14 ***22 14 ***35
Better value for money - - 8 ***33
Parent insists on it 18 10 5 11
Quicker - - 24 ***41
Base (N) 388 726 821 843
30
Results
Parents who reported that their child took school meals (N=534) were largely in agreement with pupils’ reasons for taking school meals (results not shown). The majority of parents reported that their child takes a school meal most of the time as they like it (60%), followed by good choice (37%) and their friends eating school meals (34%).
Parents whose children did not take a school lunch (N=714) were asked to provide details of why their child does not take school meals most of the time. The majority of parents (67%) reported this was because they wanted to know that their child was getting the type of food that they would eat (results not shown).
Other factors included expense (40%), their child not liking the meals provided (27%), and the view that packed lunches provided healthier food than school lunches (17%). There were no particular variations between the views of parents of primary and post-primary pupils. Parents’ views seemed to confirm some of the reasons given by pupils for not taking school meals.
A high proportion of parents (86%) reported that they were ‘very’ or ‘somewhat’ aware of the types of food provided for school meals in their child’s school. Parents who reported being very aware of the types of food in school meals were more likely to have a higher educational status (p≤0.05) and have children in primary school (p≤0.01).
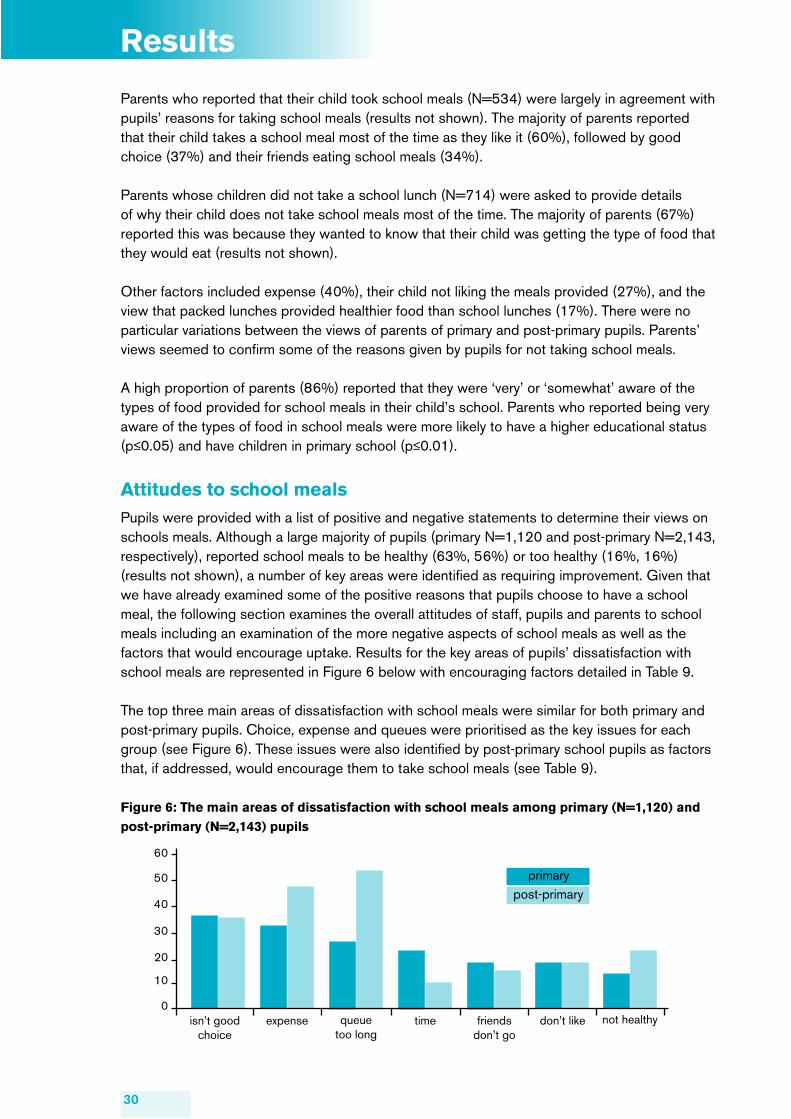
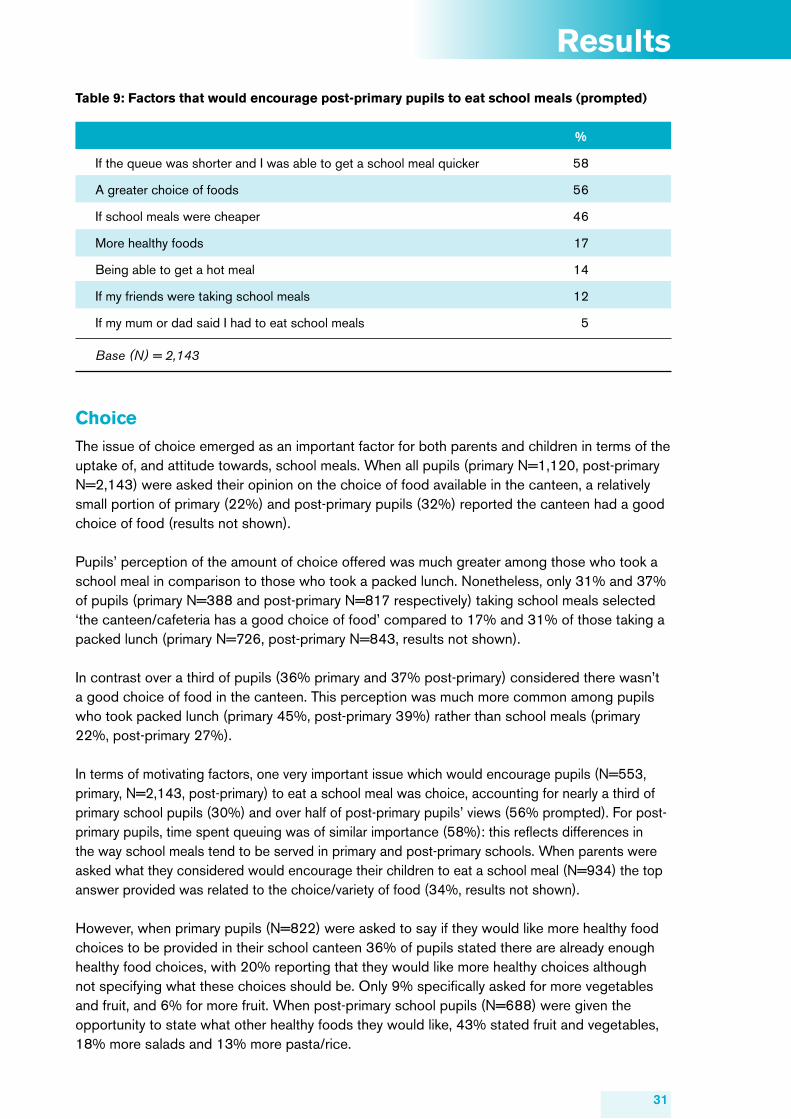
Attitudes to school mealsPupils were provided with a list of positive and negative statements to determine their views on schools meals. Although a large majority of pupils (primary N=1,120 and post-primary N=2,143, respectively), reported school meals to be healthy (63%, 56%) or too healthy (16%, 16%) (results not shown), a number of key areas were identified as requiring improvement. Given that we have already examined some of the positive reasons that pupils choose to have a school meal, the following section examines the overall attitudes of staff, pupils and parents to school meals including an examination of the more negative aspects of school meals as well as the factors that would encourage uptake. Results for the key areas of pupils’ dissatisfaction with school meals are represented in Figure 6 below with encouraging factors detailed in Table 9.
The top three main areas of dissatisfaction with school meals were similar for both primary and post-primary pupils. Choice, expense and queues were prioritised as the key issues for each group (see Figure 6). These issues were also identified by post-primary school pupils as factors that, if addressed, would encourage them to take school meals (see Table 9).
Figure 6: The main areas of dissatisfaction with school meals among primary (N=1,120) and post-primary (N=2,143) pupils
post-primaryprimary
60
isn’t good choice
50
40
30
20
10
0expense queue
too longtime friends
don’t godon’t like not healthy
31
Results
Table 9: Factors that would encourage post-primary pupils to eat school meals (prompted)
%
If the queue was shorter and I was able to get a school meal quicker 58
A greater choice of foods 56
If school meals were cheaper 46
More healthy foods 17
Being able to get a hot meal 14
If my friends were taking school meals 12
If my mum or dad said I had to eat school meals 5
Base (N) = 2,143
ChoiceThe issue of choice emerged as an important factor for both parents and children in terms of the uptake of, and attitude towards, school meals. When all pupils (primary N=1,120, post-primary N=2,143) were asked their opinion on the choice of food available in the canteen, a relatively small portion of primary (22%) and post-primary pupils (32%) reported the canteen had a good choice of food (results not shown).
Pupils’ perception of the amount of choice offered was much greater among those who took a school meal in comparison to those who took a packed lunch. Nonetheless, only 31% and 37% of pupils (primary N=388 and post-primary N=817 respectively) taking school meals selected ‘the canteen/cafeteria has a good choice of food’ compared to 17% and 31% of those taking a packed lunch (primary N=726, post-primary N=843, results not shown).
In contrast over a third of pupils (36% primary and 37% post-primary) considered there wasn’t a good choice of food in the canteen. This perception was much more common among pupils who took packed lunch (primary 45%, post-primary 39%) rather than school meals (primary 22%, post-primary 27%).
In terms of motivating factors, one very important issue which would encourage pupils (N=553, primary, N=2,143, post-primary) to eat a school meal was choice, accounting for nearly a third of primary school pupils (30%) and over half of post-primary pupils’ views (56% prompted). For post-primary pupils, time spent queuing was of similar importance (58%): this reflects differences in the way school meals tend to be served in primary and post-primary schools. When parents were asked what they considered would encourage their children to eat a school meal (N=934) the top answer provided was related to the choice/variety of food (34%, results not shown).
However, when primary pupils (N=822) were asked to say if they would like more healthy food choices to be provided in their school canteen 36% of pupils stated there are already enough healthy food choices, with 20% reporting that they would like more healthy choices although not specifying what these choices should be. Only 9% specifically asked for more vegetables and fruit, and 6% for more fruit. When post-primary school pupils (N=688) were given the opportunity to state what other healthy foods they would like, 43% stated fruit and vegetables, 18% more salads and 13% more pasta/rice.
32
Results
Cost and value for moneyIn the majority of schools principals (79%, N=284) and teachers (69%, N=156) indicated school meals were sold at a fixed daily price, a feature more common in primary schools compared with post-primary schools (as reported by both principals and teachers) (results not shown).
The research showed the average price of a school meal to be around £2.00, ranging from £1.80 to £2.20 according to catering managers, while principals reported a range of £1.00–£2.70 for food available at lunch time (prices quoted are for the school year 2007/08). The diversity of this range is most likely associated with the provision of a range of different types of meals options from snack lunches to regular school meals.
Between a quarter and just over a third of school based stakeholders were of the opinion that the cost of school meals was too high (principals N=288, teachers N=157, governors N=92). However, nearly 40% of parents (N=973) reported that school meals were too expensive. Qualitative research with catering supervisors also suggested parents may find the cost of school meals high compared with the alternatives, given that fast food options can be found for as little as £1.00.
Only approximately 1 in 10 parents (N=934) said that cheaper costs or better value for money would encourage their child to eat school meals. However, improvements in cost were regarded as an encouragement to eat school meals among post-primary pupils (46%, N=2,143), a finding of importance given the freedom of choice often exerted by this age group. (Post-primary pupils but not primary pupils or parents were prompted regarding cost.)
Catering managers highlighted that the school meal represents good value for money, especially in terms of the nutritional value it provides. However, nutritional standards coordinators and catering supervisors stressed that some families with more than one child may find the cost of a full week’s school meals unaffordable, thus reducing uptake. In general, catering managers reported that parents were not likely to tolerate further increases beyond inflation. In support of this, when governors were asked what actions they could take to improve the uptake of school meals, improving prices was cited by 49% or 37 individuals as the third most popular option.
Queues Around 6 in 10 principals (62%, N=288) and teachers (58%, N=155) reported that the queuing time to get a meal in their schools was ‘about right’. In contrast, over a third of principals (35%) and around 4 in 10 (39%) teachers said that the queue ‘is too long’. This viewpoint was more prevalent in post-primary schools than in primary schools (principals; 45% vs 29% p≤0.05, teachers; 52% vs 28% p≤0.05).
Staff’s views on queues were confirmed by pupils (N=1,095, primary, N=1,687, post-primary) with 32% of primary school pupils saying there were a lot of people in front of them in contrast to 74% of post-primary pupils. Indeed, area mangers/supervisors taking part in the qualitative research raised the point that long queues were a regular feature of dining halls.
Catering supervisors suggested that having two lunch sittings would be beneficial as much of pupils’ lunch time was spent queuing. Indeed almost a quarter of parents (23%, N=1,235) and 15% of principals (N=292) said that their child/the children at their school do not have enough time to eat during school lunchtime. This view was reiterated by pupils with almost one in ten
33
Results
primary school pupils (N=1,104) and 14% of post-primary pupils (N=2,122) saying they ‘usually don’t have time’, and 40% of primary pupils and 30% of post-primary said they ‘sometimes don’t have enough time’.
The dining environmentJust over half of principals (N=289) and two thirds of teachers (N=157) and governors (N=80) felt that the practical aspects of their canteen/dining hall (eg décor, space, etc) were sufficient for providing school meals. However, catering supervisors cited instances where the physical dining environment was inadequately sized and, for example, ‘only able to accommodate one third of the total population of the school’. This physical space issue was also mentioned by pupils with about a quarter of primary pupils (N=1,120) and half of post-primary pupils (N=2,143) agreeing that the canteen is too crowded and 32% of post-primary pupils (N=1,580) and 14% of primary school pupils (N=871) stating that increased seating/increased space would be welcomed (results not shown).
Three quarters of primary school pupils (N=897) said that they like eating their school meals or packed lunches in the school dining hall or canteen with this figure being slightly lower for post-primary school pupils (64%, N=1,846). However, area managers/supervisors said that the dining environments were, in the majority, unappealing and suggested improvements such as soft seating areas. In agreement with this, nutritional standards coordinators felt that an environment which is ‘not institutionalised would be preferable to children and would help to improve the uptake of school meals’.
Addressing the needs of FSM pupilsAccording to DE approximately 18% of primary school pupils and 17% of post-primary pupils are entitled to free school meals (FSM).18 Yet, only around 80% of these pupils take up their entitlement.18 Area managers suggested that some parents may not know their children are entitled to free school meals and recommended that this issue be addressed to increase the numbers of pupils taking FSM.
Schools used a variety of systems to identify which pupils were entitled to FSM; however these mechanisms varied substantially with school sector. Primary school teachers were aware who the FSM pupils were, whereas at post-primary level different coloured tickets were issued to reflect a pupil’s FSM entitlement.
When pupils were asked why they considered those entitled to a FSM did not take up this entitlement, the reasons offered were no different to those addressed earlier regarding the uptake of school meals in general. For primary (N=1,121) and post-primary school (N=2,138) pupils, the most common reasons given for some pupils not taking their free school meal were:• ‘not liking the quality or choice of food’(44%, primary, 56% post-primary), • ‘they don’t like queuing’ (18% primary, 46% post-primary), • ‘the canteen is too crowded’ (14% primary, 39% post-primary) and • ‘they don’t like using the canteen’ (13% primary, 24% post-primary).
In contrast to these findings, teachers (N=98) considered the key reasons for the low uptake of free school meals to be stigma (33%) and that pupils who are entitled to a free school meal do not take them due to embarrassment.
34
Results
Indeed, one third of teachers (N=157), and four in ten principals (N=284) and governors (N=90) felt parents attach stigma to free school meals, with those in post-primary schools significantly more likely to say this than their counterparts in primary schools. This was confirmed with just under half of all parents (N=1,211) believing that there is stigma attached to getting free school meals. Those parents with children entitled to free school meals were more likely to feel that there is stigma attached to free school meals than other parents (51% vs 44%, p≤0.05).
School based stakeholders were likely to feel pupils attached stigma to FSM entitlement; a view shared by 28% of principals, 35% of teachers and 30% of governors. However, relatively few pupils identified stigma as a reason for poor FSM uptake. In fact among post-primary pupils (N=2,138), those entitled to FSM were less likely to cite bullying and being teased as reasons why some pupils do not take their free school meals compared to those not entitled (16% compared to 23% p≤0.001). In addition those post-primary pupils entitled to FSM were also less likely to cite embarrassment as a factor in comparison to those not entitled to FSM (21% compared to 28% p≤0.001) indicating that parents and staff may overestimate the stigma children feel towards FSMs.
35
Results
Section 4: Nutritional standards for other food and drinks in schools In addition to the nutritional standards for school lunches, there are also published standards which DE expects to be applied to all other foods and drinks served or available to purchase within the school. Therefore, as well as asking about school meals, the quantitative and qualitative research also enquired about the food consumed outside of the school meal, for example at breakfast or after school clubs, and at break time. This may be food that is purchased in or provided by the school (and hence covered by the standards) or food that is brought from home or purchased by children outside school either before or during school hours. This section therefore details the types of food and drink available from breakfast clubs, after school clubs, vending machines, tuck shops, and food either provided or brought in at break time. The research also examined the access children had to food outlets outside the school premises.
BreakfastThree quarters of primary school pupils (N =1,125) reported having breakfast every school day, in comparison to just over half of post-primary school pupils (56%) (N =2,138). However, almost one fifth of post-primary pupils reported never eating breakfast on school days.
One way of addressing children not eating breakfast is through the provision of breakfast clubs at school. However, principals indicated (N=298) only 30% of primary schools and 50% of post-primary schools provided breakfast clubs, with clubs more likely to be provided in schools with a FSM ratio higher than 25% (p≤0.001). Despite this provision, attendance at breakfast clubs was relatively low, with 19% of primary school pupils (N=1,125), and only 7% of post-primary pupils (N=2,113) reporting that they attend breakfast clubs on most or some days of the week.
Parents reported (N=107) that the food consumed at breakfast clubs was equally likely to be provided by parents (49%) as the school (44%). However, the food consumed at breakfast clubs (as indicated by pupils’ reports, see Table 14, appendix) was largely compliant with the standards. The most commonly consumed foods were bread, toast, pancakes, cereal or porridge and fruit, and the most commonly consumed drinks were pure fruit juice (51%), milk (28%), and water (26%).
In terms of non-compliant foods, 18% of primary and 12% of post-primary pupils who attend a breakfast club reported that they drink fruit squash there, almost 10% of post-primary pupils reported drinking fizzy drinks and almost one in ten primary and post-primary pupils ate cereal bars (9%, 8%). Although it cannot be determined if the foods pupils reported eating were provided by the school or by parents, evidence from parents suggested that a number of schools are providing drinks (more so than foods) which do not comply with the standards (see Table 14, appendix).
Among those primary school pupils who attended a breakfast club, the main requests for additional foods or drinks to be available at these clubs (N=119) were smoothies (24%), fruit/fruit salad (19%), pancakes, wheaten bread or toast (10%), fruit juice (9%) and cereal/porridge (9%). Very few post-primary pupils offered suggestions for improvements, the main requests being fruit (n=19) and fruit juice (n=19).
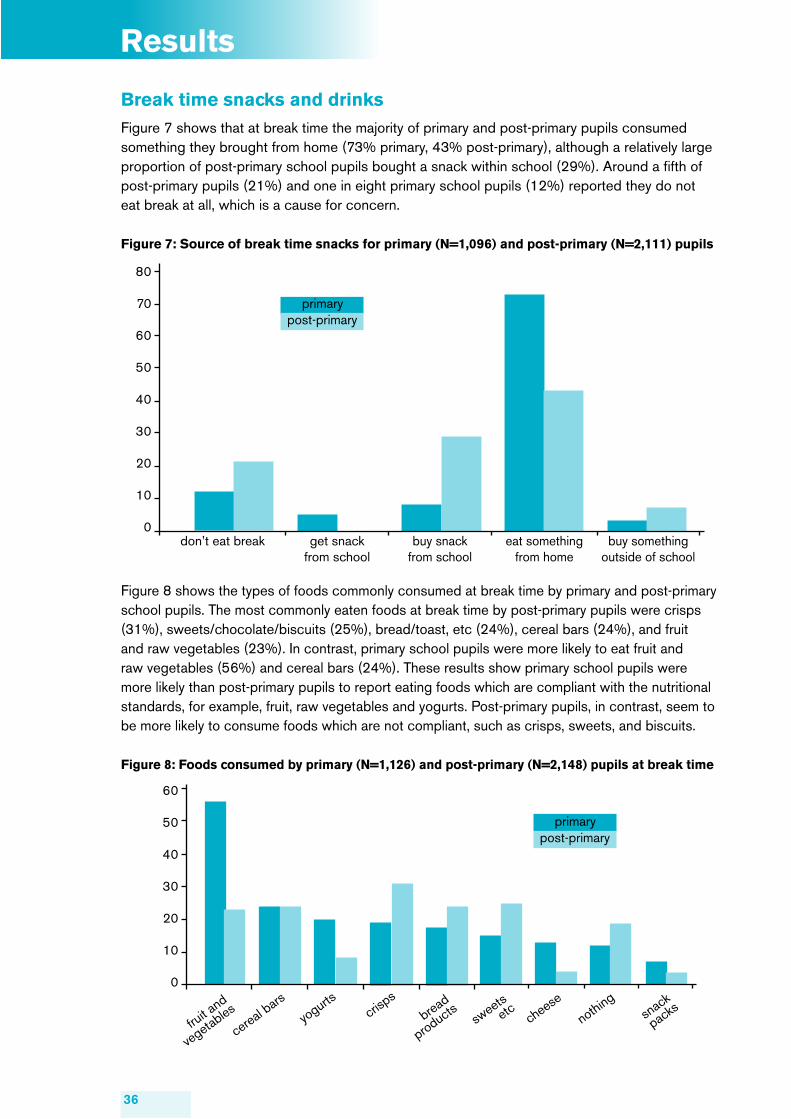
36
Break time snacks and drinksFigure 7 shows that at break time the majority of primary and post-primary pupils consumed something they brought from home (73% primary, 43% post-primary), although a relatively large proportion of post-primary school pupils bought a snack within school (29%). Around a fifth of post-primary pupils (21%) and one in eight primary school pupils (12%) reported they do not eat break at all, which is a cause for concern.
Figure 7: Source of break time snacks for primary (N=1,096) and post-primary (N=2,111) pupils
Figure 8 shows the types of foods commonly consumed at break time by primary and post-primary school pupils. The most commonly eaten foods at break time by post-primary pupils were crisps (31%), sweets/chocolate/biscuits (25%), bread/toast, etc (24%), cereal bars (24%), and fruit and raw vegetables (23%). In contrast, primary school pupils were more likely to eat fruit and raw vegetables (56%) and cereal bars (24%). These results show primary school pupils were more likely than post-primary pupils to report eating foods which are compliant with the nutritional standards, for example, fruit, raw vegetables and yogurts. Post-primary pupils, in contrast, seem to be more likely to consume foods which are not compliant, such as crisps, sweets, and biscuits.
Figure 8: Foods consumed by primary (N=1,126) and post-primary (N=2,148) pupils at break time
Results
80
70
60
50
40
30
20
10
0don’t eat break get snack
from schoolbuy snack
from schooleat something
from homebuy something
outside of school
post-primaryprimary
60
50
40
30
20
10
0
post-primaryprimary
cereal bars
yogurtscrisp
s
cheese
nothing
fruit a
nd
vegetables bread
productssw
eetsetc snack
packs
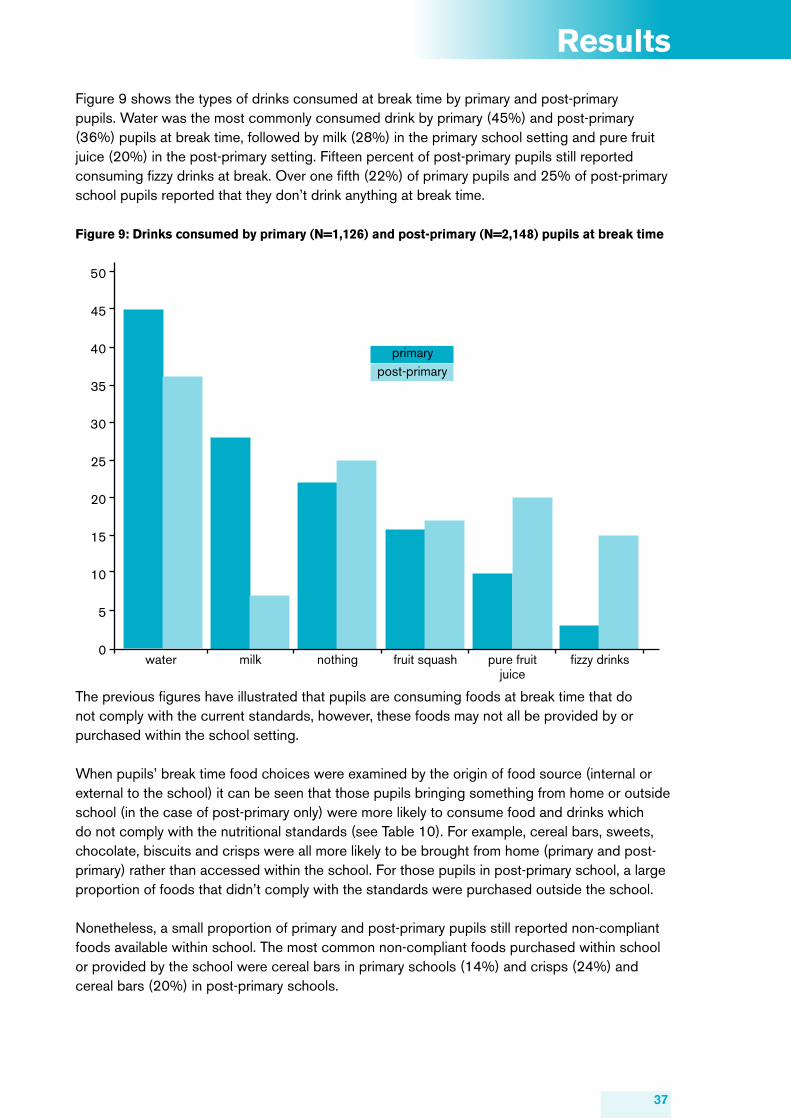
37
Results
Figure 9 shows the types of drinks consumed at break time by primary and post-primary pupils. Water was the most commonly consumed drink by primary (45%) and post-primary (36%) pupils at break time, followed by milk (28%) in the primary school setting and pure fruit juice (20%) in the post-primary setting. Fifteen percent of post-primary pupils still reported consuming fizzy drinks at break. Over one fifth (22%) of primary pupils and 25% of post-primary school pupils reported that they don’t drink anything at break time.
Figure 9: Drinks consumed by primary (N=1,126) and post-primary (N=2,148) pupils at break time
The previous figures have illustrated that pupils are consuming foods at break time that do not comply with the current standards, however, these foods may not all be provided by or purchased within the school setting.
When pupils’ break time food choices were examined by the origin of food source (internal or external to the school) it can be seen that those pupils bringing something from home or outside school (in the case of post-primary only) were more likely to consume food and drinks which do not comply with the nutritional standards (see Table 10). For example, cereal bars, sweets, chocolate, biscuits and crisps were all more likely to be brought from home (primary and post-primary) rather than accessed within the school. For those pupils in post-primary school, a large proportion of foods that didn’t comply with the standards were purchased outside the school.
Nonetheless, a small proportion of primary and post-primary pupils still reported non-compliant foods available within school. The most common non-compliant foods purchased within school or provided by the school were cereal bars in primary schools (14%) and crisps (24%) and cereal bars (20%) in post-primary schools.
50
45
40
35
30
25
20
15
10
5
0
post-primaryprimary
water milk nothing fruit squash pure fruitjuice
fizzy drinks
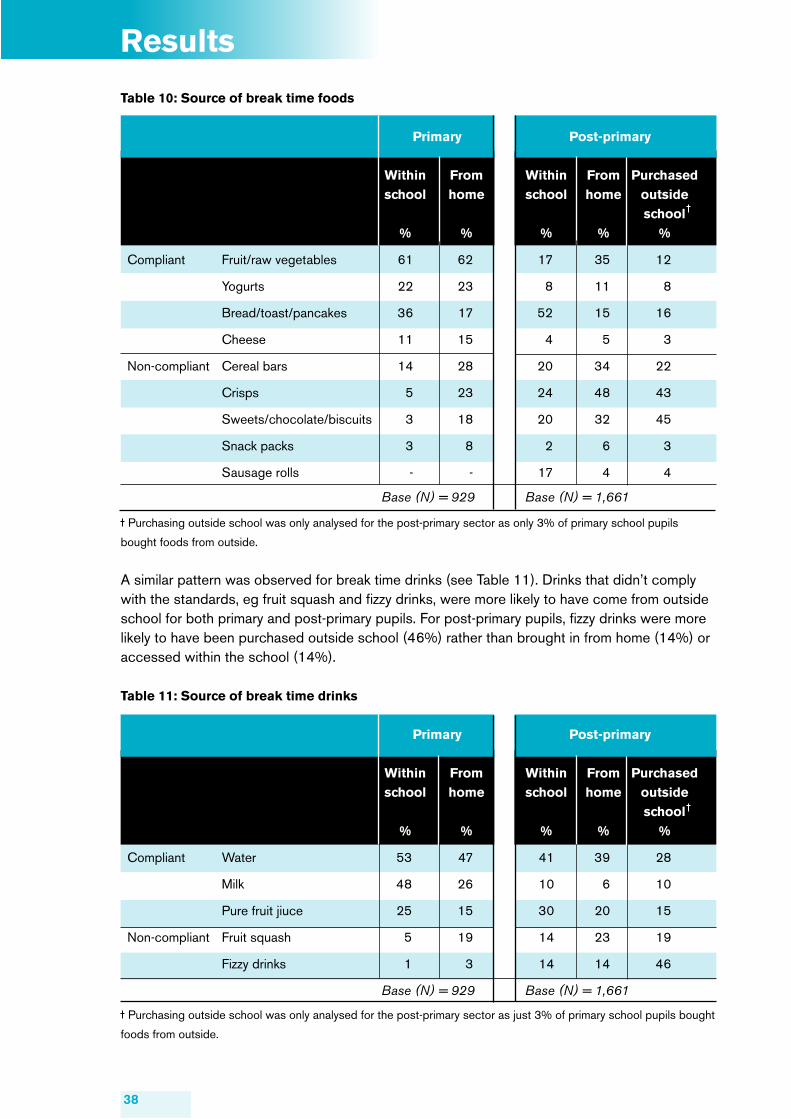
38
Table 10: Source of break time foods
Primary Post-primary
Within From Within From Purchased school home school home outside school % % % % %
Compliant Fruit/raw vegetables 61 62 17 35 12
Yogurts 22 23 8 11 8
Bread/toast/pancakes 36 17 52 15 16
Cheese 11 15 4 5 3
Non-compliant Cereal bars 14 28 20 34 22
Crisps 5 23 24 48 43
Sweets/chocolate/biscuits 3 18 20 32 45
Snack packs 3 8 2 6 3
Sausage rolls - - 17 4 4
Base (N) = 929 Base (N) = 1,661
Purchasing outside school was only analysed for the post-primary sector as only 3% of primary school pupils
bought foods from outside.
A similar pattern was observed for break time drinks (see Table 11). Drinks that didn’t comply with the standards, eg fruit squash and fizzy drinks, were more likely to have come from outside school for both primary and post-primary pupils. For post-primary pupils, fizzy drinks were more likely to have been purchased outside school (46%) rather than brought in from home (14%) or accessed within the school (14%).
Table 11: Source of break time drinks
Primary Post-primary
Within From Within From Purchased school home school home outside school % % % % %
Compliant Water 53 47 41 39 28
Milk 48 26 10 6 10
Pure fruit jiuce 25 15 30 20 15
Non-compliant Fruit squash 5 19 14 23 19
Fizzy drinks 1 3 14 14 46
Base (N) = 929 Base (N) = 1,661
Purchasing outside school was only analysed for the post-primary sector as just 3% of primary school pupils bought
foods from outside.
Results
39
Results
When asked what foods and drinks should be available in schools at break, post-primary pupils (N=474) wanted fresh fruit (25%), as well as fruit juices and smoothies (34%). Primary school pupils (N=318) made similar suggestions, including fruit juices and smoothies (27%), fresh fruit (24%, including individually named fruits) and fruit salads (17%).
After school clubs Almost 6 in 10 primary school pupils (N=1,125) and 4 in 10 post-primary pupils (N=2,127) said that they go to an after school club. Of those who attend these clubs (primary N=658, post-primary N=819), around 31% of primary school pupils and 36% of post-primary pupils reported that food or drinks were consumed there. However, in contrast to breakfast clubs, the food consumed at after school clubs was largely non-compliant with nutritional standards for other food and drinks in schools (see Table 14, appendix).
Parents did report that schools provided foods compliant with the standards including bread, toast and pancakes (21%) and fruit (20%) at these clubs, however evidence was also supplied suggesting the bulk of foods school provided within these clubs was not compliant with the standards (see Table 14, appendix). For example, parents reported foods such as sweets, chocolate (29%) and fruit squash (28%) were readily available within these after school clubs.
The findings outlined above are similar to the responses from pupils themselves indicating a wide range of foods complying and not complying with the standards being consumed at after school clubs. According to primary and post-primary pupils, the main foods and drinks they consumed at after school clubs were sweets/chocolates/biscuits (16% and 15% respectively), fruit (11%, 7%), and drinks of water (47%, 53% ) and fruit squash (14%, 15%) with a proportion of post-primary pupils consuming fizzy drinks (14%) (See Table 14, appendix). Yet results from the post-primary pupils revealed that, of those pupils who had something to eat at an after school club (N=294), only a small minority actually purchased something in school to consume at the after school club (18%), with the majority of this food coming from outside (44%) or from home (38%).
Sources of food provision This study has found that the greatest amount of food that didn’t comply with the standards was sourced from venues outside the school, although, as we have seen, non-compliant foods are still available to pupils within some schools.
There are a variety of sources where pupils can obtain the food they consume in school. Inside schools, these venues include vending machines, tuck-shops and school canteens, while external food sources include home and outside catering venues.
Principals indicated (N=297) canteens were the most commonly available internal source of food and drink for pupils (83%), followed by vending machines (20%) and then tuck shops (13%). However, all these food sources were more common in post-primary schools than primary schools (canteens 98% and 74% respectively, vending machines 52% vs 0%, tuck shops 22% vs 7%).
The frequency of food consumption from these various sources was high with 28% of post-primary pupils (N=2,089) reporting they buy something from vending machines, tuck shops or the canteen once a week, 19% at least once a day, 8% doing so more than once a day, 18% a few times a week and 28% reporting they never buy anything from these sources.
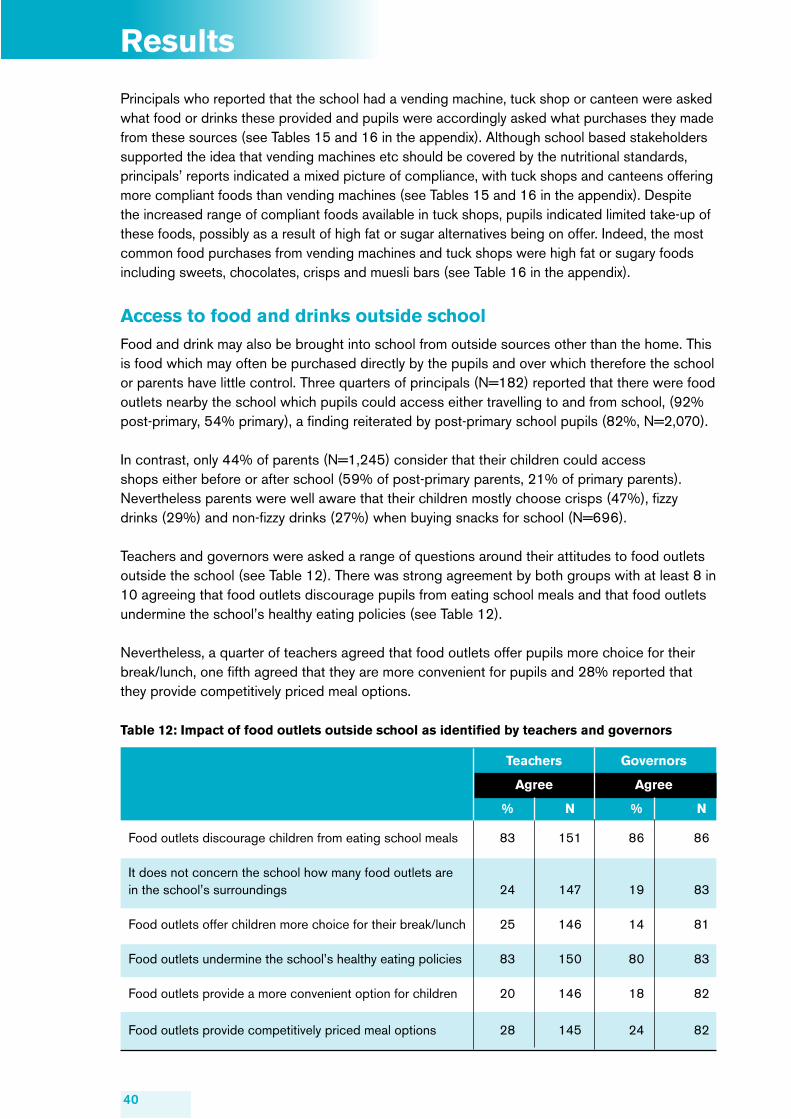
40
Results
Principals who reported that the school had a vending machine, tuck shop or canteen were asked what food or drinks these provided and pupils were accordingly asked what purchases they made from these sources (see Tables 15 and 16 in the appendix). Although school based stakeholders supported the idea that vending machines etc should be covered by the nutritional standards, principals’ reports indicated a mixed picture of compliance, with tuck shops and canteens offering more compliant foods than vending machines (see Tables 15 and 16 in the appendix). Despite the increased range of compliant foods available in tuck shops, pupils indicated limited take-up of these foods, possibly as a result of high fat or sugar alternatives being on offer. Indeed, the most common food purchases from vending machines and tuck shops were high fat or sugary foods including sweets, chocolates, crisps and muesli bars (see Table 16 in the appendix).
Access to food and drinks outside schoolFood and drink may also be brought into school from outside sources other than the home. This is food which may often be purchased directly by the pupils and over which therefore the school or parents have little control. Three quarters of principals (N=182) reported that there were food outlets nearby the school which pupils could access either travelling to and from school, (92% post-primary, 54% primary), a finding reiterated by post-primary school pupils (82%, N=2,070).
In contrast, only 44% of parents (N=1,245) consider that their children could access shops either before or after school (59% of post-primary parents, 21% of primary parents). Nevertheless parents were well aware that their children mostly choose crisps (47%), fizzy drinks (29%) and non-fizzy drinks (27%) when buying snacks for school (N=696).
Teachers and governors were asked a range of questions around their attitudes to food outlets outside the school (see Table 12). There was strong agreement by both groups with at least 8 in 10 agreeing that food outlets discourage pupils from eating school meals and that food outlets undermine the school’s healthy eating policies (see Table 12).
Nevertheless, a quarter of teachers agreed that food outlets offer pupils more choice for their break/lunch, one fifth agreed that they are more convenient for pupils and 28% reported that they provide competitively priced meal options.
Table 12: Impact of food outlets outside school as identified by teachers and governors
Teachers Governors
Agree Agree
% N % N
Food outlets discourage children from eating school meals 83 151 86 86
It does not concern the school how many food outlets are in the school’s surroundings 24 147 19 83
Food outlets offer children more choice for their break/lunch 25 146 14 81
Food outlets undermine the school’s healthy eating policies 83 150 80 83
Food outlets provide a more convenient option for children 20 146 18 82
Food outlets provide competitively priced meal options 28 145 24 82
41
Results
The catering managers and catering supervisors, however, had great concerns about outside catering outlets. These groups reported they felt post-primary pupils tended to choose the outside of school option as ‘it was often cheaper and the range of food was more appealing than what was offered in school’. They noted that where there was less availability of these alternatives, for example in rural areas, uptake of school meals was higher. The qualitative research also identified that pupils being able to leave the school premises at lunchtime presents problems for the catering managers as it permits ‘access to foods which are inconsistent with the nutritional standards’.
Around one fifth of both post-primary principals (N=294) and teachers (N=161) reported that pupils are allowed off the school premises at lunch or break time without needing specific permission. Nonetheless the concerns of catering staff are warranted given that those post-primary pupils, who were allowed off the school premises during the day (N=187), reported the most common places in which they purchased food and drinks to be sweet shops (40%), chip shops (34%) and newsagents (28%). Fifty eight pupils provided information on what they normally buy, with chips (n=19) and sandwiches (n=18) being the most commonly consumed foods.
42
Results
DiscussionThis research aimed to gather information on the knowledge and attitudes of a range of stakeholders in relation to school food. In addition, the surveys gathered vital information on the current sources of food and drink provision which pupils have access to in school, the types of food and drinks provided by the school as well as the variety of food and drinks actually consumed within the school setting. This discussion examines the motivating factors and competing obstacles that are faced by pupils, parents and schools in regard to children’s healthy eating in general and specifically within the school setting. It summarises how these factors, alongside practical and economic issues, impinge on the implementation of school standards.
Nutritional standards - stage of implementation The nutritional standards for school lunches and other food and drinks in school have been implemented to a degree. However this research found around a quarter of schools were yet to become fully compliant with the standards for school lunches and 6 out of 10 schools were yet to achieve full compliance with the newly introduced standards for other foods and drinks in schools.
It is clear that schools are moving towards full implementation of the standards and the implementation guides and associated monitoring checklists launched since this research took place will be a vital ingredient in providing schools with a cohesive and clear focus in guiding schools to implement the standards.14,15
Support and awareness of nutritional initiativesOne essential component in the implementation of any standard is the support it receives from all relevant stakeholders. Positively high support was felt for both sets of standards from all school staff, yet staff perceived little support for standards from parents. In fact, principals and teachers cited parents and pupils as the major barriers to implementing standards, principally due to them continually providing foods at break and lunch which contradict, and hence undermine the impact of the standards.
However, this research has shown parents are eager for their children to eat healthily in schools with the majority of parents supporting the banning of unhealthy foods and drinks. This parental support may be a consequence of parents feeling it is more difficult to control what their children eat in school compared to outside school, especially as a large majority of parents reported they are not fully aware what their children eat in school meals. The provision of packed lunches by an equally large proportion of parents who report they wish to know what their child is eating could be understood as an attempt to regain such control.
It is noteworthy that while parents made no direct mention of the ‘standards’, parents reported a high awareness of school nutrition policies and initiatives that potentially contribute to the standards. However information for parents seems mainly to reach those parents with the highest education status or parents of primary school pupils, suggesting that communications channels between the school and home need further improvement. Previous research has shown that the consequences of parents receiving inadequate information on school heath initiatives are limited positive dietary behaviour changes in children.19
43
Dietary behaviour during the school dayA large proportion of pupils described the food they ate as healthy. Consistent with findings from other studies, girls and younger children were more likely to describe the food they eat as healthy, a view reinforced by other research which shows these groups eating more fruit and vegetables.8,20
Nevertheless, this study noted some evident deficiencies and excesses in pupils’ nutrition across the age groups, although these were more commonly associated with the post-primary sector, possibly due to the increased independence this group of pupils may have. Pupils readily identified that they should consume more fruit and vegetables and less high fat foods or sugary drinks, however they also acknowledged that the major barriers to eating healthily were that they disliked some healthy foods and enjoyed unhealthy ones. In addition this research has found between 12-21% of pupils did not eat anything for school break, indicating consumption of drinking water, and mid morning healthy snacks needs to be promoted especially given the fact that regular but controlled snacking is seen as being important for children and adolescents to help meet their energy and nutrient needs for growth and development.21 It was also found a proportion of pupils do not consume breakfast, a meal which not only provides essential nutrients and vitamins but is also reported to improve cognitive function related to memory, test grades, and school attendance.22
Access to foods contravening the standardsAnalysis of the foods pupils consumed at break time confirmed that, certainly at this stage of the day, the foods which contravened and hence undermined the nutritional standards were derived mainly from the home environment or outside of the school. However this research also noted that foods counteracting the standards were still readily available in school even within organised clubs, especially the after-school clubs.
Given one of the key drivers to children’s nutrition is the food they have access to, it should be acknowledged that changing their knowledge and attitudes will have limited impact if unhealthier foods and snacks are still readily available within the school setting. Indeed many pupils reported being able to purchase sweets and sugary drinks in school. This was more commonly associated with post-primary pupils, owing to the higher availability of vending machines, tuck shops and school canteens in this sector, and may be reflected in the poorer diet of this group.
Principals acknowledged that many foods and drinks which contravened the standards such as fizzy drinks, chocolates and cereal bars were still sold in vending machines, tuck shops and the school canteen. The catering teams considered this to be sending out mixed messages to pupils, undermining the impact of the standards and the progress made in school meals. School meals have been subject to inspection for several years and catering teams called for other food in schools to be similarly tightly regulated and monitored by DE.
Economic implications of nutritional standards Although principals, teachers and governors supported the inclusion of vending machines and tuck shops in the nutrition standards, a small number of principals noted that the financial burden of the high costs of healthy options and loss of revenue for unhealthier items was a practical barrier to implementation of these standards. This was an experience many had
44
highlighted following the initial introduction of the standards for school meals and it could be speculated that this has limited the implementation of nutritional standards for other food in schools.13 Schools had previously been supplied with additional funding during the initial introduction of nutritional standards and principals may be concerned as to the potential for additional lost income from vending machines, tuck shops and also the school meals etc to adversely impact on schools’ resources.
In support of this hypothesis, this research has shown a proportion of schools have seen a decrease in the school meal uptake since the introduction of nutritional standards primarily in the post-primary sector. Positively, however, some schools had seen an increase in school meal uptake. It is, therefore, important that schools identify the individual challenges for their school in relation to promoting the uptake of school meals and other food in schools.
Making effective changesAs part of the process of dealing with the economic implications of changing school food, schools need to adequately address practical problems that may hinder uptake of school meals or shift purchases of food from within school to outside the school setting. A blanket approach cannot be taken to this as all schools will be at an individual starting point, but the processes schools have to go through to assess their needs will be the same.
The simplest way for this to occur is for schools to audit the needs of their customers, ie pupils, parents and staff. Although a large number of schools indicated that they had reviewed the school meal process, few schools had actually consulted with pupils and no schools mentioned consulting with parents. A more inclusive multi-stakeholder approach may be new to schools and, therefore, many schools may need help and guidance to carry out this process using effective and relevant audit tools. Such audits can help schools establish foods that would be acceptable to pupils to be sold in the vending machines etc to limit the financial impact but also identify the practical components that are needed to be addressed around, for example, school meals. Although individual schools will have different issues, this research identifies some common problems with school meals. Primary and post-primary schools identified the same three top issues with school meals to be lack of choice, lengthy queues, and high cost.
Other less commonly mentioned issues around taking a school meal centred on the lack of seating, a factor which could be alleviated by staggered lunch breaks. Segregated seating arrangements for packed lunches and school meals also meant some pupils chose a packed lunch over a school meal simply so that they could sit beside their friends.
Addressing these practical issues will have an impact on school meals as shown in many schools that have already tackled them. However, practical changes need to be accompanied by the supply of motivational information, and skills on healthy eating to pupils and other stakeholders.
Supplying practical motivating informationGiven that knowledge of key messages (for example, five a day) was shown to be high, key nutrition messages now need to be developed which motivate or provide practical advice to allow individuals (school staff, parents and pupils) to instigate positive dietary changes. Pupils
45
themselves have given key insights within this research to the types of motivational messages they see as effective, centring on the immediate impacts of poor nutrition such as obesity. It may be speculated that is hard for individuals (especially from a younger audience) to relate unhealthy lifestyles to disease states so often associated with an ageing population. With this in mind, a focus on the short- and medium-term impact of poor diet, as compared to long-term effects, may provide additional impact within this group.
Within the home setting, parents may also benefit from the provision of practical advice. For example, one of the problems schools found with the implementation of the standards was the types of foods parents supplied in their children’s lunch boxes and for break time.
Parents themselves suggested the need to be a role model to influence their children’s dietary behaviour. This is an effective strategy that was previously identified in a review of children’s eating habits and behaviour, and one considered to be of greater benefit than trying to control what children consume.23 However, the poor diet of many UK adults limits their ability to be an effective role model.16,24 Providing healthy eating recipes and information on how to cook cheap, quick and healthy meals might improve this situation and, it appears, would be welcomed by parents.
Mechanisms to motivate behaviour changeVarious mechanisms can be used to relay and promote nutrition messages, ranging from simple written information to healthy eating schemes, practical cookery demonstrations and taster sessions.
School staff and pupils suggested simple information messages should be relayed using posters. This mechanism has many advantages, in that posters may be placed at multiple points throughout the school and can therefore relay information not only to pupils, but to staff and visitors as well. This research has also suggested that nutrition should be strongly integrated into the curriculum. Further age-tailored teaching resources associated with the main messages advertised could be developed to help teachers deliver and reinforce nutrition messages regularly within the school curriculum.
Pupils and other stakeholders also suggested the use of TV in promoting key messages. However, given the highly competitive media nutrition market and associated costs of such advertising, further investigation is needed to determine the effective impact of this strategy in promoting good nutrition within and outside the school environment.
It was also suggested that engagement with pupils and parents would help give them a sense of ownership of and involvement in the eating experience in school and thus encourage healthy eating. Indeed, such schemes (sometimes known as school nutrition action groups or SNAGs) have often been implemented within schools as a mechanism to a whole school approach to healthier eating.25
Pupils themselves suggested the use of healthy eating days in school. These schemes, unlike healthy break schemes, have the advantage of providing uniformity in terms of healthy eating within the school environment and counter the negative impact that peer influences may have on healthy eating practices. However, care needs to be taken that these schemes are standardised and information/teaching resources associated with these schemes developed regionally to
46
ensure consistent messages are being delivered to all pupils. These initiatives have the added advantage of indirectly influencing parents’ behaviour, by causing parents to buy healthy foods for their children.
As one of the major gatekeepers of children’s nutrition, parents also need to be provided with practical measures to help engage themselves and their families in healthy eating practices. This can be a difficult task for schools to undertake, as personal contact with parents is often limited. However, schools should use a variety of mechanisms to engage with parents including leaflets, letters, as well as more personal engagement through, for example, parents’ evenings, school plays, sports day events to establish the most effective mechanism for their particular school.
Finally as part of efforts to promote school meals and other healthy foods, the governors also suggested the use of demonstration days. This could be used to allow pupils and indeed their parents to experience the types of foods available in school meals and dispel common misconceptions highlighted within this research around the healthiness of school meals.
This research has found addressing children’s dietary habits in the school environment is a complex task, requiring a multi-dimensional approach. The need for improved communication, education and skills has to be addressed among all stakeholders involved with children’s nutrition. In addition this research has shown that it is not only knowledge and skills that can have the potential to influence behaviour changes in children’s diet. Other factors, such as the physical environment of the dining areas of the school as well as the organisational arrangements for school lunches, also have a key role to play in addressing and optimising children’s nutrition.
47
References 1. The eatwell plate. Food Standards Agency. http://www.food.gov.uk/multimedia/pdfs/
publication/eatwellplate0907.pdf.
2. Diet, nutrition and the prevention of chronic diseases: report of a joint WHO/FAO expert consultation, Geneva, 28 January -- 1 February 2002. http://whqlibdoc.who.int/trs/who_TRS_916.pdf
3. Van Duyn MS & Pivomka E. Overview of the health benefits of fruit and vegetable consumption for the dietetics professional: selected literature. J am diet assoc 2000; 100: 1511-1521.
4. Skeaff CM & Miller J. Dietary fat and coronary heart disease: summary of evidence from prospective cohort and randomised controlled trials. Ann nutr metab 2009; 55:173-203.
5. Berenson GS, Srinivasan SR, Nicklas TA. Atherosclerosis: a nutritional disease of childhood. Am J Cardiol 1998; 82:10B:22T-29T.
6. Scientific Advisory Committee on Nutrition SACN: The SACN Subgroup on Maternal and Child Nutrition (SMCN): Draft Report for Scientific Consultation: The influence of maternal, fetal and child nutrition on the development of chronic disease in later life. February 2010. http://www.sacn.gov.uk/pdfs/draft_early_nutrition_report_consultation_february_2010.pdf
7. Berenson GS, Srinivasan SR, Bao W, Newman WP, Tracy RE, Wattigeyney WA. Association between multiple cardiovascular risk factors and atherosclerosis in children and young adults. New England Journal of Medicine 1998;338:1650-1656.
8. Northern Ireland Statistics and Research Agency NISRA. Young Persons’ Behaviour and Attitudes Survey 2007. Belfast: DHSSPS, 2007. http://www.csu.nisra.gov.uk/YPBAS%202007%20Topline%20Results%20Weighted.pdf
9. Hastings G, Stead M, McDermott L, Forsyth A, MacKintosh AM, Rayner M, Godfrey C, Caraher M, Angus K. Review of the effects of food promotion to children. Final report. Food Standards Agency. 2003. http://www.food.gov.uk/multimedia/pdfs/foodpromotiontochildren1.pdf
10. Northern Ireland Neighbourhood Information Service. Childhood obesity rates 2007/2008. http://www.ninis.nisra.gov.uk/mapxtreme_ifh/DataCatalogue.asp?button=Obj7.
11. Department of Health, Social Services and Public Safety. Fit futures. Focus on food, activity and young people. Belfast: DHSSPS, 2006.
12. Department of Education. Catering for healthier lifestyles. Compulsory nutritional standards for school meals: a consultation document. Available at http://www.deni.gov.uk/catering_for_healthier_lifestyles-2.pdf
13. PricewaterhouseCoopers. Evaluation of the pilot of the ‘Catering for healthier lifestyles standards’ in Northern Ireland. December 2005. Available at http://www.deni.gov.uk/nutritional_standards_pilot_scheme_final_report-3.pdf
48
14. Health Promotion Agency for Northern Ireland. Nutritional standards for school lunches. A guide for implementation. Belfast: HPA, 2008
15. Health Promotion Agency for Northern Ireland. Nutritional standards for other food and drinks in schools. A guide for implementation. Belfast: HPA, 2008
16. Food Standards Agency. National Diet Nutrition Survey: Headline results from year 1 (2008/2009). Available at: http://www.food.gov.uk/multimedia/pdfs/publication/ndnstables0809year1results.pdf
17. School Food Trust. A fresh look at the school meal experience (2nd edition). Sheffield: School Food Trust, 2009. Available at http://www.schoolfoodtrust.org.uk/UploadDocs/Library/Documents/sft_fresh_look_meal_experience2nd_edition.pdf (accessed 14.10.2010)
18. Department of Education. October 2008 school meals census. Unpublished data.
19. Health Promotion Agency for Northern Ireland. Fresh Fruit in Schools. Summary report 2002-2006. Belfast: HPA, 2007. http://www.healthpromotionagency.org.uk/Resources/nutrition/pdfs/FFEvaluation2007.pdf
20. Candace Currie, Kate Levin, Joanna Todd and the HBSC National Team. Health Behaviour in School-aged Children: World Health Organization Collaborative Cross national study (HBSC). Findings from the 2006 HBSC Survey in Scotland. Child and adolescent heath research unit (CAHRU), 2008. Available at http://www.education.ed.ac.uk/cahru/publications/reports_downloads/HBSC_National_Report_2008.pdf
21. Gatenby SJ. Eating frequency: methodological and dietary aspects. British journal of nutrition. 1997;77;suppl1:S7-S20.
22. Rampersaud GC, Pereira MA, Girard BL, Adams J, Metzl JD. Breakfast Habits, Nutritional Status, Body Weight, and Academic Performance in Children and Adolescents. J Am Diet Assoc. 2005;105:743-760.
23. Children’s eating attitudes and behaviour; a study of the modelling and control theories of parental influence. Health education research. 2004: 19:3: 261-271.
24. NHS. The Health and Social Care Information Centre. Statistics on obesity, physical activity and diet. The NHS Information Centre, Lifestyle Statistics England, February 2009. http://www.ic.nhs.uk/webfiles/publications/opan09/OPAD%20Feb%202009%20final.pdf
25. Passmore S, Harris G. School nutrition action groups and their effect upon secondary school-aged pupils choices. Nutrition Bulletin. British nutrition foundation 2005: 30:4:364-369.
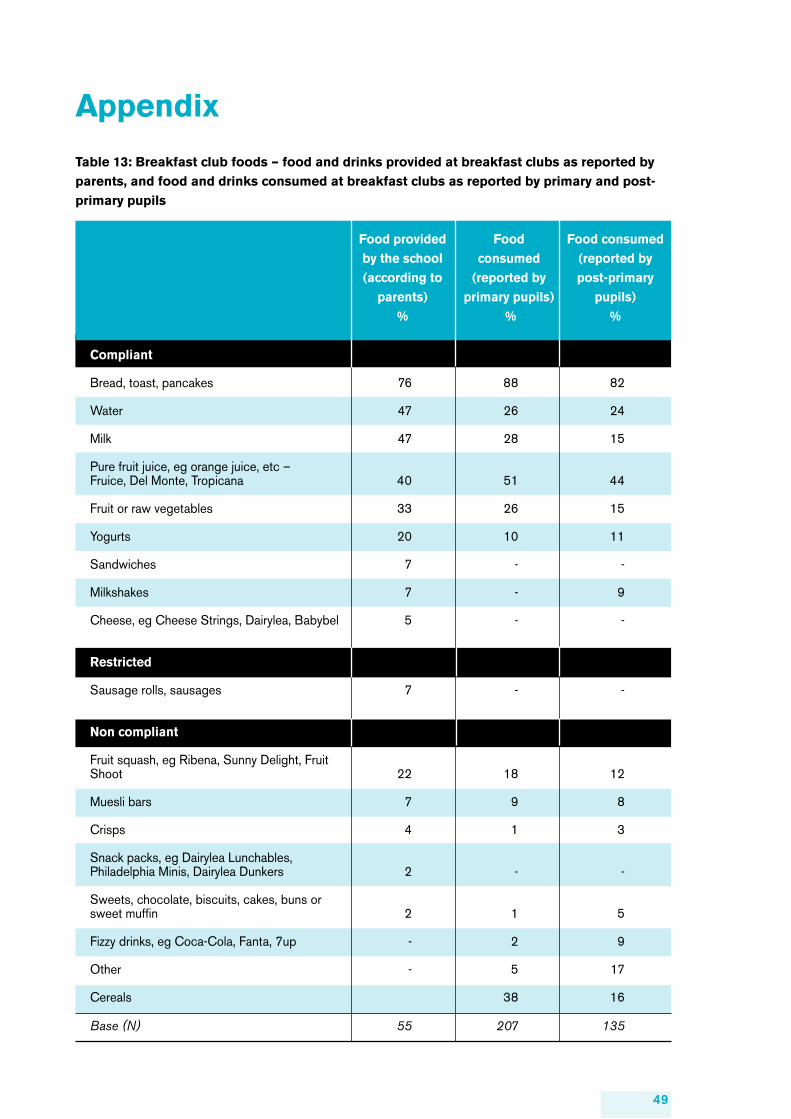
49
Appendix
Table 13: Breakfast club foods – food and drinks provided at breakfast clubs as reported by parents, and food and drinks consumed at breakfast clubs as reported by primary and post-primary pupils
Food provided Food Food consumed by the school consumed (reported by (according to (reported by post-primary parents) primary pupils) pupils) % % %
Compliant
Bread, toast, pancakes 76 88 82
Water 47 26 24
Milk 47 28 15
Pure fruit juice, eg orange juice, etc – Fruice, Del Monte, Tropicana 40 51 44
Fruit or raw vegetables 33 26 15
Yogurts 20 10 11
Sandwiches 7 - -
Milkshakes 7 - 9
Cheese, eg Cheese Strings, Dairylea, Babybel 5 - -
Restricted
Sausage rolls, sausages 7 - - Non compliant
Fruit squash, eg Ribena, Sunny Delight, Fruit Shoot 22 18 12
Muesli bars 7 9 8
Crisps 4 1 3
Snack packs, eg Dairylea Lunchables, Philadelphia Minis, Dairylea Dunkers 2 - - Sweets, chocolate, biscuits, cakes, buns or sweet muffin 2 1 5
Fizzy drinks, eg Coca-Cola, Fanta, 7up - 2 9 Other - 5 17
Cereals 38 16
Base (N) 55 207 135
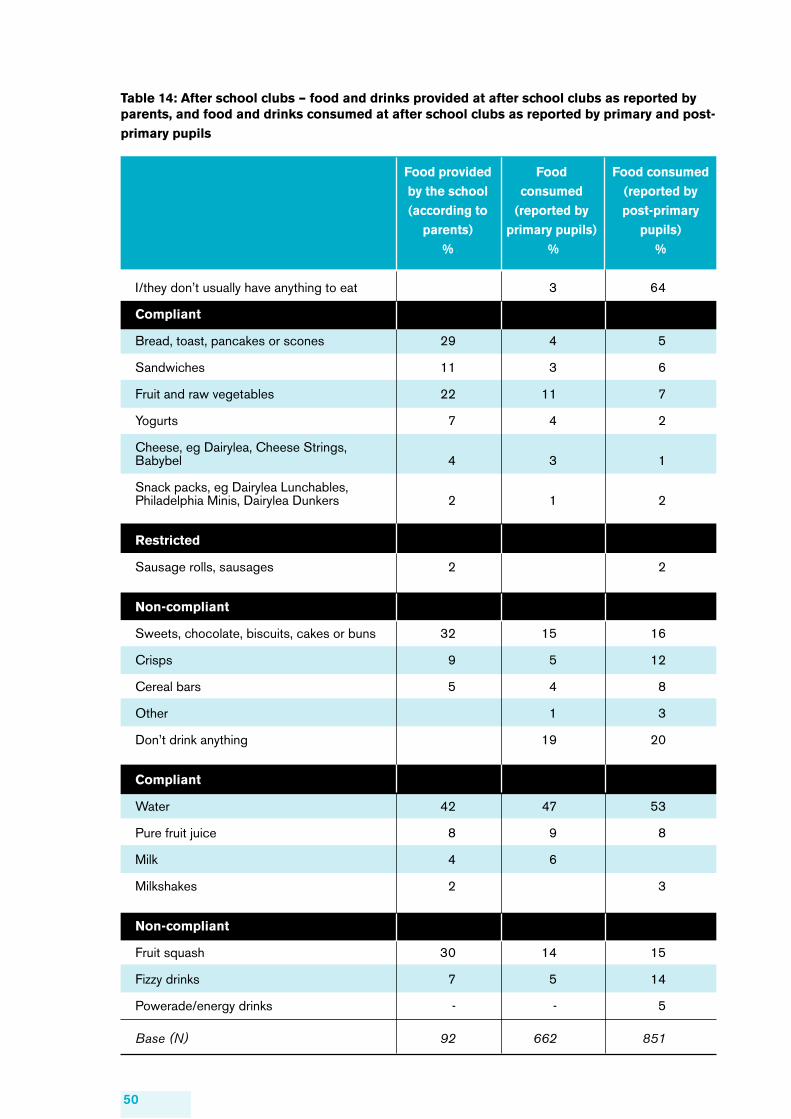
50
Table 14: After school clubs – food and drinks provided at after school clubs as reported by parents, and food and drinks consumed at after school clubs as reported by primary and post-primary pupils Food provided Food Food consumed by the school consumed (reported by (according to (reported by post-primary parents) primary pupils) pupils) % % %
I/they don’t usually have anything to eat 3 64
Compliant
Bread, toast, pancakes or scones 29 4 5
Sandwiches 11 3 6
Fruit and raw vegetables 22 11 7
Yogurts 7 4 2
Cheese, eg Dairylea, Cheese Strings, Babybel 4 3 1
Snack packs, eg Dairylea Lunchables, Philadelphia Minis, Dairylea Dunkers 2 1 2
Restricted
Sausage rolls, sausages 2 2
Non-compliant
Sweets, chocolate, biscuits, cakes or buns 32 15 16
Crisps 9 5 12
Cereal bars 5 4 8
Other 1 3
Don’t drink anything 19 20
Compliant
Water 42 47 53
Pure fruit juice 8 9 8
Milk 4 6
Milkshakes 2 3
Non-compliant
Fruit squash 30 14 15
Fizzy drinks 7 5 14
Powerade/energy drinks - - 5
Base (N) 92 662 851
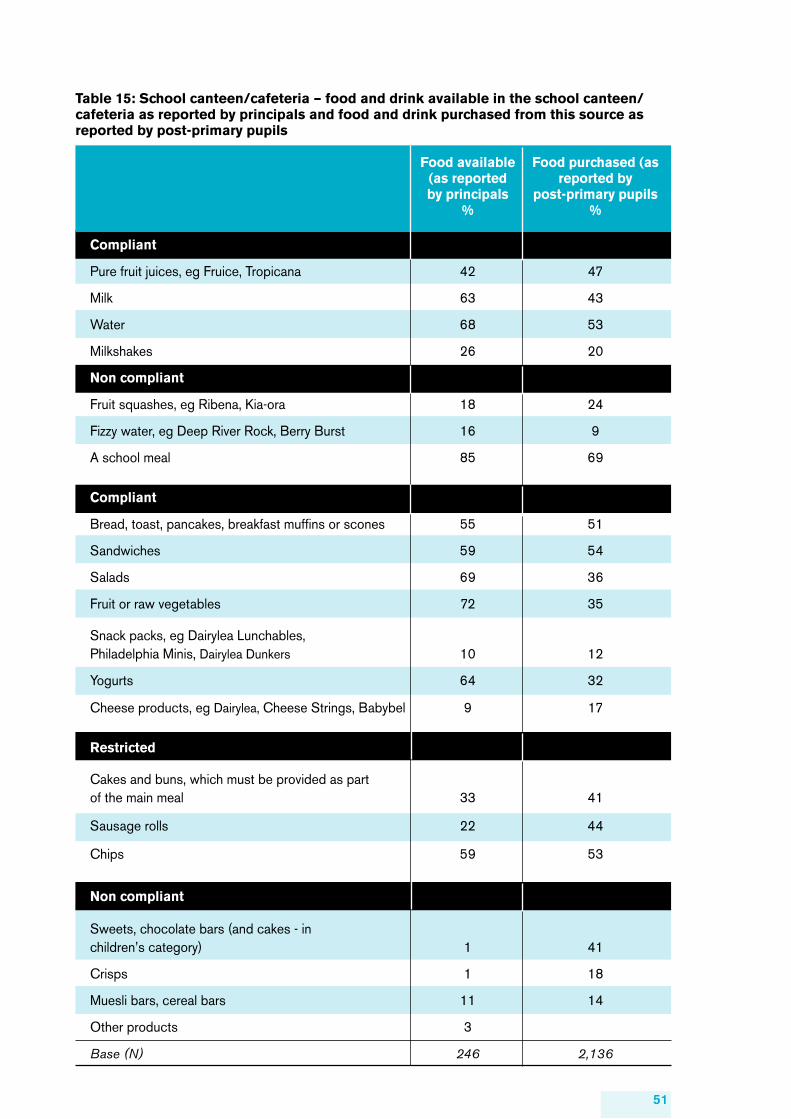
51
Table 15: School canteen/cafeteria – food and drink available in the school canteen/cafeteria as reported by principals and food and drink purchased from this source as reported by post-primary pupils
Food available Food purchased (as (as reported reported by by principals post-primary pupils % %
Compliant
Pure fruit juices, eg Fruice, Tropicana 42 47
Milk 63 43
Water 68 53
Milkshakes 26 20 Non compliant
Fruit squashes, eg Ribena, Kia-ora 18 24
Fizzy water, eg Deep River Rock, Berry Burst 16 9 A school meal 85 69
Compliant
Bread, toast, pancakes, breakfast muffins or scones 55 51 Sandwiches 59 54
Salads 69 36
Fruit or raw vegetables 72 35
Snack packs, eg Dairylea Lunchables, Philadelphia Minis, Dairylea Dunkers 10 12
Yogurts 64 32
Cheese products, eg Dairylea, Cheese Strings, Babybel 9 17
Restricted
Cakes and buns, which must be provided as part of the main meal 33 41
Sausage rolls 22 44
Chips 59 53
Non compliant
Sweets, chocolate bars (and cakes - in children’s category) 1 41 Crisps 1 18
Muesli bars, cereal bars 11 14
Other products 3
Base (N) 246 2,136
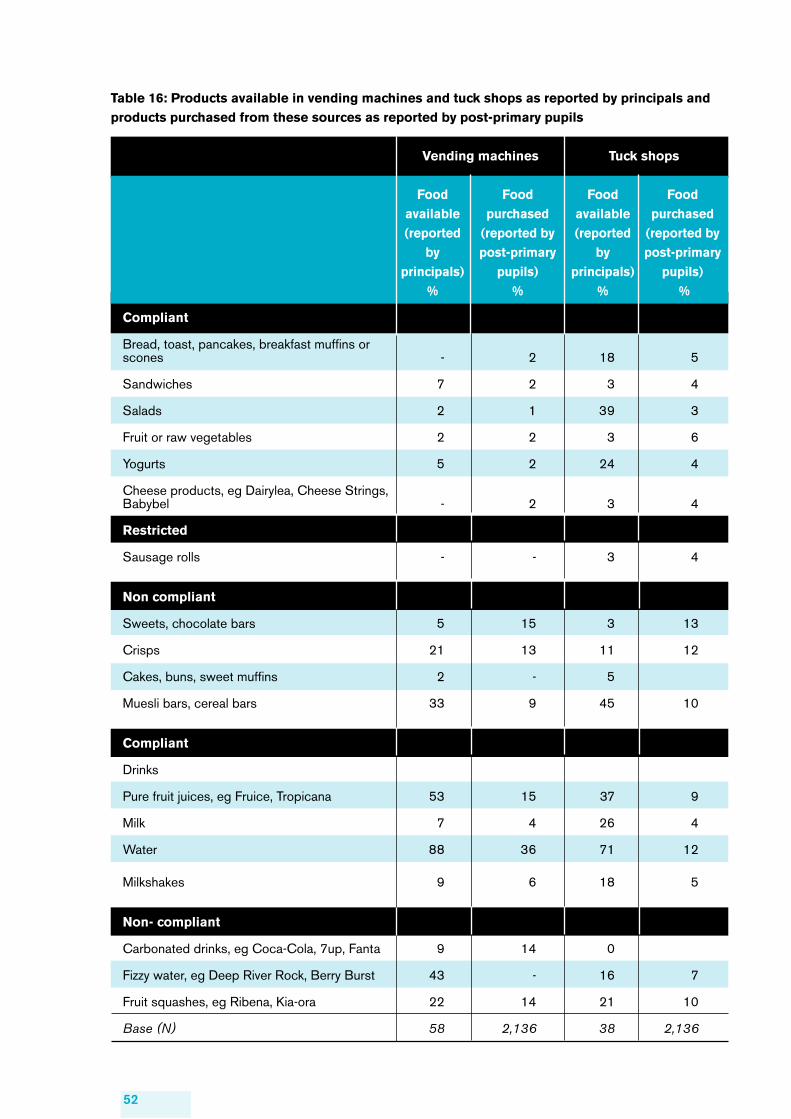
52
Table 16: Products available in vending machines and tuck shops as reported by principals and products purchased from these sources as reported by post-primary pupils
Vending machines Tuck shops
Food Food Food Food available purchased available purchased (reported (reported by (reported (reported by by post-primary by post-primary principals) pupils) principals) pupils) % % % %
Compliant
Bread, toast, pancakes, breakfast muffins or scones - 2 18 5 Sandwiches 7 2 3 4 Salads 2 1 39 3 Fruit or raw vegetables 2 2 3 6 Yogurts 5 2 24 4 Cheese products, eg Dairylea, Cheese Strings, Babybel - 2 3 4 Restricted Sausage rolls - - 3 4
Non compliant
Sweets, chocolate bars 5 15 3 13 Crisps 21 13 11 12 Cakes, buns, sweet muffins 2 - 5 Muesli bars, cereal bars 33 9 45 10
Compliant
Drinks Pure fruit juices, eg Fruice, Tropicana 53 15 37 9 Milk 7 4 26 4 Water 88 36 71 12 Milkshakes 9 6 18 5
Non- compliant
Carbonated drinks, eg Coca-Cola, 7up, Fanta 9 14 0 Fizzy water, eg Deep River Rock, Berry Burst 43 - 16 7 Fruit squashes, eg Ribena, Kia-ora 22 14 21 10 Base (N) 58 2,136 38 2,136

Public Health Agency, Ormeau Avenue Unit, 18 Ormeau Avenue, Belfast, BT2 8HS. Tel: 028 9031 1611. Textphone/Text Relay: 18001 028 9031 1611. www.publichealth.hscni.net
10/10
cover.indd 2 07/01/2011 10:41