Embed Size (px)
Citation preview
1
SCHOOL OF ECONOMICS
DISCUSSION PAPER 98/20
CRISES IN PUBLIC PENSION PROGRAMMES IN OECD:WHAT ARE THE REFORM OPTIONS
by
Richard Disney
Abstract
Public pension programmes in many OECD countries are in difficulties. With an
ageing population, and declining participation of working age men in paid work,
existing pension arrangements are far too costly in many countries, both now and in
the future. This paper examines the evidence as to whether programmes are indeed in
need of major surgery, focusing in particular on the issue of fiscal sustainability. It
then considers why programmes have got into financial difficulties. The paper then
examines the strengths and weaknesses of some reform strategies.
Acknowledgements
My thanks to Axel Böersch-Supan and David Greenaway for comments: the normal
disclaimer applies.

2
1. INTRODUCTION
Public pension programmes in many OECD countries are in difficulties. With
an ageing population, and declining participation of working age men in paid work,
existing pension arrangements are far too costly in many countries, both now and in
the future. Some countries have taken steps to tackle the pension reform issue but
there is inevitably conflict over who bears the burden of this retrenchment: whether it
be current taxpayers, current pensioners, or future generations of taxpayers and
pensioners. There are also major differences in philosophy over the nature of pension
reforms, both proposed and as implemented. Blueprints exist for reform (such as the
framework provided by The World Bank, 1994) but countries have in practice
followed a variety of different paths. An interesting question is whether economic
theory gives any guide as to which type of reform will succeed. It may be however
that countries are too idiosyncratic in their existing systems and in their political
structure as to permit a common approach to reform.
This paper considers three issues. It examines the evidence as to whether
public pension programmes in some OECD countries are indeed in need of major
surgery, focusing in particular on the issue of fiscal sustainability. It then considers
why programmes have got into financial difficulties. Consideration of this issue
provides some clues as to what type of reform process is likely to be viable and
credible. The paper then examines the strengths and weaknesses of some reform
strategies. A central issue considered there is whether pension programmes should be
funded or unfunded.

3
2. The problem of financing pension schemes in OECD countries
The problem of financing pensions in Europe is largely one of financing
public pension programmes: by which I mean the contribution-based universal
scheme of provision of public benefits for the elderly (what is termed ‘social security’
in US parlance). Currently, public pension programmes are largely unfunded, that is,
current pension payments are financed by current contributions, usually levied as
payroll taxes, but sometimes paid directly out of general revenues.1 Future
obligations are conditioned on current rules concerning eligibility and accrual rates
and, it is hoped, will be met by future generations of contributors. Significant private
provision of pensions is uncommon in Europe; the key countries where such schemes
are important are the UK and the Netherlands, where private pension fund assets have
been accumulated to a value of, respectively, 75% and 87% of GDP in 1996 (OECD,
1998). Switzerland also has a funded component, as do Sweden and Denmark which
have significant private funds, but in other countries private schemes are marginal or
largely ‘top up’ public schemes.
Although private and ‘top up’ schemes are generally treated as peripheral to
the financing debate (indeed, as we shall see, greater private provision is commonly
advocated as a solution to the problems of public programmes), existing private
schemes may not be immune from difficulties. These difficulties can be considered
briefly before moving to the more pressing question of the liabilities of public
programmes.
One problem is where supplementary pension commitments over and above
the explicit social security programme are unfunded. In particular, pension schemes
1 A subsidiary debate therefore concerns whether public pension programmes should be financed byan earmarked ‘insurance’ contribution, so emphasising the ‘actuarial basis’ of the programme, or out ofgeneral taxation, implicitly giving weight to the redistributive aspect. There is also the implicit issue ofthe transparency of a contribution-based scheme relative to a tax-financed scheme.

4
for public sector workers are often unfunded and, like other unfunded pension
liabilities, not measured explicitly in the national accounts. This is largely true of the
pension schemes of civil servants in the UK, France and Germany, for example
(Bovenberg and Petersen, 1992). Efforts to measure the liabilities of public schemes
often ignore these additional liabilities.
Second, the future values of private pension funds are subject to some of the
same pressures that are likely to affect public programmes. For example, the
maturation of these funds will accompany the demographic transition resulting from
the baby boom generation reaching retirement age, and at that point funds will be net
sellers, rather than buyers of financial assets. Whether this affects global asset values
depends on the future path that other countries take in their pension arrangements and
the extent to which portfolios are globally diversified: at present less than 20% of the
pension assets of the major OECD countries are held in assets outside OECD
countries. Falling or stagnant asset values would make it that much more difficult for
funded pension schemes to provide an adequate value of pensions. The general issue
is whether there is a positive covariance across countries and time between the rate of
return in capital markets (which determines the payoff of funded schemes) and the
implicit potential rate of return on unfunded schemes (which is the rate of growth of
the wage bill, or some similar measure). If, for example, falling labour force growth
is associated with falling returns in the capital market, then funded schemes will not
be immunised from the problems of existing, unfunded, schemes
3. The liabilities of public pension programmes
A number of projections have been made by international institutions and
individual governments of the future liabilities of public pension programmes, and of

5
the consequences of these liabilities for fiscal balances. Such projections rely on
assumptions that are not always explicit and, on past evidence, are subject to large
errors once outcomes are observed. On the ‘over-pessimistic’ side, projections often
ignore policy feedbacks, which have tended in the past to impose restraints on the
liabilities of programmes. On the ‘over-optimistic’ side, countries have generally
been systematically too optimistic in understating longevity improvements and
overstating the labour force participation of older workers. In addition, different
projections seem to rank different OECD countries quite differently in terms of the
financing ‘crises’ associated with pension programmes.
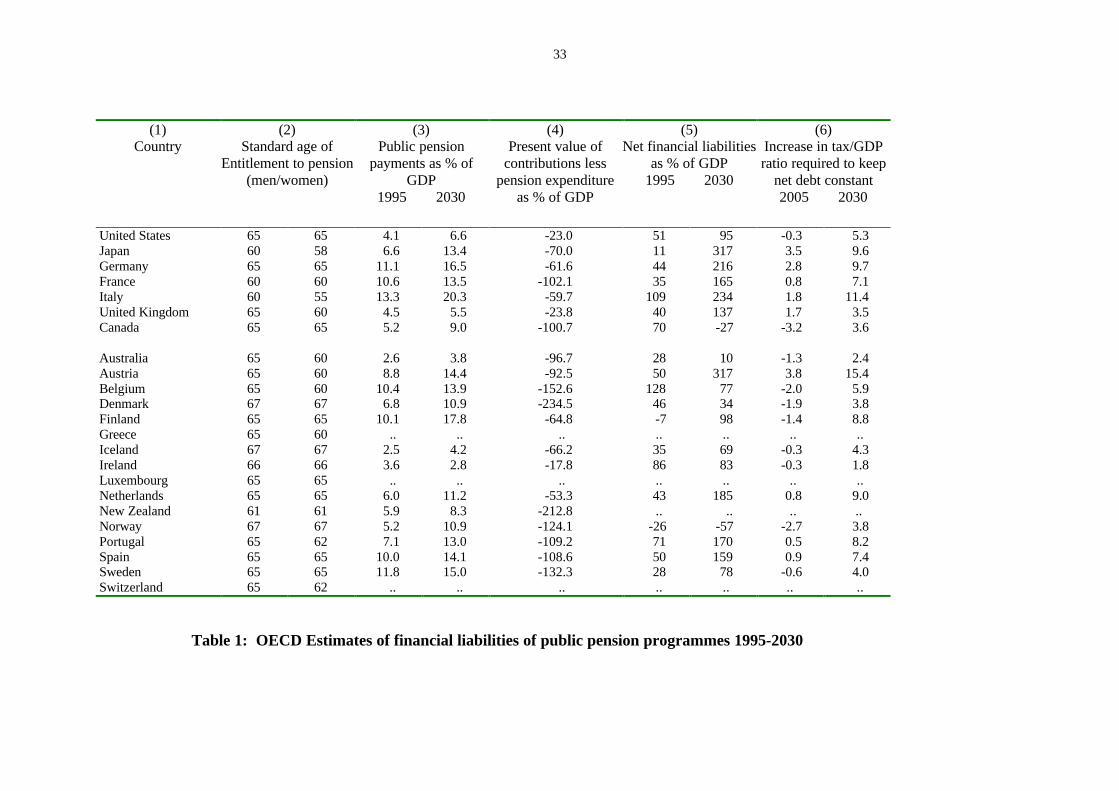
Table 1 presents some recent projections from OECD itself for a range of
countries. Column (2) is a memo item, showing that there is a fair degree of
uniformity in ages of entitlement for a full public pension across countries, although
there are some interesting outliers such as Japan, Italy and New Zealand on the one
hand, and the Scandinavian countries on the other. However it should be noted that
official pension ages give little guide to cross-country variations in retirement
behaviour. Many countries, including the United States but not the United Kingdom,
have explicit actuarially favourable early retirement options within the public pension
programme. A number of countries bordering the Mediterranean also have devices
such as ‘seniority pensions’, which allow individuals to retire on a full pension after a
certain number of years’ service, whether or not they have reached the official state
pension age.2 In contrast, in the countries of northern Europe, retirement through
disability benefit schemes and other special early retirement ‘windows’ (within the
public programme) have been popular, especially in periods of recession.
2 For example, in Italy, until the recent reform, 35 years of contributions would automatically entitlean individual to a full pension; however public servants could originally receive a full pension after 20years’ service. In Turkey, 25 years of contribution would entitle the individual to a full pension as
6
The remaining columns are derived from an OECD-based simulation model of
pension liabilities for individual countries. The underlying procedure is standard: it
projects earnings growth based on an aggregate model of earnings, utilises existing
contribution rates and projects benefit 'rules' (taking account of any prospective
reforms) in order to calculate future pension liabilities and contribution receipts.
Participation rates are held constant in the OECD case, where it is also assumed that
the age-earnings profiles, presumably derived from cross sections, are ‘augmented’ by
1½% productivity growth per annum and where GDP growth is assumed to be on a
‘medium term growth path’. These assumptions are sufficient to calculate columns
(3) and (4), which show the cost of public pensions as a proportion of GDP and the
Present Value of the difference between projected benefits and currently legislated
contribution revenues, to the time horizon of 2070.3
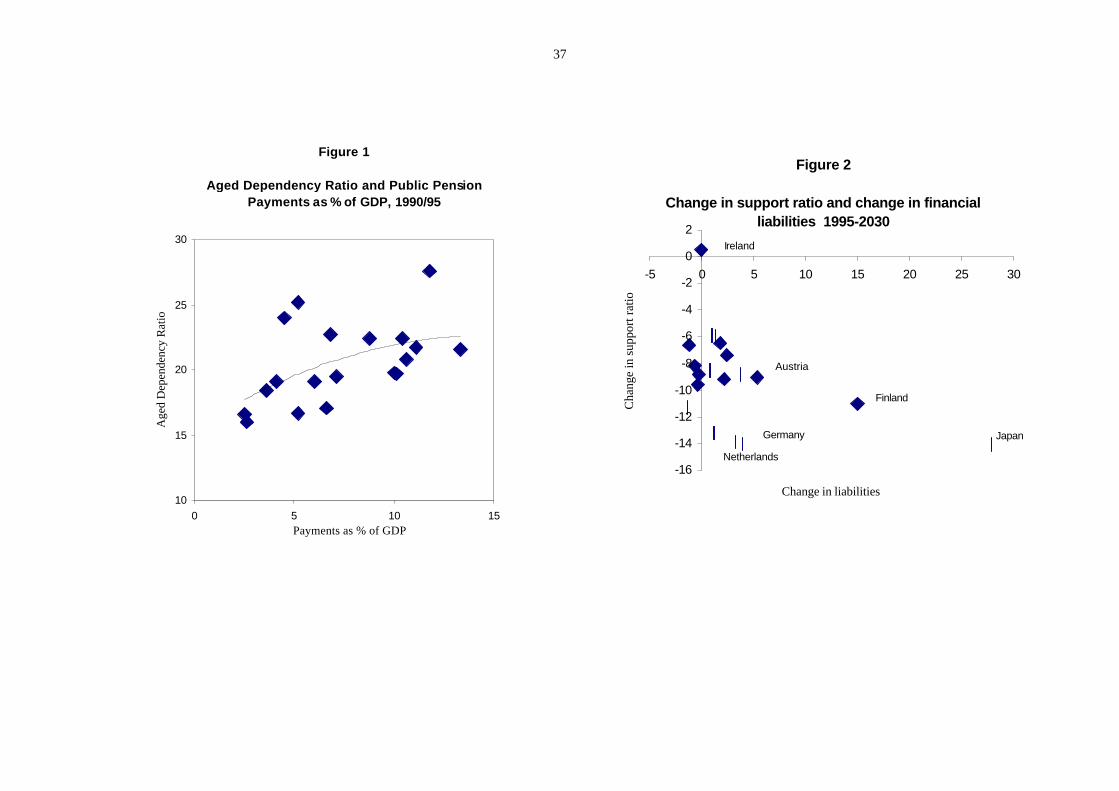
It should be noted in passing that there is not a close correlation between the
current GDP cost of pension provision and the ratio of the population of 65 and over
to the working population (the ‘aged dependency ratio’- ADR); see Figure 1. In 1990,
for example, the highest ADRs, in descending order, among the countries cited here
for which there are data were Sweden, Norway, the UK and Denmark. Yet three of
these countries are among the lowest in terms of pension payments as a proportion of
GDP in 1995. Of course, given the simulation methodology, the increase in public
pension payments to 2030 will be much more closely related to demographic change,
and it is no surprise to see countries where the demographic transition to an aged
society is dramatic, such as Italy, Japan and the Netherlands, exhibiting rising ratios.
It is hard to know what is an acceptable upper limit on pension payments as a % of
GDP and it will partly depend on the country-specific demographic transition. If,
would being 55 (a man) or 50 (a woman). In Greece, there is a complicated formula linking days ofcontributions to first age of receipt, but men could in principle retire at 58 and women at 50.

7
however, as a rule of thumb, we were to believe that a 10% ratio of public pension
payments to GDP should be an effective ceiling on public pension commitments, then
some countries already exceed this fraction, and many more will do so by 2030.
Column (4) indicates starkly that pension contributions will have to rise if
large deficits are not to be incurred. Contribution increases are, in fact, often
automatically projected by government actuaries in order to ensure that there is no
projected deficit. Whether such projected contribution increases are implemented in
all countries is quite a different matter, and already in several countries existing
pension commitments are being partly funded by borrowing.
Given the pension calculations, the next stage in such calculations is to take
the existing fiscal stance and to factor in the extra pension expenditures to examine
future ‘net financial liabilities’, so as to project the future overall fiscal balance.
These will look larger, of course, if the budget is already in deficit. The calculations
in column (5) also includes the projected costs of health care, assuming that
underlying health costs will rise in line with GDP (despite the fact that in most
countries they have risen considerably faster in recent years) and adjusting levels of
health care costs to the evolving demographic profile (since the very young and the
elderly tend to incur more health expenditures than other age groups).4
These numbers, accompanied by those in column (6), are those that give
politicians and central bankers heart attacks. Projected increases in financial
liabilities in countries such as Austria, Japan, Italy and Germany look alarming, and
increases in tax/GDP ratios, some as high as 10-15% by 2030, are not seen as
electoral vote winners. An important caveat, however, is that we have little means of
3 This is the terminal date chosen by OECD.4 An important issue is whether increased longevity is associated with better health Ia reduction inmorbidity). There is some evidence that age-specific morbidity rates have declined, but future progresswill depend on medical advances.

8
judging the reliability of such projections. For example, Canada, although it has
recently implemented a pension reform, has a rapidly rising costs of health care and
one of the most rapid demographic transitions among these countries, yet it is shown
as having an improvement in its financial position over the period. Variations in the
range of projections based on alternative assumptions as to demographic and
economic variables of course ‘fan out’ as we project further into the future.
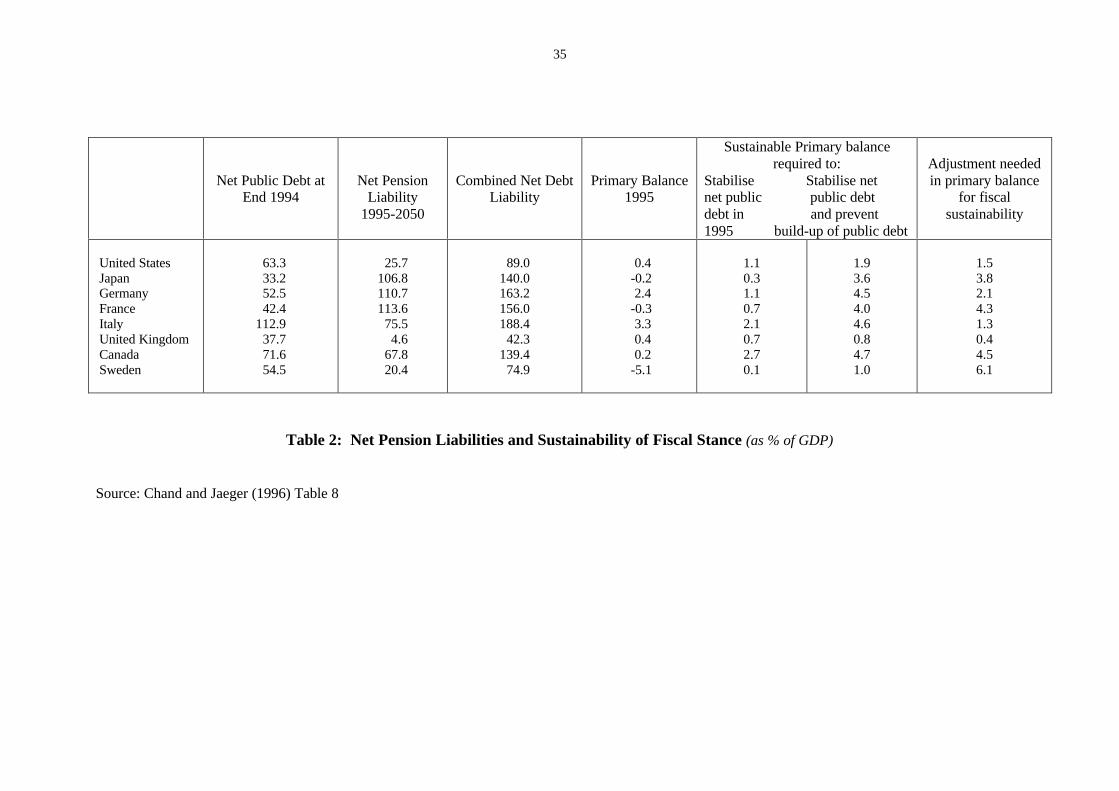
As a check on these numbers, Table 2 contains some comparable simulations
from the IMF. These do not allow for the additional costs of health care. They are
calculated on similar assumptions to those of the OECD study, with 1½% productivity
growth. Although there appears to be no explicit attempt to model the evolution of
wages, the simulations appear to allow for cohort-specific variation in labour force
participation rates. The basic message of Table 2 is similar to that of Table 1, but
there are important country-specific differences. The increases in debt liabilities are
not as dramatic as in the OECD calculations, perhaps because additional health care
expenditures are ignored. It is also noticeable that the IMF method of calculation
places a heavy emphasis on current fiscal stance. For example, Italy is shown to have
a positive primary balance in 1995 and thus the net adjustment required appears to be
much lower than, say, Sweden (in contrast to Table 1, and common sense).
A further reservation concerning financial simulations of this type is that they
make only limited attempts to model the underlying economic structure. Increases in
financial liabilities are typically assumed to raise real interest rates, but there is little
attempt to model the impact of this increase on the capital stock. In addition, the
underlying determinants of the capital stock and labour productivity may in turn be
related to the structure of the working population and the savings rate. The most
obvious feedback mechanism is that the age structure affects the aggregate saving

9
rate, which in turn affects the rate of capital accumulation and thus output growth.
Models which embody life cycle relationships of this kind have been constructed, but
it is generally hard in GE-type model simulations also to calibrate the country-specific
complexities of pension accruals and contribution structures across cohorts.5
Whatever the limitations of the modelling procedures, Tables 1 and 2 convey a
clear picture of growing fiscal imbalances and implicit liabilities that are not usually
transparent in national accounts data.6 For some countries, these prospective
liabilities look quite alarming. How then did public pension programmes get into this
position? Is, it, for example, simply a consequence of the ageing of the OECD
population? The next section suggests that this is not the only, or indeed the primary,
factor.
4. Why have pension liabilities got out of control in so many OECDcountries?
The demographic transition
The standard explanation for the rise in financial liabilities of pension
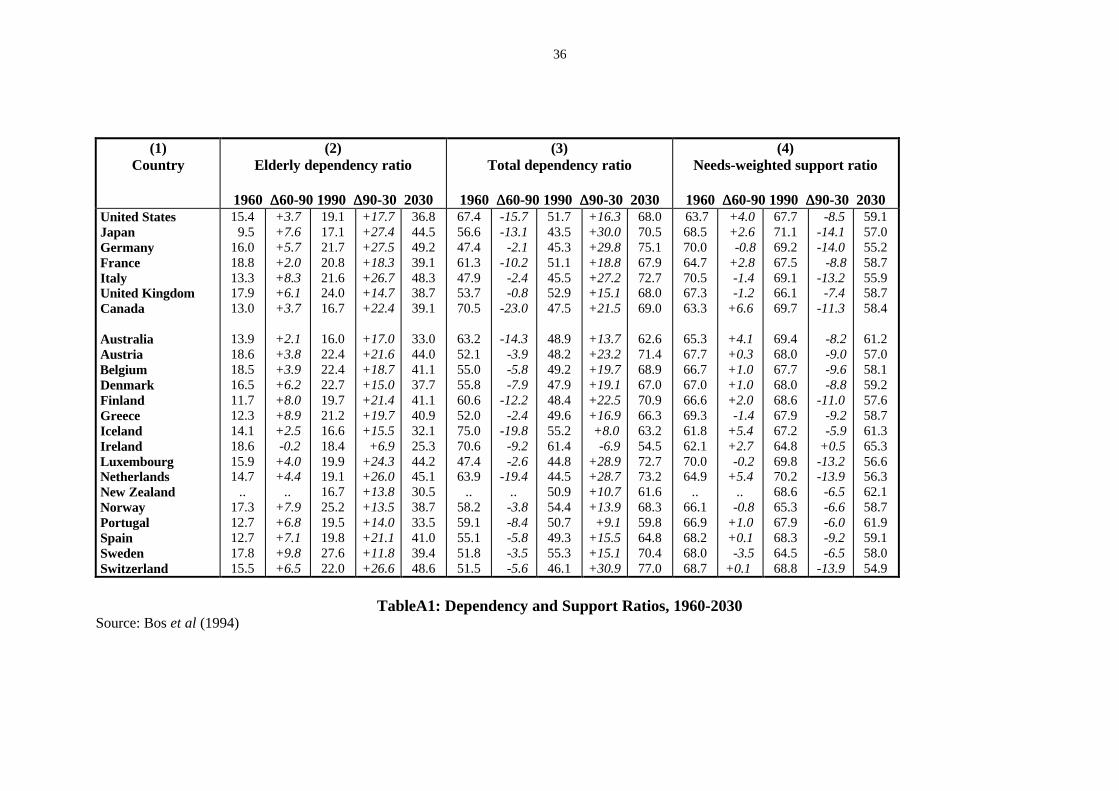
programmes is the ageing of the OECD population. Table A1 at the end of the paper
provides three measures of dependency for most OECD countries: the aged
dependency ratio (ADR) discussed previously, the total dependency ratio (TDR)
which also includes children aged 0-14, and the ‘needs weighted support ratio’
suggested by Cutler et al (1990), which takes account of the fact that the resources
spent on an elderly person may differ from those spent on a child.
5 For dynamic GE models of this type, see, for example, Auerbach and Kotlikoff (1987). See alsoCutler et al (1990). For the UK in particular, see Miles (1998, 1999).6 At the risk of relying on anecdotal evidence, in a middle-income country visited by the author on aWorld Bank mission, published financial statistics contained figures of contribution revenues whichwere obtained by calculating notional employee and employer contribution liabilities. In practice,actual contribution receipts were, in one scheme, only 20% of these liabilities, and many state managedenterprises (SMEs) had not paid employee or employer contributions for years.
10
All countries, with the exception of Ireland, saw a rise in the ADR between
1960 and 1990 and all countries, including Ireland, exhibit further ageing until 2030.
However total dependency ratios, when children are included, generally declined
between 1960 and 1990 although they will rise between 1990 and 2030. A mixed
picture is observed in terms of the adjusted support ratio (where a decline in the ratio
indicates a deterioration). A few countries saw a sharp rise from 1960 to 1990, such
as Canada and Iceland, because of the fall in the share of children in the population.
However, many see double digit declines in the ratio in the 1990-2030 period.
Do these changes in dependency and support ratios tell us anything the
growth of pension commitments, and of future pension liabilities? Figure 1 provides
a simple scatter plot of the share of public pension payments in GDP in 1995 against
the ADR in 1990. The polynomial drawn through the points indicates a weak positive
relationship but there is a good deal of variability in the pension burden relative to the
ADR that is unexplained by demographic structure. Ageing does not seem to be the
sole explanation of which countries have accumulated larger pension obligations
through their public pension programmes.
It might be expected that a stronger (negative) relationship would be observed
between future financial liabilities and projected changes in the weighted support
ratio, since demographic trends are a key factor underpinning the simulated pension
obligations. Figure 2 cross-plots the OECD projections of the growth of net financial
liabilities between 1995 and 2030 on the IBRD/World Bank estimated changes in the
needs-weighted support ratio from 1990 to 2030. As suggested, there appears to be a
negative relationship but, as the labelling illustrates, this is driven by three countries:
Ireland with an improvement in the support ratio and no growth in pension liabilities
and, on the other hand, Japan and, to a lesser extent, Finland, where a rapid

11
deterioration in the support ratio is associated with a rapid rise in financial liabilities.
For the remaining countries, large differences in the demographic projections are
associated with a wide variation in the financial trajectory: ageing per se does not
explain the cross-country variation in current pension programme commitments and
the future deterioration of the fiscal positions.7
The early stages of unfunded pension programmes
For an augmented explanation of the deterioration of the fiscal status of public
pension programmes up to the present time, we have to look at other factors. The first
explanation lies in the initial development of programmes. Although many countries,
especially in Europe and Latin America, developed public pension programmes in the
inter-war period, the full introduction of comprehensive and universal social security
took place after 1945. In the ‘life cycle’ of public pension programmes (as described
in The World Bank, 1994, 315-317), the early years of schemes should be the years in
which contributions are accumulated, assuming that pension entitlement is based on
contributions rather than financed by transfers from the general budget. ‘Sound’
actuarial practice involves the initial accumulation of a fund, to be dissolved at the
maturation of the scheme, even in a scheme which in ‘steady state’ will be unfunded,
in order to avoid rapid rises in contribution rates as the scheme reaches maturity.
Given, too, that the first ‘full’ members of the contributory scheme were members of
a large ‘baby boom’ generation, simple foresight would have strengthened this policy
conclusion to avoid the simultaneous consequences for contribution rates of both
programme maturation and population ageing.
7 A more sophisticated approach might be to break down the changes into the support ratio into theimpact of fertility (size of the cohort entering the labour market), longevity and labour forceparticipation.

12
Although some public pension programmes did initially accumulate funds, and
some of these remain, notably the US Social Security Trust Fund, foresight played
little part in pension policy from the start. Initial trust funds either lost their real value
through dubious investment decisions, or were invested in government securities, so
acting as a cheap source of public credit, or were used to finance higher real pension
commitments. Many governments decide to pay benefits out of the system to existing
people reaching pensionable age even though such people had paid little or nothing in
to the programme. While such intergenerational redistributions could be justified on
welfare grounds - the recipients of such generosity had after all lived through two
world wars and a cataclysmic world recession – such policies destroyed any notional
link between contributions and pension payments across generations, and thus any
form of fiscal responsibility within the programmes.
Falling labour force participation of older men
A pervasive and well known trend across OECD countries has been the
decline in labour force participation of older men (illustrated in OECD, 1996, Charts
4.1 and 4.2).8 The implications of this for the support ratio have been concealed in
many countries by a rise in the participation in paid work of married women. While
participation after state pensionable age is declining largely as a result of pension
programmes themselves, employer and government policies have encouraged such
declines by the use of disability income schemes, relaxation of the rules governing
work seeking behaviour as a condition for receipt of unemployment benefit, the
‘seniority pensions’ described previously, and various other ‘special measures’
(OECD, 1995).
8 For the UK, see Disney et al (1994) and Tanner (1998).
13
Forecasting errors
A somewhat surprising occurrence is that many governments have
systematically underpredicted improvements in longevity and overpredicted future
fertility rates. It is not clear whether these errors arise as a result of incompetence or
are politically motivated. The example of the United Kingdom is interesting,
although it should be emphasised that I select this case merely on the grounds of
proximity and particular knowledge.
Unlike most other OECD countries, the UK has broadly maintained a scheme
of flat benefits since 1946, supplemented by private pension schemes. In 1978,
however, after a long political wrangle, the State Earnings Related Pension Scheme
(SERPS) was introduced, to provide a comprehensive earnings-related pension for
individuals who did not belong to private occupational schemes. Government
Actuary projections of the additional costs of SERPS were only extended to the year
2005 when, with the ‘baby-boom’ generation yet to retire, the scheme looked
affordable. Subsequent projections by Hemming and Kay (1982) and the Department
of Social Security (1984) however took the forecast up to the year 2025, at which
point it became apparent that the scheme would cost a large amount of additional
money. For example, with earnings indexation of the Basic State Pension, the DSS
projected the combined employee and employer contribution rate to rise from 15.9%
in 1985 to 23.2% in 2025 as the scheme matured and the ‘baby boom’ generation
retired. These findings played a large part in the subsequent policies of downgrading
SERPS benefits and encouraging individuals to opt out of SERPS by buying Personal
Pensions (Disney and Whitehouse, 1992).
14
It is remarkable enough that a major pension programme was introduced
without a proper assessment of the costs of the scheme either at its own maturity or at
the maturation of the demographic transition. What is equally interesting is that, since
that time, the official forecast of the number of retirement pensioners in the early part
of the next century has steadily risen, even normalising for changes in the benefit
regime since then. For example, in 1981, the number of retirement pensioners
forecast for the year 2020 was 10.6 million. By 1990, the forecast had risen to 13.4
million. By 1995 (ignoring the equalisation of pension ages for men and women
during the decade 2010 to 2020, which is projected to reduce numbers by 2 million, in
order to keep the calculations on a comparable basis), the figure had risen to 14.4
million; an increase of 36%.9 Thus, had SERPS continued at its existing level of
generosity, the required contribution rate might now be projected to be as high as
31.5%, not 23.2%!
The ‘Ponzi Game’ nature of unfunded social security
The past and projected build up of the financial liabilities of the public pension
programme has in large part depended on the political process underpinning the
accrual of pension commitments by successive generations. To examine this factor in
general terms, it is useful to start by considering the economic analysis that is
normally applied to the problem of how to finance public pension schemes.
A good deal of analysis of the relative merits of funded and unfunded social
security has rested on the scheme satisfying the so-called ‘Aaron-Samuelson’
condition, named after seminal articles by Aaron (1966) and Samuelson (1958).
Samuelson considered an economy where goods were perishable and where people
9 These projections are taken from the successive Quinquennial Reviews of the GovernmentActuary’s Department. The original costings for SERPS are contained in the Report by the

15
sought to retire from producing their own consumption goods later in life. His point
was that individual lifetime utility could be maximised if a ‘social contract’ could be
arranged, so that each generation paid a ‘pension’ to each preceding generation, such
that the implicit return on the contract was equal to the rate of population growth.
Since the return on storing perishable goods was negative and population growth was
likely to be positive, such an ‘unfunded’ scheme could be socially optimal. Aaron’s
generalisation of this ‘rule’ linked the equilibrium ‘return’ on unfunded social security
to the rate of growth of earnings, being the sum of earnings growth per head and the
growth of population. The mechanical application of the ‘condition’, in a world with
capital, would simply compare the rate of return on capital (the return on a funded
scheme) with the return on an unfunded scheme, as derived above. Where the latter
was high, an unfunded scheme was superior to each generation simply relying on its
own saving.
Samuelson’s paper bears careful re-reading, not least where he discusses the
issue of how such a ‘social contract’ can be maintained. It is extremely hard to think
of practical mechanisms by which such contracts can be replicated and implemented
by successive generations, without imposing assumptions about the nature of
transactions costs (Esteban and Sákovics, 1993), or the behaviour of agents (Hansson
and Stuart, 1989). The key point of unfunded social security is that the financing of
accruing liabilities is left to future generations. In that case, it bears much the same
character as the schemes of Charles Ponzi, an originator of the use of chain letters to
raise money.10
In particular, if the initial generation in an unfunded scheme obtains a ‘return’
on its contributions in excess of the Aaron-Samuelson ‘rule’, later generations will
Government Actuary on the financial provisions of the 1975 bill to introduce SERPS.10 See Blanchard and Fischer (1989), note 23, p.84.

16
have to accept lower returns to preserve the stability of the scheme. But it is tempting
for subsequent generations to attempt to maintain the high initial rates of return by
legislating over-generous benefit accruals for themselves, the liabilities for which will
in turn be passed on to subsequent generations. The only constraint on this ratcheting
up of programme liabilities is where a generation believes that a subsequent
generation will simply renege on future commitments made by a prior generation.
Ageing, by making such reneging behaviour more likely given the extra burden it
imposes on workers, may actually make pension reform more likely.11
There is a parallel in all this with the ‘initial conditions’ problem in the public
choice literature, which suggests that ‘excessive’ government spending levels will be
passed on generation by generation, unless credible mechanisms exist to forestall the
build-up of public commitments such as various kinds of policy rules, including
‘balanced budget’ measures, tax ceilings or money supply rules. It is, however, hard
to think of rules of this kind that can induce consistent behaviour in unfunded public
pension programmes. Thus, differences in the build-up of pension obligations in
unfunded schemes across countries largely reflect the presence or absence of
mechanisms which enforce constraints on this short run optimising behaviour.12
5. A Typology of Pension Reforms
Although there are a plethora of reform options on offer for public pension
programmes from different international institutions and governments, it is possible to
construct a basic typology of such reform proposals. Key distinctions are between
11 For an extended argument along these lines, and numerical illustrations, see Disney (1996), Chapter9.12 For example, election platforms in some countries often include promises to increase the generosityof benefit levels, lower the retirement age, and so on. These promises take little account of the futureextra liabilities incurred by such promises, which are rarely explicit in national accounts. A naturalrequirement to inform public debate would be to require that all reform proposals contained explicitaccounts of their impact on future liabilities, and of the generational incidence of such changes.
17
proposals which maintain a strong unfunded element, and those which emphasise the
virtues of a transition to a funded programme. Mixed schemes which contain funded
and unfunded elements, such as the pension programme in the United Kingdom, may
of course offer a plausible ‘half way house’. Indeed, it is hard to find a funded
proposal which does not contain, at the very least, a residual publicly-financed safety
net. Similarly even the harshest critic of fully funded programmes generally accepts
that individuals should have the right to engage in supplementary saving for
retirement in financial assets if they so choose.
A mixed tier or ‘multi-pillar’ approach is central to the reform option
advocated by The World Bank (1994). However, the risk of mixed strategies is that
the pension programme becomes excessively complicated: the United Kingdom, for
example, in which individuals can choose in their second tier mandatory provision
between a public pension benefit (the State Earnings-Related Pension, SERPS), a
company-provided occupational pension, or an individual retirement saving account
(a ‘Personal Pension’), is a case in point. Such choice based systems require a high
degree of transparency and individual knowledge of pension accrual structures (net of
transactions costs) if the risk of people choosing unwisely is to be avoided.13
In what follows, four generic reform strategies are considered. The first two
involve retaining a strong unfunded component. These are denoted a ‘parametric’
reform strategy (after Chand and Jaeger, 1996) and a strategy based on ‘actuarially
fair’ public pension programmes respectively. The second two strategies involve a
strong funded private component and are denoted as a ‘clean break’ privatisation and
a ‘partial’ privatisation. In the latter case, where not all individuals join the privatised
13 As the Personal Pension ‘mis-selling’ scandal has illustrated.

18
programme, a key issue is whether it is the government or individuals themselves that
decide who can join the private funded scheme.
A ‘parametric’ reform of the unfunded programme
Chand and Jaeger denote a reform of this type as ‘parametric’ because,
presumably, the key choice variables of an unfunded scheme can indeed be written
down as a function of a few parameters. In the standard approach to financing an
unfunded pension programme, define B = number of beneficiaries, L = number of
workers, w = average wage rate, p = average pension and c = contribution rate. Then,
equilibrium requires that c = (B/L)(p/w) where (B/L) is the inverse of the support
ratio and (p/w) is the average replacement rate. Clearly to reduce c (or to avoid
growing debt if c is fixed by, say, law at below its equilibrium level) requires any of,
or a combination of, reducing p or B, or raising w or L.
Increasing the support ratio requires either reducing B, for example by raising
the state pensionable age or reducing entitlements for dependents, or raising L by, for
example, increasing the proportion of the working age population that is economically
active (this may include cutting back early retirement and other ‘routes’ to inactivity
such as disability benefits). Reducing the replacement rate means either reducing
benefits directly or indirectly by reducing the generosity of post-retirement indexation
procedures, or raising eligible wages by for example increasing the fraction of the
wage, or the wage bill, that is liable to pay contributions.
Various simulations of ‘parametric’ reforms of this type, for a number of
OECD countries, have been carried out by international organisations, such as in
Chand and Jaeger (1996), with a view to examining their impact on fiscal liabilities.
They are (or should also be) standard in projections carried out by official actuaries

19
when estimating the sensitivity of the future costs of pension programmes to changes
in baseline assumptions. Most such simulations find that the key parameter in
determining fiscal liabilities is the state pensionable age (often equated with the
‘retirement age’ in such calculations). Raising state pensionable age, or perhaps more
specifically linking it explicitly to expected longevity, is generally a key policy in
‘parametric’ reforms to the problem of financing public pension programmes. Such
policies are increasingly being adopted in a number of OECD countries.14
Although such policies are uncontroversial from an economic point of view
(although rarely so from a political perspective), the problem lies in modelling gains
from them. A key objection to analyses of the gains, in terms of the projected
reductions in fiscal liabilities, is that retirement behaviour is rarely modelled explicitly
in such simulations (as indeed in the equating of ‘retirement’ with the first age of
receipt of benefits from the public pension programme). While raising state
pensionable age does indeed reduce the denominator of the support ratio directly, the
indirect impact on the number of beneficiaries is far from clear. Employment rates in
the years prior to reaching state pensionable age are well below 100% in most OECD
countries, and simply raising state pensionable age still further may not necessarily
increase participation rates, let alone employment rates, among older workers. If
these extra people below pension age thereby end up on unemployment or disability
benefits, or other forms of welfare support, these costs will offset in budgetary terms
the ‘gain’ in the reduction in the number of explicit beneficiaries of the public pension
programme. Estimates of the benefits of ‘parametric’ reforms which do not model
these behavioural effects directly are systematically biased in favour of finding large
14 In the UK, for example, state pensionable age for men and women will be equalised at 65 between2010 and 2020. In the US, the age of full entitlement is to be raised to 67 years by 2020, and Italy isincreasing its male retirement afe to 65 in the year 2000. Other examples are given in OECD (1998),Figure IV.1.

20
reductions in fiscal liabilities from such reforms precisely because they treat as
parameters what are, in fact, behavioural variables.
An ‘actuarially fair’ unfunded programme
A second broad strategy for reform of an unfunded programme which leaves
the financing strategy intact, is to explicitly link benefits and contributions, by
generation, to the Aaron-Samuelson sustainable ‘return’ to an unfunded scheme.
Such a strategy, in general terms, calculates what is the sustainable implicit ‘rate of
return’ on the contributions of each cohort of contributors, given the projected growth
or decline in the real contribution base, and then sets the accrual rate of pensions such
that this return is, on average, realised. This policy lies behind the so-called ‘Dini
reform’ of the Italian programme in the mid-1990s, and behind the public assertion
that such a reform puts the programme on an ‘actuarially fair’ basis.
Since ‘actuarial fairness’ also involves questions of redistribution within
generations, or cohorts, such a reform has to include subsidiary but important
modifications of plans: towards, for example, an average lifetime basis for calculating
pension entitlements rather than a ’final salary’ basis (which will obviously induce
some variation in outcomes if earnings profiles are subject to volatility). At its
‘logical’ extreme, in the so-called ‘notional accounts’ variant of this strategy, each
individual pension is supposed to be explicitly based on contributions such as to
minimise inter-individual variation in returns. In the current Swedish reform, and in
similar reforms elsewhere, such as Latvia, each individual is given a ‘notional
account’ within the public pension programme, just like a funded retirement saving
account (with the important difference, of course, that the accounts are not funded)
and, with linear accrual structures, the incremental accrual of pension benefits should

21
be transparent. Post-retirement indexation arrangements are linked explicitly to
changes in demographics (such as any improvement in longevity) and to other
changes in the growth of the wage bill.
Implicit in a reform of this type is that the failures of unfunded programmes up
to now arise because of their lack of transparency and from their inability to apply a
rigid formula linking returns to the Aaron-Samuelson condition. These policies would
have minimised arbitrary redistributions arising from the vagaries of the benefit
formula and political processes, it is argued. Since this reform strategy is currently
rather fashionable, a few difficulties need to be pointed out. First, there are still no
plausible enforcement mechanisms to guarantee that the ‘Aaron-Samuelson’ condition
for equilibrium in an unfunded programme will be satisfied in the future. In the
Italian reform, much of the generational burden of shifting to this formula-based
approach falls on younger generations. There has been a conspicuous lack of success
in the Italian reform in cutting back pension benefits in the immediate future, whereby
the burden would fall on prime age and older generations. In the Swedish or Latvian-
style reform, ingenious adjustment of the pension indexation formula will be used to
keep the fiscal outcome ‘on track’. Suppose, however, that an improvement in
longevity is combined with a temporary recession such that the real wage bill growth
becomes zero. Irrespective of, say, inflation, nominal pensions will be held constant.
Politically, such an outcome seems unlikely - even the UK automatically indexes
benefits to inflation. There is likely to be a ratchet effect by which, when the wage
bill rises faster than trend, pension are raised more rapidly but, where wage bill
growth falls below ‘headline’ indicators such as the rate of inflation, pensions are
raised in line with inflation. As a result, fiscal liabilities will continue to grow
relatively rapidly.

22
Finally, by attempting to eliminate much of the redistribution inherent in
unfunded schemes, so as to make the benefit-contribution link ‘transparent’, much of
the rationale for the public programme is destroyed. Public programmes inherently
redistribute: from poor to rich (because the poor die younger), from men to women,
from married couples to widows, and from the rest to the very poorest through benefit
‘floors’. Moreover, explicit ‘returns’ to such accounts can automatically be compared
by participants with the much higher returns to be obtained in marketed private
savings accounts. Will individuals be willing to contribute to a programme which
may well explicitly offer a negative return on contributions to later generations (see,
for example Disney and Whitehouse, 1993) while observing possible double digit
nominal returns on private saving accounts? It is not overly cynical to suggest that it
is the lack of transparency of unfunded public pension schemes, coupled with their
undoubted insurance-based and redistributive component, that encourages people to
contribute to such programmes. Greater ‘transparency’ only makes their inadequacies
more transparent, and the programmes less attractive.
‘Clean Break’ Privatisation
The alternative strategy to ‘fixing up’ the unfunded pension programme is to
replace all or part of it with a funded programme. Such an approach has not been
implemented explicitly in OECD countries – the nearest variants being the
introduction of mandatory superannuation in Australia in 1992, and the 1986 reform
in the UK, which downgraded SERPS and allowed individuals to ‘opt out’ of that part
of the programme into an individual retirement savings account known as a ‘Personal
Pension’. The latter reform is however more appropriately considered under the next
sub-heading.

23
While in principle the government can introduce or extend its own managed
funded component to the public programme, a generic transition to a funded
programme is almost certain to include a private component, and thus I refer to this as
a privatisation option. The big objection to allowing the government to organise the
funded programme itself is that it is extremely difficult to ‘ring fence’ the public
pension fund from other components of the government budget. Suppose, for
example, as in the United States, that the assets of the public pension programme’s
‘trust fund’ are held in the form of government securities. Insofar as the purchase of
government securities by the fund permits the government to increase its own
liabilities by, for example, increasing its spending uncovered by tax receipts, then the
growth of government liabilities matches the growth of government assets held by the
fund. The funded and unfunded programmes are then equivalent in their generational
incidence (Kotlikoff, 1992).15 For this reason I consider only a funded option which
is combined with privatisation.
The most well-known full scale privatisation of a public pension programme
is that which took place in Chile in November 1980 (see Edwards and Edwards, 1991;
Edwards, 1998), which has been copied in a number of Latin American countries and
elsewhere. Some influential commentators are advocating reforms of this kind in
OECD countries (Börsch-Supan, 1998; Feldstein, 1996, 1998).
The attractions of full funding of the programme are as follows. First, the real
return on funding almost always exceeds the ‘Aaron-Samuelson’ return on unfunded
schemes (see Table 1 in Blake, this issue), even if one can argue over the appropriate
15 This is of course a whole sub-debate in the literature. What would happen, for example, if we let thegovernment pension fund hold equities and other private sector assets? This would imply that otherprivate asset holders would own a greater fraction of government securities while the governmentwould hold a greater share of the equity market. The effect of this on portfolio values depends on whatwe assume about financial markets. There is also the rather obvious question of whether thegovernment is a better fund manager than the private sector.

24
private rate of return to use.16 Second, a funded scheme is transparent, not in the
rather artificial sense of ‘notional accounts’, but in the real sense that benefits are
explicitly related to contributions and capital market performance rather than to some
formula of the public programme. In contrast, contributions to an unfunded public
pension programme inevitably contain a tax component, which distorts labour supply
and savings behaviour relative to saving in a funded programme. Note that this tax
distortion has two dimensions: first, individuals are forced to buy a given level of
longevity insurance (pensions) at an excessive cost given the low return to the
unfunded scheme and second, benefits do not match contributions across individuals
and thus there are arbitrary transfers of income across contributors. Feldstein (1998,
‘Introduction’) has estimated the former loss at 1% of GDP in the United States,
which is very large relative to most ‘welfare triangles’ that have been calculated for
related exercises.
In a ‘clean break’ privatisation of the pension programme, no further
contributions are made into the existing unfunded programme. All new contributions
after privatisation are made to the insurance companies or group providers and are
assigned to individual pension accounts. In contrast, the liabilities of the unfunded
programme, which comprise both existing and projected payments to current
pensioners and the accrued pension rights of those who have not yet retired within the
unfunded programme, have then to be financed by some means. This is the crux of
the funding transition problem: the implicit liabilities of the existing programme then
become explicit and are supplemented by the additional liabilities arising from the
transfer of all future contributions to the new, funded, scheme. Of course, the assets
of the new funded programmes may match, or be less than or more than, the
16 For example, the rate should account for transactions costs in establishing funded accounts, net outthe risk premium and adjust for tax liabilities.

25
additional liabilities arising from the future cessation of contributions to the unfunded
programme. As in Chile, one of the main purchasers of the extra liabilities of the
government may be the new pension funds so the ‘extra’ financing liability is offset,
at least partially. Nevertheless, the immediate impact of privatisation is an explicit
jump in the liabilities of the public sector and, to those that do not like large public
sector liabilities, such as the IMF, this issue seems to be the insurmountable hurdle of
privatisation (Chand and Jaeger, 1996).
There are, however, several ways of handling the transition issue. One is
simply to accept the extra explicit burden of public liabilities and a higher perpetual
burden of interest payments on the debt. Chand and Jaeger (1996), Table 18,
estimate the increase in pension liabilities from this strategy in a range of industrial
countries to be on average 152% of 1995 GDP, of which 60% would arise simply
from making explicit existing unfunded liabilities which are not currently covered by
legislated contribution rate increases. It would be possible, in principle, to model
heroically the implications of this for real interest rates under various assumptions.
The second alternative is to have an explicit transition finance strategy that
effectively involves establishing a generational incidence of the transition burden.
For example, Kotlikoff, in Feldstein (1998), uses the Auerbach-Kotlikoff (1987) GE
model to examine a transition to full funding in the US economy which contains three
transition-financing ‘scenarios’: ‘lump sum’ transfers to compensate losing
generations, a transition funded by a rise in income tax rates, and a consumption
(expenditure) tax-financed transition. The latter gives the strongest aggregate welfare
gain in the model simulations. Another transition strategy, where the generational
incidence is less clear, is where the liabilities are in part financed by higher budget
surpluses over a substantial period. These are achieved by, say, cutting public capital

26
spending or by privatisation of public assets. In the long run, the economy will have a
higher stock of private assets in the pension funds and a lower stock of public assets;
the welfare consequences of such a transition are more difficult to evaluate without
knowledge of the incidence of the benefits from publicly-owned assets.
Another common objection to a funded solution is that it rules out any explicit
redistributional component to the public pension programme. While elimination of
arbitrary redistribution may be desirable between generations, it reduces the equity
component of such programmes within generations. A particular problem is that, in
the face of transactions costs, persistent low income earners may be able only to earn
very low pensions with their contributions. An obvious solution is for the government
to provide a safety net or some explicit minimum pension guarantee within the funded
programme. However the costs of the safety net have to be added to the fiscal
liability of the programme, and generous guarantees may encourage low income
contributors to opt out (either formally, if permitted, or informally, if the scheme is
compulsory). Such non-participants may reason that the returns on their
contributions, less the deduction of the public guaranteed payment that will obtain if
they can raise their pension by saving, make continued contribution to the programme
unprofitable. This is a trade-off which has to be evaluated explicitly in the
privatisation route.
A third argument often presented against funded schemes of this kind is that
they subject participants to investment risk. I would rather restate this as suggesting
that funding replaces potential political risk with potential investment risk. Evaluating
the relative importance of different types of risk of this kind is problematic. It can be
argued, for example, that an explicit funded strategy allows the individual to diversify
risk: the observation that equity markets are ‘risky’ is an irrelevance to the debate.

27
The key questions are: whether, by adding a portfolio of market assets to his or her
pension ‘portfolio’, the individual can thereby reduce the prospective ‘riskiness’
attached to his or her future pension and, additionally, whether the market can provide
types of insurance against annuity risk arising from the volatility of markets. Simply
asserting that a funded pension is ‘risky’ because it may be (in part) invested in
equities is an erroneous form of reasoning.
There are, however, more plausible difficulties associated with investment
risk, which need, at the very least, low cost technical solutions. One is the process of
annuitisation itself, which will imply a change in the portfolio holding of the
individual as the accumulated fund is converted into an annuity stream. If the point of
conversion is simultaneous with an adverse outcome arising from market volatility,
the annuity stream will be of lower value. However, deferral of annuitisation in such
circumstances raises a real problem of adverse selection. In general, the annuity
market itself, which may have been rather thin prior to the decision to privatise a
component of the pension programme, may have more general adverse selection
problems and may need careful regulation. These issues are further discussed in
David Blake’s paper in this issue.
Partial Privatisation
A proposal which has gained recent attention is to privatise the programme
partially. ‘Partial’ in this context means not just the possibility of maintaining an
unfunded component to the programme as a whole. Other possibilities include only
allowing certain individuals to join the funded scheme, or alternatively of allowing
individuals the choice of joining a funded or unfunded programme. The latter is
illustrated by the current UK scheme, in which individuals can choose to remain in

28
SERPS (the unfunded component of the programme) or to invest part of their
National Insurance contribution in a Personal Pension. The former is illustrated by
‘Basic Pension Plus’, proposed by the Conservative administration before the 1997
General Election, by which the basic state pension was to be replaced by a funded
programme for each new cohort entering the labour market. Other countries that have
used partial privatisations, which either include a voluntary element, or a cohort-
specific transition, include Argentina and Hungary.
The essential point of such a reform is that it reduces or spreads the transition
costs more widely. If only younger workers enter the funded programme (whether
through compulsion or choice), they can obtain reasonable pensions on retirement by
the simple effect of compound interest on their accumulating fund. At the same time,
if earnings rise with age, the initial transition cost of their foregone contributions to
the public unfunded programme is low. Over time, the value of foregone
contributions rises but, of course, the fiscal liability will also peak. In contrast, in a
‘clean break’ privatisation, the cost of attempting to replicate the generosity of the
‘defined benefit’ programme for all participants may involve an immediate large
increase in financial liabilities, as has been shown previously.
A different problem emerges with partial privatisation if there are large
within-generation variations in funded returns, for example due to transactions costs,
or differences in individual entitlements in the unfunded programme. Suppose
participation is voluntary. It is possible, for example, that all rich people within a
cohort might opt to join the private programme while all poorer people opted to stay
in the unfunded scheme, especially if the unfunded programme contained various
explicit redistributive elements such as benefit ceilings or non-linear benefit accrual
rates with income (the extreme example of which is a flat component to benefits).

29
This generates a standard adverse selection problem, and in addition the existence of
the funded option limits the capacity of the unfunded scheme to redistribute within
generations. On the other hand, mandating that only certain individuals can join the
funded scheme (differentiated for example by age) may lead to conflict, especially if
it becomes apparent that returns to the funded scheme are well in excess of those to
the unfunded scheme, so making the funded option attractive to a much wider group
of people. There is also the simple point in voluntary privatisations, such as the UK,
that many people misunderstand accrual structures and therefore make ‘incorrect’
choices.
6. Conclusion
The preceding discussion has suggested that public pension programmes have
generated excessive financial liabilities for a number of reasons, of which the ageing
of the population is only one among several reasons. There are a number of solutions
on offer but, not surprisingly, they all have weaknesses. There are some obvious
reforms that can be carried out within existing unfunded schemes, although a switch
to a scheme of ‘notional accounts’ would seem to be an unnecessary complication
and, ultimately, a dead end. The long run solution seems to involve a strong funded
element, but the transition costs have to be handled carefully and partial strategies
need to take particular care as to their distributional consequences and potential for
complexity.
The UK has not been treated as a specific case study in this analysis, although
it will be apparent both from the calculations of fiscal liability and reference to funded
reforms in the last section that the fiscal status of the public pension programmes in
the UK is not a cause for concern. This low fiscal liability arises because benefits in

30
the UK’s unfunded scheme are predominantly flat benefits, indexed to inflation, and
because the UK has gone a long way down the funded route given its strong
occupational pension sector and the introduction of Personal Pensions. However, the
cost of this transition has been to deliver an over-complicated scheme of choice-based
funded and unfunded provision that probably needs to be rationalised. Thus reform of
pension provision remains a controversial issue in the UK, as in many other countries,
and is likely to be so for the forseeable future.

31
Bibliography
Aaron, H.J. (1966) The social insurance paradox, Canadian Journal of Economics,32, August, 371-374.
Auerbach, A.J. and Kotlikoff, L.J. (1987) Dynamic Fiscal Policy, Cambridge:Cambridge University Press.
Blanchard, O.J. and Fischer, S. (1989) Lectures on Macroeconomics, Cambridge:MIT Press.
Börsch-Supan, A. (1998) Germany: A social security system on the verge of collapse,129-160 in H. Siebert (ed) Redesigning Social Security, Proceeding of Kiel WeekConference 1997, Tübingen: Mohr Siebeck
Bos, E., Vu, M.T., Massiah, E. and Bulatao, R. (1994) World Population Projections,1994-94, IBDR/World Bank, Washington.
Bovenberg, L. and Petersen, C. (1992) Public debt and pension policy, Fiscal Studies,13, August, 1-14.
Chand, S.K and Jaeger, A. (1996) Aging Populations and Public Pension Schemes,Occasional Paper No. 147, International Monetary Fund, Washington D.C.
Cutler, D.M., Poterba, J.M., Sheiner, L.M. and Summers, L.H. (1990) An ageingsociety: Opportunity or challenge? Brookings Papers on Economic Activity, 1, 1-73.
Department of Social Security (1984) Population, pension costs and pensioners’incomes, mimeo, London.
Disney, R. (1996) Can We Afford to grow Older: A Perspective on theEconomics ofAging, Cambridge: MIT Press.
Disney, R., Meghir, C., and Whitehouse, E. (1994) Retirement behaviour in Britain,Fiscal Studies, 15, February, 24-43.
Disney, R. and Whitehouse, E. (1992) The Personal Pension Stampede, London:Institute for Fiscal Studies.
Disney, R. and Whitehouse, E. (1993) Will younger cohorts obtain a worse deal fromthe UK state pension scheme? 85-103 in J. Creedy and M. Casson (eds) IndustrialConcentration and Economic Inequality, Aldershot: Edward Elgar.
Edwards, S. (1998) ‘The Chilean pension reform: A pioneering program’ in M.Feldstein (ed) Privatizing Social Security, Chcicago: Chicago University Press.
Edwards, S. and Edwards, A. (1991) Monetarism and Liberalization: The ChileanExperiment, 2nd Edition, Chicago: Chicago University Press.
32
Esteban, J.M. and Sákovics, J. (1993) Intertemporal transfer institutions, Journal ofEconomic Theory, 61, 189-205.
Feldstein, M. (1996) The missing piece in policy analysis: social security reform,American Economic Review Papers and Proceedings, 86, May, 1-14.
Feldstein. M. (1998) (ed) Privatizing Social Security, Chicago: Chicago UniversityPress.
Hansson, I. And Stuart, C. (1989) Social security as trade among living generations,American Economic Review, 79, December, 1182-1195.
Hemming, R. and Kay, J.A. (1982) The costs of the state earnings-related pensionscheme, Economic Journal, 92, June, 300-319.
Kotlikoff, L. (1992) Generational Accounting, New York: Free Press.
Miles, D. (1998) The reform of pensions systems in the UK and Germany: Winnersand losers across the generations, mimeo, Imperial College, London.
Miles, D. (1999) Modelling the impact of demographic change on the economy,forthcoming, Economic Journal, 109, January.
OECD (1995) The Transition from Work to Retirement, Social Policy Studies No. 16,Paris.
OECD (1996) Ageing in OECD Countries: A Critical Policy Challenge: Social PolicyStudies No. 20, Paris.
OECD (1998) Maintaining Prosperity in an Ageing Society, Paris.
Roseveare, D., Leibfritz, W., Fore, D. and Wurzel, E. (1996) Ageing populations,pension systems and government budgets: simulations from 20 countries, EconomicsDepartment Working Paper No. 168, OECD: Paris.
Samuelson, P.A. (1958) An exact consumption-loan model of interest with or withoutthe social contrivance of money, Journal of Political Economy, 66, December, 467-482.
Tanner, S. (1998) The dynamics of male retirement behaviour, Fiscal Studies, 19,May, 175-196.
The World Bank (1994) Averting the Old Age Crisis: Policies to Protect the Old andPromote Growth, Oxford: Oxford University Press.
33
(1)Country
(2)Standard age of
Entitlement to pension(men/women)
(3)Public pension
payments as % ofGDP
1995 2030
(4)Present value of
contributions lesspension expenditure
as % of GDP
(5)Net financial liabilities
as % of GDP1995 2030
(6)Increase in tax/GDPratio required to keep
net debt constant2005 2030
United States Japan Germany France Italy United Kingdom Canada
Australia Austria Belgium Denmark Finland Greece Iceland Ireland Luxembourg Netherlands New Zealand Norway Portugal Spain Sweden Switzerland
65606560606565
65656567656567666565616765656565
65586560556065
60606067656067666565616762656562
4.1 6.611.110.613.3 4.5 5.2
2.6 8.810.4 6.810.1 ..
2.5 3.6 ..
6.0 5.9 5.2 7.110.011.8 ..
6.613.416.513.520.3 5.5 9.0
3.814.413.910.917.8 .. 4.2 2.8 ..11.2 8.310.913.014.115.0 ..
-23.0 -70.0 -61.6-102.1 -59.7 -23.8-100.7
-96.7 -92.5-152.6-234.5 -64.8
.. -66.2 -17.8
.. -53.3-212.8-124.1-109.2-108.6-132.3
..
51 11 44 35109 40 70
28 50128 46 -7 .. 35 86 .. 43 ..
-26 71 50 28 ..
95317216165234137 -27
10317 77 34 98 .. 69 83 ..185 .. -57170159 78 ..
-0.3 3.5 2.8 0.8 1.8 1.7 -3.2
-1.3 3.8 -2.0 -1.9 -1.4 ..
-0.3 -0.3 ..
0.8 ..
-2.7 0.5 0.9 -0.6
..
5.3 9.6 9.7 7.111.4 3.5 3.6
2.415.4 5.9 3.8 8.8 ..
4.3 1.8 ..
9.0 ..
3.8 8.2 7.4 4.0 ..
Table 1: OECD Estimates of financial liabilities of public pension programmes 1995-2030

34
Key to Table 1:
(2) Standard age of first entitlement to state pension, in 1992, Source OECD(1996).(3) Source: Roseveare et al (1996) Table 3; OECD (1998), Table 2.3.(4) The net present value of employer and employee contributions to 2070, net of future pension liabilities and less existing assets.
As % of 1994 GDP. Assumed productivity growth 1.5% p.a.; at discount rate of 5% p.a. Source: Roseveare et al (1996) Table 1; OECD (1996) Table 2.2.(5) Existing revenues and expenditures held constant as % of GDP; scenario in (3) and (4) for pension expenditure; health care costs assumed to grow in line with GDP but health care cost-age ratio maintained as at present. Net interest payments are then added, and the real interest rate is assumed to reflect (and track) GDP growth. Source: Roseveare et al (1996).(6) Source: Roseveare et al (1996), Table 6; OECD (1996), Table 5.3.
35
Net Public Debt atEnd 1994
Net PensionLiability
1995-2050
Combined Net DebtLiability
Primary Balance1995
Sustainable Primary balancerequired to:
Stabilise Stabilise netnet public public debtdebt in and prevent1995 build-up of public debt
Adjustment neededin primary balance
for fiscalsustainability
United States Japan Germany France Italy United Kingdom Canada Sweden
63.3 33.2 52.5 42.4112.9 37.7 71.6 54.5
25.7106.8110.7113.6 75.5 4.6 67.8 20.4
89.0140.0163.2156.0188.4 42.3139.4 74.9
0.4 -0.2 2.4 -0.3 3.3 0.4 0.2 -5.1
1.10.31.10.72.10.72.70.1
1.93.64.54.04.60.84.71.0
1.53.82.14.31.30.44.56.1
Table 2: Net Pension Liabilities and Sustainability of Fiscal Stance (as % of GDP)
Source: Chand and Jaeger (1996) Table 8
36
(1)Country
(2)Elderly dependency ratio
1960 ∆∆60-90 1990 ∆∆90-30 2030
(3)Total dependency ratio
1960 ∆∆60-90 1990 ∆∆90-30 2030
(4)Needs-weighted support ratio
1960 ∆∆60-90 1990 ∆∆90-30 2030 United States Japan Germany France Italy United Kingdom Canada
Australia Austria Belgium Denmark Finland Greece Iceland Ireland Luxembourg Netherlands New Zealand Norway Portugal Spain Sweden Switzerland
15.4 9.516.018.813.317.913.0
13.918.618.516.511.712.314.118.615.914.7
..17.312.712.717.815.5
+3.7+7.6+5.7+2.0+8.3+6.1+3.7
+2.1+3.8+3.9+6.2+8.0+8.9+2.5 -0.2+4.0+4.4
..+7.9+6.8+7.1+9.8+6.5
19.117.121.720.821.624.016.7
16.022.422.422.719.721.216.618.419.919.116.725.219.519.827.622.0
+17.7+27.4+27.5+18.3+26.7+14.7+22.4
+17.0+21.6+18.7+15.0+21.4+19.7+15.5 +6.9+24.3+26.0+13.8+13.5+14.0+21.1+11.8+26.6
36.844.549.239.148.338.739.1
33.044.041.137.741.140.932.125.344.245.130.538.733.541.039.448.6
67.456.647.461.347.953.770.5
63.252.155.055.860.652.075.070.647.463.9
..58.259.155.151.851.5
-15.7-13.1 -2.1-10.2 -2.4 -0.8-23.0
-14.3 -3.9 -5.8 -7.9-12.2 -2.4-19.8 -9.2 -2.6-19.4
.. -3.8 -8.4 -5.8 -3.5 -5.6
51.743.545.351.145.552.947.5
48.948.249.247.948.449.655.261.444.844.550.954.450.749.355.346.1
+16.3+30.0+29.8+18.8+27.2+15.1+21.5
+13.7+23.2+19.7+19.1+22.5+16.9 +8.0 -6.9+28.9+28.7+10.7+13.9 +9.1+15.5+15.1+30.9
68.070.575.167.972.768.069.0
62.671.468.967.070.966.363.254.572.773.261.668.359.864.870.477.0
63.768.570.064.770.567.363.3
65.367.766.767.066.669.361.862.170.064.9
..66.166.968.268.068.7
+4.0 +2.6 -0.8 +2.8 -1.4 -1.2+6.6
+4.1+0.3+1.0+1.0+2.0 -1.4+5.4+2.7 -0.2+5.4
.. -0.8+1.0+0.1 -3.5
+0.1
67.771.169.267.569.166.169.7
69.468.067.768.068.667.967.264.869.870.268.665.367.968.364.568.8
-8.5-14.1-14.0 -8.8-13.2 -7.4-11.3
-8.2 -9.0 -9.6 -8.8-11.0 -9.2 -5.9 +0.5-13.2-13.9 -6.5 -6.6 -6.0 -9.2 -6.5-13.9
59.157.055.258.755.958.758.4
61.257.058.159.257.658.761.365.356.656.362.158.761.959.158.054.9
TableA1: Dependency and Support Ratios, 1960-2030Source: Bos et al (1994)
37
Figure 1
Aged Dependency Ratio and Public Pension Payments as % of GDP, 1990/95
10
15
20
25
30
0 5 10 15Payments as % of GDP
Age
d D
epen
denc
y R
atio
Figure 2
Change in support ratio and change in financial liabilities 1995-2030
-16
-14
-12
-10
-8
-6
-4
-2
0
2
-5 0 5 10 15 20 25 30
Change in liabilities
Cha
nge
in s
uppo
rt r
atio
Japan
Finland
Ireland
Germany
Netherlands
Austria