Embed Size (px)
Citation preview

Semester One Final Examinations, 2016 STAT2201 Analysis of Engineering and Scientific Data
This exam paper must not be removed from the venue
School of Mathematics & Physics
EXAMINATION – Illustration of Structure, Formula and Tables Semester One Final Examinations, 2016
STAT2201 Analysis of Engineering and Scientific Data This paper is for St Lucia Campus students.
Examination Duration: 120 minutes
Reading Time: 10 minutes
Exam Conditions:
This is a Central Examination
This is a Closed Book Examination - no materials permitted
During reading time - write only on the rough paper provided
This examination paper will be released to the Library
Materials Permitted In The Exam Venue:
(No electronic aids are permitted e.g. laptops, phones)
Calculators - Any calculator permitted - unrestricted
Materials To Be Supplied To Students:
none
Instructions To Students:
Additional exam materials (eg. answer booklets, rough paper) will be provided upon request.
ForExaminerUseOnly
Question Mark
1a
1b
1c
1d
2a
2b
2c
2d
3a
3b
3c
3d
4a
4b
4c
4d
Total ________

Semester One Final Examinations, 2016 STAT2201 Analysis of Engineering and Scientific Data
Instructions
The exams consists of 4 questions, 1-4. Each question has four items, a-d.
Within each question:
Item (a) carries a weight of 8 marks.
Item (b) carries a weight of 7 marks. Item (c) carries a weight of 6 marks.
Item (d) carries a weight of 4 marks.
The total marks in the exam are 100.
Answer ALL questions in the spaces provided. If more space is required, use the back of the PREVIOUS page.
Show all your working and include sketches where appropriate.
Work written in the Formulae and Tables section will NOT be marked.

Semester One Final Examinations, 2016 STAT2201 Analysis of Engineering and Scientific Data
Formulae and Tables
SummaryStatistics:
Suppose ( ) ( )221
221 ,~,,, and ,~,,, XXmYYn NXXXNYYY σµσµ !! aretwoindependent
samples.Thesamplemeansandsamplevariancesarerespectively,
∑=
=n
iiYn
Y1
1 ( )2
1
2
11∑=
−−
=n
iiY YY
nS ,
∑=
=m
iiXm
X1
1 ( )2
1
2
11∑=
−−
=m
iiX XX
mS .
Notethat,2
1 1
22 )()( YnYYYn
i
n
iii∑ ∑
= =
−=− .
The(two-sample)pooledsamplevarianceis ( ) ( )211 22
2
−+
−+−=
mnSmSnS XY
P .
TheECDFfunctionis: ∑=
≤=n
ii tY
ntF
1
}{11)( .
SamplingDistributions:
Zn
Y
Y
Y ~σ
µ− 1~ −
−n
Y
Y tnS
Y µ ( ) ( )
YXmnmnP
XY tSXY
σσµµ
=+
−−−−+ if ~ 211
.
ConfidenceIntervalsfortheMean:
If Yσ isknown,use ( )nzy Yσ*± .
If Yσ estimatedby Ys ,use ( )nsty Y*± .
ConfidenceIntervalsfortheDifferenceinMeansforIndependentSamples:
If Yσ and Xσ areknown,use ( )⎟⎟
⎠
⎞
⎜⎜
⎝
⎛+±−mn
zxy XY22
* σσ .
If Yσ and Xσ areunknownbutassumedequal,use ( ) ⎟⎟⎠
⎞⎜⎜⎝
⎛+±−mn
stxy P11* .
Semester One Final Examinations, 2016 STAT2201 Analysis of Engineering and Scientific Data
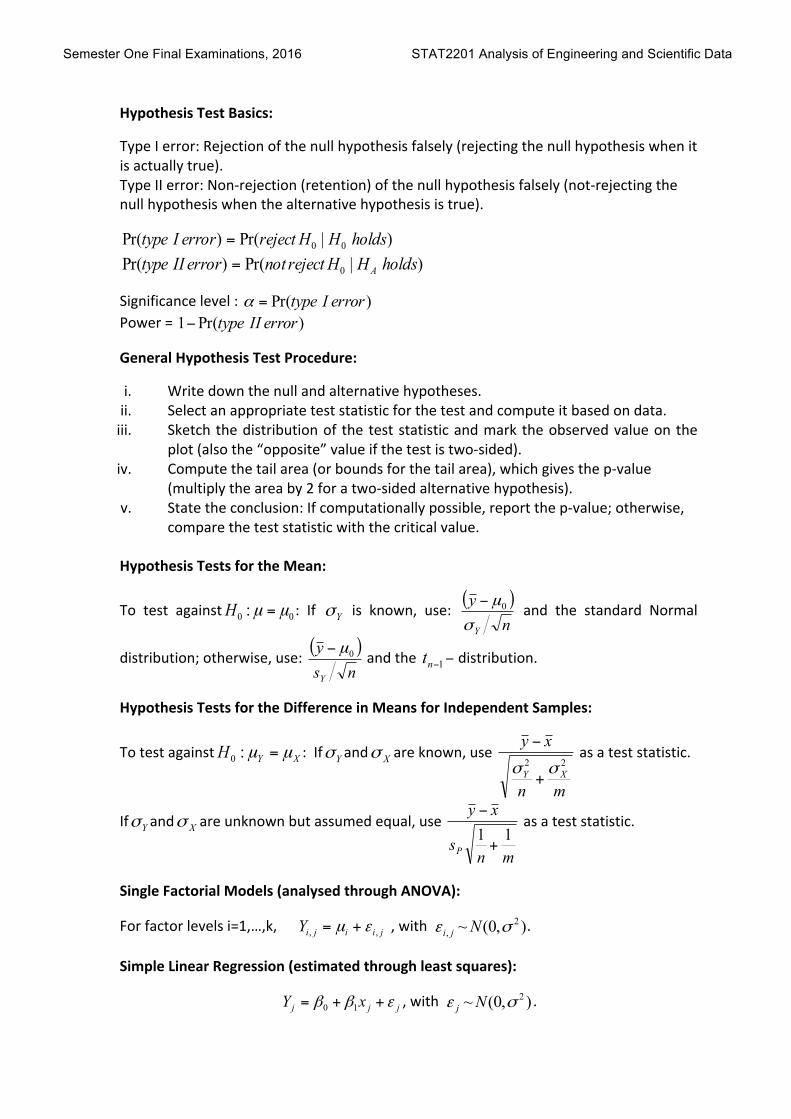
HypothesisTestBasics:
TypeIerror:Rejectionofthenullhypothesisfalsely(rejectingthenullhypothesiswhenitisactuallytrue).TypeIIerror:Non-rejection(retention)ofthenullhypothesisfalsely(not-rejectingthenullhypothesiswhenthealternativehypothesisistrue).
)|Pr()Pr( 00 holdsHHrejecterrorItype = )|Pr()Pr( 0 holdsHHrejectnoterrorIItype A=
Significancelevel: )Pr( errorItype=α Power= )Pr(1 errorIItype−
GeneralHypothesisTestProcedure:
i. Writedownthenullandalternativehypotheses.ii. Selectanappropriateteststatisticforthetestandcomputeitbasedondata.iii. Sketchthedistributionof theteststatisticandmarktheobservedvalueonthe
plot(alsothe“opposite”valueifthetestistwo-sided).iv. Computethetailarea(orboundsforthetailarea),whichgivesthep-value
(multiplytheareaby2foratwo-sidedalternativehypothesis).v. Statetheconclusion:Ifcomputationallypossible,reportthep-value;otherwise,
comparetheteststatisticwiththecriticalvalue.HypothesisTestsfortheMean:
To test against 00 : µµ =H : If Yσ is known, use: ( )n
y
Yσ
µ0− and the standard Normal
distribution;otherwise,use: ( )ns
y
Y
0µ− andthe 1−nt − distribution.
HypothesisTestsfortheDifferenceinMeansforIndependentSamples:
Totestagainst XYH µµ =:0 :If Yσ and Xσ areknown,use
mn
xy
XY22 σσ
+
−asateststatistic.
If Yσ and Xσ areunknownbutassumedequal,use
mns
xy
P11
+
−asateststatistic.
SingleFactorialModels(analysedthroughANOVA):
Forfactorlevelsi=1,…,k, jiijiY ,, εµ += ,with ),0(~ 2, σε Nji .
SimpleLinearRegression(estimatedthroughleastsquares):
jjj xY εββ ++= 10 ,with ),0(~ 2σε Nj .

Semester One Final Examinations, 2016 STAT2201 Analysis of Engineering and Scientific Data
Standard Normal Cumulative Probabilities

Semester One Final Examinations, 2016 STAT2201 Analysis of Engineering and Scientific Data
t-Distribution Quantiles
END OF EXAMINATION