Embed Size (px)
Citation preview
0
SCHOOL OF SCIENCE AND ENGINEERING
FINAL REPORT
CAPSTONE DESIGN
TOWER DESIGN AND ANALYSIS FOR A SMALL WIND TURBINE
By
Soufiane KARMOUCHE
Spring 2016
Supervised by
Dr. Anas BENTAMY

1
ACKNOWLEDGEMENTS:
I cannot express enough thanks for my supervisor, Dr. Anas Bentamy, for his continuous
encouragement and support. His help throughout these period is crucial for the success of this
capstone project. I am grateful for providing to the environment a work that goes with the
sustainability constraints and promotes clean energies. None of this work would have been
materialized without the guidance and patience of Dr.Bentamy.
I would love to address my sincere thanks and acknowledgements to Mr. Lhoussaine Tenghiri who
assisted me during all this period of capstone preparation. His unconditional help had an incredible
added value throughout this project.
I would like to thank my family for their support, help and advice that helped pushing me face new
challenges in my career with plenty of reason and confidence.
Finally, I want to thank all the engineering school in Al Akhawayn University who is giving the
opportunity to complete such research. This is also a deep gratitude to the entire Akhawayn
community who are working hard to assure the suitable conditions to access all forms of
knowledge.
Supervisor’s Signature:
2
TABLE OF CONTENTS:
ACKNOWLEDGEMENTS .......................................................................................................... 1
ABSTRACT .................................................................................................................................... 3
LIST OF FIGURES ....................................................................................................................... 4
LIST OF TABLES ......................................................................................................................... 5
INTRODUCTION .......................................................................................................................... 6
BACKGROUND ............................................................................................................................. 7
1. SUSTAINABLE ENERGIES ........................................................................................ 7
2. WIND ENERGY ............................................................................................................ 7
2.1 History of Wind Energy ..................................................................................... 8
2.2 The Energy in Wind .......................................................................................... 11
2.3 Wind Turbines .................................................................................................. 13
2.4 Wind Turbine components ............................................................................... 14
2.5 Wind Turbine Towers ....................................................................................... 16
METHODOLOGY ...................................................................................................................... 18
OPTIMUM TOWER HEIGHT .................................................................................................. 19
EFFECTS OF LOADING ........................................................................................................... 23
1. DESIGN GEOMETRY ................................................................................................ 23
2. TOWER LOADS .......................................................................................................... 25
3. BENDING STRESS ..................................................................................................... 26
4. LOCAL BUCKLING ................................................................................................... 28
5. CAPACITY FACTOR ................................................................................................. 29
6. RESULTS ..................................................................................................................... 29
6.1 Design Parameters ............................................................................................ 29
6.2 Implementation & Findings .............................................................................. 31
7. NATURAL FREQUENCY .......................................................................................... 33
BUSINESS ANALYSIS ............................................................................................................... 35
1. TOWER PERCENTAGE OF TOTAL COST ....................................................... 36
2. COST OPTIMIZATION BY TOWER GEOMETRY ........................................... 39
3. LIMITATION ........................................................................................................ 40
CONCLUSION ............................................................................................................................. 42
REFERENCES ............................................................................................................................. 43

3
ABSTRACT:
Wind turbines have known an exponential growth in the last decades, going through many
generations of technologies that increases dramatically their reliability in the energy market.
Researchers are more interested in this domain now than any time before because of the sustainable
opportunities it offers. From an economic perspective, the cost of this technology have enormously
decreased through the years which gives so much hope to substitute entirely any non-renewable
resource. Today, in Western developed countries, there are energy stations of capacities ranging
from few kilowatts to several megawatts of electrical energy. They are used to provide energy to
the entire system and also to individual usage. [6] Technological developments on many aspects
of wind turbines are established continuously to improve their efficiency, reliability and safety.
This project follows the same trend as it analyzes the design of one of the most important
component of a wind turbine which is the tower.
The design and analysis of the tower will be focused on small wind turbines. It will analyze the
effects of loading on the tower, the optimum tower height and the verification of safety against
bending and buckling.
In a further analysis, this work is to provide an optimization method for minimizing the tower mass
and estimating the added value of this optimization in terms of cost.

4
LIST OF FIGURES:
Figure. 1: Jacobs’ turbine (Jacobs, 1961)
Figure. 2: Representative size, height, and diameter of wind turbines (Steve Connors, MIT)
Figure. 3: Wind flow through circular disk representing turbine blades.
Figure. 4: Wind Turbine Components and Cost Breakdown. EWEA, 2007
Figure. 5: Different tower designs for small wind turbines. (a): Truss tower, (b): Tubular
tower, (c): Guyed pole
Figure. 6: Minimum distance between tip blade and the ground.
Figure. 7: Octagonal tower for HAWT in 3D
Figure. 8: Tower schematic & Octagonal section
Figure. 9: Loads on the Tower
Figure. 10: Share of Total Installed Units vs Share of Total Installed Capacity

5
LIST OF TABLES:
Table 1: Main types of towers
Table 2: Variation of Roughness Length and Power Exponent Depending on Terrain
Table 3: Input parameters for the optimization of monopole tower.
Table 4: Design parameters entered in MATLAB for octagonal tapered tower
Table 5: Retail prices for Bergey Turbines. Retrieved from BERGEY WINDPOWER 2013, CO.
Norman, OK, USA
Table 6: Monopole tower prices by Berget Windpower 2013
Table 7: Monopole tower prices by manufacturer.
Table 8: Percentage installed costs for Aerogenesis 5 kW turbine
Table 9: Tower mass comparison (Non-optimized versus Optimized)
6
INTRODUCTION:
In the raise of climate change and the certainty of the human impact on our planet, the change is
becoming a must. Humans burn around 21 Gt of fossil fuels each year to satisfy the global energy
needs and consequently contributing in global warming.[4]Wind energy is one of the renewable
resources of energy that have known a significant expansion since the 1980s. [6] The development
of wind energy is a key technology to face the climate change reducing the dependency on other
unsustainable resources. It is recognized to present many environmental and socio-economic
opportunities to the entire community on Earth.
After the oil crisis in 1973, people grew their awareness of the restricted carbohydrate sources,
leading a wave of researches in the field of wind energy. [7] This clean energy is a strong economic
and environmental factor that help the local and global development. Research developments
improved the technology through the years providing more and more accessibility to wind energy
systems. This research paper concerns small wind turbines which are suitable for mini-grids and
remote area power stations (RAPS). Small wind turbines are also successful and provide many
solutions in areas that are inadequate for large wind turbines, and can be directly grid-connected.
[6]
7
BACKGROUND:
1. SUSTAINABLE ENEGRIES:
Renewable energy systems are major technological tools that promote sustainable energy. By
harnessing the power of Earth through hydroelectricity, wind, solar, wave, geothermal and tidal
power... renewable energies can provide all the electricity needed for human needs while having
very limited impact on the environment. The first-generation of these technologies appeared with
the industrial revolution including hydropower, geothermal heat and power, and even combustion
of biomass. After the 1970s, research and development allowed the emergence of second-
generation technologies with solar heating, wind power, photovoltaics and bioenergy. For the third-
generation, technologies are still under development process concerning biomass gasification,
ocean energy and solar thermal power. [10] In the last decade, governments have begun massive
spending into sustainable energies, both in the application of facilities and in research labs. [11]
One way we can generate electricity is through harnessing wind power. By mounting a turbine on
top of a tower, Professor James Blyth of the Anderson College in Glasgow was able to charge
accumulators developed by French scientist Camille Alphonse Faure. [12] First, let us define wind
and wind power.
2. WIND ENERGY:
Wind power allows for steady power supply from one year to the other, but has less consistency in
shorter periods and is thus used in parallel with other power generating sources to allow for a
reliable supply. Weather forecasting is of major importance in this case as it allows for predictions
in the variation of production.

8
The world’s leader in wind power generation is arguably Denmark as it produces nearly 40% of
its’ domestic needs in electricity, 83 other countries also use wind power. As of 2014, the global
wind power production is of 369,553MW. The EU generates 11.4% of its electricity through wind
power. [13]
2.1 History of Wind Energy:
The first usage of wind to generate electricity was related to the development of electrical
generators at the end of 19th century. At that time, it was expected that people would test them
using a windmill rotor. These small turbines, as shown in Figure 1, were pioneered by Marcellus
Jacobs and represented the logical replacement for water-pumping fan mills.[16] These were
significantly resembling to the turbines found today as their rotor had three blades with airfoil
shapes. Jacob’s turbine is the old version of the modern small wind turbines we find today, such as
Bergey and Southwest Windpower.
Fig. 1 Jacobs turbine (Jacobs, 1961)

9
The early 20th century knew the construction of larger turbines. Denmark saw a great sequence of
turbines. In fact, Poul La Cour built more than a hundred turbines generating electricity of between
20 and 35 kW. These turbines were actually used in the hydrogen production for lighting. Prior to
World War II, several turbines, ranging between 30 and 60 kW, were created by Lykkedgaard Ltd
and F.L. Smidth & Co. After that, Johannes Juul raised his 200 kW Gedser turbine in southern
Denmark. Many of the concepts used today in aerodynamic wind turbine design were in a form
applied in the work of Ulrich Hütter who pioneered in wind energy in Germany in the 1950s. [16]
In the 1990s, wind turbine manufacturing moved from the US to Europe, certainly after the end of
the biggest US manufacturer Kennetech Windpower. Responding to global warming worries and
nuclear power concerns, the world demand for wind energy increased in many countries. In the
21st century, European suppliers, particularly from Denmark and Germany, established power
plants in countries such as China and the United States. [16]
The size of commercialized wind turbines increased significantly in recent times; from nearly 25
kw to 6 MW, as shown in Figure 2.

10
Fig. 2 Representative size, height, and diameter of wind turbines (Steve Connors, MIT)
Wind turbine technology rose effectively by the end of the 20th century in a world full of horizons.
Developments in different areas helped improving the technology in wind turbines contributing in
their wide re-appearance. These developments covered areas such as materials science, computer
programming, aerodynamics, power electronics, analytical design and analysis, and testing and
monitoring. [16] Materials science for example, helped finding new composition for the blades and
towers while computer science was behind facilitating design and analysis and monitoring. Thanks
to analytical design and analysis methods, much better vision is now obtained regarding the
performance of a new design.
11
2.2 The Energy in Wind:
Throughout human history, wind has been an inspiration for mythology, influenced the events of
history and expanded the horizons for human transportation. Sailing ships, hot air balloons all use
wind power to make it possible to reach new destinations. Wind is the flow of gases on a large
scale. On Earth’s surface, wind is the bulk movement of air, in outer space and many kinds exist
such as solar wind and planetary wind. Winds are classified by their speed, the causing forces, the
density of the gas and the energy content. The main drivers behind wind are the difference in
temperature between the poles and the equator and the Coriolis Effect which is due to Earth’s
rotation. [17]
For most modern turbines they have horizontal-axis and thus are called HAWTs (Horizontal-Axis
Wind Turbines). This type of wind turbine is the one to be studied in this research.
Since the first purpose of a turbine is turning the kinetic energy of the wind into electrical energy,
it is important first to know how much energy is in the wind. A simple analysis, using control
volume, can explain the power available in wind. This analysis consist of considering a circular
blade disk which represents the blades of a turbine. This disk has an area 𝐴 = 𝜋𝑅², with 𝑅 being
the radius of the blades. Supposing a wind flow with a wind speed 𝑈0 m/s, and assuming it to be
steady and uniform. The air is to be taken with a density 𝜌= 1.2 kg/m3 (at 20°C at sea level).
By determining the kinetic energy passing through the rotor per unit time, we get an amount of
energy in Joule, per unit time, second. This J/s is then expressed in Watts which is the power unit.
The number of Watts is the power output and it is what concerns most the designer of wind turbines.
In terms of cost and revenue, the electrical energy is then expressed in kWh (kilowatt-hour) form.

12
Taking an elemental volume representing the flow of air, as shown in Figure 3, we set its value to
be the product of its area ∆𝐴 and the length 𝛿𝑥 normal to the disk. [18]
Fig. 3 Wind flow through circular disk representing turbine blades.
The mass of this elemental volume would then be 𝜌∆𝐴𝛿𝑥. Thus the KE=1
2𝑚𝑉² equation becomes
KE=1
2 𝜌∆𝐴𝛿𝑥𝑈0². For ∆KE, the amount of kinetic energy passing in a given time 𝛿𝑡 is given by:
𝛿(∆𝐾𝐸) =1
2𝜌∆𝐴𝑈0𝛿𝑡𝑈0² (1.1)
with 𝛿𝑥 = 𝑈0𝛿𝑡
By the summation of all elements, the KE that passes the disk is then:
𝛿(𝐾𝐸) =1
2𝜌𝐴𝑈0
3𝛿𝑡 (1.2)
Knowing that the power is the rate change of energy according to time, we set the equation above
to the limit 𝛿𝑡 → 0 to obtain:
𝑃 =𝑑(𝐾𝐸)
𝑑𝑡⁄ =
1
2𝜌𝐴𝑈0
3 (1.3)

13
The power given in equation 1.3 is never reached in practice, but it is acceptable to say that the
power converted into electrical energy represents nearly 40% of the one given above. This is due
to aerodynamic losses and the fact that a turbine cannot use all the wind captured. For example,
applying this to calculate the extracted power from a 6 m diameter turbine at 10 m/s wind speed,
the amount in kWhs produced would then be:
𝑃 = 0.4 (1
2𝜌𝐴𝑈0
3)
= 0.4 × 0.5 × 1.2 (𝑘𝑔
𝑚3) × 𝜋 × 32 (𝑚) × 103
= 𝟔𝟕𝟖𝟓. 𝟖𝟒 𝐖
which is 6.785 kW produced in an hour. For a day, 𝑃 = 24 × 6.785= 162.84 kWhs.
Wind power is defined as the use of air flow through turbines to power generators. Wind power is
an alternative to burning fossil fuels as we have plenty of wind and generating its energy doesn’t
have any considerable impact on the environment.
2.3 Wind Turbines:
Wind turbines can range in terms of output from few Watts to tens of megawatts. The IEC 61400-
2 standard defines a small wind turbine as the one having a rotor with a swept area less than 200
m².[19] This corresponds to a power 𝑃 < 50 kW. However, the basic principles for the operation
of wind turbines apply to all sizes. It is important to focus on some points concerning small wind
turbines:
Small wind turbines are usually installed next to the owner’s home, which is not the best
location for wind.
14
Small wind turbines have generators with an important resistive torque. This torque has to be
aerodynamically surpassed for the blades to start rotating.
Small wind turbines often use furling for protection from spinning too quickly, while large
turbines have breaks. Over-speed protection by furling is done simply by orienting the blades
away from the direction of wind.
Large wind turbines are usually installed in the windiest locations. Several wind turbines connected
to a power transmission network are called a wind farm. A wind farm can be installed either
onshore or offshore. Onshore wind farms are inexpensive to install while offshore farms are more
expensive in terms of construction and maintenance cost but can provide power to isolated
locations.
Large wind turbines are in wind farms for energy generation enterprise, while small scale wind
turbines are used on local site, farm or residence to satisfy the electricity needs of the owner of
property. [20]
2.4 Wind Turbine Components:
Large and small wind turbine differ mainly in the size of their components. A wind turbine is
consisted of several components, each one with a percent cost to the total wind turbine cost. Figure
4 shows the contribution of each element in making the wind turbine.

15
Fig. 4 Wind Turbine Components and Cost Breakdown. EWEA, 2007
From the figure above, we can see that the tower and the blades make a significant part of the whole
turbine, which brings to engineers’ concerns the need to study these components. This research
will be focusing on the analysis of the tower and will try to come up with an optimum design to
withstand extreme conditions and respect safety standards.

16
2.5 Wind Turbine Towers:
Towers are supports to raise the main part of the turbine up in the air. A tower is normally at least
as high as the rotor. There are three types of tower in common use for horizontal axis wind turbines:
Free-standing lattice (truss);
Cantilevered pipe (tubular tower);
Guyed lattice or pole.
Fig. 5 Different tower designs for small wind turbines.
(a): Truss tower, (b): Tubular tower, (c): Guyed pole
There are different types of towers for small wind turbines, each one has advantages and
disadvantages. Table-1 represents the main types of small wind turbines and their main advantages
and drawbacks.

17
Type Main advantages Main disadvantages
Monopole
Looks aesthetically nice Uses more steel. More costly to
produce and transport.
Guyed
Reduced cost. Minimum material Not suitable for urban installation.
Sectional lattice Reduced transportation cost
Short lifetime. Joints corrodes
Tubular lattice Simple to produce. Light weight. Electrical cables are less protected
Table 1 Main types of towers
This project will study the tubular tower design, shown in Figure 5-b, for small wind turbines.
Historically, free-standing lattice towers were used more commonly until the mid-
1980s.[9]Tubular towers have a number of advantages. Unlike lattice towers, they do not rely on
many bolted connections which need to be torqued and checked periodically. The widespread
deployment of grid-connected horizontal axis small turbines has led to monopoles taking over,
largely because they do not need guy-wires. Hence, the number of “semi-urban” areas where the
installation is to be made is so huge that it is difficult to estimate. These monopole tower wind
turbines can be implemented in railways, parking lots, parks, university campuses...

18
METHODOLOGY:
The main purpose of this work is to estimate steady loads on the tower. The effects of loading to
be considered are bending and buckling from which the design has to be safe. This work also
provides a design that optimizes the height and the mass of the tower.
The methodology of this project is mainly based on literature review of published research papers
and books concerning the loadings applied, and their different effects. The goal of this part is to
gather the necessary formulas to determine the allowable stress through calculating the bending
stress and the local buckling. This also includes the height specifications of the tower at which it
should optimally operate. Then, given certain design parameters, the analysis is conducted mainly
through Matlab implementations. Academic sources are reviewed for further optimization methods
and advanced calculations.

19
OPTIMUM TOWER HEIGHT:
The power output varies depending on height of the wind turbine. Typically, tower height ℎ, is in
a range between 10 and 50 meters. The values for ℎ are directly associated with the change of wind
speed depending on altitude. But before expressing the dependency of height on the mean wind
speed, it is important to follow some rules of thumb provided by Mick Sagrillo for siting wind
turbines.
- Due to reduced ground drag, wind speed increases proportionally with height.
- Minimum tower height should be at least higher by 10 meters than anything in the
surrounding 150 meters.
- Rougher terrain produces more disruption of the wind.
In the lower layers of the atmosphere, the wind speed is more affected due to friction with the
surface of the Earth. During siting, the roughness of the terrain, which represents the impact of
obstacles and surrounding contours, must be taken into account. The rougher the ground surface
is, the more disrupted and slowed down is the wind. [21]
- Another rule of thumb that has to be respected is that the tip of the blade should be at least
15m above the ground [22]
𝐷
2+ 15 ≤ 𝐻ℎ𝑢𝑏 (2.1)
Where 𝐷 is the rotor diameter, and 𝐻ℎ𝑢𝑏 is the height of the hub.

20
Fig. 6 Minimum distance between tip blade and the ground.
The variation of mean wind speed can be simply expressed by the power law: [18]
𝑈(𝑧) = 𝑈(ℎ𝑟𝑒𝑓) (𝑧
ℎ𝑟𝑒𝑓)
𝑚
(2.2)
Where ℎ𝑟𝑒𝑓 is a reference height that is usually set to be equal to 10 m. Later in our analysis we
will be taking 𝑈(ℎ𝑟𝑒𝑓) = 𝑈10 = 4 m/s based on available data of wind speed in the region. The
power law exponent 𝑚 depends mainly on the roughness of the terrain. It is also affirmed that the
following logarithmic law is used for more accuracy:
21
𝑈(𝑧) = 𝑈(ℎ𝑟𝑒𝑓) (ln (𝑧 𝑧0⁄ )
ln (ℎ𝑟𝑒𝑓 𝑧0)⁄) (2.3)
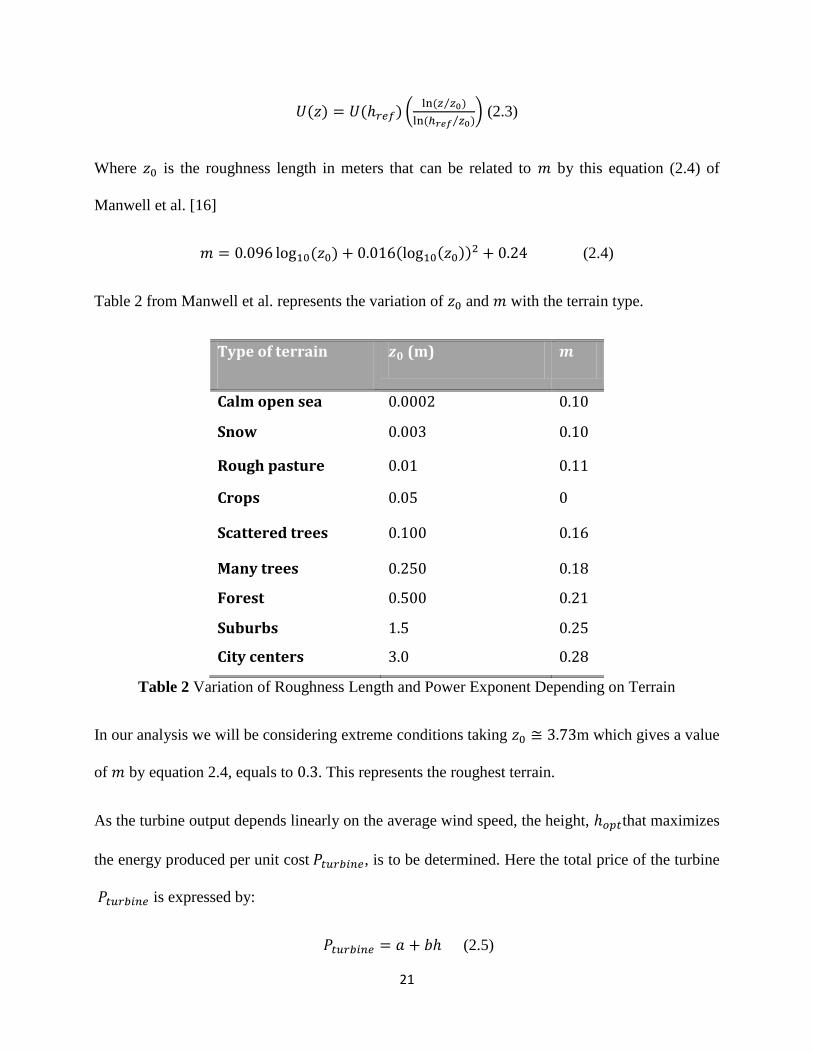
Where 𝑧0 is the roughness length in meters that can be related to 𝑚 by this equation (2.4) of
Manwell et al. [16]
𝑚 = 0.096 log10(𝑧0) + 0.016(log10(𝑧0))2 + 0.24 (2.4)
Table 2 from Manwell et al. represents the variation of 𝑧0 and 𝑚 with the terrain type.
Type of terrain 𝒛𝟎 (m) 𝒎
Calm open sea 0.0002 0.10
4 Snow
0.003 0.10
0 Rough pasture
0.01 0.11
2 Crops 0.05 0
0.13
1
Scattered trees 0.100 0.16
0 Many trees 0.250 0.18
8
Forest 0.500 0.21
3
Suburbs
1.5 0.25
7 City centers
3.0 0.28
9 Table 2 Variation of Roughness Length and Power Exponent Depending on Terrain
In our analysis we will be considering extreme conditions taking 𝑧0 ≅ 3.73m which gives a value
of 𝑚 by equation 2.4, equals to 0.3. This represents the roughest terrain.
As the turbine output depends linearly on the average wind speed, the height, ℎ𝑜𝑝𝑡that maximizes
the energy produced per unit cost 𝑃𝑡𝑢𝑟𝑏𝑖𝑛𝑒, is to be determined. Here the total price of the turbine
𝑃𝑡𝑢𝑟𝑏𝑖𝑛𝑒 is expressed by:
𝑃𝑡𝑢𝑟𝑏𝑖𝑛𝑒 = 𝑎 + 𝑏ℎ (2.5)

22
Where ℎ is in meters, 𝑎 is the cost of the nacelle and 𝑏 is a turbine constant. In our case, we use
similar model to the Bergey 10KW wind turbine taking values of a = $18000 and b = 971.
Thus the ratio that has to be maximized becomes:
𝑈10(ℎ10⁄ )
𝑚−𝑈0
𝑎+𝑏ℎ (2.6)
Taking 𝑈0= 1.95 m/s, as the offset wind speed, which represents the difference between the
minimum wind speed and the average wind speed, according to the local wind data.
Differentiating eq. 2.6 with respect to ℎ and then setting it equal to zero permits to come out with
a value for ℎ𝑜𝑝𝑡 as a solution for the following equation:
𝑚𝑎
𝑏ℎ𝑜𝑝𝑡+ 𝑚 − 1 +
𝑈0
𝑈10(
10
ℎ𝑜𝑝𝑡)
𝑚
= 0 (2.7)
Now that we are left with one equation with one unknown variable ℎ𝑜𝑝𝑡, we implement the equation
in Matlab using function fzero for root-finding algorithm. We take the 30 as “options” value for
fzero and which is the first value taken into the algorithm. The following simple code, once run on
Matlab, displays the optimal tower height for our design.
function out = optm_ht(U10,a,m,b,U0) m=0.3; % power law exponent a=18000; % cost of the nacelle in $ b=971; % tower constant. Bergey 10KW U10=4; % Average wind speed at Href=10meters in m/s U0=1.95; % Offset wind speed in m/s
out =fzero(@(h)m*a/(b*h)+m-1+(U0/U10)*(10/h)^m,30); end
23
ℎ𝑜𝑝𝑡 is found to be equal to ans = 18.7642 meters which respects the rules of thumb set above
in eq.(2.1) as we are counting for a rotor diameter 𝐷 = 7m
EFFECTS OF LOADING:
In order to design and analyze monopole towers, only the general form of the tower is taken into
account. Wind loads are considered as one among the loads acting on the tower. Some loads due
to snow for example or earthquakes are neglected in this methodology. In order to conduct this
analysis, definition of certain design parameters is crucial. After defining optimal height for the
tower, ℎ𝑜𝑝𝑡, other parameters have to be initially set such as the geometry and the design
conditions.
1. DESIGN GEOMETRY:
In this section, the main purpose is to validate an optimal tower structure with a first goal of
minimizing the tower mass for cost, transport and foundation matters. For our tapered tower with
3 sections, the optimization is almost impossible to achieve analytically. For this purpose, an
evolutionary method will be used. This method simulates the natural selection used in the genetic
algorithm and will be further discussed in the design parameters part.
The use of monopole tapered tower is suitable for areas this research is interested in. In extreme
conditions, monopole towers are the best fit. By using octagonal cross sections that are slip-fit
jointed, the manufacture become much easier, and transportation cost is reduced. The study aims
to minimize the mass as much as possible while maintaining the strength requirements. This is
because the tower represents a considerable percentage of the total cost of the turbine (about 30%)
[9].

24
Figures 7 & 8 represent respectively a 3D image and a tower scheme of the slip-fit monopole tower
with three sections. The tower has an octagonal cross-section at the base. We set dAF to be the
distance across the flats of the octagonal cross-section.
Fig. 7 Octagonal tower for HAWT in 3D
Fig. 8
Tower schematic & Octagonal section
2. TOWER LOADS:
For the forces acting on the tower are, as shown in Figure 9, 𝑇 the thrust of the turbine, 𝐷(𝑦) the
loading applied by the wind on the turbine and mturbine the mass of the turbine. We define 𝑦 to be
the vertical axis originating from the tower top.

25
Fig. 9 Loads on the Tower
For our case we will be evaluating loads for parked wind loading using the Simple Load Method
(SLM) explained in the work of Wood.[18] This means that our analysis considers distinct loads
on a parked turbine with no produced power. It is unnecessary for the blades to be static in order
to have a stationary system loading. Our load analysis is based on wind speed 𝑈𝑒50 (extreme wind
speed occurring three seconds in 50 years). For a stationary rotor (producing no power) the main
loading is due to drag force. A maximum shaft thrust is then computed following the formula:
26
𝐹𝑡ℎ𝑟𝑢𝑠𝑡 =1
2. 𝐵. 𝐶𝑑. 𝜌. 𝑈2
𝑒50. 𝐴𝑝𝑟𝑜𝑗,𝐵 (3.1)
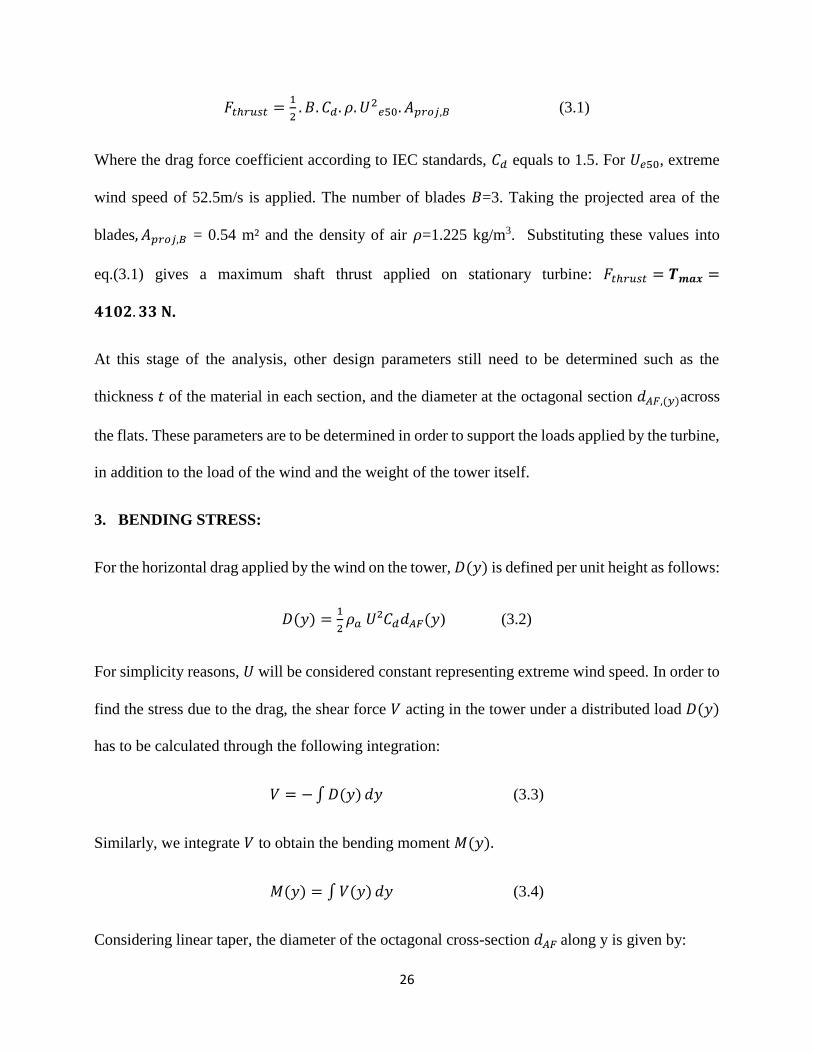
Where the drag force coefficient according to IEC standards, 𝐶𝑑 equals to 1.5. For 𝑈𝑒50, extreme
wind speed of 52.5m/s is applied. The number of blades 𝐵=3. Taking the projected area of the
blades, 𝐴𝑝𝑟𝑜𝑗,𝐵 = 0.54 m² and the density of air 𝜌=1.225 kg/m3. Substituting these values into
eq.(3.1) gives a maximum shaft thrust applied on stationary turbine: 𝐹𝑡ℎ𝑟𝑢𝑠𝑡 = 𝑻𝒎𝒂𝒙 =
𝟒𝟏𝟎𝟐. 𝟑𝟑 𝐍.
At this stage of the analysis, other design parameters still need to be determined such as the
thickness 𝑡 of the material in each section, and the diameter at the octagonal section 𝑑𝐴𝐹,(𝑦)across
the flats. These parameters are to be determined in order to support the loads applied by the turbine,
in addition to the load of the wind and the weight of the tower itself.
3. BENDING STRESS:
For the horizontal drag applied by the wind on the tower, 𝐷(𝑦) is defined per unit height as follows:
𝐷(𝑦) =1
2𝜌𝑎 𝑈²𝐶𝑑𝑑𝐴𝐹(𝑦) (3.2)
For simplicity reasons, 𝑈 will be considered constant representing extreme wind speed. In order to
find the stress due to the drag, the shear force 𝑉 acting in the tower under a distributed load 𝐷(𝑦)
has to be calculated through the following integration:
𝑉 = − ∫ 𝐷(𝑦) 𝑑𝑦 (3.3)
Similarly, we integrate 𝑉 to obtain the bending moment 𝑀(𝑦).
𝑀(𝑦) = ∫ 𝑉(𝑦) 𝑑𝑦 (3.4)
Considering linear taper, the diameter of the octagonal cross-section 𝑑𝐴𝐹 along y is given by:

27
𝑑𝐴𝐹(𝑦)= 𝑑𝐴𝐹,𝑏𝑎𝑠𝑒− 𝑑𝐴𝐹,𝑡𝑜𝑝
ℎ𝑦 + 𝑑𝐴𝐹,𝑡𝑜𝑝 = 𝑑1𝑦 + 𝑑𝐴𝐹,𝑡𝑜𝑝 (3.5)
where 𝑑1 is the taper.
Eq.(3.4) leads to this expression of the total moment using (3.2), (3.3) and (3.5):
𝑀(𝑦) = 𝑀0 + 1
2𝜌𝑎 𝑈2 𝐶𝑑 (
𝐷𝐴𝐹,𝑏𝑎𝑠𝑒− 𝐷𝐴𝐹,𝑡𝑜𝑝
6𝐿𝑦3 +
𝐷𝐴𝐹,𝑡𝑜𝑝
2𝑦2) + 𝑉0 (3.6)
by including the boundary condition for 𝑉 being 𝑇𝑚𝑎𝑥 (𝑉(0) = 𝑇𝑚𝑎𝑥). A moment 𝑀0 acting on the
tower can rise from different causes such as cyclic loads applied on the turbine shaft or from a
considerable overhang of the center of mass of the tower top. [18] Here, it is taken that 𝑀(0) = 0
as the mass is considered to be well distributed around the tower axis. Thus, equation (12) becomes:
𝑀(𝑦) =1
2𝜌𝑎 𝑈2 𝐶𝑑 (
𝐷𝐴𝐹,𝑏𝑎𝑠𝑒− 𝐷𝐴𝐹,𝑡𝑜𝑝
6𝐿𝑥3 +
𝐷𝐴𝐹,𝑡𝑜𝑝
2𝑥2) + 𝑇𝑚𝑎𝑥𝑦 (3.7)
The maximum bending stress, σ𝑏,𝑚𝑎𝑥, at any given height happens at a distance 𝑥 = 𝑑𝐴𝐹/2 from
the centroid. And it is given by:
σ𝑏,𝑚𝑎𝑥 =𝑀(𝑦)d𝐴𝐹,(𝑦)
2𝐼(𝑦) (3.8)
where the moment of area, 𝐼, for an octagon with thickness 𝑡, is as follows:
𝐼(𝑦) ≈ 0.05474[𝑑4(𝑦) − (𝑑(𝑦) − 2𝑡)4] (3.9)
The maximum total stress, σ𝑚𝑎𝑥, is calculated by summing axial loading and the bending stress:
σ𝑚𝑎𝑥 = σ𝑏,𝑚𝑎𝑥 +𝑔(𝑚𝑡𝑢𝑟𝑏𝑖𝑛𝑒+𝑚𝑡𝑜𝑤𝑒𝑟(𝑦))
𝐴(y) (3.10)
where 𝑔 is the acceleration of gravity, and the cross-sectional area 𝐴(y) ≈ 3.1337𝑡[𝑑(𝑦) − 𝑡].
28
Moreover, an increase in thickness 𝑡 in the lower sections is required to withstand increasing
stresses. A set of thicknesses is used for towers with multiple sections to reduce their mass and the
cost.
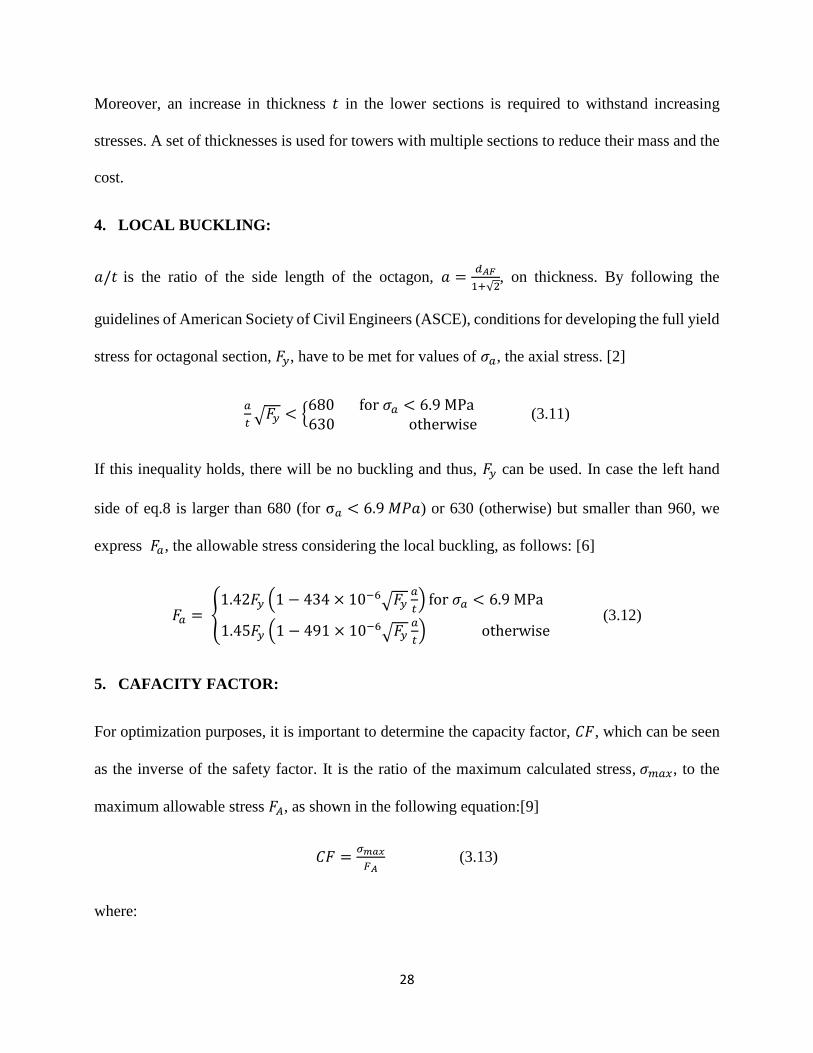
4. LOCAL BUCKLING:
𝑎/𝑡 is the ratio of the side length of the octagon, 𝑎 =𝑑𝐴𝐹
1+√2, on thickness. By following the
guidelines of American Society of Civil Engineers (ASCE), conditions for developing the full yield
stress for octagonal section, 𝐹𝑦, have to be met for values of 𝜎𝑎, the axial stress. [2]
𝑎
𝑡√𝐹𝑦 < {
680 for 𝜎𝑎 < 6.9 MPa 630 otherwise
(3.11)
If this inequality holds, there will be no buckling and thus, 𝐹𝑦 can be used. In case the left hand
side of eq.8 is larger than 680 (for σ𝑎 < 6.9 𝑀𝑃𝑎) or 630 (otherwise) but smaller than 960, we
express 𝐹𝑎, the allowable stress considering the local buckling, as follows: [6]
𝐹𝑎 = {1.42𝐹𝑦 (1 − 434 × 10−6√𝐹𝑦
𝑎
𝑡) for 𝜎𝑎 < 6.9 MPa
1.45𝐹𝑦 (1 − 491 × 10−6√𝐹𝑦𝑎
𝑡) otherwise
(3.12)
5. CAFACITY FACTOR:
For optimization purposes, it is important to determine the capacity factor, 𝐶𝐹, which can be seen
as the inverse of the safety factor. It is the ratio of the maximum calculated stress, 𝜎𝑚𝑎𝑥, to the
maximum allowable stress 𝐹𝐴, as shown in the following equation:[9]
𝐶𝐹 =𝜎𝑚𝑎𝑥
𝐹𝐴 (3.13)
where:

29
𝐹𝐴 = min (𝐹𝑦, 𝐹𝑎)
In typical conditions, a capacity factor 𝐶𝐹 ≤ 0.6 is used to illustrate the safety of the design to
buckling and stress.
6. RESULTS:
6.1 Design parameters:
At this part, a mathematical program implemented using Matlab is used to compute the capacity
factors for stress and buckling. This program also gives the tower mass and the tower top deflection,
given the remaining design parameters: top tower mass 𝑚𝑡𝑢𝑟𝑏𝑖𝑛𝑒, the thicknesses 𝑡1, 𝑡2 and 𝑡3, the
number of sections 𝑁, 𝑑𝐴𝐹,𝑡𝑜𝑝 and 𝑑𝐴𝐹,𝑏𝑎𝑠𝑒 .
In order to optimize a tapered tower with different section thicknesses, an evolutionary method is
used. This optimization method tries to look for best combination between minimizing the mass of
the tower and maximizing the capacity factor CF and the tower & turbine natural frequency.
This method is done by applying the process of natural selection by developing a certain population
through enough generations in order to get an optimum solution. This method called “genetic
algorithm”, explained in the work of Yoshida [23], starts by generating a random initial population,
then growing new members and determine the fitness of both old and new members to decide
which ones should live and which shouldn’t. The growing or “breeding” of new members include
“mutation of the genes” for every new member. In this case, the tower genes are 𝑑𝐴𝐹,𝑡𝑜𝑝, 𝑑𝐴𝐹,𝑏𝑎𝑠𝑒
and the thicknesses 𝑡1, 𝑡2 and 𝑡3 for each section. Fitness here is given by:
fitness(𝒄i) = 𝑎𝑚min (𝑚𝑡)
𝑚𝑡(𝒄i)+ 𝑎𝐶𝐹
𝐶𝐹(𝒄i)
max(𝒄i)+ (1 − 𝑎𝑚 − 𝑎𝐶𝐹)
𝑛1(𝒄i)
max(𝑛1) (3.14)
For now, the natural frequency of the tower and turbine, 𝑛1, is excluded as 𝑎𝑚 + 𝑎𝐶𝐹 = 1.
30
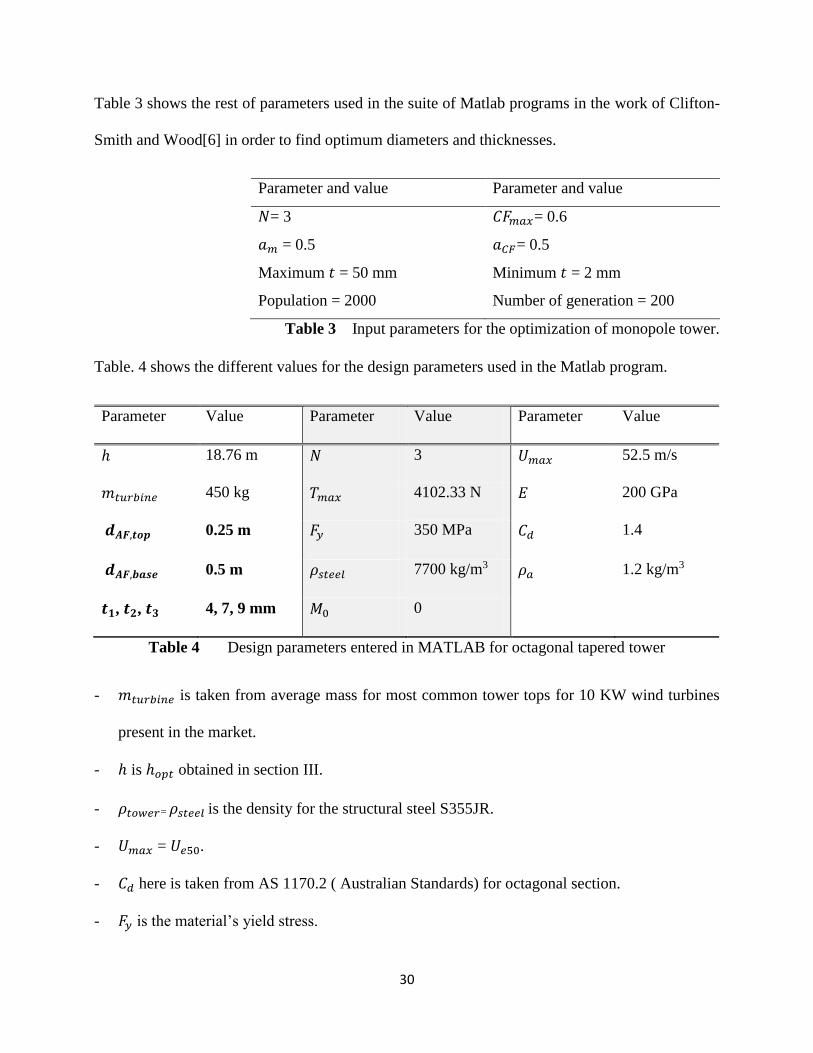
Table 3 shows the rest of parameters used in the suite of Matlab programs in the work of Clifton-
Smith and Wood[6] in order to find optimum diameters and thicknesses.
Parameter and value Parameter and value
𝑁= 3 𝐶𝐹𝑚𝑎𝑥= 0.6
𝑎𝑚 = 0.5 𝑎𝐶𝐹= 0.5
Maximum 𝑡 = 50 mm Minimum 𝑡 = 2 mm
Population = 2000 Number of generation = 200
Table 3 Input parameters for the optimization of monopole tower.
Table. 4 shows the different values for the design parameters used in the Matlab program.
Parameter Value Parameter Value Parameter Value
ℎ 18.76 m 𝑁 3 𝑈𝑚𝑎𝑥 52.5 m/s
𝑚𝑡𝑢𝑟𝑏𝑖𝑛𝑒 450 kg 𝑇𝑚𝑎𝑥 4102.33 N 𝐸 200 GPa
𝒅𝑨𝑭,𝒕𝒐𝒑 0.25 m 𝐹𝑦 350 MPa 𝐶𝑑 1.4
𝒅𝑨𝑭,𝒃𝒂𝒔𝒆 0.5 m 𝜌𝑠𝑡𝑒𝑒𝑙 7700 kg/m3 𝜌𝑎 1.2 kg/m3
𝒕𝟏, 𝒕𝟐, 𝒕𝟑 4, 7, 9 mm 𝑀0 0
Table 4 Design parameters entered in MATLAB for octagonal tapered tower
- 𝑚𝑡𝑢𝑟𝑏𝑖𝑛𝑒 is taken from average mass for most common tower tops for 10 KW wind turbines
present in the market.
- ℎ is ℎ𝑜𝑝𝑡 obtained in section III.
- 𝜌𝑡𝑜𝑤𝑒𝑟= 𝜌𝑠𝑡𝑒𝑒𝑙 is the density for the structural steel S355JR.
- 𝑈𝑚𝑎𝑥 = 𝑈𝑒50.
- 𝐶𝑑 here is taken from AS 1170.2 ( Australian Standards) for octagonal section.
- 𝐹𝑦 is the material’s yield stress.

31
- 𝐸 is the Young’s Modulus for the steel.
6.2 Implementation & Findings:
Below is the code for calling the function for our program, concerning IEC Simple Load Method
for parked wind loading, and the outputs after execution are as follows:
>> tapered_oct_tower_rectifi(450, 0.25, 0.5, 3, 18.76, 4102.33,52.5,0)
% tapered_oct_tower_rectifi(mtt, d0, dh, N, h, Tmax, Umax,M0)
% mtt: mass of the tower top (kg)
% d0: distance between the flats of cross-section at y=0 (top diameter) (m)
% dh: distance between the flats of cross-section at y=h (base diameter) (m)
% N: Number of section
% h: optimal tower height (m)
% Tmax: maximum turbine thrust (N)
% Umax: Ue50, maximum wind speed (m/s)
% M0: Moment on tower due to turbine
The horizontal force on tower is 16.29 kN
The base overturning moment is 212.76 kNm
For section 1 enter thickness in mm; 4
For section 2 enter thickness in mm; 7
For section 3 enter thickness in mm; 9
The maximum stress is 115.1123
The maximum CF for buckling is is 0.1783
The maximum CF for stress is 0.3289
The tower mass is 1239.86 kg
The tower top deflection is 0.613 metres
The estimated natural frequency of the tower + turbine is 0.706 Hz
The estimated natural frequency of the 0.23*tower + turbine is 1.071 Hz
>>
32
The horizontal force acting on the tower and the base overturning moment are found to be,
respectively: 16.29 KN and 212.76 kN.m.
The maximum stress is then calculated: σ𝑚𝑎𝑥= 115.1123 N/m²
The maximum capacity factor for buckling is found to be 0.1783 ≤ 0.6. This means that the
design is safe against buckling.
The maximum capacity factor for stress is 0.3289 ≤ 0.6. Thus, the design is safe against stress
which implies that it is also safe against the overturning moment.
The mass of the tower 𝑚𝑡𝑜𝑤𝑒𝑟 is optimized given the initial conditions to be: 1239.86 kg
Generally the tower top deflection, which is the maximum deflection of the tower, has to remain
small to prove that the design does not alter the loads. A value of 0.613 m is reasonable and
have been found using the standard beam theory:
𝑑2𝑥
𝑑𝑦2 =𝑀(𝑦)
𝐸𝐼(𝑦) (3.15)
where 𝐼(𝑦) ≈ 0.43792𝑡( 𝑑𝐴𝐹,𝑡𝑜𝑝 + 𝑑𝐴𝐹,𝑏𝑎𝑠𝑒− 𝑑𝐴𝐹,𝑡𝑜𝑝
ℎ𝑦)3 under the condition that 𝑡 ≪ 𝑑𝐴𝐹,𝑡𝑜𝑝.
Equation 3.15 is treated as two first order differential equations and solved by the built-in Runge-
Kutta routines in Matlab. [24]
7. NATURAL FREQUENCY:
Avoiding resonance is an important matter in wind turbine design. The natural frequency for the
support of the turbine (tower) has to be separated from the operating frequencies of the turbine.
Frequency in (Hertz) in obtained by dividing the turbine’s angular speed (in rpm) by sixty.
Generally, the operating intervals for small wind turbines range from 0.23 Hz and 0.52 Hz. At this
stage of wind turbine design, an important consideration is to analyze any potential resonant

33
oscillations due to matching frequencies: blade passing frequency, 𝑓𝑏 (rotational speed of the
rotor*number of blades) and tower lowest natural frequency 𝑛1. This analysis is necessary for
variable-speed small wind turbines as they are designed to keep a constant tip speed ratio by
controlling the rotational speed to match the wind speed. [25] Undesirable large stress and
deflection could occur in case the tower natural frequency and the blade-passing frequency
coincide. Less concern is given to rotational frequency, 𝑓𝑟 because the cyclic loading only develop
in case of geometrical deformation in the blades. [25] This natural frequency is also used to decide
whether a static or dynamic analysis should be followed.
An approximation for the lowest natural frequency of tower and turbine is given as follows:
𝑛 =1
2𝜋√
3𝐸𝐼
(𝑚𝑡𝑜𝑤𝑒𝑟+𝑚𝑡𝑢𝑟𝑏𝑖𝑛𝑒)ℎ3 (3.16)
This simple equation is said to underestimate the lowest natural frequency because the mass of the
turbine in mainly concentrated on the top of the tower. Rao, in his book mechanical vibrations [26]
introduces the significance of the “effective mass” as being 0.23𝑚𝑡𝑜𝑤𝑒𝑟 which was used in
Baumeister’s equation: [27]
𝑛1 =1
2𝜋√
3𝐸𝐼
(0.23𝑚𝑡𝑜𝑤𝑒𝑟+𝑚𝑡𝑢𝑟𝑏𝑖𝑛𝑒)ℎ3 (3.17)
Substituting eq.(3.9) at ℎ into the equations above, we obtain: 𝒏=0.796 Hz and 𝒏𝟏= 1.2 Hz. This
values are acceptable approximations to the ones computed by Matlab.
In a dynamic perspective, towers are classified relatively depending on their natural frequencies
and those of the rotor blades. Usually, three classes of towers are counted: stiff tower, soft tower
and soft-soft tower.

34
- Stiff towers have a natural frequency higher than the blade passing frequency: 𝑓𝑏 < 𝒏𝟏
These towers remain unaffected by any resulting motions from the turbine. On the other hand,
their cost is higher as they require more mass and material.
- Soft towers have a natural frequency lower than blade passing frequency, but higher than that
of the rotor. 𝑓𝑟 < 𝒏𝟏 < 𝑓𝑏
- Soft-soft towers are those with a natural frequency below both blade passing and rotor’s
frequencies. 𝒏𝟏 < 𝑓𝑟 < 𝑓𝑏
After calculating the blade-passing frequency being 𝑓𝑏 =𝐵𝜔𝑑𝑒𝑠𝑖𝑔𝑛,𝑟𝑝𝑚
60 = 8.6 Hz, knowing that 𝐵=3
(number of the blades) and 𝜔𝑑𝑒𝑠𝑖𝑔𝑛 = 𝑓𝑟 = 172 rpm = 2.86 Hz is the rotational speed of the
design’s rotor, the tower type is known. Having 𝑛1 < 𝑓𝑟 < 𝑓𝑏, the tower of the design is soft-soft.
Because of their light weight, soft and soft-soft towers cost generally less than stiffer towers.
However, these types need a specific attention to the whole system and a detailed dynamic analysis
of the possible resonances that may result from any motion in the turbine. [28]
BUSINESS ANALYSIS:
In a world moving towards a future of renewable energies, wind power has definitely become one
among the fastest growing technologies in this field. Thanks to the quick commercialization of this
technology, improvements are continuously made in the technology and design of wind turbines,
contributing sufficiently in growing their reliability and efficiency.
Small wind turbines (SWT) are becoming a common electricity source which represents a suitable
solution to reduce significantly the dependency on electricity supply. This business analysis aims
to cover the features that can be optimized in a tower design in order to reduce the cost of turbine
35
along with maintaining reliability. Geometry, tower height, and more are aspects that can be studied
to minimize cost.
1. TOWER PERCENTAGE OF TOTAL COST:
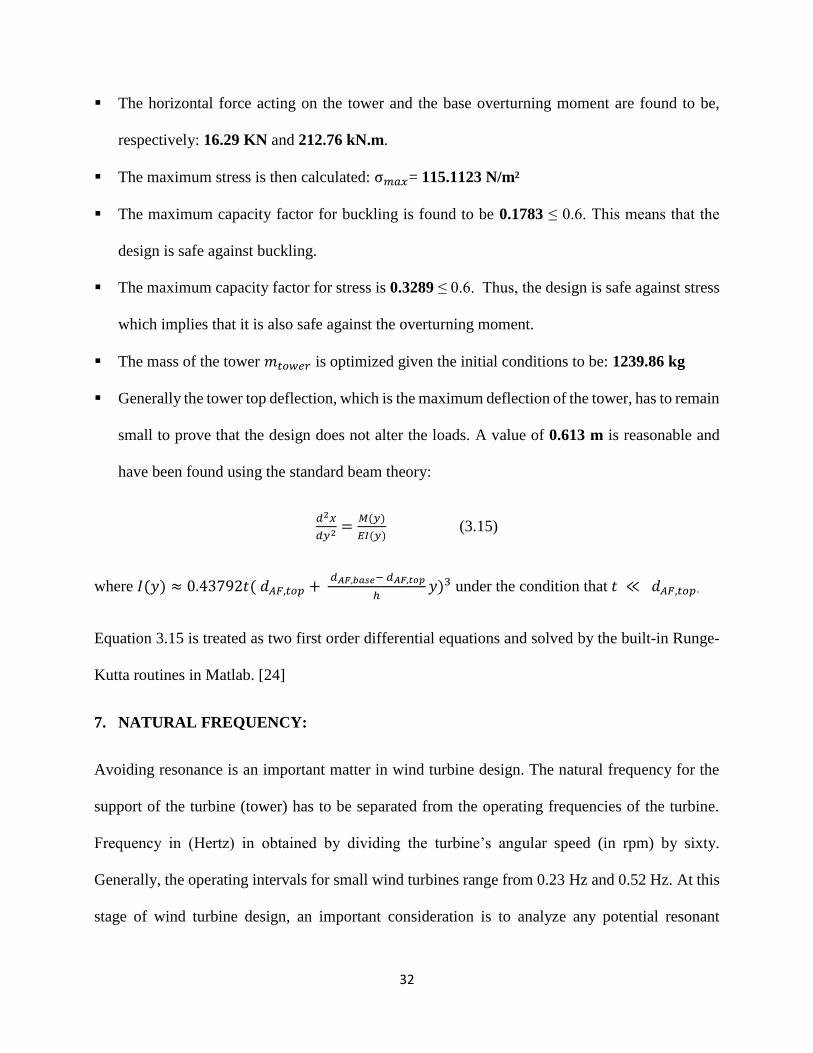
A range of costs have been looked at in order to conduct this financial study. This is a snapshot of
Bergey wind turbine top tower prices for 6 kW and 10 kW.
Table 5 Retail prices for Bergey Turbines (nacelles). BERGEY WINDPOWER 2013, CO. Norman, OK, USA
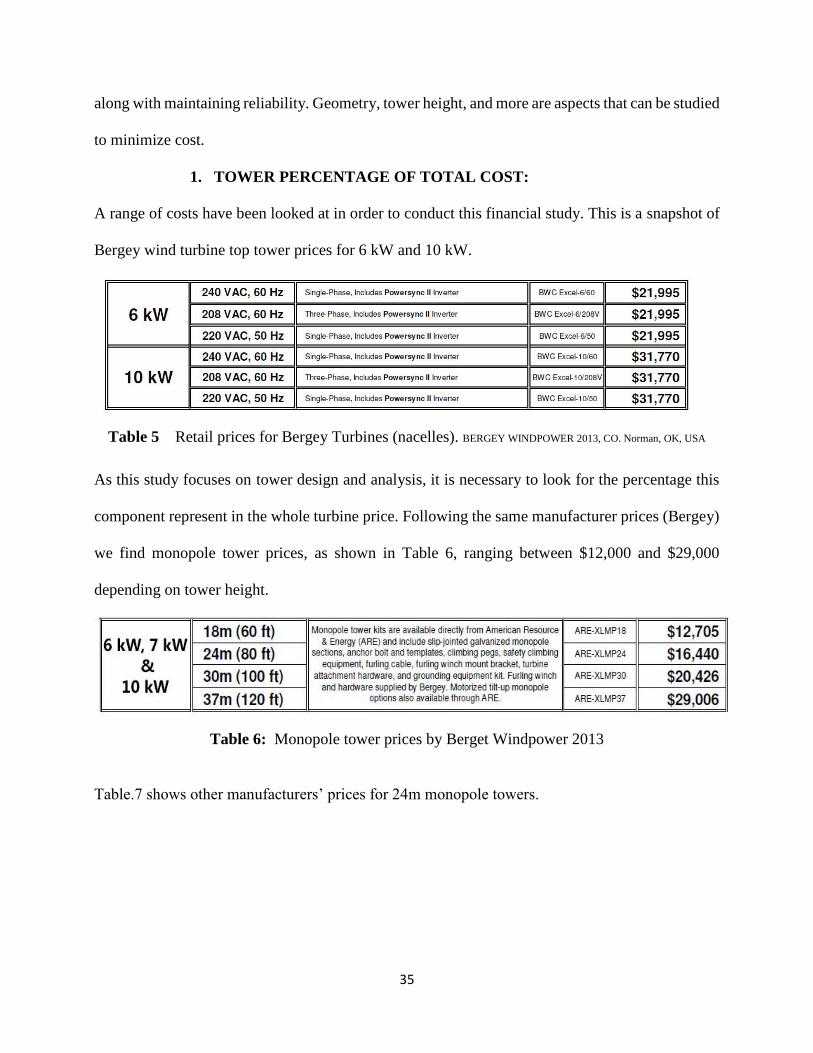
As this study focuses on tower design and analysis, it is necessary to look for the percentage this
component represent in the whole turbine price. Following the same manufacturer prices (Bergey)
we find monopole tower prices, as shown in Table 6, ranging between $12,000 and $29,000
depending on tower height.
Table 6: Monopole tower prices by Berget Windpower 2013
Table.7 shows other manufacturers’ prices for 24m monopole towers.

36
Company/Organism Country Height (m) Price ($ USD)
Aeolos Wind Energy Co. China 24 12,450
Bergey Windpower USA 24 16,640
EXMORK New Energy Company China 18 6,685
Qingdao Longteng Energy Equipment Co. China 24 9,677
Pacific Tool & Machinery USA 24 16,125
Fortis Wind Energy Netherlands 24 15,645
Table 7: Monopole tower prices by manufacturer.
This leads to determine the percentage of total cost of the tower. Typically, towers represents
between 28% and 32% of the total cost of the turbine, which is high compared to the other
components.
Table 8: Percentage installed costs for Aerogenesis 5 kW turbine
According to the small wind world report summary of 2015 by WWEA, China is maintaining its
market leader position in terms of installed units. [13] In 2013, China gained 2% of world market
share leaving the USA and the rest of the world behind. Figure 10 shows the repartition of market
share in terms of total installed units and also in terms of total installed capacity.

37
Fig. 10 Share of Total Installed Units vs Share of Total Installed Capacity. WWEA
According to the same report, the installed cost in the US ranged between $2,300/kW and
$10,000/kW in 2011, while the average installed cost in 2013 for small wind turbine reached
$6,940/kW. On the other hand, the small wind industry in China knows an important lower cost
compared to the US as it accounted for an average of $1,900/kW (12,000 Yuan). The third party in
the global market, the UK, had in 2013 an average installed cost of $5,873/kW (3,895 £/kW). [13]
For our analysis we set the average installed cost in the world to be: $4,641/kW
For a 10 kW small wind turbine, the average installed cost would be: 46,410 USD
This brings this study to the point of quantifying, in terms of cost, the efficiency of the design and
analysis discussed before.
2. COST OPTIMIZATION BY TOWER GEOMETRY:

38
The geometry of the design plays an important role in reducing the cost of the tower by mainly
reducing the mass and facilitating manufacture. The methodology to be followed will consist on
comparing the tower masses obtained using two scenarios:
- Scenario with optimization: Our tapered multi-section tower.
- Scenario without optimization: Using constant diameter and constant thickness similar to
the lower section of the tower (design without optimization).
The non-optimized design parameters for constant 𝑑𝐴𝐹 and 𝑡 are plugged in the Matlab program to
compute the tower mass. Table 9 gives the changed parameters and the mass obtained for both
designs.
Design
(non-optimized)
Parameters Design
(optimized)
Parameters
𝑑𝐴𝐹,𝑡𝑜𝑝 = 𝑑𝐴𝐹,𝑏𝑎𝑠𝑒= 0.5m
𝑡1 = 𝑡2 = 𝑡3= 9mm
𝑑𝐴𝐹,𝑡𝑜𝑝=0.25m
𝑑𝐴𝐹,𝑏𝑎𝑠𝑒= 0.5m
𝑡1= 4mm
𝑡2= 7mm
𝑡3= 9mm
Tower mass 2115.25 kg Tower mass 1239.86 kg
Table 9: Tower mass comparison (Non-optimized versus Optimized)
This shows that our tapered tower with different thicknesses reduced the tower mass by nearly 875
kg. In terms of cost, the structural steel used to make this tower, S355JR, cost around 790 EUR/Ton

39
according to Voestalpine price list. This means that our optimized design saved nearly 690 Euros
(786 USD) in tower manufacture.
Tower height is also an important aspect that optimizes the cost. Analyzing optimum tower heights
allow the manufacture of the most effective tower that will produce maximum output per unit cost.
Usually, manufacturers have a set of different heights but rarely the optimal height for a given site.
This means that an additional mass is added to the tower that increases its cost.
Another point that should to be discussed is the repartition of the tower into sections. This method
allows easier transportation as the three sections can be transported one inside the other and be slip-
fit jointed during the installation. This also facilitate the rising and lowering of the tower.
The cost reduction is mainly due to mass reduction. We estimate a saving up to 1.7% of total wind
turbine brought up by the design optimization of the tower.
This 1.7% seems negligible; however, when considering a mass production at an average of 100
wind turbines produced per year, the manufacturer would save around $78,600 per year.
3. LIMITATION:
The tower is an inseparable component from the wind turbine. It is an essential part in the wind
turbine manufacture and studying its financial analysis independently may result in some
irregularities. The cost of wind turbine should be studied as a whole for a better cost analysis.
Elemental analysis is proven to be efficient in the engineering part of design. However, when it
comes to business implementation, examining independently each component can exclude related
factors that would either optimize or increase the cost of a certain element.
The final cost reduction estimated at this part, is based on caparison between optimized and non-
optimized design and is only result of simple mathematical calculations. Factors such as fluctuating

40
steel price, the raise of new materials, transportation costs... all were underestimated during this
financial analysis.
CONCLUSION:
Generating energy from renewable power sources is the key for countries to achieve their
sustainable goals contributing in the economic and environmental development. Renewable power
generation assure a clean, safe and accessible source of energy. The capacity installed of wind
power is still growing and in an exponential way. The year 2013 knew 12% increase compared to
year before in terms of total small wind capacity installed (755MW in 2013 vs 678MW in 2012.)
[10]
In the design and construction of wind turbines, the most expensive component is the tower. This
element has to be effective in its operation in terms of safety, sustainability and reliability. Thus,
it is necessary to develop a design that optimizes mass and cost and operates in an effective and
efficient way. The design of support structure presented in this work in not the only way a tower
can be constructed. Research and development continue to optimize tower wind turbines
contributing in reducing the cost and increasing reliability. The optimization tools used in this
analysis allowed the determination of optimum tower height, which depends on tower cost,
roughness of the terrain and average wind speed at a certain location. Optimization using a suite of
Matlab programs provided reasonable approximations for tower mass, natural frequency, top tower
deflection and capacity factors for loads applied on the tower. The results of this analysis are
fundamental to achieve before starting the construction.
Innovative designs for the different components of wind turbines keep being developed for the
purpose of making wind energy more accessible, cheaper, and safer.

41
REFERENCES:
[1] AS1170.2. Australian Standard: Minimum Design Loads On Structures - Wind Loads.
Standards Association of Australia, 1989
[2] ASCE 72. Guide for Design of Steel Transmission Pole Structures. American Society of
Civil Engineers, 1990.
[3] Beer, F. and Johnston, E. Mechanics of Materials. McGraw-Hill, 1992.
[4] Bibliographie: Carbon Cycle and Climate Change. (2010). Science, 329(5993), pp.725-
725
[5] Butterfield, C. P., Sheng, S., & Oyague, F. (2009). Wind energy's new role in supplying
the world's energy: what role will structural health monitoring play?. National
Renewable Energy Laboratory.
[6] Clifton-Smith, M. J., & Wood, D. H. (2010). Optimisation of self-supporting towers for
small wind turbines. Wind Engineering, 34(5), 561-578.
[7] Khamidullin, I. N., Sabitov, L. S., & Kuznetsov, I. L. (2015). DEVELOPMENT AND
RESEARCH TOWERS FOR WIND TURBINES. Scientific Herald of the Voronezh State
University of Architecture & Civil Engineering. 28(4).
[8] Krivtsov V. S., Oleynikov A. M., Yakovlev A. I. Neischerpaemaya energiya. Kn. 2.
Vetroenergetika [Inexhaustible energy. Vol. 2. Wind power]. Kharkiv, Khar'kov. aviats.
in-t Publ.; Sevastopol, Sevastopol'. natstekhn. un-t Publ., 2004. 519 p.
[9] Wood, D. H. (2001). An improved determination of the tower height that maximises the
power output per unit cost of a small wind turbine. Wind Engineering, 25(3), 191-196.
[10] International Energy Agency (2007). Renewables in global energy supply: An IEA facts
sheet, OECD. Archived 12 October 2009 at the Wayback Machine.
[11] Kahle, L. R., & Gurel-Atay, E. (Eds.). (2013). Communicating sustainability for the green
economy. ME Sharpe..
[12] Price, T. (2005). James Blyth–Britain's first modern wind power pioneer. Wind
engineering, 29(3), 191-200. (4) Makarieva, Anastassia; V. G. Gorshkov, D. Sheil, A. D.
[13] Gsänger, S., & Pitteloud, J. D. (2015) .Small Wind World Report, World Wind Energy
Association. Bonn, Germany.
[14] James, P. (2014). Urban sustainability in theory and practice: circles of sustainability.
Routledge.

42
[15] Magee, L., Scerri, A., James, P., Thom, J. A., Padgham, L., Hickmott, S. & Cahill, F.
(2013). Reframing social sustainability reporting: towards an engaged
approach. Environment, development and sustainability, 15(1), 225-243.
[16] Manwell, J. F., McGowan, J. G., & Rogers, A. L. (2010). Wind energy explained: theory,
design and application. John Wiley & Sons.
[17] Makarieva, A. M., Gorshkov, V. G., Sheil, D., Nobre, A. D., & Li, B. L. (2013). Where
do winds come from? A new theory on how water vapor condensation influences
atmospheric pressure and dynamics. Atmospheric Chemistry and Physics, 13(2), 1039-
1056.
[18] Wood, D. (2011). Small wind turbines. Springer Berlin Heidelberg.
[19] IEC 61400-2 ed2.0 (2006-03) Wind turbines. Part 2—design requirements for small
turbines.
[20] IRENA, (2012) Wind Power: RENEWABLE ENERGY TECHNOLOGIES: COST
ANALYSIS SERIES.
[21] Sagrillo, M. (2002). Choosing a Home-Sized Wind Generator. Home Power, 14.
[22] Arbaoui, A., & Asbik, M. (2010). Constraints based decision support for site-specific
preliminary design of wind turbines. Energy and Power Engineering,2(03), 161.
[23] Yoshida, S. (2006). Wind turbine tower optimization method using a genetic
algorithm. Wind Engineering, 30(6), 453-469.
[24] Shampine, L. F. (2005). Solving ODEs and DDEs with residual control. Applied
Numerical Mathematics, 52(1), 113-127.
[25] Nicholson, J. C. (2011). Design of wind turbine tower and foundation systems:
optimization approach.
[26] Rao, S. R (2004) Mechanical vibrations, 4th ed. Pearson Prentice Hall, Upper Saddle
River
[27] Chantharasenawong, C., Jongpradist, P., & Laoharatchapruek, S. (2011, October).
Preliminary design of 1.5-MW modular wind turbine tower. In The 2nd TSME
International Conference on Me-chanical Engineering.
[28] Burton, T., Sharpe, D., Jenkins, N., & Bossanyi, E. (2001). Wind energy handbook. John
Wiley & Sons.