Embed Size (px)
Citation preview

School of Sports &
Health
Kyungsung University
Byeong-hwan Jeon
Jong-jin Park
Blood flow restriction train-
ing to prevent sarcopenia
in middle aged women

Contents
• Introduction
• Materials and Methods
• Result
• Discussion
• Conclusion

Review
• resting metabolic rate of skeletal muscle
– 17.6kcal/kg
– Example
• % Body muscle (male: 42%, female: 36%)
• EE change by increased muscle mass
– muscle mass 42%(29.4kg), 517Kcal
– if the % body muscle increased by 50%(35kg), 616Kcal

Introduction
• Prevalence of aging in Korea

Sarcopenia & sarcopenic obesity
: Fielding et al, 2011, Baumgartner, 2009
The prevalence of age-associated loss
of muscle mass alone or
in combination with increased fat mass

Risks of SO
: Ryu et al, 2013, Zamboni et al, 2008 and Zoico et al, 2004
• greater risk of frailty, falls and disability
• the prevalence of disease and increase in mortality
• functional limitations

Factors for SO
: Jones et al, 2009
• alpha‐motor neuron death
• altered hormone concentrations
• increased inflammation
• altered nutritional status

Combating strategies against SO
• testosterone, growth hormone replacement (Borst,
2004)
• pharmaceutical regulation of myostatin (Jones et al,
2009)
• nutritional (protein) supplementation (Fiatarone et al,
1994; Yarasheski et al, 1995)
• resistance exercise (Landi et al, 2014)
– the most effective and safe intervention
– consistently attenuate muscle loss, aerobic condi-
tioning, strength
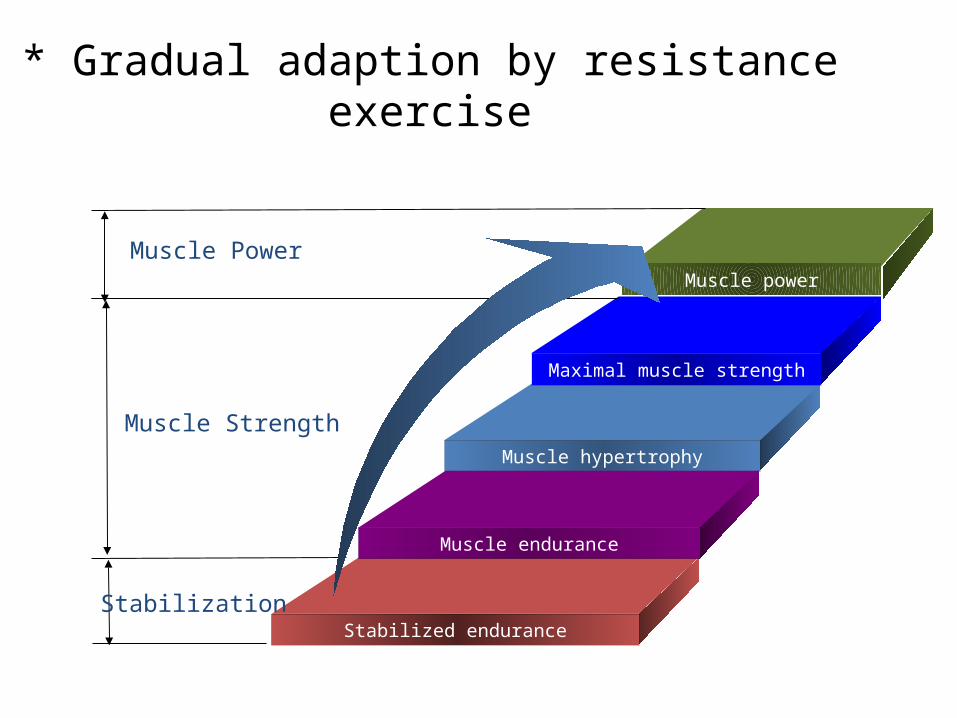
* Gradual adaption by resistance exer-cise
Muscle Strength
Maximal muscle strength
Muscle hypertrophy
Muscle endurance
Stabilized endurance
Muscle power
Muscle Power
Stabilization

Benefits of RT to the elderly population
• improvements in isokinetic strength, bone mineral
density and lean muscle mass (Salvador et al, 2013)
• enhancements in functional ability (Mariane et al,
2011)
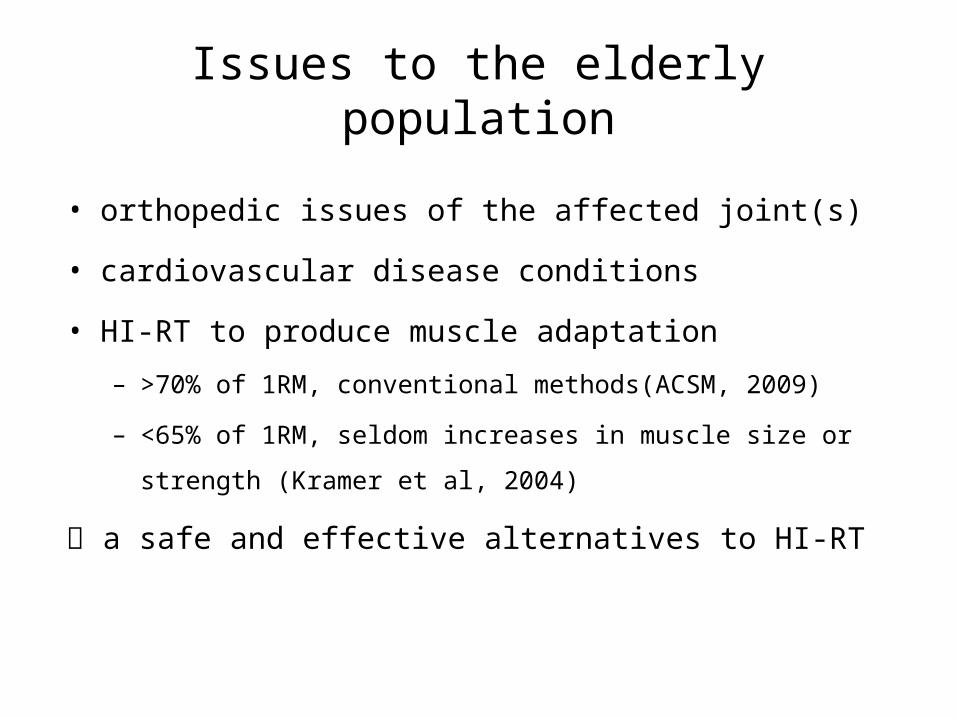
Issues to the elderly population
• orthopedic issues of the affected joint(s)
• cardiovascular disease conditions
• HI-RT to produce muscle adaptation
– >70% of 1RM, conventional methods(ACSM, 2009)
– <65% of 1RM, seldom increases in muscle size or
strength (Kramer et al, 2004)
a safe and effective alternatives to HI-RT

Blood flow restriction training(BFRT)
• the scientific application of RT
• the partial restriction/occlusion of
blood flow via cuff or band to the
exercised muscles
• Yoshiaki Sato developed(1983)
and generalised through the ‘KAATSU’
machine(2003)

• significant hypertrophy in male & in female
(Wilson et al, 2013 and Lowery et al, 2013)
• <3 times secretion of GH
(Kraemer et al, 1991; Takarada et al, 2000; Viru et al, 1998)
• maintenance in strength after 3 wks of detraining
(Yasuda et al, 2014)
• a higher frequency of training by– a shorter recovery time (Abe, 2004), – minimal muscle damage (Wilson et al, 2013)
Major benefits of BFRT

Principles of BFRT
: Loenekke et al, 2012, Fry et al, 2010; Fujita et al, 2007, Yasuda et al,
2010
• pooled blood reactive hyperaemia, cellular
swelling
• an accumulation of metabolites
– PCr depletion, H2PO4-(intramuscular pH), epinephrine/norepi-
nephrine
• anabolic signaling pathways
– growth factors & Myostatin decrease
• higher threshold type II fibre recruitment
– decreased O2 supply

Methods for BFRT
• cuff sizes
– 2cm ~20cm
• cuff pressures
– lower: 140 - 240mmHg
– upper: 100 - 160mmHg
• complete occlusion
– reduced Ex volume and isometric/isokinetic strength gains
• ~130% of resting SBP(normally 130-180mmHg) when combined with
both narrow (5cm) and wide (13.5cm) cuffs (Loenneke et al, 2011)
• 12cm of cuff (Moore et al, 2004)

LI-BFRT
• an effective but safe level of restriction
– increased strength and hypertrophy
• 7cm(Burgomaster et al, 2003 ), 3-3.3cm(Takarada et al, 2000)
– increased muscle strength and endurance
• lower pressures (50/100mmHg) with narrow cuff(7.7cm) (Sumide et
al, 2009 )

The aim of this study
• proper condition to apply for middle-aged and
older women
• body composition and muscular strength re-
sponses to BFR training in Korean middle aged
women

Materials and Methods
• Participants : 23 females, aged 40-55 years
Group n age(yrs) height(㎝ ) weight(㎏ )
BFR 9 49.22±5.40 159.90±5.00 61.11±6.43
WT 7 45.71±4.82 159.14±2.91 53.14±2.91
CON 7 47.14±3.53 160.85±2.91 55.95±5.15
AVG 47.35±4.58 159.96±3.60 56.73±4.83

Body Composition
• DEXA (Discovery QDR Hologic, USA)
– Circumference
– Fat mass
– Skeletal muscle mass
– Relative appendicular
skeletal muscle mass
(ASM/weight)

Muscle strength/power
• Biodex(Biodex system 4 Pro,
USA)
• Isokinetic strength and power
measurements
• knee flexion and extension
• Load speeds
– Muscle strength @ 60°/sec
– Muscle power @ 180°/sec

Cuff size and pressure
• 8cm
• 100~120% of SBP / RPE

Training Protocol
• Type of Ex
– Upper limb
• dumbbell hammer curl & cable push-down
– Lower limb
• leg extension & leg curl
• Intensity of Ex
– RT group: 65~70% load of 1RM
– BFRT group: 30% load of 1RM at 100%(upper limbs) & 120%
(hind limbs) of SBP

Training Protocol

Training Protocol
Frequency Exercise
LI-BFRT
Inten-
sity
RT Inten-
sity
Dura-
tion
3 d/wk,
8 wks
warm-
up
•Breathing/neutral spine
•stretching5~10 min
main
exercise
•Dumbbell Hammer Curl
•Cable Push-down
•Leg Extension
•Leg Curl
30%
1RM
Total 5
sets
1set 20
2~5set 15
65~70%
1RM
Total 4set
Warm up
1set 20
2~4set 12
30min
cool-down
•Breathing exercises
•Hamstring stretch roll-
up
5~10 min

Statistics
• SPSS Window Ver 18.0
• Descriptive statistics(mean±SD)
• a Paired-T test for training effects on all depen-
dant variables
• An ANCOVA for the differences between the train-
ing group conditions, Helmert contrast
• Statistical significance, α=.05

Comparison results for the estimated weight (kg)
M±SE.
1. Body composition
1) weight
we
igh
t (
kg)
Source of
differencen weight test
BFR 9 56.93±0.48
nsWT 7 56.90±0.53
CON 7 57.47±0.49
Result

Comparison results for
the estimated Muscle mass of upper limb (kg)
M±SE.
2) Muscle mass of upper limb
we
igh
t (
kg)
Source of
differencen weight test
BFR 9 1.68±0.03BFR > WT >
CON WT 7 1.57±0.03
CON 7 1.51±0.03
Mu
scle
ma
ss o
f u
pp
er
limb
(kg
)
1. Body composition

Comparison results for
the estimated Muscle mass of lower limb (kg)
M±SE.
3) Muscle mass of lower limb
Source of
differencen weight test
BFR 9 5.62±0.16
NS WT 7 5.26±0.17
CON 7 5.31±0.17
Mu
scle
ma
ss o
f lo
we
r lim
b (
kg)
1. Body composition

Comparison results for
the estimated fat mass of upper limb (kg)
M±SE.
4) Fat mass of upper limb
Source of
differencen weight test
BFR 9 1.13±0.04
NSWT 7 1.16±0.05
CON 7 1.11±0.04
Fa
t m
ass
of
up
pe
r lim
b (
kg)
1. Body composition

Comparison results for
the estimated fat mass of lower limb (kg)
M±SE.
5) Fat mass of lower limb
Source of
differencen weight test
BFR 9 3.31±0.16
NS WT 7 3.51±0.18
CON 7 3.29±0.16
Fa
t m
ass
of
low
er
limb
(kg
)
1. Body composition

Comparison results for
the estimated circumference of upper limb (cm²)
(kg)
M±SE.
6) circumference of upper limb
Source of
differencen circumference test
BFR 9 181.51±2.78WT > BFR >
CONWT 7 187.91±3.43
CON 7 172.95±2.81
circ
um
fere
nce
of
up
pe
r lim
b (
cm²)
1. Body composition

Comparison results for
the estimated circumference of lower limb (cm²)
M±SE.
7) circumference of lower limb
Source of
differencen circumference test
BFR 9 324.81±4.07
NS WT 7
314.72±4.75
CON 7315.47±4.53
circ
um
fere
nce
of
low
er
limb
(cm
²)
1. Body composition
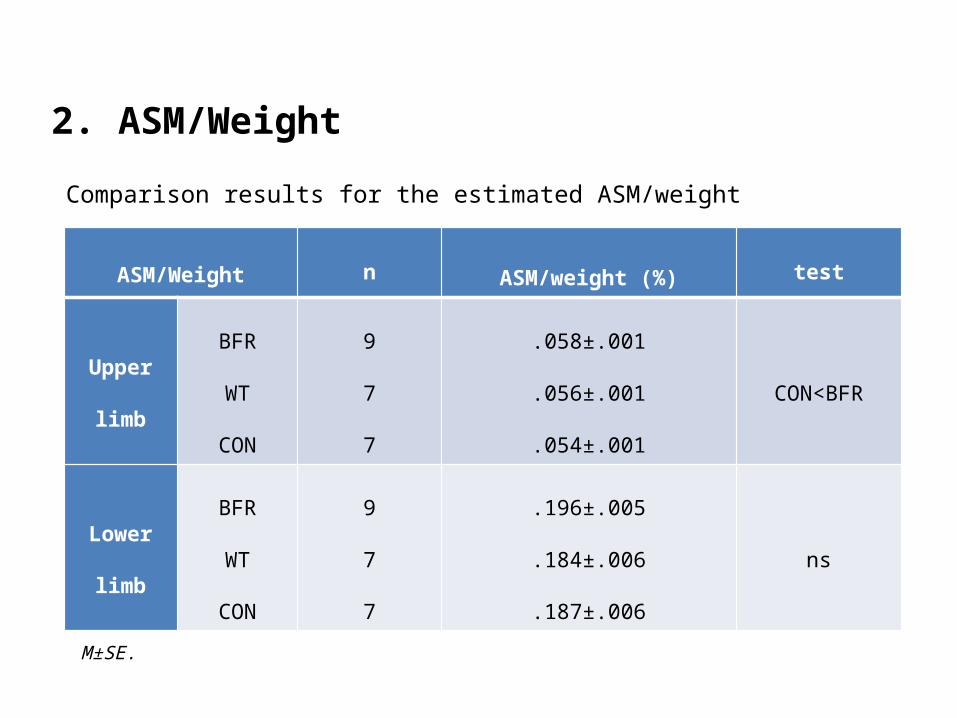
2. ASM/Weight
ASM/Weight n ASM/weight (%) test
Upper
limb
BFR
WT
CON
9
7
7
.058±.001
.056±.001
.054±.001
CON<BFR
Lower
limb
BFR
WT
CON
9
7
7
.196±.005
.184±.006
.187±.006
ns
Comparison results for the estimated ASM/weight
M±SE.

ASM/Weight change after 8 weeks
Pre Post0.04
0.05
0.06
0.07
BFRT
RT
CON
ASM
/weig
ht
(%)
Upper Limb ASM/Weight (%)
Pre Post0.16
0.17
0.18
0.19
0.2
BFRTRT
ASM
/weig
ht
(%)
Lower Limb ASM/Weight(%)

Isokinetic
strength
@ 60˚/sec
N Peak Tq/weight (%) test
Knee
Exten-
sion
BFR
WT
CON
9
7
7
102.75±3.86
101.48±4.20
94.21±4.05
ns
Knee
Flexion
BFR
WT
CON
9
7
7
50.07±1.97
45.45±2.22
40.14±2.15
CON<BFR
3. Isokinetic strength of lower limb
1) Muscle strength
Comparison results for the estimated Isokinetic strength
M±SE.

Pre Post20
40
60
BFRTRTCON
60°/
sec
flexio
n (
%)
Lower Limb muscle strength
measured at 60°/sec flexion
Pre Post50
70
90
110
130
BFRTRTCON
60°/
sec
ext
ensi
on (
%)
Lower Limb muscle strength
measured at 60°/sec extension

3. Isokinetic strength of lower limb
2) Muscle power
Isokinetic
strength
@ 180˚/sec
N Peak Tq/weight (%) test
Knee
Exten-
sion
BFR
WT
CON
9
7
7
70.75±2.57
59.12±2.93
57.57±2.84
WT,CON<BFR
Knee
Flexion
BFR
WT
CON
9
7
7
38.47±1.55
33.13±1.80
27.38±1.73
CON<WT<BFR
M±SE.
Comparison results for the estimated Isokinetic power

Pre Post10
20
30
40
50
BFRT
RT
CON
180°/
sec
flexio
n (
%)
Lower Limb muscle strength
measured at 180°/sec flexion
Pre Post40
50
60
70
80
BFRT
RT
CON
180°/
sec
exte
nsi
on (
%)
Lower Limb muscle strength
measured at 180°/sec extension

Disscusion1. Body composition
BFR WT CON Comparison results
weight X X X NS
muscle mass upper limb O O X BFR > WT> CON
lower limb O X X NS
fat mass upper limb X X X NS
lower limb X X O NS
circumference upper limb O O X WT > BFR > CON
lower limb X X X NS
ASM/wtupper limb O O X BFR > CON
lower limb O X X NS

2. Isokinetic muscle strength and power
BFR WT CON Comparison results
Muscle strength @ 60°/sec
extension X O X NS
flexion O O X BFR > CON
Muscle power@ 180°/sec
extension O X X BFR > WT, CON
flexion O O X BFR > WT > CON

• no significant differences in weight, likely due to the short
duration of this study
• small increases in ASM/weight accompanied with minor
changes/reductions in body fat
• Nonetheless the training duration was short (8 weeks),
muscle mass and volume, strength and power increased
significantly

efficacy of LI-BFRT
• comfort and tolerable
• Low-intensity (~30% 1RM) + moderate frequencies
• muscular size / strength equal to or greater than HI-RT
• applicable to increase muscle strength indices(strength &
power) in middle aged (>40yr) female populations

Suggestion for BFRT condition
• cuff pressure & size
– 100%(upper limbs) & 120%(hind limbs) of SBP
– 8cm
• intensity of load
– 30% load of 1RM
or similar level of modification

Conclusion
Suggested restrictive pressure
applied on limbs with relatively low intensity
during BFR exercise
could significantly affected the changes
on body composition and muscle strength
in Korean middle aged women

Thanks to
Lab members
Wook-chul Choi
Jae-woon Choi
Strom Reid
Hee-jin Cho
Undergraduate students