Embed Size (px)
Citation preview
SCHOOL PERFORMANCE DISPARITY IN GRANITE SCHOOL DISTRICT
A BYU Public Policy Analysis
Problem Statement
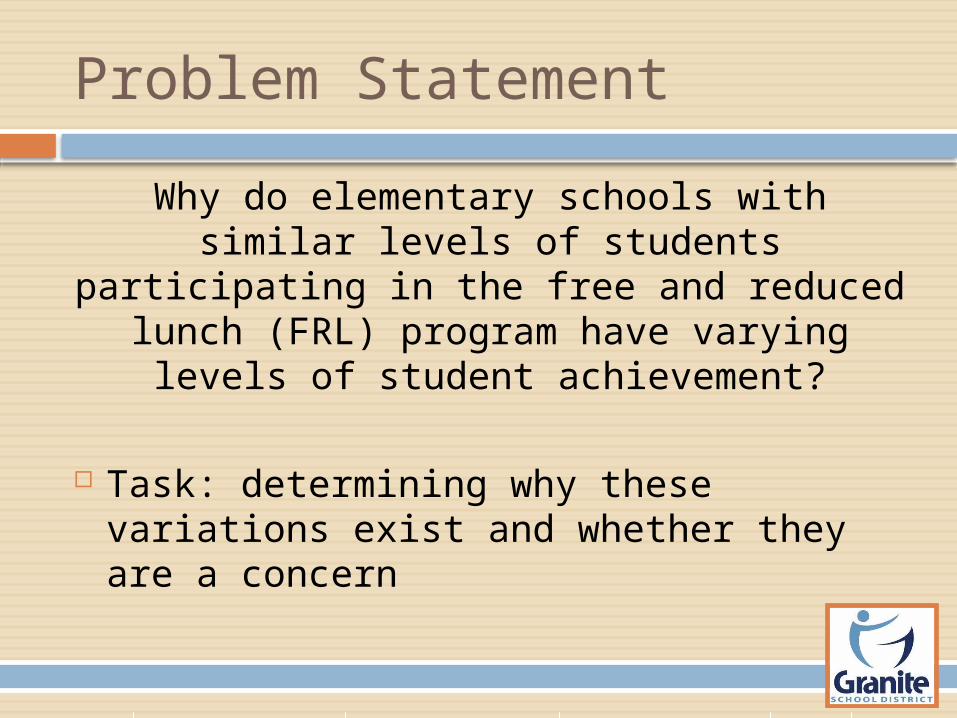
Why do elementary schools with similar levels of students participating in the free
and reduced lunch (FRL) program have varying levels of student achievement?
Task: determining why these variations exist and whether they are a concern
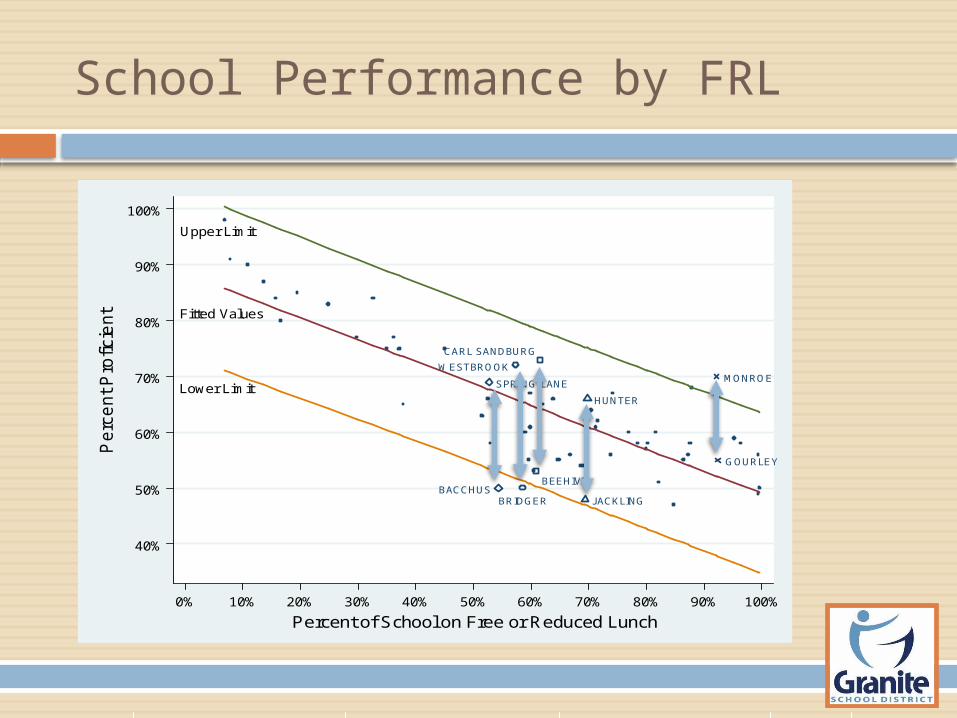
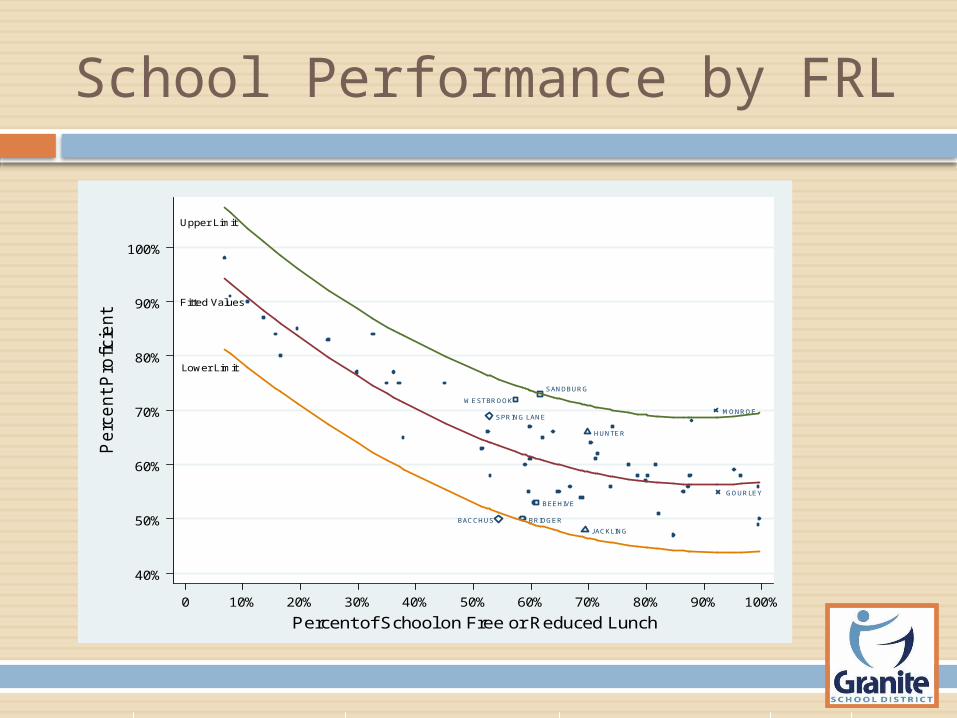
School Performance by FRL
SPRING LANE
BACCHUS
WESTBROOK
BRIDGER
BEEHIVE
CARL SANDBURG
JACKLING
HUNTER
MONROE
GOURLEY
Fitted Values
Lower Limit
Upper Limit
40%
60%
80%
100%
50%
70%
90%
Perc
ent P
roficie
nt
0% 20% 40% 60% 80% 100%10% 30% 50% 70% 90%
Percent of School on Free or Reduced Lunch
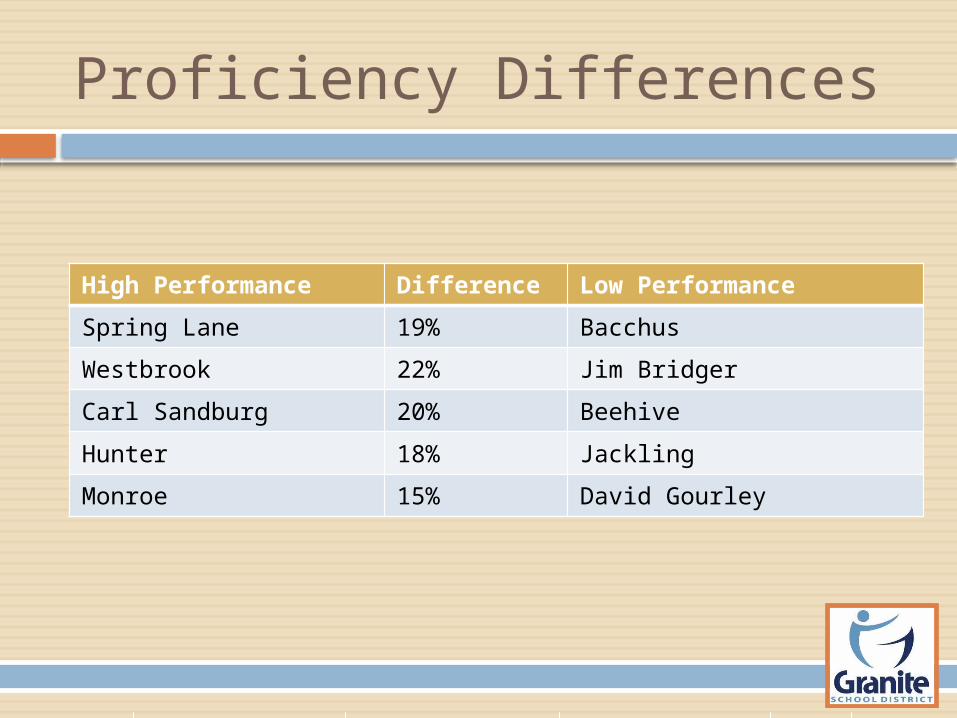
Proficiency Differences
High Performance Difference Low Performance
Spring Lane 19% Bacchus
Westbrook 22% Jim Bridger
Carl Sandburg 20% Beehive
Hunter 18% Jackling
Monroe 15% David Gourley

Education Research
School Characteristics ELL Parental Involvement Class size
Interventions Technology Principals Extra curricular activities “Liking” school Types of engagement
Quantitative Data
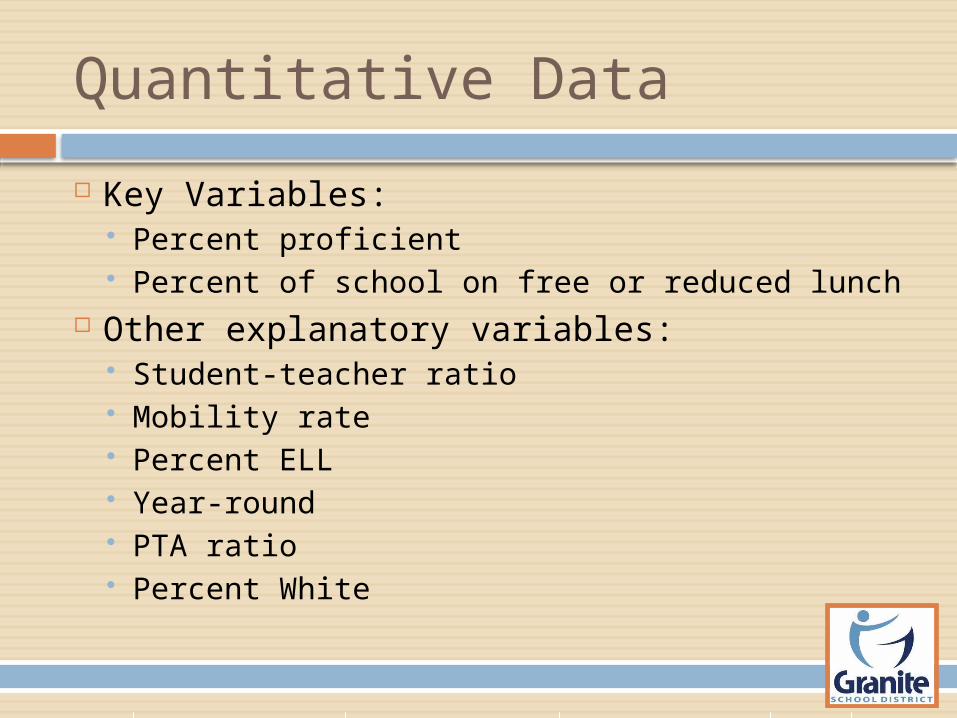
Key Variables: Percent proficient Percent of school on free or reduced lunch
Other explanatory variables: Student-teacher ratio Mobility rate Percent ELL Year-round PTA ratio Percent White
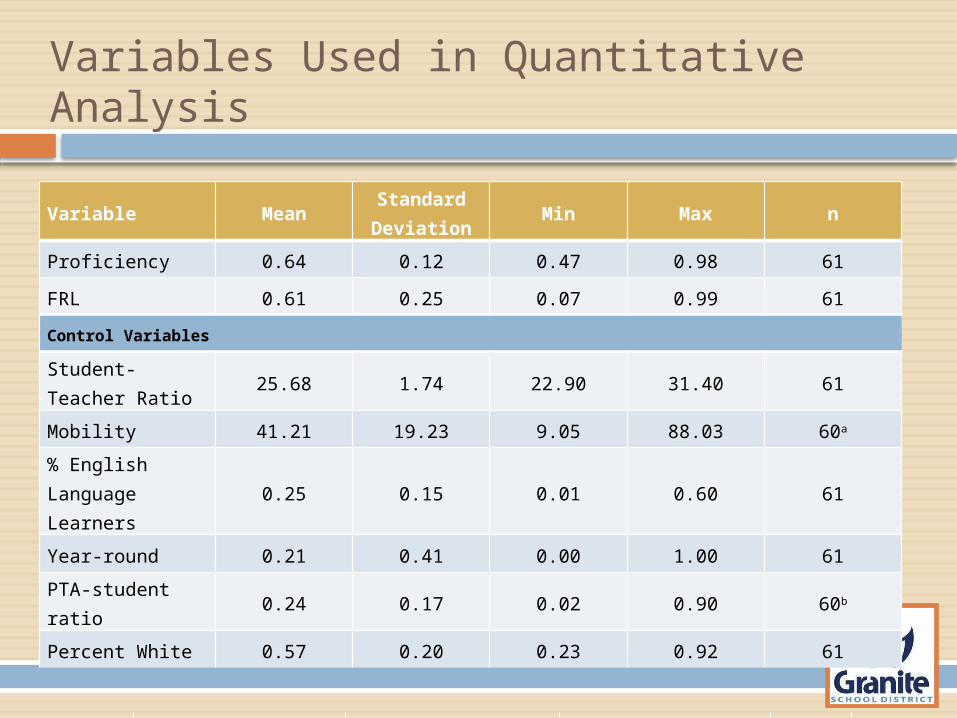
Variables Used in Quantitative Analysis
Variable MeanStandard Deviation
Min Max n
Proficiency 0.64 0.12 0.47 0.98 61
FRL 0.61 0.25 0.07 0.99 61
Control Variables
Student-Teacher Ratio
25.68 1.74 22.90 31.40 61
Mobility 41.21 19.23 9.05 88.03 60a
% English Language Learners
0.25 0.15 0.01 0.60 61
Year-round 0.21 0.41 0.00 1.00 61
PTA-student ratio 0.24 0.17 0.02 0.90 60b
Percent White 0.57 0.20 0.23 0.92 61
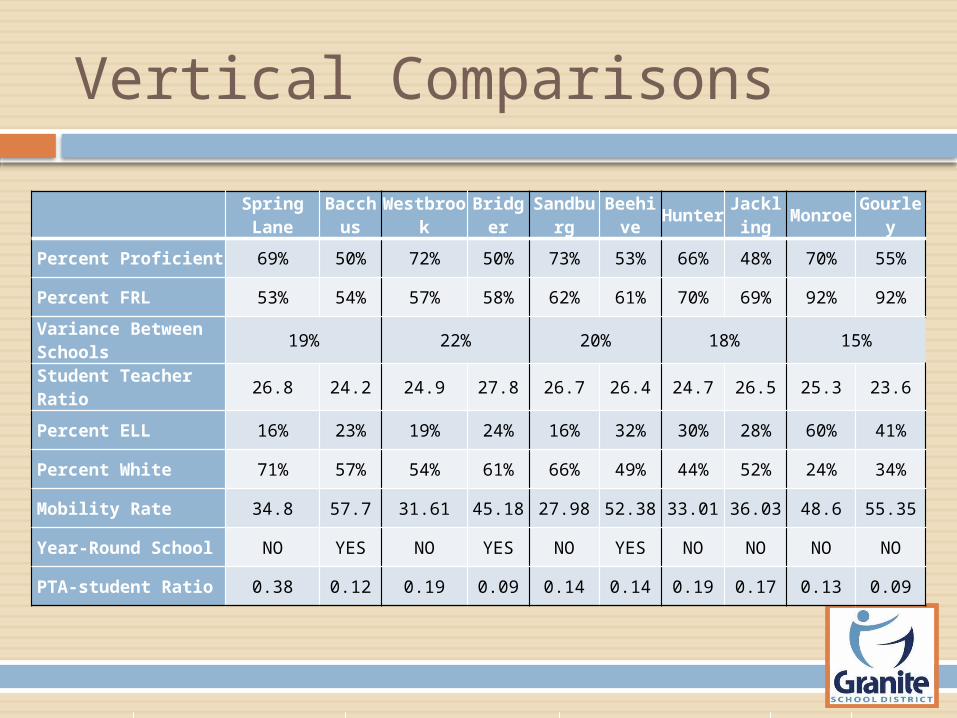
Vertical Comparisons
Spring Lane
Bacchus
Westbrook
Bridger
Sandburg
Beehive
Hunter
Jackling
Monroe
Gourley
Percent Proficient 69% 50% 72% 50% 73% 53% 66% 48% 70% 55%
Percent FRL 53% 54% 57% 58% 62% 61% 70% 69% 92% 92%
Variance Between Schools 19% 22% 20% 18% 15%
Student Teacher Ratio 26.8 24.2 24.9 27.8 26.7 26.4 24.7 26.5 25.3 23.6
Percent ELL 16% 23% 19% 24% 16% 32% 30% 28% 60% 41%
Percent White 71% 57% 54% 61% 66% 49% 44% 52% 24% 34%
Mobility Rate 34.8 57.7 31.61 45.18 27.98 52.38 33.01 36.03 48.6 55.35
Year-Round School NO YES NO YES NO YES NO NO NO NO
PTA-student Ratio 0.38 0.12 0.19 0.09 0.14 0.14 0.19 0.17 0.13 0.09
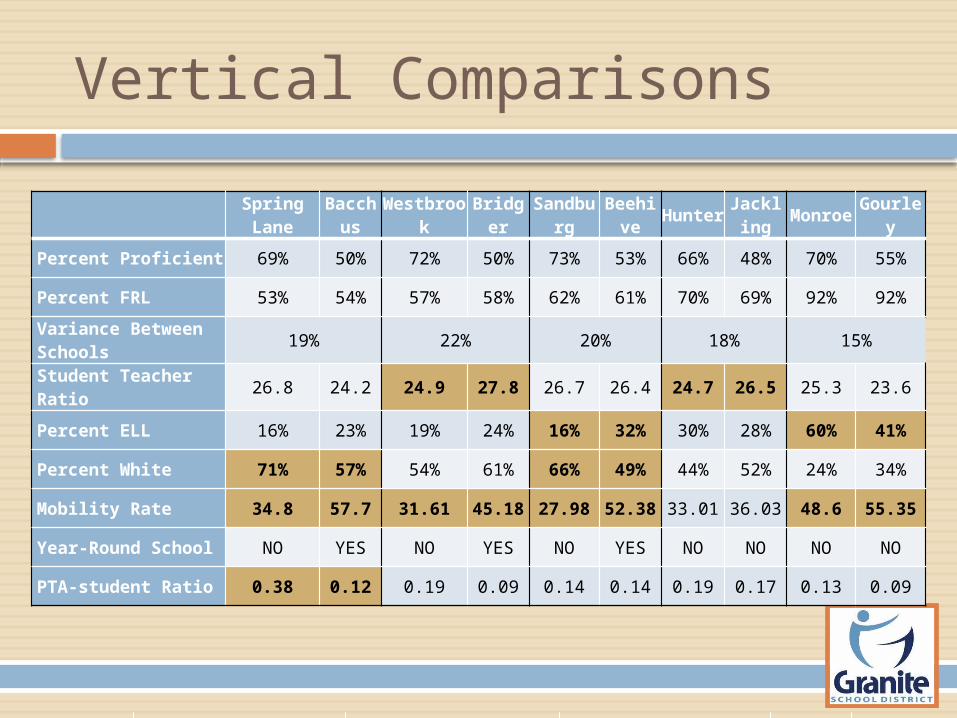
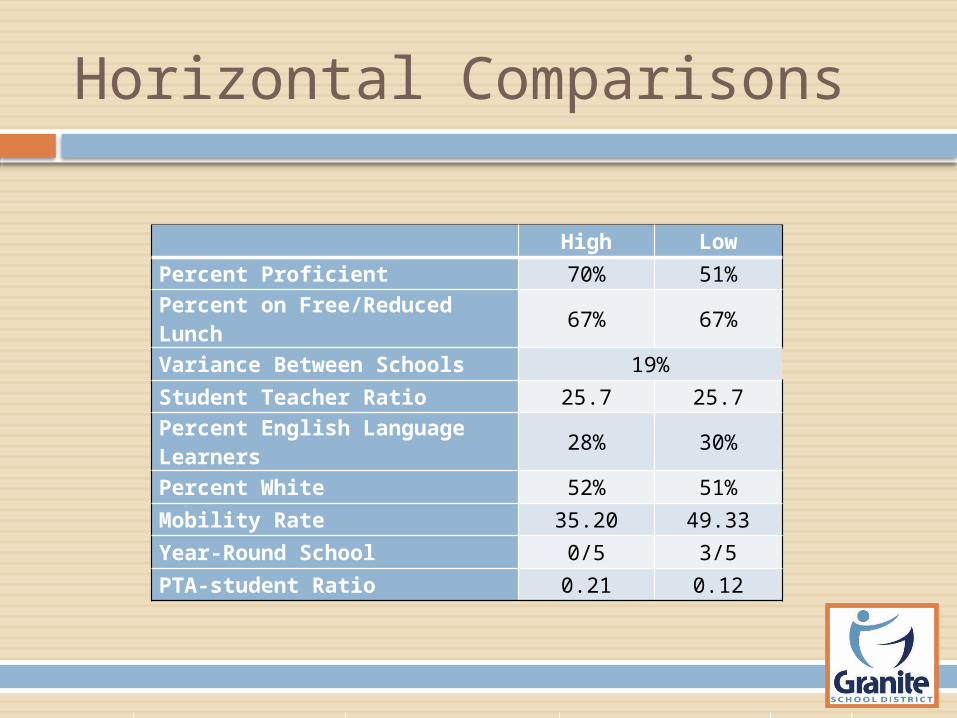
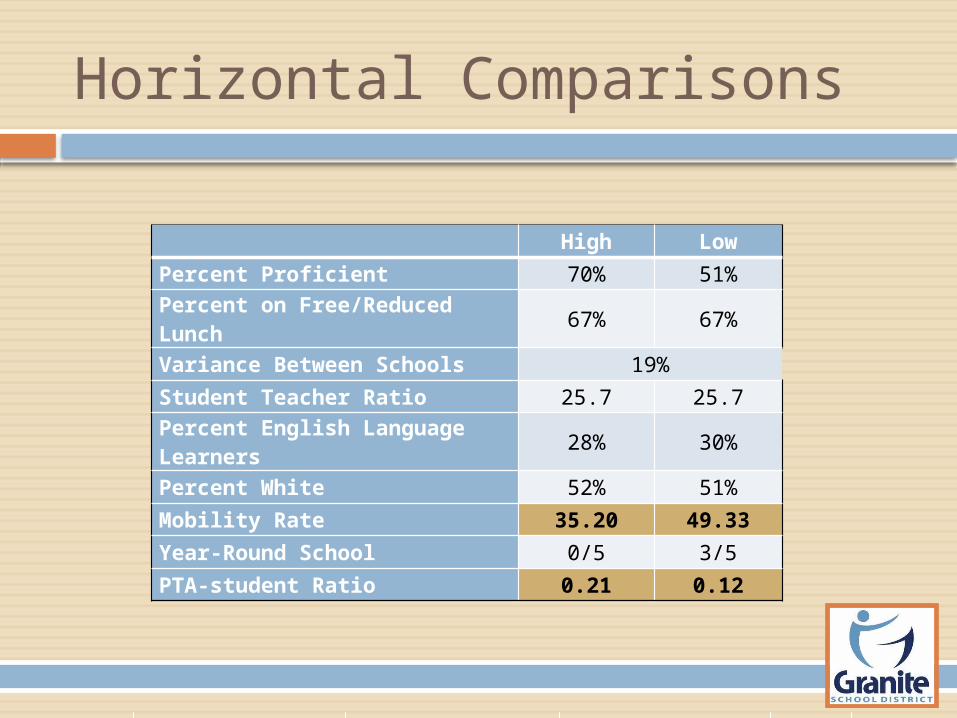
Horizontal Comparisons
High Low
Percent Proficient 70% 51%Percent on Free/Reduced Lunch 67% 67%
Variance Between Schools 19%
Student Teacher Ratio 25.7 25.7Percent English Language Learners 28% 30%
Percent White 52% 51%
Mobility Rate 35.20 49.33
Year-Round School 0/5 3/5
PTA-student Ratio 0.21 0.12
Horizontal Comparisons
High Low
Percent Proficient 70% 51%Percent on Free/Reduced Lunch 67% 67%
Variance Between Schools 19%
Student Teacher Ratio 25.7 25.7Percent English Language Learners 28% 30%
Percent White 52% 51%
Mobility Rate 35.20 49.33
Year-Round School 0/5 3/5
PTA-student Ratio 0.21 0.12
School Performance by FRL
SPRING LANE
BACCHUS
WESTBROOK
BRIDGER
BEEHIVE
SANDBURG
JACKLING
HUNTER
MONROE
GOURLEY
Fitted Values
Lower Limit
40%
50%
60%
70%
80%
90%
100%
Perc
ent P
roficie
nt
0 10% 20% 30% 40% 50% 60% 70% 80% 90% 100%
Percent of School on Free or Reduced Lunch
Upper Limit
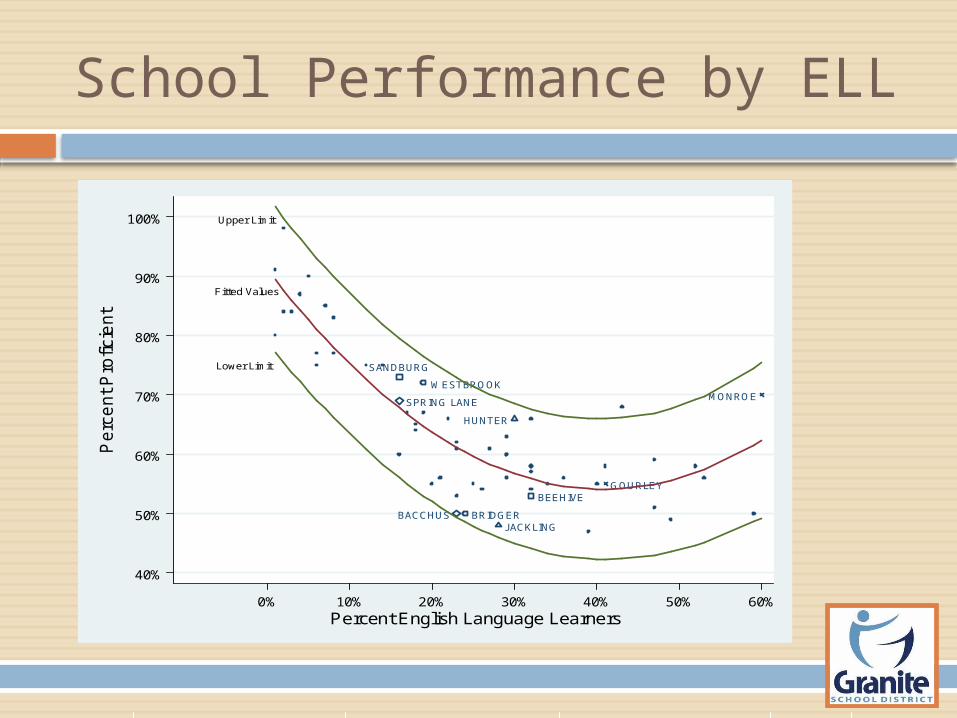
School Performance by ELL
SPRING LANE
SANDBURG
WESTBROOK
BACCHUS BRIDGERJACKLING
HUNTER
BEEHIVEGOURLEY
MONROE
Upper Limit
Fitted Values
Lower Limit
40%
60%
80%
100%
50%
70%
90%
Perc
ent P
roficie
nt
0% 20% 40% 60%10% 30% 50%
Percent English Language Learners
Final Model
Our final model uses the following factors to determine where a school should be performing: FRL and FRL2
ELL and ELL2
Percent White PTA-Student Ratio Year-Round model Year-Round × FRL
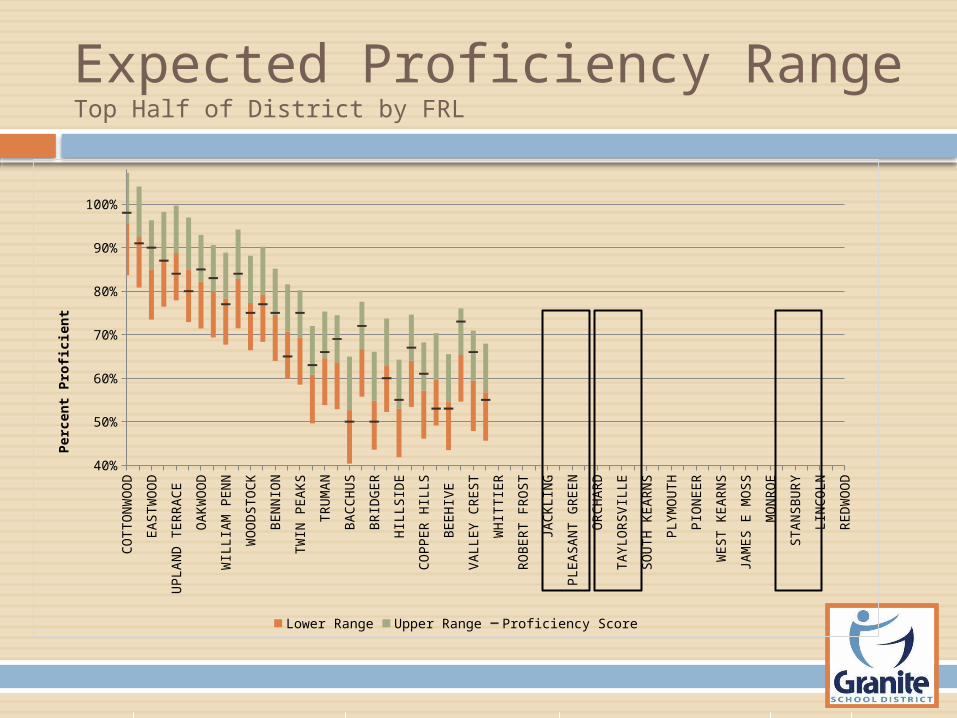
Expected Proficiency RangeTop Half of District by FRL
CO
TTO
NW
OO
D
EA
STW
OO
D
UPLA
ND
TER
RA
CE
OA
KW
OO
D
WIL
LIA
M P
EN
N
WO
OD
STO
CK
BEN
NIO
N
TW
IN P
EA
KS
TR
UM
AN
BA
CC
HU
S
BR
IDG
ER
HIL
LSID
E
CO
PPER
HIL
LS
BEEH
IVE
VA
LLEY C
REST
WH
ITTIE
R
RO
BER
T F
RO
ST
JAC
KLI
NG
PLE
ASA
NT G
REEN
OR
CH
AR
D
TA
YLO
RSV
ILLE
SO
UTH
KEA
RN
S
PLY
MO
UTH
PIO
NEER
WEST K
EA
RN
S
JAM
ES E
MO
SS
MO
NR
OE
STA
NSB
UR
Y
LIN
CO
LN
RED
WO
OD
40%
50%
60%
70%
80%
90%
100%
Lower Range Upper Range Proficiency Score
Perc
ent
Pro
ficie
nt
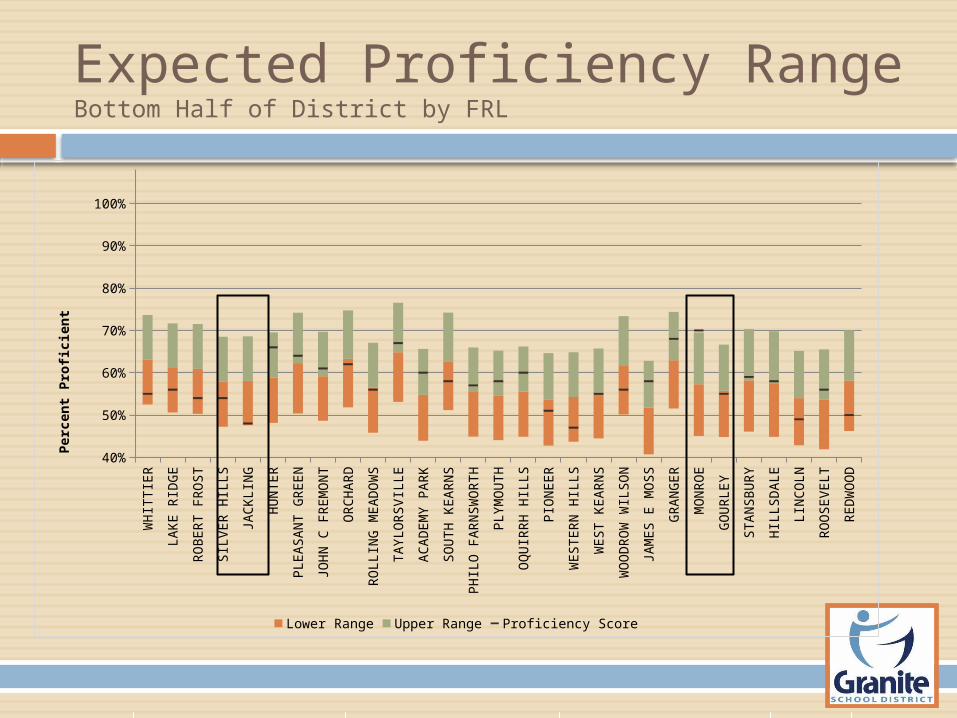
Expected Proficiency RangeBottom Half of District by FRL
WH
ITTIE
R
LAK
E R
IDG
E
RO
BER
T F
RO
ST
SIL
VER
HIL
LS
JAC
KLI
NG
HU
NTER
PLE
ASA
NT G
REEN
JOH
N C
FR
EM
ON
T
OR
CH
AR
D
RO
LLIN
G M
EA
DO
WS
TA
YLO
RSV
ILLE
AC
AD
EM
Y P
AR
K
SO
UTH
KEA
RN
S
PH
ILO
FA
RN
SW
OR
TH
PLY
MO
UTH
OQ
UIR
RH
HIL
LS
PIO
NEER
WESTER
N H
ILLS
WEST K
EA
RN
S
WO
OD
RO
W W
ILSO
N
JAM
ES E
MO
SS
GR
AN
GER
MO
NR
OE
GO
UR
LEY
STA
NSB
UR
Y
HIL
LSD
ALE
LIN
CO
LN
RO
OSEV
ELT
RED
WO
OD
40%
50%
60%
70%
80%
90%
100%
Lower Range Upper Range Proficiency Score
Perc
ent
Pro
ficie
nt
Interviews
Hope to explain the rest of the variation in school proficiency
Pairs chosen based on similar FRL rates, disparate proficiencies
Survey construction Input from Granite School District 14 questions, 7 Likert scale questions
Conducted by different pairs of interviewers
Interview Data
Small dataset prevented many avenues of analysis
Combined interviewer observations Overall reactions Items mentioned most
frequently or deemed most important
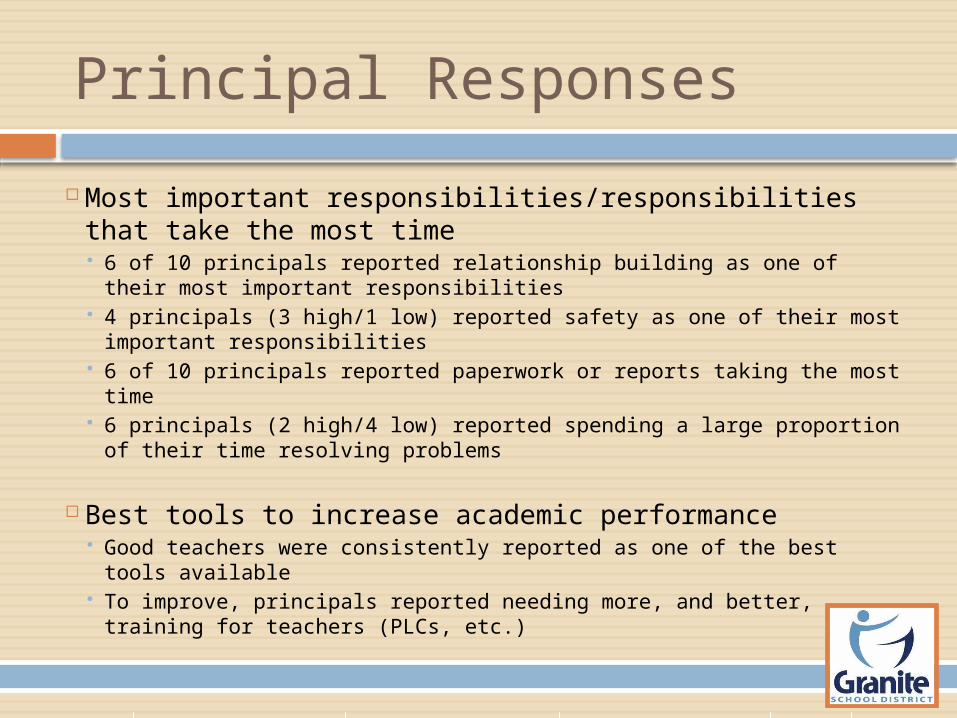
Principal Responses
Most important responsibilities/responsibilities that take the most time 6 of 10 principals reported relationship building as one of their most
important responsibilities 4 principals (3 high/1 low) reported safety as one of their most
important responsibilities 6 of 10 principals reported paperwork or reports taking the most time 6 principals (2 high/4 low) reported spending a large proportion of
their time resolving problems
Best tools to increase academic performance Good teachers were consistently reported as one of the best tools
available To improve, principals reported needing more, and better, training for
teachers (PLCs, etc.)
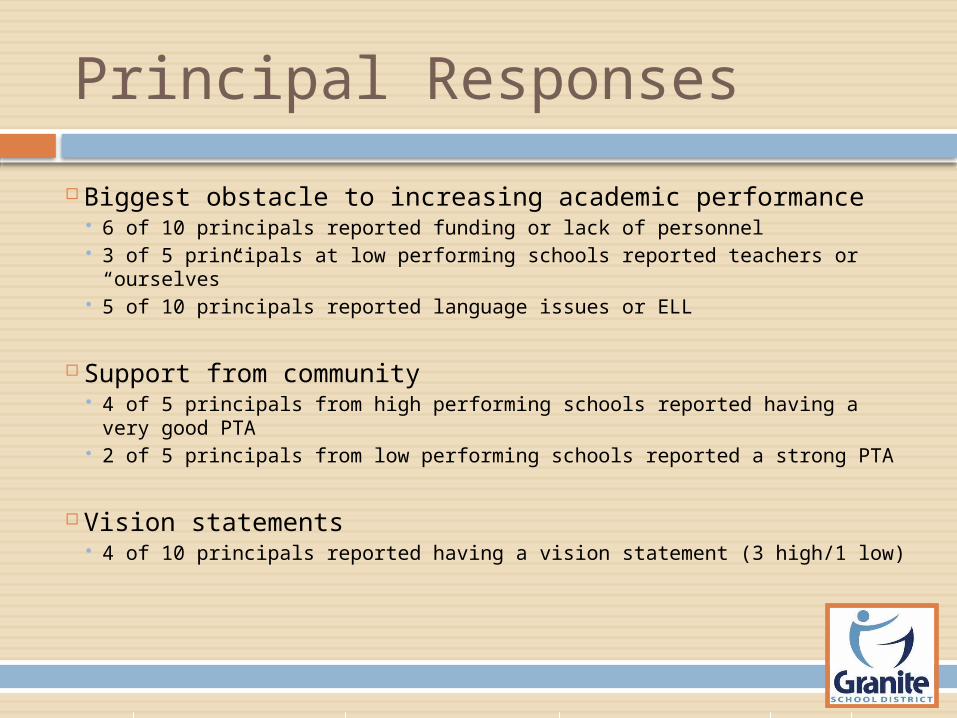
Principal Responses
Biggest obstacle to increasing academic performance 6 of 10 principals reported funding or lack of personnel 3 of 5 principals at low performing schools reported teachers or
“ourselves” 5 of 10 principals reported language issues or ELL
Support from community 4 of 5 principals from high performing schools reported having a very
good PTA 2 of 5 principals from low performing schools reported a strong PTA
Vision statements 4 of 10 principals reported having a vision statement (3 high/1 low)
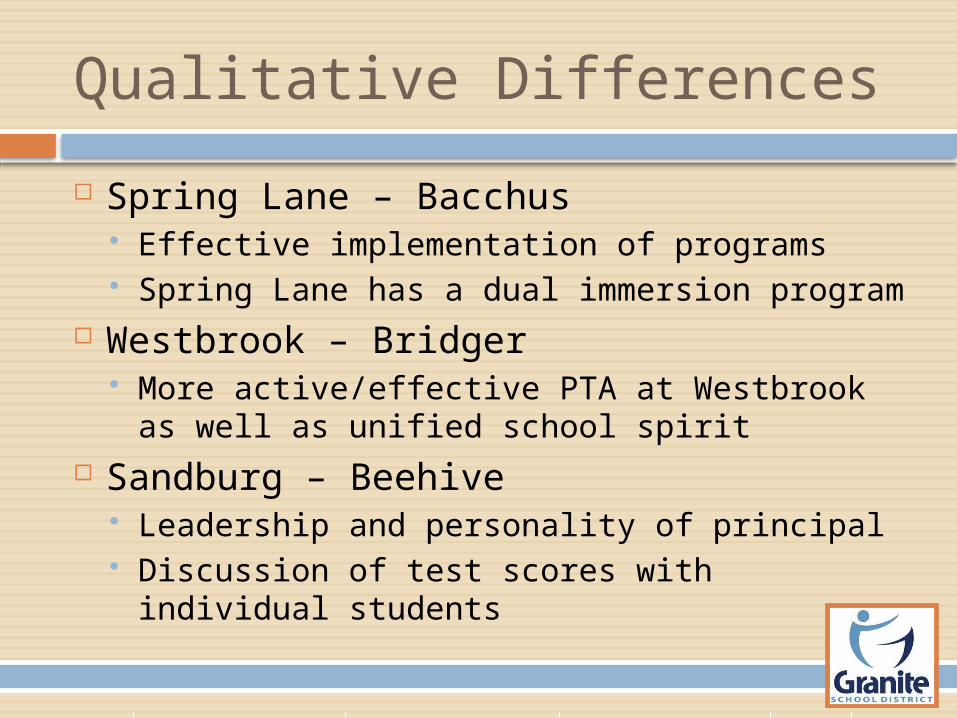
Qualitative Differences
Spring Lane – Bacchus Effective implementation of programs Spring Lane has a dual immersion program
Westbrook – Bridger More active/effective PTA at Westbrook as
well as unified school spirit Sandburg – Beehive
Leadership and personality of principal Discussion of test scores with individual
students
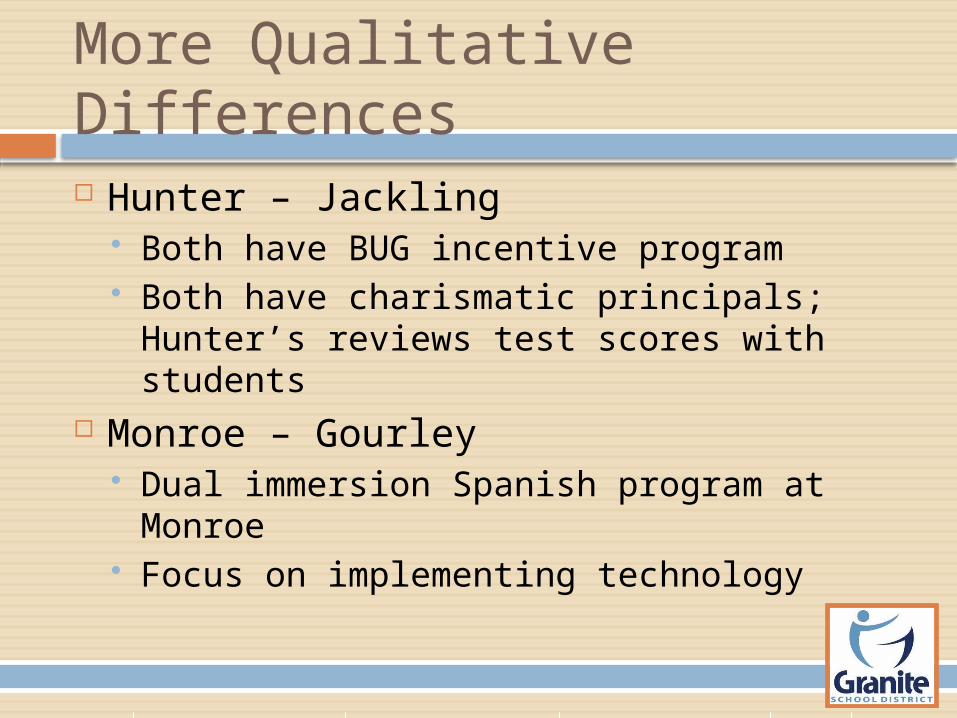
More Qualitative Differences Hunter – Jackling
Both have BUG incentive program Both have charismatic principals; Hunter’s
reviews test scores with students Monroe – Gourley
Dual immersion Spanish program at Monroe Focus on implementing technology
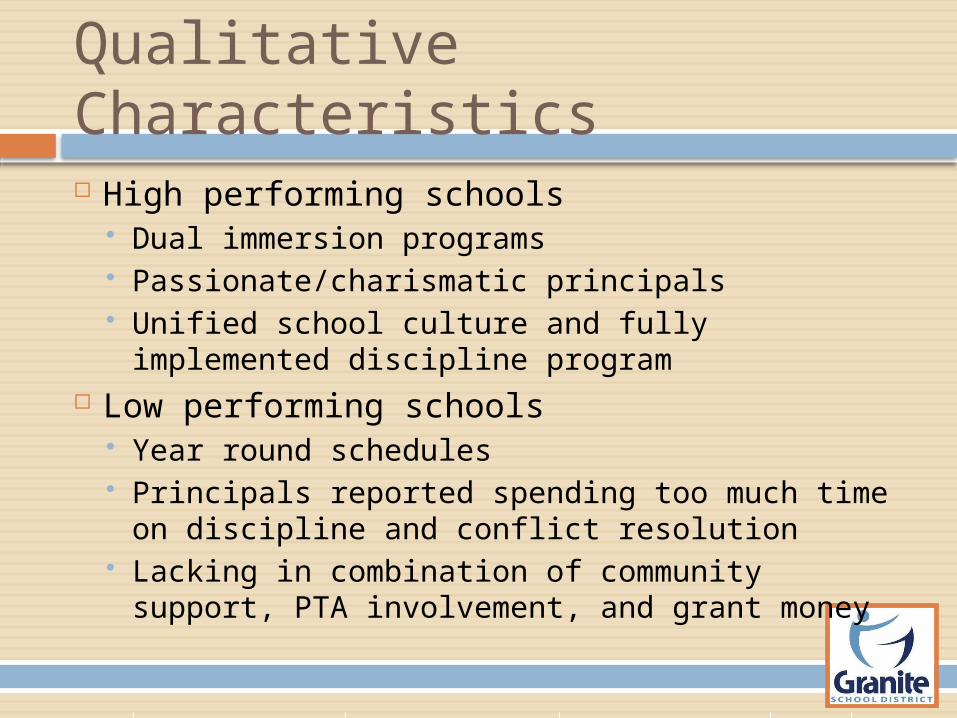
Qualitative Characteristics
High performing schools Dual immersion programs Passionate/charismatic principals Unified school culture and fully implemented
discipline program Low performing schools
Year round schedules Principals reported spending too much time on
discipline and conflict resolution Lacking in combination of community support,
PTA involvement, and grant money
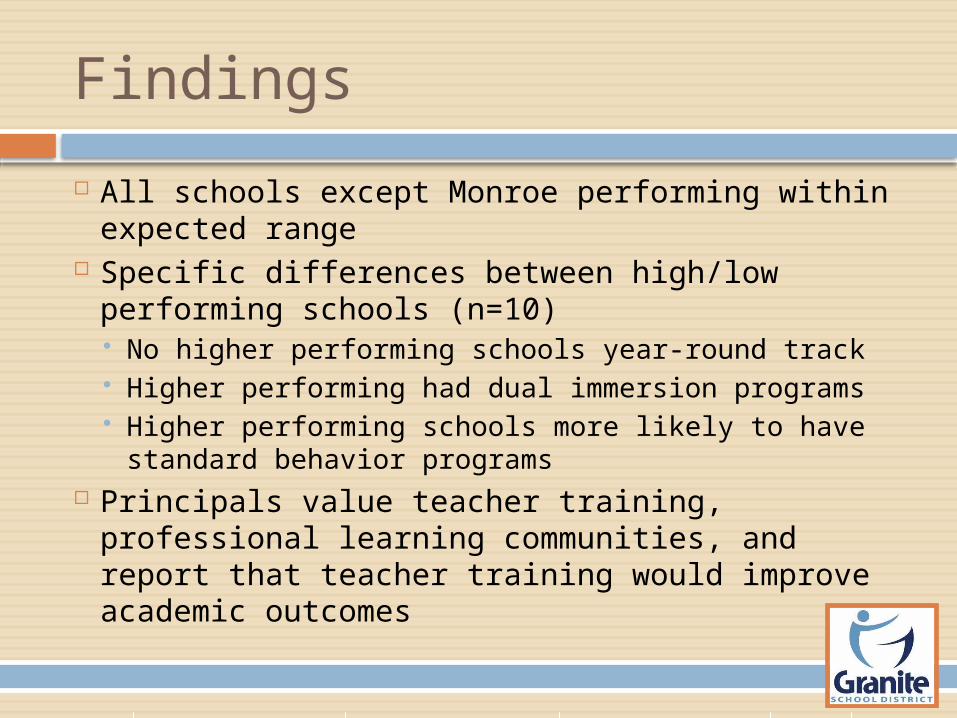
Findings
All schools except Monroe performing within expected range
Specific differences between high/low performing schools (n=10) No higher performing schools year-round track Higher performing had dual immersion programs Higher performing schools more likely to have
standard behavior programs Principals value teacher training, professional
learning communities, and report that teacher training would improve academic outcomes
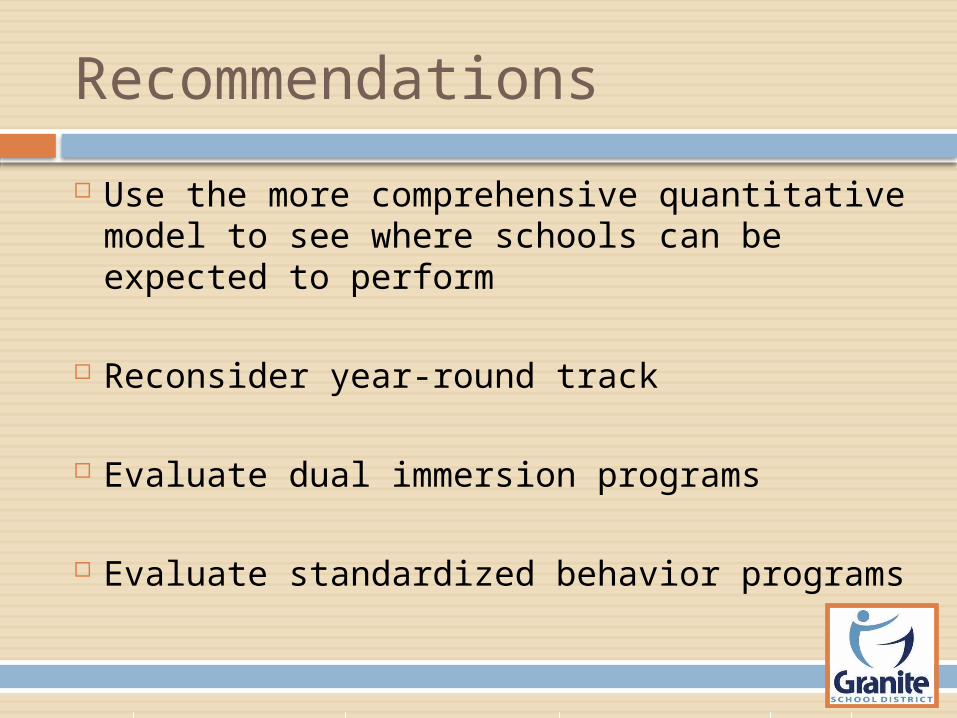
Recommendations
Use the more comprehensive quantitative model to see where schools can be expected to perform
Reconsider year-round track
Evaluate dual immersion programs
Evaluate standardized behavior programs

Questions?