Embed Size (px)
Citation preview
U.S. Department of Education February 2015
School Practices and Accountability for Students With Disabilities
Jenifer Harr-Robins Mengli Song
Michael Garet Louis Danielson
American Institutes for Research
School Practices and Accountability for Students With Disabilities
February 2015
Jenifer Harr-Robins Mengli Song Michael Garet Louis Danielson American Institutes for Research
Jonathan Jacobson Project Officer Institute of Education Sciences
NCEE 2015-4006 U.S. DEPARTMENT OF EDUCATION
School Practices and Accountability for Students With Disabilities
U.S. Department of Education Arne Duncan Secretary
Institute of Education Sciences Sue Betka Acting Director
National Center for Education Evaluation and Regional Assistance Ruth Curran Neild Commissioner
February 2015
This report was prepared for the Institute of Education Sciences under Contract ED-04-CO-0025/0013. The project officer is Jonathan Jacobson in the National Center for Education Evaluation and Regional Assistance.
IES evaluation reports present objective information on the conditions of implementation and impacts of the programs being evaluated. IES evaluation reports do not include conclusions or recommendations or views with regard to actions policymakers or practitioners should take in light of the findings in the report.
This report is in the public domain. Authorization to reproduce it in whole or in part is granted. While permission to reprint this publication is not necessary, the citation should read: Harr-Robins, J., Song, M., Garet, M., & Danielson, L. (2015). School Practices and Accountability for Students With Disabilities (NCEE 2015-4006). Washington, DC: National Center for Education Evaluation and Regional Assistance, Institute of Education Sciences, U.S. Department of Education.
This report is available on the Institute of Education Sciences website at http://ies.ed.gov/ncee.
Alternate Formats: Upon request, this report is available in alternate formats, such as Braille, large print, audiotape, or computer diskette. For more information, please contact the Department’s Alternate Format Center at 202-260-9895 or 202-205-8113.
ii
School Practices and Accountability for Students With Disabilities
Acknowledgments The authors greatly appreciate the school principals and school staff who participated in the study surveys on which this report is based. We also credit Cynthia Simko, Evan Nielsen, Jessica Knoerzer, and the rest of the NORC team at the University of Chicago for a successful survey administration and respondent outreach. We further thank the members of our Technical Working Group—Tom Cook, Lizanne DeStefano, Douglas Fuchs, Pete Goldschmidt, Brian Gong, Larry Hedges, Margaret McLaughlin, and Martha Thurlow—who provided valuable insights and guidance on survey development and presentation of findings for this report. Finally, we would like to thank Phil Esra and Emma Ruckley, whose excellent editorial skills helped make the report useful and understandable.
iii

School Practices and Accountability for Students With Disabilities
Disclosure of Potential Conflicts of Interest The research team for this study consists of key staff from American Institutes for Research. The organization and key staff members do not have financial interests that could be affected by findings from the study. None of the members of the Technical Working Group, convened by the research team to provide advice and guidance, have financial interests that could be affected by findings from the study.
iv
School Practices and Accountability for Students With Disabilities
Contents Executive Summary .................................................................................................................... xvii
Study Background and Research Questions ............................................................................ xvii Data Sources, Sample, and Analytic Methods ....................................................................... Summary of Findings ............................................................................................................... Conclusion xxiv ..............................................................................................................................
Chapter 1: Introduction ................................................................................................................... Logic Model ................................................................................................................................
Chapter 2: Study Design ................................................................................................................. Data Sources ................................................................................................................................ Determining “SWD Accountability” .......................................................................................... Survey Sample ............................................................................................................................. Analysis Methods ........................................................................................................................ Caveat ........................................................................................................................................
Chapter 3: Accountability Context for School Practices .............................................................. School Accountability for the SWD Subgroup ......................................................................... School Accountability for Other Subgroups ............................................................................. Summary ...................................................................................................................................
Chapter 4: School Characteristics and Staffing in SWD-Accountable and Non-SWD-Accountable Schools .....................................................................................................................
School Characteristics ............................................................................................................... Central District Programs for Students with Disabilities .......................................................... Staffing ...................................................................................................................................... Summary ...................................................................................................................................
Chapter 5: School Programs and Student Support Strategies in SWD-Accountable and Non-SWD-Accountable Schools ...........................................................................................................
School Programs ....................................................................................................................... Student Support Strategies ........................................................................................................ Summary ...................................................................................................................................
Chapter 6: Instructional Time, Structure, and Settings in SWD-Accountable and Non-SWD-Accountable Schools .....................................................................................................................
Instructional Time and Structure ...............................................................................................
v
xviii xix
1
2
4
4
5
5
9
10
11
11
15
18
20
20
22
23
25
26
26
27
29
31
31
School Practices and Accountability for Students With Disabilities
Instructional Settings ................................................................................................................. Summary ...................................................................................................................................
Chapter 7: Teacher Collaboration and Professional Development in SWD-Accountable and Non-SWD-Accountable Schools ...................................................................................................
Summary ...................................................................................................................................
References .....................................................................................................................................
Appendix A: Principal and Special Education Designee Surveys ................................................
Appendix B: Chapter 2, Study Design Tables ..............................................................................
Appendix C: Chapter 3, Accountability Context for School Practices—State-Level Tables .......
Appendix D: Chapter 4, School Characteristics and Staffing in SWD-Accountable and Non-SWD-Accountable Schools—State-Level Tables .........................................................................
Appendix E: Chapter 5, School Programs and Student Support Strategies in SWD-Accountable and Non-SWD-Accountable Schools—State-Level Tables...................................
Appendix F: Chapter 6, Instructional Time, Structure, and Settings in SWD-Accountable and Non-SWD-Accountable Schools—State-Level Tables ........................................................
Appendix G: Chapter 7, Teacher Collaboration and Professional Development in SWD-Accountable and Non-SWD-Accountable Schools—State-Level Tables...................................
vi
34
39
41
44
45
46
68
71
84
115
132
175
School Practices and Accountability for Students With Disabilities
Exhibits Exhibit 1-1. Logic Model for the Relationships Among School Accountability, School
Practices, and Student and School Outcomes ............................................................. Exhibit 2-1. Steps in Sampling States and Schools for the School Practice Survey ....................... Exhibit 2-2. Number of Elementary and Middle Schools Eligible for Survey Analysis, by
State and by SWD-Accountability Status Between 2005–06 and 2007–08 ............... Exhibit 3-1. Number and Percentage of All Public Elementary and Middle Schools by
SWD-Accountability Status From 2005–06 to 2007–08 (29 States) ........................ Exhibit 3-2. Percentage of All Public Elementary Schools, by State and SWD-
Accountability Status From 2005–06 to 2007–08 (29 States, Sorted by the Percentage of Always-SWD-Accountable Schools) .................................................
Exhibit 3-3. Percentage of All Public Middle Schools, by State and SWD-Accountability Status From 2005–06 to 2007–08 (29 States, Sorted by the Percentage of Always-SWD-Accountable Schools) ........................................................................
Exhibit 3-4. Number and Percentage of Public Elementary and Middle Schools Accountable for the SWD Subgroup in 2009–10, by SWD-Accountability Status From 2005–06 to 2007–08 (29 States) ...........................................................
Exhibit 3-5. Percentage of Public Elementary and Middle Schools Accountable for the Economically Disadvantaged Subgroup and the English Language Learner Subgroup in 2009–10, by SWD-Accountability Status From 2005–06 to 2007–08 (29 States) ..................................................................................................
Exhibit 3-6. Percentage of Public Elementary and Middle Schools That Were Identified for School Improvement and Percentage of Schools That Made AYP in 2009–10, by SWD-Accountability Status From 2005–06 to 2007–08 (28 States) ........................................................................................................................
Exhibit 4-1. Characteristics of Elementary and Middle Schools in 2010–11, by SWD-Accountability Status Between 2005–06 and 2007–08 ............................................
Exhibit 4-2. Characteristics of District Programs for Students With Disabilities in Elementary and Middle Schools in 2010–11, by SWD-Accountability Status Between 2005–06 and 2007–08 ..................................................................................
Exhibit 4-3. Average Number of Staff per 100 Students With Disabilities in Elementary and Middle Schools in 2010–11, by Staff Type and SWD-Accountability Status Between 2005–06 and 2007–08 .....................................................................
Exhibit 5-1. Percentage of Elementary and Middle Schools That Implemented Specified School Programs Between 2005–06 and 2010–11, by SWD-Accountability Status Between 2005–06 and 2007–08 .....................................................................
Exhibit 5-2. Percentage of Elementary and Middle Schools That Used Specified Student Support Strategies, to Some Extent or to a Great Extent in 2010–11, by SWD-Accountability Status Between 2005–06 and 2007–08 ..................................
Exhibit 6-1. Percentage of Elementary and Middle Schools by the Amount of Instructional Time Students Received in Mathematics and Reading in 2010–11, by Grade and SWD-Accountability Status Between 2005–06 and 2007–08 ...............................................................................................................................
Exhibit 6-2. Percentage of Elementary and Middle Schools That Used Specified Instructional Time Strategies in 2010–11, by SWD-Accountability Status Between 2005–06 and 2007–08 ................................................................................
vii
3 7
9
12
13
14
15
16
17
21
23
24
27
29
32
33
School Practices and Accountability for Students With Disabilities
Exhibit 6-3. Average Percentage of Students With Disabilities in Elementary and Middle Schools Receiving Extended Instructional Time in Mathematics and Reading in 2010–11, by SWD-Accountability Status Between 2005–06 and 2007–08 .........
Exhibit 6-4. Percentage of Elementary and Middle Schools That Deliberately Moved Students With Disabilities From Self-Contained Classrooms to Regular Education Classrooms Between 2005–06 and 2010–11, by SWD-Accountability Status Between 2005–06 and 2007–08 ............................................
Exhibit 6-5. Percentage of Students With Disabilities in Elementary and Middle Schools by Time Spent in Regular Education Classrooms in 2010–11, by SWD-Accountability Status Between 2005–06 and 2007–08 ............................................
Exhibit 6-6. Average Percentage of Students With Disabilities in Elementary and Middle Schools Receiving Mathematics Instruction in Different Types of Classroom Settings in 2010–11, by SWD-Accountability Status Between 2005–06 and 2007–08 .....................................................................................................................
Exhibit 6-7. Average Percentage of Students With Disabilities in Elementary and Middle Schools Receiving Reading Instruction in Different Types of Classroom Settings in 2010–11, by SWD-Accountability Status Between 2005–06 and 2007–08 .....................................................................................................................
Exhibit 7-1. Percentage of Elementary and Middle Schools That Used Specified Teacher Collaboration Strategies in 2010–11, to Some Extent or to a Great Extent, by SWD-Accountability Status Between 2005–06 and 2007–08 ..................................
Exhibit 7-2. Percentage of Elementary and Middle Schools by the Amount of Professional Development (PD) and Coaching Provided During the Past 12 Months, by SWD-Accountability Status Between 2005–06 and 2007–08 ...............
Exhibit B-1. Number of Schools in the Target Population, Survey Sample, and Analysis Sample, by SWD-Accountability Status and School Level ......................................
Exhibit B-2. Number of Elementary Schools Eligible for Survey Analysis and Response Rates for Principals and Special Education Designees, by State and by SWD-Accountability Status Between 2005–06 and 2007–08 ..................................
Exhibit B-3. Number of Middle Schools Eligible for Survey Analysis and Response Rates for Principals and Special Education Designees, by State and by SWD-Accountability Status Between 2005–06 and 2007–08 ............................................
Exhibit C-1. Number and Percentage of All Public Elementary Schools, by State and SWD-Accountability Status From 2005–06 to 2007–08 (29 States) ........................
Exhibit C-2. Number and Percentage of All Public Middle Schools, by State and SWD-Accountability Status From 2005–06 to 2007–08 (29 States) ..................................
Exhibit C-3. Number and Percentage of Elementary Schools Accountable for the SWD Subgroup in 2009–10, by State and SWD-Accountability Status From 2005–06 to 2007–08 ............................................................................................................
Exhibit C-4. Number and Percentage of Middle Schools Accountable for the SWD Subgroup in 2009–10, by State and SWD-Accountability Status From 2005–06 to 2007–08 ............................................................................................................
Exhibit C-5. Number and Percentage of Elementary Schools Accountable for the Economically Disadvantaged Subgroup in 2009–10, by State and SWD-Accountability Status From 2005–06 to 2007–08 ....................................................
Exhibit C-6. Number and Percentage of Middle Schools Accountable for the
viii
34
35
36
37
38
42
43
69
70
70
72
73
74
75
76
School Practices and Accountability for Students With Disabilities
Economically Disadvantaged Subgroup in 2009–10, by State and SWD-Accountability Status From 2005–06 to 2007–08 ....................................................
Exhibit C-7. Number and Percentage of Elementary Schools Accountable for the English Language Learner Subgroup in 2009–10, by State and SWD-Accountability Status From 2005–06 to 2007–08 .............................................................................
Exhibit C-8. Number and Percentage of Middle Schools Accountable for the English Language Learner Subgroup in 2009–10, by State and SWD-Accountability Status From 2005–06 to 2007–08 .............................................................................
Exhibit C-9. Number and Percentage of Elementary Schools Identified for School Improvement in 2009–10, by State and SWD-Accountability Status From 2005–06 to 2007–08 ..................................................................................................
Exhibit C-10. Number and Percentage of Middle Schools Identified for School Improvement in 2009–10, by State and SWD-Accountability Status From 2005–06 to 2007–08 ..................................................................................................
Exhibit C-11. Number and Percentage of Elementary Schools Making Adequate Yearly Progress (AYP) in 2009–10, by State and SWD-Accountability Status From 2005–06 to 2007–08 ..................................................................................................
Exhibit C-12. Number and Percentage of Middle Schools Making Adequate Yearly Progress (AYP) in 2009–10, by State and SWD-Accountability Status From 2005–06 to 2007–08 ..................................................................................................
Exhibit D-1. Average Total Enrollment in Elementary Schools in 2010–11, by SWD-Accountability Status Between 2005–06 and 2007–08 ............................................
Exhibit D-2. Average Total Enrollment in Middle Schools in 2010–11, by SWD-Accountability Status Between 2005–06 and 2007–08 ............................................
Exhibit D-3. Average Percentage of Students Who Are Students With Disabilities in Elementary Schools in 2010–11, by SWD-Accountability Status Between 2005–06 and 2007–08 ...............................................................................................
Exhibit D-4. Average Percentage of Students Who Are Students With Disabilities in Middle Schools 2010–11, by SWD-Accountability Status Between 2005–06 and 2007–08 ..............................................................................................................
Exhibit D-5. Average Percentage of Students Eligible to Receive Free or Reduced-Price Lunch in Elementary Schools in 2010–11, by SWD-Accountability Status Between 2005–06 and 2007–08 ................................................................................
Exhibit D-6. Average Percentage of Students Eligible to Receive Free or Reduced-Price Lunch in Middle Schools 2010–11, by SWD-Accountability Status Between 2005–06 and 2007–08 ...............................................................................................
Exhibit D-7. Average Percentage of Students Who Are Non-White or Hispanic in Elementary Schools in 2010–11, by SWD-Accountability Status Between 2005–06 and 2007–08 ...............................................................................................
Exhibit D-8. Average Percentage of Students Who Are Non-White or Hispanic in Middle Schools 2010–11, by SWD-Accountability Status Between 2005–06 and 2007–08 .....................................................................................................................
Exhibit D-9. Percentage of Urban Elementary Schools in 2010–11, by SWD-Accountability Status Between 2005–06 and 2007–08 ............................................
Exhibit D-10. Percentage of Urban Middle Schools 2010–11, by SWD-Accountability Status Between 2005–06 and 2007–08 .....................................................................
ix
77
78
79
80
81
82
83
85
86
87
88
89
90
91
92
93
94
School Practices and Accountability for Students With Disabilities
Exhibit D-11. Percentage of Suburban Elementary Schools in 2010–11, by SWD-Accountability Status Between 2005–06 and 2007–08 ............................................
Exhibit D-12. Percentage of Suburban Middle Schools 2010–11, by SWD-Accountability Status Between 2005–06 and 2007–08 .....................................................................
Exhibit D-13. Percentage of Elementary Schools in Towns in 2010–11, by SWD-Accountability Status Between 2005–06 and 2007–08 ............................................
Exhibit D-14. Percentage of Middle Schools in Towns in 2010–11, by SWD-Accountability Status Between 2005–06 and 2007–08 ............................................
Exhibit D-15. Percentage of Rural Elementary Schools in 2010–11, by SWD-Accountability Status Between 2005–06 and 2007–08 ............................................
Exhibit D-16. Percentage of Rural Middle Schools 2010–11, by SWD-Accountability Status Between 2005–06 and 2007–08 ...................................................................
Exhibit D-17. Percentage of Elementary Schools That Had Students Who Attended a Central District Program for Students With Disabilities in 2010–11, by SWD-Accountability Status Between 2005–06 and 2007–08 ................................
Exhibit D-18. Percentage of Middle Schools That Had Students Who Attended a Central District Program for Students With Disabilities in 2010–11, by SWD-Accountability Status Between 2005–06 and 2007–08 ..........................................
Exhibit D-19. Percentage of Elementary Schools That Housed a Central District Program for Students With Disabilities in 2010–11, by SWD-Accountability Status Between 2005–06 and 2007–08 ..............................................................................
Exhibit D-20. Percentage of Middle Schools That Housed a Central District Program for Students With Disabilities in 2010–11, by SWD-Accountability Status Between 2005–06 and 2007–08 ..............................................................................
Exhibit D-21. Number of Special Education Teachers per 100 Students With Disabilities in Elementary Schools in 2010–11, by SWD-Accountability Status Between 2005–06 and 2007–08 .............................................................................................
Exhibit D-22. Number of Special Education Teachers per 100 Students With Disabilities in Middle Schools 2010–11, by SWD-Accountability Status Between 2005–06 and 2007–08 ............................................................................................................
Exhibit D-23. Number of Regular Education Teachers per 100 Students With Disabilities in Elementary Schools in 2010–11, by SWD-Accountability Status Between 2005–06 and 2007–08 .............................................................................................
Exhibit D-24. Number of Regular Education Teachers per 100 Students With Disabilities in Middle Schools in 2010–11, by SWD-Accountability Status Between 2005–06 and 2007–08 .............................................................................................
Exhibit D-25. Number of Related Service Providers per 100 Students With Disabilities in Elementary Schools in 2010–11, by SWD-Accountability Status Between 2005–06 and 2007–08 .............................................................................................
Exhibit D-26. Number of Related Service Providers per 100 Students With Disabilities in Middle Schools in 2010–11, by SWD-Accountability Status Between 2005–06 and 2007–08 .......................................................................................................
Exhibit D-27. Number of Classroom Paraprofessionals per 100 Students With Disabilities in Elementary Schools in 2010–11, by SWD-Accountability Status Between 2005–06 and 2007–08 .............................................................................................
Exhibit D-28. Number of Classroom Paraprofessionals per 100 Students With Disabilities
x
95
96
97
98
99
100
101
102
103
104
105
106
107
108
109
110
111
School Practices and Accountability for Students With Disabilities
in Middle Schools in 2010–11, by SWD-Accountability Status Between 2005–06 and 2007–08 .............................................................................................
Exhibit D-29. Number of One-to-One Paraprofessionals per 100 Students With Disabilities in Elementary Schools in 2010–11, by SWD-Accountability Status Between 2005–06 and 2007–08 .............................................................................................
Exhibit D-30. Number of One-to-One Paraprofessionals per 100 Students With Disabilities in Middle Schools in 2010–11, by SWD-Accountability Status Between 2005–06 and 2007–08 .............................................................................................
Exhibit E-1. Percentage of Elementary Schools That Implemented a New Program or Curriculum in Reading or English Language Arts Between 2005–06 and 2010–11, by SWD-Accountability Status Between 2005–06 and 2007–08 ...........
Exhibit E-2. Percentage of Middle Schools That Implemented a New Program or Curriculum in Reading or English Language Arts Between 2005–06 and 2010–11, by SWD-Accountability Status Between 2005–06 and 2007–08 ...........
Exhibit E-3. Percentage of Elementary Schools That Implemented a New Program or Curriculum in Mathematics Between 2005–06 and 2010–11, by SWD-Accountability Status Between 2005–06 and 2007–08 ..........................................
Exhibit E-4. Percentage of Middle Schools That Implemented a New Program or Curriculum in Mathematics Between 2005–06 and 2010–11, by SWD-Accountability Status Between 2005–06 and 2007–08 ..........................................
Exhibit E-5. Percentage of Elementary Schools That Implemented Reading Across the Curriculum Between 2005–06 and 2010–11, by SWD-Accountability Status Between 2005–06 and 2007–08 ..............................................................................
Exhibit E-6. Percentage of Middle Schools That Implemented Reading Across the Curriculum Between 2005–06 and 2010–11, by SWD-Accountability Status Between 2005–06 and 2007–08 ..............................................................................
Exhibit E-7. Percentage of Elementary Schools That Implemented a Comprehensive School Reform Program Between 2005–06 and 2010–11, by SWD-Accountability Status Between 2005–06 and 2007–08 ..........................................
Exhibit E-8. Percentage of Middle Schools That Implemented a Comprehensive School Reform Program Between 2005–06 and 2010–11, by SWD-Accountability Status Between 2005–06 and 2007–08 ...................................................................
Exhibit E-9. Percentage of Elementary Schools That Used a Tiered Instructional Intervention System Targeting Students at Risk, to Some Extent or to a Great Extent in 2010–11, by SWD-Accountability Status Between 2005–06 and 2007–08 ............................................................................................................
Exhibit E-10. Percentage of Middle Schools That Used a Tiered Instructional Intervention System Targeting Students at Risk, to Some Extent or to a Great Extent in 2010–11, by SWD-Accountability Status Between 2005–06 and 2007–08 ...........
Exhibit E-11. Percentage of Elementary Schools That Used Positive Behavioral Interventions and Supports, to Some Extent or to a Great Extent in 2010–11, by SWD-Accountability Status Between 2005–06 and 2007–08 ...........................
Exhibit E-12. Percentage of Middle Schools That Used Positive Behavioral Interventions and Supports, to Some Extent or to a Great Extent in 2010–11, by SWD-Accountability Status Between 2005–06 and 2007–08 ..........................................
Exhibit E-13. Percentage of Elementary Schools That Used Test Preparation Instruction, to
xi
112
113
114
116
117
118
119
120
121
122
123
124
125
126
127
School Practices and Accountability for Students With Disabilities
Some Extent or to a Great Extent in 2010–11, by SWD-Accountability Status Between 2005–06 and 2007–08 ...................................................................
Exhibit E-14. Percentage of Middle Schools That Used Test Preparation Instruction, to Some Extent or to a Great Extent in 2010–11, by SWD-Accountability Status Between 2005–06 and 2007–08 ...................................................................
Exhibit E-15. Percentage of Elementary Schools That Used Instructional and Assistive Technology, to Some Extent or to a Great Extent in 2010–11, by SWD-Accountability Status Between 2005–06 and 2007–08 ..........................................
Exhibit E-16. Percentage of Middle Schools That Used Instructional and Assistive Technology, to Some Extent or to a Great Extent in 2010–11, by SWD-Accountability Status Between 2005–06 and 2007–08 ..........................................
Exhibit F-1. Percentage of Elementary Schools That Provided Two or Three Hours of Instructional Time (Versus One Hour) per Day in Mathematics in Grades 1–2 in 2010–11, by SWD-Accountability Status Between 2005–06 and 2007–08 .............................................................................................................................
Exhibit F-2. Percentage of Elementary Schools That Provided Two or Three Hours of Instructional Time (Versus One Hour) per Day in Mathematics in Grades 3–5 in 2010–11, by SWD-Accountability Status Between 2005–06 and 2007–08 .............................................................................................................................
Exhibit F-3. Percentage of Middle Schools That Provided Two or Three Hours of Instructional Time (Versus One Hour) per Day in Mathematics in Grades 6–8 in 2010–11, by SWD-Accountability Status Between 2005–06 and 2007–08 .............................................................................................................................
Exhibit F-4. Percentage of Elementary Schools That Provided Three Hours of Instructional Time (Versus One or Two Hours) per Day in Reading in Grades 1–2 in 2010–11, by SWD-Accountability Status Between 2005–06 and 2007–08 ............................................................................................................
Exhibit F-5. Percentage of Elementary Schools That Provided Three Hours of Instructional Time (Versus One or Two Hours) per Day in Reading in Grades 3–5 in 2010–11, by SWD-Accountability Status Between 2005–06 and 2007–08 ............................................................................................................
Exhibit F-6. Percentage of Middle Schools That Provided Two or Three Hours of Instructional Time (Versus One Hour) per Day in Reading in Grades 6–8 in 2010–11, by SWD-Accountability Status Between 2005–06 and 2007–08 ...........
Exhibit F-7. Percentage of Elementary Schools That Used Extended Instructional Time in 2010–11, by SWD-Accountability Status Between 2005–06 and 2007–08 ...........
Exhibit F-8. Percentage of Middle Schools That Used Extended Instructional Time in 2010–11, by SWD-Accountability Status Between 2005–06 and 2007–08 ...........
Exhibit F-9. Percentage of Elementary Schools That Used Block Scheduling in 2010–11, by SWD-Accountability Status Between 2005–06 and 2007–08 ...........................
Exhibit F-10. Percentage of Middle Schools That Used Block Scheduling in 2010–11, by SWD-Accountability Status Between 2005–06 and 2007–08 ................................
Exhibit F-11. Percentage of Elementary Schools That Used Double Dosing in English Language Arts or Mathematics in 2010–11, by SWD-Accountability Status Between 2005–06 and 2007–08 ..............................................................................
Exhibit F-12. Percentage of Middle Schools That Used Double Dosing in English
xii
128
129
130
131
133
134
135
136
137
138
139
140
141
142
143
School Practices and Accountability for Students With Disabilities
Language Arts or Mathematics in 2010–11, by SWD-Accountability Status Between 2005–06 and 2007–08 .............................................................................. 144
Exhibit F-13. Percentage of Students With Disabilities in Elementary Schools Receiving Extended Instructional Time in Mathematics in 2010–11, by SWD-Accountability Status Between 2005–06 and 2007–08 .......................................... 145
Exhibit F-14. Percentage of Students With Disabilities in Middle Schools Receiving Extended Instructional Time in Mathematics in 2010–11, by SWD-Accountability Status Between 2005–06 and 2007–08 .......................................... 146
Exhibit F-15. Percentage of Students With Disabilities in Elementary Schools Receiving Extended Instructional Time in Reading in 2010–11, by SWD-Accountability Status Between 2005–06 and 2007–08 .......................................... 147
Exhibit F-16. Percentage of Students With Disabilities in Middle Schools Receiving Extended Instructional Time in Reading in 2010–11, by SWD-Accountability Status Between 2005–06 and 2007–08 .......................................... 148
Exhibit F-17. Percentage of Elementary Schools That Deliberately Moved Students With Disabilities From Self-Contained Classrooms to Regular Education Classrooms Between 2005–06 and 2010–11, by SWD-Accountability Status Between 2005–06 and 2007–08 .............................................................................. 149
Exhibit F-18. Percentage of Middle Schools That Deliberately Moved Students With Disabilities From Self-Contained Classrooms to Regular Education Classrooms Between 2005–06 and 2010–11, by SWD-Accountability Status Between 2005–06 and 2007–08 .............................................................................. 150
Exhibit F-19. Percentage of Students With Disabilities in Elementary Schools That Spent Less Than 40 Percent of the School Day in the Regular Education Classroom in 2010–11, by SWD-Accountability Status Between 2005–06 and 2007–08 ....... 151
Exhibit F-20. Percentage of Students With Disabilities in Middle Schools That Spent Less Than 40 Percent of the School Day in the Regular Education Classroom in 2010–11, by SWD-Accountability Status Between 2005–06 and 2007–08 ........... 152
Exhibit F-21. Percentage of Students With Disabilities in Elementary Schools That Spent 80 Percent or More of the School Day in the Regular Education Classroom in 2010–11, by SWD-Accountability Status Between 2005–06 and 2007–08 ....... 153
Exhibit F-22. Percentage of Students With Disabilities in Middle Schools That Spent 80 Percent or More of the School Day in the Regular Education Classroom in 2010–11, by SWD-Accountability Status Between 2005–06 and 2007–08 ........... 154
Exhibit F-23. Percentage of Students With Disabilities in Regular Mathematics Classrooms With Regular Teachers and No/Minimal Supports in Elementary Schools in 2010–11, by SWD-Accountability Status Between 2005–06 and 2007–08 ................................................................................................................... 155
Exhibit F-24. Percentage of Students With Disabilities in Regular Mathematics Classrooms With Regular Teachers and No/Minimal Supports in Middle Schools in 2010–11, by SWD-Accountability Status Between 2005–06 and 2007–08 ................................................................................................................... 156
Exhibit F-25. Percentage of Students With Disabilities in Regular Mathematics Classrooms With Regular Teachers and Substantial Supports in Elementary Schools in 2010–11, by SWD-Accountability Status Between 2005–06 and 2007–08 ................................................................................................................... 157
xiii
School Practices and Accountability for Students With Disabilities
Exhibit F-26. Percentage of Students With Disabilities in Regular Mathematics Classrooms With Regular Teachers and Substantial Supports in Middle Schools in 2010–11, by SWD-Accountability Status Between 2005–06 and 2007–08 ................................................................................................................... 158
Exhibit F-27. Percentage of Students With Disabilities in Regular Mathematics Classrooms Co-Taught by Regular and Special Education Teachers in Elementary Schools in 2010–11, by SWD-Accountability Status Between 2005–06 and 2007–08 ............................................................................................. 159
Exhibit F-28. Percentage of Students With Disabilities in Regular Mathematics Classrooms Co-Taught by Regular and Special Education Teachers in Middle Schools in 2010–11, by SWD-Accountability Status Between 2005–06 and 2007–08 ....................................................................................................... 160
Exhibit F-29. Percentage of Students With Disabilities in Resource Rooms for Mathematics in Elementary Schools in 2010–11, by SWD-Accountability Status Between 2005–06 and 2007–08 ................................................................... 161
Exhibit F-30. Percentage of Students With Disabilities in Resource Rooms for Mathematics in Middle Schools in 2010–11, by SWD-Accountability Status Between 2005–06 and 2007–08 .............................................................................. 162
Exhibit F-31. Percentage of Students With Disabilities in Self-Contained Classrooms for Mathematics in Elementary Schools in 2010–11, by SWD-Accountability Status Between 2005–06 and 2007–08 ................................................................... 163
Exhibit F-32. Percentage of Students With Disabilities in Self-Contained Classrooms for Mathematics in Middle Schools in 2010–11, by SWD-Accountability Status Between 2005–06 and 2007–08 .............................................................................. 164
Exhibit F-33. Percentage of Students With Disabilities in Regular Reading Classrooms With Regular Teachers and No/Minimal Supports in Elementary Schools in 2010–11, by SWD-Accountability Status Between 2005–06 and 2007–08 ........... 165
Exhibit F-34. Percentage of Students With Disabilities in Regular Reading Classrooms With Regular Teachers and No/Minimal Supports in Middle Schools in 2010–11, by SWD-Accountability Status Between 2005–06 and 2007–08 ........... 166
Exhibit F-35. Percentage of Students With Disabilities in Regular Reading Classrooms With Regular Teachers and Substantial Supports in Elementary Schools in 2010–11, by SWD-Accountability Status Between 2005–06 and 2007–08 ........... 167
Exhibit F-36. Percentage of Students With Disabilities in Regular Reading Classrooms With Regular Teachers and Substantial Supports in Middle Schools in 2010–11, by SWD-Accountability Status Between 2005–06 and 2007–08 ..................... 168
Exhibit F-37. Percentage of Students With Disabilities in Regular Reading Classrooms Co-Taught by Regular and Special Education Teachers in Elementary Schools in 2010–11, by SWD-Accountability Status Between 2005–06 and 2007–08 ................................................................................................................... 169
Exhibit F-38. Percentage of Students With Disabilities in Regular Reading Classrooms Co-Taught by Regular and Special Education Teachers in Middle Schools in 2010–11, by SWD-Accountability Status Between 2005–06 and 2007–08 ........... 170
Exhibit F-39. Percentage of Students With Disabilities in Resource Rooms for Reading in Elementary Schools in 2010–11, by SWD-Accountability Status Between 2005–06 and 2007–08 ............................................................................................. 171
xiv
School Practices and Accountability for Students With Disabilities
Exhibit F-40. Percentage of Students With Disabilities in Resource Rooms for Reading in Middle Schools in 2010–11, by SWD-Accountability Status Between 2005–06 and 2007–08 ....................................................................................................... 172
Exhibit F-41. Percentage of Students With Disabilities in Self-Contained Classrooms for Reading in Elementary Schools in 2010–11, by SWD-Accountability Status Between 2005–06 and 2007–08 .............................................................................. 173
Exhibit F-42. Percentage of Students With Disabilities in Self-Contained Classrooms for Reading in Middle Schools in 2010–11, by SWD-Accountability Status Between 2005–06 and 2007–08 .............................................................................. 174
Exhibit G-1. Percentage of Elementary Schools That Used Team Teaching, to Some Extent or to a Great Extent in 2010–11, by SWD-Accountability Status Between 2005–06 and 2007–08 .............................................................................. 176
Exhibit G-2. Percentage of Middle Schools That Used Team Teaching, to Some Extent or to a Great Extent in 2010–11, by SWD-Accountability Status Between 2005–06 and 2007–08 ............................................................................................. 177
Exhibit G-3. Percentage of Elementary Schools in Which Teachers Used Student Achievement Data to Inform Instruction, to Some Extent or to a Great Extent in 2010–11, by SWD-Accountability Status Between 2005–06 and 2007–08 ................................................................................................................... 178
Exhibit G-4. Percentage of Middle Schools in Which Teachers Used Student Achievement Data to Inform Instruction, to Some Extent or to a Great Extent in 2010–11, by SWD-Accountability Status Between 2005–06 and 2007–08 ................................................................................................................... 179
Exhibit G-5. Percentage of Elementary Schools That Used Teacher Collaboration Through Common Planning Time, to Some Extent or to a Great Extent in 2010–11, by SWD-Accountability Status Between 2005–06 and 2007–08 ........... 180
Exhibit G-6. Percentage of Middle Schools That Used Teacher Collaboration Through Common Planning Time, to Some Extent or to a Great Extent in 2010–11, by SWD-Accountability Status Between 2005–06 and 2007–08 ........................... 181
Exhibit G-7. Percentage of Elementary Schools That Had at Least Three Days of Professional Development Provided During the Last 12 Months on SWD Topics for Regular Education Teachers in 2010–11, by SWD-Accountability Status Between 2005–06 and 2007–08 ................................................................... 182
Exhibit G-8. Percentage of Middle Schools That Had at Least Three Days of Professional Development Provided During the Last 12 Months on SWD Topics for Regular Education Teachers in 2010–11, by SWD-Accountability Status Between 2005–06 and 2007–08 .............................................................................. 183
Exhibit G-9. Percentage of Elementary Schools That Had at Least Weekly Coaching on SWD Topics for Regular Education Teachers in 2010–11, by SWD-Accountability Status Between 2005–06 and 2007–08 .......................................... 184
Exhibit G-10. Percentage of Middle Schools That Had at Least Weekly Coaching on SWD Topics for Regular Education Teachers in 2010–11, by SWD-Accountability Status Between 2005–06 and 2007–08 ................................................................... 185
Exhibit G-11. Percentage of Elementary Schools That Had at Least Three Days of Professional Development Provided During the Last 12 Months on SWD Topics for Special Education Teachers in 2010–11, by SWD-Accountability
xv
School Practices and Accountability for Students With Disabilities
Status Between 2005–06 and 2007–08 ................................................................... 186 Exhibit G-12. Percentage of Middle Schools That Had at Least Three Days of Professional
Development Provided During the Last 12 Months on SWD Topics for Special Education Teachers in 2010–11, by SWD-Accountability Status Between 2005–06 and 2007–08 .............................................................................. 187
Exhibit G-13. Percentage of Elementary Schools That Had at Least Weekly Coaching on SWD Topics for Special Education Teachers in 2010–11, by SWD-Accountability Status Between 2005–06 and 2007–08 .......................................... 188
Exhibit G-14. Percentage of Middle Schools That Had at Least Weekly Coaching on SWD Topics for Special Education Teachers in 2010–11, by SWD-Accountability Status Between 2005–06 and 2007–08 ................................................................... 189
xvi
School Practices and Accountability for Students With Disabilities
Executive Summary Study Background and Research Questions
Changes to federal education law—in particular, the Individuals with Disabilities Education Act (IDEA) and the Elementary and Secondary Education Act (ESEA)—have created a national conversation about accountability for students with disabilities. With the 1997 amendments, the IDEA required states to include students with disabilities in state and district assessments and to report their participation and performance. The ESEA, as reauthorized in 2001, further required states to measure and report the academic performance of all students and identified separate student subgroups, including a students with disabilities (SWD) subgroup, for the purpose of determining whether schools make adequate yearly progress (AYP).1 A student subgroup is included in determining a school’s AYP status only if it meets or exceeds the minimum subgroup size established by the state, which means that some schools are not accountable for the SWD subgroup. It is possible that school practices for students with disabilities vary with the school’s accountability for this subgroup. As part of its work to conduct a congressionally mandated national assessment of how well the IDEA is achieving its purposes (IDEA 2004, P.L. 108-446, Section 664[b]), the U.S. Department of Education’s Institute of Education Sciences (IES) contracted with American Institutes for Research (AIR) to investigate variation in school practices through the Study of School Accountability for Students With Disabilities.
The purpose of the study is to provide policy-relevant information about the education of students with disabilities by examining their inclusion in school accountability systems, and the use of school practices that may relate to their educational outcomes, in both schools that are accountable and schools that are not accountable for the performance of the SWD subgroup. The hypothesis underlying the study is that school-level accountability for the SWD subgroup may lead schools to adopt different school and instructional practices with the goal of improving the educational outcomes for this student population. While this study does not assess the effectiveness of these practices, the description of differences in school practices may identify topics for further research.
This report presents descriptive findings focusing on school practices related to staffing, student support, instructional time, educational placements, teacher collaboration, and professional development in schools explicitly held accountable for the performance of the SWD subgroup (i.e., “SWD-accountable schools”) and schools that are not accountable for the performance of the SWD subgroup (i.e., “non-SWD-accountable schools”). Relying primarily on school survey data, this report addresses the following descriptive research questions: How do school characteristics and staffing differ between SWD-accountable and non-SWD-
accountable schools? How do school programs and student support strategies differ between SWD-accountable
and non-SWD-accountable schools? How do instructional time and settings differ between SWD-accountable and non-SWD-
accountable schools?
1 The No Child Left Behind Act of 2001 (NCLB, P.L. 107-110).
xvii
School Practices and Accountability for Students With Disabilities
How do teacher collaboration and professional development differ between SWD-accountable and non-SWD-accountable schools?
Data Sources, Sample, and Analytic Methods
The research questions in this report were addressed through descriptive analyses of data from school surveys developed for this study, supplemented with data from the U.S. Department of Education EDFacts data system (2005–06 to 2009–10) and the Common Core of Data (2009–10 and 2010–11). To collect information on school practices, we developed two web-based surveys—one for the principal and one for a “special education designee” from each school, a staff member identified by the principal as knowledgeable about the school’s special education program.2 The surveys asked about school practices that occurred in 2010–11 or, for certain practices that are typically implemented over an extended time period, between 2005–06 and 2010–11.
The survey was administered between April 2011 and November 2011 to a sample of public schools in 12 states: public elementary schools in 11 states and public middle schools in 8 states. States were selected that had at least 50 eligible schools that were accountable for the SWD subgroup in 2005–06 and in at least one of the two subsequent years. Within each of these states, we sampled all eligible SWD-accountable schools. In each state with at least 30 eligible schools that were never accountable for the SWD subgroup between 2005–06 and 2007–08, we also sampled up to 350 never-accountable schools. The sampling frame was defined by data from 2005–06 to 2007–08 because 2005–06 was the first year and 2007–08 was the most recent year for which the EDFacts data needed to identify school accountability status were available at the time of sample selection. We achieved a response rate of 87 percent for the principal survey and 82 percent for the special education designee survey at the elementary school level, and 86 percent for the principal survey and 80 percent for the special education designee survey at the middle school level.
“Always-accountable schools” in this report refers to schools that were consistently accountable for the SWD subgroup from 2005–06 through 2007–08. “Never-accountable-schools” refers to schools that were not accountable for the SWD subgroup in any of the three years.
To provide a clear contrast between SWD-accountable and non-SWD-accountable schools, we restricted the analysis sample to schools that were consistently accountable for the SWD subgroup from 2005–06 through 2007–08 (described below as “always-accountable schools”) and schools that were not accountable for the SWD subgroup in any of the three years (described below as “never-accountable schools”).3 For each group of schools, we calculated the simple average of the practice measures by school level, based on data from each sample state as well as data combined across states. For states where both SWD-accountable and non-SWD-accountable schools were
2 At the conclusion of the principal survey, the principal was asked to identify the special education designee, who was then asked to complete a survey that collected information on the school’s implementation of instructional practices. Of the special education designee respondents, 70 percent were special education teachers, and the remainder identified themselves as regular education teachers, administrators, or “other.” 3 We also required that schools included in the survey analyses were classified as regular public schools from 2005–06 through 2009–10, had the same school-level designation (i.e., elementary or middle), and were operational for all five years. Although special education schools and alternative/vocational schools were included in the original sampling frame, we did not obtain a sufficient number of surveys to report on these school types and therefore restricted the anal-ysis sample to regular schools.
xviii
School Practices and Accountability for Students With Disabilities
surveyed (seven states in the elementary school sample and five states in the middle school sample), we tested the statistical significance of the differences in school practice between the two types of school within each state, as well as the average differences across states with both types of schools.
Summary of Findings
Below, we summarize the key findings for each of the research questions addressed in this report. Unless otherwise noted, the school practices discussed below were implemented in 2010–11, and the differences presented are statistically significant differences between always-accountable and never-accountable schools.
How do school characteristics and staffing differ between SWD-accountable schools and non-SWD-accountable schools? To provide context for the analyses of school practices, we examined descriptive differences between SWD-accountable and non-SWD-accountable schools in school characteristics, district programs, and staffing—features that might relate to the types of practices implemented by schools in order to address the needs of students with disabilities. Because accountability for the SWD subgroup depends on having a number of students with
disabilities greater than or equal to the minimum subgroup size, we expected SWD-accountable schools to be larger, on average, than non-SWD-accountable schools, and tohave a higher proportion of their students identified as having disabilities. Because weexpected SWD-accountable schools to be larger than non-SWD-accountable schools, theirstudent characteristics might also differ from those of non-SWD-accountable schools.
• At both the elementary and middle school levels, always-accountable schools werelarger (differences of 112 and 324 students, respectively) and had a higher percentageof students identified with disabilities (differences of 4.6 and 1.3 percentage points,respectively), compared with never-accountable schools (Exhibit 4-1).
• Always-accountable schools had a lower percentage of students who were non-White or Hispanic at the elementary school level (by 15.4 percentage points), and ahigher percentage of students eligible for free or reduced-price lunch at the middleschool level (by 6.3 percentage points), compared with never-accountable schools(Exhibit 4-1). Differences in the percentage of students who were non-White or Hispanicand in the percentage of students eligible for free and reduced-price lunch were notstatistically significant at the middle and elementary school levels, respectively.
• At the elementary school level, always-accountable schools were less likely thannever-accountable schools to be in urban settings (by 16.3 percentage points) andmore likely to be located in suburban, town, or rural locations (by 6.0, 6.0, and 4.2percentage points, respectively). At the middle school level, always-accountableschools were more likely than never-accountable schools to be urban (by 7.0percentage points) and less likely to be in towns or rural settings (by 5.4 and 7.1percentage points, respectively, Exhibit 4-1).
If they serve more students with disabilities than are served by non-SWD-accountableschools, SWD-accountable schools might be expected to use special programs for thesestudents. Some districts may set up educational programs in a central location to servestudents with disabilities with similar needs. Whether schools sent students to these district
xix
School Practices and Accountability for Students With Disabilities
programs, and whether schools operated a central program, may have played a role in the types of strategies that schools implemented for students with disabilities.
• Always-accountable schools were more likely than never-accountable schools tohave students attending a central district program for students with disabilities(differences of 7.2 percentage points for elementary schools and 18.3 percentage pointsfor middle schools, Exhibit 4-2).
• Always-accountable schools were more likely than never-accountable schools tohouse a central district program for students with disabilities (differences of 8.8percentage points for elementary schools and 7.7 percentage points for middle schools,Exhibit 4-2).
• If they serve more students with disabilities than are served by non-SWD-accountableschools, SWD-accountable schools might have fewer staff members for each student with adisability. To make it possible to compare staffing levels across schools of different sizes,we computed the number of staff per 100 students with disabilities. Although the findingsshow that always-accountable schools had lower levels of staffing per student with a disabil-ity, it is possible that they achieved greater efficiency with these staff by grouping largernumbers of students with disabilities together for services.
• Compared with never-accountable schools, always-accountable schools had morespecial education teachers per 100 students with disabilities (differences of 1.1 and1.6 special education teachers at the elementary and middle school levels, respectively,Exhibit 4-3).
• Compared with never-accountable schools, always-accountable schools had fewerstaff of various types per 100 students with disabilities (Exhibit 4-3), includingfewer:– regular education teachers, with differences of 14.6 and 8.5 teachers per 100 students
with disabilities at the elementary and middle school levels, respectively;– related service providers, with differences of 1.2 and 0.9 providers per 100 students
with disabilities at the two school levels, respectively;– classroom paraprofessionals, with differences of 3.9 and 1.6 paraprofessionals per
100 students with disabilities at the two school levels, respectively; and– one-on-one paraprofessionals assigned to students with disabilities, with differences
of 0.8 and 0.6 paraprofessionals per 100 students with disabilities, at the two schoollevels, respectively.
How do school programs and student support strategies differ between SWD-accountable schools and non-SWD-accountable schools? To improve SWD subgroup outcomes and meet AYP performance targets, SWD-accountable schools may focus on strengthening teaching and learning for all students, including students with disabilities, by adopting new instructional programs or curricula in reading/English language arts or in mathematics, or some other whole-school comprehensive reform program. Alternatively, SWD-accountable schools may adopt more targeted strategies of intervention and support for students with particular needs.
xx
School Practices and Accountability for Students With Disabilities
Across the eight strategies examined, the survey results indicate that always-accountableschools were more likely to implement six strategies at one or both school levels.
• Compared with never-accountable elementary schools, always-accountableelementary schools were more likely to adopt new reading/English language artsand mathematics programs or curricula between 2005–06 and 2010–11, withdifferences of 13.2 percentage points for reading and 13.1 percentage points formathematics. There were no significant differences in the adoption of these programs atthe middle school level (Exhibit 5-1).
• Always-accountable schools were more likely to adopt reading across thecurriculum than were never-accountable schools between 2005–06 and 2010–11 atboth the elementary and middle school levels (differences of 11.0 and 13.3 percentagepoints, respectively).
• Always-accountable schools were more likely to use, to some extent or to a greatextent, a tiered instructional intervention system and instructional and assistivetechnology at the elementary school level (differences of 11.8 and 10.3 percentagepoints, respectively), and a Positive Behavior Interventions and Supports (PBIS)system at both the elementary and middle school levels (differences of 5.3 and 10.5percentage points, respectively), relative to never-accountable schools. There were nosignificant differences in the implementation of a tiered instructional intervention systemor the provision of instructional and assistive technology at the middle school level(Exhibit 5-2).
• There were no significant differences, at either school level by SWD subgroupaccountability, in the implementation of two other comprehensive or targeted strategieswe examined: whole-school comprehensive school reform (Exhibit 5-1) and testpreparation instruction (Exhibit 5-2).
How do instructional time and settings differ between SWD-accountable schools and non-SWD-accountable schools? Schools might respond to being held accountable for SWD subgroup performance by increasing the amount of instructional time for all students and by targeting students with disabilities in particular for extended instructional opportunities. In addition, SWD-accountable schools might focus on educating students with disabilities in regular education settings to provide students with disabilities with more access to the general education curriculum than do non-SWD-accountable schools. As detailed below, the two types of schools did not differ significantly in the amount of instructional time for students with disabilities, but they did differ in the instructional settings for students with disabilities. The survey results were mixed for the hypothesis that always-accountable schools might be
expected to provide more instructional time as a strategy for improving outcomes forstudents with disabilities.
• Always-accountable middle schools were more likely than never-accountablemiddle schools to provide two or three hours per day (versus one hour) ofmathematics instruction in grades 6–8, with a difference of 7.2 percentage points.Always-accountable elementary schools were less likely than never-accountableelementary schools to provide three hours per day (versus one or two hours) ofreading instruction in grades 1–2 and grades 3–5 (differences of 9.3 and 5.3
xxi
School Practices and Accountability for Students With Disabilities
percentage points by grade span, respectively). There were no significant differences by SWD-accountability status in the percentages of schools providing two or three hours per day (versus one hour) of instruction for elementary school grades 1–2 or 3–5 in mathematics or middle school grades 6–8 in reading (Exhibit 6-1).
• Always-accountable elementary schools were more likely than never-accountableelementary schools to use extended instructional time (e.g., after-school programs),with a difference of 11.2 percentage points and more likely to use block scheduling, witha difference of 4.8 percentage points (Exhibit 6-2).
• However, always-accountable middle schools were less likely than never-accountable middle schools to use block scheduling (a difference of 9.3 percentagepoints) (Exhibit 6-2). There were no significant differences between always- and never-accountable schools at the middle school level in the use of extended instructional time(Exhibit 6-2) and, at either school level, use of double dosing in English language arts ormathematics (Exhibit 6-2) or the percentage of students with disabilities receivingextended instructional time (Exhibit 6-3).
The survey results provided support for the hypothesis that always-accountable schools mayput greater emphasis on placing students with disabilities in regular education classrooms.
• Always-accountable schools were more likely than never-accountable schools to deliberately move students with disabilities from self-contained settings to regular education classrooms between 2005–06 and 2010–11. The differences were 15.8 and 16.7 percentage points for the elementary and middle school levels, respectively (Exhibit 6-4).
• Compared with never-accountable middle schools, always-accountable middle schools had a higher percentage of students with disabilities spending 80 percent or more of the school day in regular education (with a difference of 6.3 percentage points) (Exhibit 6-5). This finding is consistent with always-accountable middle schools being more focused than never-accountable middle schools on serving students with disabilities in regular classrooms. At the elementary school level, schools did not differ by SWD-accountability status in the extent to which students with disabilities were served in regular classrooms.
• At both school levels, always-accountable schools had a higher percentage ofstudents with disabilities instructed in regular education classrooms co-taught byregular education and special education teachers and a lower percentage ofstudents with disabilities taught in resource rooms (Exhibits 6-6 and 6-7). Thedifferences for the co-taught setting were 9.9 percentage points in mathematics and 9.3percentage points in reading for elementary schools and 23.1 percentage points inmathematics and 21.5 percentage points in reading for middle schools. The differencesfor the resource room were 7.8 percentage points in mathematics and 8.8 percentagepoints in reading for elementary schools and 7.6 percentage points in mathematics and7.9 percentage points in reading for middle schools. This finding is consistent withalways-accountable schools being more focused than never-accountable schools onserving students with disabilities in regular classrooms.
xxii
School Practices and Accountability for Students With Disabilities
• Compared with never-accountable middle schools, always-accountable middleschools had a lower percentage of students with disabilities taught in regulareducation classrooms with no or minimal supports or with substantial supports, inboth mathematics and reading (Exhibits 6-6 and 6-7). The differences for the regulareducation classroom with no or minimal supports were 8.7 percentage points inmathematics and 5.2 percentage points in reading. For the regular education classroomwith substantial supports, the differences were 5.5 percentage points in mathematics and6.2 percentage points in reading. Although this is not consistent with always-accountableschools being more focused than never-accountable schools on serving students withdisabilities in regular classrooms, these results are offset by the percentages of studentswith disabilities instructed in co-taught regular education classrooms.
• The percentage of students with disabilities in elementary schools instructed in each ofthree other settings (regular classrooms without substantial supports, regular classroomswith substantial supports, and self-contained classrooms) did not differ significantly foreither mathematics or reading by schools’ accountability for the SWD subgroup. Thepercentage of students with disabilities in middle schools educated in self-containedclassrooms did not differ significantly for either mathematics or reading by the schools’SWD-accountability status (Exhibits 6-6 and 6-7).
How do teacher collaboration and professional development differ between SWD-accountable schools and non-SWD-accountable schools? Schools might respond to being held accountable for SWD subgroup performance by implementing strategies to improve teachers’ capacity to provide instruction to students with disabilities. Findings from the surveys show that compared with never-accountable schools, always-
accountable schools were more likely to use team teaching at both school levels, use studentachievement data to inform instruction at the elementary school level, and use commonteacher planning time at the middle school level. Always-accountable schools were alsomore likely to offer greater amounts of professional development (PD) and coaching relatedto instructing students with disabilities at both school levels.
• Always-accountable schools were more likely than never-accountable schools to useteam teaching to some extent or to a great extent, with differences of 20.6 percentagepoints for elementary schools and 34.2 percentage points for middle schools (Exhibit7-1).
• Always-accountable schools were more likely than never-accountable schools to usestudent achievement data, to some extent or to a great extent, to inform instructionat the elementary schools level (a difference of 2.7 percentage points) (Exhibit 7-1).Middle schools did not differ significantly by SWD-accountability status in the use ofstudent achievement data.
• Always-accountable schools were more likely than never-accountable schools to usecommon teacher planning to some extent or to a great extent at the middle schoollevel (a difference of 6.0 percentage points) (Exhibit 7-1). Elementary schools did notdiffer significantly by SWD-accountability status in the use of common teacherplanning.
xxiii
School Practices and Accountability for Students With Disabilities
• At both school levels, always-accountable schools were more likely than never-accountable schools to provide, during the last 12 months, three or more days of PDrelated to instructing students with disabilities to regular education and specialeducation teachers. The differences were 7.9 and 5.2 percentage points for regulareducation teachers and special education teachers, respectively, at the elementary schoollevel and 15.6 and 9.1 percentage points, respectively, at the middle school level(Exhibit 7-2).
• At both school levels, always-accountable schools were also more likely than never-accountable schools to provide at least monthly coaching related to instructingstudents with disabilities to regular education and special education teachers. Thedifferences were 11.5 and 10.1 percentage points for regular education teachers andspecial education teachers, respectively, at the elementary school level and 17.0 and 12.6percentage points, respectively, at the middle school level.
Conclusion
For this study, we examined differences in school characteristics and instructional practices in schools that were always SWD-accountable and schools that were never SWD-accountable between 2005–06 and 2007–08. Consistent with the subgroup accountability requirement based on the minimum subgroup size, we found that always-accountable schools on average had a larger enrollment, compared with never-accountable schools. Always-accountable schools also had a higher percentage of students identified as having disabilities, were more likely to have students attending a central district program for students with disabilities, and had more special education teachers but fewer other staff per 100 students with disabilities, compared with never-accountable schools.
With respect to programs and student support strategies, always-accountable schools were more likely than never-accountable schools to adopt new reading and mathematics instructional programs, implement a tiered instructional intervention, and provide instructional and assistive technology at the elementary school level and to adopt reading across the curriculum and implement PBIS at both school levels. Findings from this study also indicate that the two types of schools used their instructional time differently, with always-accountable schools being more likely to provide a greater amount of mathematics instruction (in middle school grades 6–8), less reading instruction (in elementary school grades 1–2 and 3–5), and extended instructional time and block scheduling at the elementary school level. Furthermore, students with disabilities in schools with different SWD-accountability status appeared to have different educational experiences in terms of instructional settings, with always-accountable schools favoring co-taught settings. At both the elementary and middle school levels, team teaching, professional development, and coaching were more evident in always-accountable schools than in never-accountable schools. At least some of these differences might be attributable to the differences in school characteristics, such as school size, student need, and available staffing, rather than to SWD-accountability status. Other factors may also have contributed to the differences between the two sets of schools.
xxiv
School Practices and Accountability for Students With Disabilities
Chapter 1: Introduction Changes to federal education law—in particular, the Individuals with Disabilities Education Act (IDEA) and the Elementary and Secondary Education Act (ESEA)—have created a national conversation about schools’ accountability for the academic performance of students with disabilities. With the 1997 amendments, the IDEA required states to include students with disabilities in state and district assessments and to report their participation and performance. The ESEA, as reauthorized in 2001, further required states to measure and report the academic performance of all students and identified separate student subgroups, including a students with disabilities (SWD) subgroup, for the purpose of determining whether schools make adequate yearly progress (AYP).4 Because certain student subgroups in the tested grades in some schools might be too small to reliably measure their overall achievement, states have set their own minimum subgroup sizes to determine whether a school should be held accountable for the performance of a given subgroup. A student subgroup is included in determining a school’s AYP status only if it meets or exceeds the minimum subgroup size established by the state.5 The minimum size for the SWD subgroup in 2009–10 ranged from a low of 5 students in Maryland to a high of 100 students in California, contributing to variation across states in the percentage of schools accountable for the performance of the SWD subgroup.6
In addition to making student performance more transparent, the ESEA also established consequences for states, districts, and schools for not achieving adequate progress. Schools that fail to make AYP for two consecutive years are identified as “in need of improvement” and are to receive technical assistance from their district and state to support their improvement efforts. Subsequent failure to make AYP results in increasingly intensive interventions, including corrective action and school restructuring. Once identified for improvement, a school must make AYP for two consecutive years to exit improvement status.
As part of its work to conduct a congressionally mandated national assessment of how well the IDEA is achieving its purposes (IDEA 2004, P.L. 108-446, Section 664[b]), the U.S. Department of Education’s Institute of Education Sciences (IES) contracted with American Institutes for Research (AIR) to conduct the Study of School Accountability for Students With Disabilities. The purpose of the study is to provide policy-relevant information about the education of students with disabilities by examining their inclusion in school accountability systems and the use of school practices that may relate to their educational outcomes in schools that are accountable and schools that are not accountable for the performance of the SWD subgroup. While this study does not assess the effectiveness of these practices, the description of differences in school practices may identify topics for further research.
4 The No Child Left Behind Act of 2001 (NCLB, P.L. 107-110). 5 For a fuller review of ESEA accountability provisions that relate to students with disabilities, please see Harr-Robins et al. (2013). 6 See Harr-Robins et al. (2013), Appendix B. According to this report, 35 percent of schools with relevant data in 44 states and the District of Columbia (DC) were accountable for SWD subgroup performance in 2009–10, representing 59 percent of the students with disabilities enrolled in these states. The percentage of schools accountable for students with disabilities varied from 7 percent in one state to 100 percent in another, with half of the states having between 16 per-cent and 93 percent of their schools designated as SWD-accountable.
1
School Practices and Accountability for Students With Disabilities
The final results of the study are presented in two reports. The first report, The Inclusion of Students With Disabilities in School Accountability Systems: An Update (Harr-Robins et al., 2013) provides descriptive information on school-level accountability, AYP performance, and school improvement status of schools accountable for SWD subgroup performance under Title I of the ESEA, as well as schools not accountable for SWD subgroup performance. It relies primarily on extant data from EDFacts, a database compiled by the U.S. Department of Education. This second report presents descriptive findings focusing on school practices related to staffing, student support, instructional time, educational placements, teacher collaboration, and professional development in schools accountable and schools not accountable for the SWD subgroup, relying primarily on survey data. Below, we describe the logic model underlying the study and the research questions addressed in this report.
Logic Model
Exhibit 1-1 depicts the study’s logic model, which illustrates the relationships among school background characteristics, school accountability status, school practices, and student and school outcomes. In this logic model, we hypothesize that a school’s background characteristics—its size and student demographics—may influence whether the school is held accountable for student subgroups, including students with disabilities. Because school accountability status for a subgroup depends on the minimum subgroup size, we would expect larger schools to be more likely to be held accountable, all else being equal. Moreover, as school demographic composition shifts, a school may go in and out of accountability from one year to the next (Harr-Robins et al., 2013).
The logic model also hypothesizes that school background characteristics are likely to have a direct effect on school practices and outcomes, including the percentage of proficient students, school AYP performance, and school improvement status (Kim & Sunderman, 2005; Krieg & Storer, 2006; Taylor, O’Day, & Le Floch, 2010). We further hypothesize that a school’s accountability status may influence the practices it adopts, which in turn may affect student and school outcomes (Dee, Jacob, & Schwartz, 2012; McMurrer, 2007; Rouse, Hannway, Goldhaber, & Figlio, 2007). At the same time, a school’s outcomes may influence the subsequent practices the school adopts, as the school responds to supports and sanctions. Thus, practices and outcomes form a kind of “feedback loop.” These hypotheses reflect key premises of the ESEA school accountability provisions—in particular, that clear definitions and targets for desired academic outcomes will provide both incentives for and indicators of improvement and that identification of districts and schools not meeting their improvement targets will help focus assistance and interventions in places where they are most needed (Taylor, O’Day, & Le Floch, 2010).
2
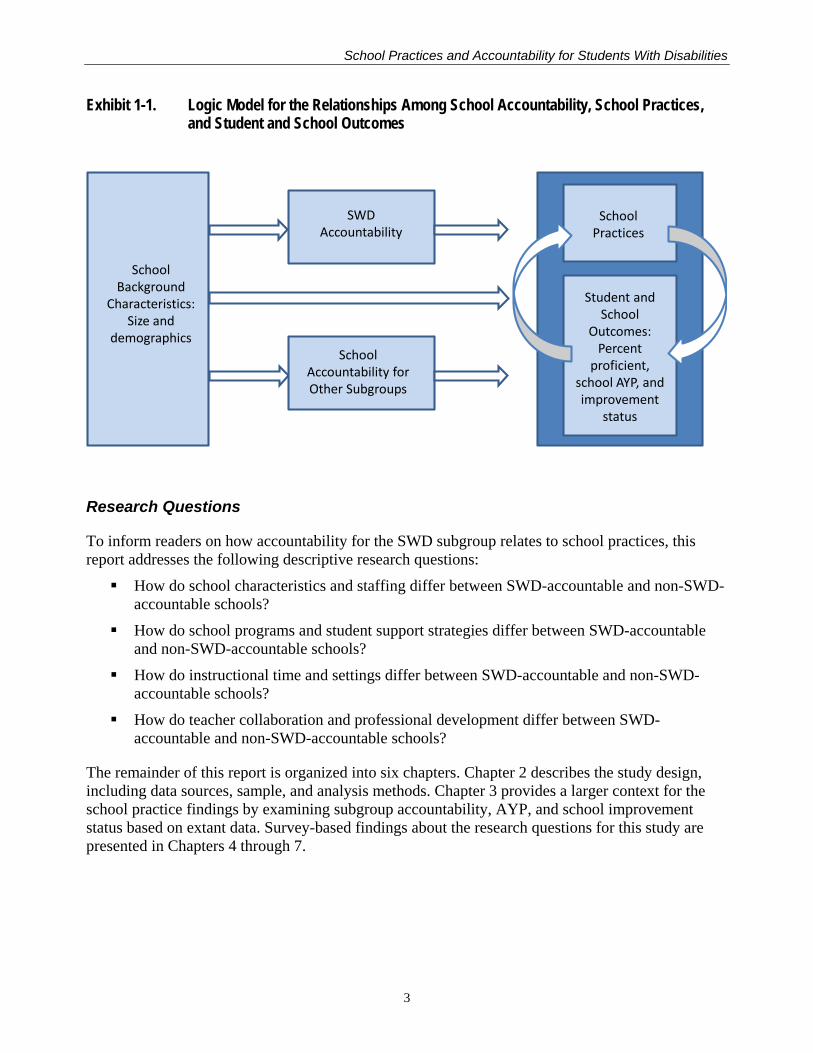
School Practices and Accountability for Students With Disabilities
Exhibit 1-1. Logic Model for the Relationships Among School Accountability, School Practices, and Student and School Outcomes
Research Questions
To inform readers on how accountability for the SWD subgroup relates to school practices, this report addresses the following descriptive research questions: How do school characteristics and staffing differ between SWD-accountable and non-SWD-
accountable schools? How do school programs and student support strategies differ between SWD-accountable
and non-SWD-accountable schools? How do instructional time and settings differ between SWD-accountable and non-SWD-
accountable schools? How do teacher collaboration and professional development differ between SWD-
accountable and non-SWD-accountable schools?
The remainder of this report is organized into six chapters. Chapter 2 describes the study design, including data sources, sample, and analysis methods. Chapter 3 provides a larger context for the school practice findings by examining subgroup accountability, AYP, and school improvement status based on extant data. Survey-based findings about the research questions for this study are presented in Chapters 4 through 7.
School Background
Characteristics: Size and
demographicsSchool
Accountability for Other Subgroups
SWD Accountability
School Practices
Student and School
Outcomes: Percent
proficient, school AYP, and improvement
status
3
School Practices and Accountability for Students With Disabilities
Chapter 2: Study Design To address the research questions about practices in SWD-accountable and non-SWD-accountable schools, the study team analyzed school survey data collected from a sample of public schools in 12 selected states: public elementary schools in 11 states and public middle schools in 8 states. To provide a broader context for the school practice results, we also examined accountability-related school characteristics—such as accountability for other student subgroups and adequate yearly progress (AYP)—of schools in 29 states with the data required for the analysis, which we refer to as the “EDFacts sample.” This chapter provides a description of the data sources, the survey sample and response rates, and the analytic methods used to address the research questions.
Data Sources
The primary data sources for this study were school surveys developed specifically for this study. In addition, we used extant data (EDFacts and Common Core of Data) to examine school accountability and demographic characteristics for contextual purposes.
Surveys
To collect information on school practices, we developed two web-based surveys—a principal survey and a special education designee survey. The surveys were administered online by NORC at the University of Chicago between April and November 2011. Although the survey sample was defined based on schools’ SWD-accountability status from 2005–06 to 2007–08 (as explained below), in most cases the survey asked about practices that occurred in 2010–11. We focused on asking about practices in 2010–11 for two reasons. First, the survey was not administered until spring 2011, and we believed it might be difficult for respondents to recall what had happened in prior years, particularly if there was staff turnover. Second, if school accountability status affects school practices, as depicted in our logic model, it may take several years for the full impact to appear. For some practices, such as the adoption of new curricula and whole-school reform programs, we asked about their adoption between 2005–06 and 2010–11, because these practices are typically implemented over an extended period of time.
The surveys included items on practices that research and policy suggest might improve outcomes for all students, as well as those that target students with disabilities. Practices were selected for the survey based on consultation with IES, Technical Working Group members, and study team members with expertise in special education practices.7 The principal survey collected information on professional development for regular education teachers, instructional time, and staffing. At the conclusion of the survey, the principal was asked to identify a school staff member who was knowledgeable about the school’s special education program. This staff nominee, known as the “special education designee,” was then asked to complete a survey collecting information on the school’s implementation of practices for all students, as well as those specific to students with disabilities, including the extent to which these practices were implemented, information on professional development for special education teachers, and the characteristics of students with disabilities, such as their disabilities and educational placements.8 Of the special education designee
7 See Appendix A for copies of the principal and special education designee surveys. 8 The principal and special education designee surveys did not include any items in common.
4
School Practices and Accountability for Students With Disabilities
respondents, 70 percent were special education teachers, and the remainder identified themselves as regular education teachers, administrators, or “other.”
EDFacts and Common Core of Data
Additional data used in this study came from EDFacts, a U.S. Department of Education (ED) initiative to collect and place K–12 performance data at the center of policy, management, and budget decisions. For this study, we used the following types of data from EDFacts for elementary and middle schools in the survey sample and in the EDFacts sample: Data on schools’ SWD-accountability status in 2005–06 through 2007–08 Data on school accountability for the economically disadvantaged subgroup and the English
language learner (ELL) subgroup in 2009–10 Data on school improvement status and adequately yearly progress (AYP) performance in
2009–10
Another extant data source for the study is the 2010–11 Common Core of Data (CCD), which provided information on school demographic characteristics—including school level, locale, poverty level, and minority concentration—for schools in the survey sample to provide context for the school practice results.
Determining “SWD Accountability”
For a school to be held accountable for the performance of a particular student subgroup, generally the number of students in that subgroup who are tested in a given subject needs to meet or exceed the minimum subgroup size (called “minimum n”) established by the state.9 To identify schools accountable for SWD performance, we used EDFacts data on the annual measurable objectives (AMOs) for mathematics or reading, which are yearly targets for the percentages of students required to score proficient or above on state assessments. For the purpose of this study, schools that met or did not meet the performance AMO for the SWD subgroup in either subject based on EDFacts data were designated as “SWD-accountable schools”; schools that reported no students with disabilities or too few such students to be accountable for the SWD subgroup for both reading and mathematics performance AMOs were designated as “non-SWD-accountable schools.”10
Survey Sample
Because of shifts in SWD-accountability status that can occur from year to year, we selected the survey sample based on schools’ SWD-accountability status over a three-year period (instead of a single year). See Exhibit 2-1 for the steps taken to draw the survey sample. First, we defined
9 A school could be accountable for the performance of a subgroup in mathematics only or reading only, or both, de-pending on the number of students tested in each subject and the state’s minimum subgroup size. The minimum group size applies to students in the tested grades, not the school’s total enrollment. Note that some states have different min-imum n requirements for performance and participation rates; thus, a school could be accountable for SWD subgroup participation but not necessarily for SWD subgroup performance, and vice versa. 10 Schools that reported no students or too few students to be accountable for the SWD subgroup for one subject and that were missing data on the AYP performance target for the other subject were also designated as “non-SWD-accountable.”
5
School Practices and Accountability for Students With Disabilities
eligible SWD-accountable schools as elementary or middle schools that were accountable for SWD performance in 2005–06 and in at least one of the two subsequent years (2006–07 and 2007–08).11 The sampling frame was defined by data from 2005–06 to 2007–08 because 2005–06 was the first year and 2007–08 was the most recent year for which the EDFacts data needed to identify school accountability status were available when we drew the sample. Because the survey sample was defined based on accountability data from three years, we further restricted the sample to schools that had the same school-level designation (elementary or middle) during the three years.12
11 We did not include high schools in the survey sample because the percentage of high schools that were accountable for the SWD subgroup was relatively low given that there is only one tested grade in high schools for accountability purposes (i.e., 23 percent in 2009–10; see Harr-Robins et al., 2013). 12 For the purpose of this study, we defined elementary schools as schools in which the lowest grade served was prekindergarten, kindergarten, 1, 2, or 3, and we defined middle schools as schools in which the lowest grade served was grade 4, 5, 6, or 7. We excluded PK–2 schools because these schools do not include any of the tested grades required by the ESEA (i.e., grades 3–8 and testing at least once between grades 10 and 12).
6
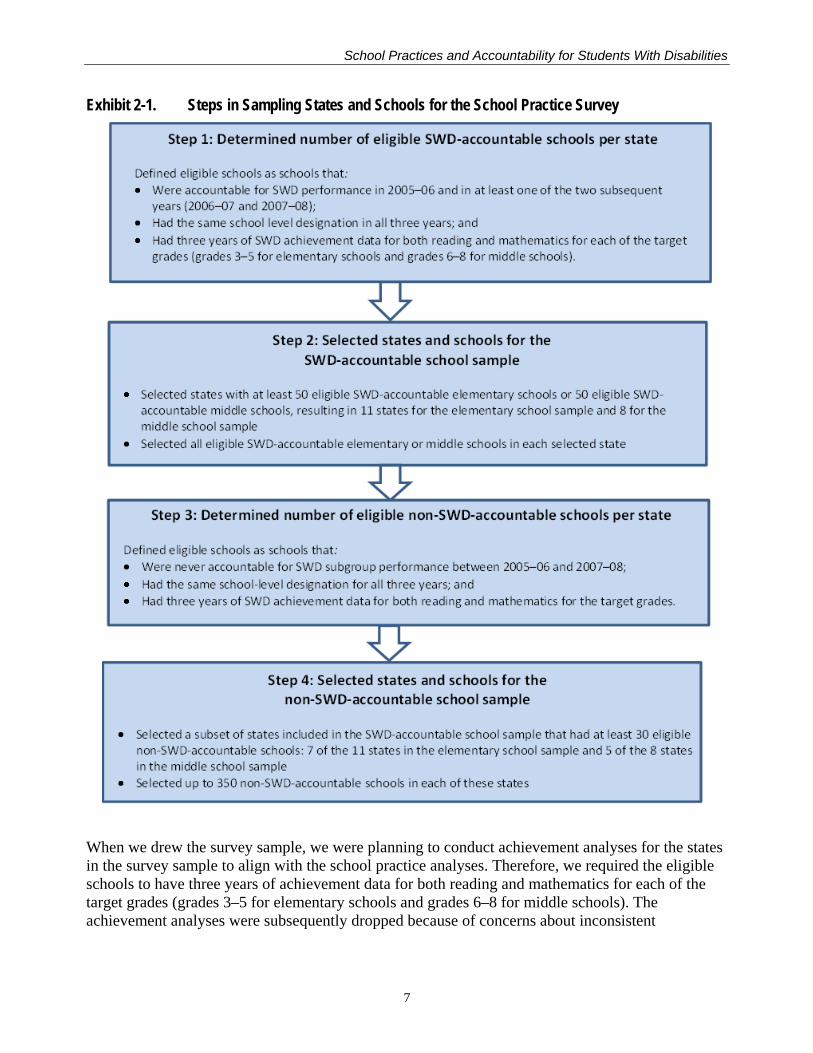
School Practices and Accountability for Students With Disabilities
Exhibit 2-1. Steps in Sampling States and Schools for the School Practice Survey
When we drew the survey sample, we were planning to conduct achievement analyses for the states in the survey sample to align with the school practice analyses. Therefore, we required the eligible schools to have three years of achievement data for both reading and mathematics for each of the target grades (grades 3–5 for elementary schools and grades 6–8 for middle schools). The achievement analyses were subsequently dropped because of concerns about inconsistent
7
School Practices and Accountability for Students With Disabilities
measurement of reading and mathematics proficiency for students with disabilities over the corresponding time period.
After identifying eligible SWD-accountable schools, we selected a total of 12 states with at least 50 eligible schools at either school level: 11 states for the elementary school sample and 8 states for the middle school sample (Exhibit 2-2 provides the list of states). Within each of these states, we included all eligible SWD-accountable schools in the survey sample, with the exception of districts where, at the request of the district, we subsampled half of the eligible SWD-accountable schools to reduce response burden.
We also surveyed a sample of non-SWD-accountable schools to enable us to examine how school practices differed for SWD-accountable and non-SWD-accountable schools. We defined eligible non-SWD-accountable schools in the sample states as those that were never accountable for SWD subgroup performance between 2005–06 and 2007–08, had the same school-level designation for all three years, and had three years of SWD achievement data for both reading and mathematics for the target grades. When drawing the sample, we also eliminated schools that were not operational in 2009–10 based on preliminary CCD data available at the time. Because our sample was restricted to schools that had SWD achievement data from 2005–06 to 2007–08 for both reading and mathematics for the target grades (grades 3–5 for elementary schools and grades 6–8 for middle schools), all non-accountable schools in our sample enrolled at least some students with disabilities in each of the three years, even though they were not accountable for the performance of the SWD subgroup in those years.
States were included in the sample of non-accountable schools if they had at least 30 eligible non-SWD-accountable schools.13 Seven of the 11 states in the elementary school sample and 5 of the 8 states in the middle school sample met this criterion. Because it was resource prohibitive to survey all the eligible non-SWD-accountable schools from these states, we sampled up to 350 non-SWD-accountable schools in each of these states. From the non-SWD-accountable schools sampled, we subsequently removed non-Title I schools in states that did not subject those schools to the same accountability sanctions as the Title I schools. As a result, some states had fewer than 30 non-SWD-accountable schools in the final sample.14
“Always-accountable schools” in this report refers to schools that were consistently accountable for the SWD subgroup from 2005–06 through 2007–08. “Never-accountable-schools” refers to schools that were not accountable for the SWD subgroup in any of the three years.
To define the final analysis sample, we restricted the survey sample in several ways. As noted above, the sample of the SWD-accountable schools included schools that were accountable in 2005–06 and in at least one of the two subsequent years. To clarify the contrast between SWD-accountable and non-SWD-accountable schools, we restricted the analysis sample to schools that were consistently accountable for the SWD subgroup from 2005–06 through 2007–08 (i.e., “always-accountable schools”) and schools that were not accountable for students with disabilities
13 We chose a lower threshold for the sample of non-accountable schools (compared with the threshold for accountable schools) because some states had very few non-accountable schools and we sought to retain as many states as possible while still having sufficient schools in each state to present state-level results. 14 These states in the sample were Florida, Minnesota, North Carolina, North Dakota, and Virginia.
8
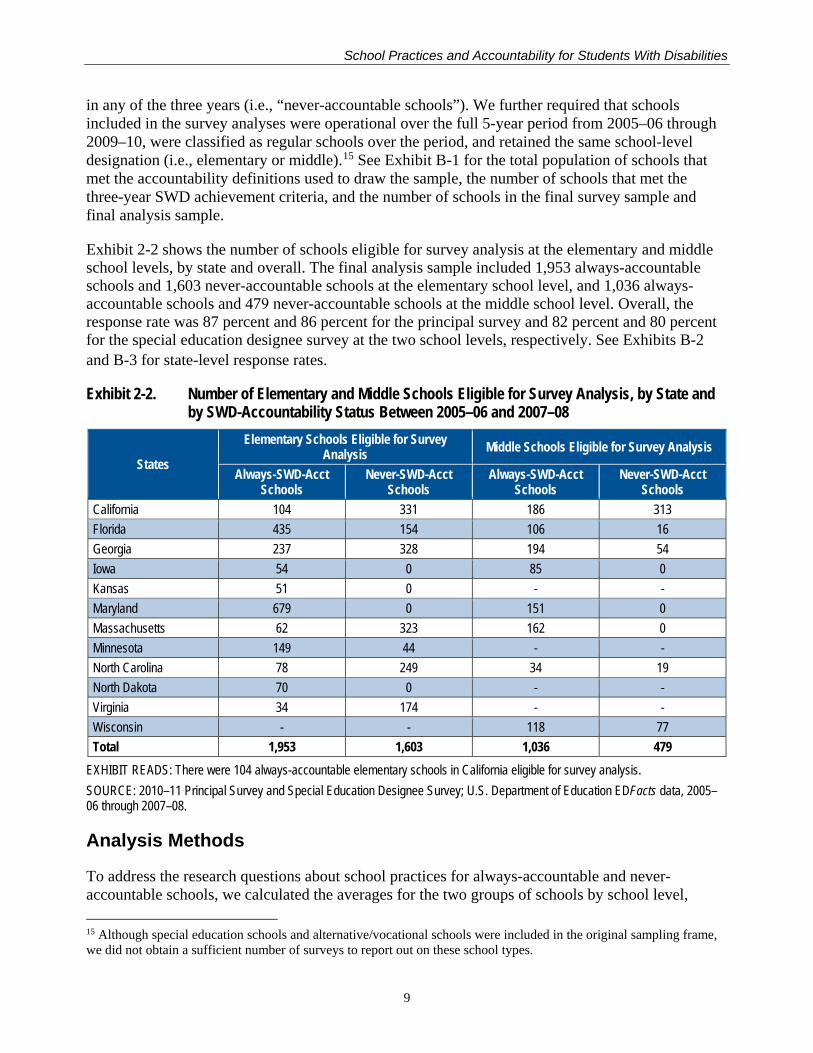
School Practices and Accountability for Students With Disabilities
in any of the three years (i.e., “never-accountable schools”). We further required that schools included in the survey analyses were operational over the full 5-year period from 2005–06 through 2009–10, were classified as regular schools over the period, and retained the same school-level designation (i.e., elementary or middle).15 See Exhibit B-1 for the total population of schools that met the accountability definitions used to draw the sample, the number of schools that met the three-year SWD achievement criteria, and the number of schools in the final survey sample and final analysis sample.
Exhibit 2-2 shows the number of schools eligible for survey analysis at the elementary and middle school levels, by state and overall. The final analysis sample included 1,953 always-accountable schools and 1,603 never-accountable schools at the elementary school level, and 1,036 always-accountable schools and 479 never-accountable schools at the middle school level. Overall, the response rate was 87 percent and 86 percent for the principal survey and 82 percent and 80 percent for the special education designee survey at the two school levels, respectively. See Exhibits B-2 and B-3 for state-level response rates.
Exhibit 2-2. Number of Elementary and Middle Schools Eligible for Survey Analysis, by State and by SWD-Accountability Status Between 2005–06 and 2007–08
States
Elementary Schools Eligible for Survey Analysis Middle Schools Eligible for Survey Analysis
Always-SWD-Acct Schools
Never-SWD-Acct Schools
Always-SWD-Acct Schools
Never-SWD-Acct Schools
California 104 331 186 313 Florida 435 154 106 16 Georgia 237 328 194 54 Iowa 54 0 85 0 Kansas 51 0 - - Maryland 679 0 151 0 Massachusetts 62 323 162 0 Minnesota 149 44 - - North Carolina 78 249 34 19 North Dakota 70 0 - - Virginia 34 174 - - Wisconsin - - 118 77 Total 1,953 1,603 1,036 479
EXHIBIT READS: There were 104 always-accountable elementary schools in California eligible for survey analysis. SOURCE: 2010–11 Principal Survey and Special Education Designee Survey; U.S. Department of Education EDFacts data, 2005–06 through 2007–08.
Analysis Methods
To address the research questions about school practices for always-accountable and never-accountable schools, we calculated the averages for the two groups of schools by school level,
15 Although special education schools and alternative/vocational schools were included in the original sampling frame, we did not obtain a sufficient number of surveys to report out on these school types.
9
School Practices and Accountability for Students With Disabilities
based on data from each individual state as well as data combined across states that had both types of schools in the analysis sample (seven states in the elementary school sample and five states in the middle school sample). This report presents differences in school practices between always-accountable and never-accountable schools across states with both types of schools. Results for individual states are provided in the appendices. Unless otherwise noted, differences between always-accountable and never-accountable schools discussed in the report are differences that were statistically significant at the .05 level.
To provide context for findings about the practices of always-accountable and never-accountable schools in the survey sample, we examined patterns of SWD-accountability status for a larger sample of schools over the same time period used to define the SWD-accountability status for the survey sample (2005–06 to 2007–08). Specifically, we examined the number and percentage of always-accountable schools, never-accountable schools, and other schools (i.e., “sometimes-accountable schools”) over the three-year time period, by state and school level. This set of analyses was based on 25,271 elementary schools and 6,889 middle schools in 29 states that reported the relevant EDFacts data (i.e., the EDFacts sample).
Because accountability for other student subgroups may relate to the adoption of school practices, we examined the extent to which schools in the three SWD-accountability categories in the 29 states were accountable for the economically disadvantaged subgroup and the ELL subgroup in 2009–10, the most recent year for which the relevant EDFacts data were available at the time of the analysis. Furthermore, we calculated the percentages of schools that were identified for school improvement and the percentages of schools that met AYP in 2009–10 separately for schools in each SWD-accountability category. The number of states included in these analyses dropped to 28, as Indiana did not report school improvement status and California did not report AYP data to EDFacts for that year. Because all the EDFacts analyses were based on the population of relevant schools across all states with available data (rather than a sample of schools), tests of statistical significance were not performed.
Caveat
This study is intended to provide descriptive results only. Although the logic model for this study hypothesizes that the SWD-accountability status of a school may influence its practices and programs, the findings from this descriptive study do not support causal conclusions about the relationships between SWD-accountability and school practices. Where differences were observed between always-accountable and never-accountable schools, these differences might be at least partly explained by factors other than SWD-accountability status, such as school size, student demographics, or district policy.
10
School Practices and Accountability for Students With Disabilities
Chapter 3: Accountability Context for School Practices A school’s SWD-accountability status is determined by the number of students with disabilities in the tested grades and the minimum subgroup size. Therefore, it is not a permanent status, and it may fluctuate over time as school demographic composition shifts.16 Before we discuss the findings from the survey, we provide, in this chapter, a broader context for the survey analyses by presenting the percentages of schools that were always accountable, sometimes accountable, and never accountable for the SWD subgroup between 2005–06 and 2007–08 across the 29 states in the EDFacts sample.
As shown in our logic model (see Chapter 1), both SWD accountability and accountability for other subgroups may affect the practices that schools adopt. Thus, in this chapter, we present the percentage of schools always, sometimes, and never accountable for students with disabilities that are also accountable for other student subgroups, specifically the economically disadvantaged subgroup and the English language learner subgroup. We show results for 2009–10, the most recent year for which the relevant EDFacts data were available at the time of analysis.
Our logic model also hypothesizes that school outcomes—including whether schools make adequate yearly progress (AYP) and their school improvement status—may influence the adoption of certain school practices. Thus, we examined the percentage of schools that made AYP and the percentage of schools that were identified for school improvement in 2009–10, both for schools that were always accountable and schools that were never accountable.
School Accountability for the SWD Subgroup
Three-fifths (60 percent) of elementary schools and 27 percent of middle schools were never accountable for the SWD subgroup between 2005–06 and 2007–08.
Exhibit 3-1 presents the number and percentage of public schools by SWD-accountability status from 2005–06 and 2007–08 in the 29 states in the EDFacts sample. At the elementary school level, three-fifths of schools (60 percent) were never accountable for the SWD subgroup over the three-year period, 15 percent were accountable for all three years, and 24 percent were accountable in some (but not all) years. At the middle school level, more schools fell into the always-accountable category (44 percent) than the sometimes-accountable category (29 percent) or never-accountable category (27 percent), which might be due to the fact that middle schools tended to be larger than elementary schools and therefore were more likely to meet the minimum n requirement for accountability (Harr-Robins et al., 2013).
16 Our previous report (Harr-Robins et al., 2013) showed that in the 31 states with the relevant data, 56 percent of the schools were not accountable for the SWD subgroup in any year between 2006–07 and 2009–10, 23 percent were ac-countable in all four years, and the remaining schools moved in and out of SWD accountability.
11
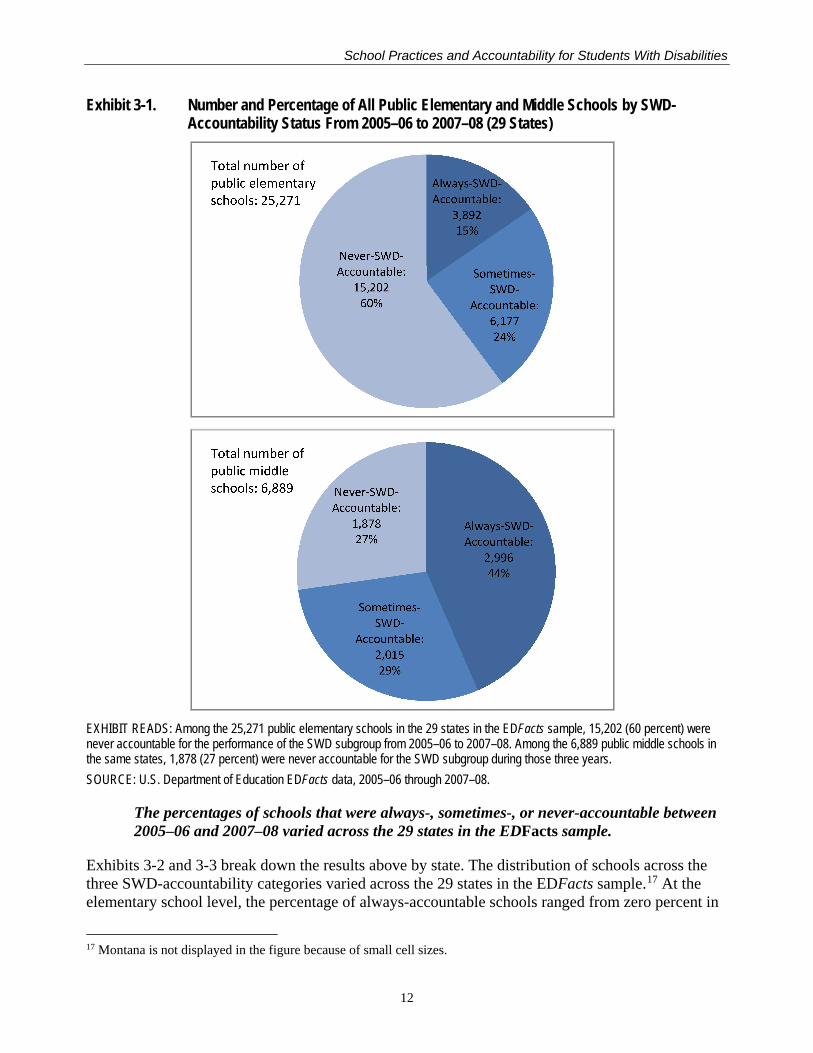
School Practices and Accountability for Students With Disabilities
Exhibit 3-1. Number and Percentage of All Public Elementary and Middle Schools by SWD-Accountability Status From 2005–06 to 2007–08 (29 States)
EXHIBIT READS: Among the 25,271 public elementary schools in the 29 states in the EDFacts sample, 15,202 (60 percent) were never accountable for the performance of the SWD subgroup from 2005–06 to 2007–08. Among the 6,889 public middle schools in the same states, 1,878 (27 percent) were never accountable for the SWD subgroup during those three years. SOURCE: U.S. Department of Education EDFacts data, 2005–06 through 2007–08.
The percentages of schools that were always-, sometimes-, or never-accountable between 2005–06 and 2007–08 varied across the 29 states in the EDFacts sample.
Exhibits 3-2 and 3-3 break down the results above by state. The distribution of schools across the three SWD-accountability categories varied across the 29 states in the EDFacts sample.17
17 Montana is not displayed in the figure because of small cell sizes.
At the elementary school level, the percentage of always-accountable schools ranged from zero percent in
12
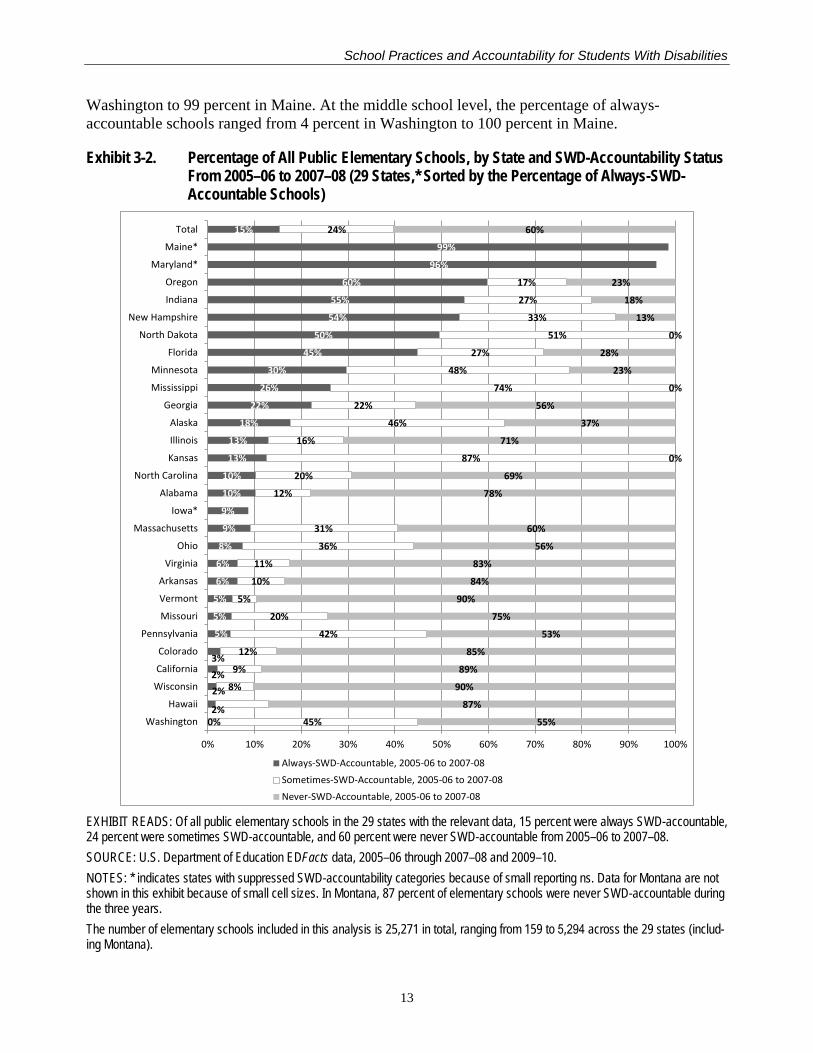
School Practices and Accountability for Students With Disabilities
Washington to 99 percent in Maine. At the middle school level, the percentage of always-accountable schools ranged from 4 percent in Washington to 100 percent in Maine.
Exhibit 3-2. Percentage of All Public Elementary Schools, by State and SWD-Accountability Status From 2005–06 to 2007–08 (29 States,* Sorted by the Percentage of Always-SWD-Accountable Schools)
EXHIBIT READS: Of all public elementary schools in the 29 states with the relevant data, 15 percent were always SWD-accountable, 24 percent were sometimes SWD-accountable, and 60 percent were never SWD-accountable from 2005–06 to 2007–08. SOURCE: U.S. Department of Education EDFacts data, 2005–06 through 2007–08 and 2009–10. NOTES: * indicates states with suppressed SWD-accountability categories because of small reporting ns. Data for Montana are not shown in this exhibit because of small cell sizes. In Montana, 87 percent of elementary schools were never SWD-accountable during the three years. The number of elementary schools included in this analysis is 25,271 in total, ranging from 159 to 5,294 across the 29 states (includ-ing Montana).
0%2%
2%2%3%
5%
5%
5%
6%
6%
8%
9%
9%
10%
10%
13%
13%
18%
22%
26%
30%
45%
50%
54%
55%
60%
96%
99%
15%
45%
8%
9%
12%
42%
20%
5%
10%
11%
36%
31%
12%
20%
87%
16%
46%
22%
74%
48%
27%
51%
33%
27%
17%
24%
55%
87%
90%
89%
85%
53%
75%
90%
84%
83%
56%
60%
78%
69%
0%
71%
37%
56%
0%
23%
28%
0%
13%
18%
23%
60%
0% 10% 20% 30% 40% 50% 60% 70% 80% 90% 100%
Washington
Hawaii
Wisconsin
California
Colorado
Pennsylvania
Missouri
Vermont
Arkansas
Virginia
Ohio
Massachusetts
Iowa*
Alabama
North Carolina
Kansas
Illinois
Alaska
Georgia
Mississippi
Minnesota
Florida
North Dakota
New Hampshire
Indiana
Oregon
Maryland*
Maine*
Total
Always-SWD-Accountable, 2005-06 to 2007-08Sometimes-SWD-Accountable, 2005-06 to 2007-08Never-SWD-Accountable, 2005-06 to 2007-08
13
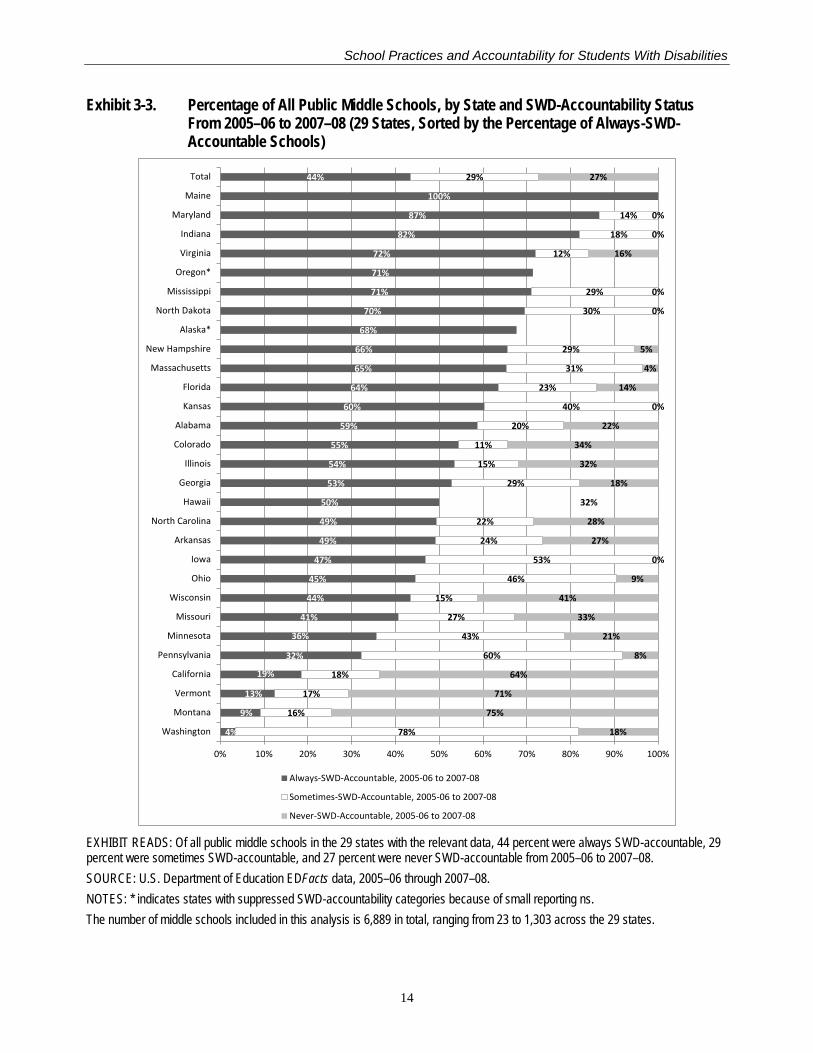
School Practices and Accountability for Students With Disabilities
Exhibit 3-3. Percentage of All Public Middle Schools, by State and SWD-Accountability Status From 2005–06 to 2007–08 (29 States, Sorted by the Percentage of Always-SWD-Accountable Schools)
EXHIBIT READS: Of all public middle schools in the 29 states with the relevant data, 44 percent were always SWD-accountable, 29 percent were sometimes SWD-accountable, and 27 percent were never SWD-accountable from 2005–06 to 2007–08. SOURCE: U.S. Department of Education EDFacts data, 2005–06 through 2007–08. NOTES: * indicates states with suppressed SWD-accountability categories because of small reporting ns. The number of middle schools included in this analysis is 6,889 in total, ranging from 23 to 1,303 across the 29 states.
4%
9%
13%
19%
32%
36%
41%
44%
45%
47%
49%
49%
50%
53%
54%
55%
59%
60%
64%
65%
66%
68%
70%
71%
71%
72%
82%
87%
100%
44%
78%
16%
17%
18%
60%
43%
27%
15%
46%
53%
24%
22%
29%
15%
11%
20%
40%
23%
31%
29%
30%
29%
12%
18%
14%
29%
18%
75%
71%
64%
8%
21%
33%
41%
9%
0%
27%
28%
32%
18%
32%
34%
22%
0%
14%
4%
5%
0%
0%
16%
0%
0%
27%
0% 10% 20% 30% 40% 50% 60% 70% 80% 90% 100%
Washington
Montana
Vermont
California
Pennsylvania
Minnesota
Missouri
Wisconsin
Ohio
Iowa
Arkansas
North Carolina
Hawaii
Georgia
Illinois
Colorado
Alabama
Kansas
Florida
Massachusetts
New Hampshire
Alaska*
North Dakota
Mississippi
Oregon*
Virginia
Indiana
Maryland
Maine
Total
Always-SWD-Accountable, 2005-06 to 2007-08
Sometimes-SWD-Accountable, 2005-06 to 2007-08
Never-SWD-Accountable, 2005-06 to 2007-08
14
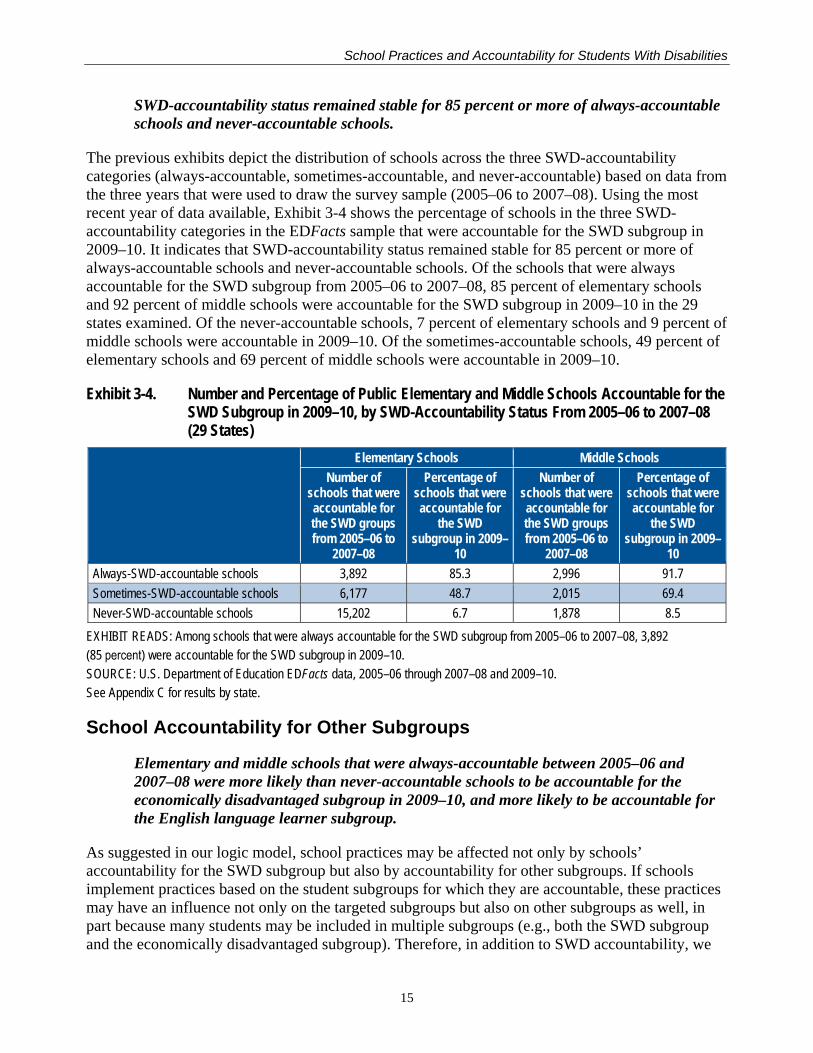
School Practices and Accountability for Students With Disabilities
SWD-accountability status remained stable for 85 percent or more of always-accountable schools and never-accountable schools.
The previous exhibits depict the distribution of schools across the three SWD-accountability categories (always-accountable, sometimes-accountable, and never-accountable) based on data from the three years that were used to draw the survey sample (2005–06 to 2007–08). Using the most recent year of data available, Exhibit 3-4 shows the percentage of schools in the three SWD-accountability categories in the EDFacts sample that were accountable for the SWD subgroup in 2009–10. It indicates that SWD-accountability status remained stable for 85 percent or more of always-accountable schools and never-accountable schools. Of the schools that were always accountable for the SWD subgroup from 2005–06 to 2007–08, 85 percent of elementary schools and 92 percent of middle schools were accountable for the SWD subgroup in 2009–10 in the 29 states examined. Of the never-accountable schools, 7 percent of elementary schools and 9 percent of middle schools were accountable in 2009–10. Of the sometimes-accountable schools, 49 percent of elementary schools and 69 percent of middle schools were accountable in 2009–10.
Exhibit 3-4. Number and Percentage of Public Elementary and Middle Schools Accountable for the SWD Subgroup in 2009–10, by SWD-Accountability Status From 2005–06 to 2007–08 (29 States)
Elementary Schools Middle Schools Number of
schools that were accountable for the SWD groups from 2005–06 to
2007–08
Percentage of schools that were accountable for
the SWD subgroup in 2009–
10
Number of schools that were accountable for the SWD groups from 2005–06 to
2007–08
Percentage of schools that were accountable for
the SWD subgroup in 2009–
10 Always-SWD-accountable schools 3,892 85.3 2,996 91.7 Sometimes-SWD-accountable schools 6,177 48.7 2,015 69.4 Never-SWD-accountable schools 15,202 6.7 1,878 8.5
EXHIBIT READS: Among schools that were always accountable for the SWD subgroup from 2005–06 to 2007–08, 3,892 (85 percent) were accountable for the SWD subgroup in 2009–10. SOURCE: U.S. Department of Education EDFacts data, 2005–06 through 2007–08 and 2009–10. See Appendix C for results by state.
School Accountability for Other Subgroups
Elementary and middle schools that were always-accountable between 2005–06 and 2007–08 were more likely than never-accountable schools to be accountable for the economically disadvantaged subgroup in 2009–10, and more likely to be accountable for the English language learner subgroup.
As suggested in our logic model, school practices may be affected not only by schools’ accountability for the SWD subgroup but also by accountability for other subgroups. If schools implement practices based on the student subgroups for which they are accountable, these practices may have an influence not only on the targeted subgroups but also on other subgroups as well, in part because many students may be included in multiple subgroups (e.g., both the SWD subgroup and the economically disadvantaged subgroup). Therefore, in addition to SWD accountability, we
15
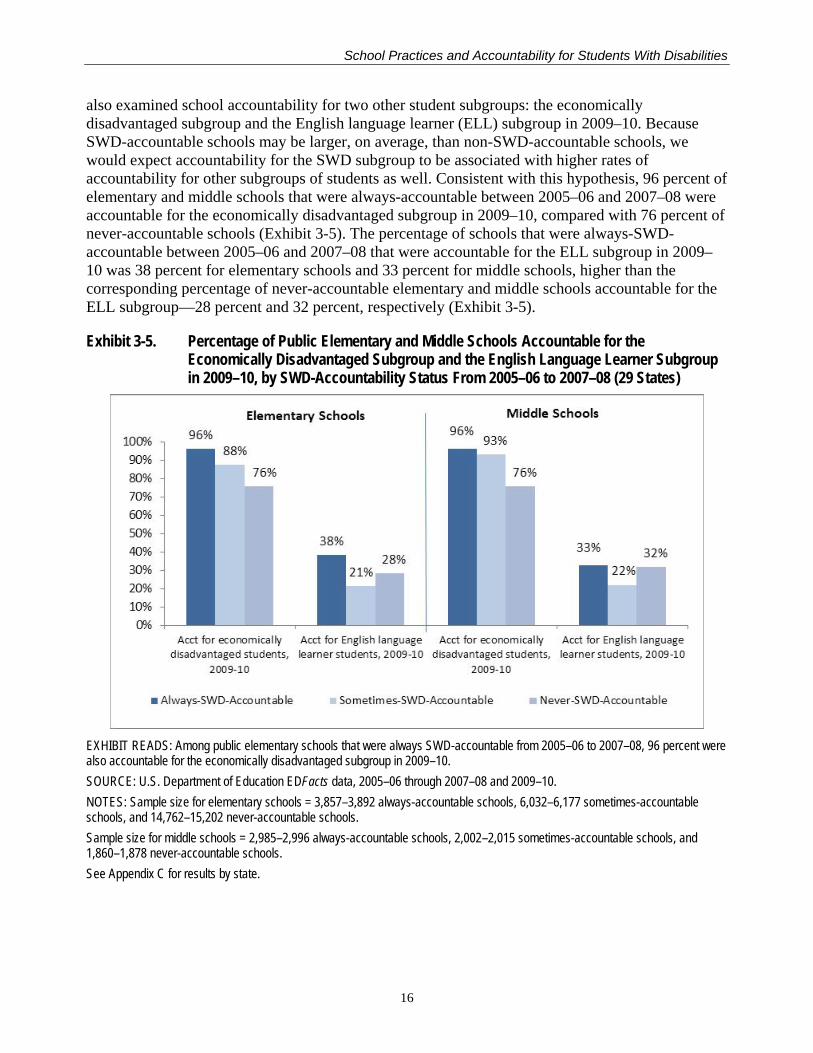
School Practices and Accountability for Students With Disabilities
also examined school accountability for two other student subgroups: the economically disadvantaged subgroup and the English language learner (ELL) subgroup in 2009–10. Because SWD-accountable schools may be larger, on average, than non-SWD-accountable schools, we would expect accountability for the SWD subgroup to be associated with higher rates of accountability for other subgroups of students as well. Consistent with this hypothesis, 96 percent of elementary and middle schools that were always-accountable between 2005–06 and 2007–08 were accountable for the economically disadvantaged subgroup in 2009–10, compared with 76 percent of never-accountable schools (Exhibit 3-5). The percentage of schools that were always-SWD- accountable between 2005–06 and 2007–08 that were accountable for the ELL subgroup in 2009–10 was 38 percent for elementary schools and 33 percent for middle schools, higher than the corresponding percentage of never-accountable elementary and middle schools accountable for the ELL subgroup—28 percent and 32 percent, respectively (Exhibit 3-5).
Exhibit 3-5. Percentage of Public Elementary and Middle Schools Accountable for the Economically Disadvantaged Subgroup and the English Language Learner Subgroup in 2009–10, by SWD-Accountability Status From 2005–06 to 2007–08 (29 States)
EXHIBIT READS: Among public elementary schools that were always SWD-accountable from 2005–06 to 2007–08, 96 percent were also accountable for the economically disadvantaged subgroup in 2009–10. SOURCE: U.S. Department of Education EDFacts data, 2005–06 through 2007–08 and 2009–10. NOTES: Sample size for elementary schools = 3,857–3,892 always-accountable schools, 6,032–6,177 sometimes-accountable schools, and 14,762–15,202 never-accountable schools. Sample size for middle schools = 2,985–2,996 always-accountable schools, 2,002–2,015 sometimes-accountable schools, and 1,860–1,878 never-accountable schools. See Appendix C for results by state.
16
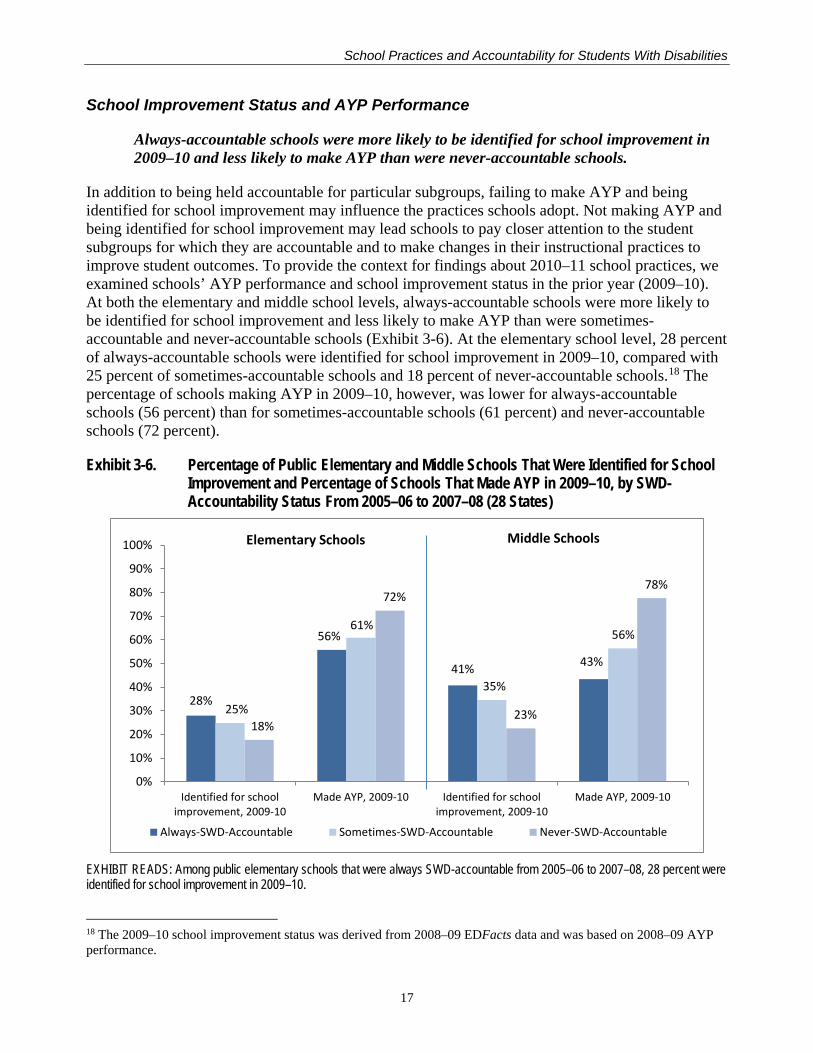
School Practices and Accountability for Students With Disabilities
School Improvement Status and AYP Performance
Always-accountable schools were more likely to be identified for school improvement in 2009–10 and less likely to make AYP than were never-accountable schools.
In addition to being held accountable for particular subgroups, failing to make AYP and being identified for school improvement may influence the practices schools adopt. Not making AYP and being identified for school improvement may lead schools to pay closer attention to the student subgroups for which they are accountable and to make changes in their instructional practices to improve student outcomes. To provide the context for findings about 2010–11 school practices, we examined schools’ AYP performance and school improvement status in the prior year (2009–10). At both the elementary and middle school levels, always-accountable schools were more likely to be identified for school improvement and less likely to make AYP than were sometimes-accountable and never-accountable schools (Exhibit 3-6). At the elementary school level, 28 percent of always-accountable schools were identified for school improvement in 2009–10, compared with 25 percent of sometimes-accountable schools and 18 percent of never-accountable schools.18 The percentage of schools making AYP in 2009–10, however, was lower for always-accountable schools (56 percent) than for sometimes-accountable schools (61 percent) and never-accountable schools (72 percent).
Exhibit 3-6. Percentage of Public Elementary and Middle Schools That Were Identified for School Improvement and Percentage of Schools That Made AYP in 2009–10, by SWD-Accountability Status From 2005–06 to 2007–08 (28 States)
EXHIBIT READS: Among public elementary schools that were always SWD-accountable from 2005–06 to 2007–08, 28 percent were identified for school improvement in 2009–10.
18 The 2009–10 school improvement status was derived from 2008–09 EDFacts data and was based on 2008–09 AYP performance.
28%
56%
41% 43%
25%
61%
35%
56%
18%
72%
23%
78%
0%
10%
20%
30%
40%
50%
60%
70%
80%
90%
100%
Identified for schoolimprovement, 2009-10
Made AYP, 2009-10 Identified for schoolimprovement, 2009-10
Made AYP, 2009-10
Always-SWD-Accountable Sometimes-SWD-Accountable Never-SWD-Accountable
Elementary Schools Middle Schools
17
School Practices and Accountability for Students With Disabilities
SOURCE: U.S. Department of Education EDFacts data, 2005–06 through 2009–10. NOTES: EDFacts data on 2009–10 school improvement status (which was based on 2008–09 AYP) for Indiana and 2009–10 AYP performance for California were not available at the time of the analysis. School improvement status sample size for elementary schools = 3,547 always-accountable schools, 6,005 sometimes-accountable schools, and 15,086 never-accountable schools. AYP sample size for elementary schools = 3,780 always-accountable schools, 5,683 sometimes-accountable schools, and 10,507 never-accountable schools. School improvement status sample size for middle schools = 2,973 always-accountable schools, 2,010 sometimes-accountable schools, and 1,877 never-accountable schools. AYP sample size for middle schools = 2,754 always-accountable schools, 1,783 sometimes-accountable schools, and 1,047 never-accountable schools. See Appendix C for results by state.
Compared with elementary schools, middle schools demonstrated larger differences in schools’ AYP performance and improvement status by schools’ SWD-accountability category. For instance, nearly twice as many always-accountable middle schools were identified for school improvement in 2009–10 as were never-accountable middle schools (41 percent versus 23 percent). Less than half (43 percent) of always-accountable middle schools made AYP in 2009–10, compared with 78 percent of never-accountable middle schools. Differences across schools in AYP performance and improvement status might lead to different decisions about the types of instructional practices that schools adopt.
Summary
To provide a broader context for the analyses of 2010–11 school practices, this chapter examined school accountability for the SWD subgroup, accountability for the economically disadvantaged student subgroup, and accountability for the ELL subgroup in 2009–10 for three groups of schools: schools that were always SWD-accountable, sometimes SWD-accountable, and never accountable between 2005–06 and 2007–08. It also presented the percentages of schools identified for school improvement and the percentages of schools that made AYP in 2009–10.
Sixty percent of elementary schools were never accountable for the SWD subgroup between 2005–06 and 2007–08, 15 percent were accountable for all three years, and 24 percent were accountable in some (but not all) years. At the middle school level, 44 percent of the schools were always SWD-accountable, and 29 percent and 27 percent of the schools were sometimes SWD-accountable and never SWD-accountable, respectively.
The percentage of schools in the three SWD-accountability categories varied across the 29states in the EDFacts sample. The percentage of always-accountable schools, for example,ranged from zero in one state to 99 percent in another at the elementary school level andfrom 4 percent to 100 percent at the middle school level.
SWD-accountability status remained stable for 85 percent or more of always-accountableschools and never-accountable schools. Of the always-accountable schools, 85 percent ofelementary schools and 92 percent of middle schools were accountable in 2009–10. Sevenpercent of never-accountable elementary schools and 9 percent of never-accountable middleschools were accountable for the SWD subgroup in 2009–10.
18
School Practices and Accountability for Students With Disabilities
Ninety-six percent of always-accountable elementary and middle schools were accountablefor the economically disadvantaged subgroup in 2009–10, compared with 76 percent ofnever-accountable schools.
Thirty-eight percent of always-accountable elementary schools and 33 percent of always-accountable middle schools were accountable for the ELL subgroup in 2009–10, comparedwith 28 percent of never-accountable elementary schools and 32 percent of never-accountable middle schools.
Always-accountable schools were more likely to be identified for school improvement thanwere never-accountable schools. At the elementary school level, 28 percent of always-accountable schools were identified for school improvement in 2009–10, compared with 18percent of never-accountable schools. At the middle school level, nearly twice as manyalways-accountable schools were identified for school improvement than were never-accountable schools (41 percent versus 23 percent).
Always-accountable schools were less likely to make AYP than were never-accountable schools. Among always-accountable schools, 56 percent at the elementary school level and 43 percent at the middle school level made AYP in 2009–10, compared with more than 70 percent of never-accountable schools (72 percent and 78 percent at the elementary and middle school levels, respectively).
19
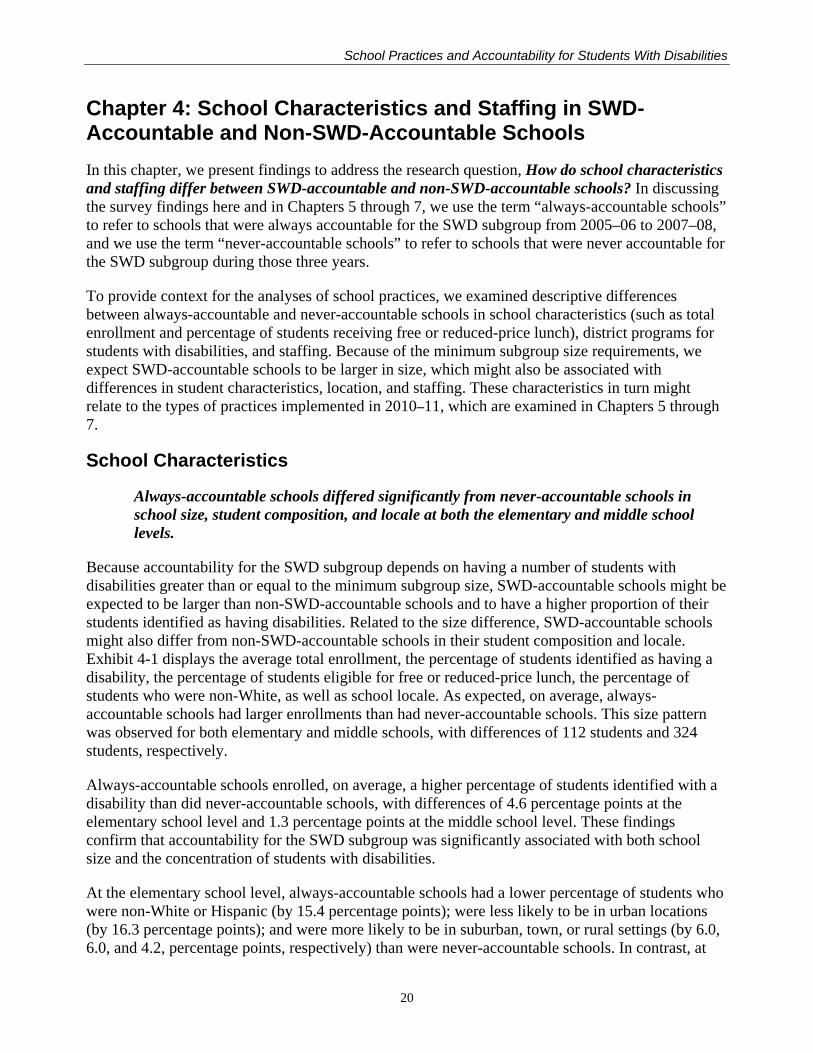
School Practices and Accountability for Students With Disabilities
Chapter 4: School Characteristics and Staffing in SWD-Accountable and Non-SWD-Accountable Schools In this chapter, we present findings to address the research question, How do school characteristics and staffing differ between SWD-accountable and non-SWD-accountable schools? In discussing the survey findings here and in Chapters 5 through 7, we use the term “always-accountable schools” to refer to schools that were always accountable for the SWD subgroup from 2005–06 to 2007–08, and we use the term “never-accountable schools” to refer to schools that were never accountable for the SWD subgroup during those three years.
To provide context for the analyses of school practices, we examined descriptive differences between always-accountable and never-accountable schools in school characteristics (such as total enrollment and percentage of students receiving free or reduced-price lunch), district programs for students with disabilities, and staffing. Because of the minimum subgroup size requirements, we expect SWD-accountable schools to be larger in size, which might also be associated with differences in student characteristics, location, and staffing. These characteristics in turn might relate to the types of practices implemented in 2010–11, which are examined in Chapters 5 through 7.
School Characteristics
Always-accountable schools differed significantly from never-accountable schools in school size, student composition, and locale at both the elementary and middle school levels.
Because accountability for the SWD subgroup depends on having a number of students with disabilities greater than or equal to the minimum subgroup size, SWD-accountable schools might be expected to be larger than non-SWD-accountable schools and to have a higher proportion of their students identified as having disabilities. Related to the size difference, SWD-accountable schools might also differ from non-SWD-accountable schools in their student composition and locale. Exhibit 4-1 displays the average total enrollment, the percentage of students identified as having a disability, the percentage of students eligible for free or reduced-price lunch, the percentage of students who were non-White, as well as school locale. As expected, on average, always-accountable schools had larger enrollments than had never-accountable schools. This size pattern was observed for both elementary and middle schools, with differences of 112 students and 324 students, respectively.
Always-accountable schools enrolled, on average, a higher percentage of students identified with a disability than did never-accountable schools, with differences of 4.6 percentage points at the elementary school level and 1.3 percentage points at the middle school level. These findings confirm that accountability for the SWD subgroup was significantly associated with both school size and the concentration of students with disabilities.
At the elementary school level, always-accountable schools had a lower percentage of students who were non-White or Hispanic (by 15.4 percentage points); were less likely to be in urban locations (by 16.3 percentage points); and were more likely to be in suburban, town, or rural settings (by 6.0, 6.0, and 4.2, percentage points, respectively) than were never-accountable schools. In contrast, at
20
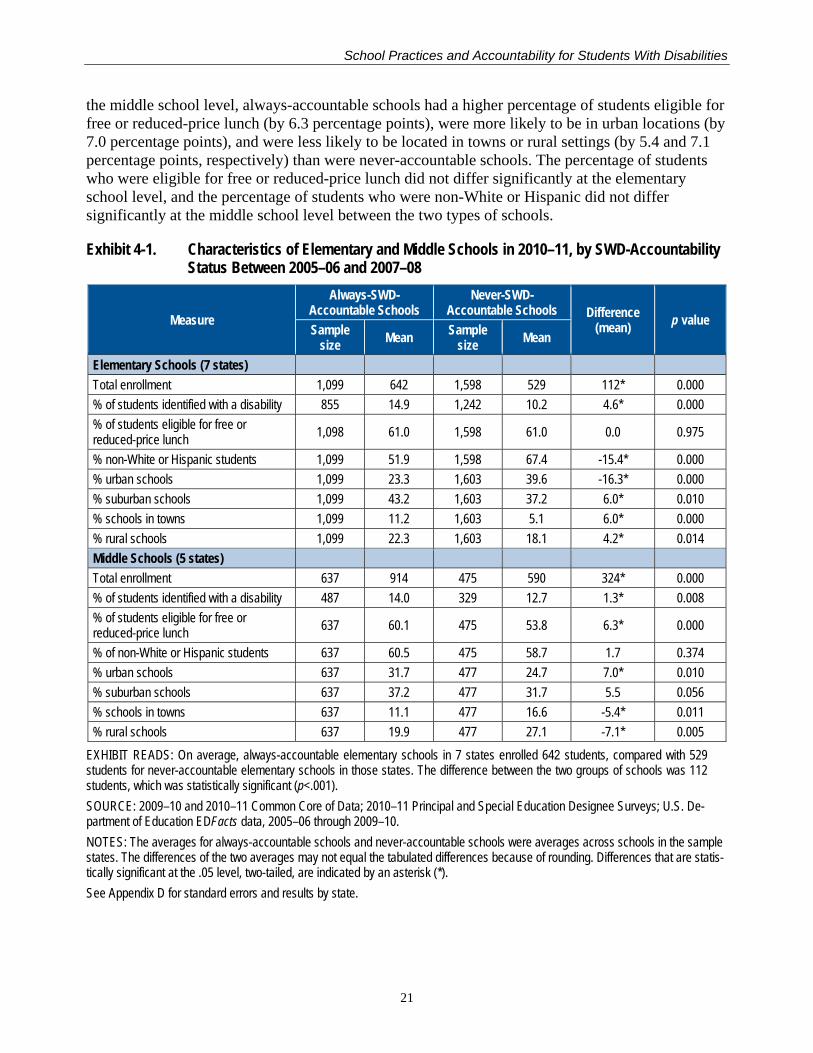
School Practices and Accountability for Students With Disabilities
the middle school level, always-accountable schools had a higher percentage of students eligible for free or reduced-price lunch (by 6.3 percentage points), were more likely to be in urban locations (by 7.0 percentage points), and were less likely to be located in towns or rural settings (by 5.4 and 7.1 percentage points, respectively) than were never-accountable schools. The percentage of students who were eligible for free or reduced-price lunch did not differ significantly at the elementary school level, and the percentage of students who were non-White or Hispanic did not differ significantly at the middle school level between the two types of schools.
Exhibit 4-1. Characteristics of Elementary and Middle Schools in 2010–11, by SWD-Accountability Status Between 2005–06 and 2007–08
Measure
Always-SWD-Accountable Schools
Never-SWD-Accountable Schools Difference
(mean) p value Sample
size Mean Sample size Mean
Elementary Schools (7 states) Total enrollment 1,099 642 1,598 529 112* 0.000 % of students identified with a disability 855 14.9 1,242 10.2 4.6* 0.000 % of students eligible for free or reduced-price lunch 1,098 61.0 1,598 61.0 0.0 0.975
% non-White or Hispanic students 1,099 51.9 1,598 67.4 -15.4* 0.000 % urban schools 1,099 23.3 1,603 39.6 -16.3* 0.000 % suburban schools 1,099 43.2 1,603 37.2 6.0* 0.010 % schools in towns 1,099 11.2 1,603 5.1 6.0* 0.000 % rural schools 1,099 22.3 1,603 18.1 4.2* 0.014 Middle Schools (5 states) Total enrollment 637 914 475 590 324* 0.000 % of students identified with a disability 487 14.0 329 12.7 1.3* 0.008 % of students eligible for free or reduced-price lunch 637 60.1 475 53.8 6.3* 0.000
% of non-White or Hispanic students 637 60.5 475 58.7 1.7 0.374 % urban schools 637 31.7 477 24.7 7.0* 0.010 % suburban schools 637 37.2 477 31.7 5.5 0.056 % schools in towns 637 11.1 477 16.6 -5.4* 0.011 % rural schools 637 19.9 477 27.1 -7.1* 0.005
EXHIBIT READS: On average, always-accountable elementary schools in 7 states enrolled 642 students, compared with 529 students for never-accountable elementary schools in those states. The difference between the two groups of schools was 112 students, which was statistically significant (p<.001). SOURCE: 2009–10 and 2010–11 Common Core of Data; 2010–11 Principal and Special Education Designee Surveys; U.S. De-partment of Education EDFacts data, 2005–06 through 2009–10. NOTES: The averages for always-accountable schools and never-accountable schools were averages across schools in the sample states. The differences of the two averages may not equal the tabulated differences because of rounding. Differences that are statis-tically significant at the .05 level, two-tailed, are indicated by an asterisk (*). See Appendix D for standard errors and results by state.
21
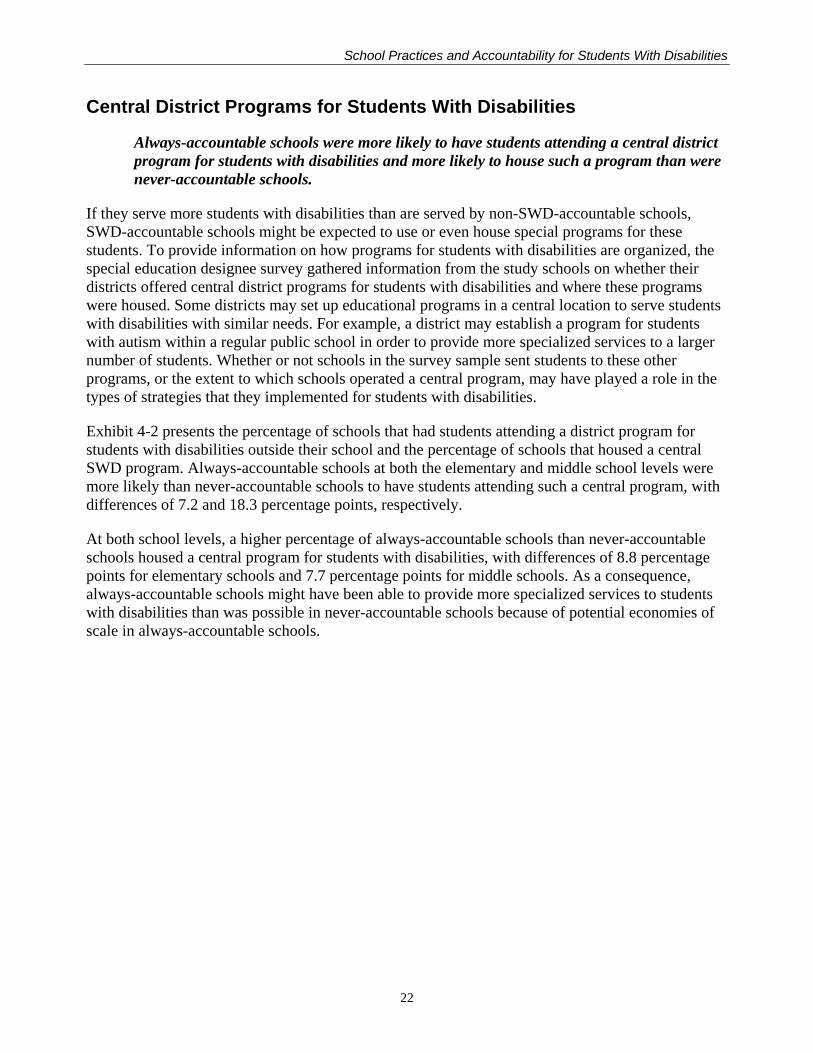
School Practices and Accountability for Students With Disabilities
Central District Programs for Students With Disabilities
Always-accountable schools were more likely to have students attending a central district program for students with disabilities and more likely to house such a program than were never-accountable schools.
If they serve more students with disabilities than are served by non-SWD-accountable schools, SWD-accountable schools might be expected to use or even house special programs for these students. To provide information on how programs for students with disabilities are organized, the special education designee survey gathered information from the study schools on whether their districts offered central district programs for students with disabilities and where these programs were housed. Some districts may set up educational programs in a central location to serve students with disabilities with similar needs. For example, a district may establish a program for students with autism within a regular public school in order to provide more specialized services to a larger number of students. Whether or not schools in the survey sample sent students to these other programs, or the extent to which schools operated a central program, may have played a role in the types of strategies that they implemented for students with disabilities.
Exhibit 4-2 presents the percentage of schools that had students attending a district program for students with disabilities outside their school and the percentage of schools that housed a central SWD program. Always-accountable schools at both the elementary and middle school levels were more likely than never-accountable schools to have students attending such a central program, with differences of 7.2 and 18.3 percentage points, respectively.
At both school levels, a higher percentage of always-accountable schools than never-accountable schools housed a central program for students with disabilities, with differences of 8.8 percentage points for elementary schools and 7.7 percentage points for middle schools. As a consequence, always-accountable schools might have been able to provide more specialized services to students with disabilities than was possible in never-accountable schools because of potential economies of scale in always-accountable schools.
22
School Practices and Accountability for Students With Disabilities
Exhibit 4-2. Characteristics of District Programs for Students With Disabilities in Elementary and Middle Schools in 2010–11, by SWD-Accountability Status Between 2005–06 and 2007–08
Measure
Always-SWD-Accountable
Schools
Never-SWD-Accountable
Schools Difference (percent) p value
Sample size Percent Sample
size Percent
Elementary Schools (7 states) % of schools that had students attending a central district program for students with disabilities 871 35.0 1,283 27.8 7.2* 0.003
% of schools that housed a central district program for students with disabilities 872 28.6 1,285 19.8 8.8* 0.000
Middle Schools (5 states) % of schools that had students attending a central district program for students with disabilities 501 32.1 351 13.9 18.3* 0.000
% of schools that housed a central district program for students with disabilities 501 19.4 352 11.7 7.7* 0.002
EXHIBIT READS: On average, 35.0 percent of always-accountable elementary schools in 7 states had students attending a central district program for students with disabilities, compared with 27.8 percent of never-accountable elementary schools in those states. The difference between the two groups of schools was 7.2 percentage points, which was statistically significant (p<.01). SOURCE: 2010–11 Special Education Designee Survey; U.S. Department of Education EDFacts data, 2005–06 through 2007–08; 2009–10 Common Core of Data. NOTES: The averages for always-accountable schools and never-accountable schools were averages across schools in the sample states. The differences of the two averages may not equal the tabulated differences because of rounding. Differences that are statis-tically significant at the .05 level, two-tailed, are indicated by an asterisk (*). See Appendix D for standard errors and results by state.
Staffing
Always-accountable schools had more special education teachers but fewer other staff per 100 students with disabilities than never-accountable schools had.
School staffing is another factor that might differ across SWD-accountable and non-SWD-accountable schools, facilitating or hindering the implementation of strategies adopted by schools to improve student achievement. If they serve more students with disabilities than are served by non-SWD-accountable schools, SWD-accountable schools might have fewer staff members for each student with a disability. In order to compare staffing levels across schools of different sizes, we computed the number of staff per 100 students with disabilities. Higher values of this variable mean larger staff-to-SWD ratios. As Exhibit 4-3 shows, the number of special education teachers per 100 students with disabilities was higher for always-accountable schools than for never-accountable schools at both the elementary and middle school levels (differences of 1.1 and 1.6 teachers, respectively). However, compared with never-accountable schools, always-accountable schools had lower numbers of regular education teachers per 100 students with disabilities at both school levels (differences of 14.6 and 8.5 teachers at the elementary and middle school levels, respectively). Compared with never-accountable schools, always-accountable schools also had fewer related service providers per 100 students with disabilities at both the elementary and middle school levels (differences of 1.2 and 0.9 providers, respectively). These differences might reflect economies of scale
23
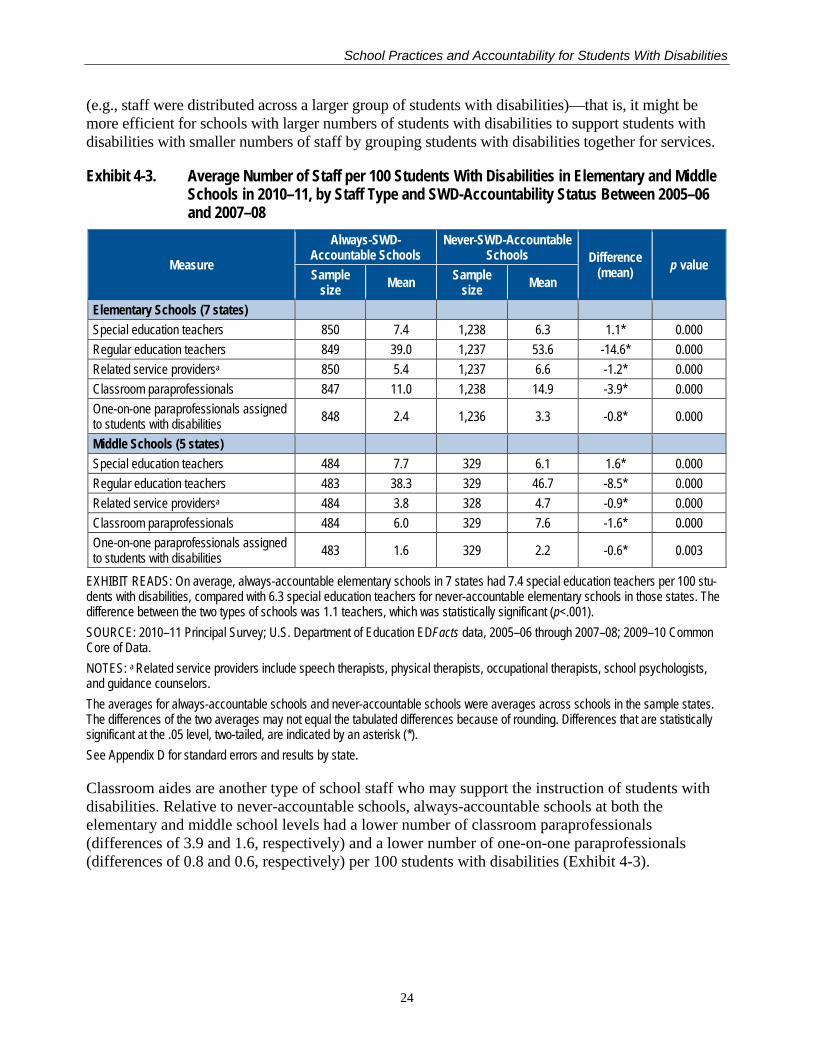
School Practices and Accountability for Students With Disabilities
(e.g., staff were distributed across a larger group of students with disabilities)—that is, it might be more efficient for schools with larger numbers of students with disabilities to support students with disabilities with smaller numbers of staff by grouping students with disabilities together for services.
Exhibit 4-3. Average Number of Staff per 100 Students With Disabilities in Elementary and Middle Schools in 2010–11, by Staff Type and SWD-Accountability Status Between 2005–06 and 2007–08
Measure
Always-SWD-Accountable Schools
Never-SWD-Accountable Schools Difference
(mean) p value Sample
size Mean Sample size Mean
Elementary Schools (7 states) Special education teachers 850 7.4 1,238 6.3 1.1* 0.000 Regular education teachers 849 39.0 1,237 53.6 -14.6* 0.000 Related service providersa 850 5.4 1,237 6.6 -1.2* 0.000 Classroom paraprofessionals 847 11.0 1,238 14.9 -3.9* 0.000 One-on-one paraprofessionals assigned to students with disabilities 848 2.4 1,236 3.3 -0.8* 0.000
Middle Schools (5 states) Special education teachers 484 7.7 329 6.1 1.6* 0.000 Regular education teachers 483 38.3 329 46.7 -8.5* 0.000 Related service providersa 484 3.8 328 4.7 -0.9* 0.000 Classroom paraprofessionals 484 6.0 329 7.6 -1.6* 0.000 One-on-one paraprofessionals assigned to students with disabilities 483 1.6 329 2.2 -0.6* 0.003
EXHIBIT READS: On average, always-accountable elementary schools in 7 states had 7.4 special education teachers per 100 stu-dents with disabilities, compared with 6.3 special education teachers for never-accountable elementary schools in those states. The difference between the two types of schools was 1.1 teachers, which was statistically significant (p<.001). SOURCE: 2010–11 Principal Survey; U.S. Department of Education EDFacts data, 2005–06 through 2007–08; 2009–10 Common Core of Data. NOTES: a Related service providers include speech therapists, physical therapists, occupational therapists, school psychologists, and guidance counselors. The averages for always-accountable schools and never-accountable schools were averages across schools in the sample states. The differences of the two averages may not equal the tabulated differences because of rounding. Differences that are statistically significant at the .05 level, two-tailed, are indicated by an asterisk (*). See Appendix D for standard errors and results by state.
Classroom aides are another type of school staff who may support the instruction of students with disabilities. Relative to never-accountable schools, always-accountable schools at both the elementary and middle school levels had a lower number of classroom paraprofessionals (differences of 3.9 and 1.6, respectively) and a lower number of one-on-one paraprofessionals (differences of 0.8 and 0.6, respectively) per 100 students with disabilities (Exhibit 4-3).
24
School Practices and Accountability for Students With Disabilities
Summary
This chapter examined how school characteristics and staffing differed between schools that were always accountable for the SWD subgroup and schools that were never accountable for the SWD subgroup between 2005–06 and 2007–08. For both elementary and middle schools, always-accountable schools had a larger
enrollment and a higher percentage of students identified with a disability than had never-accountable schools.
Compared with never-accountable schools, always-accountable schools had a lowerpercentage of students who were non-White or Hispanic at the elementary school level and ahigher percentage of students eligible for free or reduced-price lunch at the middle schoollevel.
Always-accountable elementary schools were more likely to be in suburban, town, or ruralsettings than were never-accountable elementary schools. Always-accountable middleschools were more likely to be in urban locations than were never-accountable middleschools.
At both school levels, always-accountable schools were more likely to have studentsattending a central district program for students with disabilities and more likely to housesuch a program than were never-accountable schools.
Compared with never-accountable schools, always-accountable schools had more specialeducation teachers, but fewer other staff (i.e., regular education teachers, related serviceproviders, classroom paraprofessionals, and one-on-one paraprofessionals), per 100 studentswith disabilities.
25
School Practices and Accountability for Students With Disabilities
Chapter 5: School Programs and Student Support Strategies in SWD-Accountable and Non-SWD-Accountable Schools In this chapter, we present findings to address the research question, How do school programs and student support strategies differ between SWD-accountable and non-SWD-accountable schools?
To improve SWD subgroup outcomes and meet AYP performance targets, SWD-accountable schools may seek to strengthen teaching and learning for all students including students with disabilities, or they may take a more targeted approach and implement practices specifically designed for students with disabilities. As suggested by the logic model, being explicitly held accountable for the SWD subgroup over a period of time (as well as being held accountable for other student subgroups) might prompt schools, more so for SWD-accountable schools than for non-SWD-accountable schools, to adopt new instructional programs or curricula, a whole-school comprehensive reform program, or direct interventions and supports for students with particular needs. The focus of the findings presented in this chapter is on school programs and student support strategies that generally apply to all students, not just students with disabilities, within a school.
School Programs
Compared with never-accountable elementary schools, always-accountable elementary schools were more likely to adopt new instructional programs.
Being explicitly held accountable for the SWD subgroups and possibly other student subgroups, SWD-accountable schools might be expected to improve the outcomes of students with disabilities by implementing school-wide changes, such as new curricula or whole-school comprehensive reform. Using data from the special education designee survey, we examined the adoption of such school-wide programs in both always-accountable schools and never-accountable schools. Because these efforts may be rolled out over an extended period of time, we asked designees whether these strategies were implemented over a five-year period (from 2005–06 to 2010–11).
At both the elementary and middle school levels, the majority of always-accountable and never-accountable schools in the survey sample adopted new instructional programs or curricula in reading/English language arts (ELA) and in mathematics over the five-year time period (Exhibit 5-1). Less than half of the schools implemented reading across the curriculum or a comprehensive school reform program.
Consistent with our hypothesis, always-accountable elementary schools were more likely to adopt new reading/ELA and mathematics programs or curricula than were never-accountable elementary schools (differences of 13.2 and 13.1 percentage points, respectively). Always-accountable schools were also more likely than never-accountable schools to implement reading across the curriculum at both school levels (differences of 11.0 and 13.3 percentage points, respectively). There were no significant differences between the two types of school in the adoption of new reading/ELA or mathematics instructional programs at the middle school level, or in the adoption of a comprehensive school reform program, at either the elementary or the middle school level.
26
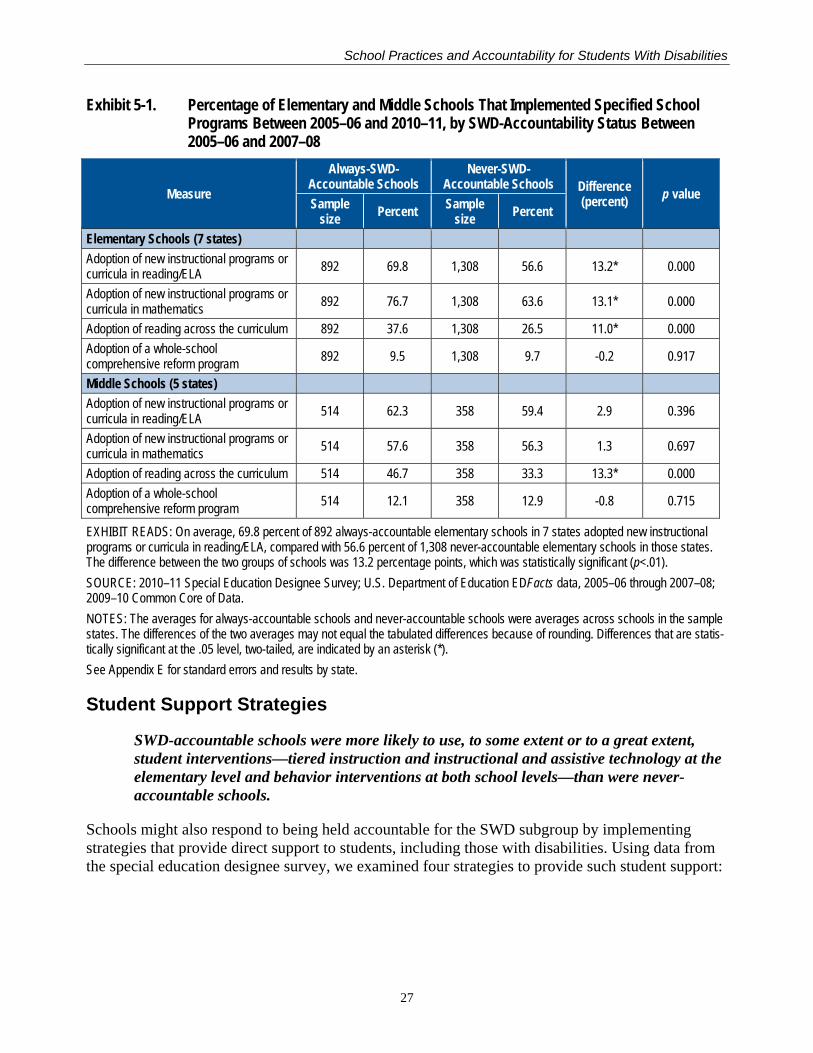
School Practices and Accountability for Students With Disabilities
Exhibit 5-1. Percentage of Elementary and Middle Schools That Implemented Specified School Programs Between 2005–06 and 2010–11, by SWD-Accountability Status Between 2005–06 and 2007–08
Measure
Always-SWD-Accountable Schools
Never-SWD-Accountable Schools Difference
(percent) p value Sample
size Percent Sample size Percent
Elementary Schools (7 states) Adoption of new instructional programs or curricula in reading/ELA 892 69.8 1,308 56.6 13.2* 0.000
Adoption of new instructional programs or curricula in mathematics 892 76.7 1,308 63.6 13.1* 0.000
Adoption of reading across the curriculum 892 37.6 1,308 26.5 11.0* 0.000 Adoption of a whole-school comprehensive reform program 892 9.5 1,308 9.7 -0.2 0.917
Middle Schools (5 states) Adoption of new instructional programs or curricula in reading/ELA 514 62.3 358 59.4 2.9 0.396
Adoption of new instructional programs or curricula in mathematics 514 57.6 358 56.3 1.3 0.697
Adoption of reading across the curriculum 514 46.7 358 33.3 13.3* 0.000 Adoption of a whole-school comprehensive reform program 514 12.1 358 12.9 -0.8 0.715
EXHIBIT READS: On average, 69.8 percent of 892 always-accountable elementary schools in 7 states adopted new instructional programs or curricula in reading/ELA, compared with 56.6 percent of 1,308 never-accountable elementary schools in those states. The difference between the two groups of schools was 13.2 percentage points, which was statistically significant (p<.01). SOURCE: 2010–11 Special Education Designee Survey; U.S. Department of Education EDFacts data, 2005–06 through 2007–08; 2009–10 Common Core of Data. NOTES: The averages for always-accountable schools and never-accountable schools were averages across schools in the sample states. The differences of the two averages may not equal the tabulated differences because of rounding. Differences that are statis-tically significant at the .05 level, two-tailed, are indicated by an asterisk (*). See Appendix E for standard errors and results by state.
Student Support Strategies
SWD-accountable schools were more likely to use, to some extent or to a great extent, student interventions—tiered instruction and instructional and assistive technology at the elementary level and behavior interventions at both school levels—than were never-accountable schools.
Schools might also respond to being held accountable for the SWD subgroup by implementing strategies that provide direct support to students, including those with disabilities. Using data from the special education designee survey, we examined four strategies to provide such student support:
27
School Practices and Accountability for Students With Disabilities
tiered instruction, Positive Behavioral Interventions and Supports (PBIS),19 test preparation instruction, and instructional and assistive technology. For each of these strategies, we asked the respondent whether the school implemented the strategy in 2010–11 and, if so, to what extent (i.e., to a limited extent, to some extent, or to a great extent).20
The majority of always-accountable and never-accountable elementary and middle schools implemented all four strategies (Exhibit 5-2). The survey results provided some evidence that SWD-accountable schools were more likely to implement student supports than were non-SWD-accountable schools. Always-accountable elementary schools were more likely to use a tiered instructional intervention system targeting at-risk students to some extent or to a great extent than were never-accountable elementary schools (a difference of 11.8 percentage points). Always-accountable elementary schools were also more likely than never-accountable elementary schools to implement PBIS to some extent or to a great extent (a difference of 5.3 percentage points) and to provide instructional and assistive technology (a difference of 10.3 percentage points). Among other factors, one possible explanation for these differences is the fact that always-accountable elementary schools were less likely to make AYP and more likely to be identified for school improvement in 2009–10 than were never-accountable elementary schools (see Chapter 3). As a result, always-accountable elementary schools might have been more likely to implement systematic ways to identify and support struggling students in an effort to improve outcomes. There was no significant difference between always-accountable and never-accountable elementary schools in the use of test preparation instruction.
At the middle school level, always-accountable schools were more likely than never-accountable schools to implement PBIS to some extent or to a great extent (a difference of 10.5 percentage points). This may be associated with the fact that always-accountable middle schools were much larger than their never-accountable counterparts (a difference of 324 students, Exhibit 4-1). Given their larger student populations, always-accountable middle schools might have a greater need to implement approaches to improve students’ behavior outcomes. Other factors may also have contributed to the difference in the use of PBIS between the two sets of schools. There were no statistically significant differences between always- and never-accountable middle schools in the implementation of a tiered instructional intervention system, in the use of test preparation instruction, or in the provision of instructional or assistive technology.
19 PBIS is “a framework or approach for assisting school personnel in adopting and organizing evidence-based behav-ioral interventions into an integrated continuum that enhances academic and social behavior outcomes for all students” (http://www.pbis.org). 20 The respondent was asked about the targeted students (i.e., all students, including students with disabilities; certain subgroups, including students with disabilities; or students with disabilities only) for each strategy in an earlier survey question. The survey then asked about the extent to which the strategy was used with the targeted students and present-ed the following three response options: limited extent: some teachers/subjects or infrequent/informal use; some extent: several teachers/subjects or frequent use; great extent: all teachers/subjects or consistently regular use.
28
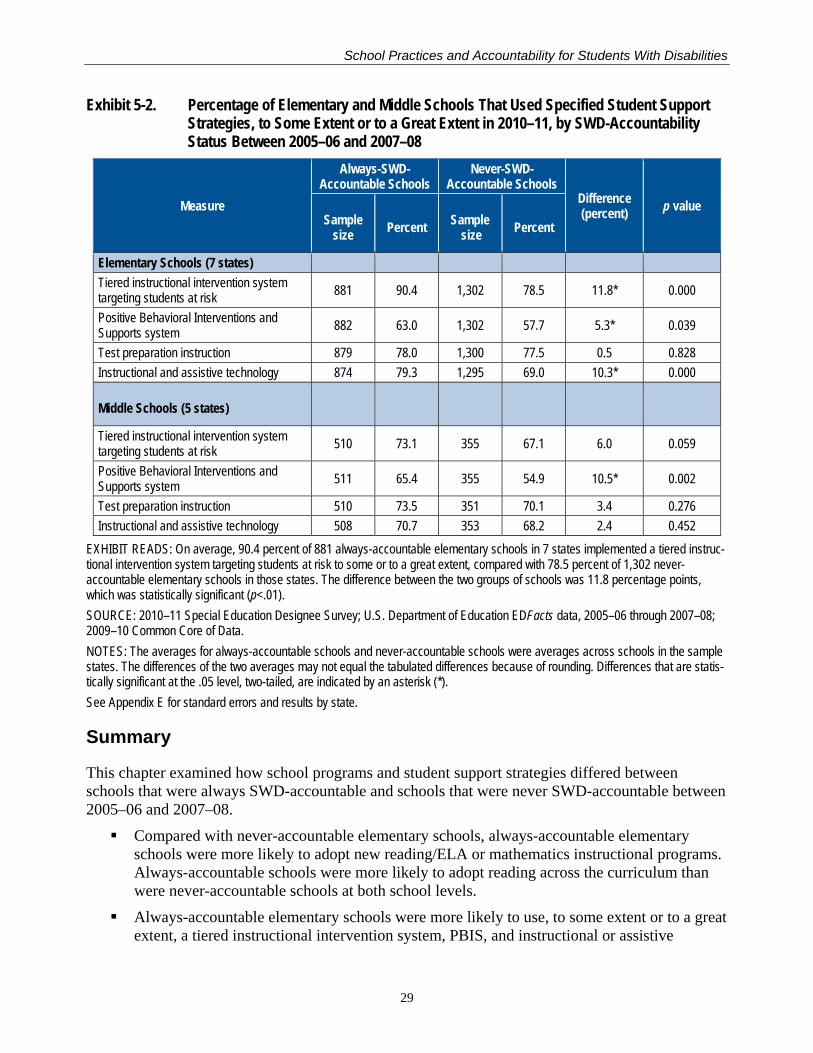
School Practices and Accountability for Students With Disabilities
Exhibit 5-2. Percentage of Elementary and Middle Schools That Used Specified Student Support Strategies, to Some Extent or to a Great Extent in 2010–11, by SWD-Accountability Status Between 2005–06 and 2007–08
Measure
Always-SWD-Accountable Schools
Never-SWD-Accountable Schools
Difference (percent) p value
Sample size Percent Sample
size Percent
Elementary Schools (7 states) Tiered instructional intervention system targeting students at risk 881 90.4 1,302 78.5 11.8* 0.000
Positive Behavioral Interventions and Supports system 882 63.0 1,302 57.7 5.3* 0.039
Test preparation instruction 879 78.0 1,300 77.5 0.5 0.828 Instructional and assistive technology 874 79.3 1,295 69.0 10.3* 0.000
Middle Schools (5 states)
Tiered instructional intervention system targeting students at risk 510 73.1 355 67.1 6.0 0.059
Positive Behavioral Interventions and Supports system 511 65.4 355 54.9 10.5* 0.002
Test preparation instruction 510 73.5 351 70.1 3.4 0.276 Instructional and assistive technology 508 70.7 353 68.2 2.4 0.452
EXHIBIT READS: On average, 90.4 percent of 881 always-accountable elementary schools in 7 states implemented a tiered instruc-tional intervention system targeting students at risk to some or to a great extent, compared with 78.5 percent of 1,302 never-accountable elementary schools in those states. The difference between the two groups of schools was 11.8 percentage points, which was statistically significant (p<.01). SOURCE: 2010–11 Special Education Designee Survey; U.S. Department of Education EDFacts data, 2005–06 through 2007–08; 2009–10 Common Core of Data. NOTES: The averages for always-accountable schools and never-accountable schools were averages across schools in the sample states. The differences of the two averages may not equal the tabulated differences because of rounding. Differences that are statis-tically significant at the .05 level, two-tailed, are indicated by an asterisk (*). See Appendix E for standard errors and results by state.
Summary
This chapter examined how school programs and student support strategies differed between schools that were always SWD-accountable and schools that were never SWD-accountable between 2005–06 and 2007–08. Compared with never-accountable elementary schools, always-accountable elementary
schools were more likely to adopt new reading/ELA or mathematics instructional programs. Always-accountable schools were more likely to adopt reading across the curriculum than were never-accountable schools at both school levels.
Always-accountable elementary schools were more likely to use, to some extent or to a great extent, a tiered instructional intervention system, PBIS, and instructional or assistive
29
School Practices and Accountability for Students With Disabilities
technology, relative to never-accountable elementary schools. At the middle school level, always-accountable schools were more likely than never-accountable schools to implement PBIS to some extent or to a great extent.
30
School Practices and Accountability for Students With Disabilities
Chapter 6: Instructional Time, Structure, and Settings in SWD-Accountable and Non-SWD-Accountable Schools In this chapter, we present findings to address the research question, How do instructional time and settings differ between SWD-accountable and non-SWD-accountable schools?
Schools might respond to being held accountable for SWD performance by increasing the amount of instructional time for all students and targeting students with disabilities in particular for extended instructional opportunities. Drawing on data from both the principal survey and the special education designee survey, we examine the amount of instructional time in mathematics and reading, as well as the structure of instructional time (such as the use of block scheduling) in both always-accountable and never-accountable schools.
With respect to instructional settings (such as self-contained or regular education classrooms), always-accountable schools might focus more than never-accountable schools do on educating students with disabilities in regular education settings to provide students with disabilities with more access to the general education curriculum in order to help them, as a subgroup, meet state academic proficiency standards. To explore this hypothesis, we examined the percentages of students with disabilities educated in various settings for mathematics and reading instruction in both types of school.
Instructional Time and Structure
Compared with never-accountable schools, always-accountable schools were more likely to offer a greater amount of mathematics instruction for middle school grades 6–8 and less likely to offer a greater amount of reading instruction for elementary school grades 1–2 or 3–5.
Accountability for student subgroups might be expected to result in schools increasing the amount of time devoted to instruction in an effort to improve student outcomes. The survey data provided some support for this expectation for mathematics, but not reading. Because there might be differences in instructional time by grade and subject, the survey asked about the hours per day of instruction for different grade spans (grades 1–2, 3–4, and 6–8) for mathematics and reading separately. As Exhibit 6-1 shows, the percentage of schools that provided two or three hours per day (versus one hour) of mathematics instruction for grades 6–8 was significantly higher for always-accountable middle schools than for never-accountable middle schools (a difference of 7.2 percentage points).21 For reading, however, the percentage of schools providing three hours per day (versus one or two hours) of instruction in grades 1–2 and grades 3–5 was significantly lower for always-accountable elementary schools than for never-accountable elementary schools (differences of 9.3 percentage points for grades 1–2 and 5.3 percentage points for grades 3–5). There were no significant differences by SWD-accountability status in the percentages of schools providing two or
21 For each grade span and subject, we divided the schools into two groups (based on the number of instructional hours reported) in such a way that the number of schools in the two groups was as similar as possible. Therefore, the specific measure of instructional time analyzed differed for different grade spans and subjects. We excluded responses of four or more hours per day for each subject (less than 0.05 percent of the respondents).
31
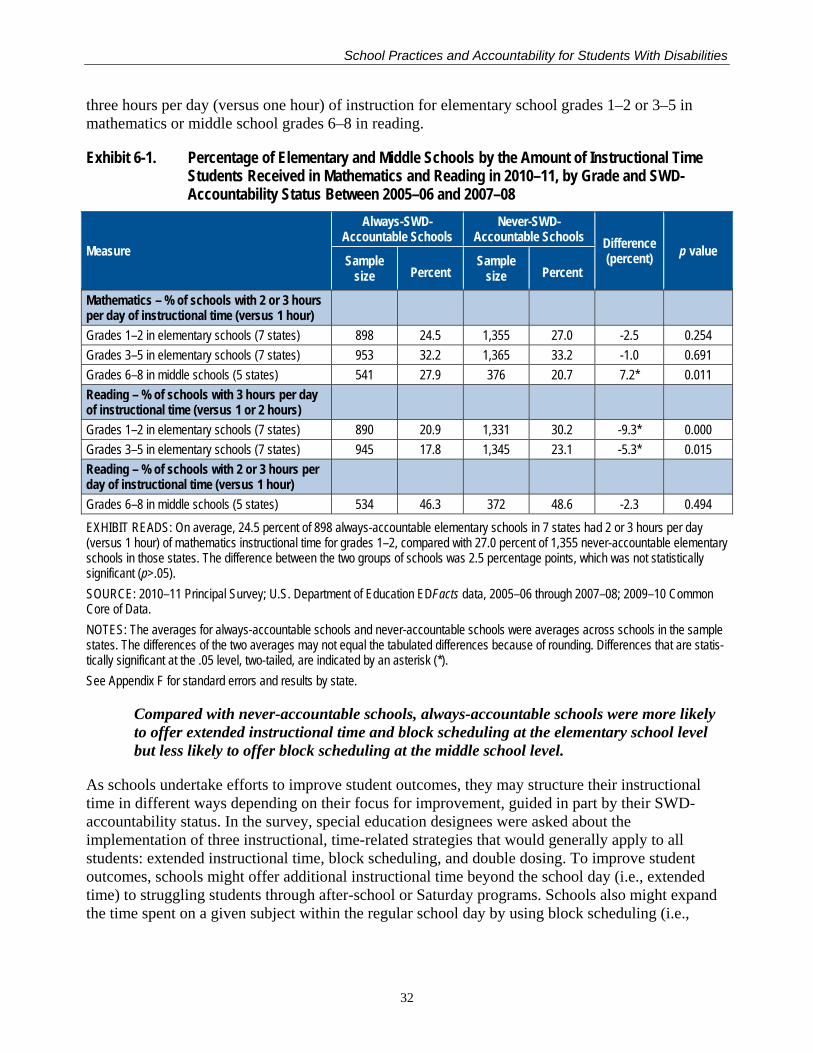
School Practices and Accountability for Students With Disabilities
three hours per day (versus one hour) of instruction for elementary school grades 1–2 or 3–5 in mathematics or middle school grades 6–8 in reading.
Exhibit 6-1. Percentage of Elementary and Middle Schools by the Amount of Instructional Time Students Received in Mathematics and Reading in 2010–11, by Grade and SWD-Accountability Status Between 2005–06 and 2007–08
Measure
Always-SWD-Accountable Schools
Never-SWD-Accountable Schools Difference
(percent) p value Sample
size Percent Sample
size Percent
Mathematics – % of schools with 2 or 3 hours per day of instructional time (versus 1 hour)
Grades 1–2 in elementary schools (7 states) 898 24.5 1,355 27.0 -2.5 0.254 Grades 3–5 in elementary schools (7 states) 953 32.2 1,365 33.2 -1.0 0.691 Grades 6–8 in middle schools (5 states) 541 27.9 376 20.7 7.2* 0.011 Reading – % of schools with 3 hours per day of instructional time (versus 1 or 2 hours)
Grades 1–2 in elementary schools (7 states) 890 20.9 1,331 30.2 -9.3* 0.000 Grades 3–5 in elementary schools (7 states) 945 17.8 1,345 23.1 -5.3* 0.015 Reading – % of schools with 2 or 3 hours per day of instructional time (versus 1 hour)
Grades 6–8 in middle schools (5 states) 534 46.3 372 48.6 -2.3 0.494 EXHIBIT READS: On average, 24.5 percent of 898 always-accountable elementary schools in 7 states had 2 or 3 hours per day (versus 1 hour) of mathematics instructional time for grades 1–2, compared with 27.0 percent of 1,355 never-accountable elementary schools in those states. The difference between the two groups of schools was 2.5 percentage points, which was not statistically significant (p>.05). SOURCE: 2010–11 Principal Survey; U.S. Department of Education EDFacts data, 2005–06 through 2007–08; 2009–10 Common Core of Data. NOTES: The averages for always-accountable schools and never-accountable schools were averages across schools in the sample states. The differences of the two averages may not equal the tabulated differences because of rounding. Differences that are statis-tically significant at the .05 level, two-tailed, are indicated by an asterisk (*). See Appendix F for standard errors and results by state.
Compared with never-accountable schools, always-accountable schools were more likely to offer extended instructional time and block scheduling at the elementary school level but less likely to offer block scheduling at the middle school level.
As schools undertake efforts to improve student outcomes, they may structure their instructional time in different ways depending on their focus for improvement, guided in part by their SWD-accountability status. In the survey, special education designees were asked about the implementation of three instructional, time-related strategies that would generally apply to all students: extended instructional time, block scheduling, and double dosing. To improve student outcomes, schools might offer additional instructional time beyond the school day (i.e., extended time) to struggling students through after-school or Saturday programs. Schools also might expand the time spent on a given subject within the regular school day by using block scheduling (i.e.,
32
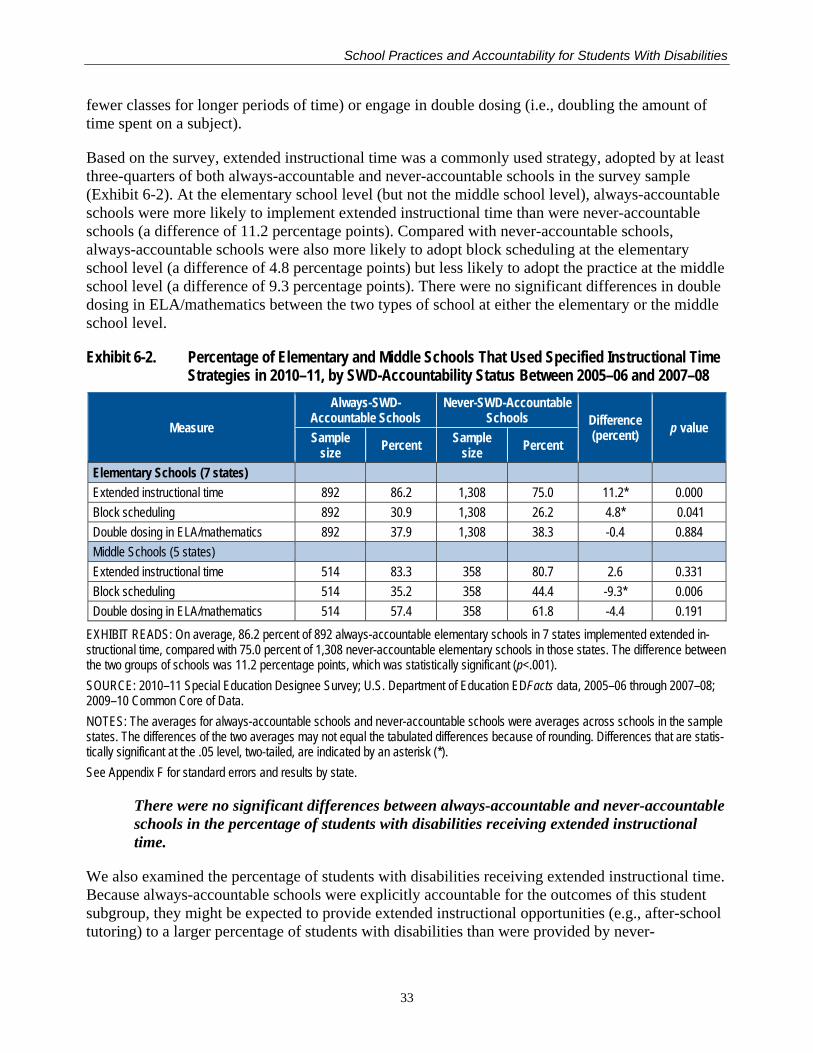
School Practices and Accountability for Students With Disabilities
fewer classes for longer periods of time) or engage in double dosing (i.e., doubling the amount of time spent on a subject).
Based on the survey, extended instructional time was a commonly used strategy, adopted by at least three-quarters of both always-accountable and never-accountable schools in the survey sample (Exhibit 6-2). At the elementary school level (but not the middle school level), always-accountable schools were more likely to implement extended instructional time than were never-accountable schools (a difference of 11.2 percentage points). Compared with never-accountable schools, always-accountable schools were also more likely to adopt block scheduling at the elementary school level (a difference of 4.8 percentage points) but less likely to adopt the practice at the middle school level (a difference of 9.3 percentage points). There were no significant differences in double dosing in ELA/mathematics between the two types of school at either the elementary or the middle school level.
Exhibit 6-2. Percentage of Elementary and Middle Schools That Used Specified Instructional Time Strategies in 2010–11, by SWD-Accountability Status Between 2005–06 and 2007–08
Measure
Always-SWD-Accountable Schools
Never-SWD-Accountable Schools Difference
(percent) p value Sample
size Percent Sample size Percent
Elementary Schools (7 states) Extended instructional time 892 86.2 1,308 75.0 11.2* 0.000 Block scheduling 892 30.9 1,308 26.2 4.8* 0.041 Double dosing in ELA/mathematics 892 37.9 1,308 38.3 -0.4 0.884 Middle Schools (5 states) Extended instructional time 514 83.3 358 80.7 2.6 0.331 Block scheduling 514 35.2 358 44.4 -9.3* 0.006 Double dosing in ELA/mathematics 514 57.4 358 61.8 -4.4 0.191
EXHIBIT READS: On average, 86.2 percent of 892 always-accountable elementary schools in 7 states implemented extended in-structional time, compared with 75.0 percent of 1,308 never-accountable elementary schools in those states. The difference between the two groups of schools was 11.2 percentage points, which was statistically significant (p<.001). SOURCE: 2010–11 Special Education Designee Survey; U.S. Department of Education EDFacts data, 2005–06 through 2007–08; 2009–10 Common Core of Data. NOTES: The averages for always-accountable schools and never-accountable schools were averages across schools in the sample states. The differences of the two averages may not equal the tabulated differences because of rounding. Differences that are statis-tically significant at the .05 level, two-tailed, are indicated by an asterisk (*). See Appendix F for standard errors and results by state.
There were no significant differences between always-accountable and never-accountable schools in the percentage of students with disabilities receiving extended instructional time.
We also examined the percentage of students with disabilities receiving extended instructional time. Because always-accountable schools were explicitly accountable for the outcomes of this student subgroup, they might be expected to provide extended instructional opportunities (e.g., after-school tutoring) to a larger percentage of students with disabilities than were provided by never-
33
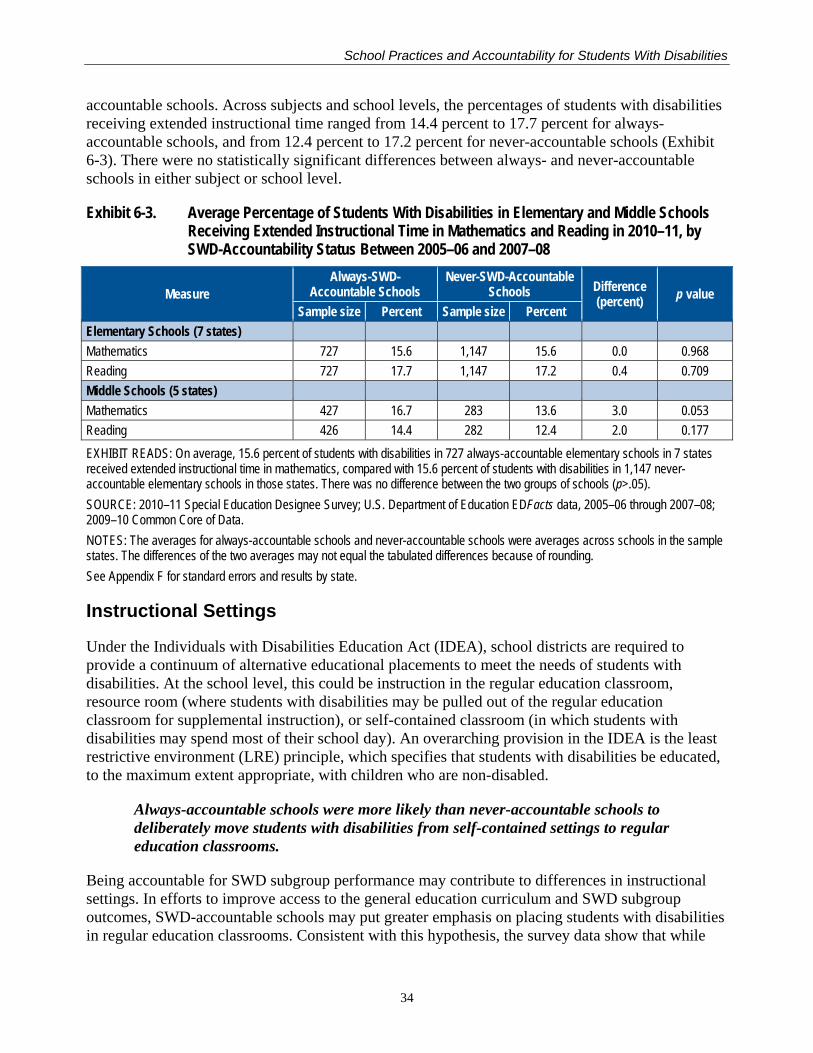
School Practices and Accountability for Students With Disabilities
accountable schools. Across subjects and school levels, the percentages of students with disabilities receiving extended instructional time ranged from 14.4 percent to 17.7 percent for always-accountable schools, and from 12.4 percent to 17.2 percent for never-accountable schools (Exhibit 6-3). There were no statistically significant differences between always- and never-accountable schools in either subject or school level.
Exhibit 6-3. Average Percentage of Students With Disabilities in Elementary and Middle Schools Receiving Extended Instructional Time in Mathematics and Reading in 2010–11, by SWD-Accountability Status Between 2005–06 and 2007–08
Measure Always-SWD-
Accountable Schools Never-SWD-Accountable
Schools Difference (percent) p value
Sample size Percent Sample size Percent Elementary Schools (7 states) Mathematics 727 15.6 1,147 15.6 0.0 0.968 Reading 727 17.7 1,147 17.2 0.4 0.709 Middle Schools (5 states) Mathematics 427 16.7 283 13.6 3.0 0.053 Reading 426 14.4 282 12.4 2.0 0.177 EXHIBIT READS: On average, 15.6 percent of students with disabilities in 727 always-accountable elementary schools in 7 states received extended instructional time in mathematics, compared with 15.6 percent of students with disabilities in 1,147 never-accountable elementary schools in those states. There was no difference between the two groups of schools (p>.05). SOURCE: 2010–11 Special Education Designee Survey; U.S. Department of Education EDFacts data, 2005–06 through 2007–08; 2009–10 Common Core of Data. NOTES: The averages for always-accountable schools and never-accountable schools were averages across schools in the sample states. The differences of the two averages may not equal the tabulated differences because of rounding. See Appendix F for standard errors and results by state.
Instructional Settings
Under the Individuals with Disabilities Education Act (IDEA), school districts are required to provide a continuum of alternative educational placements to meet the needs of students with disabilities. At the school level, this could be instruction in the regular education classroom, resource room (where students with disabilities may be pulled out of the regular education classroom for supplemental instruction), or self-contained classroom (in which students with disabilities may spend most of their school day). An overarching provision in the IDEA is the least restrictive environment (LRE) principle, which specifies that students with disabilities be educated, to the maximum extent appropriate, with children who are non-disabled.
Always-accountable schools were more likely than never-accountable schools to deliberately move students with disabilities from self-contained settings to regular education classrooms.
Being accountable for SWD subgroup performance may contribute to differences in instructional settings. In efforts to improve access to the general education curriculum and SWD subgroup outcomes, SWD-accountable schools may put greater emphasis on placing students with disabilities in regular education classrooms. Consistent with this hypothesis, the survey data show that while
34
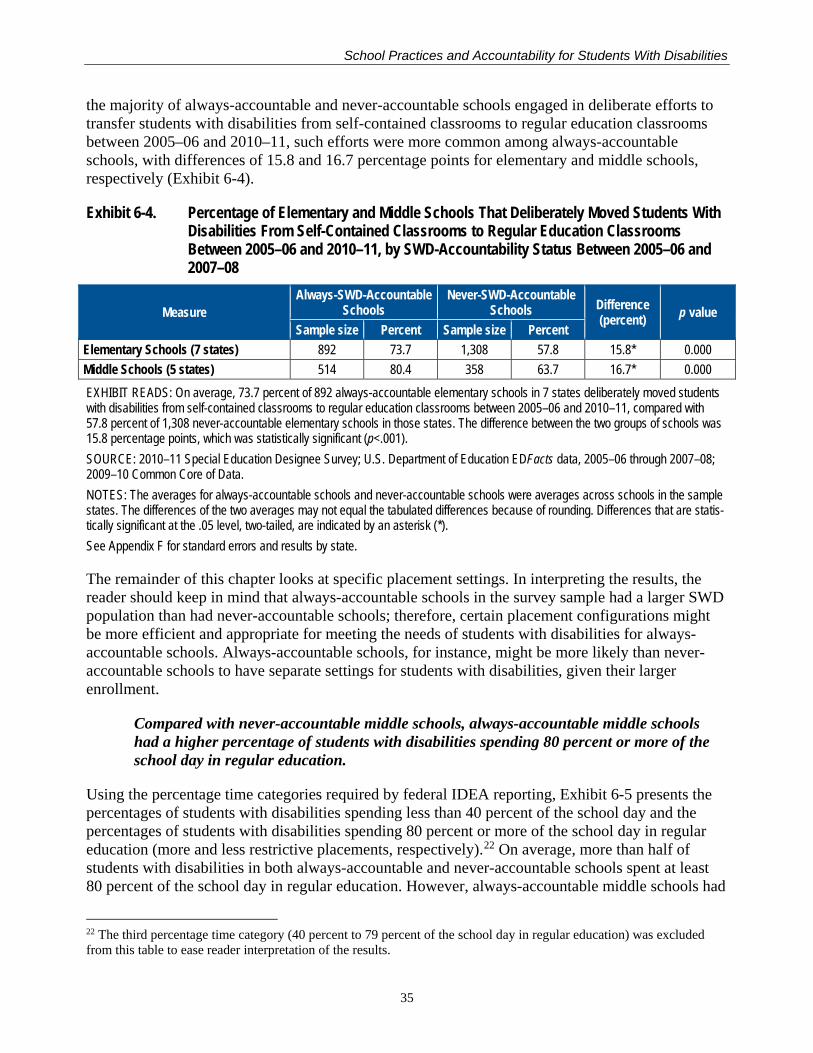
School Practices and Accountability for Students With Disabilities
the majority of always-accountable and never-accountable schools engaged in deliberate efforts to transfer students with disabilities from self-contained classrooms to regular education classrooms between 2005–06 and 2010–11, such efforts were more common among always-accountable schools, with differences of 15.8 and 16.7 percentage points for elementary and middle schools, respectively (Exhibit 6-4).
Exhibit 6-4. Percentage of Elementary and Middle Schools That Deliberately Moved Students With Disabilities From Self-Contained Classrooms to Regular Education Classrooms Between 2005–06 and 2010–11, by SWD-Accountability Status Between 2005–06 and 2007–08
Measure Always-SWD-Accountable
Schools Never-SWD-Accountable
Schools Difference (percent) p value
Sample size Percent Sample size Percent Elementary Schools (7 states) 892 73.7 1,308 57.8 15.8* 0.000 Middle Schools (5 states) 514 80.4 358 63.7 16.7* 0.000 EXHIBIT READS: On average, 73.7 percent of 892 always-accountable elementary schools in 7 states deliberately moved students with disabilities from self-contained classrooms to regular education classrooms between 2005–06 and 2010–11, compared with 57.8 percent of 1,308 never-accountable elementary schools in those states. The difference between the two groups of schools was 15.8 percentage points, which was statistically significant (p<.001). SOURCE: 2010–11 Special Education Designee Survey; U.S. Department of Education EDFacts data, 2005–06 through 2007–08; 2009–10 Common Core of Data. NOTES: The averages for always-accountable schools and never-accountable schools were averages across schools in the sample states. The differences of the two averages may not equal the tabulated differences because of rounding. Differences that are statis-tically significant at the .05 level, two-tailed, are indicated by an asterisk (*). See Appendix F for standard errors and results by state.
The remainder of this chapter looks at specific placement settings. In interpreting the results, the reader should keep in mind that always-accountable schools in the survey sample had a larger SWD population than had never-accountable schools; therefore, certain placement configurations might be more efficient and appropriate for meeting the needs of students with disabilities for always-accountable schools. Always-accountable schools, for instance, might be more likely than never-accountable schools to have separate settings for students with disabilities, given their larger enrollment.
Compared with never-accountable middle schools, always-accountable middle schools had a higher percentage of students with disabilities spending 80 percent or more of the school day in regular education.
Using the percentage time categories required by federal IDEA reporting, Exhibit 6-5 presents the percentages of students with disabilities spending less than 40 percent of the school day and the percentages of students with disabilities spending 80 percent or more of the school day in regular education (more and less restrictive placements, respectively).22 On average, more than half of students with disabilities in both always-accountable and never-accountable schools spent at least 80 percent of the school day in regular education. However, always-accountable middle schools had
22 The third percentage time category (40 percent to 79 percent of the school day in regular education) was excluded from this table to ease reader interpretation of the results.
35
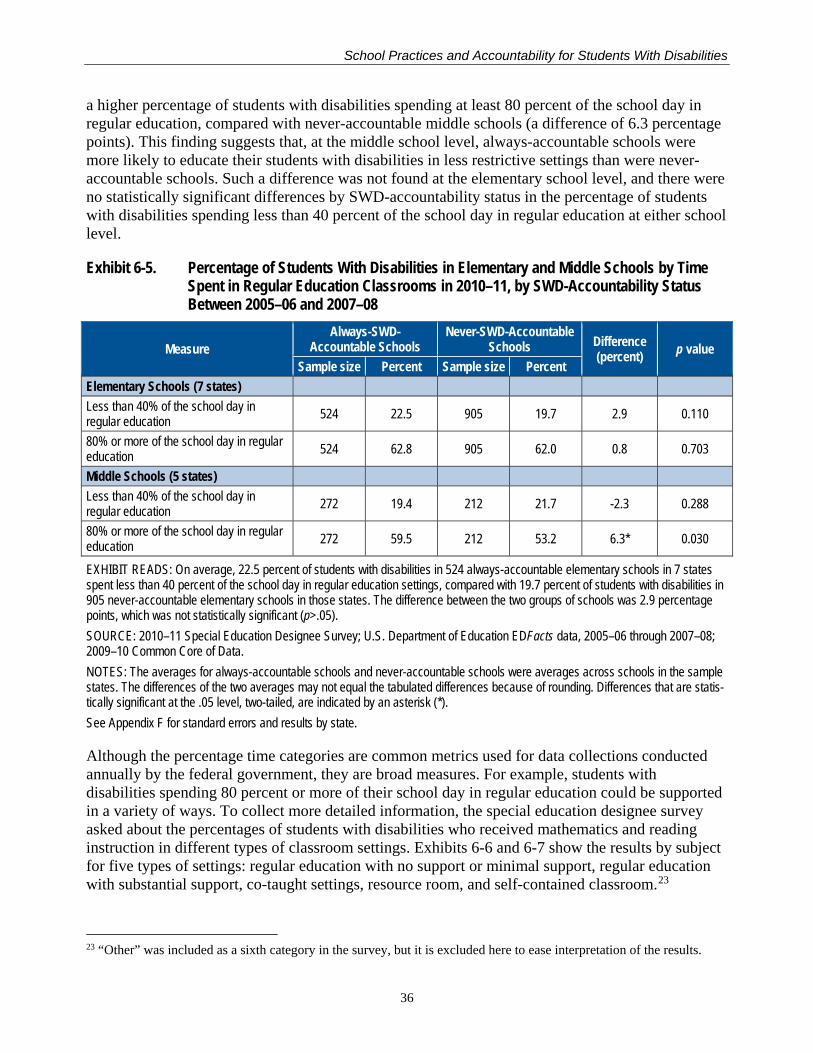
School Practices and Accountability for Students With Disabilities
a higher percentage of students with disabilities spending at least 80 percent of the school day in regular education, compared with never-accountable middle schools (a difference of 6.3 percentage points). This finding suggests that, at the middle school level, always-accountable schools were more likely to educate their students with disabilities in less restrictive settings than were never-accountable schools. Such a difference was not found at the elementary school level, and there were no statistically significant differences by SWD-accountability status in the percentage of students with disabilities spending less than 40 percent of the school day in regular education at either school level.
Exhibit 6-5. Percentage of Students With Disabilities in Elementary and Middle Schools by Time Spent in Regular Education Classrooms in 2010–11, by SWD-Accountability Status Between 2005–06 and 2007–08
Measure Always-SWD-
Accountable Schools Never-SWD-Accountable
Schools Difference (percent) p value
Sample size Percent Sample size Percent Elementary Schools (7 states) Less than 40% of the school day in regular education 524 22.5 905 19.7 2.9 0.110
80% or more of the school day in regular education 524 62.8 905 62.0 0.8 0.703
Middle Schools (5 states) Less than 40% of the school day in regular education 272 19.4 212 21.7 -2.3 0.288
80% or more of the school day in regular education 272 59.5 212 53.2 6.3* 0.030
EXHIBIT READS: On average, 22.5 percent of students with disabilities in 524 always-accountable elementary schools in 7 states spent less than 40 percent of the school day in regular education settings, compared with 19.7 percent of students with disabilities in 905 never-accountable elementary schools in those states. The difference between the two groups of schools was 2.9 percentage points, which was not statistically significant (p>.05). SOURCE: 2010–11 Special Education Designee Survey; U.S. Department of Education EDFacts data, 2005–06 through 2007–08; 2009–10 Common Core of Data. NOTES: The averages for always-accountable schools and never-accountable schools were averages across schools in the sample states. The differences of the two averages may not equal the tabulated differences because of rounding. Differences that are statis-tically significant at the .05 level, two-tailed, are indicated by an asterisk (*). See Appendix F for standard errors and results by state.
Although the percentage time categories are common metrics used for data collections conducted annually by the federal government, they are broad measures. For example, students with disabilities spending 80 percent or more of their school day in regular education could be supported in a variety of ways. To collect more detailed information, the special education designee survey asked about the percentages of students with disabilities who received mathematics and reading instruction in different types of classroom settings. Exhibits 6-6 and 6-7 show the results by subject for five types of settings: regular education with no support or minimal support, regular education with substantial support, co-taught settings, resource room, and self-contained classroom.23
23 “Other” was included as a sixth category in the survey, but it is excluded here to ease interpretation of the results.
36
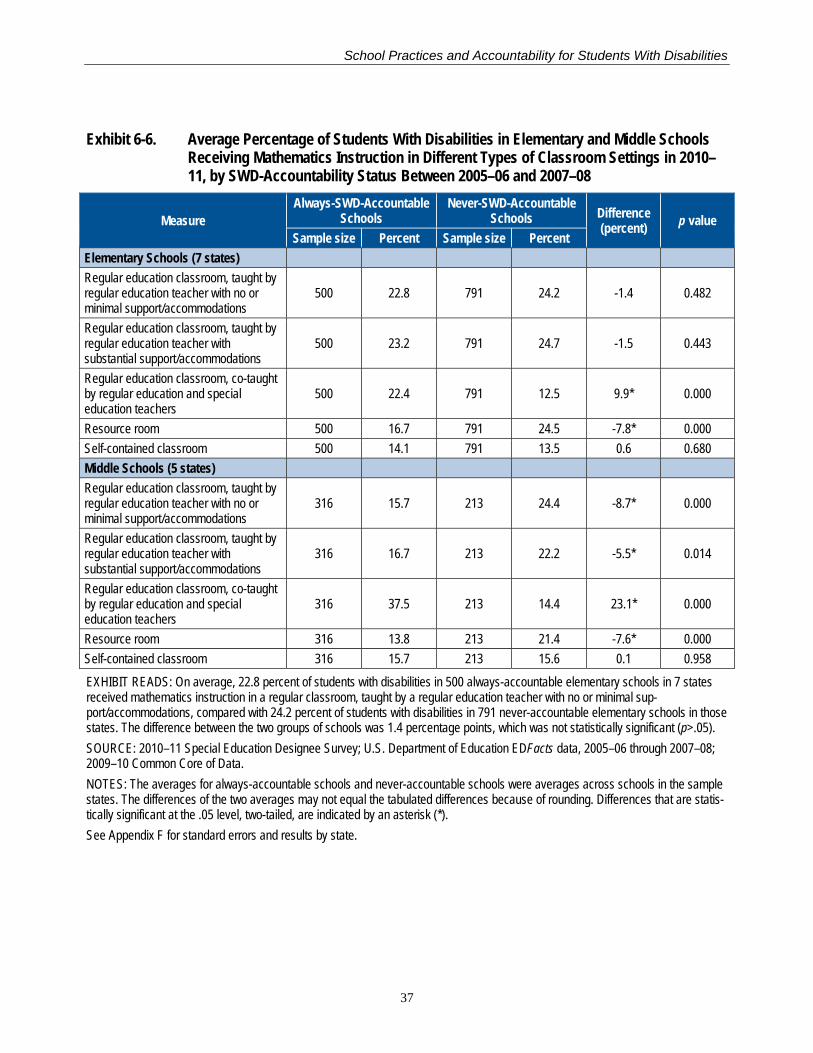
School Practices and Accountability for Students With Disabilities
Exhibit 6-6. Average Percentage of Students With Disabilities in Elementary and Middle Schools Receiving Mathematics Instruction in Different Types of Classroom Settings in 2010–11, by SWD-Accountability Status Between 2005–06 and 2007–08
Measure Always-SWD-Accountable
Schools Never-SWD-Accountable
Schools Difference (percent) p value
Sample size Percent Sample size Percent Elementary Schools (7 states) Regular education classroom, taught by regular education teacher with no or minimal support/accommodations
500 22.8 791 24.2 -1.4 0.482
Regular education classroom, taught by regular education teacher with substantial support/accommodations
500 23.2 791 24.7 -1.5 0.443
Regular education classroom, co-taught by regular education and special education teachers
500 22.4 791 12.5 9.9* 0.000
Resource room 500 16.7 791 24.5 -7.8* 0.000 Self-contained classroom 500 14.1 791 13.5 0.6 0.680 Middle Schools (5 states) Regular education classroom, taught by regular education teacher with no or minimal support/accommodations
316 15.7 213 24.4 -8.7* 0.000
Regular education classroom, taught by regular education teacher with substantial support/accommodations
316 16.7 213 22.2 -5.5* 0.014
Regular education classroom, co-taught by regular education and special education teachers
316 37.5 213 14.4 23.1* 0.000
Resource room 316 13.8 213 21.4 -7.6* 0.000 Self-contained classroom 316 15.7 213 15.6 0.1 0.958 EXHIBIT READS: On average, 22.8 percent of students with disabilities in 500 always-accountable elementary schools in 7 states received mathematics instruction in a regular classroom, taught by a regular education teacher with no or minimal sup-port/accommodations, compared with 24.2 percent of students with disabilities in 791 never-accountable elementary schools in those states. The difference between the two groups of schools was 1.4 percentage points, which was not statistically significant (p>.05). SOURCE: 2010–11 Special Education Designee Survey; U.S. Department of Education EDFacts data, 2005–06 through 2007–08; 2009–10 Common Core of Data. NOTES: The averages for always-accountable schools and never-accountable schools were averages across schools in the sample states. The differences of the two averages may not equal the tabulated differences because of rounding. Differences that are statis-tically significant at the .05 level, two-tailed, are indicated by an asterisk (*). See Appendix F for standard errors and results by state.
37
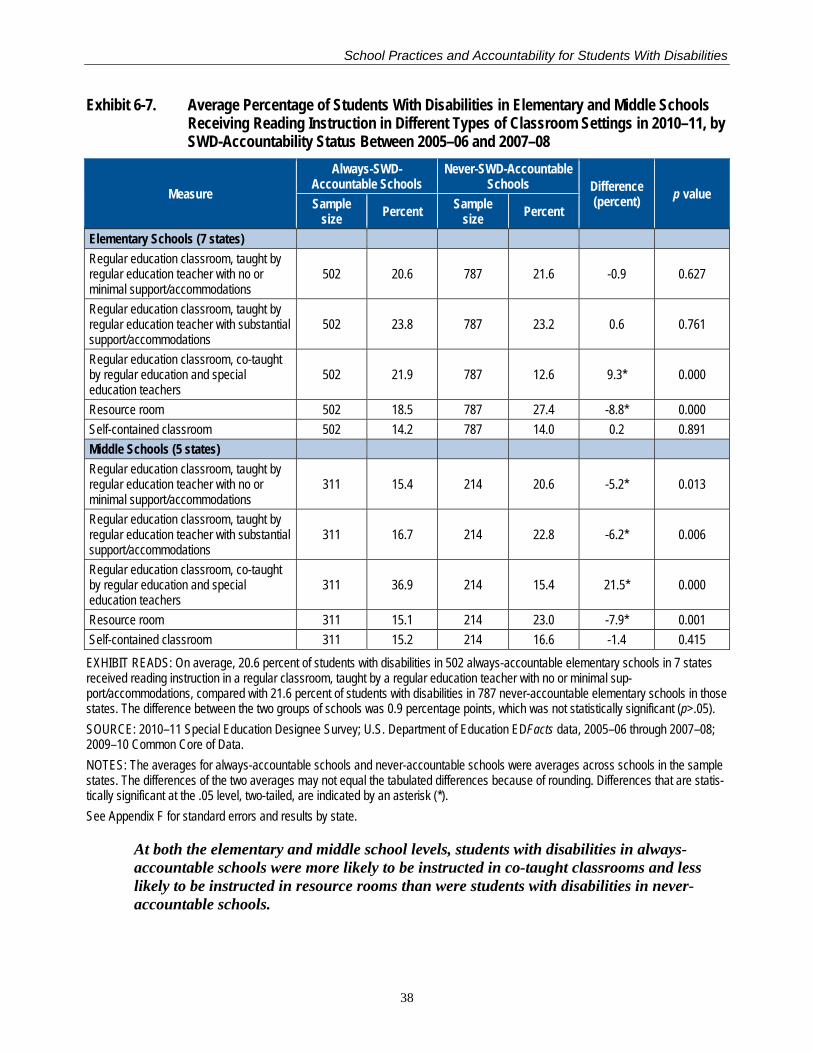
School Practices and Accountability for Students With Disabilities
Exhibit 6-7. Average Percentage of Students With Disabilities in Elementary and Middle Schools Receiving Reading Instruction in Different Types of Classroom Settings in 2010–11, by SWD-Accountability Status Between 2005–06 and 2007–08
Measure
Always-SWD-Accountable Schools
Never-SWD-Accountable Schools Difference
(percent) p value Sample
size Percent Sample size Percent
Elementary Schools (7 states) Regular education classroom, taught by regular education teacher with no or minimal support/accommodations
502 20.6 787 21.6 -0.9 0.627
Regular education classroom, taught by regular education teacher with substantial support/accommodations
502 23.8 787 23.2 0.6 0.761
Regular education classroom, co-taught by regular education and special education teachers
502 21.9 787 12.6 9.3* 0.000
Resource room 502 18.5 787 27.4 -8.8* 0.000 Self-contained classroom 502 14.2 787 14.0 0.2 0.891 Middle Schools (5 states) Regular education classroom, taught by regular education teacher with no or minimal support/accommodations
311 15.4 214 20.6 -5.2* 0.013
Regular education classroom, taught by regular education teacher with substantial support/accommodations
311 16.7 214 22.8 -6.2* 0.006
Regular education classroom, co-taught by regular education and special education teachers
311 36.9 214 15.4 21.5* 0.000
Resource room 311 15.1 214 23.0 -7.9* 0.001 Self-contained classroom 311 15.2 214 16.6 -1.4 0.415 EXHIBIT READS: On average, 20.6 percent of students with disabilities in 502 always-accountable elementary schools in 7 states received reading instruction in a regular classroom, taught by a regular education teacher with no or minimal sup-port/accommodations, compared with 21.6 percent of students with disabilities in 787 never-accountable elementary schools in those states. The difference between the two groups of schools was 0.9 percentage points, which was not statistically significant (p>.05). SOURCE: 2010–11 Special Education Designee Survey; U.S. Department of Education EDFacts data, 2005–06 through 2007–08; 2009–10 Common Core of Data. NOTES: The averages for always-accountable schools and never-accountable schools were averages across schools in the sample states. The differences of the two averages may not equal the tabulated differences because of rounding. Differences that are statis-tically significant at the .05 level, two-tailed, are indicated by an asterisk (*). See Appendix F for standard errors and results by state.
At both the elementary and middle school levels, students with disabilities in always-accountable schools were more likely to be instructed in co-taught classrooms and less likely to be instructed in resource rooms than were students with disabilities in never-accountable schools.
38
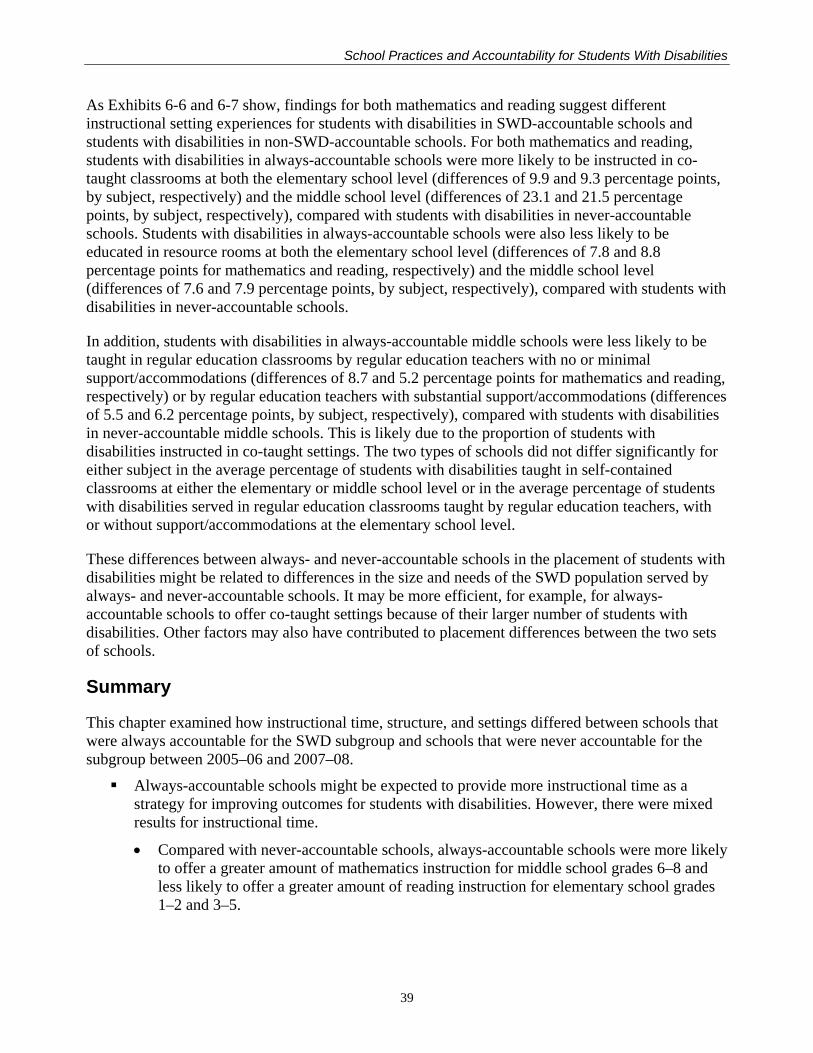
School Practices and Accountability for Students With Disabilities
As Exhibits 6-6 and 6-7 show, findings for both mathematics and reading suggest different instructional setting experiences for students with disabilities in SWD-accountable schools and students with disabilities in non-SWD-accountable schools. For both mathematics and reading, students with disabilities in always-accountable schools were more likely to be instructed in co-taught classrooms at both the elementary school level (differences of 9.9 and 9.3 percentage points, by subject, respectively) and the middle school level (differences of 23.1 and 21.5 percentage points, by subject, respectively), compared with students with disabilities in never-accountable schools. Students with disabilities in always-accountable schools were also less likely to be educated in resource rooms at both the elementary school level (differences of 7.8 and 8.8 percentage points for mathematics and reading, respectively) and the middle school level (differences of 7.6 and 7.9 percentage points, by subject, respectively), compared with students with disabilities in never-accountable schools.
In addition, students with disabilities in always-accountable middle schools were less likely to be taught in regular education classrooms by regular education teachers with no or minimal support/accommodations (differences of 8.7 and 5.2 percentage points for mathematics and reading, respectively) or by regular education teachers with substantial support/accommodations (differences of 5.5 and 6.2 percentage points, by subject, respectively), compared with students with disabilities in never-accountable middle schools. This is likely due to the proportion of students with disabilities instructed in co-taught settings. The two types of schools did not differ significantly for either subject in the average percentage of students with disabilities taught in self-contained classrooms at either the elementary or middle school level or in the average percentage of students with disabilities served in regular education classrooms taught by regular education teachers, with or without support/accommodations at the elementary school level.
These differences between always- and never-accountable schools in the placement of students with disabilities might be related to differences in the size and needs of the SWD population served by always- and never-accountable schools. It may be more efficient, for example, for always-accountable schools to offer co-taught settings because of their larger number of students with disabilities. Other factors may also have contributed to placement differences between the two sets of schools.
Summary
This chapter examined how instructional time, structure, and settings differed between schools that were always accountable for the SWD subgroup and schools that were never accountable for the subgroup between 2005–06 and 2007–08. Always-accountable schools might be expected to provide more instructional time as a
strategy for improving outcomes for students with disabilities. However, there were mixedresults for instructional time.
• Compared with never-accountable schools, always-accountable schools were more likelyto offer a greater amount of mathematics instruction for middle school grades 6–8 andless likely to offer a greater amount of reading instruction for elementary school grades1–2 and 3–5.
39
School Practices and Accountability for Students With Disabilities
• Compared with never-accountable schools, always-accountable schools were more likelyto offer extended instructional time opportunities (e.g., after-school programs) and blockscheduling at the elementary school level but less likely to offer block scheduling at themiddle school level.
• There were no significant differences in the percentage of students with disabilitiesreceiving extended instructional time between always- and never-accountable schools ateither school level.
To improve access to the general education curriculum and SWD outcomes, always-accountable schools may put greater emphasis on placing students with disabilities inregular education classrooms. The survey results provided support for this hypothesis.
• At both the elementary and middle school levels, always-accountable schools were morelikely than never-accountable schools to deliberately move students with disabilitiesfrom self-contained settings to regular education classrooms.
• Compared with never-accountable middle schools, always-accountable middle schools had a higher percentage of students with disabilities spending 80 percent or more of the school day in regular education.
• At both the elementary and middle school levels, students with disabilities in always-accountable schools were more likely to be instructed in co-taught regular educationclassrooms and less likely to receive instruction in resource rooms for both mathematicsand reading, compared with students with disabilities in never-accountable schools.
40
School Practices and Accountability for Students With Disabilities
Chapter 7: Teacher Collaboration and Professional Develop-ment in SWD-Accountable and Non-SWD-Accountable Schools This chapter reviews findings for the fourth research question: How do teacher collaboration and professional development differ between SWD-accountable and non-SWD-accountable schools?
In addition to adopting school improvement programs and student support strategies, and making changes to instructional time and settings, schools also might respond to being held accountable for SWD performance by implementing strategies to improve teachers’ capacity to provide instruction to students with disabilities. To accomplish this, schools might increase the degree of teacher collaboration to improve instructional practice and provide targeted professional development (PD) and coaching to regular education and special education teachers on topics related to students with disabilities.
Always-accountable schools were more likely to use team teaching to some extent or to a great extent than were non-SWD-accountable schools.
The special education designee survey asked about the extent to which the school engaged in three activities related to teacher collaboration: team teaching, the use of student achievement data to systematically inform instruction (which often involves teachers meeting to discuss the interpretation of data), and common planning time. At both school levels, always-accountable schools were more likely to use team teaching to some extent or to a great extent, with differences of 20.6 percentage points for elementary schools and 34.2 percentage points for middle schools. The greater use of team teaching in always-accountable schools may be due to size differences between always- and never-accountable schools, as it may be more efficient and practical for schools with larger numbers of students with disabilities to pair teachers together. Teachers in a majority of both always-accountable and never-accountable schools used student data to inform instruction and common planning time to some extent or to a great extent at both school levels (Exhibit 7-1). Always-accountable schools were more likely than never-accountable schools to use student achievement data to some or to a great extent at the elementary school level (a difference of 2.7 percentage points) and more likely to use common teacher planning time to some or to a great extent at the middle school level (a difference of 6.0 percentage points).
41
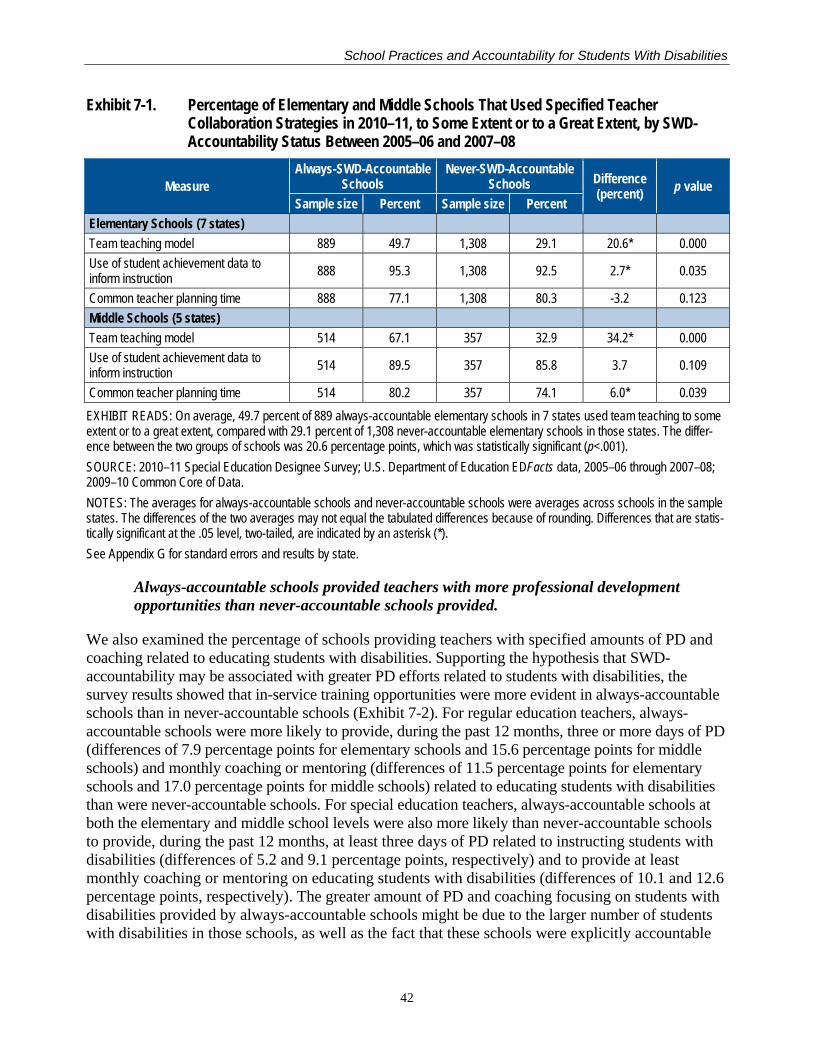
School Practices and Accountability for Students With Disabilities
Exhibit 7-1. Percentage of Elementary and Middle Schools That Used Specified Teacher Collaboration Strategies in 2010–11, to Some Extent or to a Great Extent, by SWD-Accountability Status Between 2005–06 and 2007–08
Measure Always-SWD-Accountable
Schools Never-SWD-Accountable
Schools Difference (percent) p value
Sample size Percent Sample size Percent Elementary Schools (7 states) Team teaching model 889 49.7 1,308 29.1 20.6* 0.000 Use of student achievement data to inform instruction 888 95.3 1,308 92.5 2.7* 0.035
Common teacher planning time 888 77.1 1,308 80.3 -3.2 0.123 Middle Schools (5 states) Team teaching model 514 67.1 357 32.9 34.2* 0.000 Use of student achievement data to inform instruction 514 89.5 357 85.8 3.7 0.109
Common teacher planning time 514 80.2 357 74.1 6.0* 0.039 EXHIBIT READS: On average, 49.7 percent of 889 always-accountable elementary schools in 7 states used team teaching to some extent or to a great extent, compared with 29.1 percent of 1,308 never-accountable elementary schools in those states. The differ-ence between the two groups of schools was 20.6 percentage points, which was statistically significant (p<.001). SOURCE: 2010–11 Special Education Designee Survey; U.S. Department of Education EDFacts data, 2005–06 through 2007–08; 2009–10 Common Core of Data. NOTES: The averages for always-accountable schools and never-accountable schools were averages across schools in the sample states. The differences of the two averages may not equal the tabulated differences because of rounding. Differences that are statis-tically significant at the .05 level, two-tailed, are indicated by an asterisk (*). See Appendix G for standard errors and results by state.
Always-accountable schools provided teachers with more professional development opportunities than never-accountable schools provided.
We also examined the percentage of schools providing teachers with specified amounts of PD and coaching related to educating students with disabilities. Supporting the hypothesis that SWD-accountability may be associated with greater PD efforts related to students with disabilities, the survey results showed that in-service training opportunities were more evident in always-accountable schools than in never-accountable schools (Exhibit 7-2). For regular education teachers, always-accountable schools were more likely to provide, during the past 12 months, three or more days of PD (differences of 7.9 percentage points for elementary schools and 15.6 percentage points for middle schools) and monthly coaching or mentoring (differences of 11.5 percentage points for elementary schools and 17.0 percentage points for middle schools) related to educating students with disabilities than were never-accountable schools. For special education teachers, always-accountable schools at both the elementary and middle school levels were also more likely than never-accountable schools to provide, during the past 12 months, at least three days of PD related to instructing students with disabilities (differences of 5.2 and 9.1 percentage points, respectively) and to provide at least monthly coaching or mentoring on educating students with disabilities (differences of 10.1 and 12.6 percentage points, respectively). The greater amount of PD and coaching focusing on students with disabilities provided by always-accountable schools might be due to the larger number of students with disabilities in those schools, as well as the fact that these schools were explicitly accountable
42
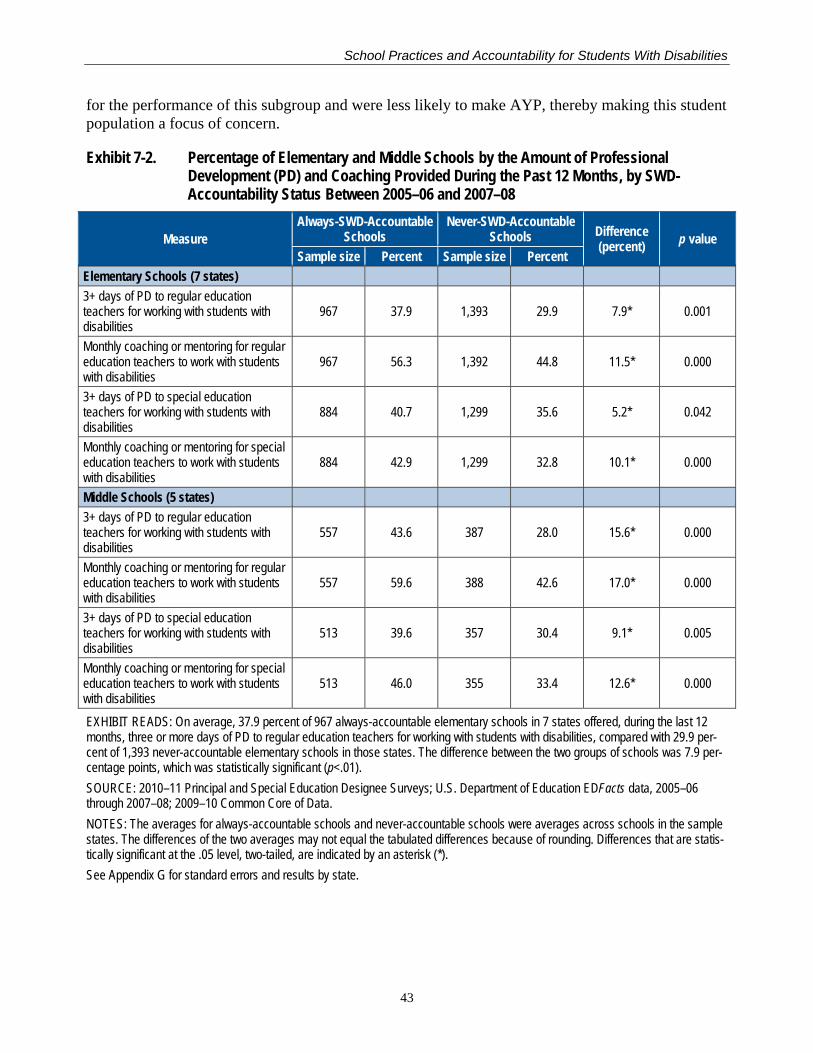
School Practices and Accountability for Students With Disabilities
for the performance of this subgroup and were less likely to make AYP, thereby making this student population a focus of concern.
Exhibit 7-2. Percentage of Elementary and Middle Schools by the Amount of Professional Development (PD) and Coaching Provided During the Past 12 Months, by SWD-Accountability Status Between 2005–06 and 2007–08
Measure Always-SWD-Accountable
Schools Never-SWD-Accountable
Schools Difference (percent) p value
Sample size Percent Sample size Percent Elementary Schools (7 states) 3+ days of PD to regular education teachers for working with students with disabilities
967 37.9 1,393 29.9 7.9* 0.001
Monthly coaching or mentoring for regular education teachers to work with students with disabilities
967 56.3 1,392 44.8 11.5* 0.000
3+ days of PD to special education teachers for working with students with disabilities
884 40.7 1,299 35.6 5.2* 0.042
Monthly coaching or mentoring for special education teachers to work with students with disabilities
884 42.9 1,299 32.8 10.1* 0.000
Middle Schools (5 states) 3+ days of PD to regular education teachers for working with students with disabilities
557 43.6 387 28.0 15.6* 0.000
Monthly coaching or mentoring for regular education teachers to work with students with disabilities
557 59.6 388 42.6 17.0* 0.000
3+ days of PD to special education teachers for working with students with disabilities
513 39.6 357 30.4 9.1* 0.005
Monthly coaching or mentoring for special education teachers to work with students with disabilities
513 46.0 355 33.4 12.6* 0.000
EXHIBIT READS: On average, 37.9 percent of 967 always-accountable elementary schools in 7 states offered, during the last 12 months, three or more days of PD to regular education teachers for working with students with disabilities, compared with 29.9 per-cent of 1,393 never-accountable elementary schools in those states. The difference between the two groups of schools was 7.9 per-centage points, which was statistically significant (p<.01). SOURCE: 2010–11 Principal and Special Education Designee Surveys; U.S. Department of Education EDFacts data, 2005–06 through 2007–08; 2009–10 Common Core of Data. NOTES: The averages for always-accountable schools and never-accountable schools were averages across schools in the sample states. The differences of the two averages may not equal the tabulated differences because of rounding. Differences that are statis-tically significant at the .05 level, two-tailed, are indicated by an asterisk (*). See Appendix G for standard errors and results by state.
43
School Practices and Accountability for Students With Disabilities
Summary
This chapter examined how teacher collaboration and professional development practices differed between schools that were always accountable for SWD subgroup performance and schools that were never accountable for the subgroup between 2005–06 and 2007–08. Always-accountable schools at both school levels were more likely to use team teaching to
some extent or to a great extent than were non-SWD-accountable schools. Always-accountable schools were more likely than non-SWD-accountable schools to use, to some extent or a great extent, student data to inform instruction at the elementary level and common teacher planning time at the middle school level.
There was evidence that always-accountable schools provided more PD opportunities than did never-accountable schools. At both the elementary and middle school levels, always-accountable schools were more likely than never-accountable schools to provide regular education and special education teachers with three or more days of PD during the past 12 months and at least monthly coaching related to instructing students with disabilities.
44
School Practices and Accountability for Students With Disabilities
References Dee, T.S., Jacob, B., & Schwartz, N.L. (2013). The Effects of NCLB on School Resources and
Practices. Educational Evaluation and Policy Analysis, 35(2), pp. 252-279.
Harr-Robins, J., Song, M., Hurlburt, S., Pruce, C., Danielson, L., & Garet, M. (2013). The Inclusion of Students With Disabilities in School Accountability Systems: An Update (NCEE 2013-4017). Washington, DC: National Center for Education Evaluation and Regional Assistance, Institute of Education Sciences, U.S. Department of Education.
Kim, J.S., & Sunderman, G.L. (2005). Measuring Academic Proficiency Under the No Child Left Behind Act: Implications for Educational Equity. Educational Researcher, 34(8), pp. 3-13.
Krieg, J.M., & Storer, P. (2006). How much do students matter? Applying the Oaxaca Decomposition to Explain Determinants of Adequate Yearly Progress. Contemporary Economic Policy, 24(4), pp. 563-581.
McMurrer, J. (2007). Choice, Changes, and Challenges: Curriculum and Instruction in the NCLB Era. Washington, DC: Center on Education Policy.
Rouse, C.E., Hannaway, J., Goldhaber, D., & Figlio, D. (2007). Feeling the Florida Heat? How Low-Performing Schools Respond to Voucher and Accountability Pressure. Working Paper 13681. Cambridge, MA: National Bureau of Economic Research.
Taylor, J., O’Day, J., & Le Floch, K.C. (2010). State and Local Implementation of the No Child Left Behind Act, Volume IX—Accountability Under NCLB: Final Report. Washington, DC: Office of Planning, Evaluation and Policy Development, Policy and Program Studies Service, U.S. Department of Education.
45

School Practices and Accountability for Students With Disabilities
Appendix A: Principal and Special Education Designee Sur-veys
46
School Improvement Status and Out-comes for Students with Disabilities
Study
Principal Survey
Prepared by: American Institutes for Research
Prepared for: U.S. Department of Education Contract No. ED-04-CO-0025/0013
Paperwork Burden Statement
According to the Paperwork Reduction Act of 1995, no persons are required to respond to a collection of information unless such collection displays a valid OMB control number. The valid OMB control number for this information collection is 1850-0879. The time required to complete this information collection is estimated to average 15 minutes per response, including the time to review instructions, search existing data resources, gather the data needed, and complete and review the information collection. The obligation to respond to this collection is voluntary. Confidentiality is ensured (P.L. 107-279, Title I, Part E, Sec.183) and the security of the data collected is compliant with the Privacy Act of 1974 as amended (5 U.S.C. 552a). Send comments regarding the burden estimate or any other aspect of this collection of information, including suggestions for reducing this burden, to the U.S. Department of Education, 400 Maryland Ave., SW, Washington, DC 20210-4537 or email [email protected] and reference the OMB Control Number 1850-0879. Note: Please do not return the completed survey to this address.
School Practices and Accountability for Students With Disabilities
Dear Principal:
Thank you for participating in a survey for the School Improvement Status and Outcomes for Students with Dis-abilities Study. This study will examine the inclusion of students with disabilities in school accountability sys-tems, school practices that may affect the outcomes of students with disabilities, and achievement trends of these students over time.
Your participation is important and appreciated, but you do have the right not to participate in the study or with-draw from the study at any time. You may also skip any question that you do not wish to answer. You will face no penalty or loss of benefits to which you are entitled if you refuse to participate in this study. Below are an-swers to some general questions concerning your participation.
What is the purpose of this survey?
The purpose of the survey is to provide policy-relevant information about the education of students with disabili-ties by examining school practices that may affect the education outcomes of these students.
Who is conducting this survey?
This study was commissioned by the Department of Education’s Institute of Education Sciences, and is adminis-tered by the American Institutes for Research (AIR) and NORC at the University of Chicago.
Why should you participate in this survey?
By responding to this survey, you can help policy makers, educators and researchers to better understand how schools are working to improve outcomes for students with disabilities.
Will your responses be kept confidential?
Your responses are protected from disclosure by federal statute (P.L. 107-279, Title I, Part E, Sec.183). Re-sponses to data collection are voluntary and will be used only for broadly descriptive and statistical purposes. The reports prepared for the study will summarize findings across the sample and will not associate responses with a specific school or individual. In no instances will data that relate to or describe identifiable characteristics of individuals or individual schools be disclosed or used in identifiable form, except as required by law.
How will your information be reported?
The information you provide will be combined with the information provided by others in statistical reports. No individual data that link your name, address, or telephone number with your responses will be included in the statistical reports.
For more information about this study you can contact the research team at [email protected] or call the study’s toll-free number at 1-800-609-2911.
Thank you for your cooperation in this very important effort!
48
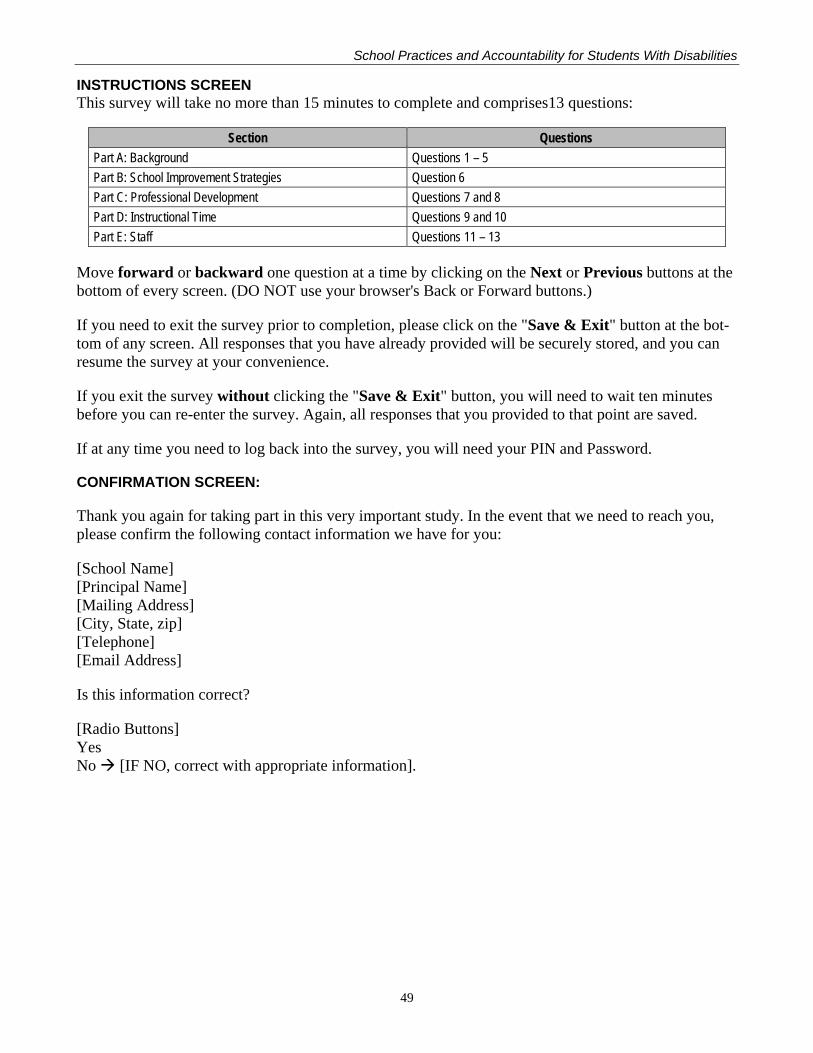
School Practices and Accountability for Students With Disabilities
INSTRUCTIONS SCREEN This survey will take no more than 15 minutes to complete and comprises13 questions:
Section Questions Part A: Background Questions 1 – 5 Part B: School Improvement Strategies Question 6 Part C: Professional Development Questions 7 and 8 Part D: Instructional Time Questions 9 and 10 Part E: Staff Questions 11 – 13
Move forward or backward one question at a time by clicking on the Next or Previous buttons at the bottom of every screen. (DO NOT use your browser's Back or Forward buttons.)
If you need to exit the survey prior to completion, please click on the "Save & Exit" button at the bot-tom of any screen. All responses that you have already provided will be securely stored, and you can resume the survey at your convenience.
If you exit the survey without clicking the "Save & Exit" button, you will need to wait ten minutes before you can re-enter the survey. Again, all responses that you provided to that point are saved.
If at any time you need to log back into the survey, you will need your PIN and Password.
CONFIRMATION SCREEN:
Thank you again for taking part in this very important study. In the event that we need to reach you, please confirm the following contact information we have for you:
[School Name] [Principal Name] [Mailing Address] [City, State, zip] [Telephone] [Email Address]
Is this information correct?
[Radio Buttons] Yes No [IF NO, correct with appropriate information].
49
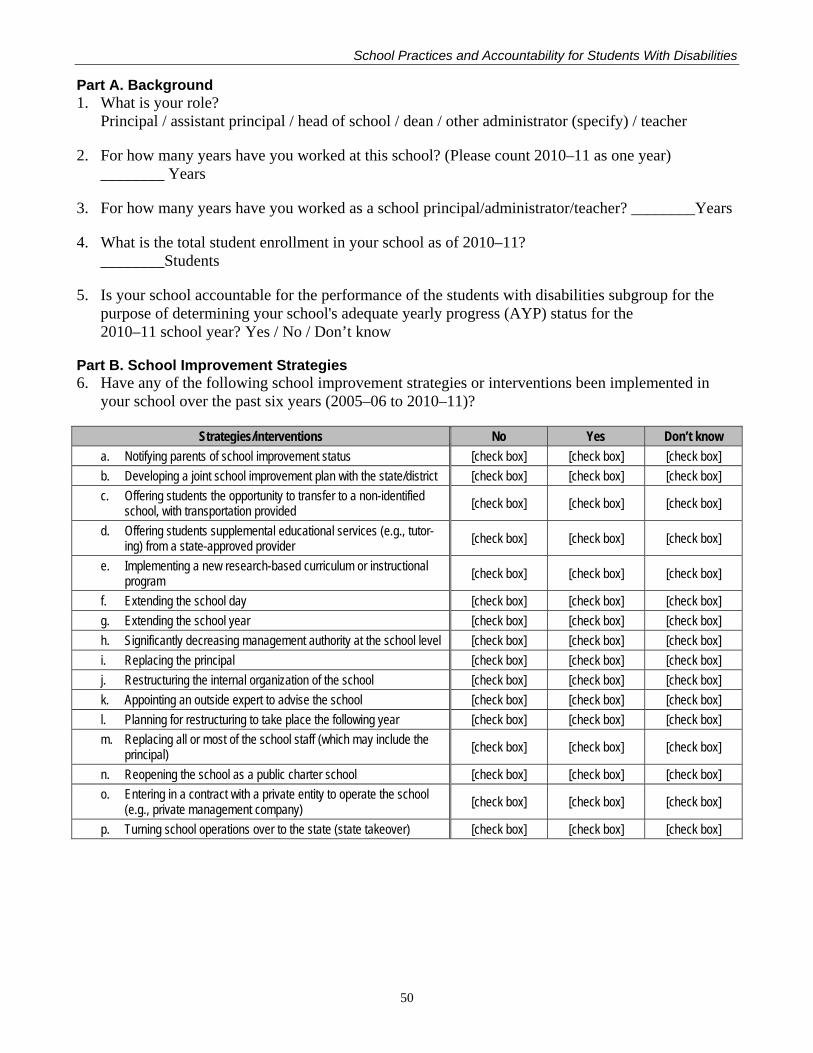
School Practices and Accountability for Students With Disabilities
Part A. Background 1. What is your role?
Principal / assistant principal / head of school / dean / other administrator (specify) / teacher
2. For how many years have you worked at this school? (Please count 2010–11 as one year) ________ Years
3. For how many years have you worked as a school principal/administrator/teacher? ________Years
4. What is the total student enrollment in your school as of 2010–11? ________Students
5. Is your school accountable for the performance of the students with disabilities subgroup for the purpose of determining your school's adequate yearly progress (AYP) status for the 2010–11 school year? Yes / No / Don’t know
Part B. School Improvement Strategies 6. Have any of the following school improvement strategies or interventions been implemented in
your school over the past six years (2005–06 to 2010–11)?
Strategies/interventions No Yes Don’t know a. Notifying parents of school improvement status [check box] [check box] [check box] b. Developing a joint school improvement plan with the state/district [check box] [check box] [check box] c. Offering students the opportunity to transfer to a non-identified
school, with transportation provided [check box] [check box] [check box]
d. Offering students supplemental educational services (e.g., tutor-ing) from a state-approved provider [check box] [check box] [check box]
e. Implementing a new research-based curriculum or instructional program [check box] [check box] [check box]
f. Extending the school day [check box] [check box] [check box] g. Extending the school year [check box] [check box] [check box] h. Significantly decreasing management authority at the school level [check box] [check box] [check box] i. Replacing the principal [check box] [check box] [check box] j. Restructuring the internal organization of the school [check box] [check box] [check box] k. Appointing an outside expert to advise the school [check box] [check box] [check box] l. Planning for restructuring to take place the following year [check box] [check box] [check box] m. Replacing all or most of the school staff (which may include the
principal) [check box] [check box] [check box]
n. Reopening the school as a public charter school [check box] [check box] [check box] o. Entering in a contract with a private entity to operate the school
(e.g., private management company) [check box] [check box] [check box]
p. Turning school operations over to the state (state takeover) [check box] [check box] [check box]
50
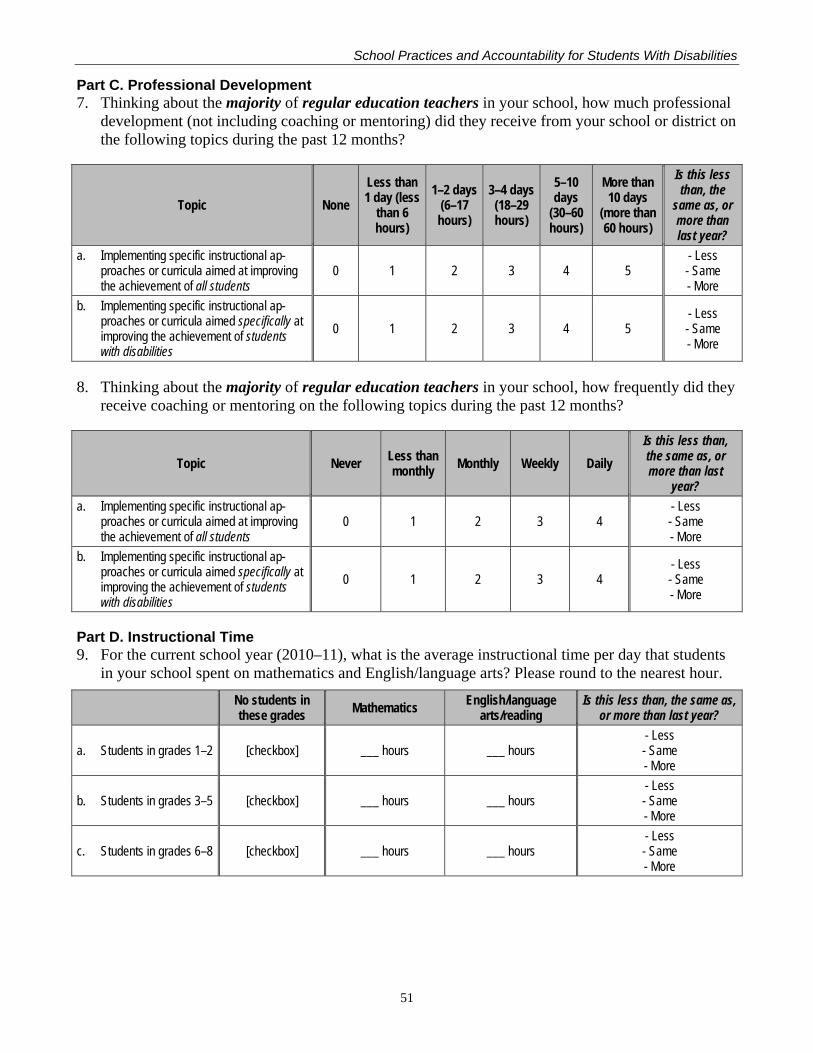
School Practices and Accountability for Students With Disabilities
Part C. Professional Development 7. Thinking about the majority of regular education teachers in your school, how much professional
development (not including coaching or mentoring) did they receive from your school or district on the following topics during the past 12 months?
Topic None Less than 1 day (less
than 6 hours)
1–2 days (6–17 hours)
3–4 days (18–29 hours)
5–10 days
(30–60 hours)
More than 10 days
(more than 60 hours)
Is this less than, the
same as, or more than last year?
a. Implementing specific instructional ap-proaches or curricula aimed at improving the achievement of all students
0 1 2 3 4 5 - Less - Same - More
b. Implementing specific instructional ap-proaches or curricula aimed specifically at improving the achievement of students with disabilities
0 1 2 3 4 5 - Less - Same - More
8. Thinking about the majority of regular education teachers in your school, how frequently did they receive coaching or mentoring on the following topics during the past 12 months?
Topic Never Less than monthly Monthly Weekly Daily
Is this less than, the same as, or more than last
year? a. Implementing specific instructional ap-
proaches or curricula aimed at improving the achievement of all students
0 1 2 3 4 - Less - Same - More
b. Implementing specific instructional ap-proaches or curricula aimed specifically at improving the achievement of students with disabilities
0 1 2 3 4 - Less - Same - More
Part D. Instructional Time 9. For the current school year (2010–11), what is the average instructional time per day that students
in your school spent on mathematics and English/language arts? Please round to the nearest hour.
No students in these grades Mathematics English/language
arts/reading Is this less than, the same as,
or more than last year?
a. Students in grades 1–2 [checkbox] ___ hours ___ hours - Less - Same - More
b. Students in grades 3–5 [checkbox] ___ hours ___ hours - Less - Same - More
c. Students in grades 6–8 [checkbox] ___ hours ___ hours - Less - Same - More
51
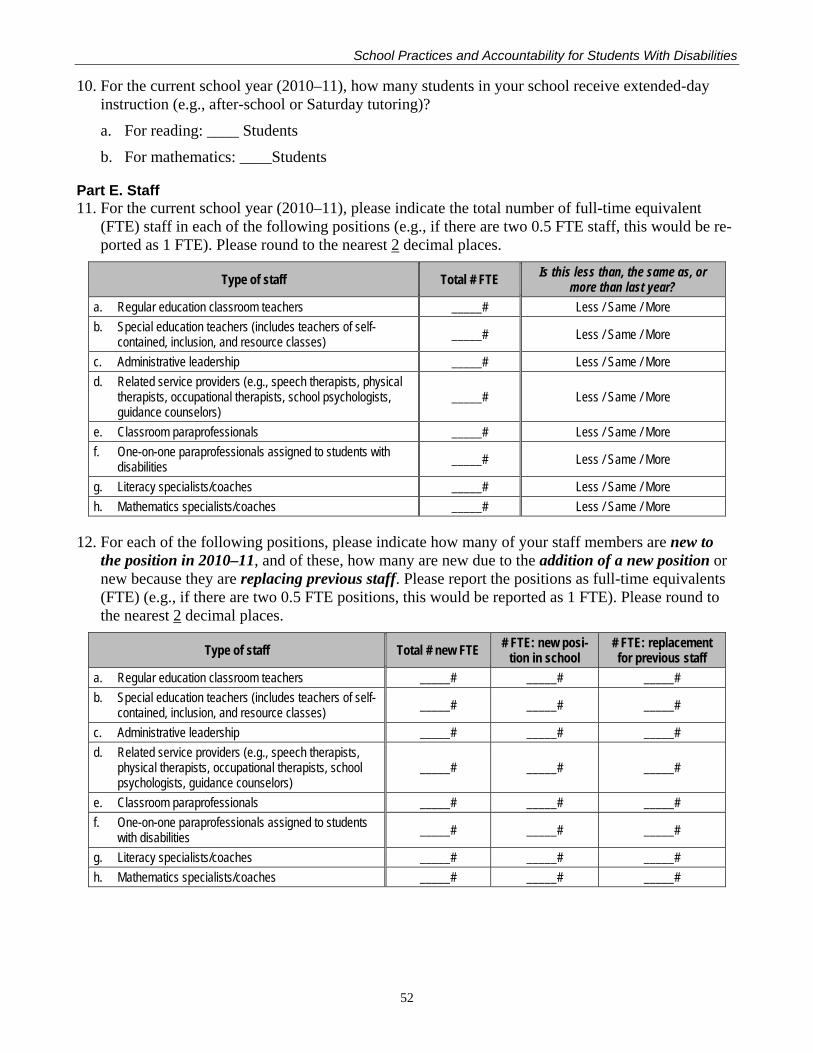
School Practices and Accountability for Students With Disabilities
10. For the current school year (2010–11), how many students in your school receive extended-day instruction (e.g., after-school or Saturday tutoring)? a. For reading: ____ Students b. For mathematics: ____Students
Part E. Staff 11. For the current school year (2010–11), please indicate the total number of full-time equivalent
(FTE) staff in each of the following positions (e.g., if there are two 0.5 FTE staff, this would be re-ported as 1 FTE). Please round to the nearest 2 decimal places.
Type of staff Total # FTE Is this less than, the same as, or more than last year?
a. Regular education classroom teachers _____# Less / Same / More b. Special education teachers (includes teachers of self-
contained, inclusion, and resource classes) _____# Less / Same / More
c. Administrative leadership _____# Less / Same / More d. Related service providers (e.g., speech therapists, physical
therapists, occupational therapists, school psychologists, guidance counselors)
_____# Less / Same / More
e. Classroom paraprofessionals _____# Less / Same / More f. One-on-one paraprofessionals assigned to students with
disabilities _____# Less / Same / More
g. Literacy specialists/coaches _____# Less / Same / More h. Mathematics specialists/coaches _____# Less / Same / More
12. For each of the following positions, please indicate how many of your staff members are new to the position in 2010–11, and of these, how many are new due to the addition of a new position or new because they are replacing previous staff. Please report the positions as full-time equivalents (FTE) (e.g., if there are two 0.5 FTE positions, this would be reported as 1 FTE). Please round to the nearest 2 decimal places.
Type of staff Total # new FTE # FTE: new posi-tion in school
# FTE: replacement for previous staff
a. Regular education classroom teachers _____# _____# _____# b. Special education teachers (includes teachers of self-
contained, inclusion, and resource classes) _____# _____# _____#
c. Administrative leadership _____# _____# _____# d. Related service providers (e.g., speech therapists,
physical therapists, occupational therapists, school psychologists, guidance counselors)
_____# _____# _____#
e. Classroom paraprofessionals _____# _____# _____# f. One-on-one paraprofessionals assigned to students
with disabilities _____# _____# _____#
g. Literacy specialists/coaches _____# _____# _____# h. Mathematics specialists/coaches _____# _____# _____#
52
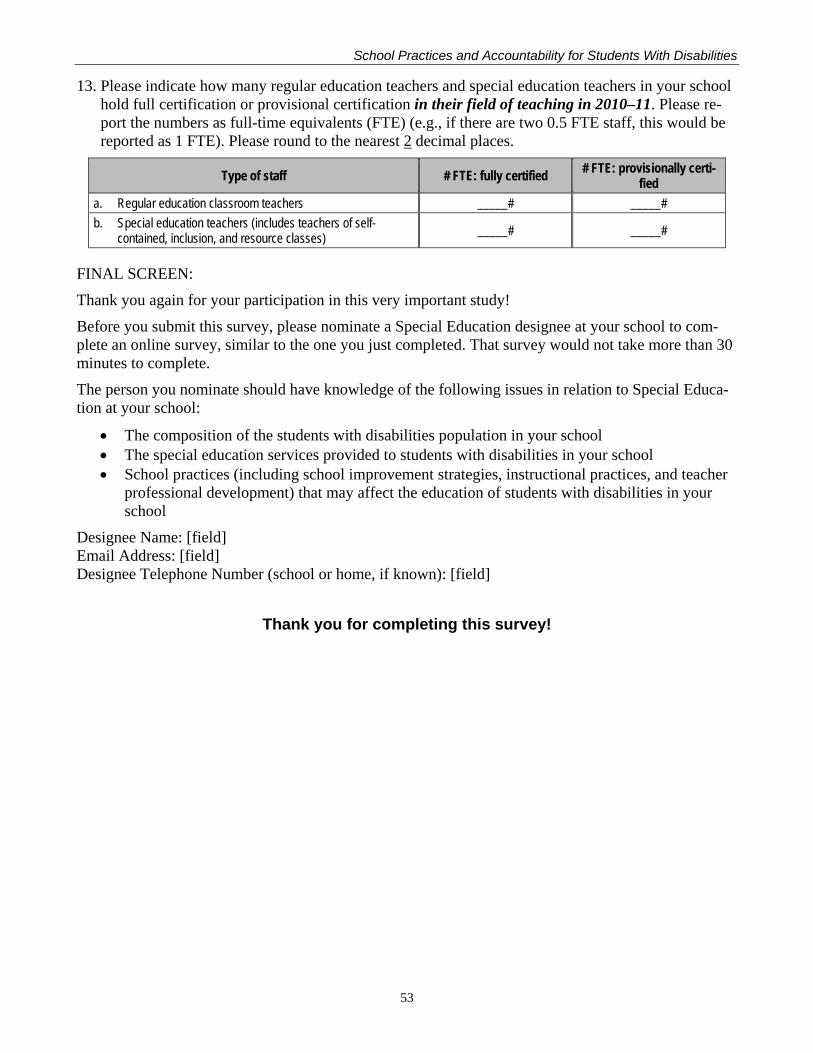
School Practices and Accountability for Students With Disabilities
13. Please indicate how many regular education teachers and special education teachers in your school hold full certification or provisional certification in their field of teaching in 2010–11. Please re-port the numbers as full-time equivalents (FTE) (e.g., if there are two 0.5 FTE staff, this would be reported as 1 FTE). Please round to the nearest 2 decimal places.
Type of staff # FTE: fully certified # FTE: provisionally certi-fied
a. Regular education classroom teachers _____# _____# b. Special education teachers (includes teachers of self-
contained, inclusion, and resource classes) _____# _____#
FINAL SCREEN: Thank you again for your participation in this very important study! Before you submit this survey, please nominate a Special Education designee at your school to com-plete an online survey, similar to the one you just completed. That survey would not take more than 30 minutes to complete. The person you nominate should have knowledge of the following issues in relation to Special Educa-tion at your school:
• The composition of the students with disabilities population in your school • The special education services provided to students with disabilities in your school • School practices (including school improvement strategies, instructional practices, and teacher
professional development) that may affect the education of students with disabilities in your school
Designee Name: [field] Email Address: [field] Designee Telephone Number (school or home, if known): [field]
Thank you for completing this survey!
53
School Improvement Status and Out-comes for Students with Disabilities
Study
Special Education Designee Survey
Prepared by: American Institutes for Research
Prepared for: U.S. Department of Education Contract No. ED-04-CO-0025/0013
Paperwork Burden Statement
According to the Paperwork Reduction Act of 1995, no persons are required to respond to a collection of information unless such collection displays a valid OMB control number. The valid OMB control number for this information collection is 1850-0879. The time required to complete this information collection is estimated to average 30 minutes per response, including the time to review instructions, search existing data resources, gather the data needed, and complete and review the information collection. The obligation to respond to this collection is voluntary. Confidentiality is ensured (P.L. 107-279, Title I, Part E, Sec.183) and the security of the data collected is compliant with the Privacy Act of 1974 as amended (5 U.S.C. 552a). Send comments regarding the burden estimate or any other aspect of this collection of information, including suggestions for reducing this burden, to the U.S. Department of Education, 400 Maryland Ave., SW, Washington, DC 20210-4537 or email [email protected] and reference the OMB Control Number 1850-0879. Note: Please do not return the completed survey to this address.
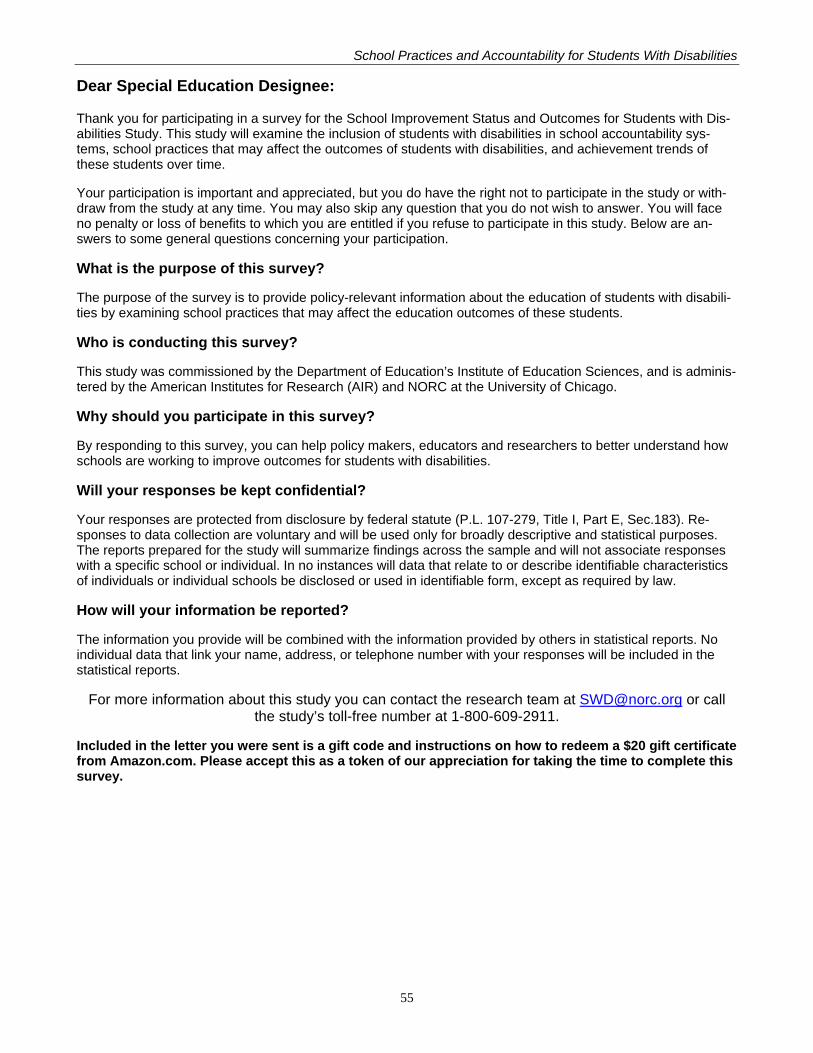
School Practices and Accountability for Students With Disabilities
Dear Special Education Designee:
Thank you for participating in a survey for the School Improvement Status and Outcomes for Students with Dis-abilities Study. This study will examine the inclusion of students with disabilities in school accountability sys-tems, school practices that may affect the outcomes of students with disabilities, and achievement trends of these students over time.
Your participation is important and appreciated, but you do have the right not to participate in the study or with-draw from the study at any time. You may also skip any question that you do not wish to answer. You will face no penalty or loss of benefits to which you are entitled if you refuse to participate in this study. Below are an-swers to some general questions concerning your participation.
What is the purpose of this survey?
The purpose of the survey is to provide policy-relevant information about the education of students with disabili-ties by examining school practices that may affect the education outcomes of these students.
Who is conducting this survey?
This study was commissioned by the Department of Education’s Institute of Education Sciences, and is adminis-tered by the American Institutes for Research (AIR) and NORC at the University of Chicago.
Why should you participate in this survey?
By responding to this survey, you can help policy makers, educators and researchers to better understand how schools are working to improve outcomes for students with disabilities.
Will your responses be kept confidential?
Your responses are protected from disclosure by federal statute (P.L. 107-279, Title I, Part E, Sec.183). Re-sponses to data collection are voluntary and will be used only for broadly descriptive and statistical purposes. The reports prepared for the study will summarize findings across the sample and will not associate responses with a specific school or individual. In no instances will data that relate to or describe identifiable characteristics of individuals or individual schools be disclosed or used in identifiable form, except as required by law.
How will your information be reported?
The information you provide will be combined with the information provided by others in statistical reports. No individual data that link your name, address, or telephone number with your responses will be included in the statistical reports.
For more information about this study you can contact the research team at [email protected] or call the study’s toll-free number at 1-800-609-2911.
Included in the letter you were sent is a gift code and instructions on how to redeem a $20 gift certificate from Amazon.com. Please accept this as a token of our appreciation for taking the time to complete this survey.
55
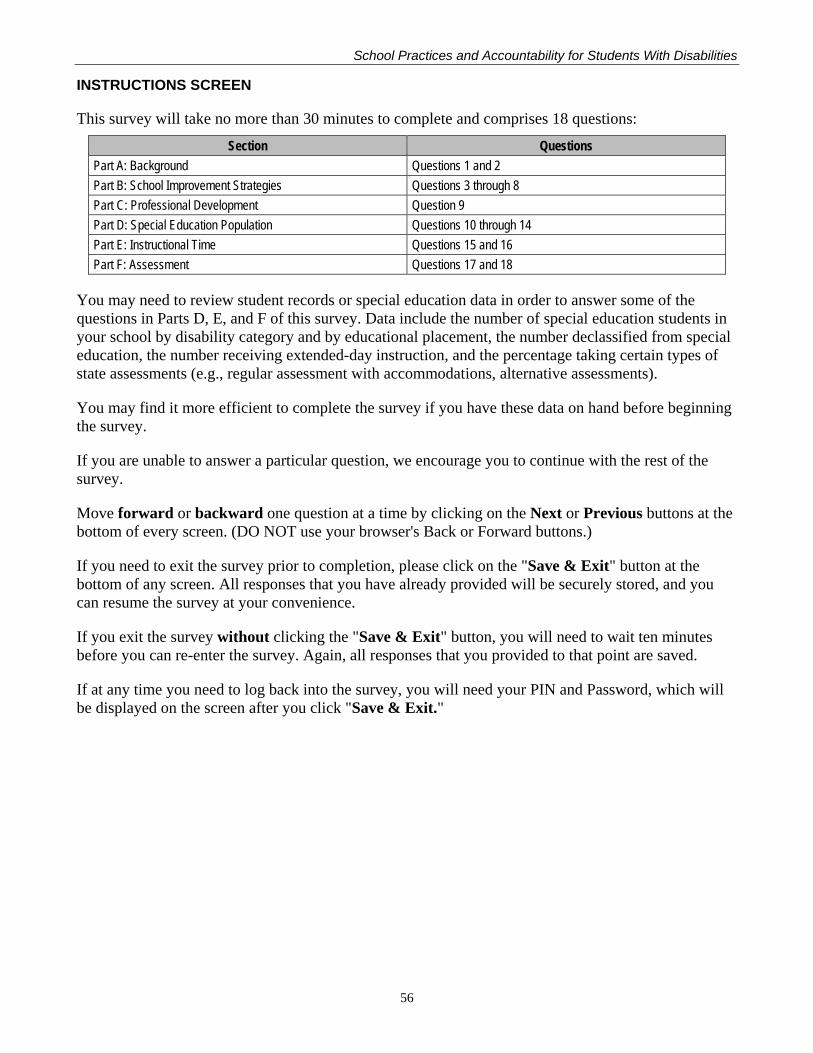
School Practices and Accountability for Students With Disabilities
INSTRUCTIONS SCREEN
This survey will take no more than 30 minutes to complete and comprises 18 questions:
Section Questions Part A: Background Questions 1 and 2 Part B: School Improvement Strategies Questions 3 through 8 Part C: Professional Development Question 9 Part D: Special Education Population Questions 10 through 14 Part E: Instructional Time Questions 15 and 16 Part F: Assessment Questions 17 and 18
You may need to review student records or special education data in order to answer some of the questions in Parts D, E, and F of this survey. Data include the number of special education students in your school by disability category and by educational placement, the number declassified from special education, the number receiving extended-day instruction, and the percentage taking certain types of state assessments (e.g., regular assessment with accommodations, alternative assessments).
You may find it more efficient to complete the survey if you have these data on hand before beginning the survey.
If you are unable to answer a particular question, we encourage you to continue with the rest of the survey.
Move forward or backward one question at a time by clicking on the Next or Previous buttons at the bottom of every screen. (DO NOT use your browser's Back or Forward buttons.)
If you need to exit the survey prior to completion, please click on the "Save & Exit" button at the bottom of any screen. All responses that you have already provided will be securely stored, and you can resume the survey at your convenience.
If you exit the survey without clicking the "Save & Exit" button, you will need to wait ten minutes before you can re-enter the survey. Again, all responses that you provided to that point are saved.
If at any time you need to log back into the survey, you will need your PIN and Password, which will be displayed on the screen after you click "Save & Exit."
56
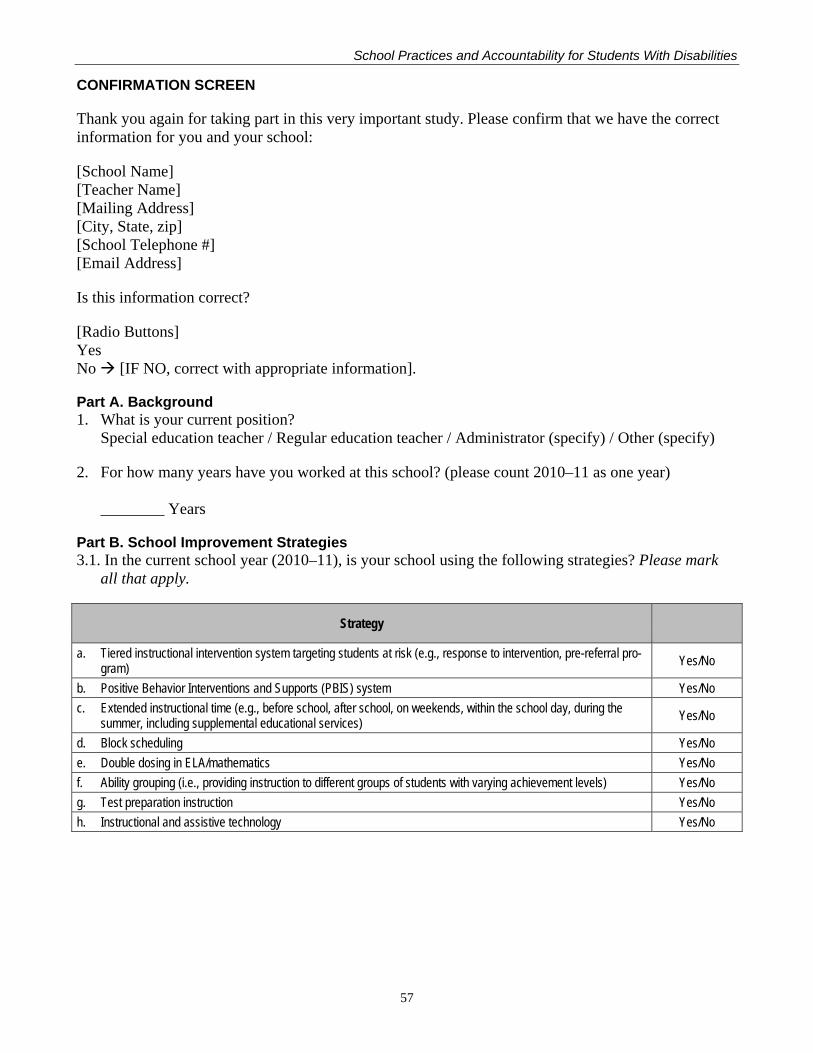
School Practices and Accountability for Students With Disabilities
CONFIRMATION SCREEN
Thank you again for taking part in this very important study. Please confirm that we have the correct information for you and your school:
[School Name] [Teacher Name] [Mailing Address] [City, State, zip] [School Telephone #] [Email Address]
Is this information correct?
[Radio Buttons] Yes No [IF NO, correct with appropriate information].
Part A. Background 1. What is your current position?
Special education teacher / Regular education teacher / Administrator (specify) / Other (specify)
2. For how many years have you worked at this school? (please count 2010–11 as one year) ________ Years
Part B. School Improvement Strategies 3.1. In the current school year (2010–11), is your school using the following strategies? Please mark
all that apply.
Strategy
a. Tiered instructional intervention system targeting students at risk (e.g., response to intervention, pre-referral pro-gram) Yes/No
b. Positive Behavior Interventions and Supports (PBIS) system Yes/No c. Extended instructional time (e.g., before school, after school, on weekends, within the school day, during the
summer, including supplemental educational services) Yes/No
d. Block scheduling Yes/No e. Double dosing in ELA/mathematics Yes/No f. Ability grouping (i.e., providing instruction to different groups of students with varying achievement levels) Yes/No g. Test preparation instruction Yes/No h. Instructional and assistive technology Yes/No
57
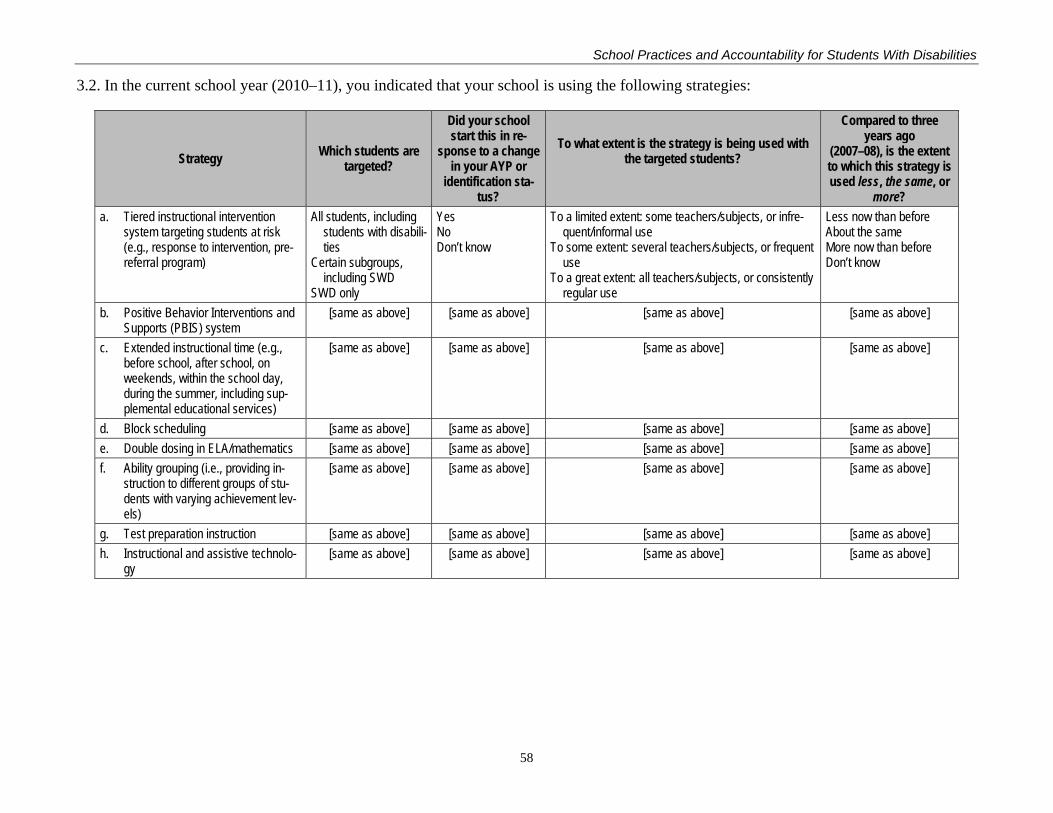
School Practices and Accountability for Students With Disabilities
3.2. In the current school year (2010–11), you indicated that your school is using the following strategies:
Strategy Which students are targeted?
Did your school start this in re-
sponse to a change in your AYP or
identification sta-tus?
To what extent is the strategy is being used with the targeted students?
Compared to three years ago
(2007–08), is the extent to which this strategy is used less, the same, or
more? a. Tiered instructional intervention
system targeting students at risk (e.g., response to intervention, pre-referral program)
All students, including students with disabili-ties
Certain subgroups, including SWD
SWD only
Yes No Don’t know
To a limited extent: some teachers/subjects, or infre-quent/informal use
To some extent: several teachers/subjects, or frequent use
To a great extent: all teachers/subjects, or consistently regular use
Less now than before About the same More now than before Don’t know
b. Positive Behavior Interventions and Supports (PBIS) system
[same as above] [same as above] [same as above] [same as above]
c. Extended instructional time (e.g., before school, after school, on weekends, within the school day, during the summer, including sup-plemental educational services)
[same as above] [same as above] [same as above] [same as above]
d. Block scheduling [same as above] [same as above] [same as above] [same as above] e. Double dosing in ELA/mathematics [same as above] [same as above] [same as above] [same as above] f. Ability grouping (i.e., providing in-
struction to different groups of stu-dents with varying achievement lev-els)
[same as above] [same as above] [same as above] [same as above]
g. Test preparation instruction [same as above] [same as above] [same as above] [same as above] h. Instructional and assistive technolo-
gy [same as above] [same as above] [same as above] [same as above]
58
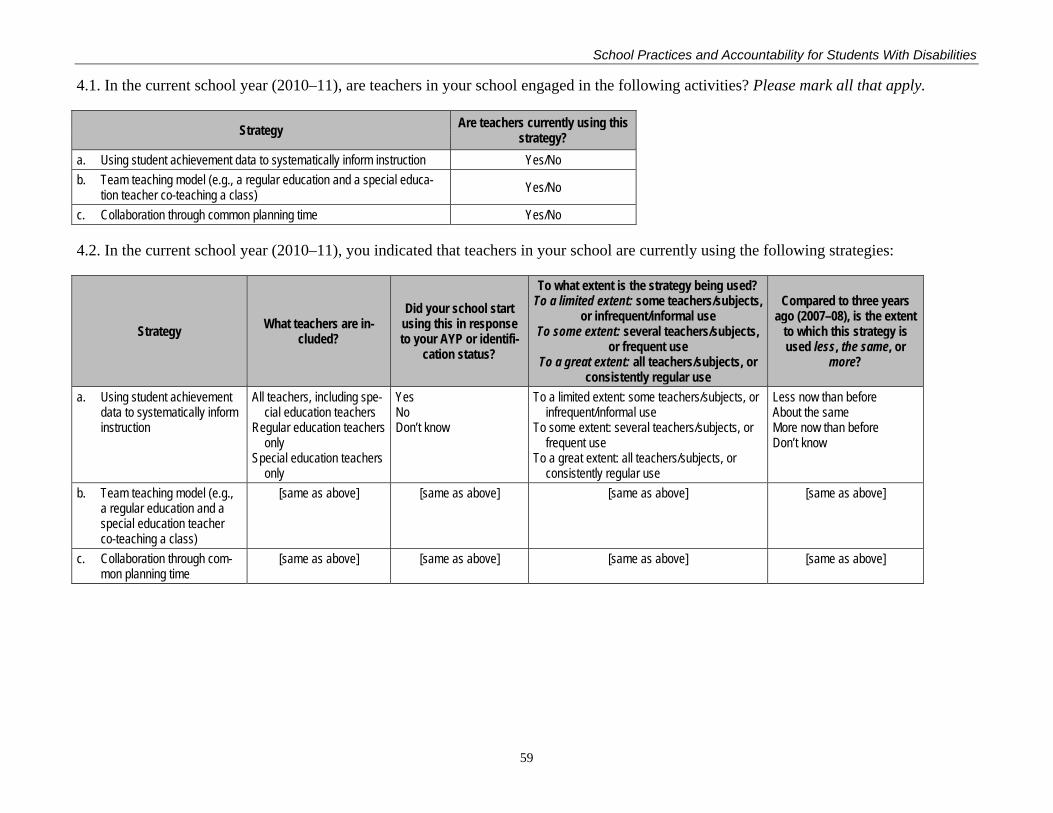
School Practices and Accountability for Students With Disabilities
4.1. In the current school year (2010–11), are teachers in your school engaged in the following activities? Please mark all that apply.
Strategy Are teachers currently using this strategy?
a. Using student achievement data to systematically inform instruction Yes/No b. Team teaching model (e.g., a regular education and a special educa-
tion teacher co-teaching a class) Yes/No
c. Collaboration through common planning time Yes/No
4.2. In the current school year (2010–11), you indicated that teachers in your school are currently using the following strategies:
Strategy What teachers are in-cluded?
Did your school start using this in response to your AYP or identifi-
cation status?
To what extent is the strategy being used? To a limited extent: some teachers/subjects,
or infrequent/informal use To some extent: several teachers/subjects,
or frequent use To a great extent: all teachers/subjects, or
consistently regular use
Compared to three years ago (2007–08), is the extent
to which this strategy is used less, the same, or
more?
a. Using student achievement data to systematically inform instruction
All teachers, including spe-cial education teachers
Regular education teachers only
Special education teachers only
Yes No Don’t know
To a limited extent: some teachers/subjects, or infrequent/informal use
To some extent: several teachers/subjects, or frequent use
To a great extent: all teachers/subjects, or consistently regular use
Less now than before About the same More now than before Don’t know
b. Team teaching model (e.g., a regular education and a special education teacher co-teaching a class)
[same as above] [same as above] [same as above] [same as above]
c. Collaboration through com-mon planning time
[same as above] [same as above] [same as above] [same as above]
59
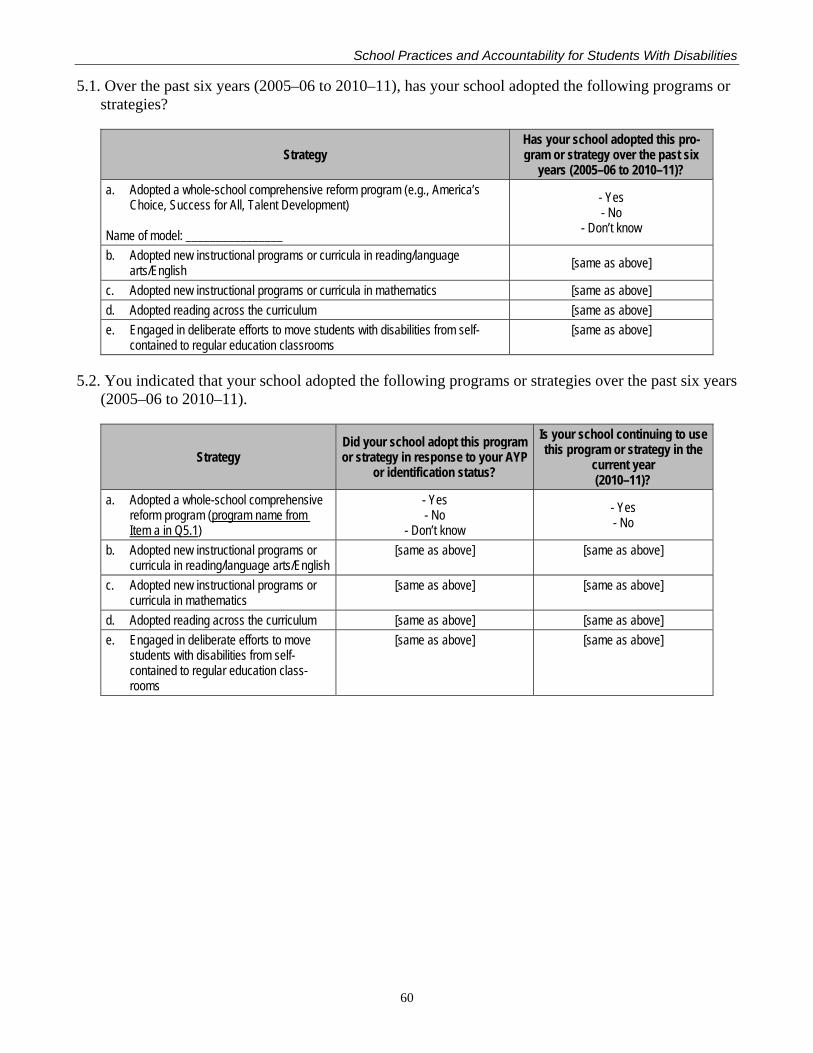
School Practices and Accountability for Students With Disabilities
5.1. Over the past six years (2005–06 to 2010–11), has your school adopted the following programs or strategies?
Strategy Has your school adopted this pro-gram or strategy over the past six
years (2005–06 to 2010–11)? a. Adopted a whole-school comprehensive reform program (e.g., America’s
Choice, Success for All, Talent Development)
Name of model: ________________
- Yes - No
- Don’t know
b. Adopted new instructional programs or curricula in reading/language arts/English [same as above]
c. Adopted new instructional programs or curricula in mathematics [same as above] d. Adopted reading across the curriculum [same as above] e. Engaged in deliberate efforts to move students with disabilities from self-
contained to regular education classrooms [same as above]
5.2. You indicated that your school adopted the following programs or strategies over the past six years (2005–06 to 2010–11).
Strategy Did your school adopt this program or strategy in response to your AYP
or identification status?
Is your school continuing to use this program or strategy in the
current year (2010–11)?
a. Adopted a whole-school comprehensive reform program (program name from Item a in Q5.1)
- Yes - No
- Don’t know - Yes - No
b. Adopted new instructional programs or curricula in reading/language arts/English
[same as above] [same as above]
c. Adopted new instructional programs or curricula in mathematics
[same as above] [same as above]
d. Adopted reading across the curriculum [same as above] [same as above] e. Engaged in deliberate efforts to move
students with disabilities from self-contained to regular education class-rooms
[same as above] [same as above]
60
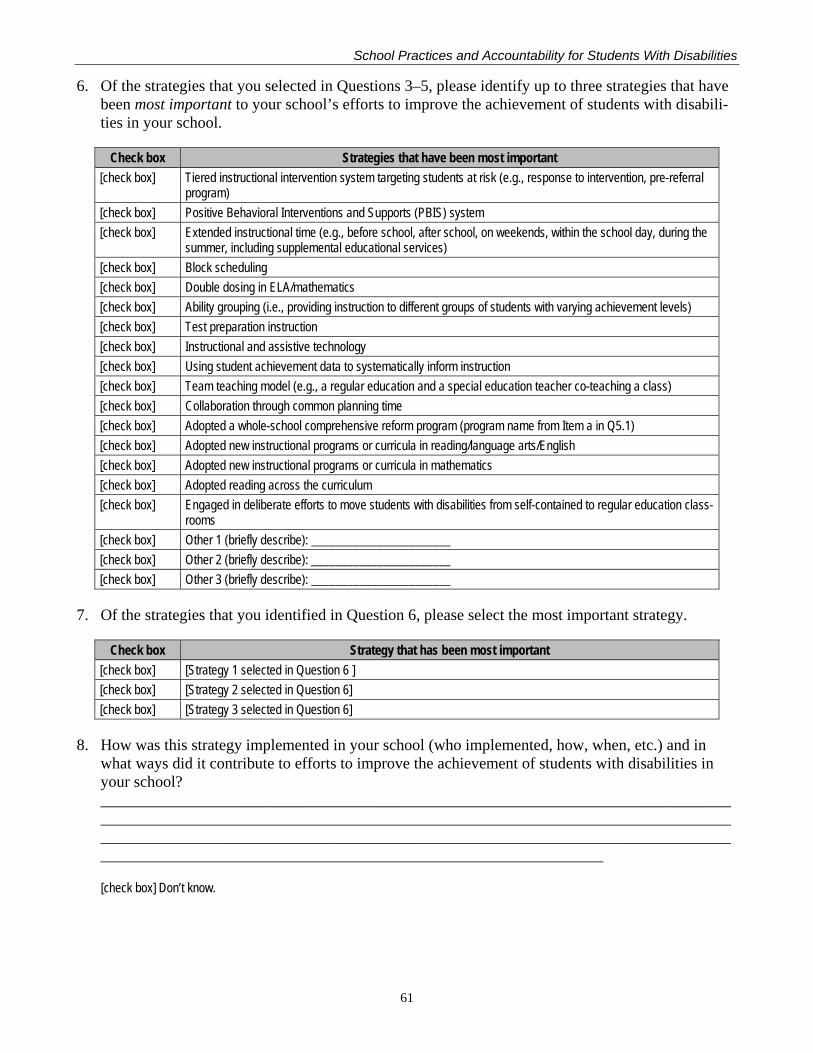
School Practices and Accountability for Students With Disabilities
6. Of the strategies that you selected in Questions 3–5, please identify up to three strategies that have been most important to your school’s efforts to improve the achievement of students with disabili-ties in your school.
Check box Strategies that have been most important [check box] Tiered instructional intervention system targeting students at risk (e.g., response to intervention, pre-referral
program) [check box] Positive Behavioral Interventions and Supports (PBIS) system [check box] Extended instructional time (e.g., before school, after school, on weekends, within the school day, during the
summer, including supplemental educational services) [check box] Block scheduling [check box] Double dosing in ELA/mathematics [check box] Ability grouping (i.e., providing instruction to different groups of students with varying achievement levels) [check box] Test preparation instruction [check box] Instructional and assistive technology [check box] Using student achievement data to systematically inform instruction [check box] Team teaching model (e.g., a regular education and a special education teacher co-teaching a class) [check box] Collaboration through common planning time [check box] Adopted a whole-school comprehensive reform program (program name from Item a in Q5.1) [check box] Adopted new instructional programs or curricula in reading/language arts/English [check box] Adopted new instructional programs or curricula in mathematics [check box] Adopted reading across the curriculum [check box] Engaged in deliberate efforts to move students with disabilities from self-contained to regular education class-
rooms [check box] Other 1 (briefly describe): _______________________ [check box] Other 2 (briefly describe): _______________________ [check box] Other 3 (briefly describe): _______________________
7. Of the strategies that you identified in Question 6, please select the most important strategy.
Check box Strategy that has been most important [check box] [Strategy 1 selected in Question 6 ] [check box] [Strategy 2 selected in Question 6] [check box] [Strategy 3 selected in Question 6]
8. How was this strategy implemented in your school (who implemented, how, when, etc.) and in what ways did it contribute to efforts to improve the achievement of students with disabilities in your school? ____________________________________________________________________________________________________________________________________________________________________________________________________________________________________________________________________________________________________________
[check box] Don’t know.
61
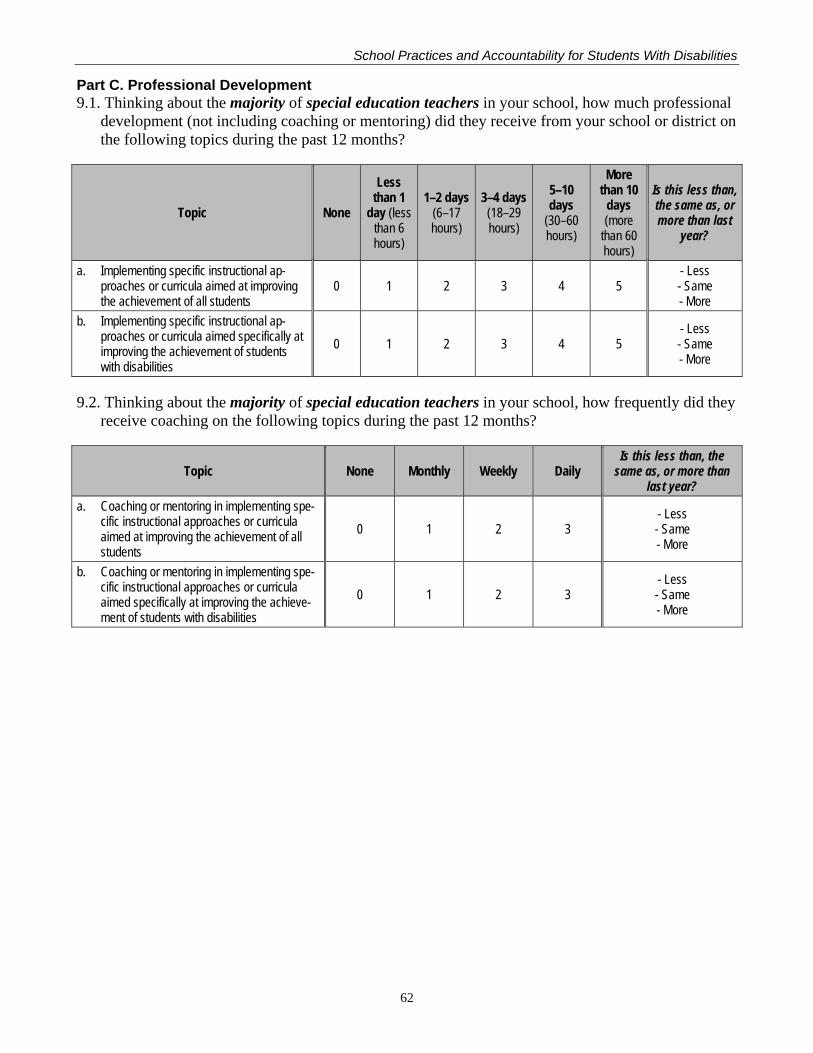
School Practices and Accountability for Students With Disabilities
Part C. Professional Development 9.1. Thinking about the majority of special education teachers in your school, how much professional
development (not including coaching or mentoring) did they receive from your school or district on the following topics during the past 12 months?
Topic None
Less than 1
day (less than 6 hours)
1–2 days (6–17 hours)
3–4 days (18–29 hours)
5–10 days
(30–60 hours)
More than 10
days (more
than 60 hours)
Is this less than, the same as, or more than last
year?
a. Implementing specific instructional ap-proaches or curricula aimed at improving the achievement of all students
0 1 2 3 4 5 - Less - Same - More
b. Implementing specific instructional ap-proaches or curricula aimed specifically at improving the achievement of students with disabilities
0 1 2 3 4 5 - Less - Same - More
9.2. Thinking about the majority of special education teachers in your school, how frequently did they receive coaching on the following topics during the past 12 months?
Topic None Monthly Weekly Daily Is this less than, the
same as, or more than last year?
a. Coaching or mentoring in implementing spe-cific instructional approaches or curricula aimed at improving the achievement of all students
0 1 2 3 - Less - Same - More
b. Coaching or mentoring in implementing spe-cific instructional approaches or curricula aimed specifically at improving the achieve-ment of students with disabilities
0 1 2 3 - Less - Same - More
62
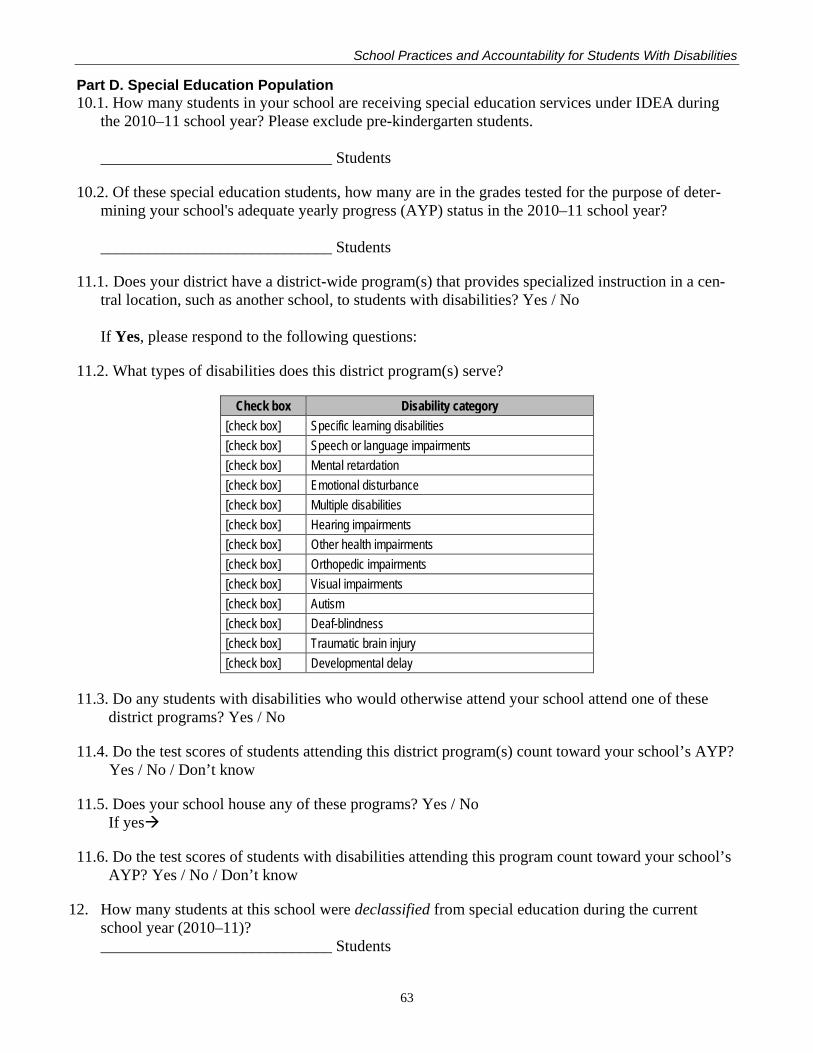
School Practices and Accountability for Students With Disabilities
Part D. Special Education Population 10.1. How many students in your school are receiving special education services under IDEA during
the 2010–11 school year? Please exclude pre-kindergarten students. _____________________________ Students
10.2. Of these special education students, how many are in the grades tested for the purpose of deter-mining your school's adequate yearly progress (AYP) status in the 2010–11 school year? _____________________________ Students
11.1. Does your district have a district-wide program(s) that provides specialized instruction in a cen-tral location, such as another school, to students with disabilities? Yes / No If Yes, please respond to the following questions:
11.2. What types of disabilities does this district program(s) serve?
Check box Disability category [check box] Specific learning disabilities [check box] Speech or language impairments [check box] Mental retardation [check box] Emotional disturbance [check box] Multiple disabilities [check box] Hearing impairments [check box] Other health impairments [check box] Orthopedic impairments [check box] Visual impairments [check box] Autism [check box] Deaf-blindness [check box] Traumatic brain injury [check box] Developmental delay
11.3. Do any students with disabilities who would otherwise attend your school attend one of these district programs? Yes / No
11.4. Do the test scores of students attending this district program(s) count toward your school’s AYP? Yes / No / Don’t know
11.5. Does your school house any of these programs? Yes / No If yes
11.6. Do the test scores of students with disabilities attending this program count toward your school’s AYP? Yes / No / Don’t know
12. How many students at this school were declassified from special education during the current school year (2010–11)? _____________________________ Students
63
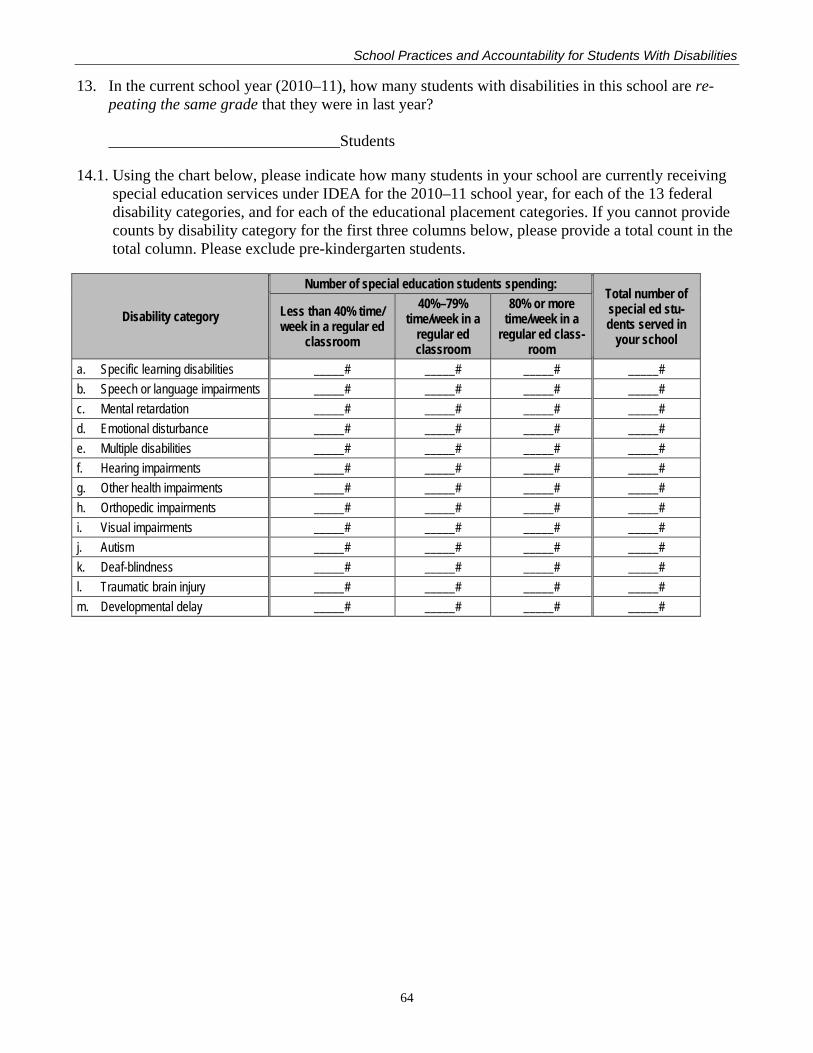
School Practices and Accountability for Students With Disabilities
13. In the current school year (2010–11), how many students with disabilities in this school are re-peating the same grade that they were in last year? _____________________________Students
14.1. Using the chart below, please indicate how many students in your school are currently receiving special education services under IDEA for the 2010–11 school year, for each of the 13 federal disability categories, and for each of the educational placement categories. If you cannot provide counts by disability category for the first three columns below, please provide a total count in the total column. Please exclude pre-kindergarten students.
Disability category
Number of special education students spending: Total number of special ed stu-dents served in
your school
Less than 40% time/ week in a regular ed
classroom
40%–79% time/week in a
regular ed classroom
80% or more time/week in a
regular ed class-room
a. Specific learning disabilities _____# _____# _____# _____# b. Speech or language impairments _____# _____# _____# _____# c. Mental retardation _____# _____# _____# _____# d. Emotional disturbance _____# _____# _____# _____# e. Multiple disabilities _____# _____# _____# _____# f. Hearing impairments _____# _____# _____# _____# g. Other health impairments _____# _____# _____# _____# h. Orthopedic impairments _____# _____# _____# _____# i. Visual impairments _____# _____# _____# _____# j. Autism _____# _____# _____# _____# k. Deaf-blindness _____# _____# _____# _____# l. Traumatic brain injury _____# _____# _____# _____# m. Developmental delay _____# _____# _____# _____#
64
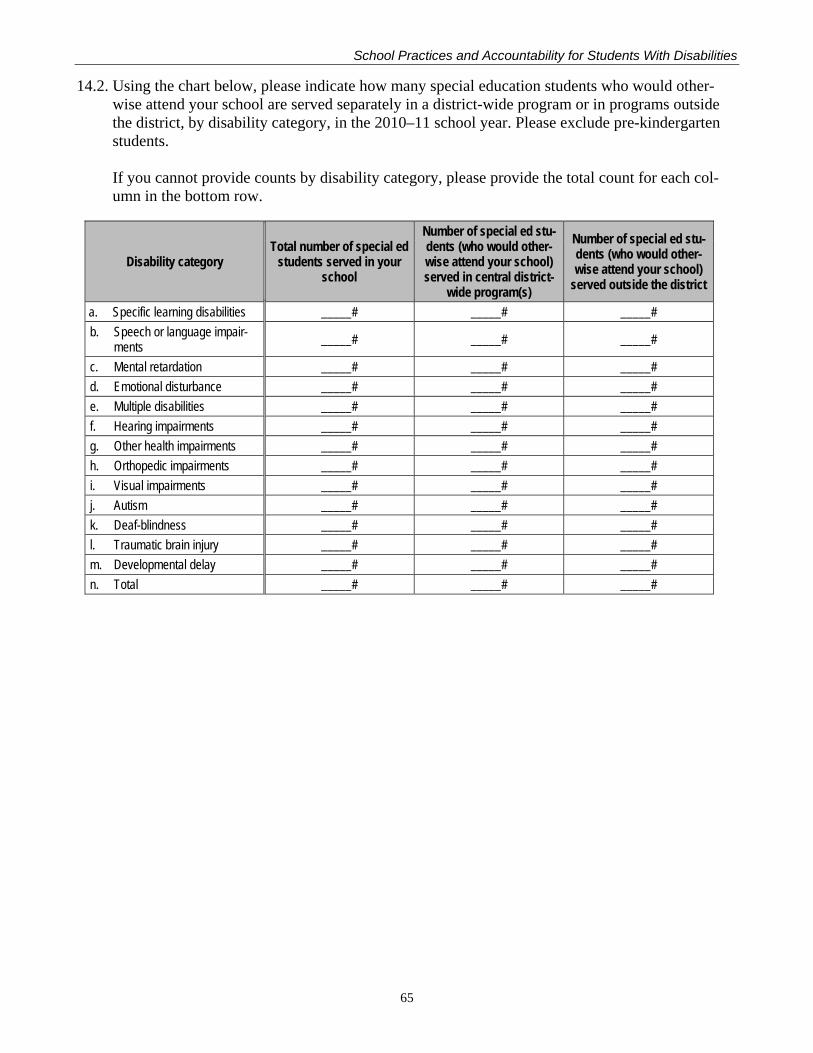
School Practices and Accountability for Students With Disabilities
14.2. Using the chart below, please indicate how many special education students who would other-wise attend your school are served separately in a district-wide program or in programs outside the district, by disability category, in the 2010–11 school year. Please exclude pre-kindergarten students. If you cannot provide counts by disability category, please provide the total count for each col-umn in the bottom row.
Disability category Total number of special ed
students served in your school
Number of special ed stu-dents (who would other-wise attend your school) served in central district-
wide program(s)
Number of special ed stu-dents (who would other-wise attend your school)
served outside the district
a. Specific learning disabilities _____# _____# _____# b. Speech or language impair-
ments _____# _____# _____#
c. Mental retardation _____# _____# _____# d. Emotional disturbance _____# _____# _____# e. Multiple disabilities _____# _____# _____# f. Hearing impairments _____# _____# _____# g. Other health impairments _____# _____# _____# h. Orthopedic impairments _____# _____# _____# i. Visual impairments _____# _____# _____# j. Autism _____# _____# _____# k. Deaf-blindness _____# _____# _____# l. Traumatic brain injury _____# _____# _____# m. Developmental delay _____# _____# _____# n. Total _____# _____# _____#
65
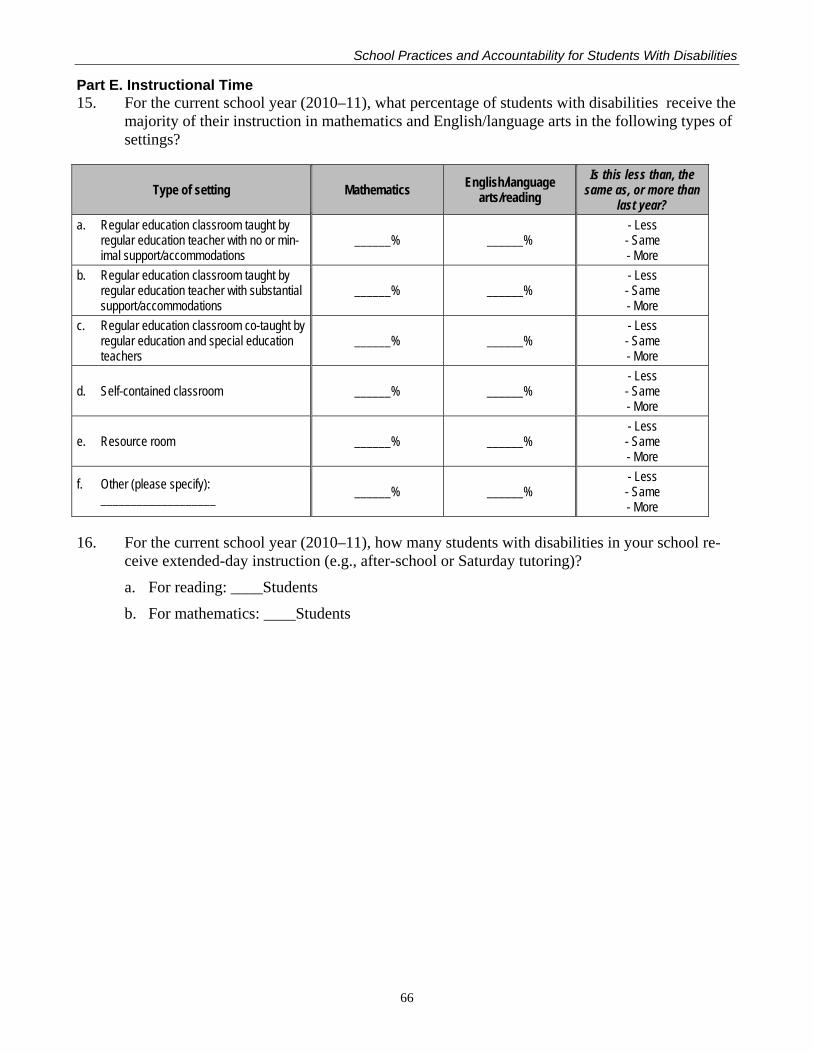
School Practices and Accountability for Students With Disabilities
Part E. Instructional Time 15. For the current school year (2010–11), what percentage of students with disabilities receive the
majority of their instruction in mathematics and English/language arts in the following types of settings?
Type of setting Mathematics English/language arts/reading
Is this less than, the same as, or more than
last year? a. Regular education classroom taught by
regular education teacher with no or min-imal support/accommodations
______% ______% - Less - Same - More
b. Regular education classroom taught by regular education teacher with substantial support/accommodations
______% ______% - Less - Same - More
c. Regular education classroom co-taught by regular education and special education teachers
______% ______% - Less - Same - More
d. Self-contained classroom ______% ______% - Less - Same - More
e. Resource room ______% ______% - Less - Same - More
f. Other (please specify): ___________________ ______% ______%
- Less - Same - More
16. For the current school year (2010–11), how many students with disabilities in your school re-ceive extended-day instruction (e.g., after-school or Saturday tutoring)? a. For reading: ____Students b. For mathematics: ____Students
66
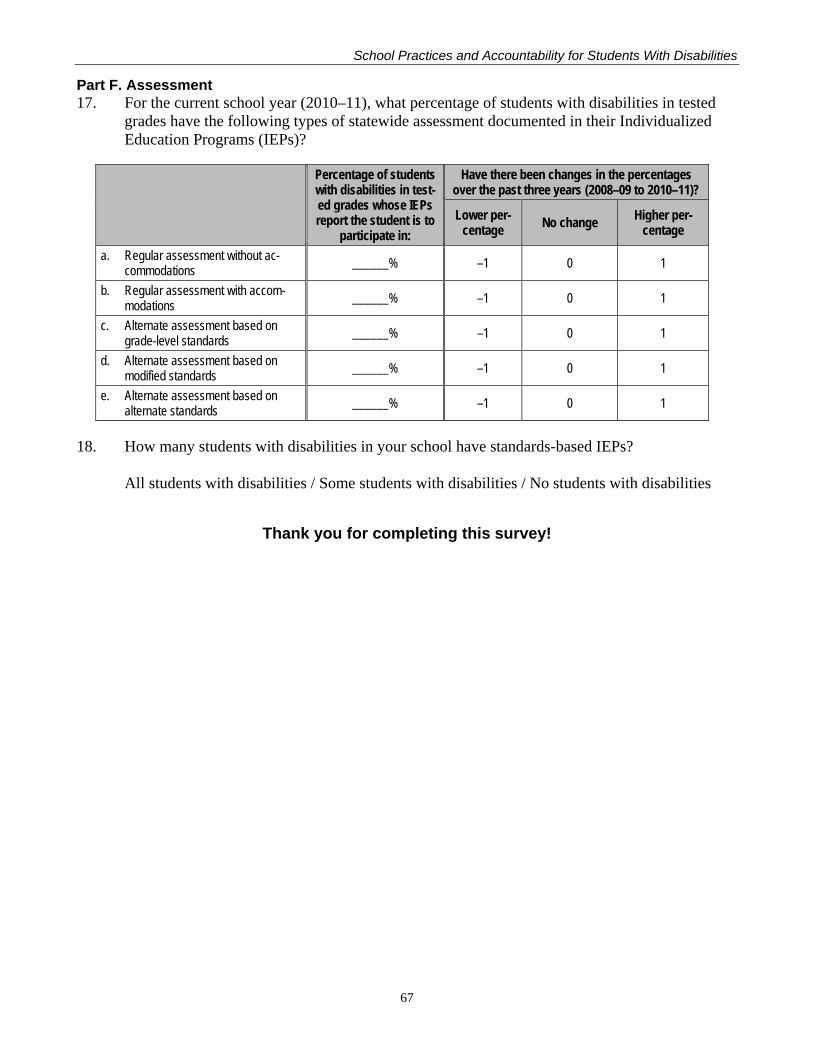
School Practices and Accountability for Students With Disabilities
Part F. Assessment 17. For the current school year (2010–11), what percentage of students with disabilities in tested
grades have the following types of statewide assessment documented in their Individualized Education Programs (IEPs)?
Percentage of students with disabilities in test-ed grades whose IEPs report the student is to
participate in:
Have there been changes in the percentages over the past three years (2008–09 to 2010–11)?
Lower per-centage No change Higher per-
centage
a. Regular assessment without ac-commodations ______% –1 0 1
b. Regular assessment with accom-modations ______% –1 0 1
c. Alternate assessment based on grade-level standards ______% –1 0 1
d. Alternate assessment based on modified standards ______% –1 0 1
e. Alternate assessment based on alternate standards ______% –1 0 1
18. How many students with disabilities in your school have standards-based IEPs? All students with disabilities / Some students with disabilities / No students with disabilities
Thank you for completing this survey!
67
School Practices and Accountability for Students With Disabilities
Appendix B: Chapter 2, Study Design Tables
68
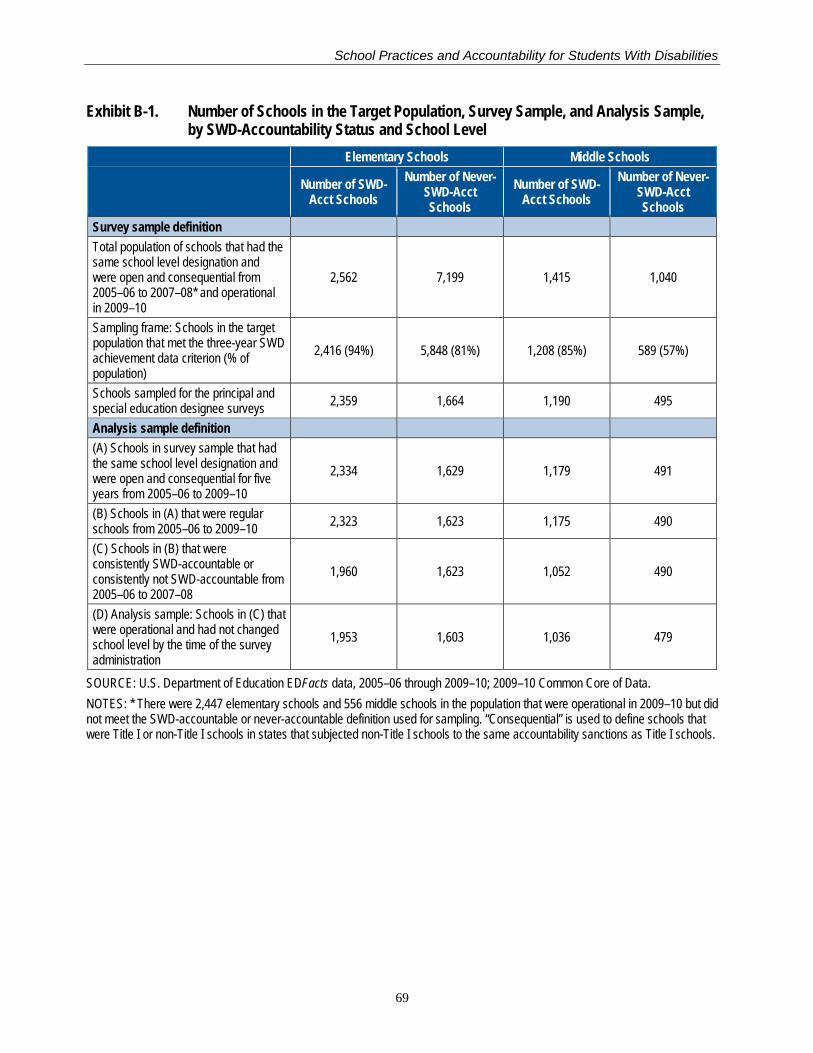
School Practices and Accountability for Students With Disabilities
Exhibit B-1. Number of Schools in the Target Population, Survey Sample, and Analysis Sample, by SWD-Accountability Status and School Level Elementary Schools Middle Schools
Number of SWD-Acct Schools
Number of Never-SWD-Acct Schools
Number of SWD-Acct Schools
Number of Never-SWD-Acct Schools
Survey sample definition Total population of schools that had the same school level designation and were open and consequential from 2005–06 to 2007–08* and operational in 2009–10
2,562 7,199 1,415 1,040
Sampling frame: Schools in the target population that met the three-year SWD achievement data criterion (% of population)
2,416 (94%) 5,848 (81%) 1,208 (85%) 589 (57%)
Schools sampled for the principal and special education designee surveys 2,359 1,664 1,190 495
Analysis sample definition (A) Schools in survey sample that had the same school level designation and were open and consequential for five years from 2005–06 to 2009–10
2,334 1,629 1,179 491
(B) Schools in (A) that were regular schools from 2005–06 to 2009–10 2,323 1,623 1,175 490
(C) Schools in (B) that were consistently SWD-accountable or consistently not SWD-accountable from 2005–06 to 2007–08
1,960 1,623 1,052 490
(D) Analysis sample: Schools in (C) that were operational and had not changed school level by the time of the survey administration
1,953 1,603 1,036 479
SOURCE: U.S. Department of Education EDFacts data, 2005–06 through 2009–10; 2009–10 Common Core of Data. NOTES: * There were 2,447 elementary schools and 556 middle schools in the population that were operational in 2009–10 but did not meet the SWD-accountable or never-accountable definition used for sampling. “Consequential” is used to define schools that were Title I or non-Title I schools in states that subjected non-Title I schools to the same accountability sanctions as Title I schools.
69
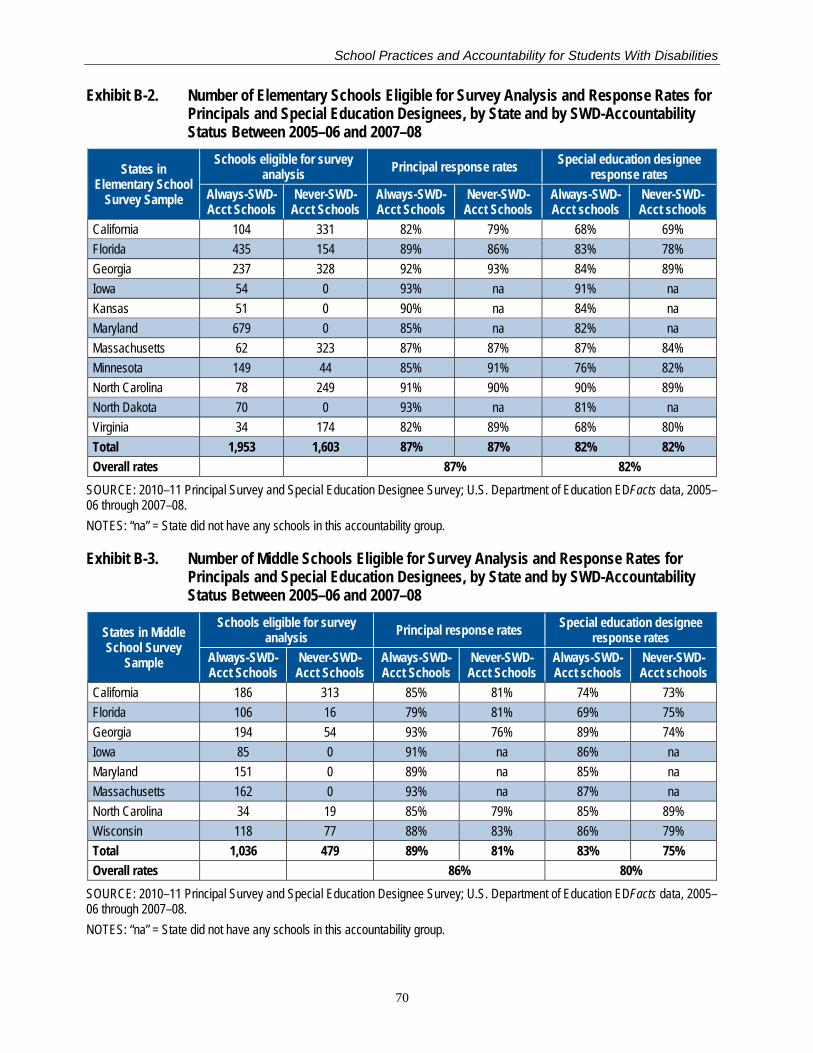
School Practices and Accountability for Students With Disabilities
Exhibit B-2. Number of Elementary Schools Eligible for Survey Analysis and Response Rates for Principals and Special Education Designees, by State and by SWD-Accountability Status Between 2005–06 and 2007–08
States in Elementary School
Survey Sample
Schools eligible for survey analysis Principal response rates Special education designee
response rates Always-SWD-Acct Schools
Never-SWD-Acct Schools
Always-SWD-Acct Schools
Never-SWD-Acct Schools
Always-SWD-Acct schools
Never-SWD-Acct schools
California 104 331 82% 79% 68% 69% Florida 435 154 89% 86% 83% 78% Georgia 237 328 92% 93% 84% 89% Iowa 54 0 93% na 91% na Kansas 51 0 90% na 84% na Maryland 679 0 85% na 82% na Massachusetts 62 323 87% 87% 87% 84% Minnesota 149 44 85% 91% 76% 82% North Carolina 78 249 91% 90% 90% 89% North Dakota 70 0 93% na 81% na Virginia 34 174 82% 89% 68% 80% Total 1,953 1,603 87% 87% 82% 82% Overall rates 87% 82%
SOURCE: 2010–11 Principal Survey and Special Education Designee Survey; U.S. Department of Education EDFacts data, 2005–06 through 2007–08. NOTES: “na” = State did not have any schools in this accountability group.
Exhibit B-3. Number of Middle Schools Eligible for Survey Analysis and Response Rates for Principals and Special Education Designees, by State and by SWD-Accountability Status Between 2005–06 and 2007–08
States in Middle School Survey
Sample
Schools eligible for survey analysis Principal response rates Special education designee
response rates Always-SWD-Acct Schools
Never-SWD-Acct Schools
Always-SWD-Acct Schools
Never-SWD-Acct Schools
Always-SWD-Acct schools
Never-SWD-Acct schools
California 186 313 85% 81% 74% 73% Florida 106 16 79% 81% 69% 75% Georgia 194 54 93% 76% 89% 74% Iowa 85 0 91% na 86% na Maryland 151 0 89% na 85% na Massachusetts 162 0 93% na 87% na North Carolina 34 19 85% 79% 85% 89% Wisconsin 118 77 88% 83% 86% 79% Total 1,036 479 89% 81% 83% 75% Overall rates 86% 80%
SOURCE: 2010–11 Principal Survey and Special Education Designee Survey; U.S. Department of Education EDFacts data, 2005–06 through 2007–08. NOTES: “na” = State did not have any schools in this accountability group.
70
School Practices and Accountability for Students With Disabilities
Appendix C: Chapter 3, Accountability Context for School Practices—State-Level Tables
71
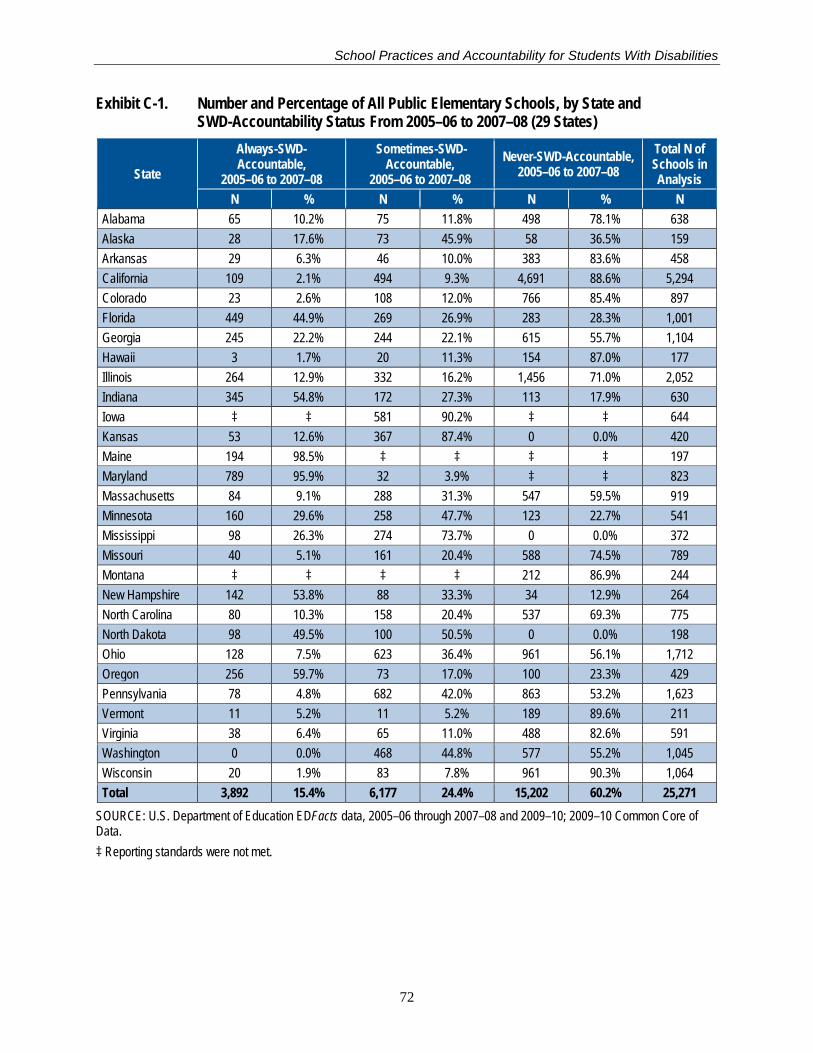
School Practices and Accountability for Students With Disabilities
Exhibit C-1. Number and Percentage of All Public Elementary Schools, by State and SWD-Accountability Status From 2005–06 to 2007–08 (29 States)
State
Always-SWD-Accountable,
2005–06 to 2007–08
Sometimes-SWD-Accountable,
2005–06 to 2007–08 Never-SWD-Accountable,
2005–06 to 2007–08 Total N of Schools in Analysis
N % N % N % N Alabama 65 10.2% 75 11.8% 498 78.1% 638 Alaska 28 17.6% 73 45.9% 58 36.5% 159 Arkansas 29 6.3% 46 10.0% 383 83.6% 458 California 109 2.1% 494 9.3% 4,691 88.6% 5,294 Colorado 23 2.6% 108 12.0% 766 85.4% 897 Florida 449 44.9% 269 26.9% 283 28.3% 1,001 Georgia 245 22.2% 244 22.1% 615 55.7% 1,104 Hawaii 3 1.7% 20 11.3% 154 87.0% 177 Illinois 264 12.9% 332 16.2% 1,456 71.0% 2,052 Indiana 345 54.8% 172 27.3% 113 17.9% 630 Iowa ‡ ‡ 581 90.2% ‡ ‡ 644 Kansas 53 12.6% 367 87.4% 0 0.0% 420 Maine 194 98.5% ‡ ‡ ‡ ‡ 197 Maryland 789 95.9% 32 3.9% ‡ ‡ 823 Massachusetts 84 9.1% 288 31.3% 547 59.5% 919 Minnesota 160 29.6% 258 47.7% 123 22.7% 541 Mississippi 98 26.3% 274 73.7% 0 0.0% 372 Missouri 40 5.1% 161 20.4% 588 74.5% 789 Montana ‡ ‡ ‡ ‡ 212 86.9% 244 New Hampshire 142 53.8% 88 33.3% 34 12.9% 264 North Carolina 80 10.3% 158 20.4% 537 69.3% 775 North Dakota 98 49.5% 100 50.5% 0 0.0% 198 Ohio 128 7.5% 623 36.4% 961 56.1% 1,712 Oregon 256 59.7% 73 17.0% 100 23.3% 429 Pennsylvania 78 4.8% 682 42.0% 863 53.2% 1,623 Vermont 11 5.2% 11 5.2% 189 89.6% 211 Virginia 38 6.4% 65 11.0% 488 82.6% 591 Washington 0 0.0% 468 44.8% 577 55.2% 1,045 Wisconsin 20 1.9% 83 7.8% 961 90.3% 1,064 Total 3,892 15.4% 6,177 24.4% 15,202 60.2% 25,271
SOURCE: U.S. Department of Education EDFacts data, 2005–06 through 2007–08 and 2009–10; 2009–10 Common Core of Data. ‡ Reporting standards were not met.
72
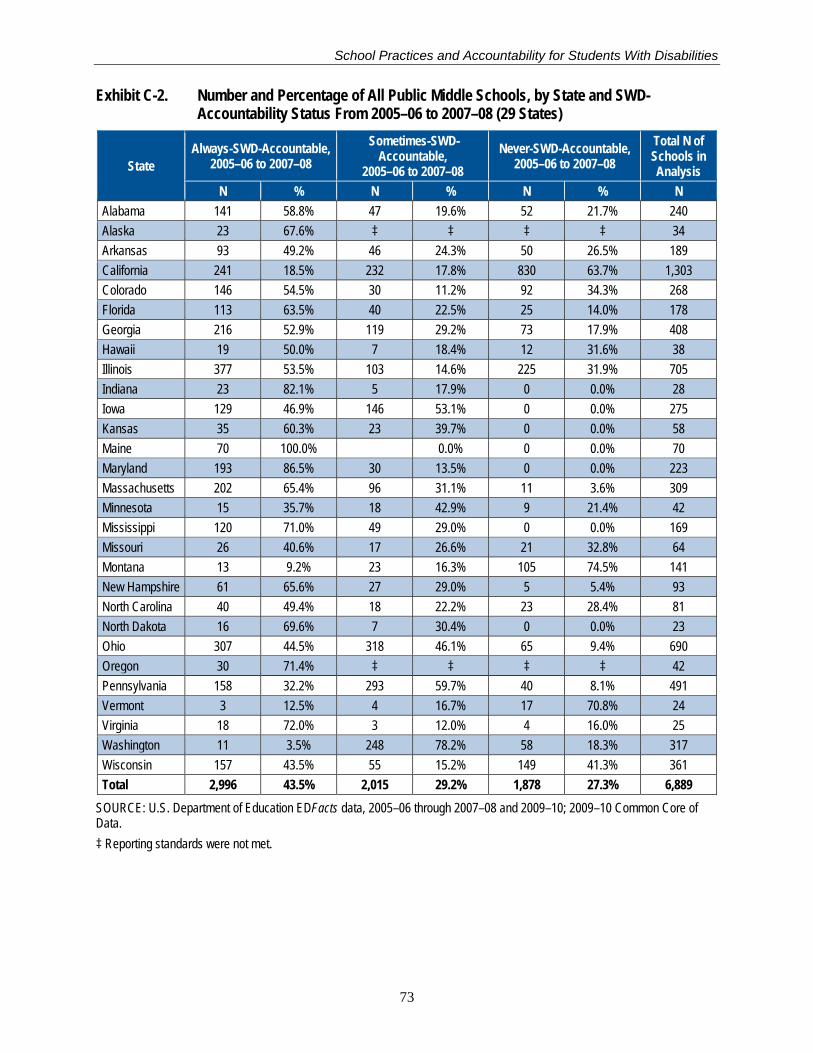
School Practices and Accountability for Students With Disabilities
Exhibit C-2. Number and Percentage of All Public Middle Schools, by State and SWD-Accountability Status From 2005–06 to 2007–08 (29 States)
State Always-SWD-Accountable,
2005–06 to 2007–08 Sometimes-SWD-
Accountable, 2005–06 to 2007–08
Never-SWD-Accountable, 2005–06 to 2007–08
Total N of Schools in Analysis
N % N % N % N Alabama 141 58.8% 47 19.6% 52 21.7% 240 Alaska 23 67.6% ‡ ‡ ‡ ‡ 34 Arkansas 93 49.2% 46 24.3% 50 26.5% 189 California 241 18.5% 232 17.8% 830 63.7% 1,303 Colorado 146 54.5% 30 11.2% 92 34.3% 268 Florida 113 63.5% 40 22.5% 25 14.0% 178 Georgia 216 52.9% 119 29.2% 73 17.9% 408 Hawaii 19 50.0% 7 18.4% 12 31.6% 38 Illinois 377 53.5% 103 14.6% 225 31.9% 705 Indiana 23 82.1% 5 17.9% 0 0.0% 28 Iowa 129 46.9% 146 53.1% 0 0.0% 275 Kansas 35 60.3% 23 39.7% 0 0.0% 58 Maine 70 100.0% 0.0% 0 0.0% 70 Maryland 193 86.5% 30 13.5% 0 0.0% 223 Massachusetts 202 65.4% 96 31.1% 11 3.6% 309 Minnesota 15 35.7% 18 42.9% 9 21.4% 42 Mississippi 120 71.0% 49 29.0% 0 0.0% 169 Missouri 26 40.6% 17 26.6% 21 32.8% 64 Montana 13 9.2% 23 16.3% 105 74.5% 141 New Hampshire 61 65.6% 27 29.0% 5 5.4% 93 North Carolina 40 49.4% 18 22.2% 23 28.4% 81 North Dakota 16 69.6% 7 30.4% 0 0.0% 23 Ohio 307 44.5% 318 46.1% 65 9.4% 690 Oregon 30 71.4% ‡ ‡ ‡ ‡ 42 Pennsylvania 158 32.2% 293 59.7% 40 8.1% 491 Vermont 3 12.5% 4 16.7% 17 70.8% 24 Virginia 18 72.0% 3 12.0% 4 16.0% 25 Washington 11 3.5% 248 78.2% 58 18.3% 317 Wisconsin 157 43.5% 55 15.2% 149 41.3% 361 Total 2,996 43.5% 2,015 29.2% 1,878 27.3% 6,889
SOURCE: U.S. Department of Education EDFacts data, 2005–06 through 2007–08 and 2009–10; 2009–10 Common Core of Data. ‡ Reporting standards were not met.
73
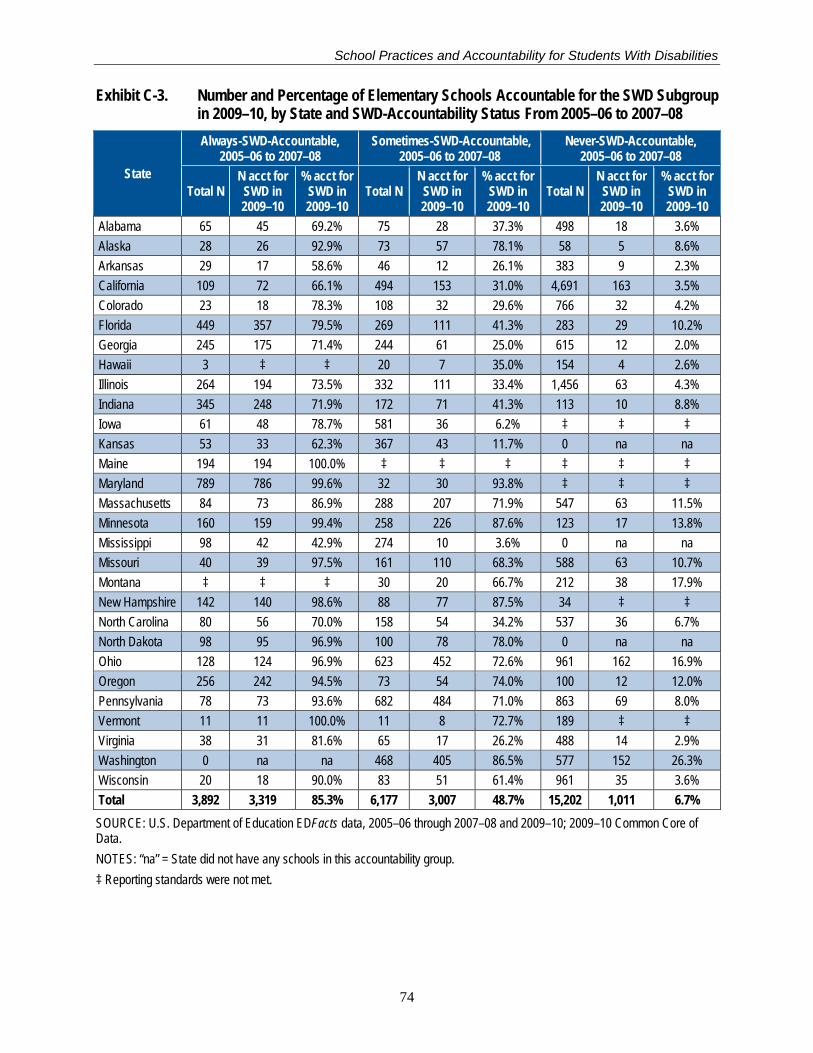
School Practices and Accountability for Students With Disabilities
Exhibit C-3. Number and Percentage of Elementary Schools Accountable for the SWD Subgroup in 2009–10, by State and SWD-Accountability Status From 2005–06 to 2007–08
State
Always-SWD-Accountable, 2005–06 to 2007–08
Sometimes-SWD-Accountable, 2005–06 to 2007–08
Never-SWD-Accountable, 2005–06 to 2007–08
Total N N acct for SWD in 2009–10
% acct for SWD in 2009–10
Total N N acct for SWD in 2009–10
% acct for SWD in 2009–10
Total N N acct for SWD in 2009–10
% acct for SWD in 2009–10
Alabama 65 45 69.2% 75 28 37.3% 498 18 3.6% Alaska 28 26 92.9% 73 57 78.1% 58 5 8.6% Arkansas 29 17 58.6% 46 12 26.1% 383 9 2.3% California 109 72 66.1% 494 153 31.0% 4,691 163 3.5% Colorado 23 18 78.3% 108 32 29.6% 766 32 4.2% Florida 449 357 79.5% 269 111 41.3% 283 29 10.2% Georgia 245 175 71.4% 244 61 25.0% 615 12 2.0% Hawaii 3 ‡ ‡ 20 7 35.0% 154 4 2.6% Illinois 264 194 73.5% 332 111 33.4% 1,456 63 4.3% Indiana 345 248 71.9% 172 71 41.3% 113 10 8.8% Iowa 61 48 78.7% 581 36 6.2% ‡ ‡ ‡ Kansas 53 33 62.3% 367 43 11.7% 0 na na Maine 194 194 100.0% ‡ ‡ ‡ ‡ ‡ ‡ Maryland 789 786 99.6% 32 30 93.8% ‡ ‡ ‡ Massachusetts 84 73 86.9% 288 207 71.9% 547 63 11.5% Minnesota 160 159 99.4% 258 226 87.6% 123 17 13.8% Mississippi 98 42 42.9% 274 10 3.6% 0 na na Missouri 40 39 97.5% 161 110 68.3% 588 63 10.7% Montana ‡ ‡ ‡ 30 20 66.7% 212 38 17.9% New Hampshire 142 140 98.6% 88 77 87.5% 34 ‡ ‡ North Carolina 80 56 70.0% 158 54 34.2% 537 36 6.7% North Dakota 98 95 96.9% 100 78 78.0% 0 na na Ohio 128 124 96.9% 623 452 72.6% 961 162 16.9% Oregon 256 242 94.5% 73 54 74.0% 100 12 12.0% Pennsylvania 78 73 93.6% 682 484 71.0% 863 69 8.0% Vermont 11 11 100.0% 11 8 72.7% 189 ‡ ‡ Virginia 38 31 81.6% 65 17 26.2% 488 14 2.9% Washington 0 na na 468 405 86.5% 577 152 26.3% Wisconsin 20 18 90.0% 83 51 61.4% 961 35 3.6% Total 3,892 3,319 85.3% 6,177 3,007 48.7% 15,202 1,011 6.7% SOURCE: U.S. Department of Education EDFacts data, 2005–06 through 2007–08 and 2009–10; 2009–10 Common Core of Data. NOTES: “na” = State did not have any schools in this accountability group. ‡ Reporting standards were not met.
74
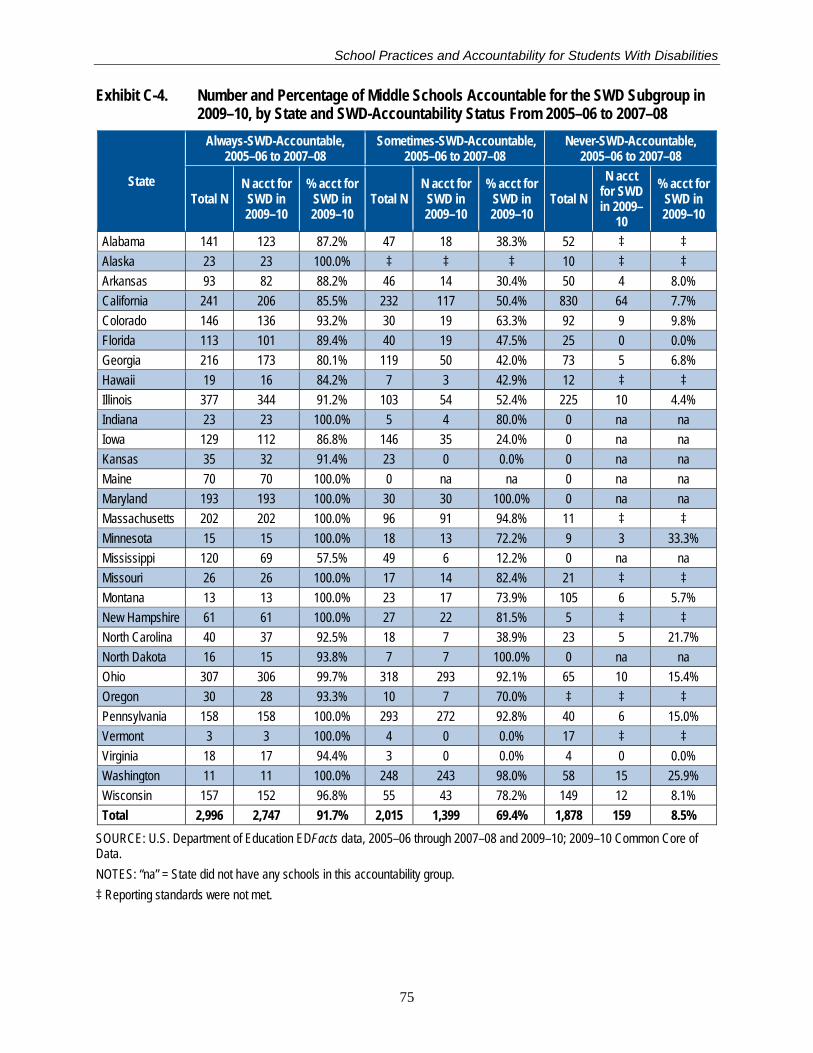
School Practices and Accountability for Students With Disabilities
Exhibit C-4. Number and Percentage of Middle Schools Accountable for the SWD Subgroup in 2009–10, by State and SWD-Accountability Status From 2005–06 to 2007–08
State
Always-SWD-Accountable, 2005–06 to 2007–08
Sometimes-SWD-Accountable, 2005–06 to 2007–08
Never-SWD-Accountable, 2005–06 to 2007–08
Total N N acct for SWD in 2009–10
% acct for SWD in 2009–10
Total N N acct for SWD in 2009–10
% acct for SWD in 2009–10
Total N N acct
for SWD in 2009–
10
% acct for SWD in 2009–10
Alabama 141 123 87.2% 47 18 38.3% 52 ‡ ‡ Alaska 23 23 100.0% ‡ ‡ ‡ 10 ‡ ‡ Arkansas 93 82 88.2% 46 14 30.4% 50 4 8.0% California 241 206 85.5% 232 117 50.4% 830 64 7.7% Colorado 146 136 93.2% 30 19 63.3% 92 9 9.8% Florida 113 101 89.4% 40 19 47.5% 25 0 0.0% Georgia 216 173 80.1% 119 50 42.0% 73 5 6.8% Hawaii 19 16 84.2% 7 3 42.9% 12 ‡ ‡ Illinois 377 344 91.2% 103 54 52.4% 225 10 4.4% Indiana 23 23 100.0% 5 4 80.0% 0 na na Iowa 129 112 86.8% 146 35 24.0% 0 na na Kansas 35 32 91.4% 23 0 0.0% 0 na na Maine 70 70 100.0% 0 na na 0 na na Maryland 193 193 100.0% 30 30 100.0% 0 na na Massachusetts 202 202 100.0% 96 91 94.8% 11 ‡ ‡ Minnesota 15 15 100.0% 18 13 72.2% 9 3 33.3% Mississippi 120 69 57.5% 49 6 12.2% 0 na na Missouri 26 26 100.0% 17 14 82.4% 21 ‡ ‡ Montana 13 13 100.0% 23 17 73.9% 105 6 5.7% New Hampshire 61 61 100.0% 27 22 81.5% 5 ‡ ‡ North Carolina 40 37 92.5% 18 7 38.9% 23 5 21.7% North Dakota 16 15 93.8% 7 7 100.0% 0 na na Ohio 307 306 99.7% 318 293 92.1% 65 10 15.4% Oregon 30 28 93.3% 10 7 70.0% ‡ ‡ ‡ Pennsylvania 158 158 100.0% 293 272 92.8% 40 6 15.0% Vermont 3 3 100.0% 4 0 0.0% 17 ‡ ‡ Virginia 18 17 94.4% 3 0 0.0% 4 0 0.0% Washington 11 11 100.0% 248 243 98.0% 58 15 25.9% Wisconsin 157 152 96.8% 55 43 78.2% 149 12 8.1% Total 2,996 2,747 91.7% 2,015 1,399 69.4% 1,878 159 8.5%
SOURCE: U.S. Department of Education EDFacts data, 2005–06 through 2007–08 and 2009–10; 2009–10 Common Core of Data. NOTES: “na” = State did not have any schools in this accountability group. ‡ Reporting standards were not met.
75
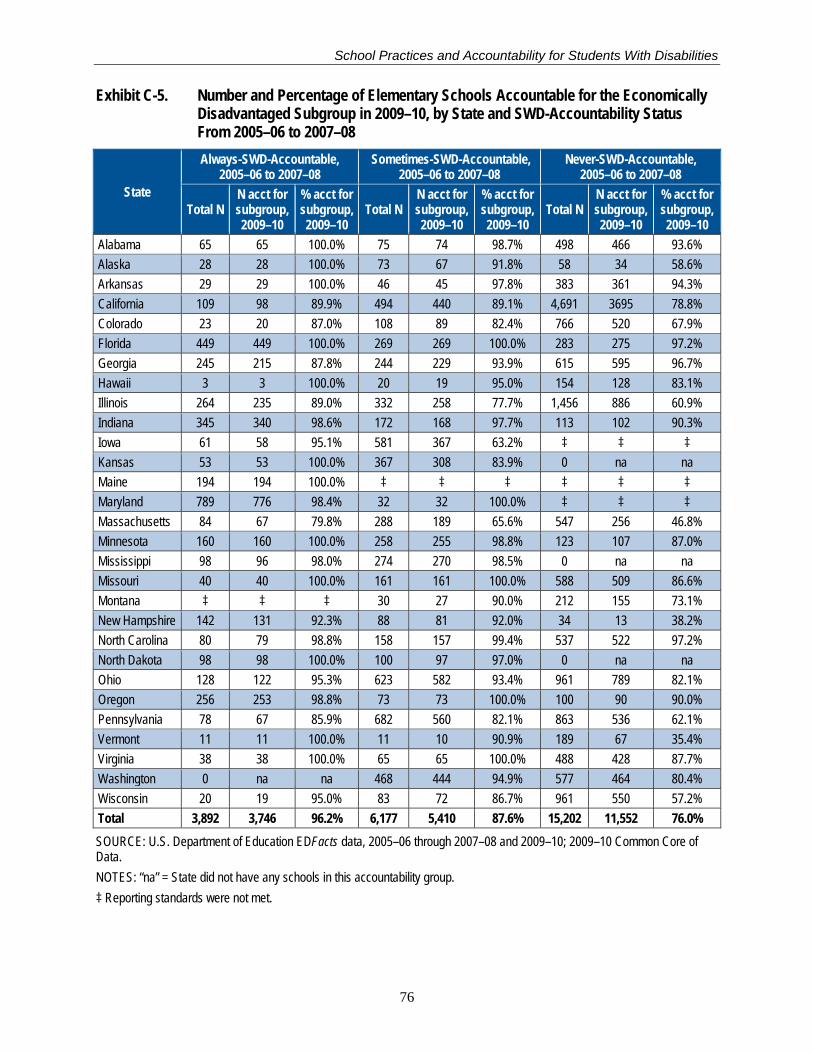
School Practices and Accountability for Students With Disabilities
Exhibit C-5. Number and Percentage of Elementary Schools Accountable for the Economically Disadvantaged Subgroup in 2009–10, by State and SWD-Accountability Status From 2005–06 to 2007–08
State
Always-SWD-Accountable, 2005–06 to 2007–08
Sometimes-SWD-Accountable, 2005–06 to 2007–08
Never-SWD-Accountable, 2005–06 to 2007–08
Total N N acct for subgroup, 2009–10
% acct for subgroup, 2009–10
Total N N acct for subgroup, 2009–10
% acct for subgroup, 2009–10
Total N N acct for subgroup, 2009–10
% acct for subgroup, 2009–10
Alabama 65 65 100.0% 75 74 98.7% 498 466 93.6% Alaska 28 28 100.0% 73 67 91.8% 58 34 58.6% Arkansas 29 29 100.0% 46 45 97.8% 383 361 94.3% California 109 98 89.9% 494 440 89.1% 4,691 3695 78.8% Colorado 23 20 87.0% 108 89 82.4% 766 520 67.9% Florida 449 449 100.0% 269 269 100.0% 283 275 97.2% Georgia 245 215 87.8% 244 229 93.9% 615 595 96.7% Hawaii 3 3 100.0% 20 19 95.0% 154 128 83.1% Illinois 264 235 89.0% 332 258 77.7% 1,456 886 60.9% Indiana 345 340 98.6% 172 168 97.7% 113 102 90.3% Iowa 61 58 95.1% 581 367 63.2% ‡ ‡ ‡ Kansas 53 53 100.0% 367 308 83.9% 0 na na Maine 194 194 100.0% ‡ ‡ ‡ ‡ ‡ ‡ Maryland 789 776 98.4% 32 32 100.0% ‡ ‡ ‡ Massachusetts 84 67 79.8% 288 189 65.6% 547 256 46.8% Minnesota 160 160 100.0% 258 255 98.8% 123 107 87.0% Mississippi 98 96 98.0% 274 270 98.5% 0 na na Missouri 40 40 100.0% 161 161 100.0% 588 509 86.6% Montana ‡ ‡ ‡ 30 27 90.0% 212 155 73.1% New Hampshire 142 131 92.3% 88 81 92.0% 34 13 38.2% North Carolina 80 79 98.8% 158 157 99.4% 537 522 97.2% North Dakota 98 98 100.0% 100 97 97.0% 0 na na Ohio 128 122 95.3% 623 582 93.4% 961 789 82.1% Oregon 256 253 98.8% 73 73 100.0% 100 90 90.0% Pennsylvania 78 67 85.9% 682 560 82.1% 863 536 62.1% Vermont 11 11 100.0% 11 10 90.9% 189 67 35.4% Virginia 38 38 100.0% 65 65 100.0% 488 428 87.7% Washington 0 na na 468 444 94.9% 577 464 80.4% Wisconsin 20 19 95.0% 83 72 86.7% 961 550 57.2% Total 3,892 3,746 96.2% 6,177 5,410 87.6% 15,202 11,552 76.0% SOURCE: U.S. Department of Education EDFacts data, 2005–06 through 2007–08 and 2009–10; 2009–10 Common Core of Data. NOTES: “na” = State did not have any schools in this accountability group. ‡ Reporting standards were not met.
76
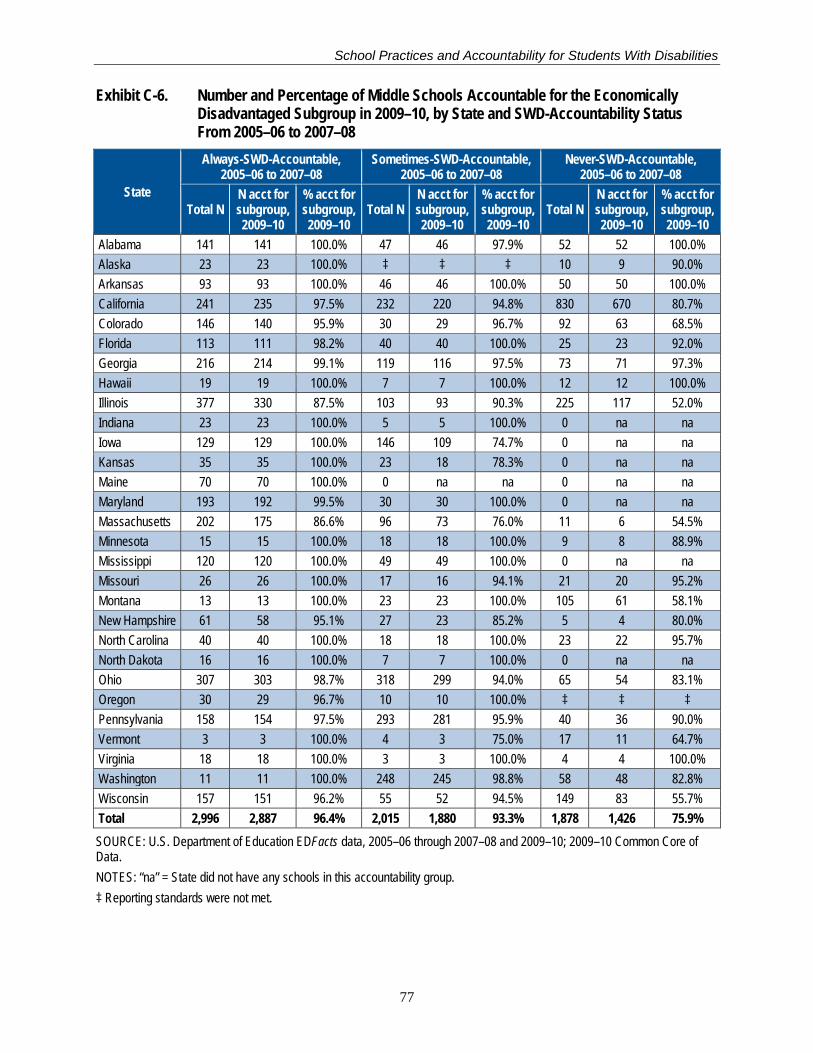
School Practices and Accountability for Students With Disabilities
Exhibit C-6. Number and Percentage of Middle Schools Accountable for the Economically Disadvantaged Subgroup in 2009–10, by State and SWD-Accountability Status From 2005–06 to 2007–08
State
Always-SWD-Accountable, 2005–06 to 2007–08
Sometimes-SWD-Accountable, 2005–06 to 2007–08
Never-SWD-Accountable, 2005–06 to 2007–08
Total N N acct for subgroup, 2009–10
% acct for subgroup, 2009–10
Total N N acct for subgroup, 2009–10
% acct for subgroup, 2009–10
Total N N acct for subgroup, 2009–10
% acct for subgroup, 2009–10
Alabama 141 141 100.0% 47 46 97.9% 52 52 100.0% Alaska 23 23 100.0% ‡ ‡ ‡ 10 9 90.0% Arkansas 93 93 100.0% 46 46 100.0% 50 50 100.0% California 241 235 97.5% 232 220 94.8% 830 670 80.7% Colorado 146 140 95.9% 30 29 96.7% 92 63 68.5% Florida 113 111 98.2% 40 40 100.0% 25 23 92.0% Georgia 216 214 99.1% 119 116 97.5% 73 71 97.3% Hawaii 19 19 100.0% 7 7 100.0% 12 12 100.0% Illinois 377 330 87.5% 103 93 90.3% 225 117 52.0% Indiana 23 23 100.0% 5 5 100.0% 0 na na Iowa 129 129 100.0% 146 109 74.7% 0 na na Kansas 35 35 100.0% 23 18 78.3% 0 na na Maine 70 70 100.0% 0 na na 0 na na Maryland 193 192 99.5% 30 30 100.0% 0 na na Massachusetts 202 175 86.6% 96 73 76.0% 11 6 54.5% Minnesota 15 15 100.0% 18 18 100.0% 9 8 88.9% Mississippi 120 120 100.0% 49 49 100.0% 0 na na Missouri 26 26 100.0% 17 16 94.1% 21 20 95.2% Montana 13 13 100.0% 23 23 100.0% 105 61 58.1% New Hampshire 61 58 95.1% 27 23 85.2% 5 4 80.0% North Carolina 40 40 100.0% 18 18 100.0% 23 22 95.7% North Dakota 16 16 100.0% 7 7 100.0% 0 na na Ohio 307 303 98.7% 318 299 94.0% 65 54 83.1% Oregon 30 29 96.7% 10 10 100.0% ‡ ‡ ‡ Pennsylvania 158 154 97.5% 293 281 95.9% 40 36 90.0% Vermont 3 3 100.0% 4 3 75.0% 17 11 64.7% Virginia 18 18 100.0% 3 3 100.0% 4 4 100.0% Washington 11 11 100.0% 248 245 98.8% 58 48 82.8% Wisconsin 157 151 96.2% 55 52 94.5% 149 83 55.7% Total 2,996 2,887 96.4% 2,015 1,880 93.3% 1,878 1,426 75.9% SOURCE: U.S. Department of Education EDFacts data, 2005–06 through 2007–08 and 2009–10; 2009–10 Common Core of Data. NOTES: “na” = State did not have any schools in this accountability group. ‡ Reporting standards were not met.
77
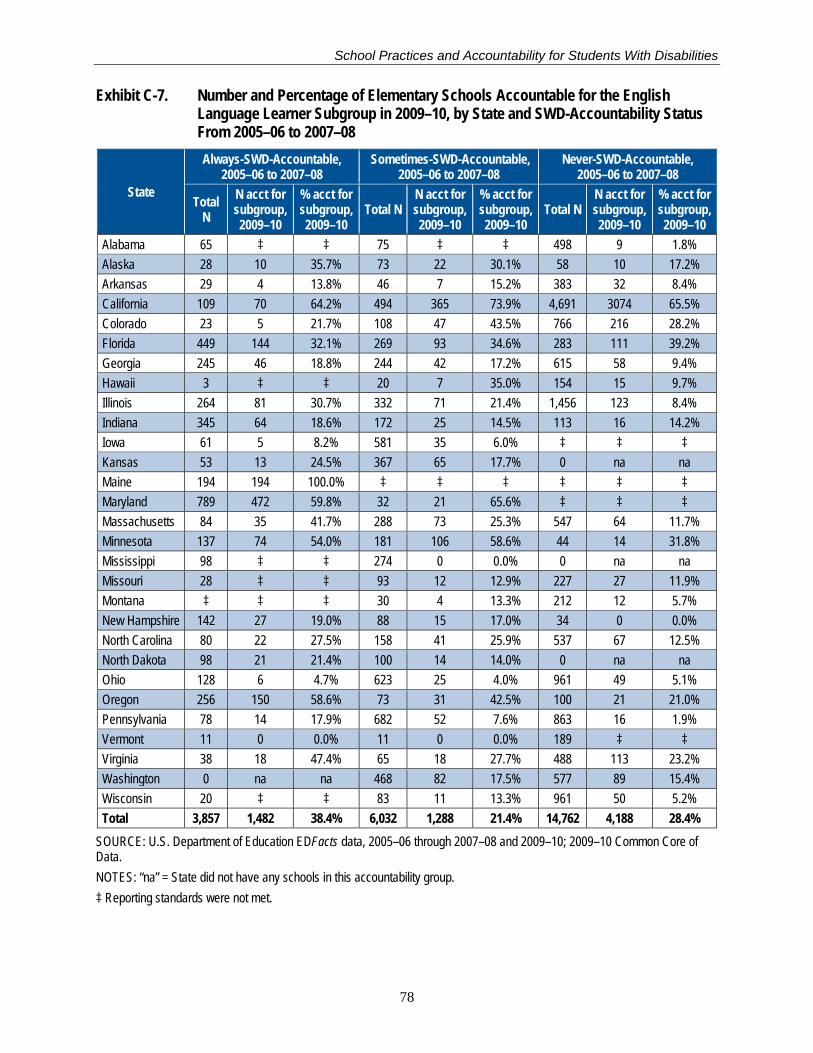
School Practices and Accountability for Students With Disabilities
Exhibit C-7. Number and Percentage of Elementary Schools Accountable for the English Language Learner Subgroup in 2009–10, by State and SWD-Accountability Status From 2005–06 to 2007–08
State
Always-SWD-Accountable, 2005–06 to 2007–08
Sometimes-SWD-Accountable, 2005–06 to 2007–08
Never-SWD-Accountable, 2005–06 to 2007–08
Total N
N acct for subgroup, 2009–10
% acct for subgroup, 2009–10
Total N N acct for subgroup, 2009–10
% acct for subgroup, 2009–10
Total N N acct for subgroup, 2009–10
% acct for subgroup, 2009–10
Alabama 65 ‡ ‡ 75 ‡ ‡ 498 9 1.8% Alaska 28 10 35.7% 73 22 30.1% 58 10 17.2% Arkansas 29 4 13.8% 46 7 15.2% 383 32 8.4% California 109 70 64.2% 494 365 73.9% 4,691 3074 65.5% Colorado 23 5 21.7% 108 47 43.5% 766 216 28.2% Florida 449 144 32.1% 269 93 34.6% 283 111 39.2% Georgia 245 46 18.8% 244 42 17.2% 615 58 9.4% Hawaii 3 ‡ ‡ 20 7 35.0% 154 15 9.7% Illinois 264 81 30.7% 332 71 21.4% 1,456 123 8.4% Indiana 345 64 18.6% 172 25 14.5% 113 16 14.2% Iowa 61 5 8.2% 581 35 6.0% ‡ ‡ ‡ Kansas 53 13 24.5% 367 65 17.7% 0 na na Maine 194 194 100.0% ‡ ‡ ‡ ‡ ‡ ‡ Maryland 789 472 59.8% 32 21 65.6% ‡ ‡ ‡ Massachusetts 84 35 41.7% 288 73 25.3% 547 64 11.7% Minnesota 137 74 54.0% 181 106 58.6% 44 14 31.8% Mississippi 98 ‡ ‡ 274 0 0.0% 0 na na Missouri 28 ‡ ‡ 93 12 12.9% 227 27 11.9% Montana ‡ ‡ ‡ 30 4 13.3% 212 12 5.7% New Hampshire 142 27 19.0% 88 15 17.0% 34 0 0.0% North Carolina 80 22 27.5% 158 41 25.9% 537 67 12.5% North Dakota 98 21 21.4% 100 14 14.0% 0 na na Ohio 128 6 4.7% 623 25 4.0% 961 49 5.1% Oregon 256 150 58.6% 73 31 42.5% 100 21 21.0% Pennsylvania 78 14 17.9% 682 52 7.6% 863 16 1.9% Vermont 11 0 0.0% 11 0 0.0% 189 ‡ ‡ Virginia 38 18 47.4% 65 18 27.7% 488 113 23.2% Washington 0 na na 468 82 17.5% 577 89 15.4% Wisconsin 20 ‡ ‡ 83 11 13.3% 961 50 5.2% Total 3,857 1,482 38.4% 6,032 1,288 21.4% 14,762 4,188 28.4%
SOURCE: U.S. Department of Education EDFacts data, 2005–06 through 2007–08 and 2009–10; 2009–10 Common Core of Data. NOTES: “na” = State did not have any schools in this accountability group. ‡ Reporting standards were not met.
78
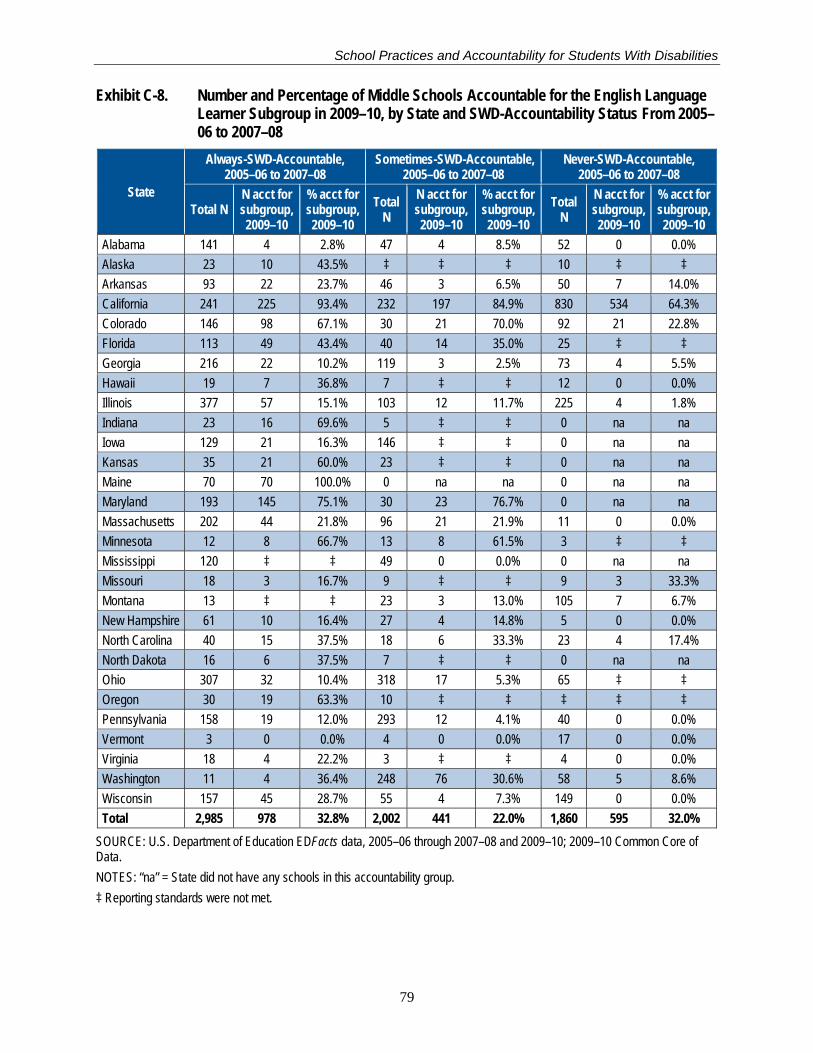
School Practices and Accountability for Students With Disabilities
Exhibit C-8. Number and Percentage of Middle Schools Accountable for the English Language Learner Subgroup in 2009–10, by State and SWD-Accountability Status From 2005–06 to 2007–08
State
Always-SWD-Accountable, 2005–06 to 2007–08
Sometimes-SWD-Accountable, 2005–06 to 2007–08
Never-SWD-Accountable, 2005–06 to 2007–08
Total N N acct for subgroup, 2009–10
% acct for subgroup, 2009–10
Total N
N acct for subgroup, 2009–10
% acct for subgroup, 2009–10
Total N
N acct for subgroup, 2009–10
% acct for subgroup, 2009–10
Alabama 141 4 2.8% 47 4 8.5% 52 0 0.0% Alaska 23 10 43.5% ‡ ‡ ‡ 10 ‡ ‡ Arkansas 93 22 23.7% 46 3 6.5% 50 7 14.0% California 241 225 93.4% 232 197 84.9% 830 534 64.3% Colorado 146 98 67.1% 30 21 70.0% 92 21 22.8% Florida 113 49 43.4% 40 14 35.0% 25 ‡ ‡ Georgia 216 22 10.2% 119 3 2.5% 73 4 5.5% Hawaii 19 7 36.8% 7 ‡ ‡ 12 0 0.0% Illinois 377 57 15.1% 103 12 11.7% 225 4 1.8% Indiana 23 16 69.6% 5 ‡ ‡ 0 na na Iowa 129 21 16.3% 146 ‡ ‡ 0 na na Kansas 35 21 60.0% 23 ‡ ‡ 0 na na Maine 70 70 100.0% 0 na na 0 na na Maryland 193 145 75.1% 30 23 76.7% 0 na na Massachusetts 202 44 21.8% 96 21 21.9% 11 0 0.0% Minnesota 12 8 66.7% 13 8 61.5% 3 ‡ ‡ Mississippi 120 ‡ ‡ 49 0 0.0% 0 na na Missouri 18 3 16.7% 9 ‡ ‡ 9 3 33.3% Montana 13 ‡ ‡ 23 3 13.0% 105 7 6.7% New Hampshire 61 10 16.4% 27 4 14.8% 5 0 0.0% North Carolina 40 15 37.5% 18 6 33.3% 23 4 17.4% North Dakota 16 6 37.5% 7 ‡ ‡ 0 na na Ohio 307 32 10.4% 318 17 5.3% 65 ‡ ‡ Oregon 30 19 63.3% 10 ‡ ‡ ‡ ‡ ‡ Pennsylvania 158 19 12.0% 293 12 4.1% 40 0 0.0% Vermont 3 0 0.0% 4 0 0.0% 17 0 0.0% Virginia 18 4 22.2% 3 ‡ ‡ 4 0 0.0% Washington 11 4 36.4% 248 76 30.6% 58 5 8.6% Wisconsin 157 45 28.7% 55 4 7.3% 149 0 0.0% Total 2,985 978 32.8% 2,002 441 22.0% 1,860 595 32.0%
SOURCE: U.S. Department of Education EDFacts data, 2005–06 through 2007–08 and 2009–10; 2009–10 Common Core of Data. NOTES: “na” = State did not have any schools in this accountability group. ‡ Reporting standards were not met.
79
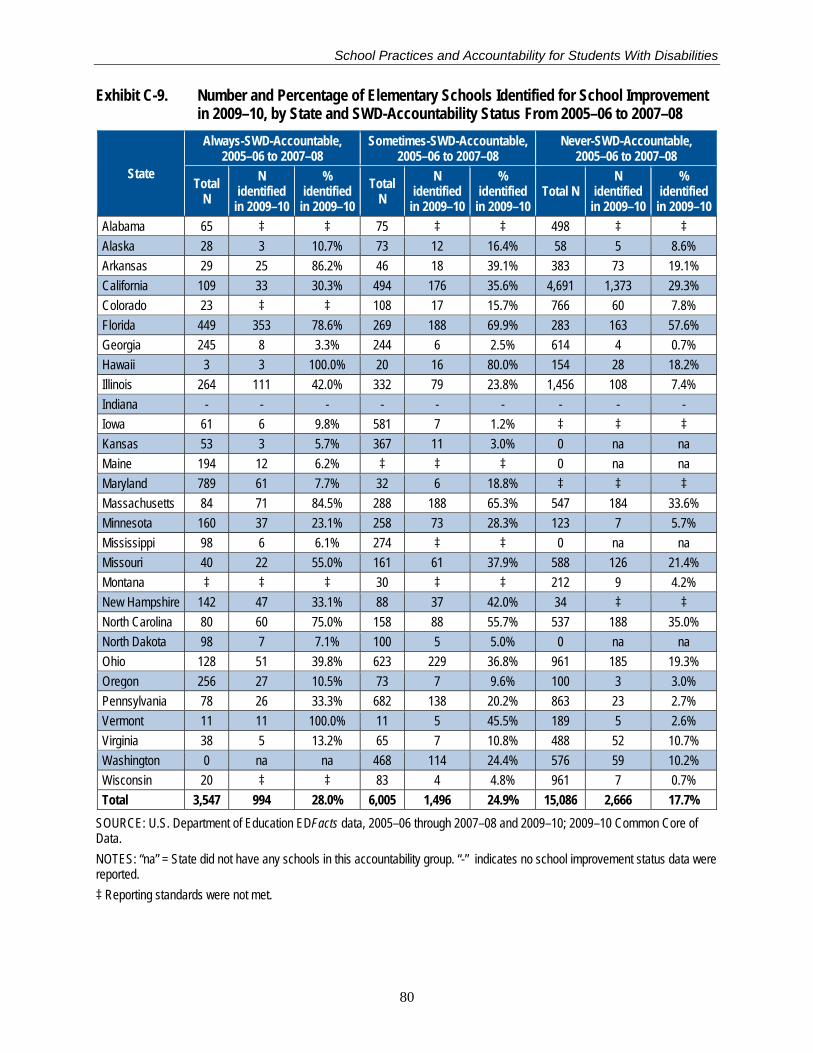
School Practices and Accountability for Students With Disabilities
Exhibit C-9. Number and Percentage of Elementary Schools Identified for School Improvement in 2009–10, by State and SWD-Accountability Status From 2005–06 to 2007–08
State
Always-SWD-Accountable, 2005–06 to 2007–08
Sometimes-SWD-Accountable, 2005–06 to 2007–08
Never-SWD-Accountable, 2005–06 to 2007–08
Total N
N identified
in 2009–10
% identified
in 2009–10 Total
N N
identified in 2009–10
% identified
in 2009–10 Total N
N identified
in 2009–10
% identified
in 2009–10 Alabama 65 ‡ ‡ 75 ‡ ‡ 498 ‡ ‡ Alaska 28 3 10.7% 73 12 16.4% 58 5 8.6% Arkansas 29 25 86.2% 46 18 39.1% 383 73 19.1% California 109 33 30.3% 494 176 35.6% 4,691 1,373 29.3% Colorado 23 ‡ ‡ 108 17 15.7% 766 60 7.8% Florida 449 353 78.6% 269 188 69.9% 283 163 57.6% Georgia 245 8 3.3% 244 6 2.5% 614 4 0.7% Hawaii 3 3 100.0% 20 16 80.0% 154 28 18.2% Illinois 264 111 42.0% 332 79 23.8% 1,456 108 7.4% Indiana - - - - - - - - - Iowa 61 6 9.8% 581 7 1.2% ‡ ‡ ‡ Kansas 53 3 5.7% 367 11 3.0% 0 na na Maine 194 12 6.2% ‡ ‡ ‡ 0 na na Maryland 789 61 7.7% 32 6 18.8% ‡ ‡ ‡ Massachusetts 84 71 84.5% 288 188 65.3% 547 184 33.6% Minnesota 160 37 23.1% 258 73 28.3% 123 7 5.7% Mississippi 98 6 6.1% 274 ‡ ‡ 0 na na Missouri 40 22 55.0% 161 61 37.9% 588 126 21.4% Montana ‡ ‡ ‡ 30 ‡ ‡ 212 9 4.2% New Hampshire 142 47 33.1% 88 37 42.0% 34 ‡ ‡ North Carolina 80 60 75.0% 158 88 55.7% 537 188 35.0% North Dakota 98 7 7.1% 100 5 5.0% 0 na na Ohio 128 51 39.8% 623 229 36.8% 961 185 19.3% Oregon 256 27 10.5% 73 7 9.6% 100 3 3.0% Pennsylvania 78 26 33.3% 682 138 20.2% 863 23 2.7% Vermont 11 11 100.0% 11 5 45.5% 189 5 2.6% Virginia 38 5 13.2% 65 7 10.8% 488 52 10.7% Washington 0 na na 468 114 24.4% 576 59 10.2% Wisconsin 20 ‡ ‡ 83 4 4.8% 961 7 0.7% Total 3,547 994 28.0% 6,005 1,496 24.9% 15,086 2,666 17.7%
SOURCE: U.S. Department of Education EDFacts data, 2005–06 through 2007–08 and 2009–10; 2009–10 Common Core of Data. NOTES: “na” = State did not have any schools in this accountability group. “-” indicates no school improvement status data were reported. ‡ Reporting standards were not met.
80
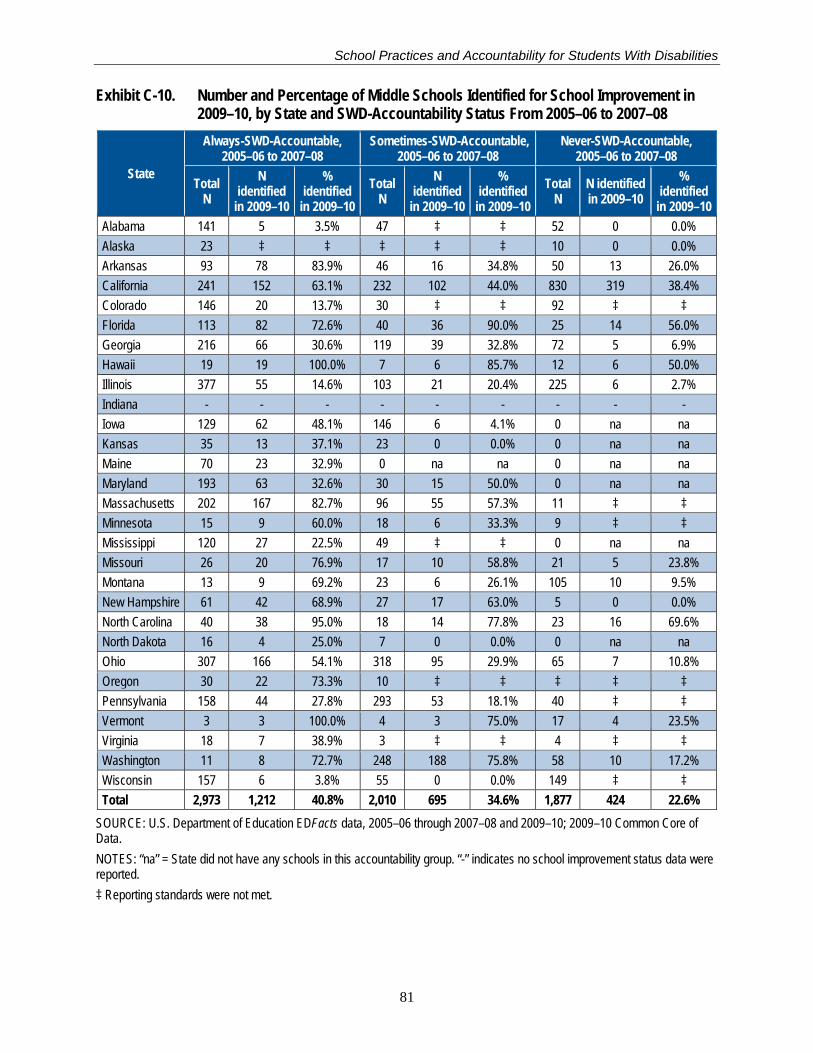
School Practices and Accountability for Students With Disabilities
Exhibit C-10. Number and Percentage of Middle Schools Identified for School Improvement in 2009–10, by State and SWD-Accountability Status From 2005–06 to 2007–08
State
Always-SWD-Accountable, 2005–06 to 2007–08
Sometimes-SWD-Accountable, 2005–06 to 2007–08
Never-SWD-Accountable, 2005–06 to 2007–08
Total N
N identified
in 2009–10
% identified
in 2009–10 Total
N N
identified in 2009–10
% identified
in 2009–10 Total
N N identified in 2009–10
% identified
in 2009–10 Alabama 141 5 3.5% 47 ‡ ‡ 52 0 0.0% Alaska 23 ‡ ‡ ‡ ‡ ‡ 10 0 0.0% Arkansas 93 78 83.9% 46 16 34.8% 50 13 26.0% California 241 152 63.1% 232 102 44.0% 830 319 38.4% Colorado 146 20 13.7% 30 ‡ ‡ 92 ‡ ‡ Florida 113 82 72.6% 40 36 90.0% 25 14 56.0% Georgia 216 66 30.6% 119 39 32.8% 72 5 6.9% Hawaii 19 19 100.0% 7 6 85.7% 12 6 50.0% Illinois 377 55 14.6% 103 21 20.4% 225 6 2.7% Indiana - - - - - - - - - Iowa 129 62 48.1% 146 6 4.1% 0 na na Kansas 35 13 37.1% 23 0 0.0% 0 na na Maine 70 23 32.9% 0 na na 0 na na Maryland 193 63 32.6% 30 15 50.0% 0 na na Massachusetts 202 167 82.7% 96 55 57.3% 11 ‡ ‡ Minnesota 15 9 60.0% 18 6 33.3% 9 ‡ ‡ Mississippi 120 27 22.5% 49 ‡ ‡ 0 na na Missouri 26 20 76.9% 17 10 58.8% 21 5 23.8% Montana 13 9 69.2% 23 6 26.1% 105 10 9.5% New Hampshire 61 42 68.9% 27 17 63.0% 5 0 0.0% North Carolina 40 38 95.0% 18 14 77.8% 23 16 69.6% North Dakota 16 4 25.0% 7 0 0.0% 0 na na Ohio 307 166 54.1% 318 95 29.9% 65 7 10.8% Oregon 30 22 73.3% 10 ‡ ‡ ‡ ‡ ‡ Pennsylvania 158 44 27.8% 293 53 18.1% 40 ‡ ‡ Vermont 3 3 100.0% 4 3 75.0% 17 4 23.5% Virginia 18 7 38.9% 3 ‡ ‡ 4 ‡ ‡ Washington 11 8 72.7% 248 188 75.8% 58 10 17.2% Wisconsin 157 6 3.8% 55 0 0.0% 149 ‡ ‡ Total 2,973 1,212 40.8% 2,010 695 34.6% 1,877 424 22.6%
SOURCE: U.S. Department of Education EDFacts data, 2005–06 through 2007–08 and 2009–10; 2009–10 Common Core of Data. NOTES: “na” = State did not have any schools in this accountability group. “-” indicates no school improvement status data were reported. ‡ Reporting standards were not met.
81
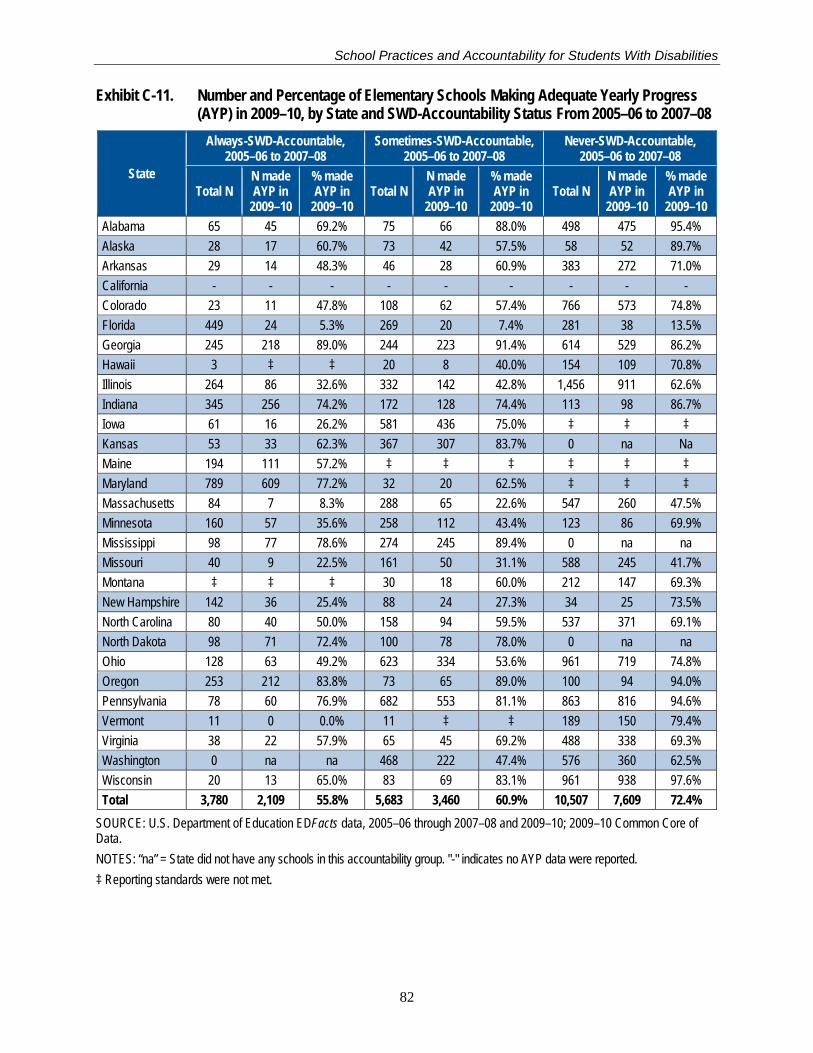
School Practices and Accountability for Students With Disabilities
Exhibit C-11. Number and Percentage of Elementary Schools Making Adequate Yearly Progress (AYP) in 2009–10, by State and SWD-Accountability Status From 2005–06 to 2007–08
State
Always-SWD-Accountable, 2005–06 to 2007–08
Sometimes-SWD-Accountable, 2005–06 to 2007–08
Never-SWD-Accountable, 2005–06 to 2007–08
Total N N made AYP in
2009–10
% made AYP in
2009–10 Total N
N made AYP in
2009–10
% made AYP in
2009–10 Total N
N made AYP in
2009–10
% made AYP in
2009–10 Alabama 65 45 69.2% 75 66 88.0% 498 475 95.4% Alaska 28 17 60.7% 73 42 57.5% 58 52 89.7% Arkansas 29 14 48.3% 46 28 60.9% 383 272 71.0% California - - - - - - - - - Colorado 23 11 47.8% 108 62 57.4% 766 573 74.8% Florida 449 24 5.3% 269 20 7.4% 281 38 13.5% Georgia 245 218 89.0% 244 223 91.4% 614 529 86.2% Hawaii 3 ‡ ‡ 20 8 40.0% 154 109 70.8% Illinois 264 86 32.6% 332 142 42.8% 1,456 911 62.6% Indiana 345 256 74.2% 172 128 74.4% 113 98 86.7% Iowa 61 16 26.2% 581 436 75.0% ‡ ‡ ‡ Kansas 53 33 62.3% 367 307 83.7% 0 na Na Maine 194 111 57.2% ‡ ‡ ‡ ‡ ‡ ‡ Maryland 789 609 77.2% 32 20 62.5% ‡ ‡ ‡ Massachusetts 84 7 8.3% 288 65 22.6% 547 260 47.5% Minnesota 160 57 35.6% 258 112 43.4% 123 86 69.9% Mississippi 98 77 78.6% 274 245 89.4% 0 na na Missouri 40 9 22.5% 161 50 31.1% 588 245 41.7% Montana ‡ ‡ ‡ 30 18 60.0% 212 147 69.3% New Hampshire 142 36 25.4% 88 24 27.3% 34 25 73.5% North Carolina 80 40 50.0% 158 94 59.5% 537 371 69.1% North Dakota 98 71 72.4% 100 78 78.0% 0 na na Ohio 128 63 49.2% 623 334 53.6% 961 719 74.8% Oregon 253 212 83.8% 73 65 89.0% 100 94 94.0% Pennsylvania 78 60 76.9% 682 553 81.1% 863 816 94.6% Vermont 11 0 0.0% 11 ‡ ‡ 189 150 79.4% Virginia 38 22 57.9% 65 45 69.2% 488 338 69.3% Washington 0 na na 468 222 47.4% 576 360 62.5% Wisconsin 20 13 65.0% 83 69 83.1% 961 938 97.6% Total 3,780 2,109 55.8% 5,683 3,460 60.9% 10,507 7,609 72.4%
SOURCE: U.S. Department of Education EDFacts data, 2005–06 through 2007–08 and 2009–10; 2009–10 Common Core of Data. NOTES: “na” = State did not have any schools in this accountability group. "-" indicates no AYP data were reported. ‡ Reporting standards were not met.
82
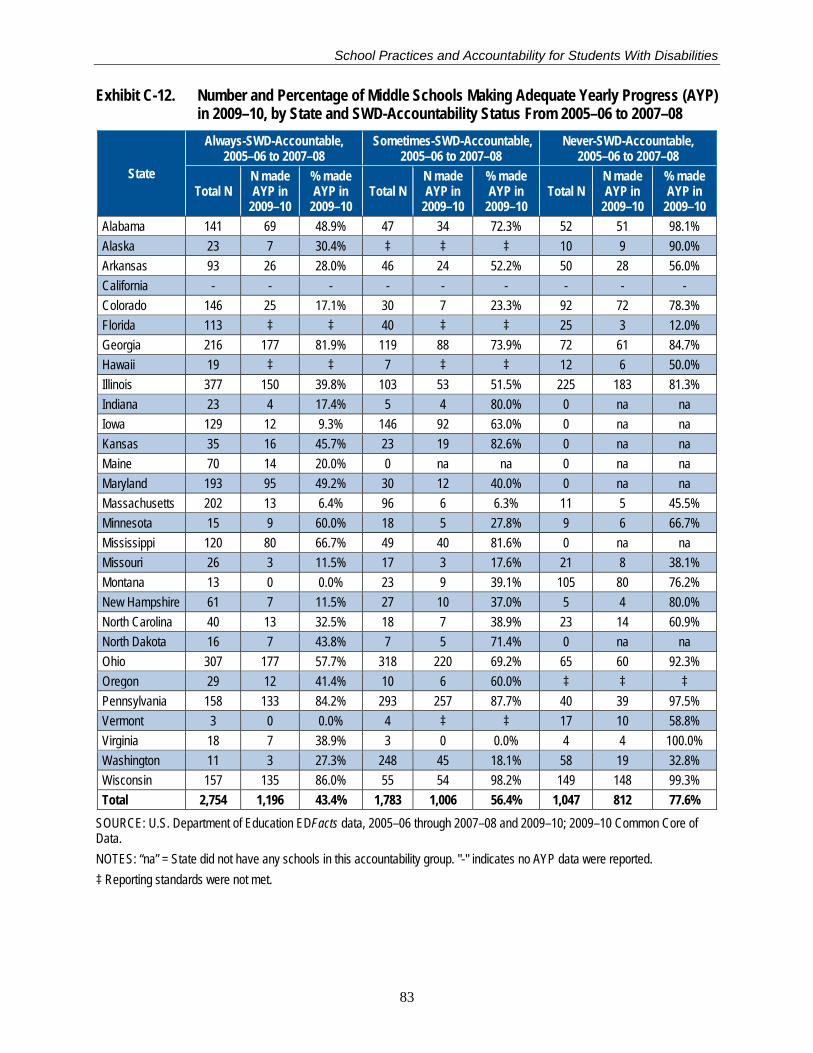
School Practices and Accountability for Students With Disabilities
Exhibit C-12. Number and Percentage of Middle Schools Making Adequate Yearly Progress (AYP) in 2009–10, by State and SWD-Accountability Status From 2005–06 to 2007–08
State
Always-SWD-Accountable, 2005–06 to 2007–08
Sometimes-SWD-Accountable, 2005–06 to 2007–08
Never-SWD-Accountable, 2005–06 to 2007–08
Total N N made AYP in
2009–10
% made AYP in
2009–10 Total N
N made AYP in
2009–10
% made AYP in
2009–10 Total N
N made AYP in
2009–10
% made AYP in
2009–10 Alabama 141 69 48.9% 47 34 72.3% 52 51 98.1% Alaska 23 7 30.4% ‡ ‡ ‡ 10 9 90.0% Arkansas 93 26 28.0% 46 24 52.2% 50 28 56.0% California - - - - - - - - - Colorado 146 25 17.1% 30 7 23.3% 92 72 78.3% Florida 113 ‡ ‡ 40 ‡ ‡ 25 3 12.0% Georgia 216 177 81.9% 119 88 73.9% 72 61 84.7% Hawaii 19 ‡ ‡ 7 ‡ ‡ 12 6 50.0% Illinois 377 150 39.8% 103 53 51.5% 225 183 81.3% Indiana 23 4 17.4% 5 4 80.0% 0 na na Iowa 129 12 9.3% 146 92 63.0% 0 na na Kansas 35 16 45.7% 23 19 82.6% 0 na na Maine 70 14 20.0% 0 na na 0 na na Maryland 193 95 49.2% 30 12 40.0% 0 na na Massachusetts 202 13 6.4% 96 6 6.3% 11 5 45.5% Minnesota 15 9 60.0% 18 5 27.8% 9 6 66.7% Mississippi 120 80 66.7% 49 40 81.6% 0 na na Missouri 26 3 11.5% 17 3 17.6% 21 8 38.1% Montana 13 0 0.0% 23 9 39.1% 105 80 76.2% New Hampshire 61 7 11.5% 27 10 37.0% 5 4 80.0% North Carolina 40 13 32.5% 18 7 38.9% 23 14 60.9% North Dakota 16 7 43.8% 7 5 71.4% 0 na na Ohio 307 177 57.7% 318 220 69.2% 65 60 92.3% Oregon 29 12 41.4% 10 6 60.0% ‡ ‡ ‡ Pennsylvania 158 133 84.2% 293 257 87.7% 40 39 97.5% Vermont 3 0 0.0% 4 ‡ ‡ 17 10 58.8% Virginia 18 7 38.9% 3 0 0.0% 4 4 100.0% Washington 11 3 27.3% 248 45 18.1% 58 19 32.8% Wisconsin 157 135 86.0% 55 54 98.2% 149 148 99.3% Total 2,754 1,196 43.4% 1,783 1,006 56.4% 1,047 812 77.6%
SOURCE: U.S. Department of Education EDFacts data, 2005–06 through 2007–08 and 2009–10; 2009–10 Common Core of Data. NOTES: “na” = State did not have any schools in this accountability group. "-" indicates no AYP data were reported. ‡ Reporting standards were not met.
83
School Practices and Accountability for Students With Disabilities
Appendix D: Chapter 4, School Characteristics and Staffing in SWD-Accountable and Non-SWD-Accountable Schools—State-Level Tables
84
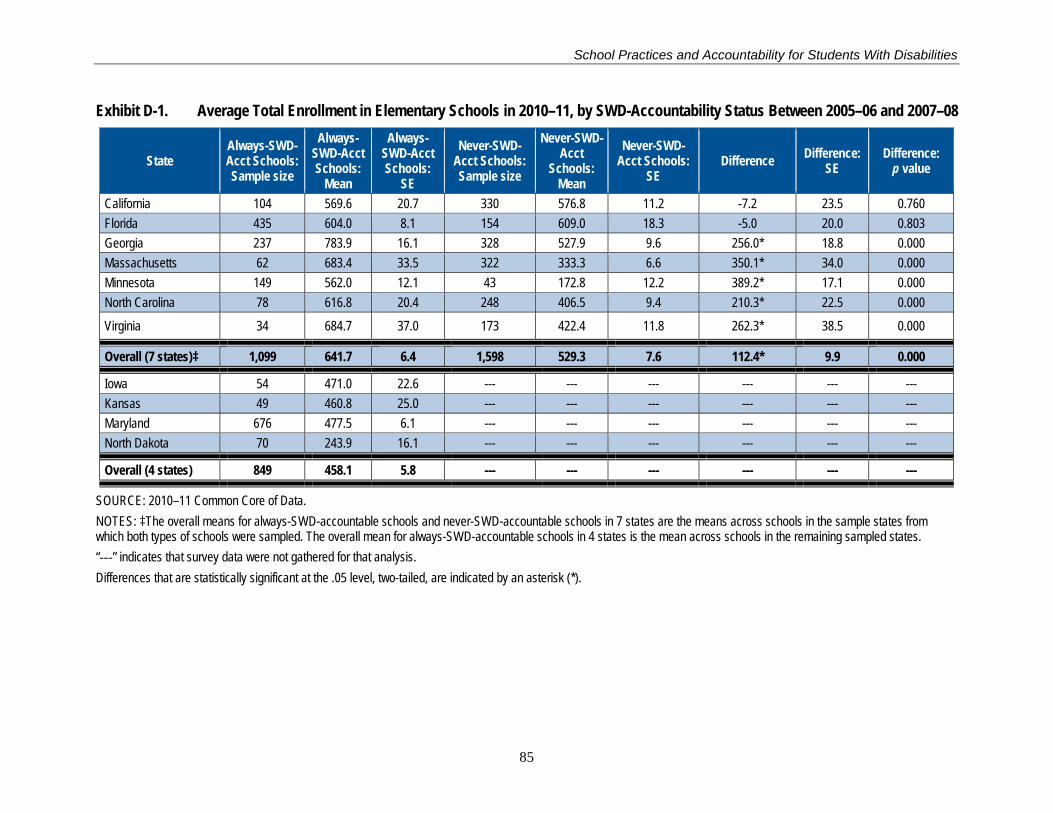
School Practices and Accountability for Students With Disabilities
Exhibit D-1. Average Total Enrollment in Elementary Schools in 2010–11, by SWD-Accountability Status Between 2005–06 and 2007–08
State Always-SWD-Acct Schools: Sample size
Always-SWD-Acct Schools:
Mean
Always-SWD-Acct Schools:
SE
Never-SWD-Acct Schools: Sample size
Never-SWD-Acct
Schools: Mean
Never-SWD-Acct Schools:
SE Difference Difference:
SE Difference:
p value
California 104 569.6 20.7 330 576.8 11.2 -7.2 23.5 0.760 Florida 435 604.0 8.1 154 609.0 18.3 -5.0 20.0 0.803 Georgia 237 783.9 16.1 328 527.9 9.6 256.0* 18.8 0.000 Massachusetts 62 683.4 33.5 322 333.3 6.6 350.1* 34.0 0.000 Minnesota 149 562.0 12.1 43 172.8 12.2 389.2* 17.1 0.000 North Carolina 78 616.8 20.4 248 406.5 9.4 210.3* 22.5 0.000
Virginia 34 684.7 37.0 173 422.4 11.8 262.3* 38.5 0.000
Overall (7 states)‡ 1,099 641.7 6.4 1,598 529.3 7.6 112.4* 9.9 0.000
Iowa 54 471.0 22.6 --- --- --- --- --- --- Kansas 49 460.8 25.0 --- --- --- --- --- --- Maryland 676 477.5 6.1 --- --- --- --- --- --- North Dakota 70 243.9 16.1 --- --- --- --- --- ---
Overall (4 states) 849 458.1 5.8 --- --- --- --- --- ---
SOURCE: 2010–11 Common Core of Data. NOTES: ‡The overall means for always-SWD-accountable schools and never-SWD-accountable schools in 7 states are the means across schools in the sample states from which both types of schools were sampled. The overall mean for always-SWD-accountable schools in 4 states is the mean across schools in the remaining sampled states. “---” indicates that survey data were not gathered for that analysis. Differences that are statistically significant at the .05 level, two-tailed, are indicated by an asterisk (*).
85
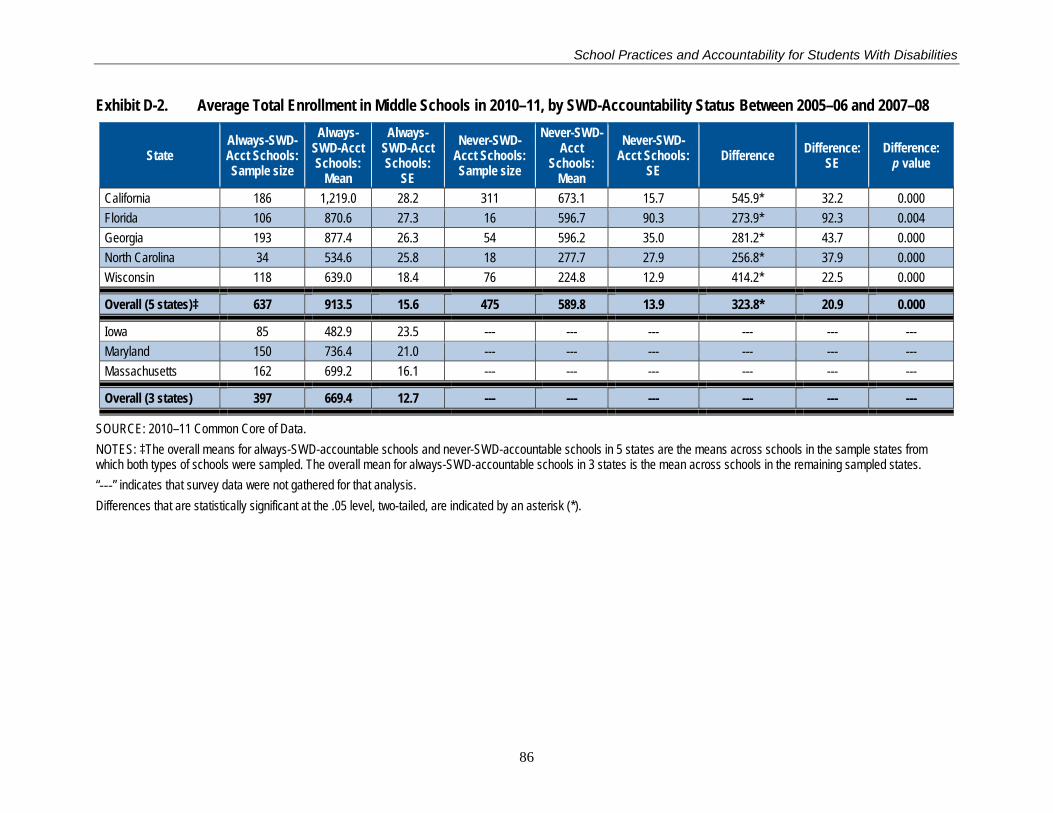
School Practices and Accountability for Students With Disabilities
Exhibit D-2. Average Total Enrollment in Middle Schools in 2010–11, by SWD-Accountability Status Between 2005–06 and 2007–08
State Always-SWD-Acct Schools: Sample size
Always-SWD-Acct Schools:
Mean
Always-SWD-Acct Schools:
SE
Never-SWD-Acct Schools: Sample size
Never-SWD-Acct
Schools: Mean
Never-SWD-Acct Schools:
SE Difference Difference:
SE Difference:
p value
California 186 1,219.0 28.2 311 673.1 15.7 545.9* 32.2 0.000 Florida 106 870.6 27.3 16 596.7 90.3 273.9* 92.3 0.004 Georgia 193 877.4 26.3 54 596.2 35.0 281.2* 43.7 0.000 North Carolina 34 534.6 25.8 18 277.7 27.9 256.8* 37.9 0.000 Wisconsin 118 639.0 18.4 76 224.8 12.9 414.2* 22.5 0.000
Overall (5 states)‡ 637 913.5 15.6 475 589.8 13.9 323.8* 20.9 0.000
Iowa 85 482.9 23.5 --- --- --- --- --- --- Maryland 150 736.4 21.0 --- --- --- --- --- --- Massachusetts 162 699.2 16.1 --- --- --- --- --- ---
Overall (3 states) 397 669.4 12.7 --- --- --- --- --- ---
SOURCE: 2010–11 Common Core of Data. NOTES: ‡The overall means for always-SWD-accountable schools and never-SWD-accountable schools in 5 states are the means across schools in the sample states from which both types of schools were sampled. The overall mean for always-SWD-accountable schools in 3 states is the mean across schools in the remaining sampled states. “---” indicates that survey data were not gathered for that analysis. Differences that are statistically significant at the .05 level, two-tailed, are indicated by an asterisk (*).
86
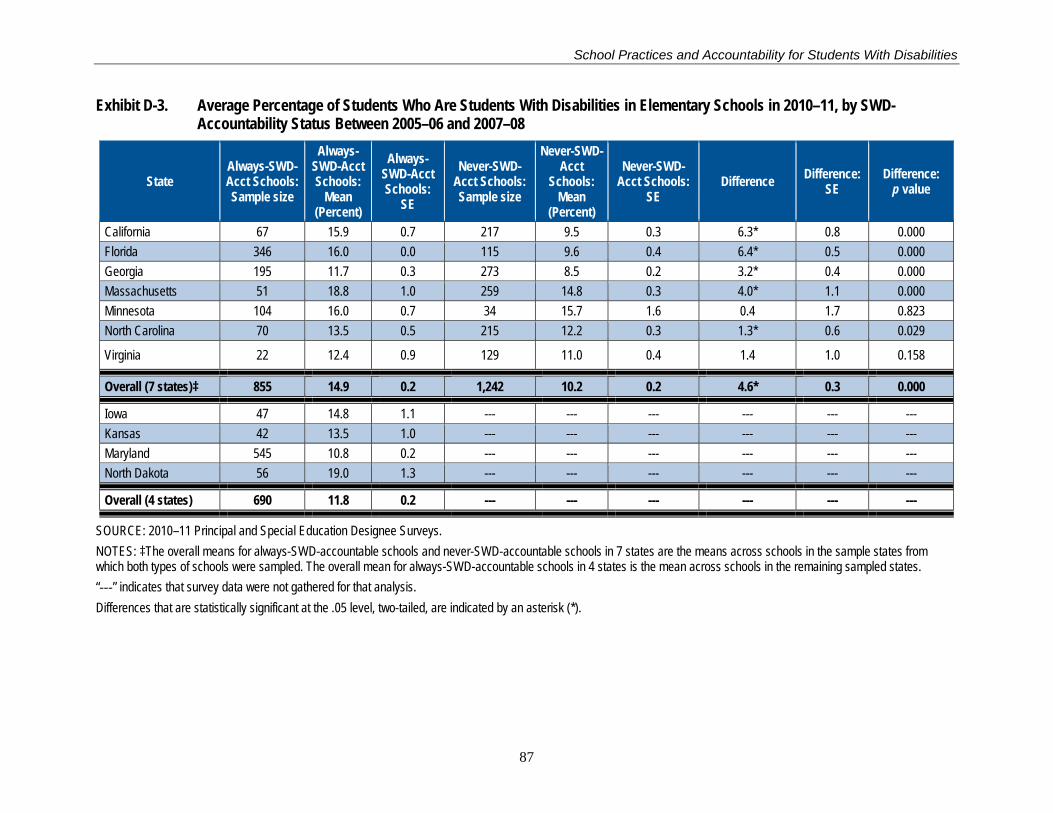
School Practices and Accountability for Students With Disabilities
Exhibit D-3. Average Percentage of Students Who Are Students With Disabilities in Elementary Schools in 2010–11, by SWD-Accountability Status Between 2005–06 and 2007–08
State Always-SWD-Acct Schools: Sample size
Always-SWD-Acct Schools:
Mean (Percent)
Always-SWD-Acct Schools:
SE
Never-SWD-Acct Schools: Sample size
Never-SWD-Acct
Schools: Mean
(Percent)
Never-SWD-Acct Schools:
SE Difference Difference:
SE Difference:
p value
California 67 15.9 0.7 217 9.5 0.3 6.3* 0.8 0.000 Florida 346 16.0 0.0 115 9.6 0.4 6.4* 0.5 0.000 Georgia 195 11.7 0.3 273 8.5 0.2 3.2* 0.4 0.000 Massachusetts 51 18.8 1.0 259 14.8 0.3 4.0* 1.1 0.000 Minnesota 104 16.0 0.7 34 15.7 1.6 0.4 1.7 0.823 North Carolina 70 13.5 0.5 215 12.2 0.3 1.3* 0.6 0.029
Virginia 22 12.4 0.9 129 11.0 0.4 1.4 1.0 0.158
Overall (7 states)‡ 855 14.9 0.2 1,242 10.2 0.2 4.6* 0.3 0.000
Iowa 47 14.8 1.1 --- --- --- --- --- --- Kansas 42 13.5 1.0 --- --- --- --- --- --- Maryland 545 10.8 0.2 --- --- --- --- --- --- North Dakota 56 19.0 1.3 --- --- --- --- --- ---
Overall (4 states) 690 11.8 0.2 --- --- --- --- --- ---
SOURCE: 2010–11 Principal and Special Education Designee Surveys. NOTES: ‡The overall means for always-SWD-accountable schools and never-SWD-accountable schools in 7 states are the means across schools in the sample states from which both types of schools were sampled. The overall mean for always-SWD-accountable schools in 4 states is the mean across schools in the remaining sampled states. “---” indicates that survey data were not gathered for that analysis. Differences that are statistically significant at the .05 level, two-tailed, are indicated by an asterisk (*).
87

School Practices and Accountability for Students With Disabilities
Exhibit D-4. Average Percentage of Students Who Are Students With Disabilities in Middle Schools 2010–11, by SWD-Accountability Status Between 2005–06 and 2007–08
State Always-SWD-Acct Schools: Sample size
Always-SWD-Acct Schools:
Mean (Percent)
Always-SWD-Acct Schools:
SE
Never-SWD-Acct Schools: Sample size
Never-SWD-Acct
Schools: Mean
(Percent)
Never-SWD-Acct Schools:
SE Difference Difference:
SE Difference:
p value
California 133 12.3 0.3 215 11.2 0.4 1.1* 0.5 0.026 Florida 70 18.2 0.6 12 9.5 1.2 8.7* 1.3 0.000 Georgia 164 12.4 0.3 40 10.8 1.2 1.5 1.3 0.222 North Carolina 29 14.8 0.7 15 11.3 0.9 3.5* 1.2 0.004 Wisconsin 91 16.0 0.8 47 23.8 2.1 -7.8* 2.3 0.001
Overall (5 states)‡ 487 14.0 0.2 329 12.7 0.5 1.3* 0.5 0.008
Iowa 68 17.0 1.0 --- --- --- --- --- --- Maryland 129 11.3 0.3 --- --- --- --- --- --- Massachusetts 132 18.6 0.5 --- --- --- --- --- ---
Overall (3 states) 329 15.2 0.3 --- --- --- --- --- ---
SOURCE: 2010–11 Principal and Special Education Designee Surveys. NOTES: ‡The overall means for always-SWD-accountable schools and never-SWD-accountable schools in 5 states are the means across schools in the sample states from which both types of schools were sampled. The overall mean for always-SWD-accountable schools in 3 states is the mean across schools in the remaining sampled states. “---” indicates that survey data were not gathered for that analysis. Differences that are statistically significant at the .05 level, two-tailed, are indicated by an asterisk (*).
88

School Practices and Accountability for Students With Disabilities
Exhibit D-5. Average Percentage of Students Eligible to Receive Free or Reduced-Price Lunch in Elementary Schools in 2010–11, by SWD-Accountability Status Between 2005–06 and 2007–08
State Always-SWD-Acct Schools: Sample size
Always-SWD-Acct Schools:
Mean (Percent)
Always-SWD-Acct Schools:
SE
Never-SWD-Acct Schools: Sample size
Never-SWD-Acct
Schools: Mean
(Percent)
Never-SWD-Acct Schools:
SE Difference Difference:
SE Difference:
p value
California 104 48.8 2.5 330 59.5 1.6 -10.7* 3.0 0.000 Florida 435 78.9 0.6 154 81.9 1.0 -3.0* 1.2 0.012 Georgia 237 47.8 1.6 328 71.7 1.2 -23.8* 2.0 0.000 Massachusetts 62 42.0 4.0 322 37.5 1.6 4.4 4.3 0.305 Minnesota 149 45.4 1.6 43 54.1 2.6 -8.7* 3.1 0.005 North Carolina 77 63.0 1.6 248 69.2 1.0 -6.2* 1.9 0.001
Virginia 34 60.5 3.2 173 60.9 1.2 -0.4 3.4 0.907
Overall (7 states)‡ 1,098 61.0 0.8 1,598 61.0 1.0 0.0 1.3 0.975
Iowa 54 46.4 3.0 --- --- --- --- --- --- Kansas 49 59.6 3.0 --- --- --- --- --- --- Maryland 676 47.1 1.2 --- --- --- --- --- --- North Dakota 70 40.4 2.2 --- --- --- --- --- ---
Overall (4 states) 849 47.2 1.0 --- --- --- --- --- ---
SOURCE: 2010–11 Common Core of Data. NOTES: ‡The overall means for always-SWD-accountable schools and never-SWD-accountable schools in 7 states are the means across schools in the sample states from which both types of schools were sampled. The overall mean for always-SWD-accountable schools in 4 states is the mean across schools in the remaining sampled states. “---” indicates that survey data were not gathered for that analysis. Differences that are statistically significant at the .05 level, two-tailed, are indicated by an asterisk (*).
89
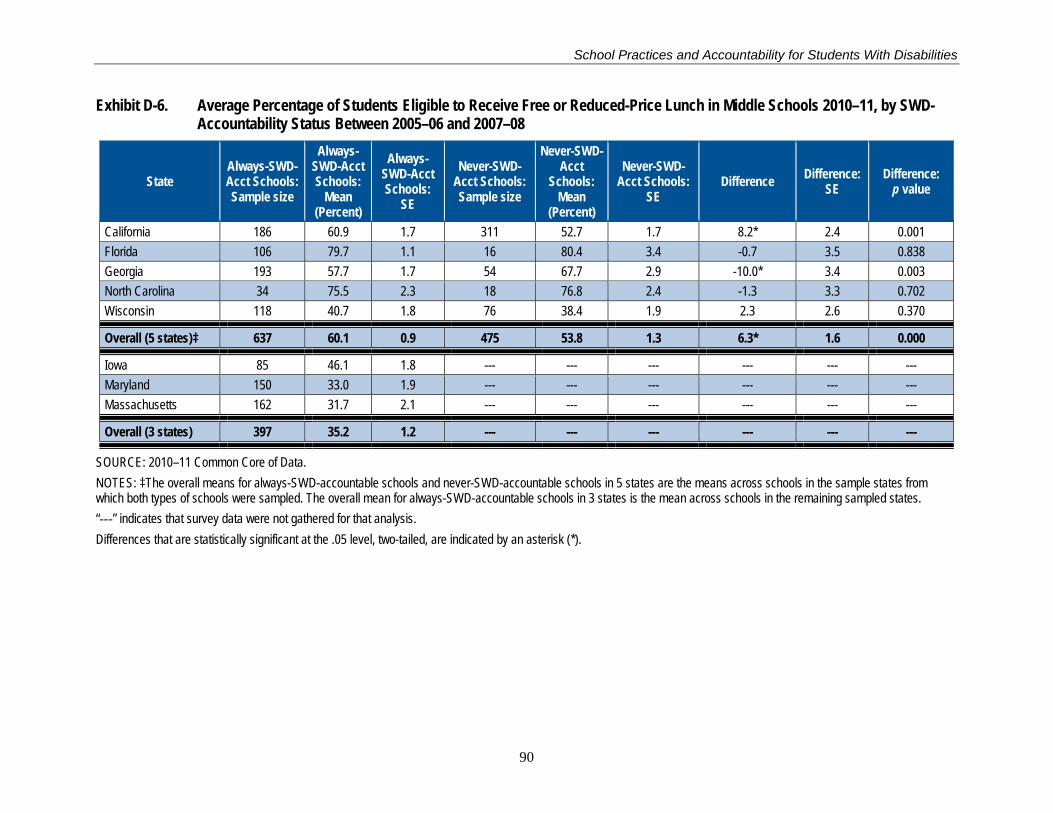
School Practices and Accountability for Students With Disabilities
Exhibit D-6. Average Percentage of Students Eligible to Receive Free or Reduced-Price Lunch in Middle Schools 2010–11, by SWD-Accountability Status Between 2005–06 and 2007–08
State Always-SWD-Acct Schools: Sample size
Always-SWD-Acct Schools:
Mean (Percent)
Always-SWD-Acct Schools:
SE
Never-SWD-Acct Schools: Sample size
Never-SWD-Acct
Schools: Mean
(Percent)
Never-SWD-Acct Schools:
SE Difference Difference:
SE Difference:
p value
California 186 60.9 1.7 311 52.7 1.7 8.2* 2.4 0.001 Florida 106 79.7 1.1 16 80.4 3.4 -0.7 3.5 0.838 Georgia 193 57.7 1.7 54 67.7 2.9 -10.0* 3.4 0.003 North Carolina 34 75.5 2.3 18 76.8 2.4 -1.3 3.3 0.702 Wisconsin 118 40.7 1.8 76 38.4 1.9 2.3 2.6 0.370
Overall (5 states)‡ 637 60.1 0.9 475 53.8 1.3 6.3* 1.6 0.000
Iowa 85 46.1 1.8 --- --- --- --- --- --- Maryland 150 33.0 1.9 --- --- --- --- --- --- Massachusetts 162 31.7 2.1 --- --- --- --- --- ---
Overall (3 states) 397 35.2 1.2 --- --- --- --- --- ---
SOURCE: 2010–11 Common Core of Data. NOTES: ‡The overall means for always-SWD-accountable schools and never-SWD-accountable schools in 5 states are the means across schools in the sample states from which both types of schools were sampled. The overall mean for always-SWD-accountable schools in 3 states is the mean across schools in the remaining sampled states. “---” indicates that survey data were not gathered for that analysis. Differences that are statistically significant at the .05 level, two-tailed, are indicated by an asterisk (*).
90
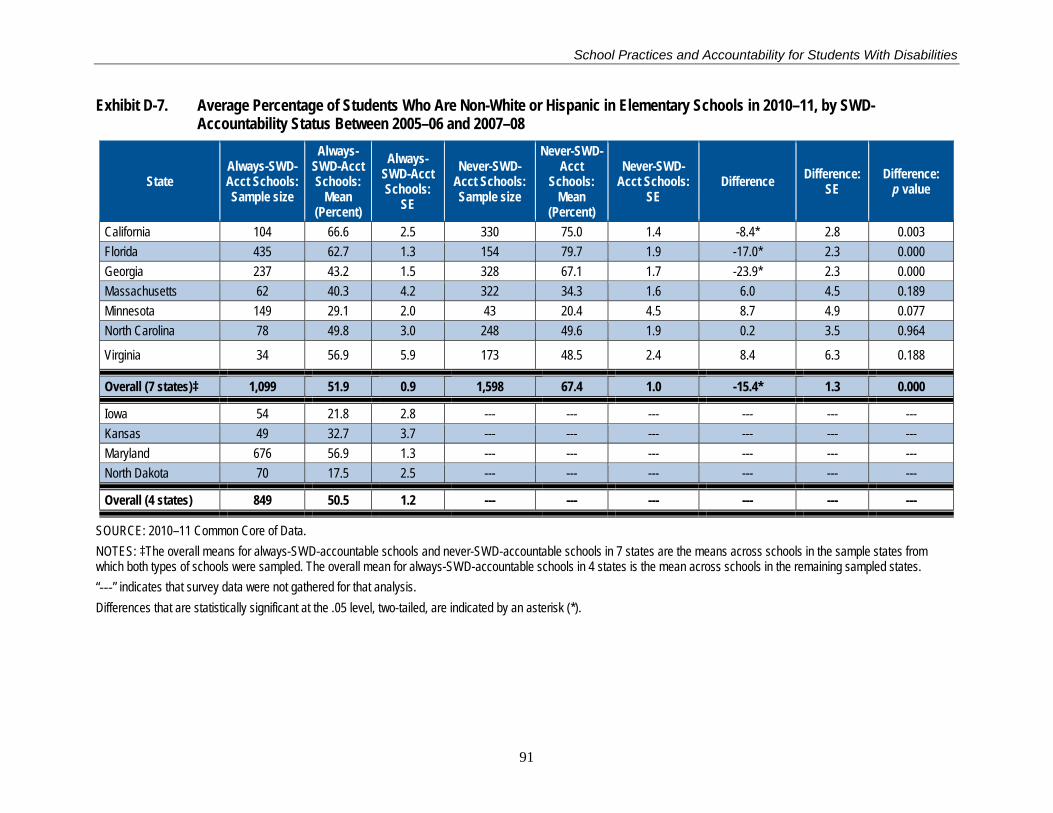
School Practices and Accountability for Students With Disabilities
Exhibit D-7. Average Percentage of Students Who Are Non-White or Hispanic in Elementary Schools in 2010–11, by SWD-Accountability Status Between 2005–06 and 2007–08
State Always-SWD-Acct Schools: Sample size
Always-SWD-Acct Schools:
Mean (Percent)
Always-SWD-Acct Schools:
SE
Never-SWD-Acct Schools: Sample size
Never-SWD-Acct
Schools: Mean
(Percent)
Never-SWD-Acct Schools:
SE Difference Difference:
SE Difference:
p value
California 104 66.6 2.5 330 75.0 1.4 -8.4* 2.8 0.003 Florida 435 62.7 1.3 154 79.7 1.9 -17.0* 2.3 0.000 Georgia 237 43.2 1.5 328 67.1 1.7 -23.9* 2.3 0.000 Massachusetts 62 40.3 4.2 322 34.3 1.6 6.0 4.5 0.189 Minnesota 149 29.1 2.0 43 20.4 4.5 8.7 4.9 0.077 North Carolina 78 49.8 3.0 248 49.6 1.9 0.2 3.5 0.964
Virginia 34 56.9 5.9 173 48.5 2.4 8.4 6.3 0.188
Overall (7 states)‡ 1,099 51.9 0.9 1,598 67.4 1.0 -15.4* 1.3 0.000
Iowa 54 21.8 2.8 --- --- --- --- --- --- Kansas 49 32.7 3.7 --- --- --- --- --- --- Maryland 676 56.9 1.3 --- --- --- --- --- --- North Dakota 70 17.5 2.5 --- --- --- --- --- ---
Overall (4 states) 849 50.5 1.2 --- --- --- --- --- ---
SOURCE: 2010–11 Common Core of Data. NOTES: ‡The overall means for always-SWD-accountable schools and never-SWD-accountable schools in 7 states are the means across schools in the sample states from which both types of schools were sampled. The overall mean for always-SWD-accountable schools in 4 states is the mean across schools in the remaining sampled states. “---” indicates that survey data were not gathered for that analysis. Differences that are statistically significant at the .05 level, two-tailed, are indicated by an asterisk (*).
91
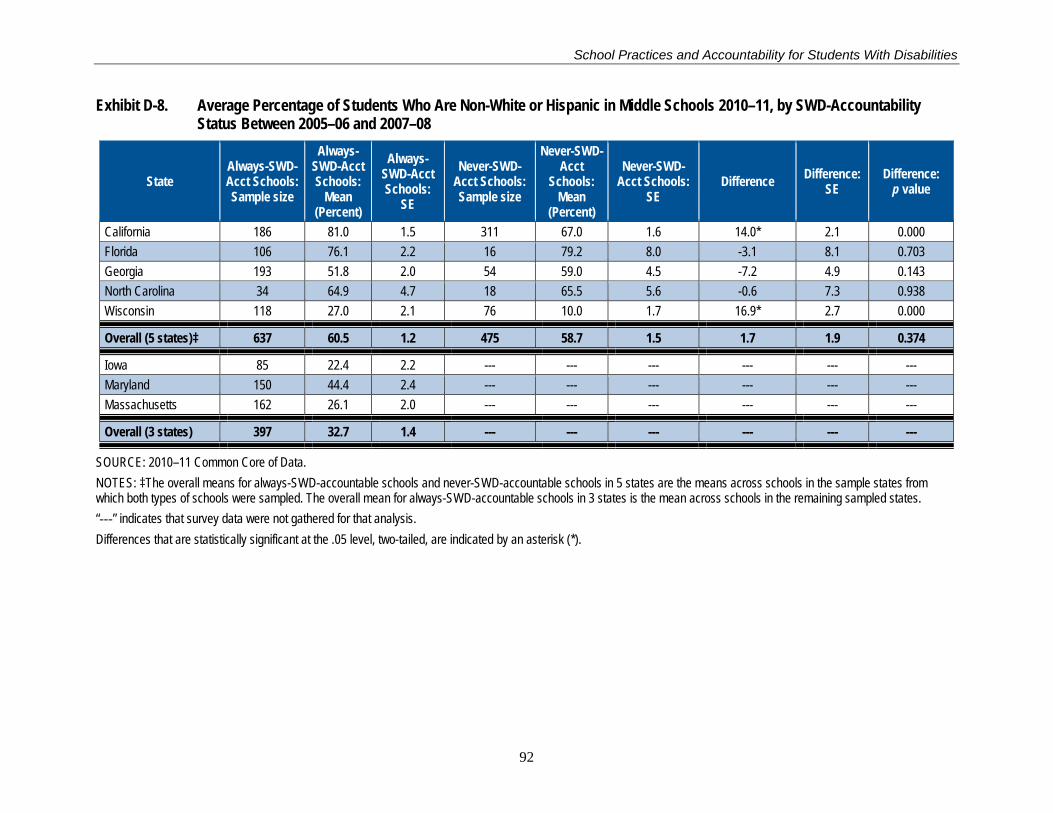
School Practices and Accountability for Students With Disabilities
Exhibit D-8. Average Percentage of Students Who Are Non-White or Hispanic in Middle Schools 2010–11, by SWD-Accountability Status Between 2005–06 and 2007–08
State Always-SWD-Acct Schools: Sample size
Always-SWD-Acct Schools:
Mean (Percent)
Always-SWD-Acct Schools:
SE
Never-SWD-Acct Schools: Sample size
Never-SWD-Acct
Schools: Mean
(Percent)
Never-SWD-Acct Schools:
SE Difference Difference:
SE Difference:
p value
California 186 81.0 1.5 311 67.0 1.6 14.0* 2.1 0.000 Florida 106 76.1 2.2 16 79.2 8.0 -3.1 8.1 0.703 Georgia 193 51.8 2.0 54 59.0 4.5 -7.2 4.9 0.143 North Carolina 34 64.9 4.7 18 65.5 5.6 -0.6 7.3 0.938 Wisconsin 118 27.0 2.1 76 10.0 1.7 16.9* 2.7 0.000
Overall (5 states)‡ 637 60.5 1.2 475 58.7 1.5 1.7 1.9 0.374
Iowa 85 22.4 2.2 --- --- --- --- --- --- Maryland 150 44.4 2.4 --- --- --- --- --- --- Massachusetts 162 26.1 2.0 --- --- --- --- --- ---
Overall (3 states) 397 32.7 1.4 --- --- --- --- --- ---
SOURCE: 2010–11 Common Core of Data. NOTES: ‡The overall means for always-SWD-accountable schools and never-SWD-accountable schools in 5 states are the means across schools in the sample states from which both types of schools were sampled. The overall mean for always-SWD-accountable schools in 3 states is the mean across schools in the remaining sampled states. “---” indicates that survey data were not gathered for that analysis. Differences that are statistically significant at the .05 level, two-tailed, are indicated by an asterisk (*).
92

School Practices and Accountability for Students With Disabilities
Exhibit D-9. Percentage of Urban Elementary Schools in 2010–11, by SWD-Accountability Status Between 2005–06 and 2007–08
State Always-SWD-Acct Schools: Sample size
Always-SWD-Acct Schools:
Mean (Percent)
Always-SWD-Acct Schools:
SE
Never-SWD-Acct Schools: Sample size
Never-SWD-Acct
Schools: Mean
(Percent)
Never-SWD-Acct Schools:
SE Difference Difference:
SE Difference:
p value
California 104 46.2 4.9 331 45.9 2.7 0.2 5.6 0.967 Florida 435 33.6 2.3 154 27.9 3.6 5.6 4.3 0.187 Georgia 237 3.4 1.2 328 32.3 2.6 -28.9* 2.8 0.000 Massachusetts 62 16.1 4.7 323 34.1 2.6 -17.9* 5.4 0.001 Minnesota 149 16.1 3.0 44 9.1 4.4 7.0 5.3 0.188 North Carolina 78 15.4 4.1 249 21.7 2.6 -6.3 4.9 0.196
Virginia 34 23.5 7.4 174 29.3 3.5 -5.8 8.1 0.476
Overall (7 states)‡ 1,099 23.3 1.3 1,603 39.6 1.8 -16.3* 2.2 0.000
Iowa 54 33.3 6.5 --- --- --- --- --- --- Kansas 51 27.5 6.3 --- --- --- --- --- --- Maryland 676 18.5 1.5 --- --- --- --- --- --- North Dakota 70 15.7 4.4 --- --- --- --- --- ---
Overall (4 states) 851 19.7 1.4 --- --- --- --- --- ---
SOURCE: 2010–11 Common Core of Data. NOTES: ‡The overall means for always-SWD-accountable schools and never-SWD-accountable schools in 7 states are the means across schools in the sample states from which both types of schools were sampled. The overall mean for always-SWD-accountable schools in 4 states is the mean across schools in the remaining sampled states. “---” indicates that survey data were not gathered for that analysis. Differences that are statistically significant at the .05 level, two-tailed, are indicated by an asterisk (*).
93

School Practices and Accountability for Students With Disabilities
Exhibit D-10. Percentage of Urban Middle Schools 2010–11, by SWD-Accountability Status Between 2005–06 and 2007–08
State Always-SWD-Acct Schools: Sample size
Always-SWD-Acct Schools:
Mean (Percent)
Always-SWD-Acct Schools:
SE
Never-SWD-Acct Schools: Sample size
Never-SWD-Acct
Schools: Mean
(Percent)
Never-SWD-Acct Schools:
SE Difference Difference:
SE Difference:
p value
California 186 56.5 3.6 312 29.2 2.6 27.3* 4.5 0.000 Florida 106 33.0 4.6 16 18.8 10.1 14.3 10.9 0.192 Georgia 193 7.8 1.9 54 33.3 6.5 -25.6* 6.7 0.000 North Carolina 34 23.5 7.4 18 5.6 5.6 18.0 9.2 0.057 Wisconsin 118 33.1 4.3 77 1.3 1.3 31.7* 4.5 0.000
Overall (5 states)‡ 637 31.7 1.8 477 24.7 2.0 7.0* 2.7 0.010
Iowa 85 32.9 5.1 --- --- --- --- --- --- Maryland 150 11.5 3.0 --- --- --- --- --- --- Massachusetts 162 22.2 3.3 --- --- --- --- --- ---
Overall (3 states) 397 20.1 2.1 --- --- --- --- --- ---
SOURCE: 2010–11 Common Core of Data. NOTES: ‡The overall means for always-SWD-accountable schools and never-SWD-accountable schools in 5 states are the means across schools in the sample states from which both types of schools were sampled. The overall mean for always-SWD-accountable schools in 3 states is the mean across schools in the remaining sampled states. “---” indicates that survey data were not gathered for that analysis. Differences that are statistically significant at the .05 level, two-tailed, are indicated by an asterisk (*).
94

School Practices and Accountability for Students With Disabilities
Exhibit D-11. Percentage of Suburban Elementary Schools in 2010–11, by SWD-Accountability Status Between 2005–06 and 2007–08
State Always-SWD-Acct Schools: Sample size
Always-SWD-Acct Schools:
Mean (Percent)
Always-SWD-Acct Schools:
SE
Never-SWD-Acct Schools: Sample size
Never-SWD-Acct
Schools: Mean
(Percent)
Never-SWD-Acct Schools:
SE Difference Difference:
SE Difference:
p value
California 104 49.0 4.9 331 42.0 2.7 7.0 5.6 0.210 Florida 435 42.5 2.4 154 52.6 4.0 -10.1* 4.7 0.032 Georgia 237 49.4 3.3 328 30.8 2.6 18.6* 4.1 0.000 Massachusetts 62 77.4 5.4 323 51.1 2.8 26.3* 6.0 0.000 Minnesota 149 30.9 3.8 44 4.5 3.2 26.3* 4.9 0.000 North Carolina 78 16.7 4.2 249 8.8 1.8 7.8 4.6 0.090
Virginia 34 44.1 8.6 174 17.8 2.9 26.3* 9.0 0.004
Overall (7 states)‡ 1,099 43.2 1.5 1,603 37.2 1.8 6.0* 2.3 0.010
Iowa 54 5.6 3.1 --- --- --- --- --- --- Kansas 51 13.7 4.9 --- --- --- --- --- --- Maryland 676 61.2 1.9 --- --- --- --- --- --- North Dakota 70 5.7 2.8 --- --- --- --- --- ---
Overall (4 states) 851 50.9 1.8 --- --- --- --- --- ---
SOURCE: 2010–11 Common Core of Data. NOTES: ‡The overall means for always-SWD-accountable schools and never-SWD-accountable schools in 7 states are the means across schools in the sample states from which both types of schools were sampled. The overall mean for always-SWD-accountable schools in 4 states is the mean across schools in the remaining sampled states. “---” indicates that survey data were not gathered for that analysis. Differences that are statistically significant at the .05 level, two-tailed, are indicated by an asterisk (*).
95
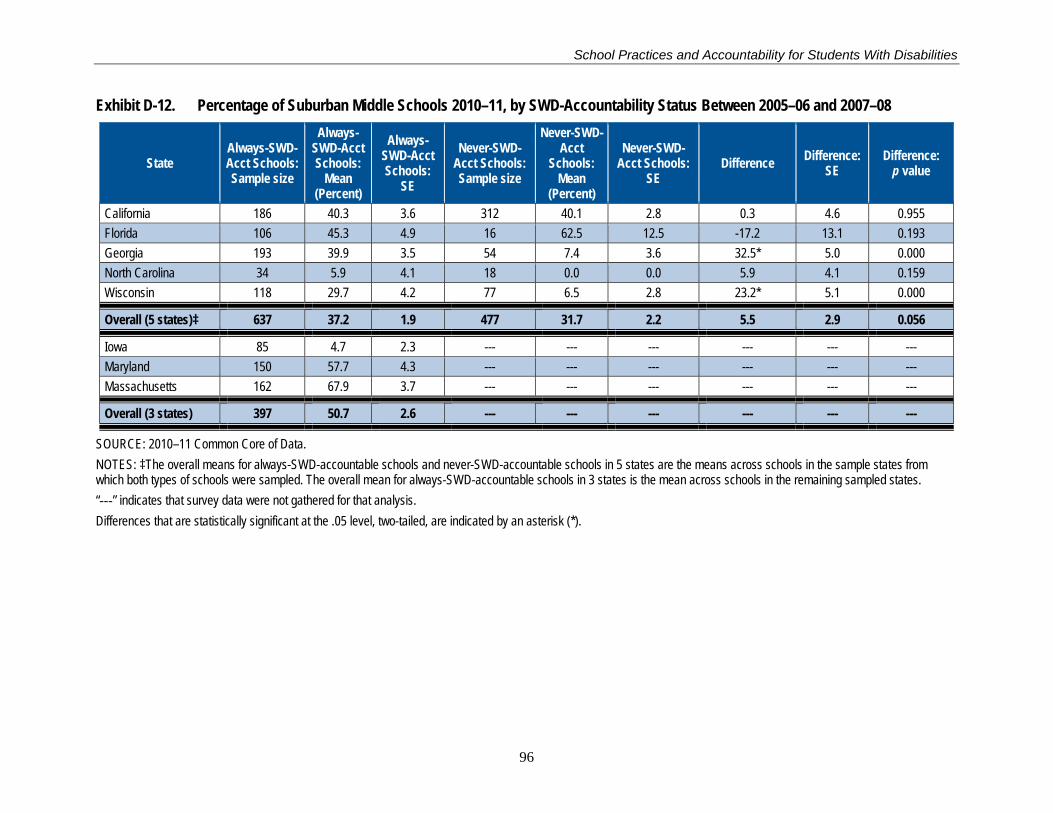
School Practices and Accountability for Students With Disabilities
Exhibit D-12. Percentage of Suburban Middle Schools 2010–11, by SWD-Accountability Status Between 2005–06 and 2007–08
State Always-SWD-Acct Schools: Sample size
Always-SWD-Acct Schools:
Mean (Percent)
Always-SWD-Acct Schools:
SE
Never-SWD-Acct Schools: Sample size
Never-SWD-Acct
Schools: Mean
(Percent)
Never-SWD-Acct Schools:
SE Difference Difference:
SE Difference:
p value
California 186 40.3 3.6 312 40.1 2.8 0.3 4.6 0.955 Florida 106 45.3 4.9 16 62.5 12.5 -17.2 13.1 0.193 Georgia 193 39.9 3.5 54 7.4 3.6 32.5* 5.0 0.000 North Carolina 34 5.9 4.1 18 0.0 0.0 5.9 4.1 0.159 Wisconsin 118 29.7 4.2 77 6.5 2.8 23.2* 5.1 0.000
Overall (5 states)‡ 637 37.2 1.9 477 31.7 2.2 5.5 2.9 0.056
Iowa 85 4.7 2.3 --- --- --- --- --- --- Maryland 150 57.7 4.3 --- --- --- --- --- --- Massachusetts 162 67.9 3.7 --- --- --- --- --- ---
Overall (3 states) 397 50.7 2.6 --- --- --- --- --- ---
SOURCE: 2010–11 Common Core of Data. NOTES: ‡The overall means for always-SWD-accountable schools and never-SWD-accountable schools in 5 states are the means across schools in the sample states from which both types of schools were sampled. The overall mean for always-SWD-accountable schools in 3 states is the mean across schools in the remaining sampled states. “---” indicates that survey data were not gathered for that analysis. Differences that are statistically significant at the .05 level, two-tailed, are indicated by an asterisk (*).
96

School Practices and Accountability for Students With Disabilities
Exhibit D-13. Percentage of Elementary Schools in Towns in 2010–11, by SWD-Accountability Status Between 2005–06 and 2007–08
State Always-SWD-Acct Schools: Sample size
Always-SWD-Acct Schools:
Mean (Percent)
Always-SWD-Acct Schools:
SE
Never-SWD-Acct Schools: Sample size
Never-SWD-Acct
Schools: Mean
(Percent)
Never-SWD-Acct Schools:
SE Difference Difference:
SE Difference:
p value
California 104 1.0 1.0 331 3.3 1.0 -2.3 1.4 0.087 Florida 435 8.5 1.3 154 5.2 1.8 3.3 2.2 0.139 Georgia 237 11.4 2.1 328 8.5 1.5 2.9 2.6 0.269 Massachusetts 62 0.0 0.0 323 2.8 0.9 -2.8* 0.9 0.003 Minnesota 149 28.9 3.7 44 2.3 2.3 26.6* 4.4 0.000 North Carolina 78 16.7 4.2 249 13.3 2.2 3.4 4.7 0.473
Virginia 34 5.9 4.1 174 9.8 2.3 -3.9 4.6 0.403
Overall (7 states)‡ 1,099 11.2 1.0 1,603 5.1 0.7 6.0* 1.2 0.000
Iowa 54 37.0 6.6 --- --- --- --- --- --- Kansas 51 37.3 6.8 --- --- --- --- --- --- Maryland 676 3.6 0.7 --- --- --- --- --- --- North Dakota 70 20.0 4.8 --- --- --- --- --- ---
Overall (4 states) 851 8.7 0.9 --- --- --- --- --- ---
SOURCE: 2010–11 Common Core of Data. NOTES: ‡The overall means for always-SWD-accountable schools and never-SWD-accountable schools in 7 states are the means across schools in the sample states from which both types of schools were sampled. The overall mean for always-SWD-accountable schools in 4 states is the mean across schools in the remaining sampled states. “---” indicates that survey data were not gathered for that analysis. Differences that are statistically significant at the .05 level, two-tailed, are indicated by an asterisk (*).
97

School Practices and Accountability for Students With Disabilities
Exhibit D-14. Percentage of Middle Schools in Towns in 2010–11, by SWD-Accountability Status Between 2005–06 and 2007–08
State Always-SWD-Acct Schools: Sample size
Always-SWD-Acct Schools:
Mean (Percent)
Always-SWD-Acct Schools:
SE
Never-SWD-Acct Schools: Sample size
Never-SWD-Acct
Schools: Mean
(Percent)
Never-SWD-Acct Schools:
SE Difference Difference:
SE Difference:
p value
California 186 1.6 0.9 312 16.7 2.1 -15.1* 2.3 0.000 Florida 106 6.6 2.4 16 6.3 6.3 0.4 6.6 0.957 Georgia 193 10.9 2.2 54 22.2 5.7 -11.3 6.1 0.065 North Carolina 34 17.6 6.6 18 0.0 0.0 17.6* 6.7 0.011 Wisconsin 118 28.8 4.2 77 18.2 4.4 10.6 6.1 0.082
Overall (5 states)‡ 637 11.1 1.2 477 16.6 1.7 -5.4* 2.1 0.011
Iowa 85 32.9 5.1 --- --- --- --- --- --- Maryland 150 9.8 2.5 --- --- --- --- --- --- Massachusetts 162 0.6 0.6 --- --- --- --- --- ---
Overall (3 states) 397 11.0 1.6 --- --- --- --- --- ---
SOURCE: 2010–11 Common Core of Data. NOTES: ‡The overall means for always-SWD-accountable schools and never-SWD-accountable schools in 5 states are the means across schools in the sample states from which both types of schools were sampled. The overall mean for always-SWD-accountable schools in 3 states is the mean across schools in the remaining sampled states. “---” indicates that survey data were not gathered for that analysis. Differences that are statistically significant at the .05 level, two-tailed, are indicated by an asterisk (*).
98
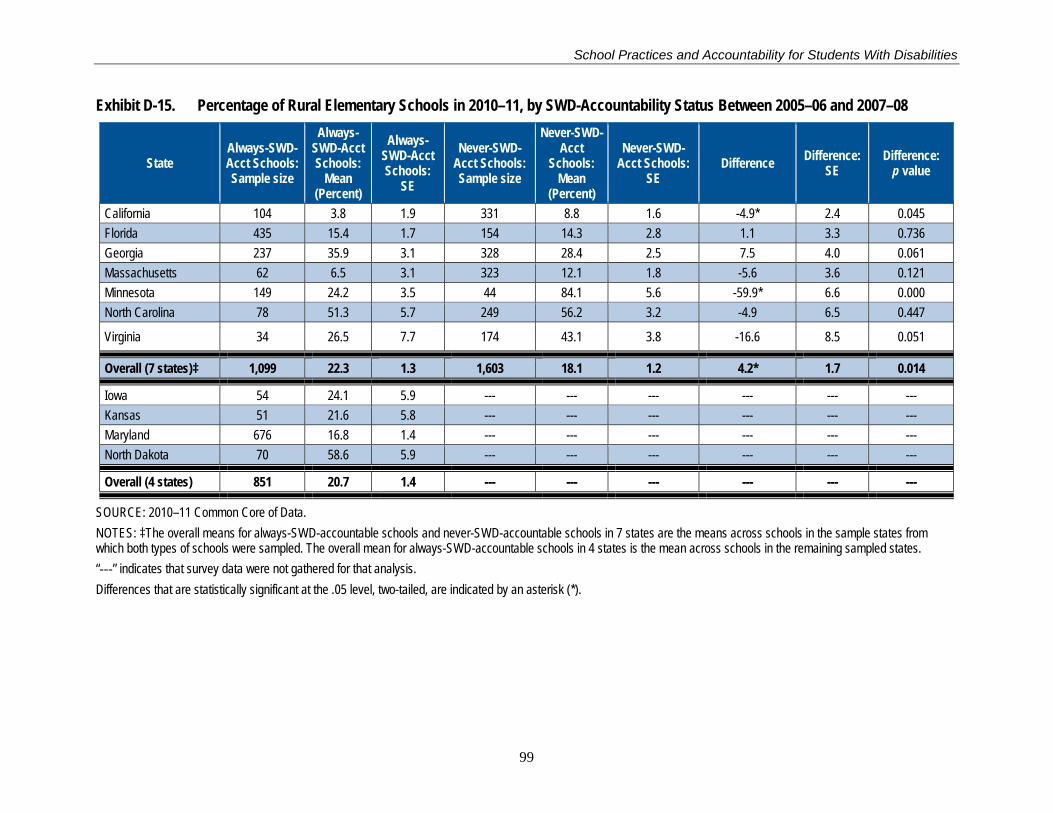
School Practices and Accountability for Students With Disabilities
Exhibit D-15. Percentage of Rural Elementary Schools in 2010–11, by SWD-Accountability Status Between 2005–06 and 2007–08
State Always-SWD-Acct Schools: Sample size
Always-SWD-Acct Schools:
Mean (Percent)
Always-SWD-Acct Schools:
SE
Never-SWD-Acct Schools: Sample size
Never-SWD-Acct
Schools: Mean
(Percent)
Never-SWD-Acct Schools:
SE Difference Difference:
SE Difference:
p value
California 104 3.8 1.9 331 8.8 1.6 -4.9* 2.4 0.045 Florida 435 15.4 1.7 154 14.3 2.8 1.1 3.3 0.736 Georgia 237 35.9 3.1 328 28.4 2.5 7.5 4.0 0.061 Massachusetts 62 6.5 3.1 323 12.1 1.8 -5.6 3.6 0.121 Minnesota 149 24.2 3.5 44 84.1 5.6 -59.9* 6.6 0.000 North Carolina 78 51.3 5.7 249 56.2 3.2 -4.9 6.5 0.447
Virginia 34 26.5 7.7 174 43.1 3.8 -16.6 8.5 0.051
Overall (7 states)‡ 1,099 22.3 1.3 1,603 18.1 1.2 4.2* 1.7 0.014
Iowa 54 24.1 5.9 --- --- --- --- --- --- Kansas 51 21.6 5.8 --- --- --- --- --- --- Maryland 676 16.8 1.4 --- --- --- --- --- --- North Dakota 70 58.6 5.9 --- --- --- --- --- ---
Overall (4 states) 851 20.7 1.4 --- --- --- --- --- ---
SOURCE: 2010–11 Common Core of Data. NOTES: ‡The overall means for always-SWD-accountable schools and never-SWD-accountable schools in 7 states are the means across schools in the sample states from which both types of schools were sampled. The overall mean for always-SWD-accountable schools in 4 states is the mean across schools in the remaining sampled states. “---” indicates that survey data were not gathered for that analysis. Differences that are statistically significant at the .05 level, two-tailed, are indicated by an asterisk (*).
99
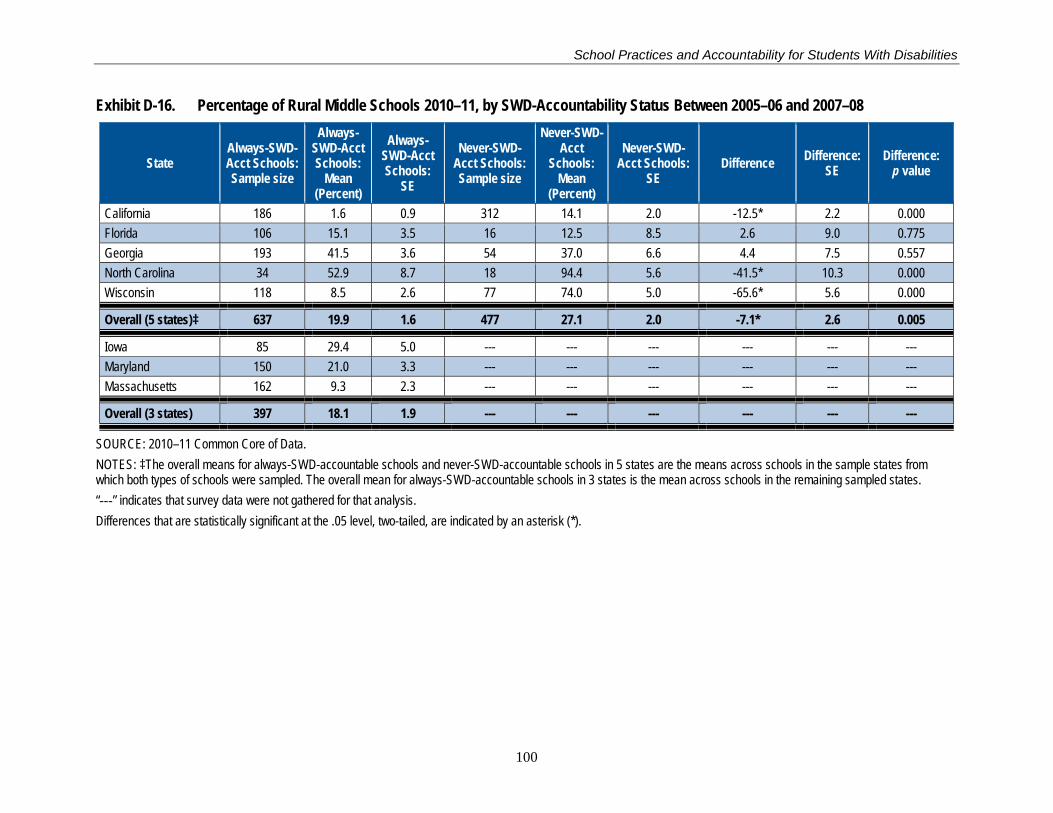
School Practices and Accountability for Students With Disabilities
Exhibit D-16. Percentage of Rural Middle Schools 2010–11, by SWD-Accountability Status Between 2005–06 and 2007–08
State Always-SWD-Acct Schools: Sample size
Always-SWD-Acct Schools:
Mean (Percent)
Always-SWD-Acct Schools:
SE
Never-SWD-Acct Schools: Sample size
Never-SWD-Acct
Schools: Mean
(Percent)
Never-SWD-Acct Schools:
SE Difference Difference:
SE Difference:
p value
California 186 1.6 0.9 312 14.1 2.0 -12.5* 2.2 0.000 Florida 106 15.1 3.5 16 12.5 8.5 2.6 9.0 0.775 Georgia 193 41.5 3.6 54 37.0 6.6 4.4 7.5 0.557 North Carolina 34 52.9 8.7 18 94.4 5.6 -41.5* 10.3 0.000 Wisconsin 118 8.5 2.6 77 74.0 5.0 -65.6* 5.6 0.000
Overall (5 states)‡ 637 19.9 1.6 477 27.1 2.0 -7.1* 2.6 0.005
Iowa 85 29.4 5.0 --- --- --- --- --- --- Maryland 150 21.0 3.3 --- --- --- --- --- --- Massachusetts 162 9.3 2.3 --- --- --- --- --- ---
Overall (3 states) 397 18.1 1.9 --- --- --- --- --- ---
SOURCE: 2010–11 Common Core of Data. NOTES: ‡The overall means for always-SWD-accountable schools and never-SWD-accountable schools in 5 states are the means across schools in the sample states from which both types of schools were sampled. The overall mean for always-SWD-accountable schools in 3 states is the mean across schools in the remaining sampled states. “---” indicates that survey data were not gathered for that analysis. Differences that are statistically significant at the .05 level, two-tailed, are indicated by an asterisk (*).
100
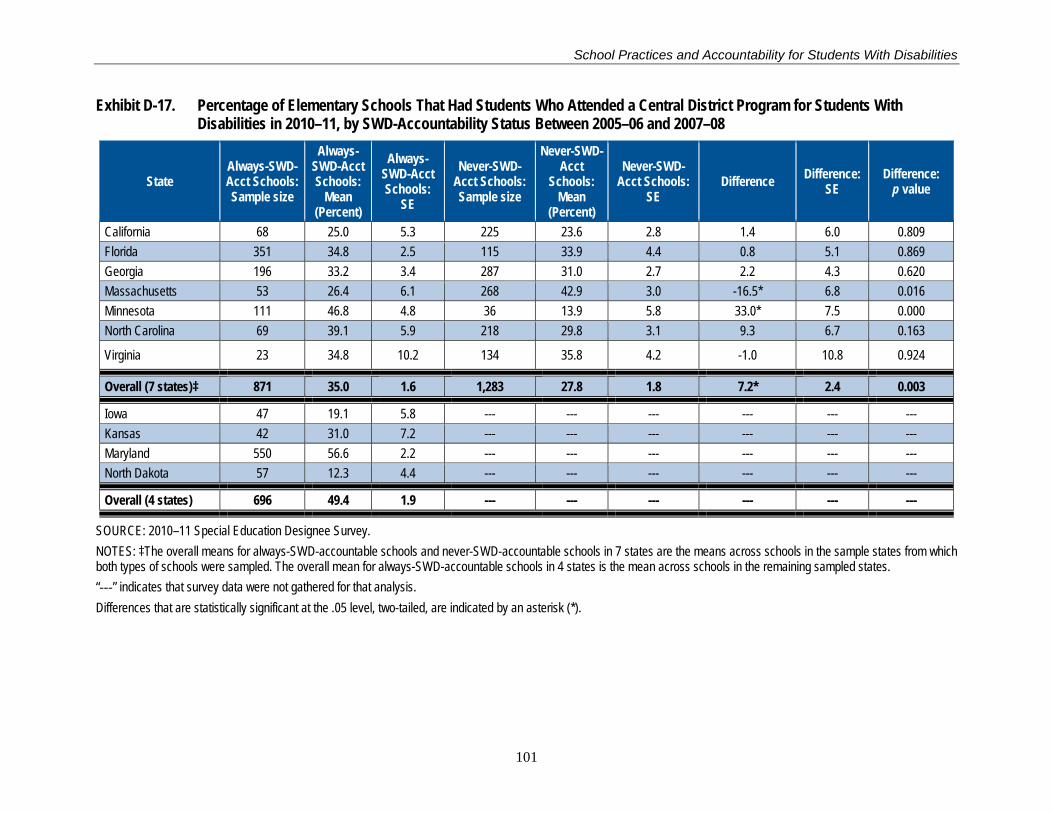
School Practices and Accountability for Students With Disabilities
Exhibit D-17. Percentage of Elementary Schools That Had Students Who Attended a Central District Program for Students With Disabilities in 2010–11, by SWD-Accountability Status Between 2005–06 and 2007–08
State Always-SWD-Acct Schools: Sample size
Always-SWD-Acct Schools:
Mean (Percent)
Always-SWD-Acct Schools:
SE
Never-SWD-Acct Schools: Sample size
Never-SWD-Acct
Schools: Mean
(Percent)
Never-SWD-Acct Schools:
SE Difference Difference:
SE Difference:
p value
California 68 25.0 5.3 225 23.6 2.8 1.4 6.0 0.809 Florida 351 34.8 2.5 115 33.9 4.4 0.8 5.1 0.869 Georgia 196 33.2 3.4 287 31.0 2.7 2.2 4.3 0.620 Massachusetts 53 26.4 6.1 268 42.9 3.0 -16.5* 6.8 0.016 Minnesota 111 46.8 4.8 36 13.9 5.8 33.0* 7.5 0.000 North Carolina 69 39.1 5.9 218 29.8 3.1 9.3 6.7 0.163
Virginia 23 34.8 10.2 134 35.8 4.2 -1.0 10.8 0.924
Overall (7 states)‡ 871 35.0 1.6 1,283 27.8 1.8 7.2* 2.4 0.003
Iowa 47 19.1 5.8 --- --- --- --- --- --- Kansas 42 31.0 7.2 --- --- --- --- --- --- Maryland 550 56.6 2.2 --- --- --- --- --- --- North Dakota 57 12.3 4.4 --- --- --- --- --- ---
Overall (4 states) 696 49.4 1.9 --- --- --- --- --- ---
SOURCE: 2010–11 Special Education Designee Survey. NOTES: ‡The overall means for always-SWD-accountable schools and never-SWD-accountable schools in 7 states are the means across schools in the sample states from which both types of schools were sampled. The overall mean for always-SWD-accountable schools in 4 states is the mean across schools in the remaining sampled states. “---” indicates that survey data were not gathered for that analysis. Differences that are statistically significant at the .05 level, two-tailed, are indicated by an asterisk (*).
101
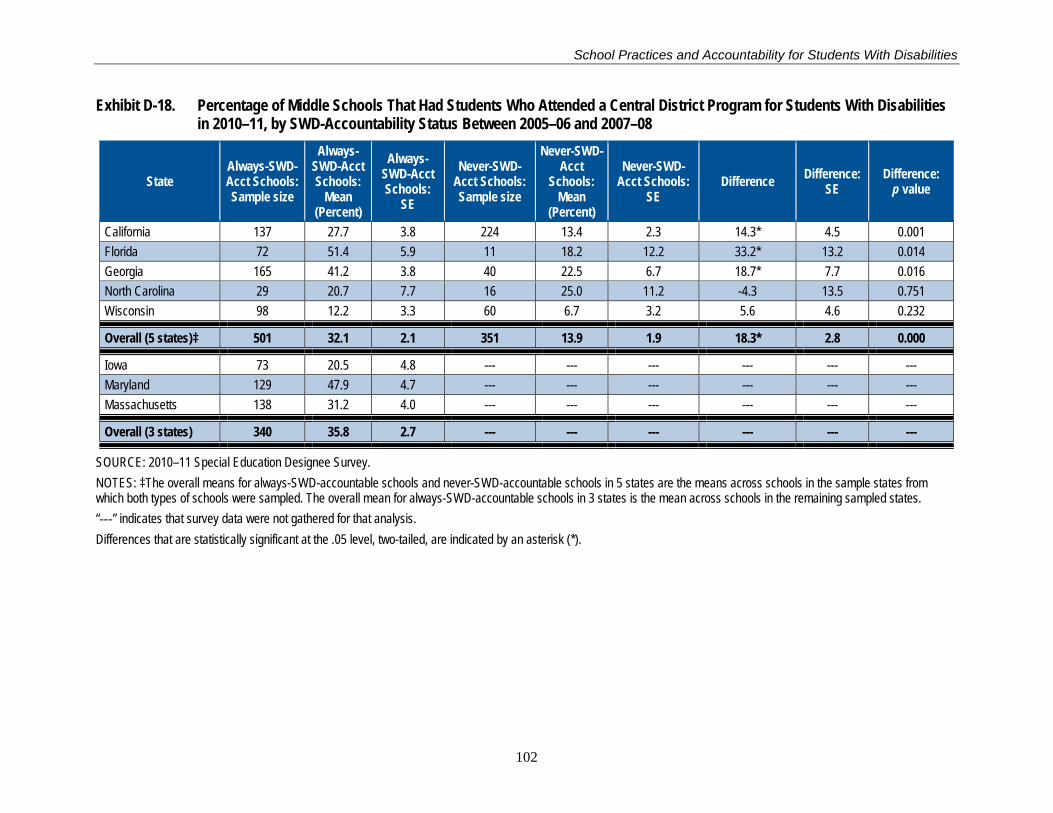
School Practices and Accountability for Students With Disabilities
Exhibit D-18. Percentage of Middle Schools That Had Students Who Attended a Central District Program for Students With Disabilities in 2010–11, by SWD-Accountability Status Between 2005–06 and 2007–08
State Always-SWD-Acct Schools: Sample size
Always-SWD-Acct Schools:
Mean (Percent)
Always-SWD-Acct Schools:
SE
Never-SWD-Acct Schools: Sample size
Never-SWD-Acct
Schools: Mean
(Percent)
Never-SWD-Acct Schools:
SE Difference Difference:
SE Difference:
p value
California 137 27.7 3.8 224 13.4 2.3 14.3* 4.5 0.001 Florida 72 51.4 5.9 11 18.2 12.2 33.2* 13.2 0.014 Georgia 165 41.2 3.8 40 22.5 6.7 18.7* 7.7 0.016 North Carolina 29 20.7 7.7 16 25.0 11.2 -4.3 13.5 0.751 Wisconsin 98 12.2 3.3 60 6.7 3.2 5.6 4.6 0.232
Overall (5 states)‡ 501 32.1 2.1 351 13.9 1.9 18.3* 2.8 0.000
Iowa 73 20.5 4.8 --- --- --- --- --- --- Maryland 129 47.9 4.7 --- --- --- --- --- --- Massachusetts 138 31.2 4.0 --- --- --- --- --- ---
Overall (3 states) 340 35.8 2.7 --- --- --- --- --- ---
SOURCE: 2010–11 Special Education Designee Survey. NOTES: ‡The overall means for always-SWD-accountable schools and never-SWD-accountable schools in 5 states are the means across schools in the sample states from which both types of schools were sampled. The overall mean for always-SWD-accountable schools in 3 states is the mean across schools in the remaining sampled states. “---” indicates that survey data were not gathered for that analysis. Differences that are statistically significant at the .05 level, two-tailed, are indicated by an asterisk (*).
102

School Practices and Accountability for Students With Disabilities
Exhibit D-19. Percentage of Elementary Schools That Housed a Central District Program for Students With Disabilities in 2010–11, by SWD-Accountability Status Between 2005–06 and 2007–08
State Always-SWD-Acct Schools: Sample size
Always-SWD-Acct Schools:
Mean (Percent)
Always-SWD-Acct Schools:
SE
Never-SWD-Acct Schools: Sample size
Never-SWD-Acct
Schools: Mean
(Percent)
Never-SWD-Acct Schools:
SE Difference Difference:
SE Difference:
p value
California 68 30.9 5.6 226 18.1 2.6 12.7* 6.2 0.040 Florida 352 29.8 2.4 116 24.1 4.0 5.7 4.7 0.224 Georgia 196 23.0 3.0 287 18.5 2.3 4.5 3.8 0.236 Massachusetts 53 28.3 6.2 268 31.3 2.8 -3.0 6.8 0.656 Minnesota 111 34.2 4.5 36 11.1 5.3 23.1* 7.0 0.001 North Carolina 69 26.1 5.3 219 18.3 2.6 7.7 5.9 0.192 Virginia 23 30.4 9.8 134 23.1 3.7 7.3 10.3 0.481
Overall (7 states)‡ 872 28.6 1.5 1,285 19.8 1.6 8.8* 2.2 0.000
Iowa 47 23.4 6.2 --- --- --- --- --- --- Kansas 42 14.3 5.5 --- --- --- --- --- --- Maryland 550 28.2 2.0 --- --- --- --- --- --- North Dakota 57 7.0 3.4 --- --- --- --- --- ---
Overall (4 states) 696 25.5 1.7 --- --- --- --- --- ---
SOURCE: 2010–11 Special Education Designee Survey. NOTES: ‡The overall means for always-SWD-accountable schools and never-SWD-accountable schools in 7 states are the means across schools in the sample states from which both types of schools were sampled. The overall mean for always-SWD-accountable schools in 4 states is the mean across schools in the remaining sampled states. “---” indicates that survey data were not gathered for that analysis. Differences that are statistically significant at the .05 level, two-tailed, are indicated by an asterisk (*).
103
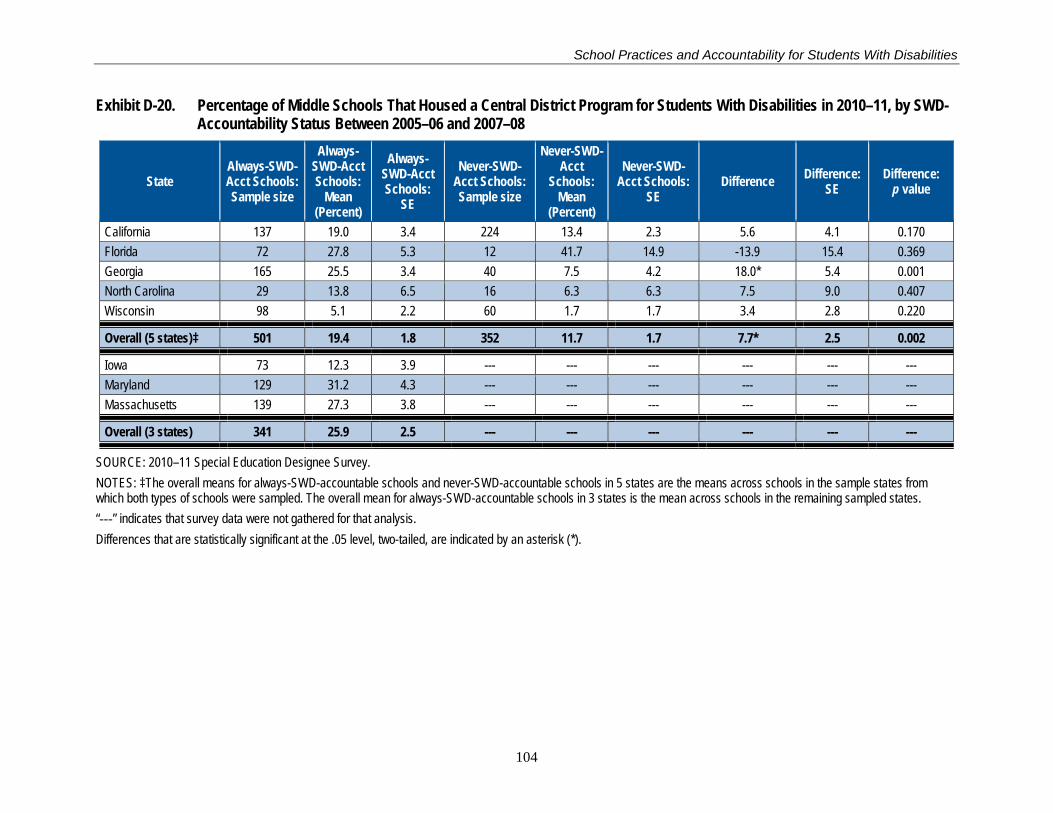
School Practices and Accountability for Students With Disabilities
Exhibit D-20. Percentage of Middle Schools That Housed a Central District Program for Students With Disabilities in 2010–11, by SWD-Accountability Status Between 2005–06 and 2007–08
State Always-SWD-Acct Schools: Sample size
Always-SWD-Acct Schools:
Mean (Percent)
Always-SWD-Acct Schools:
SE
Never-SWD-Acct Schools: Sample size
Never-SWD-Acct
Schools: Mean
(Percent)
Never-SWD-Acct Schools:
SE Difference Difference:
SE Difference:
p value
California 137 19.0 3.4 224 13.4 2.3 5.6 4.1 0.170 Florida 72 27.8 5.3 12 41.7 14.9 -13.9 15.4 0.369 Georgia 165 25.5 3.4 40 7.5 4.2 18.0* 5.4 0.001 North Carolina 29 13.8 6.5 16 6.3 6.3 7.5 9.0 0.407 Wisconsin 98 5.1 2.2 60 1.7 1.7 3.4 2.8 0.220
Overall (5 states)‡ 501 19.4 1.8 352 11.7 1.7 7.7* 2.5 0.002
Iowa 73 12.3 3.9 --- --- --- --- --- --- Maryland 129 31.2 4.3 --- --- --- --- --- --- Massachusetts 139 27.3 3.8 --- --- --- --- --- ---
Overall (3 states) 341 25.9 2.5 --- --- --- --- --- ---
SOURCE: 2010–11 Special Education Designee Survey. NOTES: ‡The overall means for always-SWD-accountable schools and never-SWD-accountable schools in 5 states are the means across schools in the sample states from which both types of schools were sampled. The overall mean for always-SWD-accountable schools in 3 states is the mean across schools in the remaining sampled states. “---” indicates that survey data were not gathered for that analysis. Differences that are statistically significant at the .05 level, two-tailed, are indicated by an asterisk (*).
104

School Practices and Accountability for Students With Disabilities
Exhibit D-21. Number of Special Education Teachers per 100 Students With Disabilities in Elementary Schools in 2010–11, by SWD-Accountability Status Between 2005–06 and 2007–08
State Always-SWD-Acct Schools: Sample size
Always-SWD-Acct Schools:
Mean (Percent)
Always-SWD-Acct Schools:
SE
Never-SWD-Acct Schools: Sample size
Never-SWD-Acct
Schools: Mean
(Percent)
Never-SWD-Acct Schools:
SE Difference Difference:
SE Difference:
p value
California 66 5.8 0.3 217 5.0 0.2 0.8* 0.3 0.018 Florida 344 7.1 0.2 114 8.4 1.1 -1.2 1.1 0.261 Georgia 195 9.1 0.3 273 9.3 0.3 -0.2 0.4 0.636 Massachusetts 51 8.4 0.7 257 7.9 0.3 0.5 0.7 0.534 Minnesota 102 6.5 0.3 33 8.5 0.9 -2.0* 1.0 0.041 North Carolina 70 5.4 0.3 215 5.9 0.2 -0.5 0.3 0.121
Virginia 22 11.1 2.2 129 9.5 0.4 1.6 2.2 0.455
Overall (7 states)‡ 850 7.4 0.2 1,238 6.3 0.2 1.1* 0.2 0.000
Iowa 47 9.8 0.7 --- --- --- --- --- --- Kansas 42 7.2 0.5 --- --- --- --- --- --- Maryland 540 8.4 0.2 --- --- --- --- --- --- North Dakota 56 7.7 0.7 --- --- --- --- --- ---
Overall (4 states) 685 8.4 0.2 --- --- --- --- --- ---
SOURCE: 2010–11 Principal Survey. NOTES: ‡The overall means for always-SWD-accountable schools and never-SWD-accountable schools in 7 states are the means across schools in the sample states from which both types of schools were sampled. The overall mean for always-SWD-accountable schools in 4 states is the mean across schools in the remaining sampled states. “---” indicates that survey data were not gathered for that analysis. Differences that are statistically significant at the .05 level, two-tailed, are indicated by an asterisk (*).
105

School Practices and Accountability for Students With Disabilities
Exhibit D-22. Number of Special Education Teachers per 100 Students With Disabilities in Middle Schools 2010–11, by SWD-Accountability Status Between 2005–06 and 2007–08
State Always-SWD-Acct Schools: Sample size
Always-SWD-Acct Schools:
Mean (Percent)
Always-SWD-Acct Schools:
SE
Never-SWD-Acct Schools: Sample size
Never-SWD-Acct
Schools: Mean
(Percent)
Never-SWD-Acct Schools:
SE Difference Difference:
SE Difference:
p value
California 132 5.4 0.1 215 5.4 0.1 0.0 0.2 0.817 Florida 70 6.2 0.8 12 5.9 1.2 0.3 1.4 0.826 Georgia 162 10.3 0.2 40 9.2 0.5 1.1 0.6 0.058 North Carolina 29 6.5 0.4 15 7.1 0.5 -0.6 0.7 0.411 Wisconsin 91 8.1 0.3 47 7.1 1.1 1.1 1.1 0.352
Overall (5 states)‡ 484 7.7 0.2 329 6.1 0.2 1.6* 0.3 0.000
Iowa 68 8.7 0.3 --- --- --- --- --- --- Maryland 127 9.5 0.3 --- --- --- --- --- --- Massachusetts 131 7.9 0.3 --- --- --- --- --- ---
Overall (3 states) 326 8.7 0.2 --- --- --- --- --- ---
SOURCE: 2010–11 Principal Survey. NOTES: ‡The overall means for always-SWD-accountable schools and never-SWD-accountable schools in 5 states are the means across schools in the sample states from which both types of schools were sampled. The overall mean for always-SWD-accountable schools in 3 states is the mean across schools in the remaining sampled states. “---” indicates that survey data were not gathered for that analysis. Differences that are statistically significant at the .05 level, two-tailed, are indicated by an asterisk (*).
106

School Practices and Accountability for Students With Disabilities
Exhibit D-23. Number of Regular Education Teachers per 100 Students With Disabilities in Elementary Schools in 2010–11, by SWD-Accountability Status Between 2005–06 and 2007–08
State Always-SWD-Acct Schools: Sample size
Always-SWD-Acct Schools:
Mean (Percent)
Always-SWD-Acct Schools:
SE
Never-SWD-Acct Schools: Sample size
Never-SWD-Acct
Schools: Mean
(Percent)
Never-SWD-Acct Schools:
SE Difference Difference:
SE Difference:
p value
California 66 26.6 1.4 217 49.7 1.6 -23.0* 2.2 0.000 Florida 344 40.2 1.0 114 70.6 3.5 -30.4* 3.6 0.000 Georgia 195 46.7 1.4 273 76.0 2.5 -29.3* 2.9 0.000 Massachusetts 51 30.0 2.7 256 38.2 1.1 -8.3* 2.9 0.004 Minnesota 102 31.6 1.3 33 54.6 7.0 -23.0* 7.1 0.002 North Carolina 70 38.5 1.7 215 49.5 1.6 -11.0* 2.3 0.000
Virginia 21 47.9 9.0 129 60.3 3.8 -12.5 9.7 0.200
Overall (7 states)‡ 849 39.0 0.7 1,237 53.6 1.1 -14.6* 1.3 0.000
Iowa 47 38.5 2.8 --- --- --- --- --- --- Kansas 42 45.1 4.2 --- --- --- --- --- --- Maryland 540 51.7 1.3 --- --- --- --- --- --- North Dakota 56 42.9 3.1 --- --- --- --- --- ---
Overall (4 states) 685 49.8 1.1 --- --- --- --- --- ---
SOURCE: 2010–11 Principal Survey. NOTES: ‡The overall means for always-SWD-accountable schools and never-SWD-accountable schools in 7 states are the means across schools in the sample states from which both types of schools were sampled. The overall mean for always-SWD-accountable schools in 4 states is the mean across schools in the remaining sampled states. “---” indicates that survey data were not gathered for that analysis. Differences that are statistically significant at the .05 level, two-tailed, are indicated by an asterisk (*).
107

School Practices and Accountability for Students With Disabilities
Exhibit D-24. Number of Regular Education Teachers per 100 Students With Disabilities in Middle Schools in 2010–11, by SWD-Accountability Status Between 2005–06 and 2007–08
State Always-SWD-Acct Schools: Sample size
Always-SWD-Acct Schools:
Mean (Percent)
Always-SWD-Acct Schools:
SE
Never-SWD-Acct Schools: Sample size
Never-SWD-Acct
Schools: Mean
(Percent)
Never-SWD-Acct Schools:
SE Difference Difference:
SE Difference:
p value
California 132 33.3 1.0 215 42.4 1.4 -9.1* 1.8 0.000 Florida 70 31.8 1.7 12 68.2 8.1 -36.4* 8.0 0.000 Georgia 162 44.6 1.4 40 59.3 4.3 -14.7* 4.5 0.001 North Carolina 28 42.3 3.2 15 60.4 5.8 -18.1* 6.6 0.009 Wisconsin 91 37.8 1.9 47 51.1 8.4 -13.2 8.6 0.124
Overall (5 states)‡ 483 38.3 0.8 329 46.7 1.6 -8.5* 1.7 0.000
Iowa 68 39.7 2.2 --- --- --- --- --- --- Maryland 127 61.5 2.7 --- --- --- --- --- --- Massachusetts 130 34.9 1.3 --- --- --- --- --- ---
Overall (3 states) 325 47.0 1.5 --- --- --- --- --- ---
SOURCE: 2010–11 Principal Survey. NOTES: ‡The overall means for always-SWD-accountable schools and never-SWD-accountable schools in 5 states are the means across schools in the sample states from which both types of schools were sampled. The overall mean for always-SWD-accountable schools in 3 states is the mean across schools in the remaining sampled states. “---” indicates that survey data were not gathered for that analysis. Differences that are statistically significant at the .05 level, two-tailed, are indicated by an asterisk (*).
108
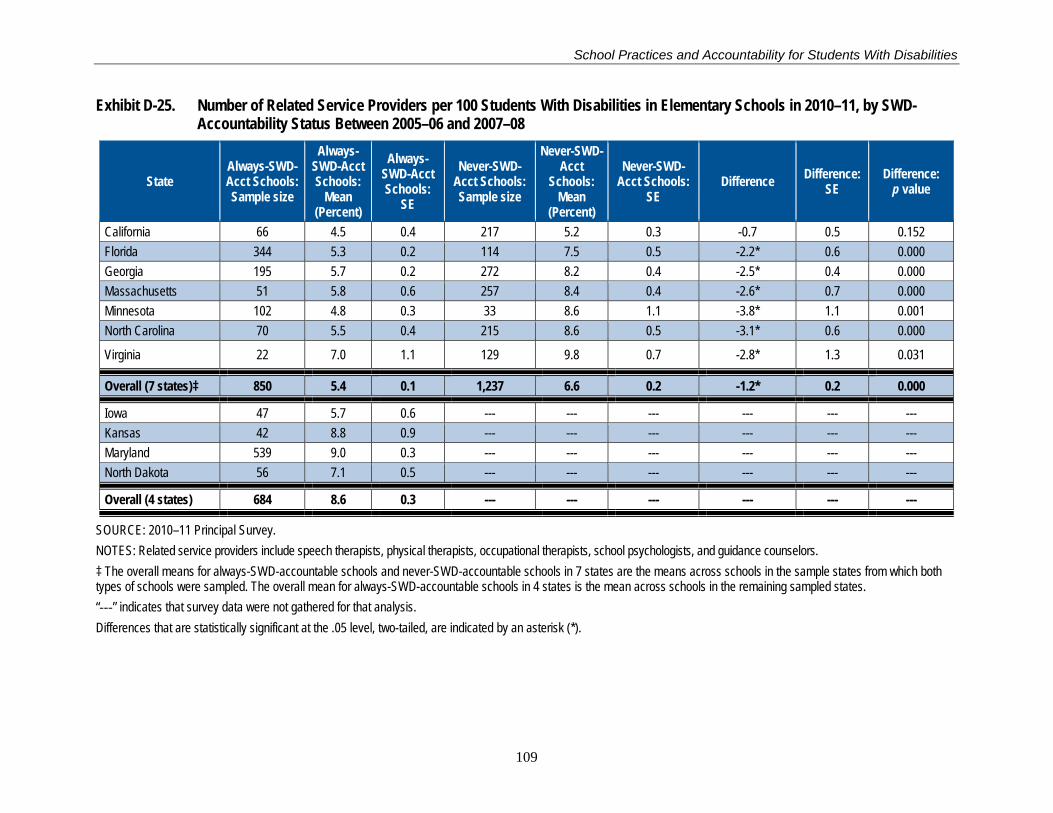
School Practices and Accountability for Students With Disabilities
Exhibit D-25. Number of Related Service Providers per 100 Students With Disabilities in Elementary Schools in 2010–11, by SWD-Accountability Status Between 2005–06 and 2007–08
State Always-SWD-Acct Schools: Sample size
Always-SWD-Acct Schools:
Mean (Percent)
Always-SWD-Acct Schools:
SE
Never-SWD-Acct Schools: Sample size
Never-SWD-Acct
Schools: Mean
(Percent)
Never-SWD-Acct Schools:
SE Difference Difference:
SE Difference:
p value
California 66 4.5 0.4 217 5.2 0.3 -0.7 0.5 0.152 Florida 344 5.3 0.2 114 7.5 0.5 -2.2* 0.6 0.000 Georgia 195 5.7 0.2 272 8.2 0.4 -2.5* 0.4 0.000 Massachusetts 51 5.8 0.6 257 8.4 0.4 -2.6* 0.7 0.000 Minnesota 102 4.8 0.3 33 8.6 1.1 -3.8* 1.1 0.001 North Carolina 70 5.5 0.4 215 8.6 0.5 -3.1* 0.6 0.000
Virginia 22 7.0 1.1 129 9.8 0.7 -2.8* 1.3 0.031
Overall (7 states)‡ 850 5.4 0.1 1,237 6.6 0.2 -1.2* 0.2 0.000
Iowa 47 5.7 0.6 --- --- --- --- --- --- Kansas 42 8.8 0.9 --- --- --- --- --- --- Maryland 539 9.0 0.3 --- --- --- --- --- --- North Dakota 56 7.1 0.5 --- --- --- --- --- ---
Overall (4 states) 684 8.6 0.3 --- --- --- --- --- ---
SOURCE: 2010–11 Principal Survey. NOTES: Related service providers include speech therapists, physical therapists, occupational therapists, school psychologists, and guidance counselors. ‡ The overall means for always-SWD-accountable schools and never-SWD-accountable schools in 7 states are the means across schools in the sample states from which both types of schools were sampled. The overall mean for always-SWD-accountable schools in 4 states is the mean across schools in the remaining sampled states. “---” indicates that survey data were not gathered for that analysis. Differences that are statistically significant at the .05 level, two-tailed, are indicated by an asterisk (*).
109
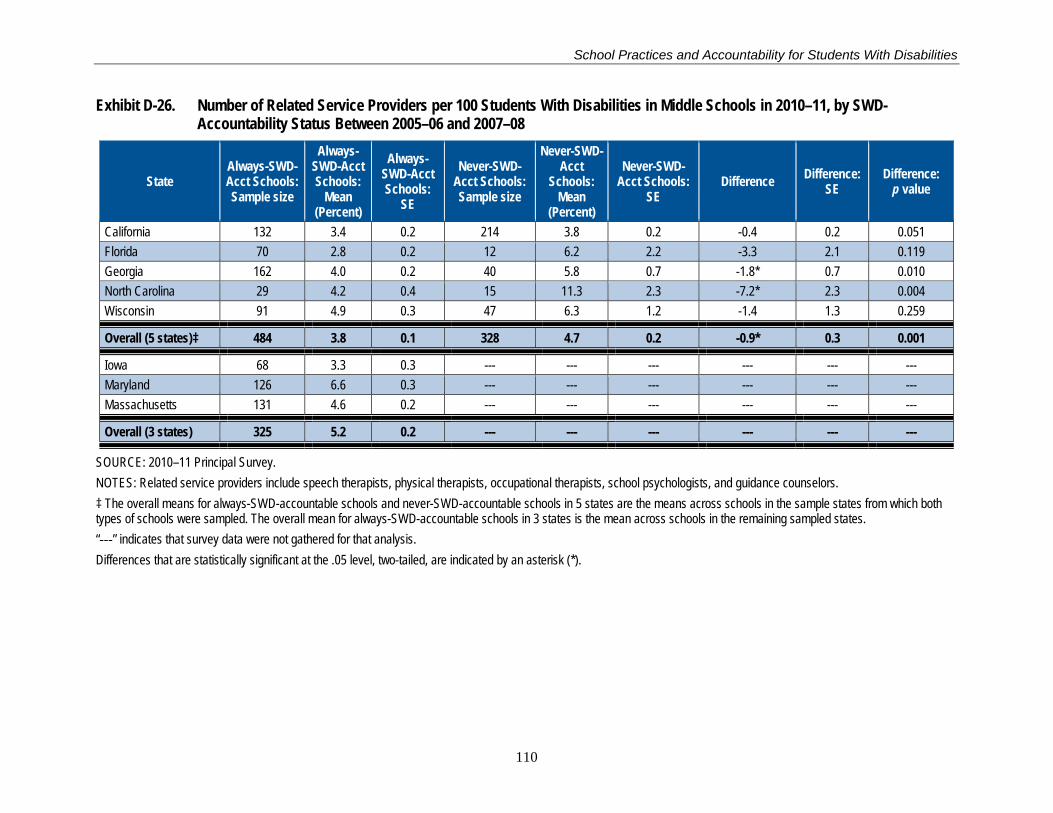
School Practices and Accountability for Students With Disabilities
Exhibit D-26. Number of Related Service Providers per 100 Students With Disabilities in Middle Schools in 2010–11, by SWD-Accountability Status Between 2005–06 and 2007–08
State Always-SWD-Acct Schools: Sample size
Always-SWD-Acct Schools:
Mean (Percent)
Always-SWD-Acct Schools:
SE
Never-SWD-Acct Schools: Sample size
Never-SWD-Acct
Schools: Mean
(Percent)
Never-SWD-Acct Schools:
SE Difference Difference:
SE Difference:
p value
California 132 3.4 0.2 214 3.8 0.2 -0.4 0.2 0.051 Florida 70 2.8 0.2 12 6.2 2.2 -3.3 2.1 0.119 Georgia 162 4.0 0.2 40 5.8 0.7 -1.8* 0.7 0.010 North Carolina 29 4.2 0.4 15 11.3 2.3 -7.2* 2.3 0.004 Wisconsin 91 4.9 0.3 47 6.3 1.2 -1.4 1.3 0.259
Overall (5 states)‡ 484 3.8 0.1 328 4.7 0.2 -0.9* 0.3 0.001
Iowa 68 3.3 0.3 --- --- --- --- --- --- Maryland 126 6.6 0.3 --- --- --- --- --- --- Massachusetts 131 4.6 0.2 --- --- --- --- --- ---
Overall (3 states) 325 5.2 0.2 --- --- --- --- --- ---
SOURCE: 2010–11 Principal Survey. NOTES: Related service providers include speech therapists, physical therapists, occupational therapists, school psychologists, and guidance counselors. ‡ The overall means for always-SWD-accountable schools and never-SWD-accountable schools in 5 states are the means across schools in the sample states from which both types of schools were sampled. The overall mean for always-SWD-accountable schools in 3 states is the mean across schools in the remaining sampled states. “---” indicates that survey data were not gathered for that analysis. Differences that are statistically significant at the .05 level, two-tailed, are indicated by an asterisk (*).
110

School Practices and Accountability for Students With Disabilities
Exhibit D-27. Number of Classroom Paraprofessionals per 100 Students With Disabilities in Elementary Schools in 2010–11, by SWD-Accountability Status Between 2005–06 and 2007–08
State Always-SWD-Acct Schools: Sample size
Always-SWD-Acct Schools:
Mean (Percent)
Always-SWD-Acct Schools:
SE
Never-SWD-Acct Schools: Sample size
Never-SWD-Acct
Schools: Mean
(Percent)
Never-SWD-Acct Schools:
SE Difference Difference:
SE Difference:
p value
California 66 10.4 0.9 217 11.2 0.7 -0.8 1.1 0.477 Florida 342 8.5 0.4 114 12.3 1.1 -3.7* 1.2 0.002 Georgia 195 14.1 0.7 273 22.3 1.0 -8.2* 1.2 0.000 Massachusetts 51 10.4 1.1 257 15.5 0.7 -5.1* 1.3 0.000 Minnesota 102 9.1 0.8 33 17.6 2.5 -8.5* 2.6 0.002 North Carolina 70 17.4 1.4 215 24.2 0.9 -6.7* 1.6 0.000
Virginia 21 12.3 2.0 129 20.0 1.5 -7.7* 2.5 0.002
Overall (7 states)‡ 847 11.0 0.3 1,238 14.9 0.5 -3.9* 0.6 0.000
Iowa 47 11.1 1.7 --- --- --- --- --- --- Kansas 42 22.0 2.7 --- --- --- --- --- --- Maryland 540 12.8 0.5 --- --- --- --- --- --- North Dakota 56 11.1 1.3 --- --- --- --- --- ---
Overall (4 states) 685 13.1 0.4 --- --- --- --- --- ---
SOURCE: 2010–11 Principal Survey. NOTES: ‡The overall means for always-SWD-accountable schools and never-SWD-accountable schools in 7 states are the means across schools in the sample states from which both types of schools were sampled. The overall mean for always-SWD-accountable schools in 4 states is the mean across schools in the remaining sampled states. “---” indicates that survey data were not gathered for that analysis. Differences that are statistically significant at the .05 level, two-tailed, are indicated by an asterisk (*).
111

School Practices and Accountability for Students With Disabilities
Exhibit D-28. Number of Classroom Paraprofessionals per 100 Students With Disabilities in Middle Schools in 2010–11, by SWD-Accountability Status Between 2005–06 and 2007–08
State Always-SWD-Acct Schools: Sample size
Always-SWD-Acct Schools:
Mean (Percent)
Always-SWD-Acct Schools:
SE
Never-SWD-Acct Schools: Sample size
Never-SWD-Acct
Schools: Mean
(Percent)
Never-SWD-Acct Schools:
SE Difference Difference:
SE Difference:
p value
California 132 7.5 0.4 215 8.1 0.4 -0.6 0.6 0.267 Florida 70 3.6 0.6 12 3.2 1.1 0.5 1.2 0.706 Georgia 162 5.5 0.3 40 6.7 0.7 -1.3 0.8 0.094 North Carolina 29 5.4 0.6 15 5.9 1.2 -0.4 1.3 0.749 Wisconsin 91 6.9 0.5 47 6.8 0.9 0.1 1.1 0.915
Overall (5 states)‡ 484 6.0 0.2 329 7.6 0.3 -1.6* 0.4 0.000
Iowa 68 9.3 0.9 --- --- --- --- --- --- Maryland 127 7.8 0.5 --- --- --- --- --- --- Massachusetts 131 8.7 0.4 --- --- --- --- --- ---
Overall (3 states) 326 8.5 0.3 --- --- --- --- --- ---
SOURCE: 2010–11 Principal Survey. NOTES: ‡The overall means for always-SWD-accountable schools and never-SWD-accountable schools in 5 states are the means across schools in the sample states from which both types of schools were sampled. The overall mean for always-SWD-accountable schools in 3 states is the mean across schools in the remaining sampled states. “---” indicates that survey data were not gathered for that analysis. Differences that are statistically significant at the .05 level, two-tailed, are indicated by an asterisk (*).
112
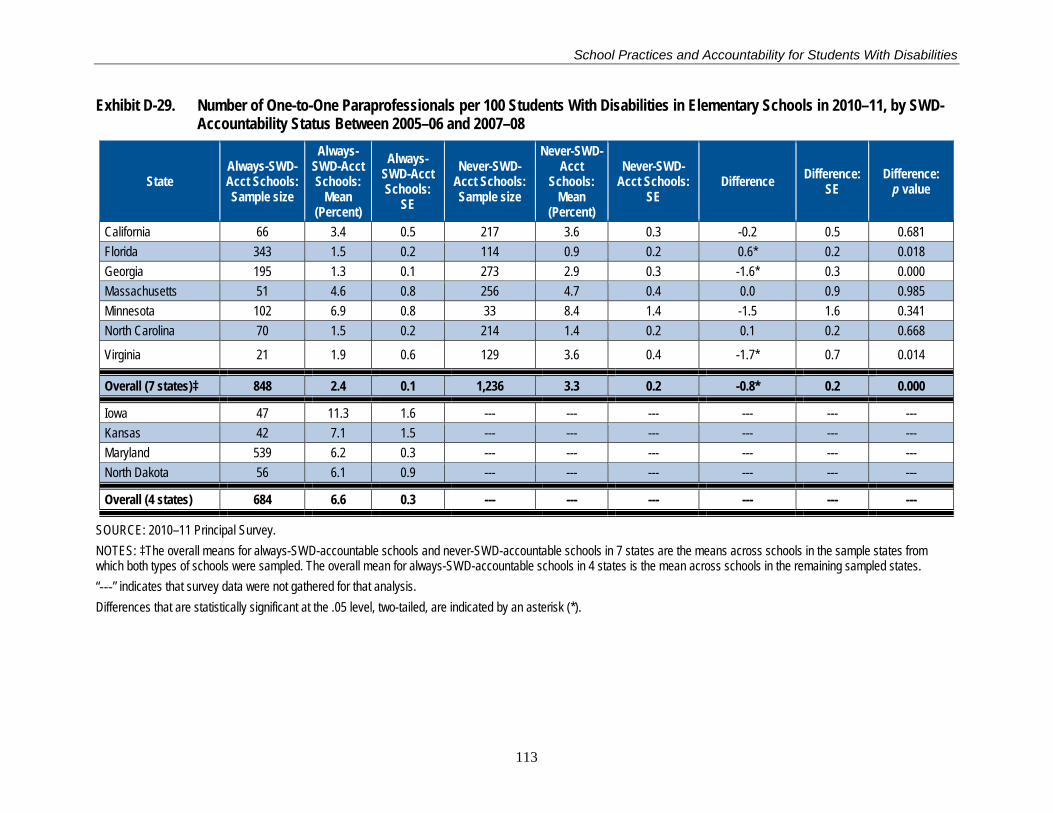
School Practices and Accountability for Students With Disabilities
Exhibit D-29. Number of One-to-One Paraprofessionals per 100 Students With Disabilities in Elementary Schools in 2010–11, by SWD-Accountability Status Between 2005–06 and 2007–08
State Always-SWD-Acct Schools: Sample size
Always-SWD-Acct Schools:
Mean (Percent)
Always-SWD-Acct Schools:
SE
Never-SWD-Acct Schools: Sample size
Never-SWD-Acct
Schools: Mean
(Percent)
Never-SWD-Acct Schools:
SE Difference Difference:
SE Difference:
p value
California 66 3.4 0.5 217 3.6 0.3 -0.2 0.5 0.681 Florida 343 1.5 0.2 114 0.9 0.2 0.6* 0.2 0.018 Georgia 195 1.3 0.1 273 2.9 0.3 -1.6* 0.3 0.000 Massachusetts 51 4.6 0.8 256 4.7 0.4 0.0 0.9 0.985 Minnesota 102 6.9 0.8 33 8.4 1.4 -1.5 1.6 0.341 North Carolina 70 1.5 0.2 214 1.4 0.2 0.1 0.2 0.668
Virginia 21 1.9 0.6 129 3.6 0.4 -1.7* 0.7 0.014
Overall (7 states)‡ 848 2.4 0.1 1,236 3.3 0.2 -0.8* 0.2 0.000
Iowa 47 11.3 1.6 --- --- --- --- --- --- Kansas 42 7.1 1.5 --- --- --- --- --- --- Maryland 539 6.2 0.3 --- --- --- --- --- --- North Dakota 56 6.1 0.9 --- --- --- --- --- ---
Overall (4 states) 684 6.6 0.3 --- --- --- --- --- ---
SOURCE: 2010–11 Principal Survey. NOTES: ‡The overall means for always-SWD-accountable schools and never-SWD-accountable schools in 7 states are the means across schools in the sample states from which both types of schools were sampled. The overall mean for always-SWD-accountable schools in 4 states is the mean across schools in the remaining sampled states. “---” indicates that survey data were not gathered for that analysis. Differences that are statistically significant at the .05 level, two-tailed, are indicated by an asterisk (*).
113

School Practices and Accountability for Students With Disabilities
Exhibit D-30. Number of One-to-One Paraprofessionals per 100 Students With Disabilities in Middle Schools in 2010–11, by SWD-Accountability Status Between 2005–06 and 2007–08
State Always-SWD-Acct Schools: Sample size
Always-SWD-Acct Schools:
Mean (Percent)
Always-SWD-Acct Schools:
SE
Never-SWD-Acct Schools: Sample size
Never-SWD-Acct
Schools: Mean
(Percent)
Never-SWD-Acct Schools:
SE Difference Difference:
SE Difference:
p value
California 132 2.5 0.2 215 2.2 0.2 0.2 0.3 0.436 Florida 70 0.7 0.1 12 0.3 0.3 0.4 0.3 0.133 Georgia 161 1.2 0.1 40 1.5 0.4 -0.3 0.4 0.399 North Carolina 29 1.0 0.2 15 2.0 0.9 -1.0 0.9 0.299 Wisconsin 91 2.1 0.3 47 3.0 0.7 -1.0 0.7 0.187
Overall (5 states)‡ 483 1.6 0.1 329 2.2 0.2 -0.6* 0.2 0.003
Iowa 68 4.5 0.6 --- --- --- --- --- --- Maryland 126 3.6 0.3 --- --- --- --- --- --- Massachusetts 130 2.6 0.2 --- --- --- --- --- ---
Overall (3 states) 324 3.4 0.2 --- --- --- --- --- ---
SOURCE: 2010–11 Principal Survey. NOTES: ‡The overall means for always-SWD-accountable schools and never-SWD-accountable schools in 5 states are the means across schools in the sample states from which both types of schools were sampled. The overall mean for always-SWD-accountable schools in 3 states is the mean across schools in the remaining sampled states. “---” indicates that survey data were not gathered for that analysis. Differences that are statistically significant at the .05 level, two-tailed, are indicated by an asterisk (*).
114
School Practices and Accountability for Students With Disabilities
Appendix E: Chapter 5, School Programs and Student Support Strategies in SWD-Accountable and Non-SWD-Accountable Schools—State-Level Tables
115
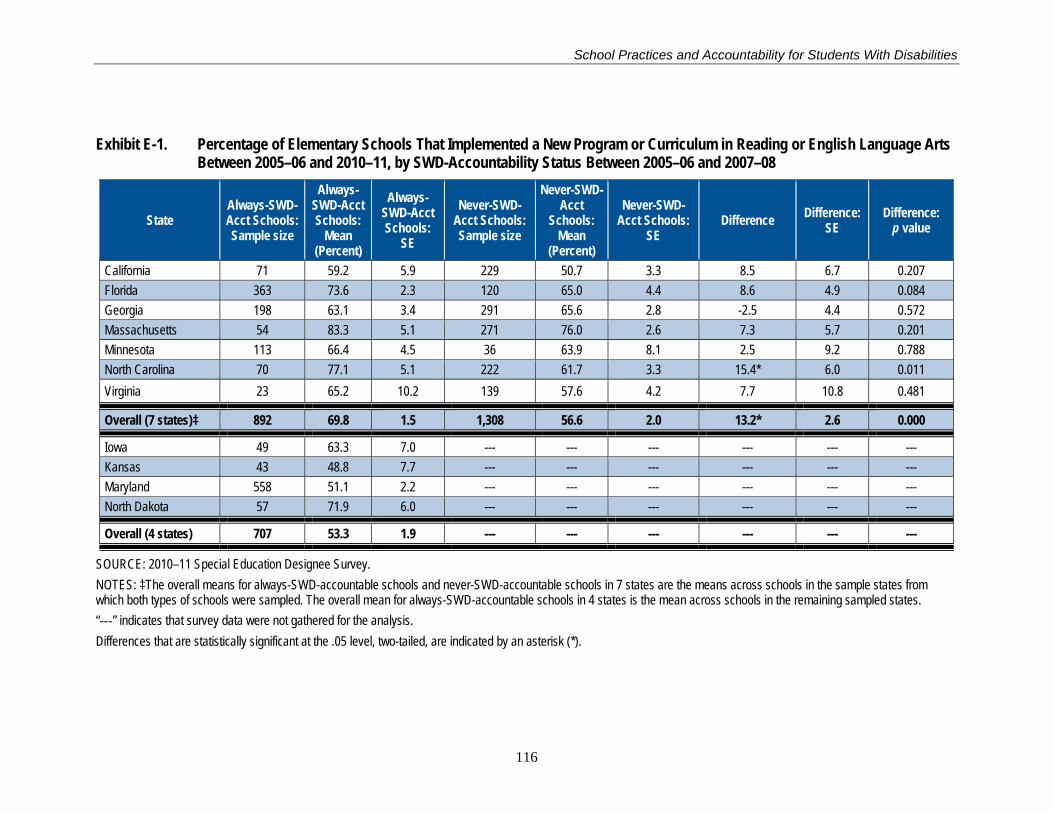
School Practices and Accountability for Students With Disabilities
Exhibit E-1. Percentage of Elementary Schools That Implemented a New Program or Curriculum in Reading or English Language Arts Between 2005–06 and 2010–11, by SWD-Accountability Status Between 2005–06 and 2007–08
State Always-SWD-Acct Schools: Sample size
Always-SWD-Acct Schools:
Mean (Percent)
Always-SWD-Acct Schools:
SE
Never-SWD-Acct Schools: Sample size
Never-SWD-Acct
Schools: Mean
(Percent)
Never-SWD-Acct Schools:
SE Difference Difference:
SE Difference:
p value
California 71 59.2 5.9 229 50.7 3.3 8.5 6.7 0.207 Florida 363 73.6 2.3 120 65.0 4.4 8.6 4.9 0.084 Georgia 198 63.1 3.4 291 65.6 2.8 -2.5 4.4 0.572 Massachusetts 54 83.3 5.1 271 76.0 2.6 7.3 5.7 0.201 Minnesota 113 66.4 4.5 36 63.9 8.1 2.5 9.2 0.788 North Carolina 70 77.1 5.1 222 61.7 3.3 15.4* 6.0 0.011 Virginia 23 65.2 10.2 139 57.6 4.2 7.7 10.8 0.481
Overall (7 states)‡ 892 69.8 1.5 1,308 56.6 2.0 13.2* 2.6 0.000
Iowa 49 63.3 7.0 --- --- --- --- --- --- Kansas 43 48.8 7.7 --- --- --- --- --- --- Maryland 558 51.1 2.2 --- --- --- --- --- --- North Dakota 57 71.9 6.0 --- --- --- --- --- ---
Overall (4 states) 707 53.3 1.9 --- --- --- --- --- ---
SOURCE: 2010–11 Special Education Designee Survey. NOTES: ‡The overall means for always-SWD-accountable schools and never-SWD-accountable schools in 7 states are the means across schools in the sample states from which both types of schools were sampled. The overall mean for always-SWD-accountable schools in 4 states is the mean across schools in the remaining sampled states. “---” indicates that survey data were not gathered for the analysis. Differences that are statistically significant at the .05 level, two-tailed, are indicated by an asterisk (*).
116

School Practices and Accountability for Students With Disabilities
Exhibit E-2. Percentage of Middle Schools That Implemented a New Program or Curriculum in Reading or English Language Arts Between 2005–06 and 2010–11, by SWD-Accountability Status Between 2005–06 and 2007–08
State Always-SWD-Acct Schools: Sample size
Always-SWD-Acct Schools:
Mean (Percent)
Always-SWD-Acct Schools:
SE
Never-SWD-Acct Schools: Sample size
Never-SWD-Acct
Schools: Mean
(Percent)
Never-SWD-Acct Schools:
SE Difference Difference:
SE Difference:
p value
California 138 69.6 3.9 229 62.0 3.2 7.6 5.1 0.137 Florida 73 65.8 5.6 12 66.7 14.2 -0.9 14.9 0.951 Georgia 173 54.3 3.8 40 50.0 8.0 4.3 8.8 0.623 North Carolina 29 44.8 9.4 16 56.3 12.8 -11.4 15.8 0.474 Wisconsin 101 68.3 4.7 61 52.5 6.4 15.9* 7.9 0.048
Overall (5 states)‡ 514 62.3 2.1 358 59.4 2.6 2.9 3.4 0.396
Iowa 73 67.1 5.5 --- --- --- --- --- --- Maryland 129 63.2 4.5 --- --- --- --- --- --- Massachusetts 141 54.6 4.2 --- --- --- --- --- ---
Overall (3 states) 343 60.7 2.7 --- --- --- --- --- ---
SOURCE: 2010–11 Special Education Designee Survey. NOTES: ‡The overall means for always-SWD-accountable schools and never-SWD-accountable schools in 5 states are the means across schools in the sample states from which both types of schools were sampled. The overall mean for always-SWD-accountable schools in 3 states is the mean across schools in the remaining sampled states. “---” indicates that survey data were not gathered for the analysis. Differences that are statistically significant at the .05 level, two-tailed, are indicated by an asterisk (*).
117

School Practices and Accountability for Students With Disabilities
Exhibit E-3. Percentage of Elementary Schools That Implemented a New Program or Curriculum in Mathematics Between 2005–06 and 2010–11, by SWD-Accountability Status Between 2005–06 and 2007–08
State Always-SWD-Acct Schools: Sample size
Always-SWD-Acct Schools:
Mean (Percent)
Always-SWD-Acct Schools:
SE
Never-SWD-Acct Schools: Sample size
Never-SWD-Acct
Schools: Mean
(Percent)
Never-SWD-Acct Schools:
SE Difference Difference:
SE Difference:
p value
California 71 73.2 5.3 229 67.2 3.1 6.0 6.1 0.329 Florida 363 86.5 1.8 120 83.3 3.4 3.2 3.9 0.411 Georgia 198 74.8 3.1 291 61.5 2.9 13.2* 4.2 0.002 Massachusetts 54 61.1 6.7 271 59.8 3.0 1.3 7.3 0.855 Minnesota 113 62.8 4.6 36 63.9 8.1 -1.1 9.3 0.909 North Carolina 70 80.0 4.8 222 55.9 3.3 24.1* 5.8 0.000
Virginia 23 43.5 10.6 139 41.0 4.2 2.5 11.2 0.826
Overall (7 states)‡ 892 76.7 1.4 1,308 63.6 1.9 13.1* 2.4 0.000
Iowa 49 51.0 7.2 --- --- --- --- --- --- Kansas 43 62.8 7.5 --- --- --- --- --- --- Maryland 558 52.8 2.2 --- --- --- --- --- --- North Dakota 57 52.6 6.7 --- --- --- --- --- ---
Overall (4 states) 707 53.2 1.9
SOURCE: 2010–11 Special Education Designee Survey. NOTES: ‡The overall means for always-SWD-accountable schools and never-SWD-accountable schools in 7 states are the means across schools in the sample states from which both types of schools were sampled. The overall mean for always-SWD-accountable schools in 4 states is the mean across schools in the remaining sampled states. “---” indicates that survey data were not gathered for the analysis. Differences that are statistically significant at the .05 level, two-tailed, are indicated by an asterisk (*).
118

School Practices and Accountability for Students With Disabilities
Exhibit E-4. Percentage of Middle Schools That Implemented a New Program or Curriculum in Mathematics Between 2005–06 and 2010–11, by SWD-Accountability Status Between 2005–06 and 2007–08
State Always-SWD-Acct Schools: Sample size
Always-SWD-Acct Schools:
Mean (Percent)
Always-SWD-Acct Schools:
SE
Never-SWD-Acct Schools: Sample size
Never-SWD-Acct
Schools: Mean
(Percent)
Never-SWD-Acct Schools:
SE Difference Difference:
SE Difference:
p value
California 138 55.1 4.2 229 58.5 3.3 -3.4 5.4 0.521 Florida 73 69.9 5.4 12 58.3 14.9 11.5 15.4 0.456 Georgia 173 63.0 3.7 40 45.0 8.0 18.0* 8.7 0.040 North Carolina 29 24.1 8.1 16 43.8 12.8 -19.6 15.1 0.200 Wisconsin 101 52.5 5.0 61 55.7 6.4 -3.2 8.1 0.688
Overall (5 states)‡ 514 57.6 2.2 358 56.3 2.6 1.3 3.4 0.697
Iowa 73 49.3 5.9 --- --- --- --- --- --- Maryland 129 59.4 4.7 --- --- --- --- --- --- Massachusetts 141 63.8 4.1 --- --- --- --- --- ---
Overall (3 states) 343 59.1 2.8 --- --- --- --- --- ---
SOURCE: 2010–11 Special Education Designee Survey. NOTES: ‡The overall means for always-SWD-accountable schools and never-SWD-accountable schools in 5 states are the means across schools in the sample states from which both types of schools were sampled. The overall mean for always-SWD-accountable schools in 3 states is the mean across schools in the remaining sampled states. “---” indicates that survey data were not gathered for the analysis. Differences that are statistically significant at the .05 level, two-tailed, are indicated by an asterisk (*).
119

School Practices and Accountability for Students With Disabilities
Exhibit E-5. Percentage of Elementary Schools That Implemented Reading Across the Curriculum Between 2005–06 and 2010–11, by SWD-Accountability Status Between 2005–06 and 2007–08
State Always-SWD-Acct Schools: Sample size
Always-SWD-Acct Schools:
Mean (Percent)
Always-SWD-Acct Schools:
SE
Never-SWD-Acct Schools: Sample size
Never-SWD-Acct
Schools: Mean
(Percent)
Never-SWD-Acct Schools:
SE Difference Difference:
SE Difference:
p value
California 71 28.2 5.4 229 21.8 2.7 6.3 6.0 0.293 Florida 363 44.1 2.6 120 43.3 4.5 0.7 5.2 0.887 Georgia 198 36.4 3.4 291 33.3 2.8 3.0 4.4 0.492 Massachusetts 54 46.3 6.8 271 36.2 2.9 10.1 7.4 0.172 Minnesota 113 25.7 4.1 36 33.3 8.0 -7.7 8.9 0.392 North Carolina 70 31.4 5.6 222 30.6 3.1 0.8 6.4 0.900
Virginia 23 30.4 9.8 139 26.6 3.8 3.8 10.4 0.713
Overall (7 states)‡ 892 37.6 1.6 1,308 26.5 1.7 11.0* 2.4 0.000
Iowa 49 20.4 5.8 --- --- --- --- --- --- Kansas 43 11.6 4.9 --- --- --- --- --- --- Maryland 558 28.8 2.0 --- --- --- --- --- --- North Dakota 57 15.8 4.9 --- --- --- --- --- ---
Overall (4 states) 707 26.3 1.7
SOURCE: 2010–11 Special Education Designee Survey. NOTES: ‡The overall means for always-SWD-accountable schools and never-SWD-accountable schools in 7 states are the means across schools in the sample states from which both types of schools were sampled. The overall mean for always-SWD-accountable schools in 4 states is the mean across schools in the remaining sampled states. “---” indicates that survey data were not gathered for the analysis. Differences that are statistically significant at the .05 level, two-tailed, are indicated by an asterisk (*).
120

School Practices and Accountability for Students With Disabilities
Exhibit E-6. Percentage of Middle Schools That Implemented Reading Across the Curriculum Between 2005–06 and 2010–11, by SWD-Accountability Status Between 2005–06 and 2007–08
State Always-SWD-Acct Schools: Sample size
Always-SWD-Acct Schools:
Mean (Percent)
Always-SWD-Acct Schools:
SE
Never-SWD-Acct Schools: Sample size
Never-SWD-Acct
Schools: Mean
(Percent)
Never-SWD-Acct Schools:
SE Difference Difference:
SE Difference:
p value
California 138 34.1 4.0 229 27.5 3.0 6.5 5.0 0.192 Florida 73 71.2 5.3 12 66.7 14.2 4.6 14.8 0.758 Georgia 173 51.4 3.8 40 55.0 8.0 -3.6 8.8 0.686 North Carolina 29 51.7 9.4 16 75.0 11.2 -23.3 14.6 0.118 Wisconsin 101 36.6 4.8 61 29.5 5.9 7.1 7.6 0.350
Overall (5 states)‡ 514 46.7 2.2 358 33.3 2.5 13.3* 3.3 0.000
Iowa 73 35.6 5.6 --- --- --- --- --- --- Maryland 129 40.9 4.6 --- --- --- --- --- --- Massachusetts 141 41.1 4.2 --- --- --- --- --- ---
Overall (3 states) 343 39.9 2.7 --- --- --- --- --- ---
SOURCE: 2010–11 Special Education Designee Survey. NOTES: ‡The overall means for always-SWD-accountable schools and never-SWD-accountable schools in 5 states are the means across schools in the sample states from which both types of schools were sampled. The overall mean for always-SWD-accountable schools in 3 states is the mean across schools in the remaining sampled states. “---” indicates that survey data were not gathered for the analysis. Differences that are statistically significant at the .05 level, two-tailed, are indicated by an asterisk (*).
121
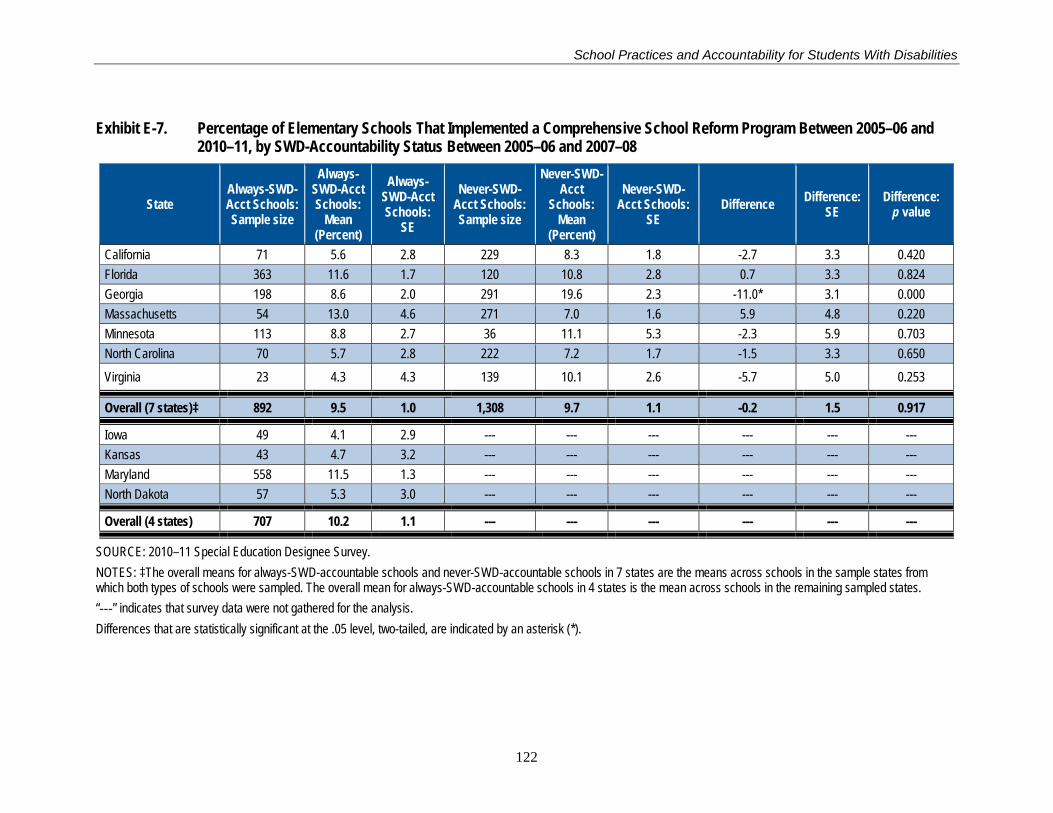
School Practices and Accountability for Students With Disabilities
Exhibit E-7. Percentage of Elementary Schools That Implemented a Comprehensive School Reform Program Between 2005–06 and 2010–11, by SWD-Accountability Status Between 2005–06 and 2007–08
State Always-SWD-Acct Schools: Sample size
Always-SWD-Acct Schools:
Mean (Percent)
Always-SWD-Acct Schools:
SE
Never-SWD-Acct Schools: Sample size
Never-SWD-Acct
Schools: Mean
(Percent)
Never-SWD-Acct Schools:
SE Difference Difference:
SE Difference:
p value
California 71 5.6 2.8 229 8.3 1.8 -2.7 3.3 0.420 Florida 363 11.6 1.7 120 10.8 2.8 0.7 3.3 0.824 Georgia 198 8.6 2.0 291 19.6 2.3 -11.0* 3.1 0.000 Massachusetts 54 13.0 4.6 271 7.0 1.6 5.9 4.8 0.220 Minnesota 113 8.8 2.7 36 11.1 5.3 -2.3 5.9 0.703 North Carolina 70 5.7 2.8 222 7.2 1.7 -1.5 3.3 0.650
Virginia 23 4.3 4.3 139 10.1 2.6 -5.7 5.0 0.253
Overall (7 states)‡ 892 9.5 1.0 1,308 9.7 1.1 -0.2 1.5 0.917
Iowa 49 4.1 2.9 --- --- --- --- --- --- Kansas 43 4.7 3.2 --- --- --- --- --- --- Maryland 558 11.5 1.3 --- --- --- --- --- --- North Dakota 57 5.3 3.0 --- --- --- --- --- ---
Overall (4 states) 707 10.2 1.1 --- --- --- --- --- ---
SOURCE: 2010–11 Special Education Designee Survey. NOTES: ‡The overall means for always-SWD-accountable schools and never-SWD-accountable schools in 7 states are the means across schools in the sample states from which both types of schools were sampled. The overall mean for always-SWD-accountable schools in 4 states is the mean across schools in the remaining sampled states. “---” indicates that survey data were not gathered for the analysis. Differences that are statistically significant at the .05 level, two-tailed, are indicated by an asterisk (*).
122

School Practices and Accountability for Students With Disabilities
Exhibit E-8. Percentage of Middle Schools That Implemented a Comprehensive School Reform Program Between 2005–06 and 2010–11, by SWD-Accountability Status Between 2005–06 and 2007–08
State Always-SWD-Acct Schools: Sample size
Always-SWD-Acct Schools:
Mean (Percent)
Always-SWD-Acct Schools:
SE
Never-SWD-Acct Schools: Sample size
Never-SWD-Acct
Schools: Mean
(Percent)
Never-SWD-Acct Schools:
SE Difference Difference:
SE Difference:
p value
California 138 11.6 2.7 229 14.8 2.4 -3.2 3.6 0.368 Florida 73 15.1 4.2 12 8.3 8.3 6.7 9.1 0.462 Georgia 173 12.1 2.5 40 15.0 5.7 -2.9 6.2 0.645 North Carolina 29 17.2 7.1 16 12.5 8.5 4.7 11.1 0.671 Wisconsin 101 8.9 2.8 61 3.3 2.3 5.6 3.7 0.126
Overall (5 states)‡ 514 12.1 1.4 358 12.9 1.8 -0.8 2.3 0.715
Iowa 73 2.7 1.9 --- --- --- --- --- --- Maryland 129 5.5 1.9 --- --- --- --- --- --- Massachusetts 141 6.4 2.1 --- --- --- --- --- ---
Overall (3 states) 343 5.3 1.2 --- --- --- --- --- ---
SOURCE: 2010–11 Special Education Designee Survey. NOTES: ‡The overall means for always-SWD-accountable schools and never-SWD-accountable schools in 5 states are the means across schools in the sample states from which both types of schools were sampled. The overall mean for always-SWD-accountable schools in 3 states is the mean across schools in the remaining sampled states. “---” indicates that survey data were not gathered for the analysis.
123

School Practices and Accountability for Students With Disabilities
Exhibit E-9. Percentage of Elementary Schools That Used a Tiered Instructional Intervention System Targeting Students at Risk, to Some Extent or to a Great Extent in 2010–11, by SWD-Accountability Status Between 2005–06 and 2007–08
State Always-SWD-Acct Schools: Sample size
Always-SWD-Acct Schools:
Mean (Percent)
Always-SWD-Acct Schools:
SE
Never-SWD-Acct Schools: Sample size
Never-SWD-Acct
Schools: Mean
(Percent)
Never-SWD-Acct Schools:
SE Difference Difference:
SE Difference:
p value
California 70 82.9 4.5 228 75.0 2.9 7.9 5.4 0.144 Florida 357 93.2 1.3 120 92.5 2.4 0.8 2.8 0.778 Georgia 195 96.4 1.3 290 92.4 1.6 4.0 2.1 0.052 Massachusetts 54 79.6 5.5 269 80.7 2.4 -1.0 6.0 0.863 Minnesota 112 83.0 3.6 36 50.0 8.5 33.0* 9.1 0.000 North Carolina 70 85.7 4.2 220 76.8 2.9 8.9 5.1 0.081
Virginia 23 91.3 6.0 139 79.1 3.5 12.2 6.9 0.078
Overall (7 states)‡ 881 90.4 1.0 1,302 78.5 1.7 11.8* 2.0 0.000
Iowa 49 69.4 6.7 --- --- --- --- --- --- Kansas 43 88.4 4.9 --- --- --- --- --- --- Maryland 553 82.6 1.6 --- --- --- --- --- --- North Dakota 56 78.6 5.5 --- --- --- --- --- ---
Overall (4 states) 701 81.8 1.5 --- --- --- --- --- ---
SOURCE: 2010–11 Special Education Designee Survey. NOTES: ‡The overall means for always-SWD-accountable schools and never-SWD-accountable schools in 7 states are the means across schools in the sample states from which both types of schools were sampled. The overall mean for always-SWD-accountable schools in 4 states is the mean across schools in the remaining sampled states. “---” indicates that survey data were not gathered for the analysis. Differences that are statistically significant at the .05 level, two-tailed, are indicated by an asterisk (*).
124
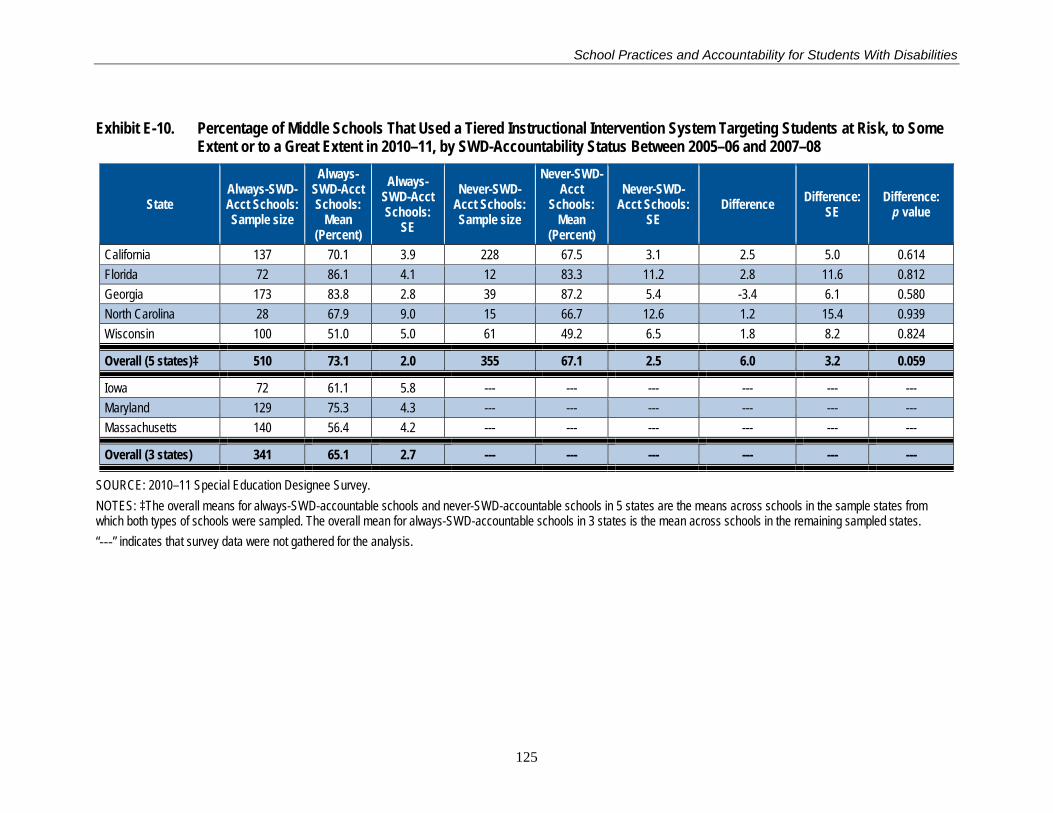
School Practices and Accountability for Students With Disabilities
Exhibit E-10. Percentage of Middle Schools That Used a Tiered Instructional Intervention System Targeting Students at Risk, to Some Extent or to a Great Extent in 2010–11, by SWD-Accountability Status Between 2005–06 and 2007–08
State Always-SWD-Acct Schools: Sample size
Always-SWD-Acct Schools:
Mean (Percent)
Always-SWD-Acct Schools:
SE
Never-SWD-Acct Schools: Sample size
Never-SWD-Acct
Schools: Mean
(Percent)
Never-SWD-Acct Schools:
SE Difference Difference:
SE Difference:
p value
California 137 70.1 3.9 228 67.5 3.1 2.5 5.0 0.614 Florida 72 86.1 4.1 12 83.3 11.2 2.8 11.6 0.812 Georgia 173 83.8 2.8 39 87.2 5.4 -3.4 6.1 0.580 North Carolina 28 67.9 9.0 15 66.7 12.6 1.2 15.4 0.939 Wisconsin 100 51.0 5.0 61 49.2 6.5 1.8 8.2 0.824
Overall (5 states)‡ 510 73.1 2.0 355 67.1 2.5 6.0 3.2 0.059
Iowa 72 61.1 5.8 --- --- --- --- --- --- Maryland 129 75.3 4.3 --- --- --- --- --- --- Massachusetts 140 56.4 4.2 --- --- --- --- --- ---
Overall (3 states) 341 65.1 2.7 --- --- --- --- --- ---
SOURCE: 2010–11 Special Education Designee Survey. NOTES: ‡The overall means for always-SWD-accountable schools and never-SWD-accountable schools in 5 states are the means across schools in the sample states from which both types of schools were sampled. The overall mean for always-SWD-accountable schools in 3 states is the mean across schools in the remaining sampled states. “---” indicates that survey data were not gathered for the analysis.
125

School Practices and Accountability for Students With Disabilities
Exhibit E-11. Percentage of Elementary Schools That Used Positive Behavioral Interventions and Supports, to Some Extent or to a Great Extent in 2010–11, by SWD-Accountability Status Between 2005–06 and 2007–08
State Always-SWD-Acct Schools: Sample size
Always-SWD-Acct Schools:
Mean (Percent)
Always-SWD-Acct Schools:
SE
Never-SWD-Acct Schools: Sample size
Never-SWD-Acct
Schools: Mean
(Percent)
Never-SWD-Acct Schools:
SE Difference Difference:
SE Difference:
p value
California 69 62.3 5.9 226 56.6 3.3 5.7 6.7 0.399 Florida 357 71.1 2.4 120 61.7 4.5 9.5 5.1 0.061 Georgia 197 60.9 3.5 290 66.2 2.8 -5.3 4.5 0.236 Massachusetts 54 61.1 6.7 270 51.5 3.0 9.6 7.3 0.189 Minnesota 112 42.0 4.7 36 36.1 8.1 5.9 9.3 0.531 North Carolina 70 64.3 5.8 221 57.5 3.3 6.8 6.6 0.306
Virginia 23 60.9 10.4 139 59.0 4.2 1.9 11.1 0.866
Overall (7 states)‡ 882 63.0 1.6 1,302 57.7 2.0 5.3* 2.6 0.039
Iowa 49 59.2 7.1 --- --- --- --- --- --- Kansas 43 60.5 7.5 --- --- --- --- --- --- Maryland 556 64.1 2.1 --- --- --- --- --- --- North Dakota 56 44.6 6.7 --- --- --- --- --- ---
Overall (4 states) 704 62.1 1.9 --- --- --- --- --- ---
SOURCE: 2010–11 Special Education Designee Survey. NOTES: ‡The overall means for always-SWD-accountable schools and never-SWD-accountable schools in 7 states are the means across schools in the sample states from which both types of schools were sampled. The overall mean for always-SWD-accountable schools in 4 states is the mean across schools in the remaining sampled states. “---” indicates that survey data were not gathered for the analysis. Differences that are statistically significant at the .05 level, two-tailed, are indicated by an asterisk (*).
126
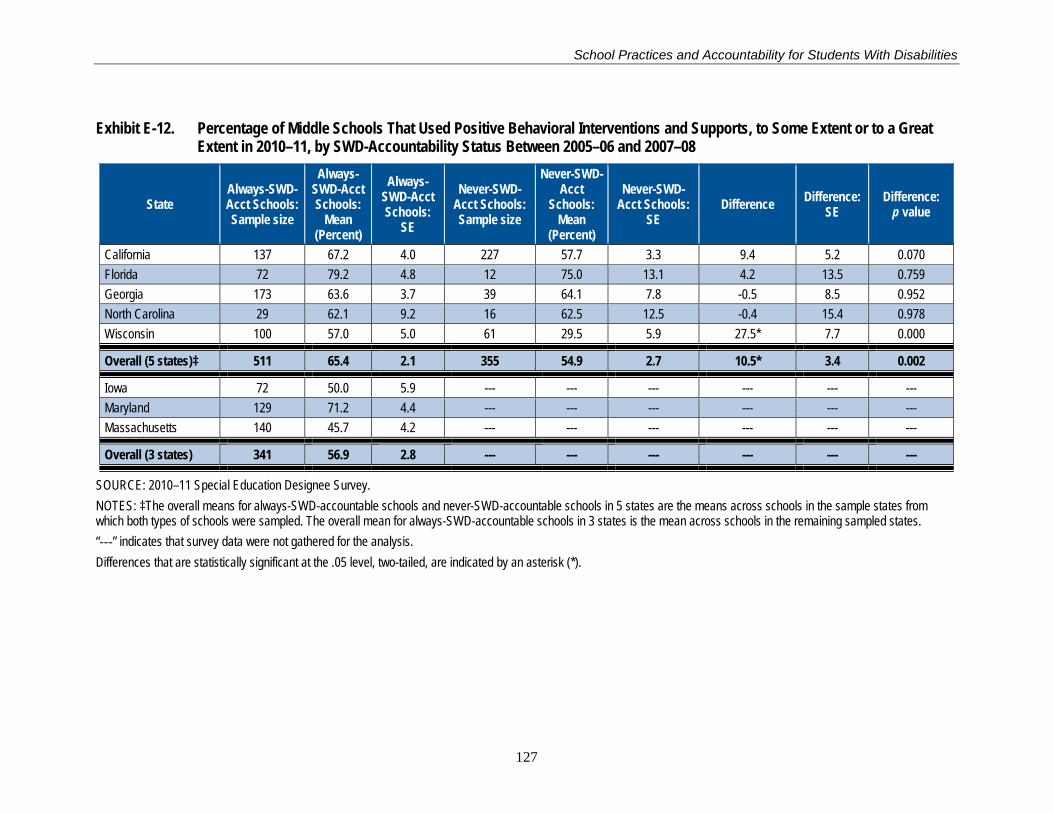
School Practices and Accountability for Students With Disabilities
Exhibit E-12. Percentage of Middle Schools That Used Positive Behavioral Interventions and Supports, to Some Extent or to a Great Extent in 2010–11, by SWD-Accountability Status Between 2005–06 and 2007–08
State Always-SWD-Acct Schools: Sample size
Always-SWD-Acct Schools:
Mean (Percent)
Always-SWD-Acct Schools:
SE
Never-SWD-Acct Schools: Sample size
Never-SWD-Acct
Schools: Mean
(Percent)
Never-SWD-Acct Schools:
SE Difference Difference:
SE Difference:
p value
California 137 67.2 4.0 227 57.7 3.3 9.4 5.2 0.070 Florida 72 79.2 4.8 12 75.0 13.1 4.2 13.5 0.759 Georgia 173 63.6 3.7 39 64.1 7.8 -0.5 8.5 0.952 North Carolina 29 62.1 9.2 16 62.5 12.5 -0.4 15.4 0.978 Wisconsin 100 57.0 5.0 61 29.5 5.9 27.5* 7.7 0.000
Overall (5 states)‡ 511 65.4 2.1 355 54.9 2.7 10.5* 3.4 0.002
Iowa 72 50.0 5.9 --- --- --- --- --- --- Maryland 129 71.2 4.4 --- --- --- --- --- --- Massachusetts 140 45.7 4.2 --- --- --- --- --- ---
Overall (3 states) 341 56.9 2.8 --- --- --- --- --- ---
SOURCE: 2010–11 Special Education Designee Survey. NOTES: ‡The overall means for always-SWD-accountable schools and never-SWD-accountable schools in 5 states are the means across schools in the sample states from which both types of schools were sampled. The overall mean for always-SWD-accountable schools in 3 states is the mean across schools in the remaining sampled states. “---” indicates that survey data were not gathered for the analysis. Differences that are statistically significant at the .05 level, two-tailed, are indicated by an asterisk (*).
127

School Practices and Accountability for Students With Disabilities
Exhibit E-13. Percentage of Elementary Schools That Used Test Preparation Instruction, to Some Extent or to a Great Extent in 2010–11, by SWD-Accountability Status Between 2005–06 and 2007–08
State Always-SWD-Acct Schools: Sample size
Always-SWD-Acct Schools:
Mean (Percent)
Always-SWD-Acct Schools:
SE
Never-SWD-Acct Schools: Sample size
Never-SWD-Acct
Schools: Mean
(Percent)
Never-SWD-Acct Schools:
SE Difference Difference:
SE Difference:
p value
California 69 75.4 5.2 227 71.8 3.0 3.6 6.0 0.554 Florida 356 74.2 2.3 120 80.0 3.7 -5.8 4.3 0.178 Georgia 196 88.3 2.3 290 86.9 2.0 1.4 3.0 0.653 Massachusetts 54 66.7 6.5 268 80.2 2.4 -13.6* 6.9 0.050 Minnesota 111 73.0 4.2 36 66.7 8.0 6.3 9.0 0.484 North Carolina 70 87.1 4.0 220 86.4 2.3 0.8 4.6 0.867
Virginia 23 82.6 8.1 139 92.8 2.2 -10.2 8.3 0.218
Overall (7 states)‡ 879 78.0 1.4 1,300 77.5 1.8 0.5 2.3 0.828
Iowa 49 55.1 7.2 --- --- --- --- --- --- Kansas 43 83.7 5.7 --- --- --- --- --- --- Maryland 552 71.9 1.9 --- --- --- --- --- --- North Dakota 56 46.4 6.7 --- --- --- --- --- ---
Overall (4 states) 700 69.5 1.8 --- --- --- --- --- ---
SOURCE: 2010–11 Special Education Designee Survey. NOTES: ‡The overall means for always-SWD-accountable schools and never-SWD-accountable schools in 7 states are the means across schools in the sample states from which both types of schools were sampled. The overall mean for always-SWD-accountable schools in 4 states is the mean across schools in the remaining sampled states. “---” indicates that survey data were not gathered for the analysis. Differences that are statistically significant at the .05 level, two-tailed, are indicated by an asterisk (*).
128

School Practices and Accountability for Students With Disabilities
Exhibit E-14. Percentage of Middle Schools That Used Test Preparation Instruction, to Some Extent or to a Great Extent in 2010–11, by SWD-Accountability Status Between 2005–06 and 2007–08
State Always-SWD-Acct Schools: Sample size
Always-SWD-Acct Schools:
Mean (Percent)
Always-SWD-Acct Schools:
SE
Never-SWD-Acct Schools: Sample size
Never-SWD-Acct
Schools: Mean
(Percent)
Never-SWD-Acct Schools:
SE Difference Difference:
SE Difference:
p value
California 137 77.4 3.6 224 71.9 3.0 5.5 4.7 0.241 Florida 72 72.2 5.3 12 75.0 13.1 -2.8 13.7 0.840 Georgia 173 82.1 2.9 39 87.2 5.4 -5.1 6.1 0.406 North Carolina 28 75.0 8.3 16 93.8 6.3 -18.8 10.4 0.079 Wisconsin 100 54.0 5.0 60 43.3 6.5 10.7 8.2 0.193
Overall (5 states)‡ 510 73.5 2.0 351 70.1 2.5 3.4 3.1 0.276
Iowa 72 55.6 5.9 --- --- --- --- --- --- Maryland 129 70.1 4.3 --- --- --- --- --- --- Massachusetts 139 70.5 3.9 --- --- --- --- --- ---
Overall (3 states) 340 67.3 2.6 --- --- --- --- --- ---
SOURCE: 2010–11 Special Education Designee Survey. NOTES: ‡The overall means for always-SWD-accountable schools and never-SWD-accountable schools in 5 states are the means across schools in the sample states from which both types of schools were sampled. The overall mean for always-SWD-accountable schools in 3 states is the mean across schools in the remaining sampled states. “---” indicates that survey data were not gathered for the analysis.
129

School Practices and Accountability for Students With Disabilities
Exhibit E-15. Percentage of Elementary Schools That Used Instructional and Assistive Technology, to Some Extent or to a Great Extent in 2010–11, by SWD-Accountability Status Between 2005–06 and 2007–08
State Always-SWD-Acct Schools: Sample size
Always-SWD-Acct Schools:
Mean (Percent)
Always-SWD-Acct Schools:
SE
Never-SWD-Acct Schools: Sample size
Never-SWD-Acct
Schools: Mean
(Percent)
Never-SWD-Acct Schools:
SE Difference Difference:
SE Difference:
p value
California 68 66.2 5.8 227 63.4 3.2 2.7 6.6 0.678 Florida 353 79.9 2.1 119 78.2 3.8 1.7 4.4 0.691 Georgia 195 85.6 2.5 288 82.3 2.3 3.3 3.4 0.322 Massachusetts 54 75.9 5.9 268 68.7 2.8 7.3 6.5 0.264 Minnesota 111 73.0 4.2 36 44.4 8.4 28.5* 9.4 0.003 North Carolina 70 87.1 4.0 218 74.8 2.9 12.4* 5.0 0.014
Virginia 23 69.6 9.8 139 82.0 3.3 -12.4 10.2 0.224
Overall (7 states)‡ 874 79.3 1.4 1,295 69.0 2.0 10.3* 2.4 0.000
Iowa 49 73.5 6.4 --- --- --- --- --- --- Kansas 43 79.1 6.3 --- --- --- --- --- --- Maryland 550 74.8 1.9 --- --- --- --- --- --- North Dakota 56 76.8 5.7 --- --- --- --- --- ---
Overall (4 states) 698 75.1 1.7 --- --- --- --- --- ---
SOURCE: 2010–11 Special Education Designee Survey. NOTES: ‡The overall means for always-SWD-accountable schools and never-SWD-accountable schools in 7 states are the means across schools in the sample states from which both types of schools were sampled. The overall mean for always-SWD-accountable schools in 4 states is the mean across schools in the remaining sampled states. “---” indicates that survey data were not gathered for the analysis. Differences that are statistically significant at the .05 level, two-tailed, are indicated by an asterisk (*).
130
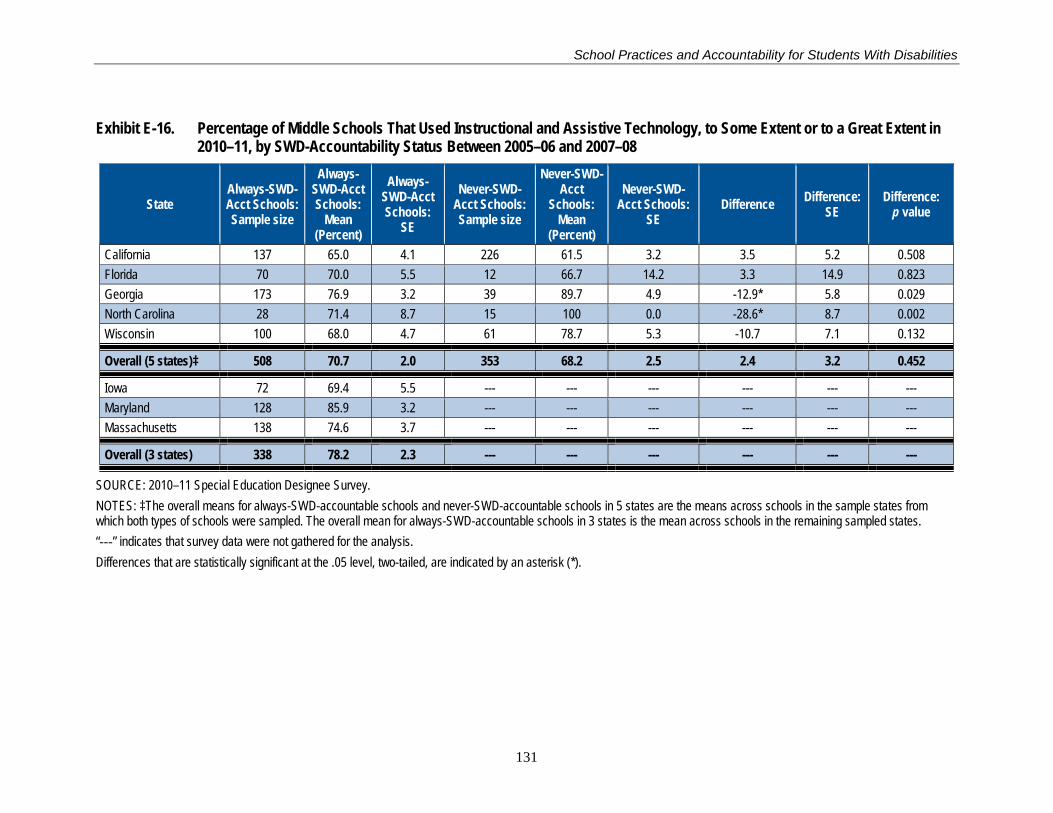
School Practices and Accountability for Students With Disabilities
Exhibit E-16. Percentage of Middle Schools That Used Instructional and Assistive Technology, to Some Extent or to a Great Extent in 2010–11, by SWD-Accountability Status Between 2005–06 and 2007–08
State Always-SWD-Acct Schools: Sample size
Always-SWD-Acct Schools:
Mean (Percent)
Always-SWD-Acct Schools:
SE
Never-SWD-Acct Schools: Sample size
Never-SWD-Acct
Schools: Mean
(Percent)
Never-SWD-Acct Schools:
SE Difference Difference:
SE Difference:
p value
California 137 65.0 4.1 226 61.5 3.2 3.5 5.2 0.508 Florida 70 70.0 5.5 12 66.7 14.2 3.3 14.9 0.823 Georgia 173 76.9 3.2 39 89.7 4.9 -12.9* 5.8 0.029 North Carolina 28 71.4 8.7 15 100 0.0 -28.6* 8.7 0.002 Wisconsin 100 68.0 4.7 61 78.7 5.3 -10.7 7.1 0.132
Overall (5 states)‡ 508 70.7 2.0 353 68.2 2.5 2.4 3.2 0.452
Iowa 72 69.4 5.5 --- --- --- --- --- --- Maryland 128 85.9 3.2 --- --- --- --- --- --- Massachusetts 138 74.6 3.7 --- --- --- --- --- ---
Overall (3 states) 338 78.2 2.3 --- --- --- --- --- ---
SOURCE: 2010–11 Special Education Designee Survey. NOTES: ‡The overall means for always-SWD-accountable schools and never-SWD-accountable schools in 5 states are the means across schools in the sample states from which both types of schools were sampled. The overall mean for always-SWD-accountable schools in 3 states is the mean across schools in the remaining sampled states. “---” indicates that survey data were not gathered for the analysis. Differences that are statistically significant at the .05 level, two-tailed, are indicated by an asterisk (*).
131
School Practices and Accountability for Students With Disabilities
Appendix F: Chapter 6, Instructional Time, Structure, and Settings in SWD-Accountable and Non-SWD-Accountable Schools—State-Level Tables
132
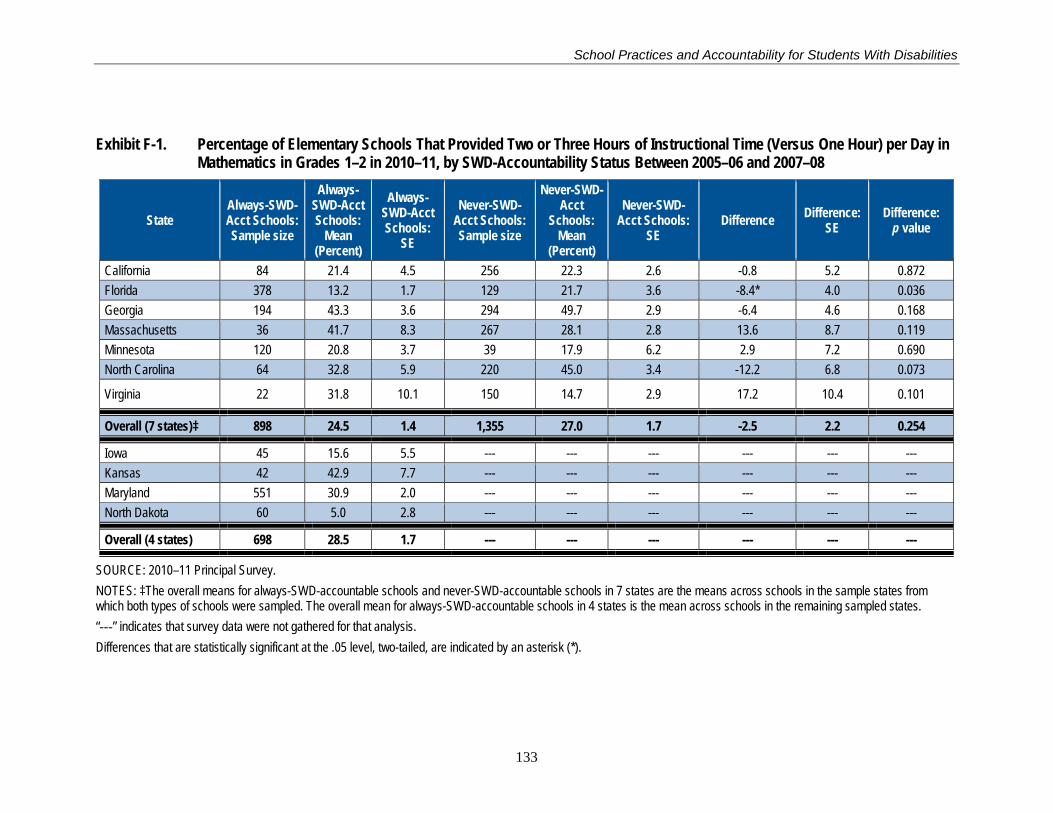
School Practices and Accountability for Students With Disabilities
Exhibit F-1. Percentage of Elementary Schools That Provided Two or Three Hours of Instructional Time (Versus One Hour) per Day in Mathematics in Grades 1–2 in 2010–11, by SWD-Accountability Status Between 2005–06 and 2007–08
State Always-SWD-Acct Schools: Sample size
Always-SWD-Acct Schools:
Mean (Percent)
Always-SWD-Acct Schools:
SE
Never-SWD-Acct Schools: Sample size
Never-SWD-Acct
Schools: Mean
(Percent)
Never-SWD-Acct Schools:
SE Difference Difference:
SE Difference:
p value
California 84 21.4 4.5 256 22.3 2.6 -0.8 5.2 0.872 Florida 378 13.2 1.7 129 21.7 3.6 -8.4* 4.0 0.036 Georgia 194 43.3 3.6 294 49.7 2.9 -6.4 4.6 0.168 Massachusetts 36 41.7 8.3 267 28.1 2.8 13.6 8.7 0.119 Minnesota 120 20.8 3.7 39 17.9 6.2 2.9 7.2 0.690 North Carolina 64 32.8 5.9 220 45.0 3.4 -12.2 6.8 0.073
Virginia 22 31.8 10.1 150 14.7 2.9 17.2 10.4 0.101
Overall (7 states)‡ 898 24.5 1.4 1,355 27.0 1.7 -2.5 2.2 0.254
Iowa 45 15.6 5.5 --- --- --- --- --- --- Kansas 42 42.9 7.7 --- --- --- --- --- --- Maryland 551 30.9 2.0 --- --- --- --- --- --- North Dakota 60 5.0 2.8 --- --- --- --- --- ---
Overall (4 states) 698 28.5 1.7 --- --- --- --- --- ---
SOURCE: 2010–11 Principal Survey. NOTES: ‡The overall means for always-SWD-accountable schools and never-SWD-accountable schools in 7 states are the means across schools in the sample states from which both types of schools were sampled. The overall mean for always-SWD-accountable schools in 4 states is the mean across schools in the remaining sampled states. “---” indicates that survey data were not gathered for that analysis. Differences that are statistically significant at the .05 level, two-tailed, are indicated by an asterisk (*).
133
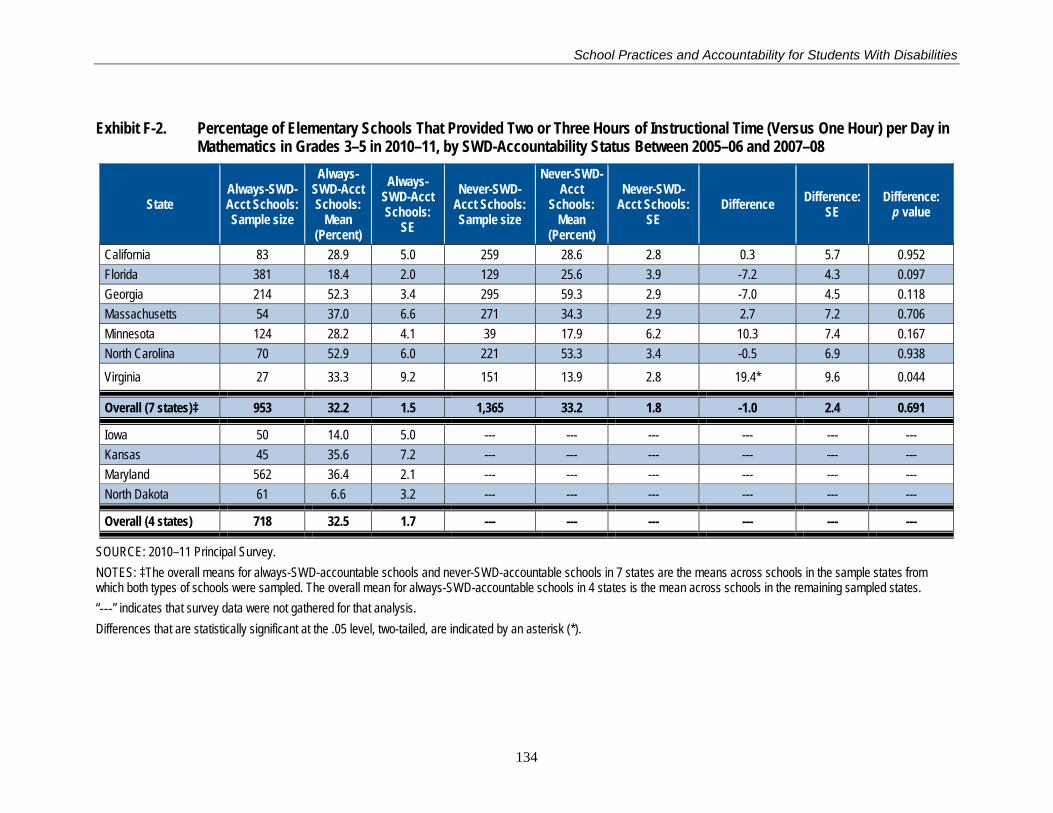
School Practices and Accountability for Students With Disabilities
Exhibit F-2. Percentage of Elementary Schools That Provided Two or Three Hours of Instructional Time (Versus One Hour) per Day in Mathematics in Grades 3–5 in 2010–11, by SWD-Accountability Status Between 2005–06 and 2007–08
State Always-SWD-Acct Schools: Sample size
Always-SWD-Acct Schools:
Mean (Percent)
Always-SWD-Acct Schools:
SE
Never-SWD-Acct Schools: Sample size
Never-SWD-Acct
Schools: Mean
(Percent)
Never-SWD-Acct Schools:
SE Difference Difference:
SE Difference:
p value
California 83 28.9 5.0 259 28.6 2.8 0.3 5.7 0.952 Florida 381 18.4 2.0 129 25.6 3.9 -7.2 4.3 0.097 Georgia 214 52.3 3.4 295 59.3 2.9 -7.0 4.5 0.118 Massachusetts 54 37.0 6.6 271 34.3 2.9 2.7 7.2 0.706 Minnesota 124 28.2 4.1 39 17.9 6.2 10.3 7.4 0.167 North Carolina 70 52.9 6.0 221 53.3 3.4 -0.5 6.9 0.938
Virginia 27 33.3 9.2 151 13.9 2.8 19.4* 9.6 0.044
Overall (7 states)‡ 953 32.2 1.5 1,365 33.2 1.8 -1.0 2.4 0.691
Iowa 50 14.0 5.0 --- --- --- --- --- --- Kansas 45 35.6 7.2 --- --- --- --- --- --- Maryland 562 36.4 2.1 --- --- --- --- --- --- North Dakota 61 6.6 3.2 --- --- --- --- --- ---
Overall (4 states) 718 32.5 1.7 --- --- --- --- --- ---
SOURCE: 2010–11 Principal Survey. NOTES: ‡The overall means for always-SWD-accountable schools and never-SWD-accountable schools in 7 states are the means across schools in the sample states from which both types of schools were sampled. The overall mean for always-SWD-accountable schools in 4 states is the mean across schools in the remaining sampled states. “---” indicates that survey data were not gathered for that analysis. Differences that are statistically significant at the .05 level, two-tailed, are indicated by an asterisk (*).
134
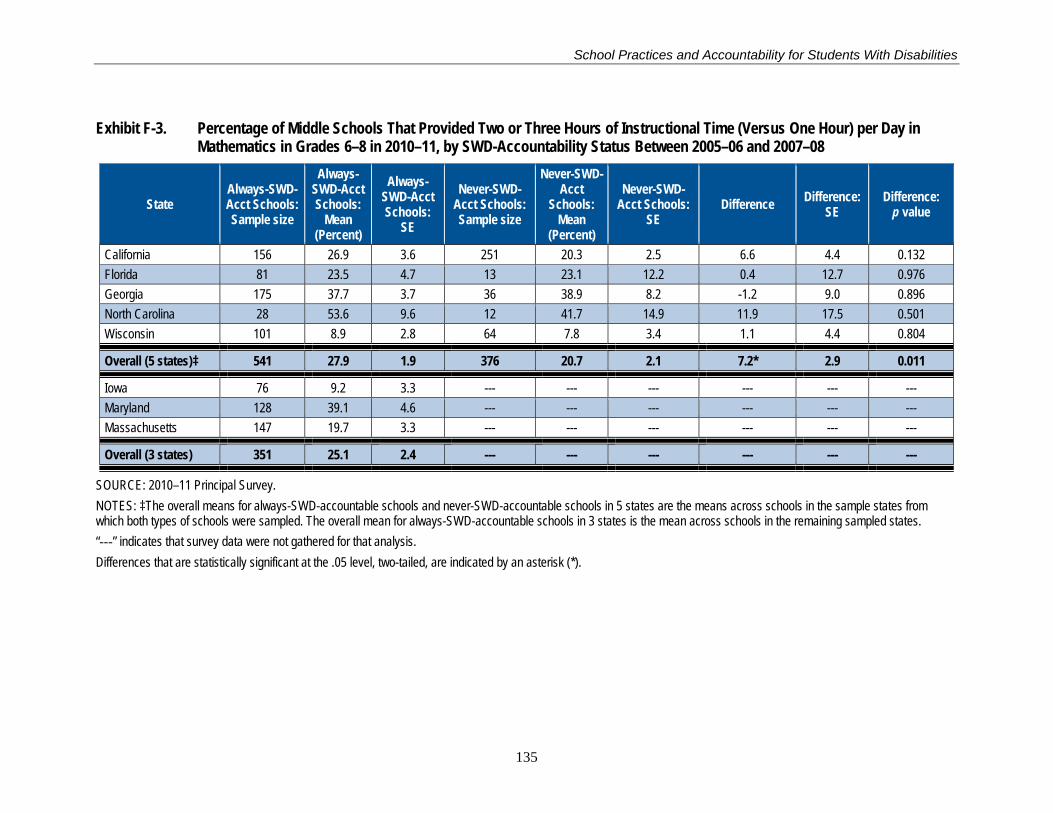
School Practices and Accountability for Students With Disabilities
Exhibit F-3. Percentage of Middle Schools That Provided Two or Three Hours of Instructional Time (Versus One Hour) per Day in Mathematics in Grades 6–8 in 2010–11, by SWD-Accountability Status Between 2005–06 and 2007–08
State Always-SWD-Acct Schools: Sample size
Always-SWD-Acct Schools:
Mean (Percent)
Always-SWD-Acct Schools:
SE
Never-SWD-Acct Schools: Sample size
Never-SWD-Acct
Schools: Mean
(Percent)
Never-SWD-Acct Schools:
SE Difference Difference:
SE Difference:
p value
California 156 26.9 3.6 251 20.3 2.5 6.6 4.4 0.132 Florida 81 23.5 4.7 13 23.1 12.2 0.4 12.7 0.976 Georgia 175 37.7 3.7 36 38.9 8.2 -1.2 9.0 0.896 North Carolina 28 53.6 9.6 12 41.7 14.9 11.9 17.5 0.501 Wisconsin 101 8.9 2.8 64 7.8 3.4 1.1 4.4 0.804
Overall (5 states)‡ 541 27.9 1.9 376 20.7 2.1 7.2* 2.9 0.011
Iowa 76 9.2 3.3 --- --- --- --- --- --- Maryland 128 39.1 4.6 --- --- --- --- --- --- Massachusetts 147 19.7 3.3 --- --- --- --- --- ---
Overall (3 states) 351 25.1 2.4 --- --- --- --- --- ---
SOURCE: 2010–11 Principal Survey. NOTES: ‡The overall means for always-SWD-accountable schools and never-SWD-accountable schools in 5 states are the means across schools in the sample states from which both types of schools were sampled. The overall mean for always-SWD-accountable schools in 3 states is the mean across schools in the remaining sampled states. “---” indicates that survey data were not gathered for that analysis. Differences that are statistically significant at the .05 level, two-tailed, are indicated by an asterisk (*).
135

School Practices and Accountability for Students With Disabilities
Exhibit F-4. Percentage of Elementary Schools That Provided Three Hours of Instructional Time (Versus One or Two Hours) per Day in Reading in Grades 1–2 in 2010–11, by SWD-Accountability Status Between 2005–06 and 2007–08
State Always-SWD-Acct Schools: Sample size
Always-SWD-Acct Schools:
Mean (Percent)
Always-SWD-Acct Schools:
SE
Never-SWD-Acct Schools: Sample size
Never-SWD-Acct
Schools: Mean
(Percent)
Never-SWD-Acct Schools:
SE Difference Difference:
SE Difference:
p value
California 82 42.7 5.5 248 38.7 3.1 4.0 6.3 0.528 Florida 376 17.6 2.0 125 14.4 3.2 3.2 3.7 0.396 Georgia 192 21.9 3.0 290 21.4 2.4 0.5 3.8 0.897 Massachusetts 35 34.3 8.1 264 20.1 2.5 14.2 8.4 0.093 Minnesota 120 10.8 2.8 38 5.3 3.7 5.6 4.6 0.231 North Carolina 63 23.8 5.4 216 8.8 1.9 15.0* 5.7 0.009
Virginia 22 13.6 7.5 150 22.0 3.4 -8.4 8.1 0.304
Overall (7 states)‡ 890 20.9 1.4 1,331 30.2 2.0 -9.3* 2.4 0.000
Iowa 45 17.8 5.8 --- --- --- --- --- --- Kansas 41 17.1 5.9 --- --- --- --- --- --- Maryland 548 33.2 2.0 --- --- --- --- --- --- North Dakota 59 23.7 5.6 --- --- --- --- --- ---
Overall (4 states) 693 30.6 1.8 --- --- --- --- --- ---
SOURCE: 2010–11 Principal Survey. NOTES: ‡The overall means for always-SWD-accountable schools and never-SWD-accountable schools in 7 states are the means across schools in the sample states from which both types of schools were sampled. The overall mean for always-SWD-accountable schools in 4 states is the mean across schools in the remaining sampled states. “---” indicates that survey data were not gathered for that analysis. Differences that are statistically significant at the .05 level, two-tailed, are indicated by an asterisk (*).
136
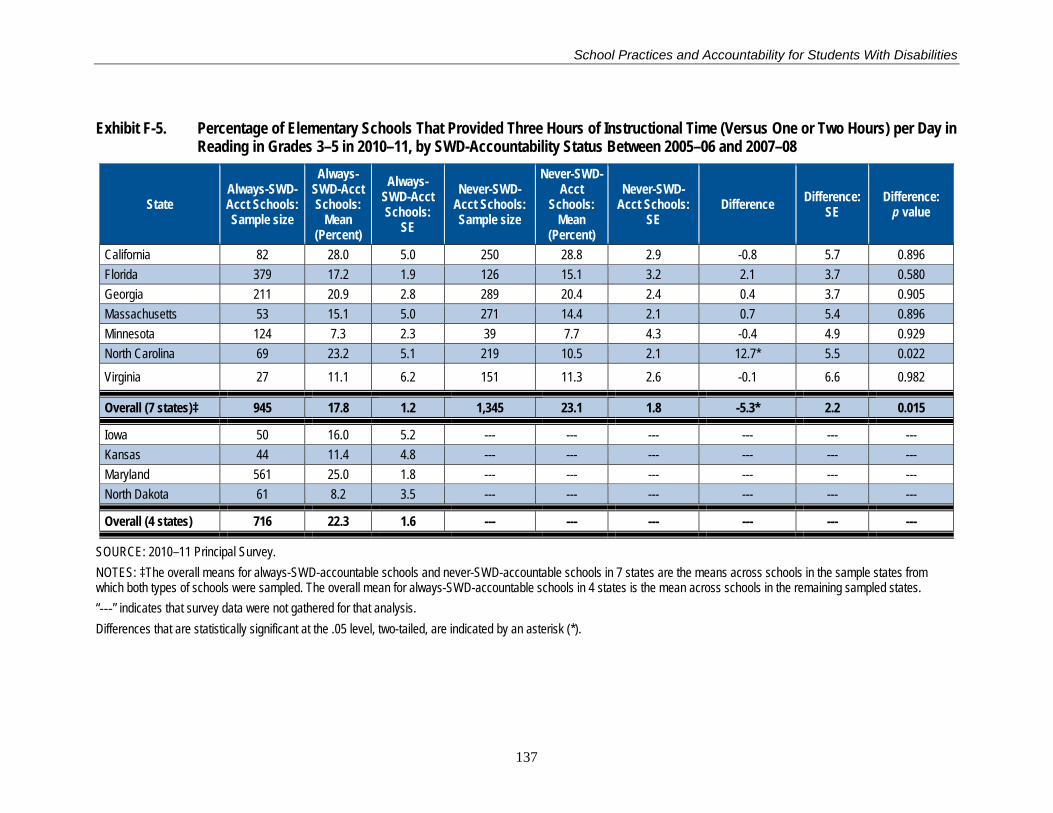
School Practices and Accountability for Students With Disabilities
Exhibit F-5. Percentage of Elementary Schools That Provided Three Hours of Instructional Time (Versus One or Two Hours) per Day in Reading in Grades 3–5 in 2010–11, by SWD-Accountability Status Between 2005–06 and 2007–08
State Always-SWD-Acct Schools: Sample size
Always-SWD-Acct Schools:
Mean (Percent)
Always-SWD-Acct Schools:
SE
Never-SWD-Acct Schools: Sample size
Never-SWD-Acct
Schools: Mean
(Percent)
Never-SWD-Acct Schools:
SE Difference Difference:
SE Difference:
p value
California 82 28.0 5.0 250 28.8 2.9 -0.8 5.7 0.896 Florida 379 17.2 1.9 126 15.1 3.2 2.1 3.7 0.580 Georgia 211 20.9 2.8 289 20.4 2.4 0.4 3.7 0.905 Massachusetts 53 15.1 5.0 271 14.4 2.1 0.7 5.4 0.896 Minnesota 124 7.3 2.3 39 7.7 4.3 -0.4 4.9 0.929 North Carolina 69 23.2 5.1 219 10.5 2.1 12.7* 5.5 0.022
Virginia 27 11.1 6.2 151 11.3 2.6 -0.1 6.6 0.982
Overall (7 states)‡ 945 17.8 1.2 1,345 23.1 1.8 -5.3* 2.2 0.015
Iowa 50 16.0 5.2 --- --- --- --- --- --- Kansas 44 11.4 4.8 --- --- --- --- --- --- Maryland 561 25.0 1.8 --- --- --- --- --- --- North Dakota 61 8.2 3.5 --- --- --- --- --- ---
Overall (4 states) 716 22.3 1.6 --- --- --- --- --- ---
SOURCE: 2010–11 Principal Survey. NOTES: ‡The overall means for always-SWD-accountable schools and never-SWD-accountable schools in 7 states are the means across schools in the sample states from which both types of schools were sampled. The overall mean for always-SWD-accountable schools in 4 states is the mean across schools in the remaining sampled states. “---” indicates that survey data were not gathered for that analysis. Differences that are statistically significant at the .05 level, two-tailed, are indicated by an asterisk (*).
137
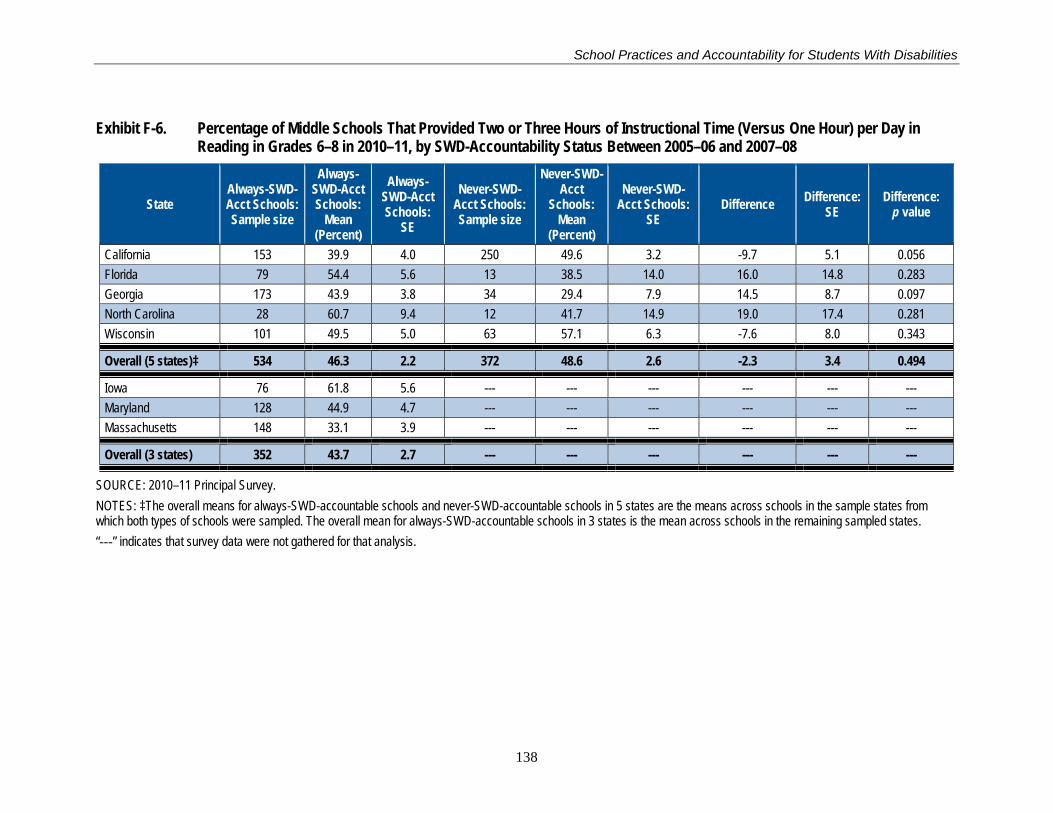
School Practices and Accountability for Students With Disabilities
Exhibit F-6. Percentage of Middle Schools That Provided Two or Three Hours of Instructional Time (Versus One Hour) per Day in Reading in Grades 6–8 in 2010–11, by SWD-Accountability Status Between 2005–06 and 2007–08
State Always-SWD-Acct Schools: Sample size
Always-SWD-Acct Schools:
Mean (Percent)
Always-SWD-Acct Schools:
SE
Never-SWD-Acct Schools: Sample size
Never-SWD-Acct
Schools: Mean
(Percent)
Never-SWD-Acct Schools:
SE Difference Difference:
SE Difference:
p value
California 153 39.9 4.0 250 49.6 3.2 -9.7 5.1 0.056 Florida 79 54.4 5.6 13 38.5 14.0 16.0 14.8 0.283 Georgia 173 43.9 3.8 34 29.4 7.9 14.5 8.7 0.097 North Carolina 28 60.7 9.4 12 41.7 14.9 19.0 17.4 0.281 Wisconsin 101 49.5 5.0 63 57.1 6.3 -7.6 8.0 0.343
Overall (5 states)‡ 534 46.3 2.2 372 48.6 2.6 -2.3 3.4 0.494
Iowa 76 61.8 5.6 --- --- --- --- --- --- Maryland 128 44.9 4.7 --- --- --- --- --- --- Massachusetts 148 33.1 3.9 --- --- --- --- --- ---
Overall (3 states) 352 43.7 2.7 --- --- --- --- --- ---
SOURCE: 2010–11 Principal Survey. NOTES: ‡The overall means for always-SWD-accountable schools and never-SWD-accountable schools in 5 states are the means across schools in the sample states from which both types of schools were sampled. The overall mean for always-SWD-accountable schools in 3 states is the mean across schools in the remaining sampled states. “---” indicates that survey data were not gathered for that analysis.
138
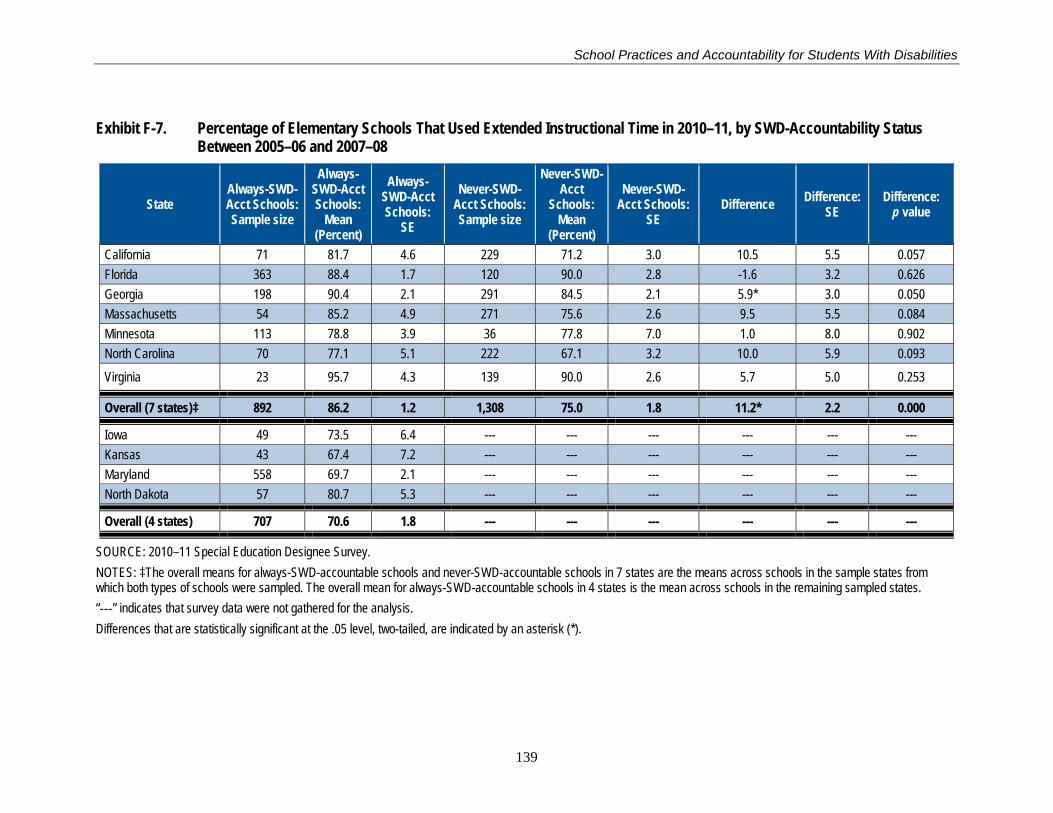
School Practices and Accountability for Students With Disabilities
Exhibit F-7. Percentage of Elementary Schools That Used Extended Instructional Time in 2010–11, by SWD-Accountability Status Between 2005–06 and 2007–08
State Always-SWD-Acct Schools: Sample size
Always-SWD-Acct Schools:
Mean (Percent)
Always-SWD-Acct Schools:
SE
Never-SWD-Acct Schools: Sample size
Never-SWD-Acct
Schools: Mean
(Percent)
Never-SWD-Acct Schools:
SE Difference Difference:
SE Difference:
p value
California 71 81.7 4.6 229 71.2 3.0 10.5 5.5 0.057 Florida 363 88.4 1.7 120 90.0 2.8 -1.6 3.2 0.626 Georgia 198 90.4 2.1 291 84.5 2.1 5.9* 3.0 0.050 Massachusetts 54 85.2 4.9 271 75.6 2.6 9.5 5.5 0.084 Minnesota 113 78.8 3.9 36 77.8 7.0 1.0 8.0 0.902 North Carolina 70 77.1 5.1 222 67.1 3.2 10.0 5.9 0.093
Virginia 23 95.7 4.3 139 90.0 2.6 5.7 5.0 0.253
Overall (7 states)‡ 892 86.2 1.2 1,308 75.0 1.8 11.2* 2.2 0.000
Iowa 49 73.5 6.4 --- --- --- --- --- --- Kansas 43 67.4 7.2 --- --- --- --- --- --- Maryland 558 69.7 2.1 --- --- --- --- --- --- North Dakota 57 80.7 5.3 --- --- --- --- --- ---
Overall (4 states) 707 70.6 1.8 --- --- --- --- --- ---
SOURCE: 2010–11 Special Education Designee Survey. NOTES: ‡The overall means for always-SWD-accountable schools and never-SWD-accountable schools in 7 states are the means across schools in the sample states from which both types of schools were sampled. The overall mean for always-SWD-accountable schools in 4 states is the mean across schools in the remaining sampled states. “---” indicates that survey data were not gathered for the analysis. Differences that are statistically significant at the .05 level, two-tailed, are indicated by an asterisk (*).
139
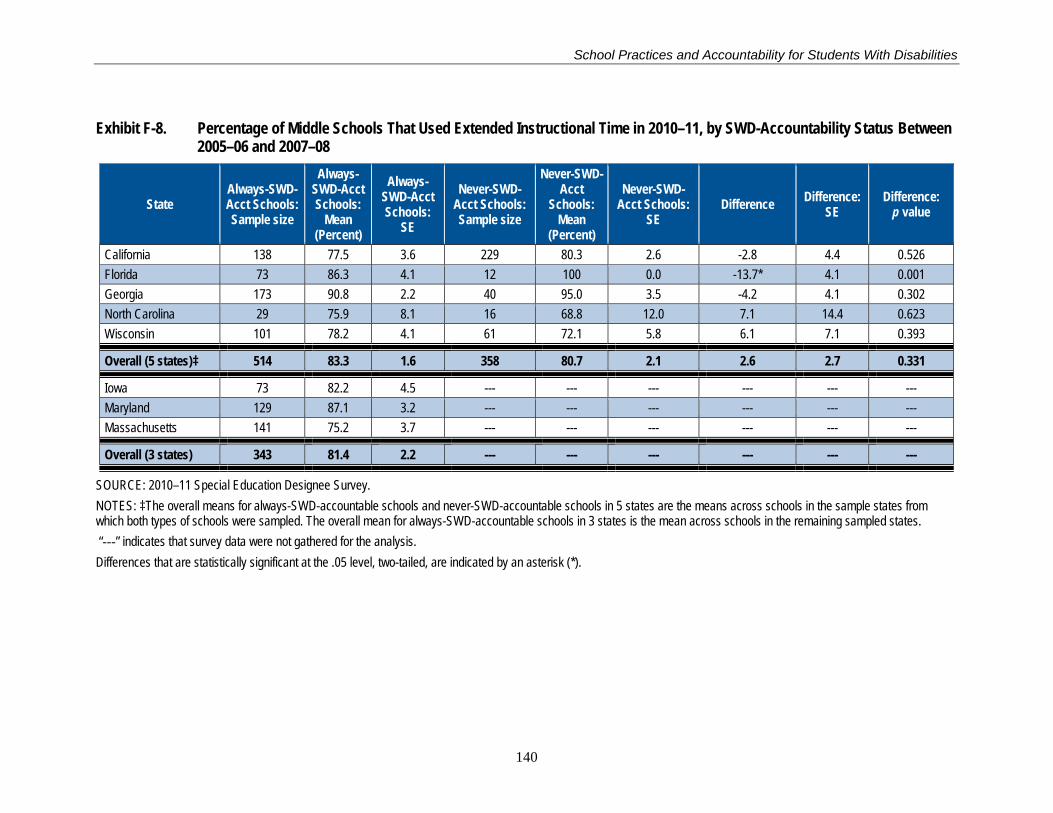
School Practices and Accountability for Students With Disabilities
Exhibit F-8. Percentage of Middle Schools That Used Extended Instructional Time in 2010–11, by SWD-Accountability Status Between 2005–06 and 2007–08
State Always-SWD-Acct Schools: Sample size
Always-SWD-Acct Schools:
Mean (Percent)
Always-SWD-Acct Schools:
SE
Never-SWD-Acct Schools: Sample size
Never-SWD-Acct
Schools: Mean
(Percent)
Never-SWD-Acct Schools:
SE Difference Difference:
SE Difference:
p value
California 138 77.5 3.6 229 80.3 2.6 -2.8 4.4 0.526 Florida 73 86.3 4.1 12 100 0.0 -13.7* 4.1 0.001 Georgia 173 90.8 2.2 40 95.0 3.5 -4.2 4.1 0.302 North Carolina 29 75.9 8.1 16 68.8 12.0 7.1 14.4 0.623 Wisconsin 101 78.2 4.1 61 72.1 5.8 6.1 7.1 0.393
Overall (5 states)‡ 514 83.3 1.6 358 80.7 2.1 2.6 2.7 0.331
Iowa 73 82.2 4.5 --- --- --- --- --- --- Maryland 129 87.1 3.2 --- --- --- --- --- --- Massachusetts 141 75.2 3.7 --- --- --- --- --- ---
Overall (3 states) 343 81.4 2.2 --- --- --- --- --- ---
SOURCE: 2010–11 Special Education Designee Survey. NOTES: ‡The overall means for always-SWD-accountable schools and never-SWD-accountable schools in 5 states are the means across schools in the sample states from which both types of schools were sampled. The overall mean for always-SWD-accountable schools in 3 states is the mean across schools in the remaining sampled states. “---” indicates that survey data were not gathered for the analysis. Differences that are statistically significant at the .05 level, two-tailed, are indicated by an asterisk (*).
140
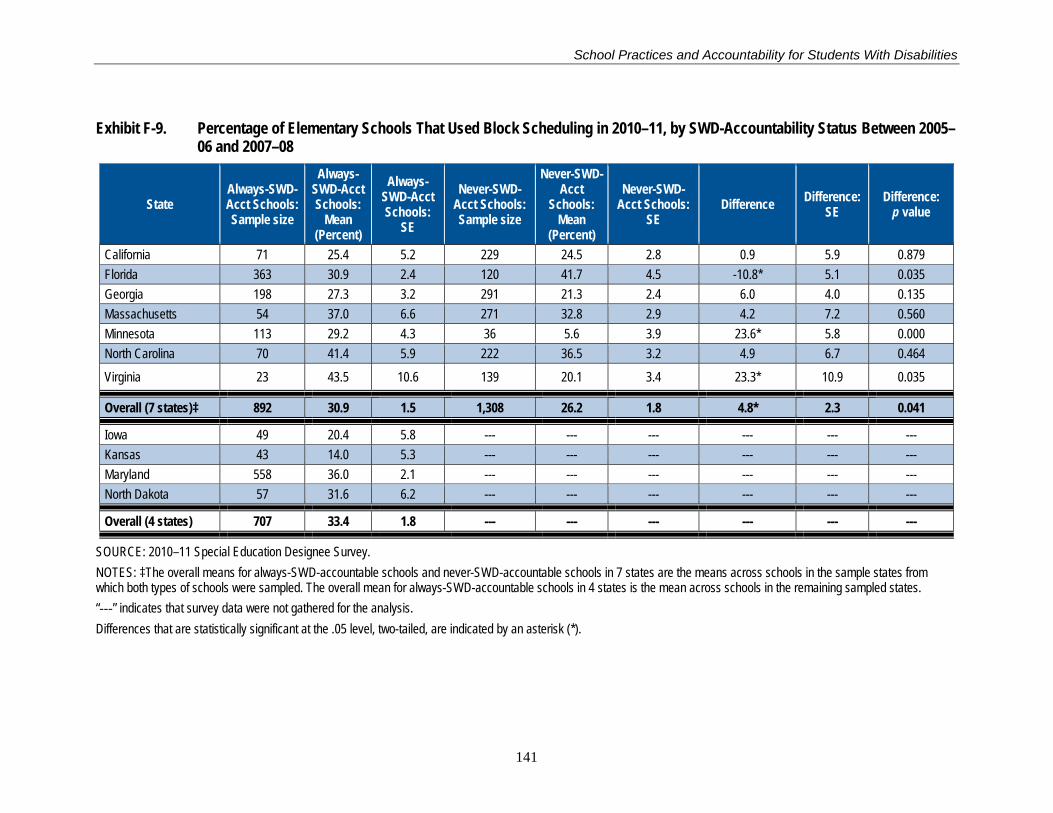
School Practices and Accountability for Students With Disabilities
Exhibit F-9. Percentage of Elementary Schools That Used Block Scheduling in 2010–11, by SWD-Accountability Status Between 2005–06 and 2007–08
State Always-SWD-Acct Schools: Sample size
Always-SWD-Acct Schools:
Mean (Percent)
Always-SWD-Acct Schools:
SE
Never-SWD-Acct Schools: Sample size
Never-SWD-Acct
Schools: Mean
(Percent)
Never-SWD-Acct Schools:
SE Difference Difference:
SE Difference:
p value
California 71 25.4 5.2 229 24.5 2.8 0.9 5.9 0.879 Florida 363 30.9 2.4 120 41.7 4.5 -10.8* 5.1 0.035 Georgia 198 27.3 3.2 291 21.3 2.4 6.0 4.0 0.135 Massachusetts 54 37.0 6.6 271 32.8 2.9 4.2 7.2 0.560 Minnesota 113 29.2 4.3 36 5.6 3.9 23.6* 5.8 0.000 North Carolina 70 41.4 5.9 222 36.5 3.2 4.9 6.7 0.464
Virginia 23 43.5 10.6 139 20.1 3.4 23.3* 10.9 0.035
Overall (7 states)‡ 892 30.9 1.5 1,308 26.2 1.8 4.8* 2.3 0.041
Iowa 49 20.4 5.8 --- --- --- --- --- --- Kansas 43 14.0 5.3 --- --- --- --- --- --- Maryland 558 36.0 2.1 --- --- --- --- --- --- North Dakota 57 31.6 6.2 --- --- --- --- --- ---
Overall (4 states) 707 33.4 1.8 --- --- --- --- --- ---
SOURCE: 2010–11 Special Education Designee Survey. NOTES: ‡The overall means for always-SWD-accountable schools and never-SWD-accountable schools in 7 states are the means across schools in the sample states from which both types of schools were sampled. The overall mean for always-SWD-accountable schools in 4 states is the mean across schools in the remaining sampled states. “---” indicates that survey data were not gathered for the analysis. Differences that are statistically significant at the .05 level, two-tailed, are indicated by an asterisk (*).
141

School Practices and Accountability for Students With Disabilities
Exhibit F-10. Percentage of Middle Schools That Used Block Scheduling in 2010–11, by SWD-Accountability Status Between 2005–06 and 2007–08
State Always-SWD-Acct Schools: Sample size
Always-SWD-Acct Schools:
Mean (Percent)
Always-SWD-Acct Schools:
SE
Never-SWD-Acct Schools: Sample size
Never-SWD-Acct
Schools: Mean
(Percent)
Never-SWD-Acct Schools:
SE Difference Difference:
SE Difference:
p value
California 138 42.8 4.2 229 48.0 3.3 -5.3 5.4 0.326 Florida 73 37.0 5.7 12 58.3 14.9 -21.3 15.5 0.172 Georgia 173 27.2 3.4 40 42.5 7.9 -15.3 8.6 0.075 North Carolina 29 62.1 9.2 16 75.0 11.1 -12.9 14.4 0.374 Wisconsin 101 29.7 4.6 61 18.0 5.0 11.7 6.7 0.085
Overall (5 states)‡ 514 35.2 2.1 358 44.4 2.6 -9.3* 3.4 0.006
Iowa 73 34.3 5.6 --- --- --- --- --- --- Maryland 129 46.1 4.7 --- --- --- --- --- --- Massachusetts 141 41.8 4.2 --- --- --- --- --- ---
Overall (3 states) 343 42.0 2.7 --- --- --- --- --- ---
SOURCE: 2010–11 Special Education Designee Survey. NOTES: ‡The overall means for always-SWD-accountable schools and never-SWD-accountable schools in 5 states are the means across schools in the sample states from which both types of schools were sampled. The overall mean for always-SWD-accountable schools in 3 states is the mean across schools in the remaining sampled states. “---” indicates that survey data were not gathered for the analysis. Differences that are statistically significant at the .05 level, two-tailed, are indicated by an asterisk (*).
142
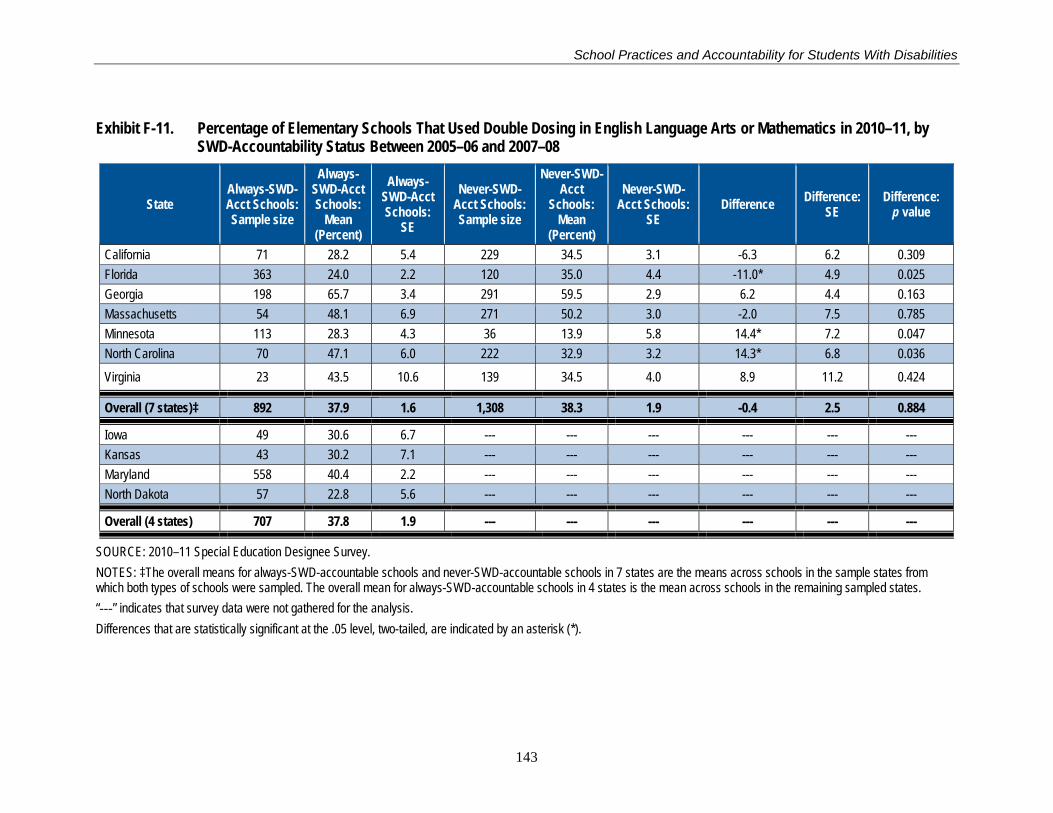
School Practices and Accountability for Students With Disabilities
Exhibit F-11. Percentage of Elementary Schools That Used Double Dosing in English Language Arts or Mathematics in 2010–11, by SWD-Accountability Status Between 2005–06 and 2007–08
State Always-SWD-Acct Schools: Sample size
Always-SWD-Acct Schools:
Mean (Percent)
Always-SWD-Acct Schools:
SE
Never-SWD-Acct Schools: Sample size
Never-SWD-Acct
Schools: Mean
(Percent)
Never-SWD-Acct Schools:
SE Difference Difference:
SE Difference:
p value
California 71 28.2 5.4 229 34.5 3.1 -6.3 6.2 0.309 Florida 363 24.0 2.2 120 35.0 4.4 -11.0* 4.9 0.025 Georgia 198 65.7 3.4 291 59.5 2.9 6.2 4.4 0.163 Massachusetts 54 48.1 6.9 271 50.2 3.0 -2.0 7.5 0.785 Minnesota 113 28.3 4.3 36 13.9 5.8 14.4* 7.2 0.047 North Carolina 70 47.1 6.0 222 32.9 3.2 14.3* 6.8 0.036
Virginia 23 43.5 10.6 139 34.5 4.0 8.9 11.2 0.424
Overall (7 states)‡ 892 37.9 1.6 1,308 38.3 1.9 -0.4 2.5 0.884
Iowa 49 30.6 6.7 --- --- --- --- --- --- Kansas 43 30.2 7.1 --- --- --- --- --- --- Maryland 558 40.4 2.2 --- --- --- --- --- --- North Dakota 57 22.8 5.6 --- --- --- --- --- ---
Overall (4 states) 707 37.8 1.9 --- --- --- --- --- ---
SOURCE: 2010–11 Special Education Designee Survey. NOTES: ‡The overall means for always-SWD-accountable schools and never-SWD-accountable schools in 7 states are the means across schools in the sample states from which both types of schools were sampled. The overall mean for always-SWD-accountable schools in 4 states is the mean across schools in the remaining sampled states. “---” indicates that survey data were not gathered for the analysis. Differences that are statistically significant at the .05 level, two-tailed, are indicated by an asterisk (*).
143

School Practices and Accountability for Students With Disabilities
Exhibit F-12. Percentage of Middle Schools That Used Double Dosing in English Language Arts or Mathematics in 2010–11, by SWD-Accountability Status Between 2005–06 and 2007–08
State Always-SWD-Acct Schools: Sample size
Always-SWD-Acct Schools:
Mean (Percent)
Always-SWD-Acct Schools:
SE
Never-SWD-Acct Schools: Sample size
Never-SWD-Acct
Schools: Mean
(Percent)
Never-SWD-Acct Schools:
SE Difference Difference:
SE Difference:
p value
California 138 61.6 4.2 229 70.3 3.0 -8.7 5.1 0.091 Florida 73 43.8 5.8 12 58.3 14.9 -14.5 15.6 0.354 Georgia 173 75.1 3.3 40 75.0 6.9 0.1 7.6 0.985 North Carolina 29 27.6 8.4 16 31.3 12.0 -3.7 14.6 0.803 Wisconsin 101 39.6 4.9 61 21.3 5.3 18.3* 7.2 0.012
Overall (5 states)‡ 514 57.4 2.2 358 61.8 2.6 -4.4 3.4 0.191
Iowa 73 24.7 5.1 --- --- --- --- --- --- Maryland 129 49.0 4.7 --- --- --- --- --- --- Massachusetts 141 46.1 4.2 --- --- --- --- --- ---
Overall (3 states) 343 42.9 2.8 --- --- --- --- --- ---
SOURCE: 2010–11 Special Education Designee Survey. NOTES: ‡The overall means for always-SWD-accountable schools and never-SWD-accountable schools in 5 states are the means across schools in the sample states from which both types of schools were sampled. The overall mean for always-SWD-accountable schools in 3 states is the mean across schools in the remaining sampled states. “---” indicates that survey data were not gathered for the analysis. Differences that are statistically significant at the .05 level, two-tailed, are indicated by an asterisk (*).
144

School Practices and Accountability for Students With Disabilities
Exhibit F-13. Percentage of Students With Disabilities in Elementary Schools Receiving Extended Instructional Time in Mathematics in 2010–11, by SWD-Accountability Status Between 2005–06 and 2007–08
State Always-SWD-Acct Schools: Sample size
Always-SWD-Acct Schools:
Mean (Percent)
Always-SWD-Acct Schools:
SE
Never-SWD-Acct Schools: Sample size
Never-SWD-Acct
Schools: Mean
(Percent)
Never-SWD-Acct Schools:
SE Difference Difference:
SE Difference:
p value
California 56 11.5 2.6 199 14.4 1.6 -3.0 3.0 0.330 Florida 282 20.2 1.3 108 23.3 2.5 -3.1 2.8 0.271 Georgia 170 14.3 1.2 257 18.4 1.4 -4.2* 1.9 0.025 Massachusetts 45 11.2 2.3 238 13.0 1.4 -1.8 2.6 0.498 Minnesota 91 14.3 2.2 32 4.0 1.3 10.3* 2.5 0.000 North Carolina 61 9.0 2.0 201 14.9 1.5 -5.9* 2.5 0.017
Virginia 22 9.1 2.1 112 20.8 2.4 -11.7* 3.2 0.000
Overall (7 states)‡ 727 15.6 0.7 1,147 15.6 1.0 0.0 1.2 0.968
Iowa 40 10.1 3.2 --- --- --- --- --- --- Kansas 39 7.4 1.8 --- --- --- --- --- --- Maryland 503 14.5 0.9 --- --- --- --- --- --- North Dakota 54 6.6 1.6 --- --- --- --- --- ---
Overall (4 states) 636 13.2 0.8 --- --- --- --- --- ---
SOURCE: 2010–11 Special Education Designee Survey. NOTES: ‡The overall means for always-SWD-accountable schools and never-SWD-accountable schools in 7 states are the means across schools in the sample states from which both types of schools were sampled. The overall mean for always-SWD-accountable schools in 4 states is the mean across schools in the remaining sampled states. “---” indicates that survey data were not gathered for that analysis. Differences that are statistically significant at the .05 level, two-tailed, are indicated by an asterisk (*).
145
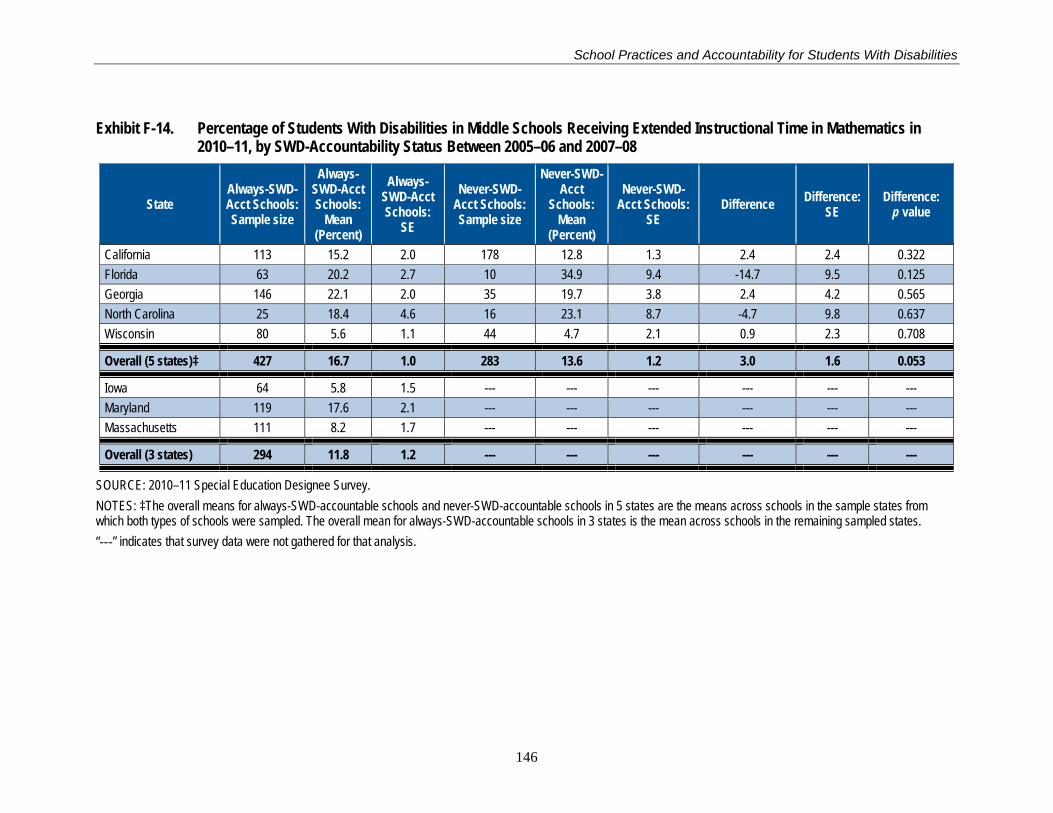
School Practices and Accountability for Students With Disabilities
Exhibit F-14. Percentage of Students With Disabilities in Middle Schools Receiving Extended Instructional Time in Mathematics in 2010–11, by SWD-Accountability Status Between 2005–06 and 2007–08
State Always-SWD-Acct Schools: Sample size
Always-SWD-Acct Schools:
Mean (Percent)
Always-SWD-Acct Schools:
SE
Never-SWD-Acct Schools: Sample size
Never-SWD-Acct
Schools: Mean
(Percent)
Never-SWD-Acct Schools:
SE Difference Difference:
SE Difference:
p value
California 113 15.2 2.0 178 12.8 1.3 2.4 2.4 0.322 Florida 63 20.2 2.7 10 34.9 9.4 -14.7 9.5 0.125 Georgia 146 22.1 2.0 35 19.7 3.8 2.4 4.2 0.565 North Carolina 25 18.4 4.6 16 23.1 8.7 -4.7 9.8 0.637 Wisconsin 80 5.6 1.1 44 4.7 2.1 0.9 2.3 0.708
Overall (5 states)‡ 427 16.7 1.0 283 13.6 1.2 3.0 1.6 0.053
Iowa 64 5.8 1.5 --- --- --- --- --- --- Maryland 119 17.6 2.1 --- --- --- --- --- --- Massachusetts 111 8.2 1.7 --- --- --- --- --- ---
Overall (3 states) 294 11.8 1.2 --- --- --- --- --- ---
SOURCE: 2010–11 Special Education Designee Survey. NOTES: ‡The overall means for always-SWD-accountable schools and never-SWD-accountable schools in 5 states are the means across schools in the sample states from which both types of schools were sampled. The overall mean for always-SWD-accountable schools in 3 states is the mean across schools in the remaining sampled states. “---” indicates that survey data were not gathered for that analysis.
146

School Practices and Accountability for Students With Disabilities
Exhibit F-15. Percentage of Students With Disabilities in Elementary Schools Receiving Extended Instructional Time in Reading in 2010–11, by SWD-Accountability Status Between 2005–06 and 2007–08
State Always-SWD-Acct Schools: Sample size
Always-SWD-Acct Schools:
Mean (Percent)
Always-SWD-Acct Schools:
SE
Never-SWD-Acct Schools: Sample size
Never-SWD-Acct
Schools: Mean
(Percent)
Never-SWD-Acct Schools:
SE Difference Difference:
SE Difference:
p value
California 57 12.6 2.5 199 16.4 1.7 -3.8 3.0 0.207 Florida 282 24.7 1.4 108 27.3 2.5 -2.6 3.0 0.364 Georgia 170 13.7 1.2 257 18.3 1.4 -4.5* 1.8 0.014 Massachusetts 45 13.6 3.1 238 14.5 1.6 -0.9 3.4 0.785 Minnesota 90 15.2 2.2 32 4.3 1.5 10.9* 2.6 0.000 North Carolina 61 9.4 2.0 201 15.0 1.5 -5.6* 2.5 0.026
Virginia 22 12.3 3.0 112 22.8 2.5 -10.5* 3.9 0.007
Overall (7 states)‡ 727 17.7 0.8 1,147 17.2 1.0 0.4 1.3 0.709
Iowa 40 10.5 3.2 --- --- --- --- --- --- Kansas 39 6.8 1.7 --- --- --- --- --- --- Maryland 502 13.9 0.9 --- --- --- --- --- --- North Dakota 54 7.0 1.8 --- --- --- --- --- ---
Overall (4 states) 635 12.6 0.8 --- --- --- --- --- ---
SOURCE: 2010–11 Special Education Designee Survey. NOTES: ‡The overall means for always-SWD-accountable schools and never-SWD-accountable schools in 7 states are the means across schools in the sample states from which both types of schools were sampled. The overall mean for always-SWD-accountable schools in 4 states is the mean across schools in the remaining sampled states. “---” indicates that survey data were not gathered for that analysis. Differences that are statistically significant at the .05 level, two-tailed, are indicated by an asterisk (*).
147
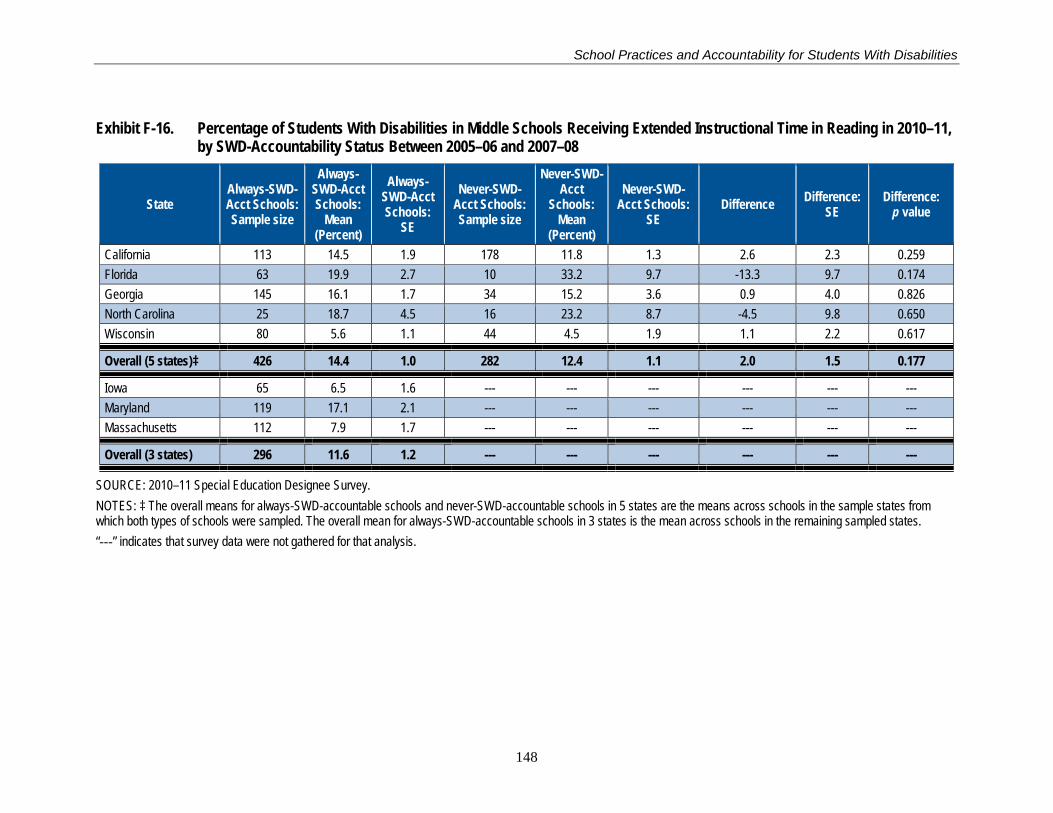
School Practices and Accountability for Students With Disabilities
Exhibit F-16. Percentage of Students With Disabilities in Middle Schools Receiving Extended Instructional Time in Reading in 2010–11, by SWD-Accountability Status Between 2005–06 and 2007–08
State Always-SWD-Acct Schools: Sample size
Always-SWD-Acct Schools:
Mean (Percent)
Always-SWD-Acct Schools:
SE
Never-SWD-Acct Schools: Sample size
Never-SWD-Acct
Schools: Mean
(Percent)
Never-SWD-Acct Schools:
SE Difference Difference:
SE Difference:
p value
California 113 14.5 1.9 178 11.8 1.3 2.6 2.3 0.259 Florida 63 19.9 2.7 10 33.2 9.7 -13.3 9.7 0.174 Georgia 145 16.1 1.7 34 15.2 3.6 0.9 4.0 0.826 North Carolina 25 18.7 4.5 16 23.2 8.7 -4.5 9.8 0.650 Wisconsin 80 5.6 1.1 44 4.5 1.9 1.1 2.2 0.617
Overall (5 states)‡ 426 14.4 1.0 282 12.4 1.1 2.0 1.5 0.177
Iowa 65 6.5 1.6 --- --- --- --- --- --- Maryland 119 17.1 2.1 --- --- --- --- --- --- Massachusetts 112 7.9 1.7 --- --- --- --- --- ---
Overall (3 states) 296 11.6 1.2 --- --- --- --- --- ---
SOURCE: 2010–11 Special Education Designee Survey. NOTES: ‡ The overall means for always-SWD-accountable schools and never-SWD-accountable schools in 5 states are the means across schools in the sample states from which both types of schools were sampled. The overall mean for always-SWD-accountable schools in 3 states is the mean across schools in the remaining sampled states. “---” indicates that survey data were not gathered for that analysis.
148
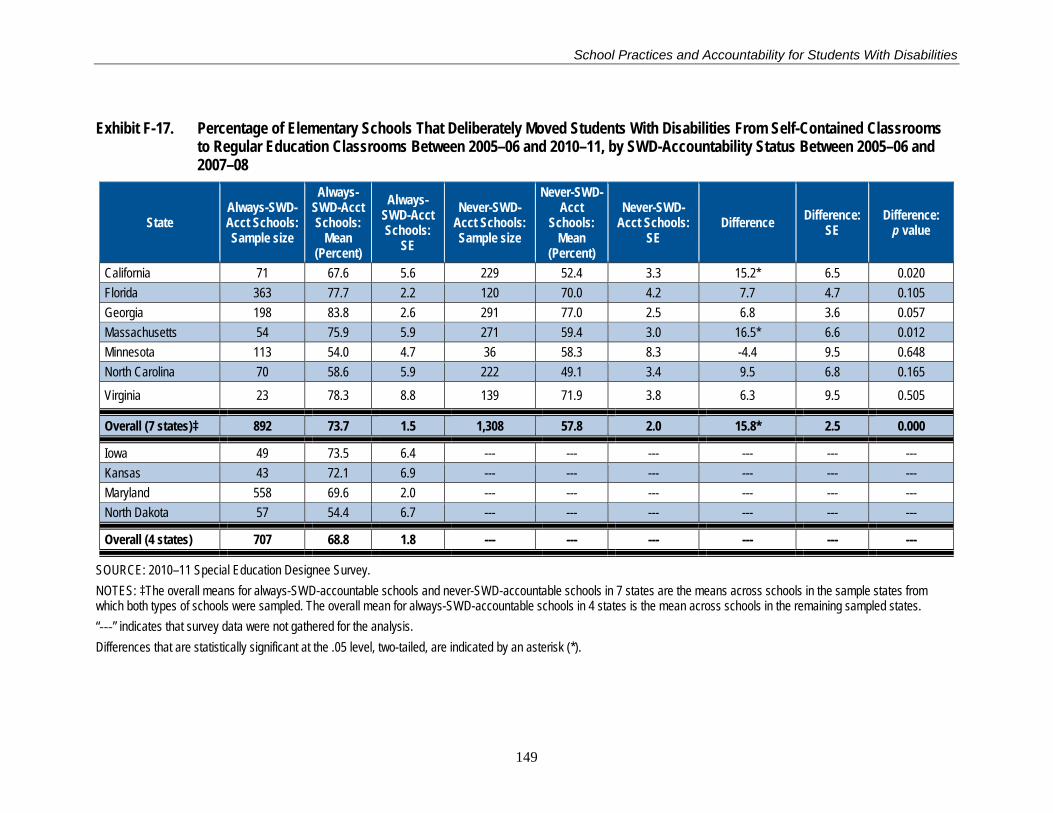
School Practices and Accountability for Students With Disabilities
Exhibit F-17. Percentage of Elementary Schools That Deliberately Moved Students With Disabilities From Self-Contained Classrooms to Regular Education Classrooms Between 2005–06 and 2010–11, by SWD-Accountability Status Between 2005–06 and 2007–08
State Always-SWD-Acct Schools: Sample size
Always-SWD-Acct Schools:
Mean (Percent)
Always-SWD-Acct Schools:
SE
Never-SWD-Acct Schools: Sample size
Never-SWD-Acct
Schools: Mean
(Percent)
Never-SWD-Acct Schools:
SE Difference Difference:
SE Difference:
p value
California 71 67.6 5.6 229 52.4 3.3 15.2* 6.5 0.020 Florida 363 77.7 2.2 120 70.0 4.2 7.7 4.7 0.105 Georgia 198 83.8 2.6 291 77.0 2.5 6.8 3.6 0.057 Massachusetts 54 75.9 5.9 271 59.4 3.0 16.5* 6.6 0.012 Minnesota 113 54.0 4.7 36 58.3 8.3 -4.4 9.5 0.648 North Carolina 70 58.6 5.9 222 49.1 3.4 9.5 6.8 0.165
Virginia 23 78.3 8.8 139 71.9 3.8 6.3 9.5 0.505
Overall (7 states)‡ 892 73.7 1.5 1,308 57.8 2.0 15.8* 2.5 0.000
Iowa 49 73.5 6.4 --- --- --- --- --- --- Kansas 43 72.1 6.9 --- --- --- --- --- --- Maryland 558 69.6 2.0 --- --- --- --- --- --- North Dakota 57 54.4 6.7 --- --- --- --- --- ---
Overall (4 states) 707 68.8 1.8 --- --- --- --- --- ---
SOURCE: 2010–11 Special Education Designee Survey. NOTES: ‡The overall means for always-SWD-accountable schools and never-SWD-accountable schools in 7 states are the means across schools in the sample states from which both types of schools were sampled. The overall mean for always-SWD-accountable schools in 4 states is the mean across schools in the remaining sampled states. “---” indicates that survey data were not gathered for the analysis. Differences that are statistically significant at the .05 level, two-tailed, are indicated by an asterisk (*).
149
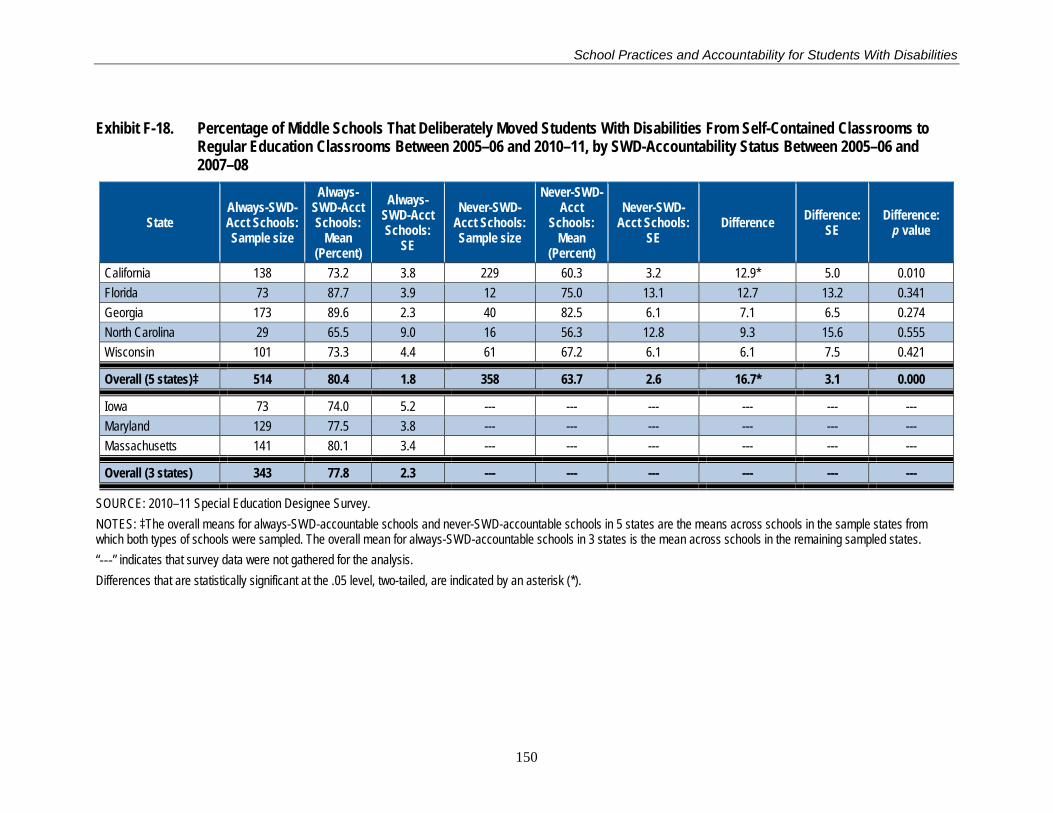
School Practices and Accountability for Students With Disabilities
Exhibit F-18. Percentage of Middle Schools That Deliberately Moved Students With Disabilities From Self-Contained Classrooms to Regular Education Classrooms Between 2005–06 and 2010–11, by SWD-Accountability Status Between 2005–06 and 2007–08
State Always-SWD-Acct Schools: Sample size
Always-SWD-Acct Schools:
Mean (Percent)
Always-SWD-Acct Schools:
SE
Never-SWD-Acct Schools: Sample size
Never-SWD-Acct
Schools: Mean
(Percent)
Never-SWD-Acct Schools:
SE Difference Difference:
SE Difference:
p value
California 138 73.2 3.8 229 60.3 3.2 12.9* 5.0 0.010 Florida 73 87.7 3.9 12 75.0 13.1 12.7 13.2 0.341 Georgia 173 89.6 2.3 40 82.5 6.1 7.1 6.5 0.274 North Carolina 29 65.5 9.0 16 56.3 12.8 9.3 15.6 0.555 Wisconsin 101 73.3 4.4 61 67.2 6.1 6.1 7.5 0.421
Overall (5 states)‡ 514 80.4 1.8 358 63.7 2.6 16.7* 3.1 0.000
Iowa 73 74.0 5.2 --- --- --- --- --- --- Maryland 129 77.5 3.8 --- --- --- --- --- --- Massachusetts 141 80.1 3.4 --- --- --- --- --- ---
Overall (3 states) 343 77.8 2.3 --- --- --- --- --- ---
SOURCE: 2010–11 Special Education Designee Survey. NOTES: ‡The overall means for always-SWD-accountable schools and never-SWD-accountable schools in 5 states are the means across schools in the sample states from which both types of schools were sampled. The overall mean for always-SWD-accountable schools in 3 states is the mean across schools in the remaining sampled states. “---” indicates that survey data were not gathered for the analysis. Differences that are statistically significant at the .05 level, two-tailed, are indicated by an asterisk (*).
150
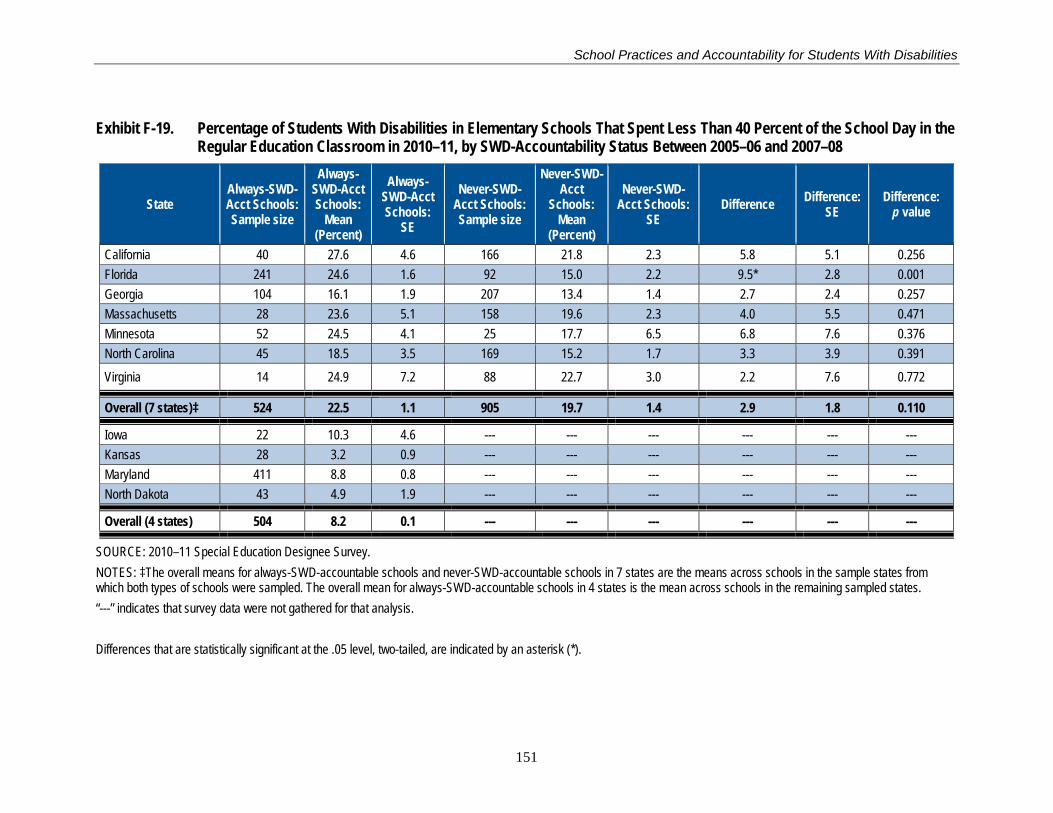
School Practices and Accountability for Students With Disabilities
Exhibit F-19. Percentage of Students With Disabilities in Elementary Schools That Spent Less Than 40 Percent of the School Day in the Regular Education Classroom in 2010–11, by SWD-Accountability Status Between 2005–06 and 2007–08
State Always-SWD-Acct Schools: Sample size
Always-SWD-Acct Schools:
Mean (Percent)
Always-SWD-Acct Schools:
SE
Never-SWD-Acct Schools: Sample size
Never-SWD-Acct
Schools: Mean
(Percent)
Never-SWD-Acct Schools:
SE Difference Difference:
SE Difference:
p value
California 40 27.6 4.6 166 21.8 2.3 5.8 5.1 0.256 Florida 241 24.6 1.6 92 15.0 2.2 9.5* 2.8 0.001 Georgia 104 16.1 1.9 207 13.4 1.4 2.7 2.4 0.257 Massachusetts 28 23.6 5.1 158 19.6 2.3 4.0 5.5 0.471 Minnesota 52 24.5 4.1 25 17.7 6.5 6.8 7.6 0.376 North Carolina 45 18.5 3.5 169 15.2 1.7 3.3 3.9 0.391
Virginia 14 24.9 7.2 88 22.7 3.0 2.2 7.6 0.772
Overall (7 states)‡ 524 22.5 1.1 905 19.7 1.4 2.9 1.8 0.110
Iowa 22 10.3 4.6 --- --- --- --- --- --- Kansas 28 3.2 0.9 --- --- --- --- --- --- Maryland 411 8.8 0.8 --- --- --- --- --- --- North Dakota 43 4.9 1.9 --- --- --- --- --- ---
Overall (4 states) 504 8.2 0.1 --- --- --- --- --- ---
SOURCE: 2010–11 Special Education Designee Survey. NOTES: ‡The overall means for always-SWD-accountable schools and never-SWD-accountable schools in 7 states are the means across schools in the sample states from which both types of schools were sampled. The overall mean for always-SWD-accountable schools in 4 states is the mean across schools in the remaining sampled states. “---” indicates that survey data were not gathered for that analysis. Differences that are statistically significant at the .05 level, two-tailed, are indicated by an asterisk (*).
151

School Practices and Accountability for Students With Disabilities
Exhibit F-20. Percentage of Students With Disabilities in Middle Schools That Spent Less Than 40 Percent of the School Day in the Regular Education Classroom in 2010–11, by SWD-Accountability Status Between 2005–06 and 2007–08
State Always-SWD-Acct Schools: Sample size
Always-SWD-Acct Schools:
Mean (Percent)
Always-SWD-Acct Schools:
SE
Never-SWD-Acct Schools: Sample size
Never-SWD-Acct
Schools: Mean
(Percent)
Never-SWD-Acct Schools:
SE Difference Difference:
SE Difference:
p value
California 73 28.4 2.9 135 25.2 2.2 3.2 3.7 0.392 Florida 47 20.2 3.2 8 14.5 6.0 5.7 6.5 0.386 Georgia 88 16.8 1.7 26 9.7 2.1 7.1* 2.7 0.009 North Carolina 20 19.2 4.6 12 18.1 4.6 1.1 6.5 0.868 Wisconsin 44 9.1 2.0 31 15.6 4.8 -6.5 5.2 0.217
Overall (5 states)‡ 272 19.4 1.3 212 21.7 1.7 -2.3 2.1 0.288
Iowa 37 17.3 4.5 --- --- --- --- --- --- Maryland 100 12.0 1.9 --- --- --- --- --- --- Massachusetts 61 20.1 3.4 --- --- --- --- --- ---
Overall (3 states) 198 15.3 1.6 --- --- --- --- --- ---
SOURCE: 2010–11 Special Education Designee Survey. NOTES: ‡The overall means for always-SWD-accountable schools and never-SWD-accountable schools in 5 states are the means across schools in the sample states from which both types of schools were sampled. The overall mean for always-SWD-accountable schools in 3 states is the mean across schools in the remaining sampled states. “---” indicates that survey data were not gathered for that analysis. Differences that are statistically significant at the .05 level, two-tailed, are indicated by an asterisk (*).
152
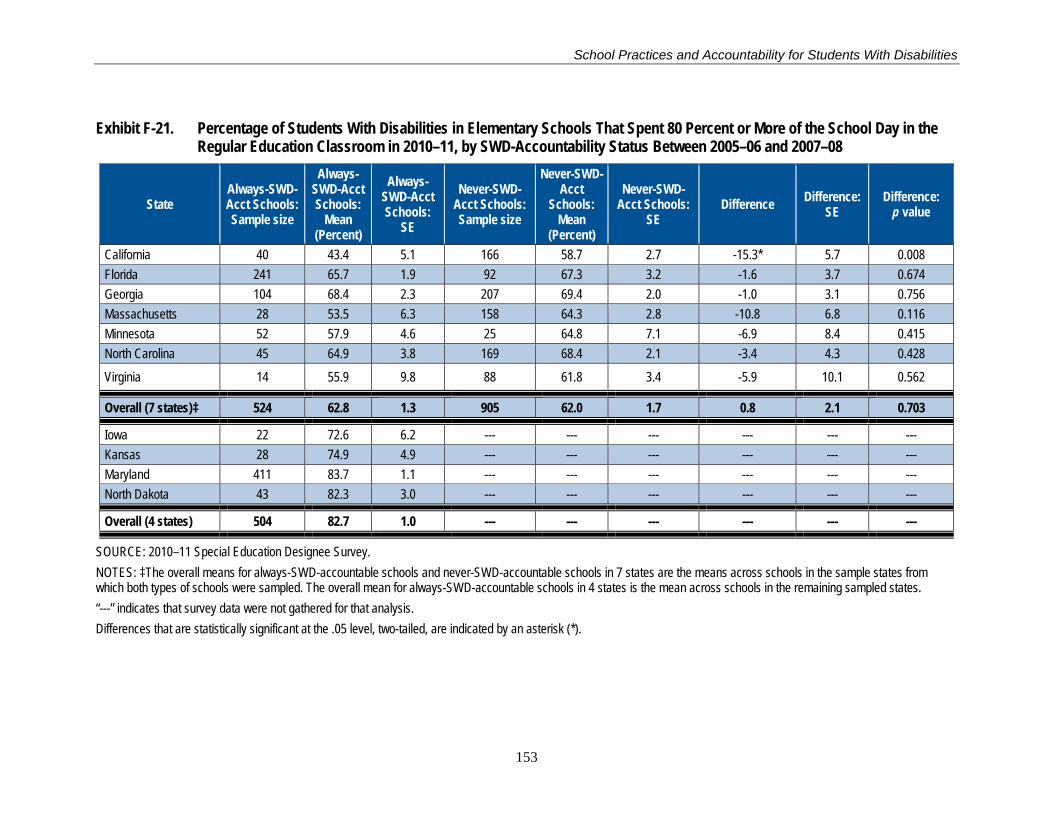
School Practices and Accountability for Students With Disabilities
Exhibit F-21. Percentage of Students With Disabilities in Elementary Schools That Spent 80 Percent or More of the School Day in the Regular Education Classroom in 2010–11, by SWD-Accountability Status Between 2005–06 and 2007–08
State Always-SWD-Acct Schools: Sample size
Always-SWD-Acct Schools:
Mean (Percent)
Always-SWD-Acct Schools:
SE
Never-SWD-Acct Schools: Sample size
Never-SWD-Acct
Schools: Mean
(Percent)
Never-SWD-Acct Schools:
SE Difference Difference:
SE Difference:
p value
California 40 43.4 5.1 166 58.7 2.7 -15.3* 5.7 0.008 Florida 241 65.7 1.9 92 67.3 3.2 -1.6 3.7 0.674 Georgia 104 68.4 2.3 207 69.4 2.0 -1.0 3.1 0.756 Massachusetts 28 53.5 6.3 158 64.3 2.8 -10.8 6.8 0.116 Minnesota 52 57.9 4.6 25 64.8 7.1 -6.9 8.4 0.415 North Carolina 45 64.9 3.8 169 68.4 2.1 -3.4 4.3 0.428
Virginia 14 55.9 9.8 88 61.8 3.4 -5.9 10.1 0.562
Overall (7 states)‡ 524 62.8 1.3 905 62.0 1.7 0.8 2.1 0.703
Iowa 22 72.6 6.2 --- --- --- --- --- --- Kansas 28 74.9 4.9 --- --- --- --- --- --- Maryland 411 83.7 1.1 --- --- --- --- --- --- North Dakota 43 82.3 3.0 --- --- --- --- --- ---
Overall (4 states) 504 82.7 1.0 --- --- --- --- --- ---
SOURCE: 2010–11 Special Education Designee Survey. NOTES: ‡The overall means for always-SWD-accountable schools and never-SWD-accountable schools in 7 states are the means across schools in the sample states from which both types of schools were sampled. The overall mean for always-SWD-accountable schools in 4 states is the mean across schools in the remaining sampled states. “---” indicates that survey data were not gathered for that analysis. Differences that are statistically significant at the .05 level, two-tailed, are indicated by an asterisk (*).
153

School Practices and Accountability for Students With Disabilities
Exhibit F-22. Percentage of Students With Disabilities in Middle Schools That Spent 80 Percent or More of the School Day in the Regular Education Classroom in 2010–11, by SWD-Accountability Status Between 2005–06 and 2007–08
State Always-SWD-Acct Schools: Sample size
Always-SWD-Acct Schools:
Mean (Percent)
Always-SWD-Acct Schools:
SE
Never-SWD-Acct Schools: Sample size
Never-SWD-Acct
Schools: Mean
(Percent)
Never-SWD-Acct Schools:
SE Difference Difference:
SE Difference:
p value
California 73 42.0 3.6 135 46.8 2.8 -4.9 4.5 0.284 Florida 47 64.1 4.6 8 80.2 6.4 -16.1* 7.7 0.041 Georgia 88 64.8 2.6 26 77.7 4.8 -13.0* 5.4 0.017 North Carolina 20 58.2 7.8 12 54.8 6.9 3.4 10.4 0.746 Wisconsin 44 73.6 3.7 31 60.3 4.9 13.3* 6.2 0.035
Overall (5 states)‡ 272 59.5 1.8 212 53.2 2.2 6.3* 2.9 0.030
Iowa 37 59.9 5.1 --- --- --- --- --- --- Maryland 100 80.0 2.7 --- --- --- --- --- --- Massachusetts 61 60.0 4.0 --- --- --- --- --- ---
Overall (3 states) 198 70.5 2.2 --- --- --- --- --- ---
SOURCE: 2010–11 Special Education Designee Survey. NOTES: ‡The overall means for always-SWD-accountable schools and never-SWD-accountable schools in 5 states are the means across schools in the sample states from which both types of schools were sampled. The overall mean for always-SWD-accountable schools in 3 states is the mean across schools in the remaining sampled states. “---” indicates that survey data were not gathered for that analysis. Differences that are statistically significant at the .05 level, two-tailed, are indicated by an asterisk (*).
154
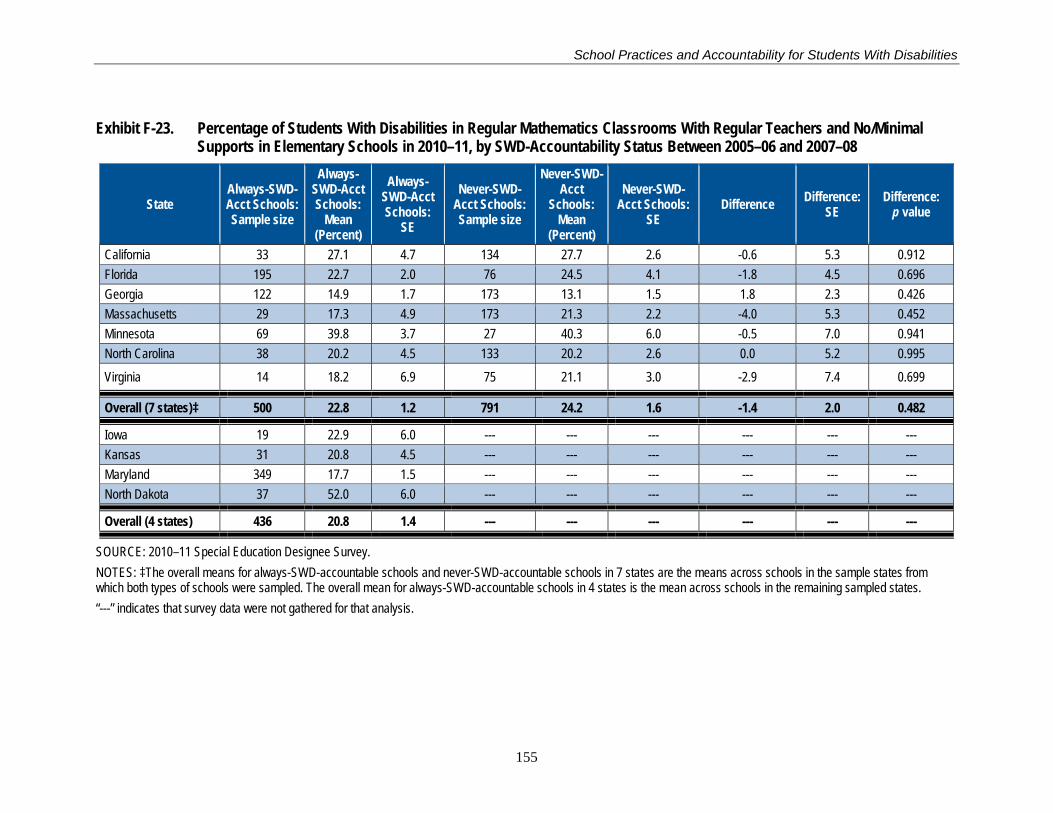
School Practices and Accountability for Students With Disabilities
Exhibit F-23. Percentage of Students With Disabilities in Regular Mathematics Classrooms With Regular Teachers and No/Minimal Supports in Elementary Schools in 2010–11, by SWD-Accountability Status Between 2005–06 and 2007–08
State Always-SWD-Acct Schools: Sample size
Always-SWD-Acct Schools:
Mean (Percent)
Always-SWD-Acct Schools:
SE
Never-SWD-Acct Schools: Sample size
Never-SWD-Acct
Schools: Mean
(Percent)
Never-SWD-Acct Schools:
SE Difference Difference:
SE Difference:
p value
California 33 27.1 4.7 134 27.7 2.6 -0.6 5.3 0.912 Florida 195 22.7 2.0 76 24.5 4.1 -1.8 4.5 0.696 Georgia 122 14.9 1.7 173 13.1 1.5 1.8 2.3 0.426 Massachusetts 29 17.3 4.9 173 21.3 2.2 -4.0 5.3 0.452 Minnesota 69 39.8 3.7 27 40.3 6.0 -0.5 7.0 0.941 North Carolina 38 20.2 4.5 133 20.2 2.6 0.0 5.2 0.995
Virginia 14 18.2 6.9 75 21.1 3.0 -2.9 7.4 0.699
Overall (7 states)‡ 500 22.8 1.2 791 24.2 1.6 -1.4 2.0 0.482
Iowa 19 22.9 6.0 --- --- --- --- --- --- Kansas 31 20.8 4.5 --- --- --- --- --- --- Maryland 349 17.7 1.5 --- --- --- --- --- --- North Dakota 37 52.0 6.0 --- --- --- --- --- ---
Overall (4 states) 436 20.8 1.4 --- --- --- --- --- ---
SOURCE: 2010–11 Special Education Designee Survey. NOTES: ‡The overall means for always-SWD-accountable schools and never-SWD-accountable schools in 7 states are the means across schools in the sample states from which both types of schools were sampled. The overall mean for always-SWD-accountable schools in 4 states is the mean across schools in the remaining sampled states. “---” indicates that survey data were not gathered for that analysis.
155
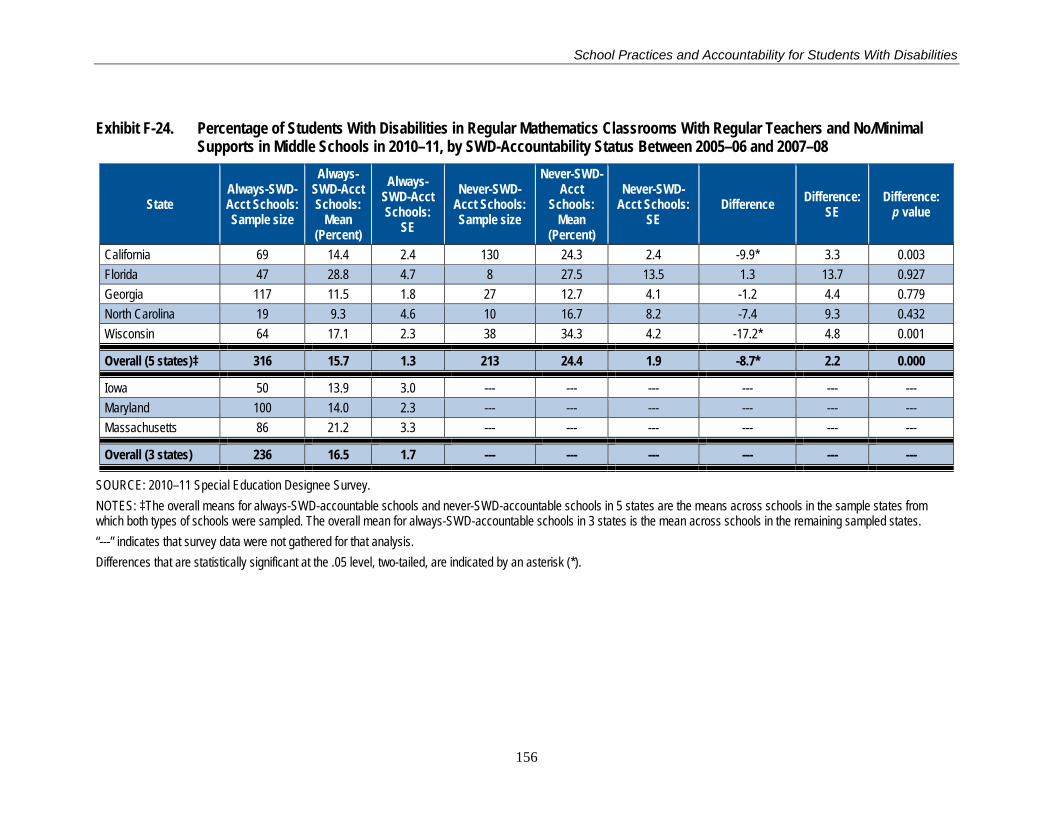
School Practices and Accountability for Students With Disabilities
Exhibit F-24. Percentage of Students With Disabilities in Regular Mathematics Classrooms With Regular Teachers and No/Minimal Supports in Middle Schools in 2010–11, by SWD-Accountability Status Between 2005–06 and 2007–08
State Always-SWD-Acct Schools: Sample size
Always-SWD-Acct Schools:
Mean (Percent)
Always-SWD-Acct Schools:
SE
Never-SWD-Acct Schools: Sample size
Never-SWD-Acct
Schools: Mean
(Percent)
Never-SWD-Acct Schools:
SE Difference Difference:
SE Difference:
p value
California 69 14.4 2.4 130 24.3 2.4 -9.9* 3.3 0.003 Florida 47 28.8 4.7 8 27.5 13.5 1.3 13.7 0.927 Georgia 117 11.5 1.8 27 12.7 4.1 -1.2 4.4 0.779 North Carolina 19 9.3 4.6 10 16.7 8.2 -7.4 9.3 0.432 Wisconsin 64 17.1 2.3 38 34.3 4.2 -17.2* 4.8 0.001
Overall (5 states)‡ 316 15.7 1.3 213 24.4 1.9 -8.7* 2.2 0.000
Iowa 50 13.9 3.0 --- --- --- --- --- --- Maryland 100 14.0 2.3 --- --- --- --- --- --- Massachusetts 86 21.2 3.3 --- --- --- --- --- ---
Overall (3 states) 236 16.5 1.7 --- --- --- --- --- ---
SOURCE: 2010–11 Special Education Designee Survey. NOTES: ‡The overall means for always-SWD-accountable schools and never-SWD-accountable schools in 5 states are the means across schools in the sample states from which both types of schools were sampled. The overall mean for always-SWD-accountable schools in 3 states is the mean across schools in the remaining sampled states. “---” indicates that survey data were not gathered for that analysis. Differences that are statistically significant at the .05 level, two-tailed, are indicated by an asterisk (*).
156

School Practices and Accountability for Students With Disabilities
Exhibit F-25. Percentage of Students With Disabilities in Regular Mathematics Classrooms With Regular Teachers and Substantial Supports in Elementary Schools in 2010–11, by SWD-Accountability Status Between 2005–06 and 2007–08
State Always-SWD-Acct Schools: Sample size
Always-SWD-Acct Schools:
Mean (Percent)
Always-SWD-Acct Schools:
SE
Never-SWD-Acct Schools: Sample size
Never-SWD-Acct
Schools: Mean
(Percent)
Never-SWD-Acct Schools:
SE Difference Difference:
SE Difference:
p value
California 33 12.5 2.9 134 23.6 2.4 -11.1* 3.7 0.003 Florida 195 31.9 2.4 76 39.5 4.4 -7.6 5.0 0.132 Georgia 122 7.9 1.1 173 15.2 1.7 -7.2* 2.1 0.001 Massachusetts 29 34.6 6.2 173 32.9 2.4 1.7 6.6 0.800 Minnesota 69 25.9 3.1 27 24.2 3.9 1.6 5.0 0.742 North Carolina 38 20.5 3.7 133 27.4 2.9 -6.9 4.7 0.139
Virginia 14 31.8 8.0 75 26.7 3.9 5.1 8.7 0.560
Overall (7 states)‡ 500 23.2 1.3 791 24.7 1.5 -1.5 1.9 0.443
Iowa 19 10.1 3.6 --- --- --- --- --- --- Kansas 31 53.8 5.4 --- --- --- --- --- --- Maryland 349 25.1 1.7 --- --- --- --- --- --- North Dakota 37 25.5 4.9 --- --- --- --- --- ---
Overall (4 states) 436 26.5 1.5 --- --- --- --- --- ---
SOURCE: 2010–11 Special Education Designee Survey. NOTES: ‡The overall means for always-SWD-accountable schools and never-SWD-accountable schools in 7 states are the means across schools in the sample states from which both types of schools were sampled. The overall mean for always-SWD-accountable schools in 4 states is the mean across schools in the remaining sampled states. “---” indicates that survey data were not gathered for that analysis. Differences that are statistically significant at the .05 level, two-tailed, are indicated by an asterisk (*).
157
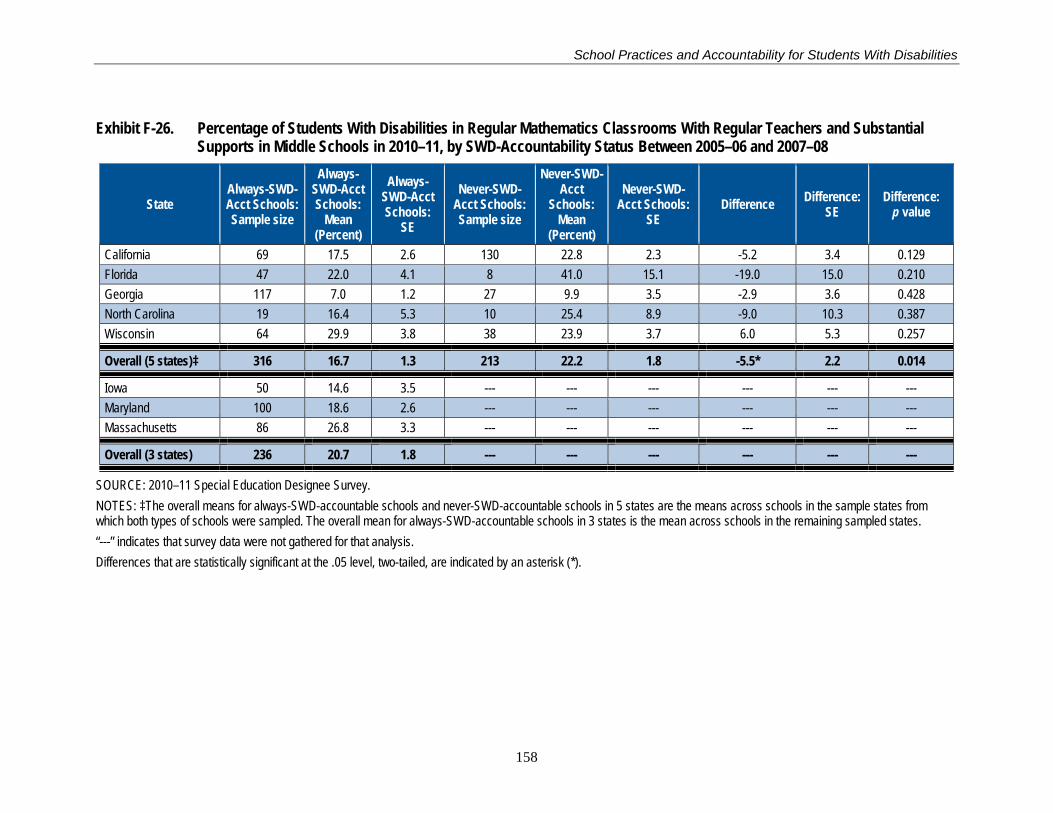
School Practices and Accountability for Students With Disabilities
Exhibit F-26. Percentage of Students With Disabilities in Regular Mathematics Classrooms With Regular Teachers and Substantial Supports in Middle Schools in 2010–11, by SWD-Accountability Status Between 2005–06 and 2007–08
State Always-SWD-Acct Schools: Sample size
Always-SWD-Acct Schools:
Mean (Percent)
Always-SWD-Acct Schools:
SE
Never-SWD-Acct Schools: Sample size
Never-SWD-Acct
Schools: Mean
(Percent)
Never-SWD-Acct Schools:
SE Difference Difference:
SE Difference:
p value
California 69 17.5 2.6 130 22.8 2.3 -5.2 3.4 0.129 Florida 47 22.0 4.1 8 41.0 15.1 -19.0 15.0 0.210 Georgia 117 7.0 1.2 27 9.9 3.5 -2.9 3.6 0.428 North Carolina 19 16.4 5.3 10 25.4 8.9 -9.0 10.3 0.387 Wisconsin 64 29.9 3.8 38 23.9 3.7 6.0 5.3 0.257
Overall (5 states)‡ 316 16.7 1.3 213 22.2 1.8 -5.5* 2.2 0.014
Iowa 50 14.6 3.5 --- --- --- --- --- --- Maryland 100 18.6 2.6 --- --- --- --- --- --- Massachusetts 86 26.8 3.3 --- --- --- --- --- ---
Overall (3 states) 236 20.7 1.8 --- --- --- --- --- ---
SOURCE: 2010–11 Special Education Designee Survey. NOTES: ‡The overall means for always-SWD-accountable schools and never-SWD-accountable schools in 5 states are the means across schools in the sample states from which both types of schools were sampled. The overall mean for always-SWD-accountable schools in 3 states is the mean across schools in the remaining sampled states. “---” indicates that survey data were not gathered for that analysis. Differences that are statistically significant at the .05 level, two-tailed, are indicated by an asterisk (*).
158
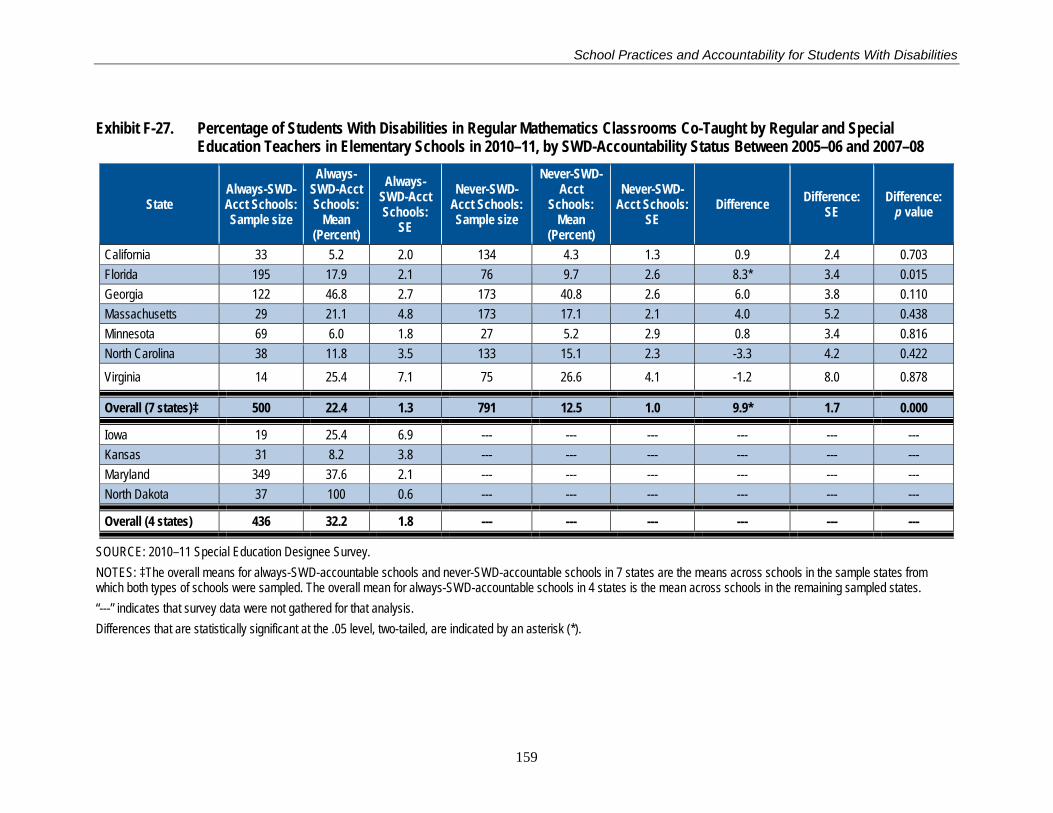
School Practices and Accountability for Students With Disabilities
Exhibit F-27. Percentage of Students With Disabilities in Regular Mathematics Classrooms Co-Taught by Regular and Special Education Teachers in Elementary Schools in 2010–11, by SWD-Accountability Status Between 2005–06 and 2007–08
State Always-SWD-Acct Schools: Sample size
Always-SWD-Acct Schools:
Mean (Percent)
Always-SWD-Acct Schools:
SE
Never-SWD-Acct Schools: Sample size
Never-SWD-Acct
Schools: Mean
(Percent)
Never-SWD-Acct Schools:
SE Difference Difference:
SE Difference:
p value
California 33 5.2 2.0 134 4.3 1.3 0.9 2.4 0.703 Florida 195 17.9 2.1 76 9.7 2.6 8.3* 3.4 0.015 Georgia 122 46.8 2.7 173 40.8 2.6 6.0 3.8 0.110 Massachusetts 29 21.1 4.8 173 17.1 2.1 4.0 5.2 0.438 Minnesota 69 6.0 1.8 27 5.2 2.9 0.8 3.4 0.816 North Carolina 38 11.8 3.5 133 15.1 2.3 -3.3 4.2 0.422
Virginia 14 25.4 7.1 75 26.6 4.1 -1.2 8.0 0.878
Overall (7 states)‡ 500 22.4 1.3 791 12.5 1.0 9.9* 1.7 0.000
Iowa 19 25.4 6.9 --- --- --- --- --- --- Kansas 31 8.2 3.8 --- --- --- --- --- --- Maryland 349 37.6 2.1 --- --- --- --- --- --- North Dakota 37 100 0.6 --- --- --- --- --- ---
Overall (4 states) 436 32.2 1.8 --- --- --- --- --- ---
SOURCE: 2010–11 Special Education Designee Survey. NOTES: ‡The overall means for always-SWD-accountable schools and never-SWD-accountable schools in 7 states are the means across schools in the sample states from which both types of schools were sampled. The overall mean for always-SWD-accountable schools in 4 states is the mean across schools in the remaining sampled states. “---” indicates that survey data were not gathered for that analysis. Differences that are statistically significant at the .05 level, two-tailed, are indicated by an asterisk (*).
159

School Practices and Accountability for Students With Disabilities
Exhibit F-28. Percentage of Students With Disabilities in Regular Mathematics Classrooms Co-Taught by Regular and Special Education Teachers in Middle Schools in 2010–11, by SWD-Accountability Status Between 2005–06 and 2007–08
State Always-SWD-Acct Schools: Sample size
Always-SWD-Acct Schools:
Mean (Percent)
Always-SWD-Acct Schools:
SE
Never-SWD-Acct Schools: Sample size
Never-SWD-Acct
Schools: Mean
(Percent)
Never-SWD-Acct Schools:
SE Difference Difference:
SE Difference:
p value
California 69 25.0 3.5 130 10.5 2.1 14.5* 4.0 0.000 Florida 47 24.6 4.2 8 8.2 7.4 16.3 8.3 0.053 Georgia 117 54.3 2.9 27 46.3 5.8 8.1 6.4 0.213 North Carolina 19 38.3 9.4 10 12.3 9.6 26.0 13.4 0.062 Wisconsin 64 29.3 3.8 38 10.2 3.4 19.1* 5.1 0.000
Overall (5 states)‡ 316 37.5 1.9 213 14.4 1.8 23.1* 2.6 0.000
Iowa 50 34.8 4.6 --- --- --- --- --- --- Maryland 100 52.2 3.8 --- --- --- --- --- --- Massachusetts 86 29.6 3.4 --- --- --- --- --- ---
Overall (3 states) 236 40.7 2.4 --- --- --- --- --- ---
SOURCE: 2010–11 Special Education Designee Survey. NOTES: ‡The overall means for always-SWD-accountable schools and never-SWD-accountable schools in 5 states are the means across schools in the sample states from which both types of schools were sampled. The overall mean for always-SWD-accountable schools in 3 states is the mean across schools in the remaining sampled states. “---” indicates that survey data were not gathered for that analysis. Differences that are statistically significant at the .05 level, two-tailed, are indicated by an asterisk (*).
160
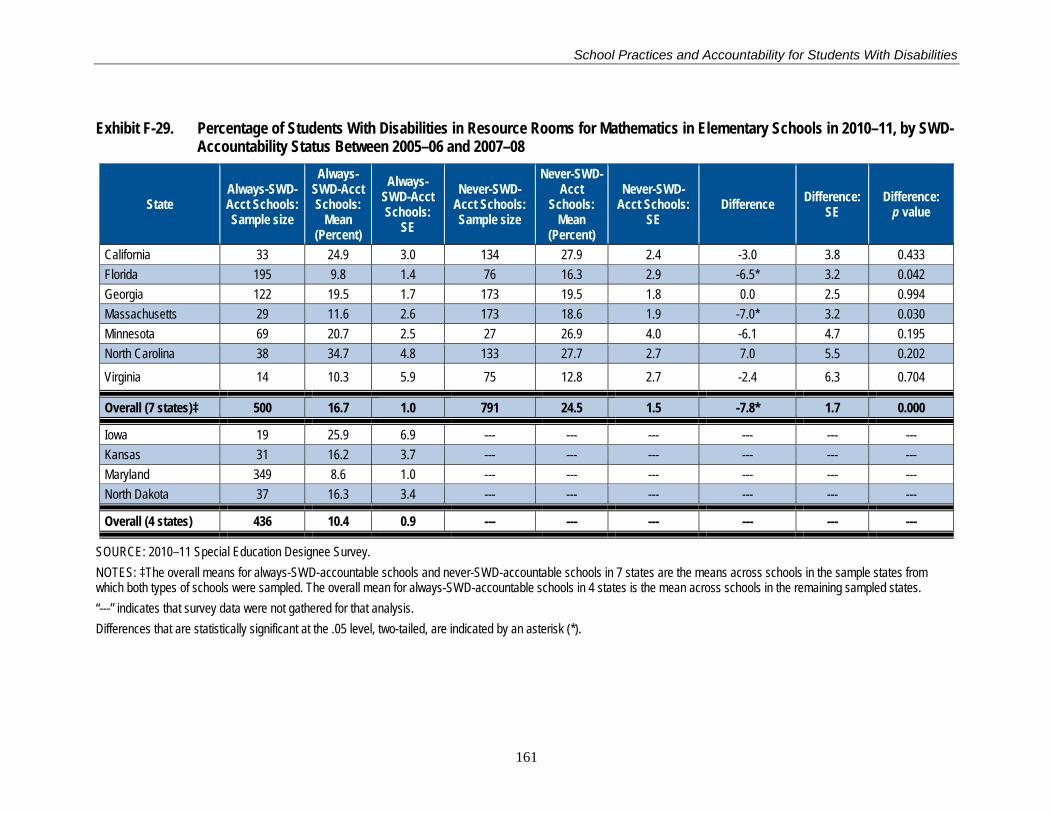
School Practices and Accountability for Students With Disabilities
Exhibit F-29. Percentage of Students With Disabilities in Resource Rooms for Mathematics in Elementary Schools in 2010–11, by SWD-Accountability Status Between 2005–06 and 2007–08
State Always-SWD-Acct Schools: Sample size
Always-SWD-Acct Schools:
Mean (Percent)
Always-SWD-Acct Schools:
SE
Never-SWD-Acct Schools: Sample size
Never-SWD-Acct
Schools: Mean
(Percent)
Never-SWD-Acct Schools:
SE Difference Difference:
SE Difference:
p value
California 33 24.9 3.0 134 27.9 2.4 -3.0 3.8 0.433 Florida 195 9.8 1.4 76 16.3 2.9 -6.5* 3.2 0.042 Georgia 122 19.5 1.7 173 19.5 1.8 0.0 2.5 0.994 Massachusetts 29 11.6 2.6 173 18.6 1.9 -7.0* 3.2 0.030 Minnesota 69 20.7 2.5 27 26.9 4.0 -6.1 4.7 0.195 North Carolina 38 34.7 4.8 133 27.7 2.7 7.0 5.5 0.202
Virginia 14 10.3 5.9 75 12.8 2.7 -2.4 6.3 0.704
Overall (7 states)‡ 500 16.7 1.0 791 24.5 1.5 -7.8* 1.7 0.000
Iowa 19 25.9 6.9 --- --- --- --- --- --- Kansas 31 16.2 3.7 --- --- --- --- --- --- Maryland 349 8.6 1.0 --- --- --- --- --- --- North Dakota 37 16.3 3.4 --- --- --- --- --- ---
Overall (4 states) 436 10.4 0.9 --- --- --- --- --- ---
SOURCE: 2010–11 Special Education Designee Survey. NOTES: ‡The overall means for always-SWD-accountable schools and never-SWD-accountable schools in 7 states are the means across schools in the sample states from which both types of schools were sampled. The overall mean for always-SWD-accountable schools in 4 states is the mean across schools in the remaining sampled states. “---” indicates that survey data were not gathered for that analysis. Differences that are statistically significant at the .05 level, two-tailed, are indicated by an asterisk (*).
161

School Practices and Accountability for Students With Disabilities
Exhibit F-30. Percentage of Students With Disabilities in Resource Rooms for Mathematics in Middle Schools in 2010–11, by SWD-Accountability Status Between 2005–06 and 2007–08
State Always-SWD-Acct Schools: Sample size
Always-SWD-Acct Schools:
Mean (Percent)
Always-SWD-Acct Schools:
SE
Never-SWD-Acct Schools: Sample size
Never-SWD-Acct
Schools: Mean
(Percent)
Never-SWD-Acct Schools:
SE Difference Difference:
SE Difference:
p value
California 69 16.7 2.8 130 22.3 2.4 -5.6 3.7 0.126 Florida 47 11.1 2.9 8 12.2 6.6 -1.1 6.9 0.880 Georgia 117 13.6 1.4 27 11.2 3.0 2.4 3.2 0.468 North Carolina 19 19.4 6.5 10 40.9 12.0 -21.5 13.5 0.122 Wisconsin 64 11.4 2.3 38 21.4 4.1 -10.1* 4.7 0.034
Overall (5 states)‡ 316 13.8 1.1 213 21.4 1.8 -7.6* 2.1 0.000
Iowa 50 10.8 2.8 --- --- --- --- --- --- Maryland 100 1.8 0.5 --- --- --- --- --- --- Massachusetts 86 8.1 1.8 --- --- --- --- --- ---
Overall (3 states) 236 5.9 0.9 --- --- --- --- --- ---
SOURCE: 2010–11 Special Education Designee Survey. NOTES: ‡The overall means for always-SWD-accountable schools and never-SWD-accountable schools in 5 states are the means across schools in the sample states from which both types of schools were sampled. The overall mean for always-SWD-accountable schools in 3 states is the mean across schools in the remaining sampled states. “---” indicates that survey data were not gathered for that analysis. Differences that are statistically significant at the .05 level, two-tailed, are indicated by an asterisk (*).
162
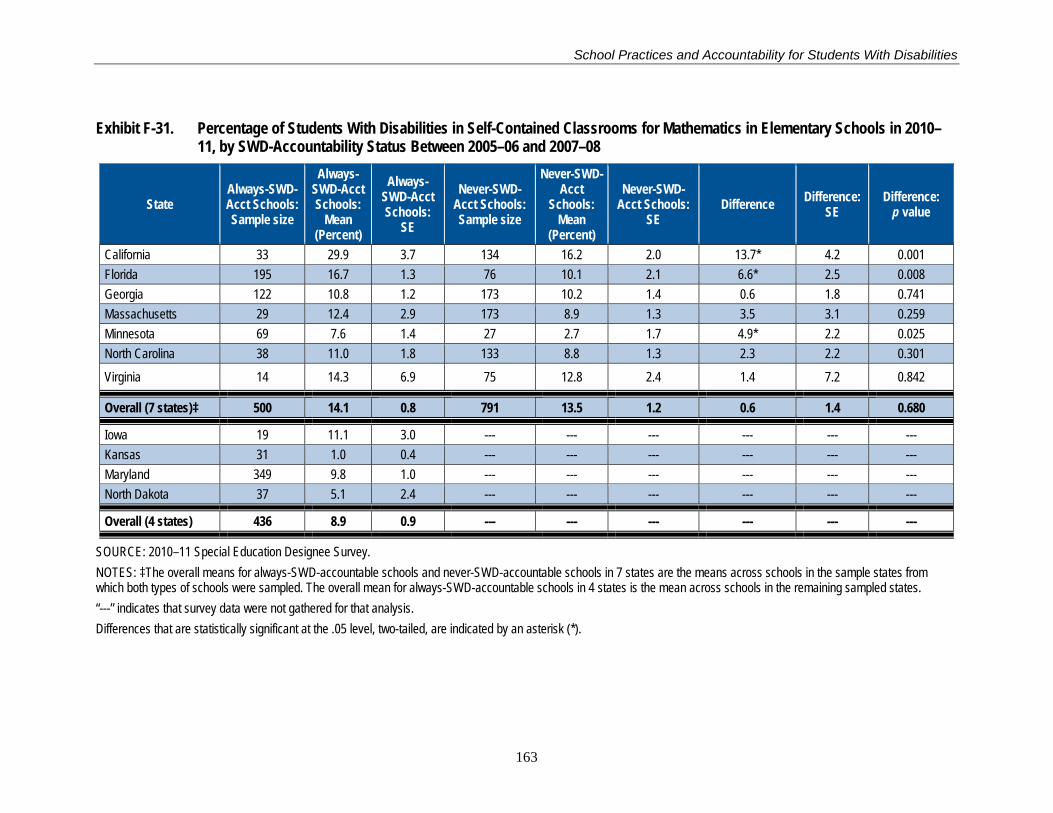
School Practices and Accountability for Students With Disabilities
Exhibit F-31. Percentage of Students With Disabilities in Self-Contained Classrooms for Mathematics in Elementary Schools in 2010–11, by SWD-Accountability Status Between 2005–06 and 2007–08
State Always-SWD-Acct Schools: Sample size
Always-SWD-Acct Schools:
Mean (Percent)
Always-SWD-Acct Schools:
SE
Never-SWD-Acct Schools: Sample size
Never-SWD-Acct
Schools: Mean
(Percent)
Never-SWD-Acct Schools:
SE Difference Difference:
SE Difference:
p value
California 33 29.9 3.7 134 16.2 2.0 13.7* 4.2 0.001 Florida 195 16.7 1.3 76 10.1 2.1 6.6* 2.5 0.008 Georgia 122 10.8 1.2 173 10.2 1.4 0.6 1.8 0.741 Massachusetts 29 12.4 2.9 173 8.9 1.3 3.5 3.1 0.259 Minnesota 69 7.6 1.4 27 2.7 1.7 4.9* 2.2 0.025 North Carolina 38 11.0 1.8 133 8.8 1.3 2.3 2.2 0.301
Virginia 14 14.3 6.9 75 12.8 2.4 1.4 7.2 0.842
Overall (7 states)‡ 500 14.1 0.8 791 13.5 1.2 0.6 1.4 0.680
Iowa 19 11.1 3.0 --- --- --- --- --- --- Kansas 31 1.0 0.4 --- --- --- --- --- --- Maryland 349 9.8 1.0 --- --- --- --- --- --- North Dakota 37 5.1 2.4 --- --- --- --- --- ---
Overall (4 states) 436 8.9 0.9 --- --- --- --- --- ---
SOURCE: 2010–11 Special Education Designee Survey. NOTES: ‡The overall means for always-SWD-accountable schools and never-SWD-accountable schools in 7 states are the means across schools in the sample states from which both types of schools were sampled. The overall mean for always-SWD-accountable schools in 4 states is the mean across schools in the remaining sampled states. “---” indicates that survey data were not gathered for that analysis. Differences that are statistically significant at the .05 level, two-tailed, are indicated by an asterisk (*).
163

School Practices and Accountability for Students With Disabilities
Exhibit F-32. Percentage of Students With Disabilities in Self-Contained Classrooms for Mathematics in Middle Schools in 2010–11, by SWD-Accountability Status Between 2005–06 and 2007–08
State Always-SWD-Acct Schools: Sample size
Always-SWD-Acct Schools:
Mean (Percent)
Always-SWD-Acct Schools:
SE
Never-SWD-Acct Schools: Sample size
Never-SWD-Acct
Schools: Mean
(Percent)
Never-SWD-Acct Schools:
SE Difference Difference:
SE Difference:
p value
California 69 25.8 2.4 130 17.1 1.7 8.7* 2.9 0.003 Florida 47 11.5 1.9 8 11.1 7.8 0.4 7.6 0.962 Georgia 117 13.2 1.4 27 19.9 5.2 -6.7 5.3 0.208 North Carolina 19 16.6 5.4 10 4.7 2.9 11.9 6.2 0.065 Wisconsin 64 12.3 2.0 38 10.1 2.3 2.2 3.0 0.478
Overall (5 states)‡ 316 15.7 1.0 213 15.6 1.4 0.1 1.7 0.958
Iowa 50 25.8 3.8 --- --- --- --- --- --- Maryland 100 12.3 1.7 --- --- --- --- --- --- Massachusetts 86 13.6 2.1 --- --- --- --- --- ---
Overall (3 states) 236 15.5 1.4 --- --- --- --- --- ---
SOURCE: 2010–11 Special Education Designee Survey. NOTES: ‡The overall means for always-SWD-accountable schools and never-SWD-accountable schools in 5 states are the means across schools in the sample states from which both types of schools were sampled. The overall mean for always-SWD-accountable schools in 3 states is the mean across schools in the remaining sampled states. “---” indicates that survey data were not gathered for that analysis. Differences that are statistically significant at the .05 level, two-tailed, are indicated by an asterisk (*).
164
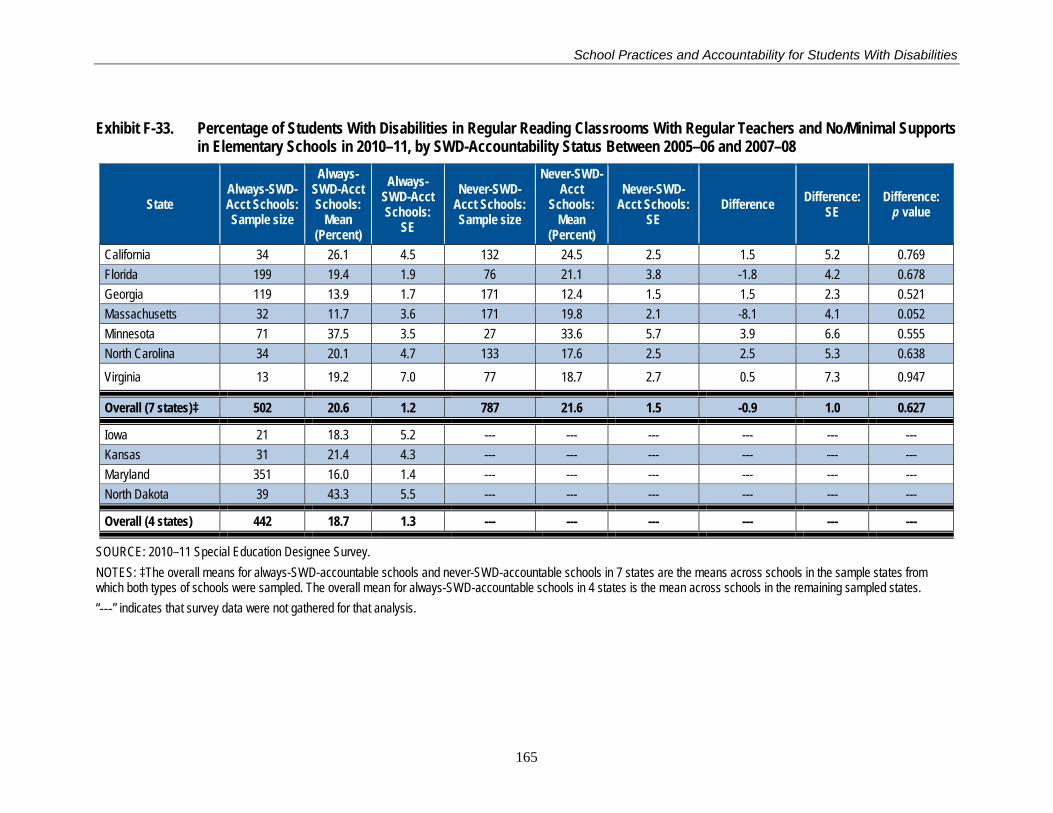
School Practices and Accountability for Students With Disabilities
Exhibit F-33. Percentage of Students With Disabilities in Regular Reading Classrooms With Regular Teachers and No/Minimal Supports in Elementary Schools in 2010–11, by SWD-Accountability Status Between 2005–06 and 2007–08
State Always-SWD-Acct Schools: Sample size
Always-SWD-Acct Schools:
Mean (Percent)
Always-SWD-Acct Schools:
SE
Never-SWD-Acct Schools: Sample size
Never-SWD-Acct
Schools: Mean
(Percent)
Never-SWD-Acct Schools:
SE Difference Difference:
SE Difference:
p value
California 34 26.1 4.5 132 24.5 2.5 1.5 5.2 0.769 Florida 199 19.4 1.9 76 21.1 3.8 -1.8 4.2 0.678 Georgia 119 13.9 1.7 171 12.4 1.5 1.5 2.3 0.521 Massachusetts 32 11.7 3.6 171 19.8 2.1 -8.1 4.1 0.052 Minnesota 71 37.5 3.5 27 33.6 5.7 3.9 6.6 0.555 North Carolina 34 20.1 4.7 133 17.6 2.5 2.5 5.3 0.638
Virginia 13 19.2 7.0 77 18.7 2.7 0.5 7.3 0.947
Overall (7 states)‡ 502 20.6 1.2 787 21.6 1.5 -0.9 1.0 0.627
Iowa 21 18.3 5.2 --- --- --- --- --- --- Kansas 31 21.4 4.3 --- --- --- --- --- --- Maryland 351 16.0 1.4 --- --- --- --- --- --- North Dakota 39 43.3 5.5 --- --- --- --- --- ---
Overall (4 states) 442 18.7 1.3 --- --- --- --- --- ---
SOURCE: 2010–11 Special Education Designee Survey. NOTES: ‡The overall means for always-SWD-accountable schools and never-SWD-accountable schools in 7 states are the means across schools in the sample states from which both types of schools were sampled. The overall mean for always-SWD-accountable schools in 4 states is the mean across schools in the remaining sampled states. “---” indicates that survey data were not gathered for that analysis.
165

School Practices and Accountability for Students With Disabilities
Exhibit F-34. Percentage of Students With Disabilities in Regular Reading Classrooms With Regular Teachers and No/Minimal Supports in Middle Schools in 2010–11, by SWD-Accountability Status Between 2005–06 and 2007–08
State Always-SWD-Acct Schools: Sample size
Always-SWD-Acct Schools:
Mean (Percent)
Always-SWD-Acct Schools:
SE
Never-SWD-Acct Schools: Sample size
Never-SWD-Acct
Schools: Mean
(Percent)
Never-SWD-Acct Schools:
SE Difference Difference:
SE Difference:
p value
California 73 13.4 2.3 134 20.0 2.1 -6.6* 3.1 0.033 Florida 47 28.3 4.7 8 27.9 13.5 0.4 13.7 0.974 Georgia 115 12.1 1.9 25 12.5 4.1 -0.4 4.4 0.926 North Carolina 18 11.4 5.7 10 14.6 6.5 -3.2 8.6 0.711 Wisconsin 58 15.2 2.1 37 29.1 3.8 -13.8* 4.3 0.002
Overall (5 states)‡ 311 15.4 1.3 214 20.6 1.7 -5.2* 2.1 0.013
Iowa 48 11.9 2.9 --- --- --- --- --- --- Maryland 86 20.9 3.2 --- --- --- --- --- --- Massachusetts 102 13.0 2.2 --- --- --- --- --- ---
Overall (3 states) 236 15.5 1.6 --- --- --- --- --- ---
SOURCE: 2010–11 Special Education Designee Survey. NOTES: ‡The overall means for always-SWD-accountable schools and never-SWD-accountable schools in 5 states are the means across schools in the sample states from which both types of schools were sampled. The overall mean for always-SWD-accountable schools in 3 states is the mean across schools in the remaining sampled states. “---” indicates that survey data were not gathered for that analysis. Differences that are statistically significant at the .05 level, two-tailed, are indicated by an asterisk (*).
166
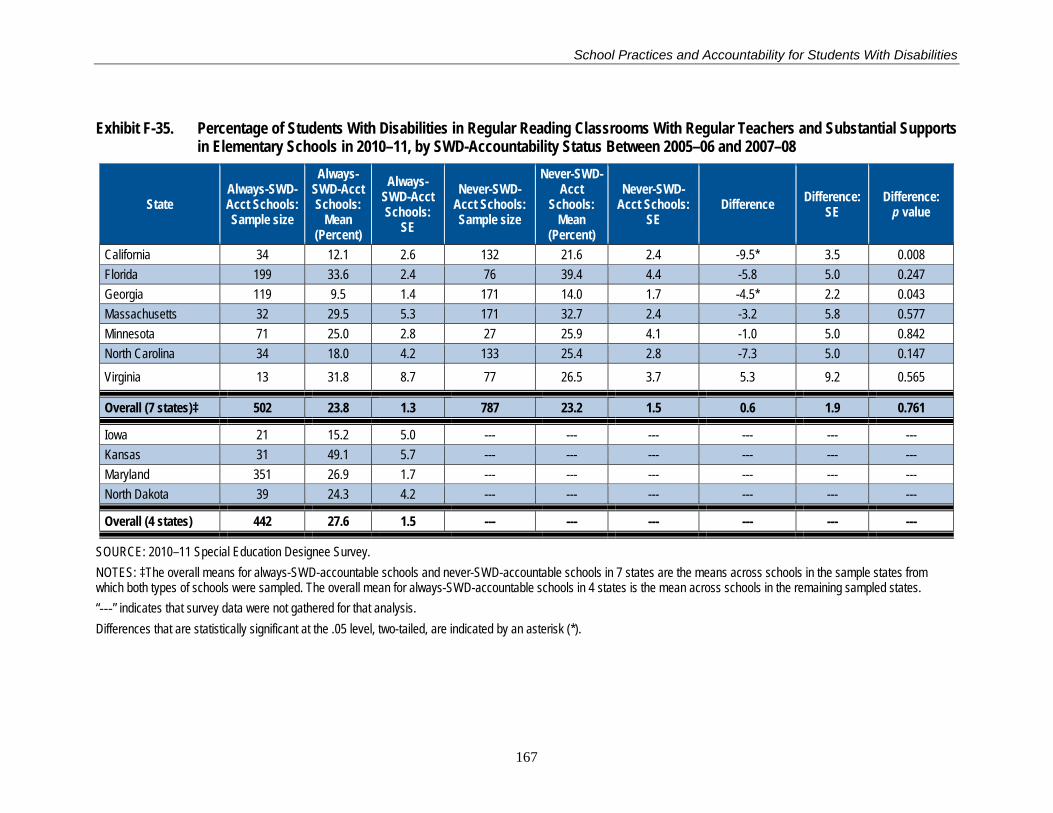
School Practices and Accountability for Students With Disabilities
Exhibit F-35. Percentage of Students With Disabilities in Regular Reading Classrooms With Regular Teachers and Substantial Supports in Elementary Schools in 2010–11, by SWD-Accountability Status Between 2005–06 and 2007–08
State Always-SWD-Acct Schools: Sample size
Always-SWD-Acct Schools:
Mean (Percent)
Always-SWD-Acct Schools:
SE
Never-SWD-Acct Schools: Sample size
Never-SWD-Acct
Schools: Mean
(Percent)
Never-SWD-Acct Schools:
SE Difference Difference:
SE Difference:
p value
California 34 12.1 2.6 132 21.6 2.4 -9.5* 3.5 0.008 Florida 199 33.6 2.4 76 39.4 4.4 -5.8 5.0 0.247 Georgia 119 9.5 1.4 171 14.0 1.7 -4.5* 2.2 0.043 Massachusetts 32 29.5 5.3 171 32.7 2.4 -3.2 5.8 0.577 Minnesota 71 25.0 2.8 27 25.9 4.1 -1.0 5.0 0.842 North Carolina 34 18.0 4.2 133 25.4 2.8 -7.3 5.0 0.147
Virginia 13 31.8 8.7 77 26.5 3.7 5.3 9.2 0.565
Overall (7 states)‡ 502 23.8 1.3 787 23.2 1.5 0.6 1.9 0.761
Iowa 21 15.2 5.0 --- --- --- --- --- --- Kansas 31 49.1 5.7 --- --- --- --- --- --- Maryland 351 26.9 1.7 --- --- --- --- --- --- North Dakota 39 24.3 4.2 --- --- --- --- --- ---
Overall (4 states) 442 27.6 1.5 --- --- --- --- --- ---
SOURCE: 2010–11 Special Education Designee Survey. NOTES: ‡The overall means for always-SWD-accountable schools and never-SWD-accountable schools in 7 states are the means across schools in the sample states from which both types of schools were sampled. The overall mean for always-SWD-accountable schools in 4 states is the mean across schools in the remaining sampled states. “---” indicates that survey data were not gathered for that analysis. Differences that are statistically significant at the .05 level, two-tailed, are indicated by an asterisk (*).
167
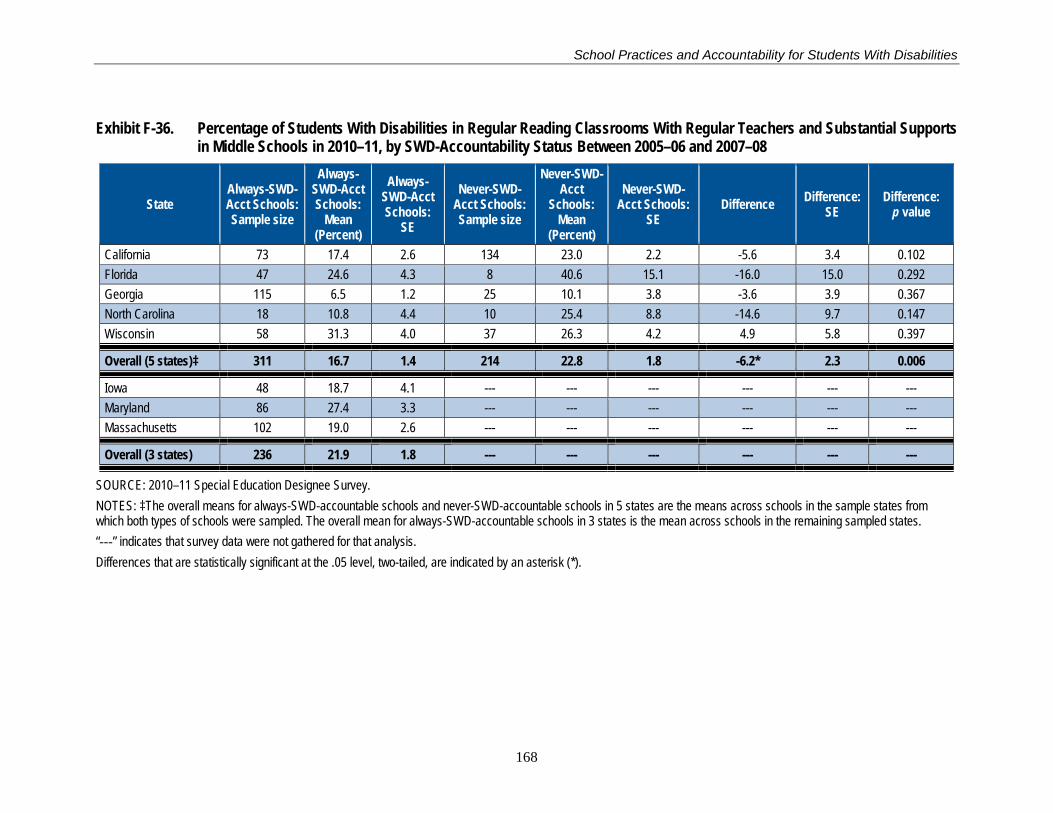
School Practices and Accountability for Students With Disabilities
Exhibit F-36. Percentage of Students With Disabilities in Regular Reading Classrooms With Regular Teachers and Substantial Supports in Middle Schools in 2010–11, by SWD-Accountability Status Between 2005–06 and 2007–08
State Always-SWD-Acct Schools: Sample size
Always-SWD-Acct Schools:
Mean (Percent)
Always-SWD-Acct Schools:
SE
Never-SWD-Acct Schools: Sample size
Never-SWD-Acct
Schools: Mean
(Percent)
Never-SWD-Acct Schools:
SE Difference Difference:
SE Difference:
p value
California 73 17.4 2.6 134 23.0 2.2 -5.6 3.4 0.102 Florida 47 24.6 4.3 8 40.6 15.1 -16.0 15.0 0.292 Georgia 115 6.5 1.2 25 10.1 3.8 -3.6 3.9 0.367 North Carolina 18 10.8 4.4 10 25.4 8.8 -14.6 9.7 0.147 Wisconsin 58 31.3 4.0 37 26.3 4.2 4.9 5.8 0.397
Overall (5 states)‡ 311 16.7 1.4 214 22.8 1.8 -6.2* 2.3 0.006
Iowa 48 18.7 4.1 --- --- --- --- --- --- Maryland 86 27.4 3.3 --- --- --- --- --- --- Massachusetts 102 19.0 2.6 --- --- --- --- --- ---
Overall (3 states) 236 21.9 1.8 --- --- --- --- --- ---
SOURCE: 2010–11 Special Education Designee Survey. NOTES: ‡The overall means for always-SWD-accountable schools and never-SWD-accountable schools in 5 states are the means across schools in the sample states from which both types of schools were sampled. The overall mean for always-SWD-accountable schools in 3 states is the mean across schools in the remaining sampled states. “---” indicates that survey data were not gathered for that analysis. Differences that are statistically significant at the .05 level, two-tailed, are indicated by an asterisk (*).
168
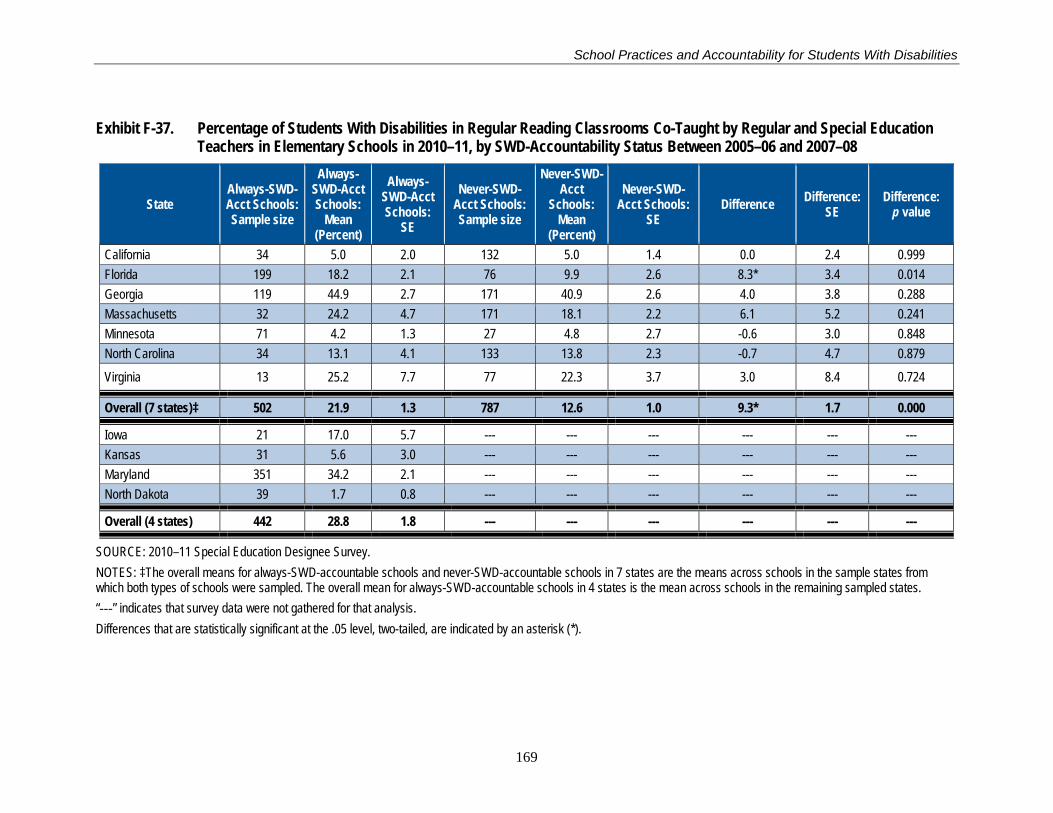
School Practices and Accountability for Students With Disabilities
Exhibit F-37. Percentage of Students With Disabilities in Regular Reading Classrooms Co-Taught by Regular and Special Education Teachers in Elementary Schools in 2010–11, by SWD-Accountability Status Between 2005–06 and 2007–08
State Always-SWD-Acct Schools: Sample size
Always-SWD-Acct Schools:
Mean (Percent)
Always-SWD-Acct Schools:
SE
Never-SWD-Acct Schools: Sample size
Never-SWD-Acct
Schools: Mean
(Percent)
Never-SWD-Acct Schools:
SE Difference Difference:
SE Difference:
p value
California 34 5.0 2.0 132 5.0 1.4 0.0 2.4 0.999 Florida 199 18.2 2.1 76 9.9 2.6 8.3* 3.4 0.014 Georgia 119 44.9 2.7 171 40.9 2.6 4.0 3.8 0.288 Massachusetts 32 24.2 4.7 171 18.1 2.2 6.1 5.2 0.241 Minnesota 71 4.2 1.3 27 4.8 2.7 -0.6 3.0 0.848 North Carolina 34 13.1 4.1 133 13.8 2.3 -0.7 4.7 0.879
Virginia 13 25.2 7.7 77 22.3 3.7 3.0 8.4 0.724
Overall (7 states)‡ 502 21.9 1.3 787 12.6 1.0 9.3* 1.7 0.000
Iowa 21 17.0 5.7 --- --- --- --- --- --- Kansas 31 5.6 3.0 --- --- --- --- --- --- Maryland 351 34.2 2.1 --- --- --- --- --- --- North Dakota 39 1.7 0.8 --- --- --- --- --- ---
Overall (4 states) 442 28.8 1.8 --- --- --- --- --- ---
SOURCE: 2010–11 Special Education Designee Survey. NOTES: ‡The overall means for always-SWD-accountable schools and never-SWD-accountable schools in 7 states are the means across schools in the sample states from which both types of schools were sampled. The overall mean for always-SWD-accountable schools in 4 states is the mean across schools in the remaining sampled states. “---” indicates that survey data were not gathered for that analysis. Differences that are statistically significant at the .05 level, two-tailed, are indicated by an asterisk (*).
169

School Practices and Accountability for Students With Disabilities
Exhibit F-38. Percentage of Students With Disabilities in Regular Reading Classrooms Co-Taught by Regular and Special Education Teachers in Middle Schools in 2010–11, by SWD-Accountability Status Between 2005–06 and 2007–08
State Always-SWD-Acct Schools: Sample size
Always-SWD-Acct Schools:
Mean (Percent)
Always-SWD-Acct Schools:
SE
Never-SWD-Acct Schools: Sample size
Never-SWD-Acct
Schools: Mean
(Percent)
Never-SWD-Acct Schools:
SE Difference Difference:
SE Difference:
p value
California 73 24.8 3.4 134 11.8 2.1 13.0* 4.0 0.001 Florida 47 20.8 4.1 8 8.2 7.4 12.5 8.2 0.132 Georgia 115 55.1 2.9 25 51.7 6.1 3.4 6.7 0.612 North Carolina 18 43.5 9.5 10 12.3 9.6 31.2* 13.5 0.028 Wisconsin 58 26.9 4.0 37 9.7 3.5 17.2* 5.3 0.002
Overall (5 states)‡ 311 36.9 1.9 214 15.4 1.9 21.5* 2.7 0.000
Iowa 48 35.5 4.8 --- --- --- --- --- --- Maryland 86 26.5 3.1 --- --- --- --- --- --- Massachusetts 102 53.5 3.8 --- --- --- --- --- ---
Overall (3 states) 236 40.5 2.4 --- --- --- --- --- ---
SOURCE: 2010–11 Special Education Designee Survey. NOTES: ‡The overall means for always-SWD-accountable schools and never-SWD-accountable schools in 5 states are the means across schools in the sample states from which both types of schools were sampled. The overall mean for always-SWD-accountable schools in 3 states is the mean across schools in the remaining sampled states. “---” indicates that survey data were not gathered for that analysis. Differences that are statistically significant at the .05 level, two-tailed, are indicated by an asterisk (*).
170

School Practices and Accountability for Students With Disabilities
Exhibit F-39. Percentage of Students With Disabilities in Resource Rooms for Reading in Elementary Schools in 2010–11, by SWD-Accountability Status Between 2005–06 and 2007–08
State Always-SWD-Acct Schools: Sample size
Always-SWD-Acct Schools:
Mean (Percent)
Always-SWD-Acct Schools:
SE
Never-SWD-Acct Schools: Sample size
Never-SWD-Acct
Schools: Mean
(Percent)
Never-SWD-Acct Schools:
SE Difference Difference:
SE Difference:
p value
California 34 27.3 3.0 132 31.1 2.6 -3.8 4.0 0.337 Florida 199 11.3 1.5 76 17.8 2.9 -6.5* 3.3 0.048 Georgia 119 20.9 1.9 171 20.8 1.8 0.1 2.6 0.965 Massachusetts 32 16.8 4.0 171 18.7 1.9 -1.9 4.4 0.666 Minnesota 71 24.4 2.9 27 31.0 4.6 -6.6 5.4 0.231 North Carolina 34 35.7 5.3 133 32.2 2.8 3.4 6.0 0.566
Virginia 13 11.1 6.3 77 17.2 3.0 -6.1 6.9 0.379
Overall (7 states)‡ 502 18.5 1.0 787 27.4 1.6 -8.8* 1.9 0.000
Iowa 21 34.4 7.0 --- --- --- --- --- --- Kansas 31 20.4 4.1 --- --- --- --- --- --- Maryland 351 12.4 1.2 --- --- --- --- --- --- North Dakota 39 25.9 4.3 --- --- --- --- --- ---
Overall (4 states) 442 15.0 1.1 --- --- --- --- --- ---
SOURCE: 2010–11 Special Education Designee Survey. NOTES: ‡The overall means for always-SWD-accountable schools and never-SWD-accountable schools in 7 states are the means across schools in the sample states from which both types of schools were sampled. The overall mean for always-SWD-accountable schools in 4 states is the mean across schools in the remaining sampled states. “---” indicates that survey data were not gathered for that analysis. Differences that are statistically significant at the .05 level, two-tailed, are indicated by an asterisk (*).
171

School Practices and Accountability for Students With Disabilities
Exhibit F-40. Percentage of Students With Disabilities in Resource Rooms for Reading in Middle Schools in 2010–11, by SWD-Accountability Status Between 2005–06 and 2007–08
State Always-SWD-Acct Schools: Sample size
Always-SWD-Acct Schools:
Mean (Percent)
Always-SWD-Acct Schools:
SE
Never-SWD-Acct Schools: Sample size
Never-SWD-Acct
Schools: Mean
(Percent)
Never-SWD-Acct Schools:
SE Difference Difference:
SE Difference:
p value
California 73 17.7 2.8 134 24.3 2.6 -6.6 3.8 0.083 Florida 47 12.6 3.1 8 12.2 6.6 0.5 7.0 0.947 Georgia 115 14.3 1.5 25 8.9 2.3 5.4* 2.7 0.046 North Carolina 18 19.4 7.3 10 41.5 12.3 -22.1 14.2 0.131 Wisconsin 58 14.2 2.9 37 23.8 4.3 -9.6 5.2 0.066
Overall (5 states)‡ 311 15.1 1.2 214 23.0 2.0 -7.9* 2.3 0.001
Iowa 48 9.3 2.6 --- --- --- --- --- --- Maryland 86 11.5 2.2 --- --- --- --- --- --- Massachusetts 102 2.2 0.5 --- --- --- --- --- ---
Overall (3 states) 236 6.9 1.0 --- --- --- --- --- ---
SOURCE: 2010–11 Special Education Designee Survey. NOTES: ‡The overall means for always-SWD-accountable schools and never-SWD-accountable schools in 5 states are the means across schools in the sample states from which both types of schools were sampled. The overall mean for always-SWD-accountable schools in 3 states is the mean across schools in the remaining sampled states. “---” indicates that survey data were not gathered for that analysis. Differences that are statistically significant at the .05 level, two-tailed, are indicated by an asterisk (*).
172

School Practices and Accountability for Students With Disabilities
Exhibit F-41. Percentage of Students With Disabilities in Self-Contained Classrooms for Reading in Elementary Schools in 2010–11, by SWD-Accountability Status Between 2005–06 and 2007–08
State Always-SWD-Acct Schools: Sample size
Always-SWD-Acct Schools:
Mean (Percent)
Always-SWD-Acct Schools:
SE
Never-SWD-Acct Schools: Sample size
Never-SWD-Acct
Schools: Mean
(Percent)
Never-SWD-Acct Schools:
SE Difference Difference:
SE Difference:
p value
California 34 29.2 3.5 132 16.3 2.0 12.8* 4.0 0.002 Florida 199 16.4 1.3 76 10.3 2.1 6.1* 2.5 0.013 Georgia 119 10.7 1.2 171 10.6 1.4 0.1 1.9 0.948 Massachusetts 32 15.1 3.1 171 9.0 1.4 6.1 3.4 0.074 Minnesota 71 7.9 1.4 27 2.7 1.7 5.3* 2.1 0.016 North Carolina 34 11.0 1.8 133 10.3 1.5 0.6 2.4 0.792
Virginia 13 12.6 7.0 77 15.3 2.7 -2.7 7.3 0.713
Overall (7 states)‡ 502 14.2 0.8 787 14.0 1.2 0.2 1.4 0.891
Iowa 21 11.0 2.9 --- --- --- --- --- --- Kansas 31 1.0 0.4 --- --- --- --- --- --- Maryland 351 9.5 1.0 --- --- --- --- --- --- North Dakota 39 4.6 2.1 --- --- --- --- --- ---
Overall (4 states) 442 8.6 0.8 --- --- --- --- --- ---
SOURCE: 2010–11 Special Education Designee Survey. NOTES: ‡The overall means for always-SWD-accountable schools and never-SWD-accountable schools in 7 states are the means across schools in the sample states from which both types of schools were sampled. The overall mean for always-SWD-accountable schools in 4 states is the mean across schools in the remaining sampled states. “---” indicates that survey data were not gathered for that analysis. Differences that are statistically significant at the .05 level, two-tailed, are indicated by an asterisk (*).
173

School Practices and Accountability for Students With Disabilities
Exhibit F-42. Percentage of Students With Disabilities in Self-Contained Classrooms for Reading in Middle Schools in 2010–11, by SWD-Accountability Status Between 2005–06 and 2007–08
State Always-SWD-Acct Schools: Sample size
Always-SWD-Acct Schools:
Mean (Percent)
Always-SWD-Acct Schools:
SE
Never-SWD-Acct Schools: Sample size
Never-SWD-Acct
Schools: Mean
(Percent)
Never-SWD-Acct Schools:
SE Difference Difference:
SE Difference:
p value
California 73 25.6 2.2 134 18.6 1.9 7.0* 2.9 0.018 Florida 47 11.4 1.9 8 11.1 7.8 0.3 7.6 0.967 Georgia 115 11.6 1.2 25 16.9 4.8 -5.3 4.8 0.276 North Carolina 18 14.9 5.5 10 6.2 3.1 8.7 6.3 0.180 Wisconsin 58 12.3 2.2 37 11.1 2.7 1.3 3.5 0.719
Overall (5 states)‡ 311 15.2 1.0 214 16.6 1.5 -1.4 1.7 0.415
Iowa 48 24.6 3.8 --- --- --- --- --- --- Maryland 86 13.2 2.0 --- --- --- --- --- --- Massachusetts 102 11.3 1.6 --- --- --- --- --- ---
Overall (3 states) 236 14.6 1.3 --- --- --- --- --- ---
SOURCE: 2010–11 Special Education Designee Survey. NOTES: ‡The overall means for always-SWD-accountable schools and never-SWD-accountable schools in 5 states are the means across schools in the sample states from which both types of schools were sampled. The overall mean for always-SWD-accountable schools in 3 states is the mean across schools in the remaining sampled states. “---” indicates that survey data were not gathered for that analysis. Differences that are statistically significant at the .05 level, two-tailed, are indicated by an asterisk (*).
174
School Practices and Accountability for Students With Disabilities
Appendix G: Chapter 7, Teacher Collaboration and Pro-fessional Development in SWD-Accountable and Non-SWD-Accountable Schools—State-Level Tables
175
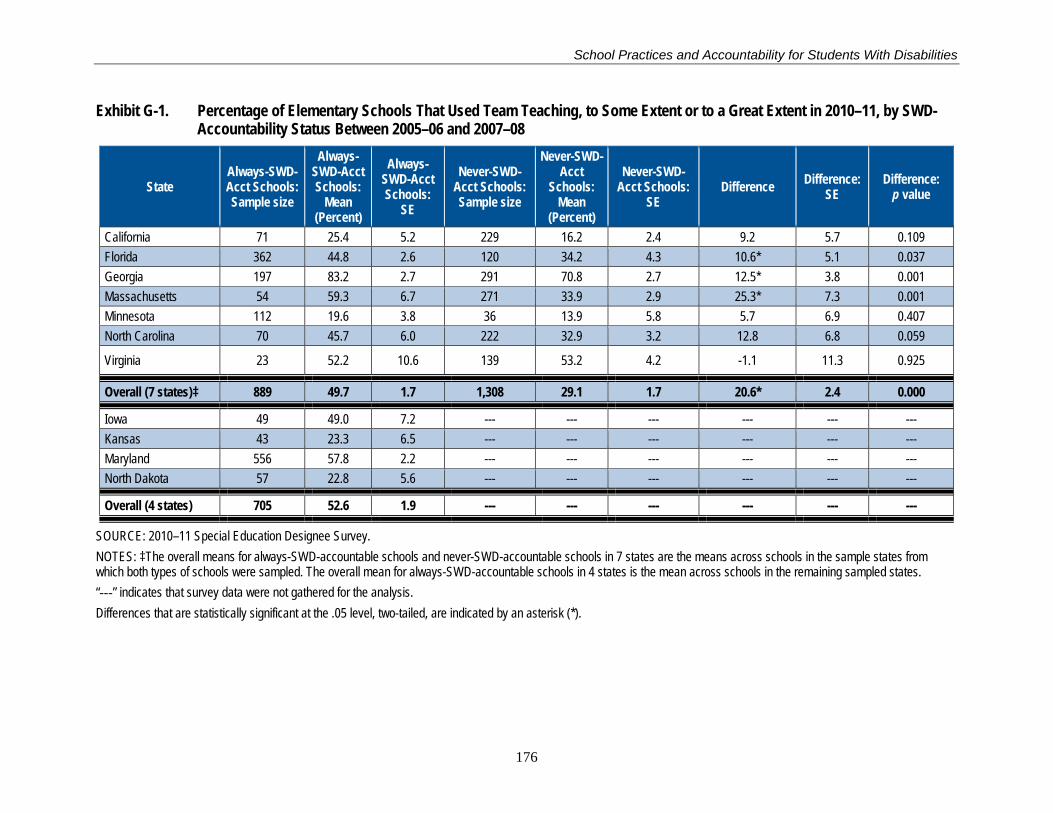
School Practices and Accountability for Students With Disabilities
Exhibit G-1. Percentage of Elementary Schools That Used Team Teaching, to Some Extent or to a Great Extent in 2010–11, by SWD-Accountability Status Between 2005–06 and 2007–08
State Always-SWD-Acct Schools: Sample size
Always-SWD-Acct Schools:
Mean (Percent)
Always-SWD-Acct Schools:
SE
Never-SWD-Acct Schools: Sample size
Never-SWD-Acct
Schools: Mean
(Percent)
Never-SWD-Acct Schools:
SE Difference Difference:
SE Difference:
p value
California 71 25.4 5.2 229 16.2 2.4 9.2 5.7 0.109 Florida 362 44.8 2.6 120 34.2 4.3 10.6* 5.1 0.037 Georgia 197 83.2 2.7 291 70.8 2.7 12.5* 3.8 0.001 Massachusetts 54 59.3 6.7 271 33.9 2.9 25.3* 7.3 0.001 Minnesota 112 19.6 3.8 36 13.9 5.8 5.7 6.9 0.407 North Carolina 70 45.7 6.0 222 32.9 3.2 12.8 6.8 0.059
Virginia 23 52.2 10.6 139 53.2 4.2 -1.1 11.3 0.925
Overall (7 states)‡ 889 49.7 1.7 1,308 29.1 1.7 20.6* 2.4 0.000
Iowa 49 49.0 7.2 --- --- --- --- --- --- Kansas 43 23.3 6.5 --- --- --- --- --- --- Maryland 556 57.8 2.2 --- --- --- --- --- --- North Dakota 57 22.8 5.6 --- --- --- --- --- ---
Overall (4 states) 705 52.6 1.9 --- --- --- --- --- ---
SOURCE: 2010–11 Special Education Designee Survey. NOTES: ‡The overall means for always-SWD-accountable schools and never-SWD-accountable schools in 7 states are the means across schools in the sample states from which both types of schools were sampled. The overall mean for always-SWD-accountable schools in 4 states is the mean across schools in the remaining sampled states. “---” indicates that survey data were not gathered for the analysis. Differences that are statistically significant at the .05 level, two-tailed, are indicated by an asterisk (*).
176
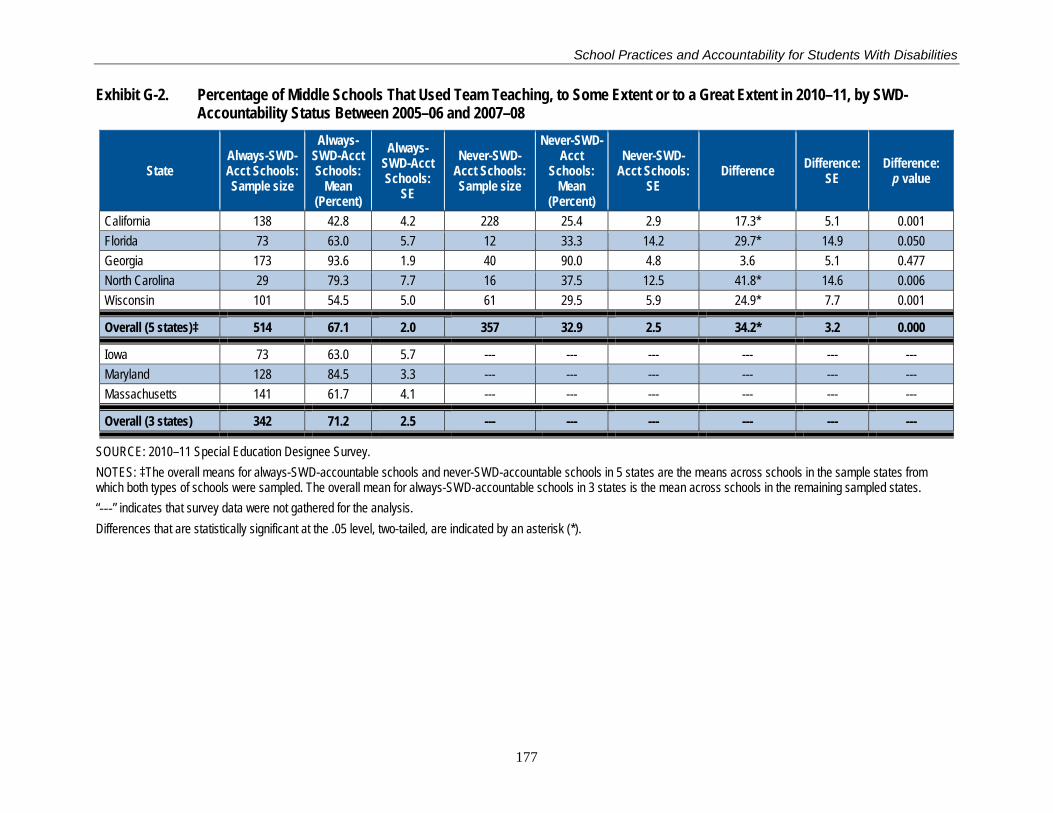
School Practices and Accountability for Students With Disabilities
Exhibit G-2. Percentage of Middle Schools That Used Team Teaching, to Some Extent or to a Great Extent in 2010–11, by SWD-Accountability Status Between 2005–06 and 2007–08
State Always-SWD-Acct Schools: Sample size
Always-SWD-Acct Schools:
Mean (Percent)
Always-SWD-Acct Schools:
SE
Never-SWD-Acct Schools: Sample size
Never-SWD-Acct
Schools: Mean
(Percent)
Never-SWD-Acct Schools:
SE Difference Difference:
SE Difference:
p value
California 138 42.8 4.2 228 25.4 2.9 17.3* 5.1 0.001 Florida 73 63.0 5.7 12 33.3 14.2 29.7* 14.9 0.050 Georgia 173 93.6 1.9 40 90.0 4.8 3.6 5.1 0.477 North Carolina 29 79.3 7.7 16 37.5 12.5 41.8* 14.6 0.006 Wisconsin 101 54.5 5.0 61 29.5 5.9 24.9* 7.7 0.001
Overall (5 states)‡ 514 67.1 2.0 357 32.9 2.5 34.2* 3.2 0.000
Iowa 73 63.0 5.7 --- --- --- --- --- --- Maryland 128 84.5 3.3 --- --- --- --- --- --- Massachusetts 141 61.7 4.1 --- --- --- --- --- ---
Overall (3 states) 342 71.2 2.5 --- --- --- --- --- ---
SOURCE: 2010–11 Special Education Designee Survey. NOTES: ‡The overall means for always-SWD-accountable schools and never-SWD-accountable schools in 5 states are the means across schools in the sample states from which both types of schools were sampled. The overall mean for always-SWD-accountable schools in 3 states is the mean across schools in the remaining sampled states. “---” indicates that survey data were not gathered for the analysis. Differences that are statistically significant at the .05 level, two-tailed, are indicated by an asterisk (*).
177
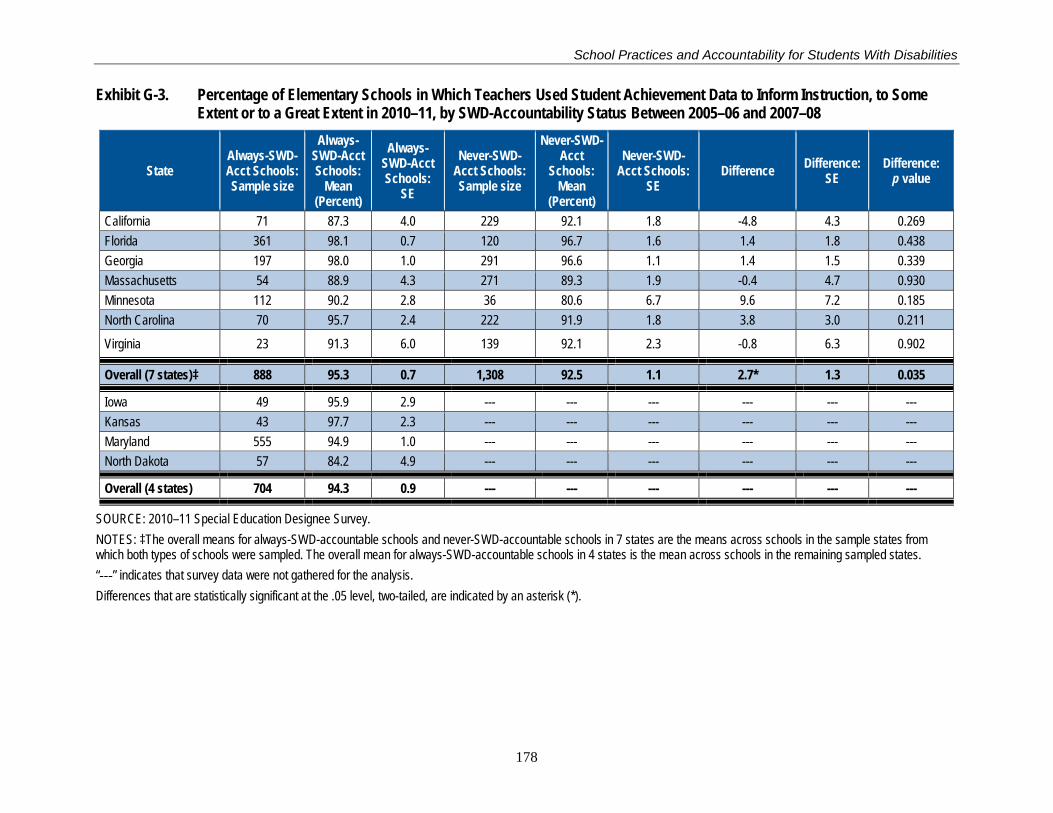
School Practices and Accountability for Students With Disabilities
Exhibit G-3. Percentage of Elementary Schools in Which Teachers Used Student Achievement Data to Inform Instruction, to Some Extent or to a Great Extent in 2010–11, by SWD-Accountability Status Between 2005–06 and 2007–08
State Always-SWD-Acct Schools: Sample size
Always-SWD-Acct Schools:
Mean (Percent)
Always-SWD-Acct Schools:
SE
Never-SWD-Acct Schools: Sample size
Never-SWD-Acct
Schools: Mean
(Percent)
Never-SWD-Acct Schools:
SE Difference Difference:
SE Difference:
p value
California 71 87.3 4.0 229 92.1 1.8 -4.8 4.3 0.269 Florida 361 98.1 0.7 120 96.7 1.6 1.4 1.8 0.438 Georgia 197 98.0 1.0 291 96.6 1.1 1.4 1.5 0.339 Massachusetts 54 88.9 4.3 271 89.3 1.9 -0.4 4.7 0.930 Minnesota 112 90.2 2.8 36 80.6 6.7 9.6 7.2 0.185 North Carolina 70 95.7 2.4 222 91.9 1.8 3.8 3.0 0.211
Virginia 23 91.3 6.0 139 92.1 2.3 -0.8 6.3 0.902
Overall (7 states)‡ 888 95.3 0.7 1,308 92.5 1.1 2.7* 1.3 0.035
Iowa 49 95.9 2.9 --- --- --- --- --- --- Kansas 43 97.7 2.3 --- --- --- --- --- --- Maryland 555 94.9 1.0 --- --- --- --- --- --- North Dakota 57 84.2 4.9 --- --- --- --- --- ---
Overall (4 states) 704 94.3 0.9 --- --- --- --- --- ---
SOURCE: 2010–11 Special Education Designee Survey. NOTES: ‡The overall means for always-SWD-accountable schools and never-SWD-accountable schools in 7 states are the means across schools in the sample states from which both types of schools were sampled. The overall mean for always-SWD-accountable schools in 4 states is the mean across schools in the remaining sampled states. “---” indicates that survey data were not gathered for the analysis. Differences that are statistically significant at the .05 level, two-tailed, are indicated by an asterisk (*).
178
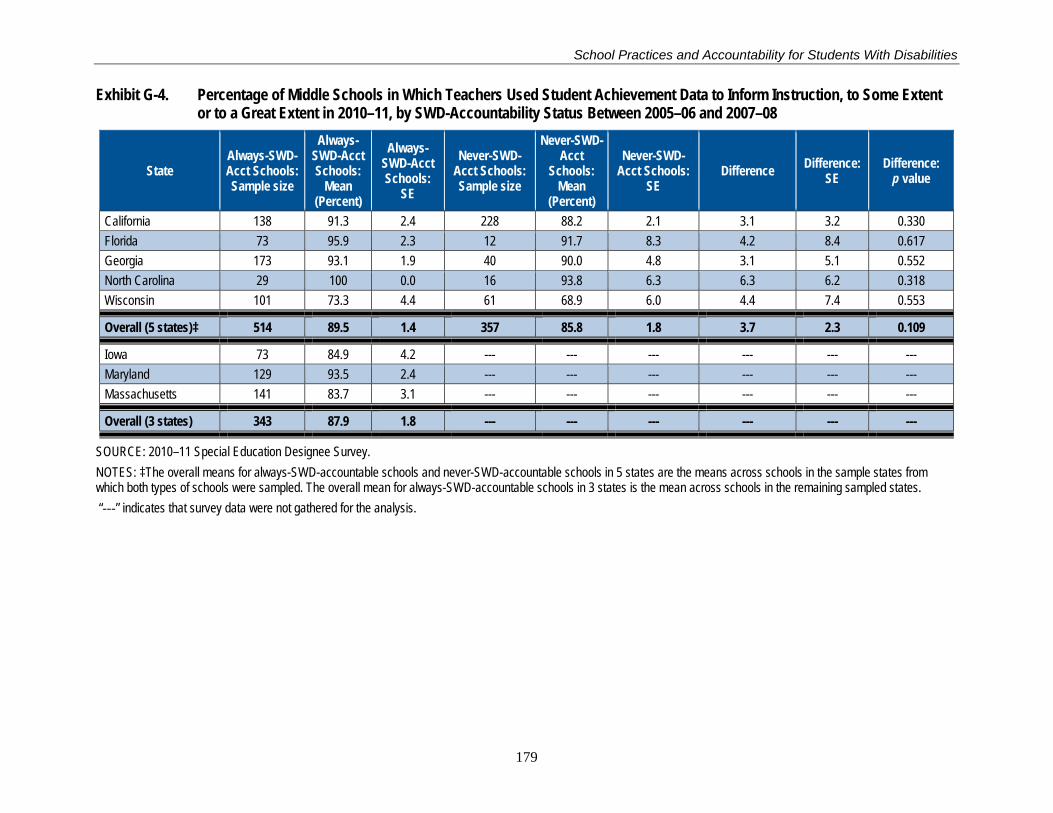
School Practices and Accountability for Students With Disabilities
Exhibit G-4. Percentage of Middle Schools in Which Teachers Used Student Achievement Data to Inform Instruction, to Some Extent or to a Great Extent in 2010–11, by SWD-Accountability Status Between 2005–06 and 2007–08
State Always-SWD-Acct Schools: Sample size
Always-SWD-Acct Schools:
Mean (Percent)
Always-SWD-Acct Schools:
SE
Never-SWD-Acct Schools: Sample size
Never-SWD-Acct
Schools: Mean
(Percent)
Never-SWD-Acct Schools:
SE Difference Difference:
SE Difference:
p value
California 138 91.3 2.4 228 88.2 2.1 3.1 3.2 0.330 Florida 73 95.9 2.3 12 91.7 8.3 4.2 8.4 0.617 Georgia 173 93.1 1.9 40 90.0 4.8 3.1 5.1 0.552 North Carolina 29 100 0.0 16 93.8 6.3 6.3 6.2 0.318 Wisconsin 101 73.3 4.4 61 68.9 6.0 4.4 7.4 0.553
Overall (5 states)‡ 514 89.5 1.4 357 85.8 1.8 3.7 2.3 0.109
Iowa 73 84.9 4.2 --- --- --- --- --- --- Maryland 129 93.5 2.4 --- --- --- --- --- --- Massachusetts 141 83.7 3.1 --- --- --- --- --- ---
Overall (3 states) 343 87.9 1.8 --- --- --- --- --- ---
SOURCE: 2010–11 Special Education Designee Survey. NOTES: ‡The overall means for always-SWD-accountable schools and never-SWD-accountable schools in 5 states are the means across schools in the sample states from which both types of schools were sampled. The overall mean for always-SWD-accountable schools in 3 states is the mean across schools in the remaining sampled states. “---” indicates that survey data were not gathered for the analysis.
179
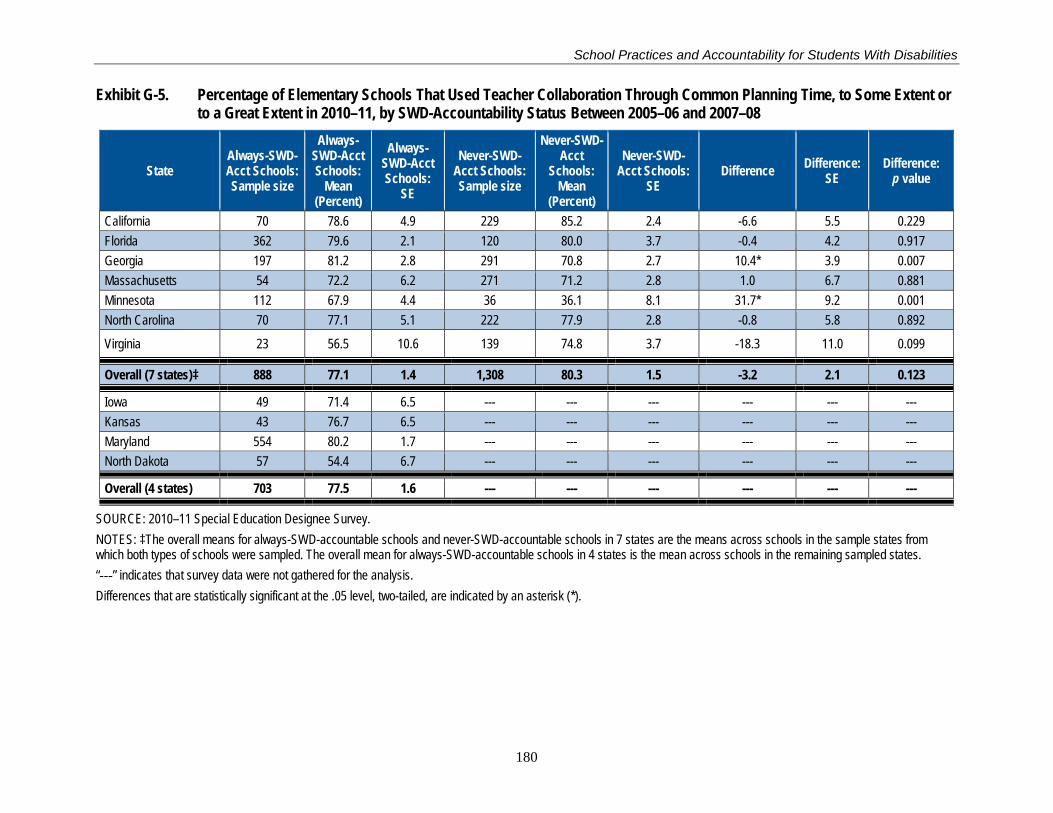
School Practices and Accountability for Students With Disabilities
Exhibit G-5. Percentage of Elementary Schools That Used Teacher Collaboration Through Common Planning Time, to Some Extent or to a Great Extent in 2010–11, by SWD-Accountability Status Between 2005–06 and 2007–08
State Always-SWD-Acct Schools: Sample size
Always-SWD-Acct Schools:
Mean (Percent)
Always-SWD-Acct Schools:
SE
Never-SWD-Acct Schools: Sample size
Never-SWD-Acct
Schools: Mean
(Percent)
Never-SWD-Acct Schools:
SE Difference Difference:
SE Difference:
p value
California 70 78.6 4.9 229 85.2 2.4 -6.6 5.5 0.229 Florida 362 79.6 2.1 120 80.0 3.7 -0.4 4.2 0.917 Georgia 197 81.2 2.8 291 70.8 2.7 10.4* 3.9 0.007 Massachusetts 54 72.2 6.2 271 71.2 2.8 1.0 6.7 0.881 Minnesota 112 67.9 4.4 36 36.1 8.1 31.7* 9.2 0.001 North Carolina 70 77.1 5.1 222 77.9 2.8 -0.8 5.8 0.892
Virginia 23 56.5 10.6 139 74.8 3.7 -18.3 11.0 0.099
Overall (7 states)‡ 888 77.1 1.4 1,308 80.3 1.5 -3.2 2.1 0.123
Iowa 49 71.4 6.5 --- --- --- --- --- --- Kansas 43 76.7 6.5 --- --- --- --- --- --- Maryland 554 80.2 1.7 --- --- --- --- --- --- North Dakota 57 54.4 6.7 --- --- --- --- --- ---
Overall (4 states) 703 77.5 1.6 --- --- --- --- --- ---
SOURCE: 2010–11 Special Education Designee Survey. NOTES: ‡The overall means for always-SWD-accountable schools and never-SWD-accountable schools in 7 states are the means across schools in the sample states from which both types of schools were sampled. The overall mean for always-SWD-accountable schools in 4 states is the mean across schools in the remaining sampled states. “---” indicates that survey data were not gathered for the analysis. Differences that are statistically significant at the .05 level, two-tailed, are indicated by an asterisk (*).
180
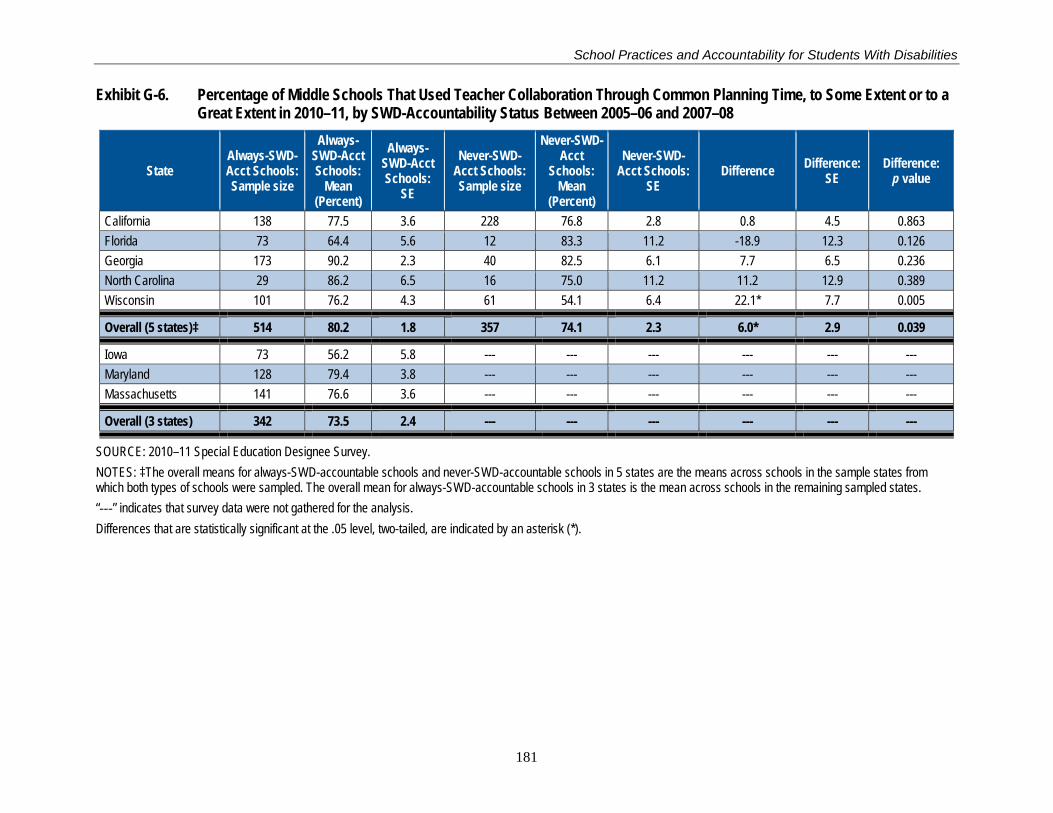
School Practices and Accountability for Students With Disabilities
Exhibit G-6. Percentage of Middle Schools That Used Teacher Collaboration Through Common Planning Time, to Some Extent or to a Great Extent in 2010–11, by SWD-Accountability Status Between 2005–06 and 2007–08
State Always-SWD-Acct Schools: Sample size
Always-SWD-Acct Schools:
Mean (Percent)
Always-SWD-Acct Schools:
SE
Never-SWD-Acct Schools: Sample size
Never-SWD-Acct
Schools: Mean
(Percent)
Never-SWD-Acct Schools:
SE Difference Difference:
SE Difference:
p value
California 138 77.5 3.6 228 76.8 2.8 0.8 4.5 0.863 Florida 73 64.4 5.6 12 83.3 11.2 -18.9 12.3 0.126 Georgia 173 90.2 2.3 40 82.5 6.1 7.7 6.5 0.236 North Carolina 29 86.2 6.5 16 75.0 11.2 11.2 12.9 0.389 Wisconsin 101 76.2 4.3 61 54.1 6.4 22.1* 7.7 0.005
Overall (5 states)‡ 514 80.2 1.8 357 74.1 2.3 6.0* 2.9 0.039
Iowa 73 56.2 5.8 --- --- --- --- --- --- Maryland 128 79.4 3.8 --- --- --- --- --- --- Massachusetts 141 76.6 3.6 --- --- --- --- --- ---
Overall (3 states) 342 73.5 2.4 --- --- --- --- --- ---
SOURCE: 2010–11 Special Education Designee Survey. NOTES: ‡The overall means for always-SWD-accountable schools and never-SWD-accountable schools in 5 states are the means across schools in the sample states from which both types of schools were sampled. The overall mean for always-SWD-accountable schools in 3 states is the mean across schools in the remaining sampled states. “---” indicates that survey data were not gathered for the analysis. Differences that are statistically significant at the .05 level, two-tailed, are indicated by an asterisk (*).
181
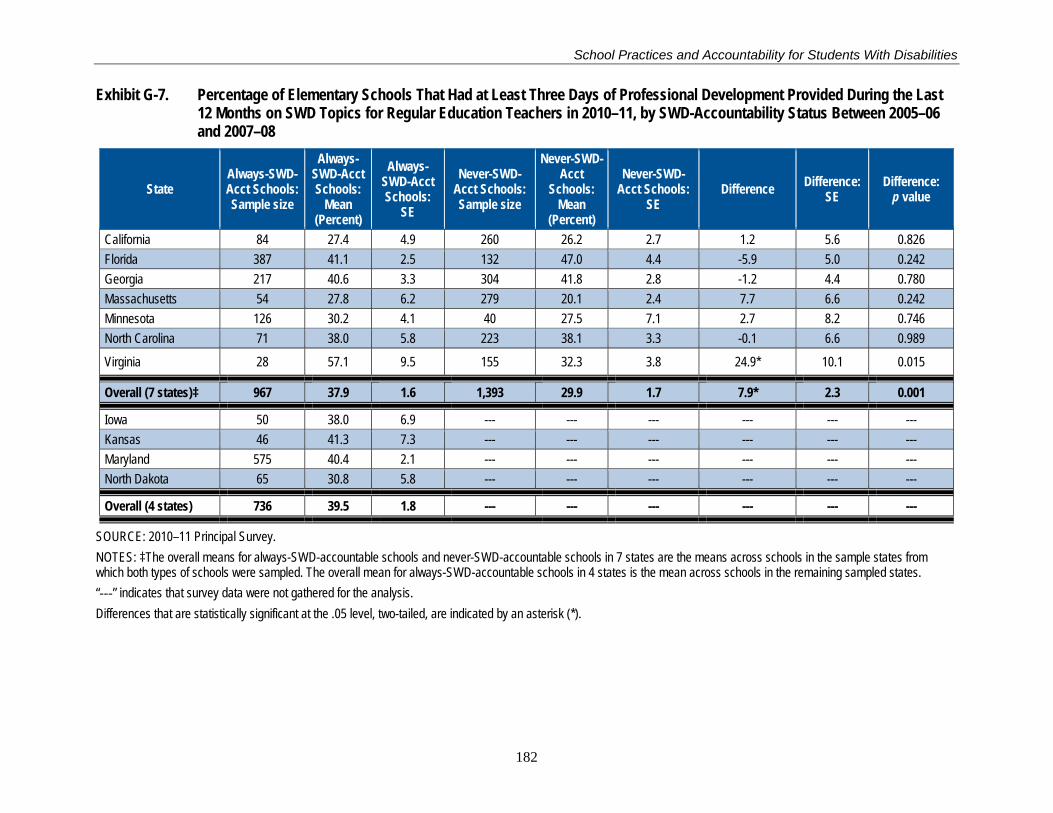
School Practices and Accountability for Students With Disabilities
Exhibit G-7. Percentage of Elementary Schools That Had at Least Three Days of Professional Development Provided During the Last 12 Months on SWD Topics for Regular Education Teachers in 2010–11, by SWD-Accountability Status Between 2005–06 and 2007–08
State Always-SWD-Acct Schools: Sample size
Always-SWD-Acct Schools:
Mean (Percent)
Always-SWD-Acct Schools:
SE
Never-SWD-Acct Schools: Sample size
Never-SWD-Acct
Schools: Mean
(Percent)
Never-SWD-Acct Schools:
SE Difference Difference:
SE Difference:
p value
California 84 27.4 4.9 260 26.2 2.7 1.2 5.6 0.826 Florida 387 41.1 2.5 132 47.0 4.4 -5.9 5.0 0.242 Georgia 217 40.6 3.3 304 41.8 2.8 -1.2 4.4 0.780 Massachusetts 54 27.8 6.2 279 20.1 2.4 7.7 6.6 0.242 Minnesota 126 30.2 4.1 40 27.5 7.1 2.7 8.2 0.746 North Carolina 71 38.0 5.8 223 38.1 3.3 -0.1 6.6 0.989
Virginia 28 57.1 9.5 155 32.3 3.8 24.9* 10.1 0.015
Overall (7 states)‡ 967 37.9 1.6 1,393 29.9 1.7 7.9* 2.3 0.001
Iowa 50 38.0 6.9 --- --- --- --- --- --- Kansas 46 41.3 7.3 --- --- --- --- --- --- Maryland 575 40.4 2.1 --- --- --- --- --- --- North Dakota 65 30.8 5.8 --- --- --- --- --- ---
Overall (4 states) 736 39.5 1.8 --- --- --- --- --- ---
SOURCE: 2010–11 Principal Survey. NOTES: ‡The overall means for always-SWD-accountable schools and never-SWD-accountable schools in 7 states are the means across schools in the sample states from which both types of schools were sampled. The overall mean for always-SWD-accountable schools in 4 states is the mean across schools in the remaining sampled states. “---” indicates that survey data were not gathered for the analysis. Differences that are statistically significant at the .05 level, two-tailed, are indicated by an asterisk (*).
182
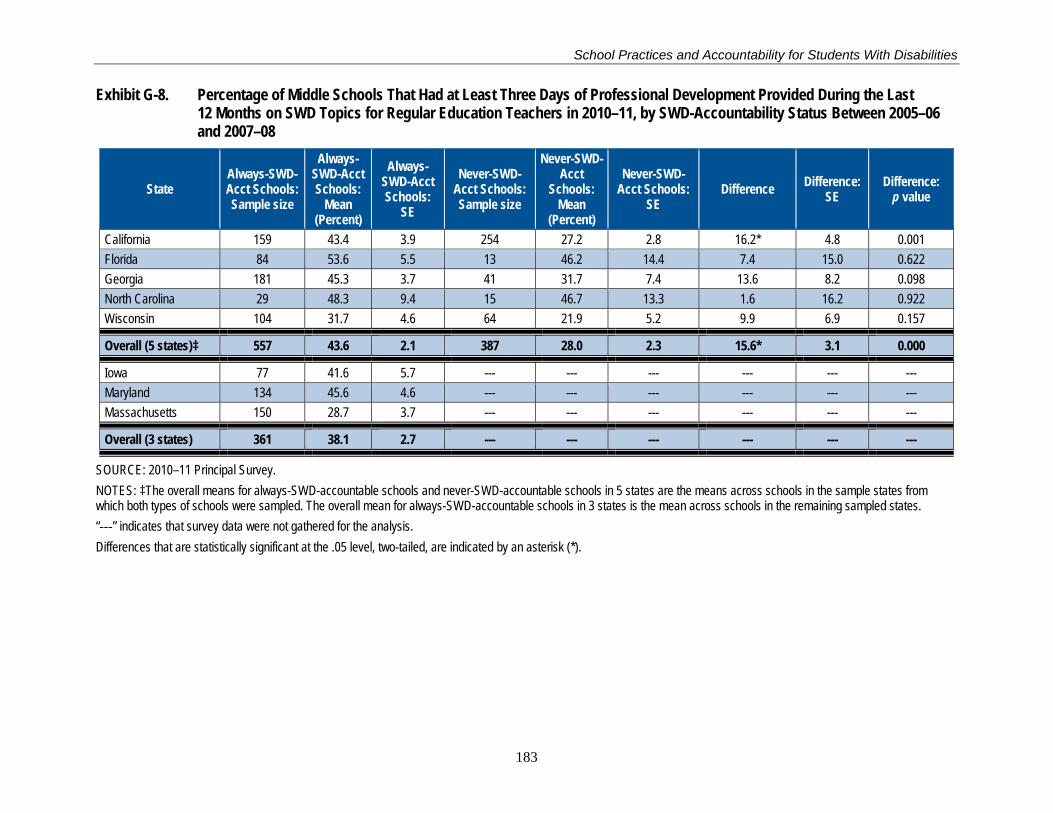
School Practices and Accountability for Students With Disabilities
Exhibit G-8. Percentage of Middle Schools That Had at Least Three Days of Professional Development Provided During the Last 12 Months on SWD Topics for Regular Education Teachers in 2010–11, by SWD-Accountability Status Between 2005–06 and 2007–08
State Always-SWD-Acct Schools: Sample size
Always-SWD-Acct Schools:
Mean (Percent)
Always-SWD-Acct Schools:
SE
Never-SWD-Acct Schools: Sample size
Never-SWD-Acct
Schools: Mean
(Percent)
Never-SWD-Acct Schools:
SE Difference Difference:
SE Difference:
p value
California 159 43.4 3.9 254 27.2 2.8 16.2* 4.8 0.001 Florida 84 53.6 5.5 13 46.2 14.4 7.4 15.0 0.622 Georgia 181 45.3 3.7 41 31.7 7.4 13.6 8.2 0.098 North Carolina 29 48.3 9.4 15 46.7 13.3 1.6 16.2 0.922 Wisconsin 104 31.7 4.6 64 21.9 5.2 9.9 6.9 0.157
Overall (5 states)‡ 557 43.6 2.1 387 28.0 2.3 15.6* 3.1 0.000
Iowa 77 41.6 5.7 --- --- --- --- --- --- Maryland 134 45.6 4.6 --- --- --- --- --- --- Massachusetts 150 28.7 3.7 --- --- --- --- --- ---
Overall (3 states) 361 38.1 2.7 --- --- --- --- --- ---
SOURCE: 2010–11 Principal Survey. NOTES: ‡The overall means for always-SWD-accountable schools and never-SWD-accountable schools in 5 states are the means across schools in the sample states from which both types of schools were sampled. The overall mean for always-SWD-accountable schools in 3 states is the mean across schools in the remaining sampled states. “---” indicates that survey data were not gathered for the analysis. Differences that are statistically significant at the .05 level, two-tailed, are indicated by an asterisk (*).
183
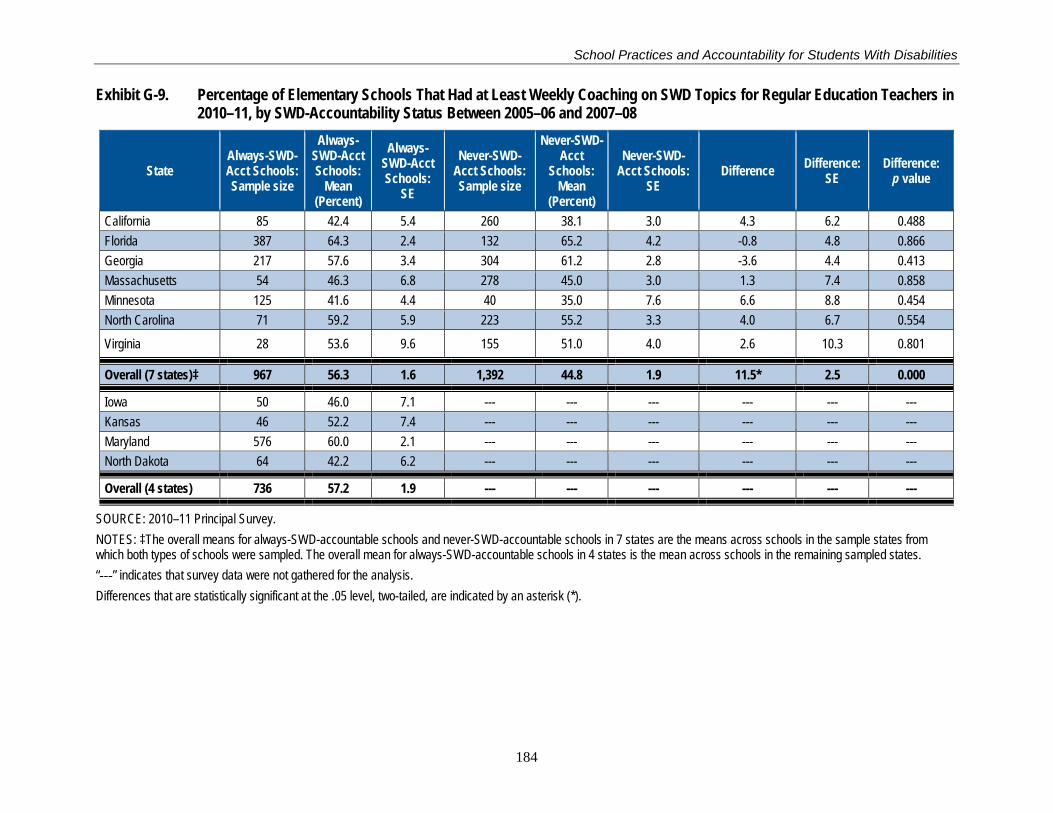
School Practices and Accountability for Students With Disabilities
Exhibit G-9. Percentage of Elementary Schools That Had at Least Weekly Coaching on SWD Topics for Regular Education Teachers in 2010–11, by SWD-Accountability Status Between 2005–06 and 2007–08
State Always-SWD-Acct Schools: Sample size
Always-SWD-Acct Schools:
Mean (Percent)
Always-SWD-Acct Schools:
SE
Never-SWD-Acct Schools: Sample size
Never-SWD-Acct
Schools: Mean
(Percent)
Never-SWD-Acct Schools:
SE Difference Difference:
SE Difference:
p value
California 85 42.4 5.4 260 38.1 3.0 4.3 6.2 0.488 Florida 387 64.3 2.4 132 65.2 4.2 -0.8 4.8 0.866 Georgia 217 57.6 3.4 304 61.2 2.8 -3.6 4.4 0.413 Massachusetts 54 46.3 6.8 278 45.0 3.0 1.3 7.4 0.858 Minnesota 125 41.6 4.4 40 35.0 7.6 6.6 8.8 0.454 North Carolina 71 59.2 5.9 223 55.2 3.3 4.0 6.7 0.554
Virginia 28 53.6 9.6 155 51.0 4.0 2.6 10.3 0.801
Overall (7 states)‡ 967 56.3 1.6 1,392 44.8 1.9 11.5* 2.5 0.000
Iowa 50 46.0 7.1 --- --- --- --- --- --- Kansas 46 52.2 7.4 --- --- --- --- --- --- Maryland 576 60.0 2.1 --- --- --- --- --- --- North Dakota 64 42.2 6.2 --- --- --- --- --- ---
Overall (4 states) 736 57.2 1.9 --- --- --- --- --- ---
SOURCE: 2010–11 Principal Survey. NOTES: ‡The overall means for always-SWD-accountable schools and never-SWD-accountable schools in 7 states are the means across schools in the sample states from which both types of schools were sampled. The overall mean for always-SWD-accountable schools in 4 states is the mean across schools in the remaining sampled states. “---” indicates that survey data were not gathered for the analysis. Differences that are statistically significant at the .05 level, two-tailed, are indicated by an asterisk (*).
184
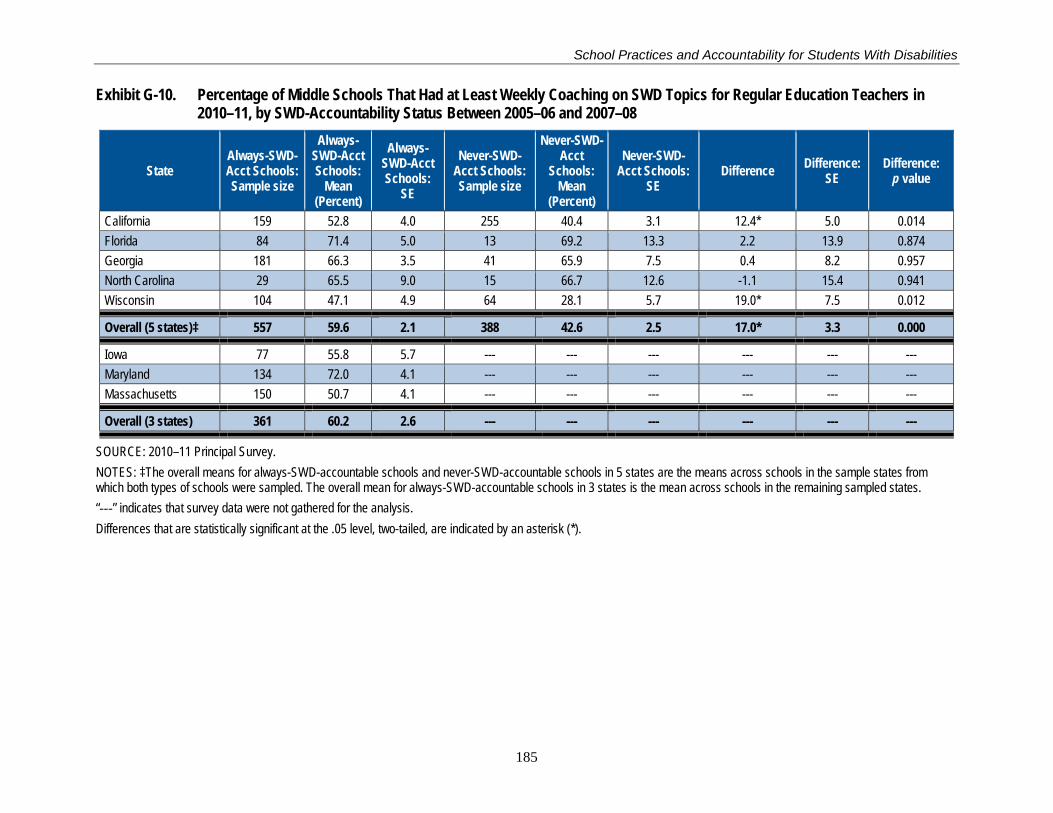
School Practices and Accountability for Students With Disabilities
Exhibit G-10. Percentage of Middle Schools That Had at Least Weekly Coaching on SWD Topics for Regular Education Teachers in 2010–11, by SWD-Accountability Status Between 2005–06 and 2007–08
State Always-SWD-Acct Schools: Sample size
Always-SWD-Acct Schools:
Mean (Percent)
Always-SWD-Acct Schools:
SE
Never-SWD-Acct Schools: Sample size
Never-SWD-Acct
Schools: Mean
(Percent)
Never-SWD-Acct Schools:
SE Difference Difference:
SE Difference:
p value
California 159 52.8 4.0 255 40.4 3.1 12.4* 5.0 0.014 Florida 84 71.4 5.0 13 69.2 13.3 2.2 13.9 0.874 Georgia 181 66.3 3.5 41 65.9 7.5 0.4 8.2 0.957 North Carolina 29 65.5 9.0 15 66.7 12.6 -1.1 15.4 0.941 Wisconsin 104 47.1 4.9 64 28.1 5.7 19.0* 7.5 0.012
Overall (5 states)‡ 557 59.6 2.1 388 42.6 2.5 17.0* 3.3 0.000
Iowa 77 55.8 5.7 --- --- --- --- --- --- Maryland 134 72.0 4.1 --- --- --- --- --- --- Massachusetts 150 50.7 4.1 --- --- --- --- --- ---
Overall (3 states) 361 60.2 2.6 --- --- --- --- --- ---
SOURCE: 2010–11 Principal Survey. NOTES: ‡The overall means for always-SWD-accountable schools and never-SWD-accountable schools in 5 states are the means across schools in the sample states from which both types of schools were sampled. The overall mean for always-SWD-accountable schools in 3 states is the mean across schools in the remaining sampled states. “---” indicates that survey data were not gathered for the analysis. Differences that are statistically significant at the .05 level, two-tailed, are indicated by an asterisk (*).
185
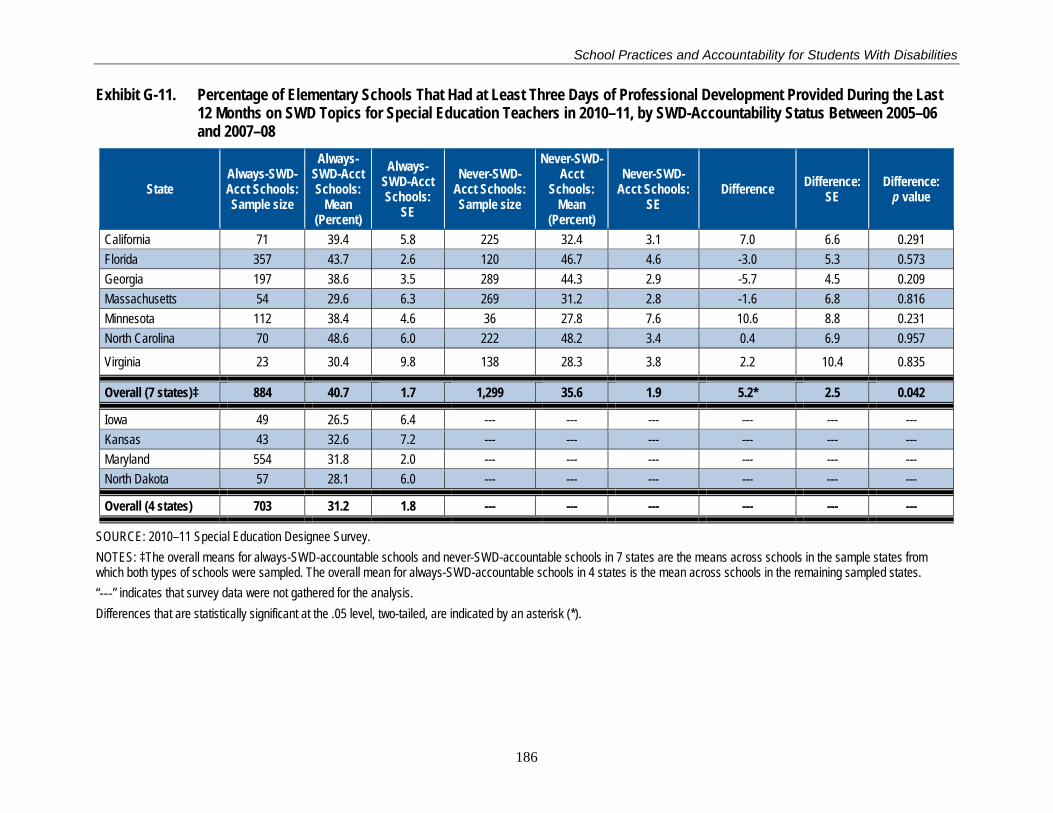
School Practices and Accountability for Students With Disabilities
Exhibit G-11. Percentage of Elementary Schools That Had at Least Three Days of Professional Development Provided During the Last 12 Months on SWD Topics for Special Education Teachers in 2010–11, by SWD-Accountability Status Between 2005–06 and 2007–08
State Always-SWD-Acct Schools: Sample size
Always-SWD-Acct Schools:
Mean (Percent)
Always-SWD-Acct Schools:
SE
Never-SWD-Acct Schools: Sample size
Never-SWD-Acct
Schools: Mean
(Percent)
Never-SWD-Acct Schools:
SE Difference Difference:
SE Difference:
p value
California 71 39.4 5.8 225 32.4 3.1 7.0 6.6 0.291 Florida 357 43.7 2.6 120 46.7 4.6 -3.0 5.3 0.573 Georgia 197 38.6 3.5 289 44.3 2.9 -5.7 4.5 0.209 Massachusetts 54 29.6 6.3 269 31.2 2.8 -1.6 6.8 0.816 Minnesota 112 38.4 4.6 36 27.8 7.6 10.6 8.8 0.231 North Carolina 70 48.6 6.0 222 48.2 3.4 0.4 6.9 0.957
Virginia 23 30.4 9.8 138 28.3 3.8 2.2 10.4 0.835
Overall (7 states)‡ 884 40.7 1.7 1,299 35.6 1.9 5.2* 2.5 0.042
Iowa 49 26.5 6.4 --- --- --- --- --- --- Kansas 43 32.6 7.2 --- --- --- --- --- --- Maryland 554 31.8 2.0 --- --- --- --- --- --- North Dakota 57 28.1 6.0 --- --- --- --- --- ---
Overall (4 states) 703 31.2 1.8 --- --- --- --- --- ---
SOURCE: 2010–11 Special Education Designee Survey. NOTES: ‡The overall means for always-SWD-accountable schools and never-SWD-accountable schools in 7 states are the means across schools in the sample states from which both types of schools were sampled. The overall mean for always-SWD-accountable schools in 4 states is the mean across schools in the remaining sampled states. “---” indicates that survey data were not gathered for the analysis. Differences that are statistically significant at the .05 level, two-tailed, are indicated by an asterisk (*).
186

School Practices and Accountability for Students With Disabilities
Exhibit G-12. Percentage of Middle Schools That Had at Least Three Days of Professional Development Provided During the Last 12 Months on SWD Topics for Special Education Teachers in 2010–11, by SWD-Accountability Status Between 2005–06 and 2007–08
State Always-SWD-Acct Schools: Sample size
Always-SWD-Acct Schools:
Mean (Percent)
Always-SWD-Acct Schools:
SE
Never-SWD-Acct Schools: Sample size
Never-SWD-Acct
Schools: Mean
(Percent)
Never-SWD-Acct Schools:
SE Difference Difference:
SE Difference:
p value
California 138 44.2 4.2 228 29.8 3.0 14.4* 5.2 0.006 Florida 73 46.6 5.9 12 66.7 14.2 -20.1 15.0 0.184 Georgia 172 37.2 3.7 40 27.5 7.1 9.7 8.0 0.226 North Carolina 29 55.2 9.4 16 37.5 12.5 17.7 15.6 0.263 Wisconsin 101 27.7 4.5 61 26.2 5.7 1.5 7.2 0.837
Overall (5 states)‡ 513 39.6 2.2 357 30.4 2.5 9.1* 3.3 0.005
Iowa 73 27.4 5.3 --- --- --- --- --- --- Maryland 128 40.6 4.7 --- --- --- --- --- --- Massachusetts 139 28.1 3.8 --- --- --- --- --- ---
Overall (3 states) 340 33.0 2.7 --- --- --- --- --- ---
SOURCE: 2010–11 Special Education Designee Survey. NOTES: ‡The overall means for always-SWD-accountable schools and never-SWD-accountable schools in 5 states are the means across schools in the sample states from which both types of schools were sampled. The overall mean for always-SWD-accountable schools in 3 states is the mean across schools in the remaining sampled states. “---” indicates that survey data were not gathered for the analysis. Differences that are statistically significant at the .05 level, two-tailed, are indicated by an asterisk (*).
187
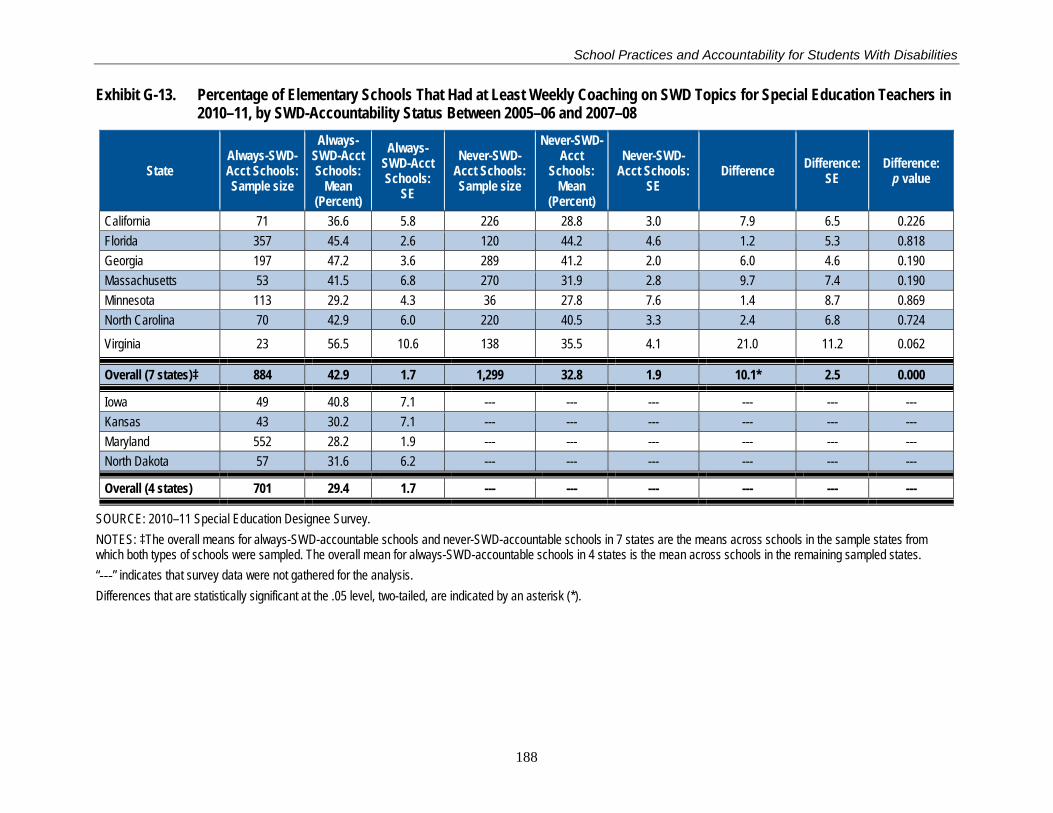
School Practices and Accountability for Students With Disabilities
Exhibit G-13. Percentage of Elementary Schools That Had at Least Weekly Coaching on SWD Topics for Special Education Teachers in 2010–11, by SWD-Accountability Status Between 2005–06 and 2007–08
State Always-SWD-Acct Schools: Sample size
Always-SWD-Acct Schools:
Mean (Percent)
Always-SWD-Acct Schools:
SE
Never-SWD-Acct Schools: Sample size
Never-SWD-Acct
Schools: Mean
(Percent)
Never-SWD-Acct Schools:
SE Difference Difference:
SE Difference:
p value
California 71 36.6 5.8 226 28.8 3.0 7.9 6.5 0.226 Florida 357 45.4 2.6 120 44.2 4.6 1.2 5.3 0.818 Georgia 197 47.2 3.6 289 41.2 2.0 6.0 4.6 0.190 Massachusetts 53 41.5 6.8 270 31.9 2.8 9.7 7.4 0.190 Minnesota 113 29.2 4.3 36 27.8 7.6 1.4 8.7 0.869 North Carolina 70 42.9 6.0 220 40.5 3.3 2.4 6.8 0.724
Virginia 23 56.5 10.6 138 35.5 4.1 21.0 11.2 0.062
Overall (7 states)‡ 884 42.9 1.7 1,299 32.8 1.9 10.1* 2.5 0.000
Iowa 49 40.8 7.1 --- --- --- --- --- --- Kansas 43 30.2 7.1 --- --- --- --- --- --- Maryland 552 28.2 1.9 --- --- --- --- --- --- North Dakota 57 31.6 6.2 --- --- --- --- --- ---
Overall (4 states) 701 29.4 1.7 --- --- --- --- --- ---
SOURCE: 2010–11 Special Education Designee Survey. NOTES: ‡The overall means for always-SWD-accountable schools and never-SWD-accountable schools in 7 states are the means across schools in the sample states from which both types of schools were sampled. The overall mean for always-SWD-accountable schools in 4 states is the mean across schools in the remaining sampled states. “---” indicates that survey data were not gathered for the analysis. Differences that are statistically significant at the .05 level, two-tailed, are indicated by an asterisk (*).
188
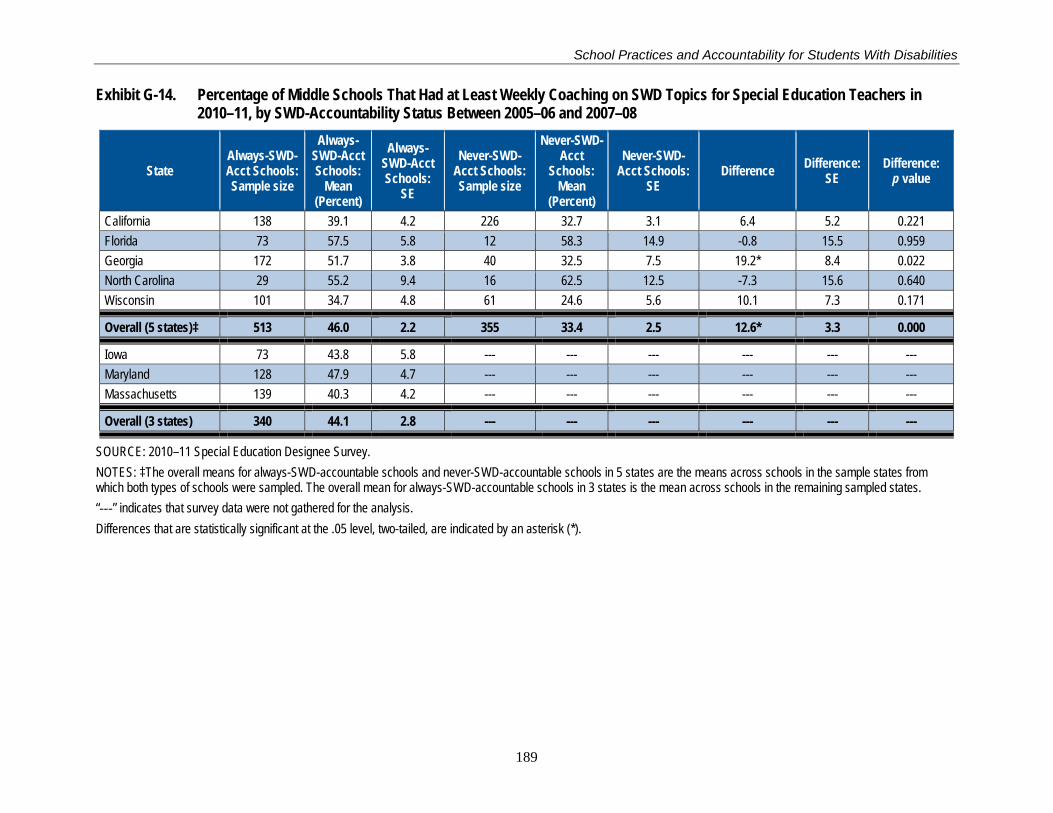
School Practices and Accountability for Students With Disabilities
Exhibit G-14. Percentage of Middle Schools That Had at Least Weekly Coaching on SWD Topics for Special Education Teachers in 2010–11, by SWD-Accountability Status Between 2005–06 and 2007–08
State Always-SWD-Acct Schools: Sample size
Always-SWD-Acct Schools:
Mean (Percent)
Always-SWD-Acct Schools:
SE
Never-SWD-Acct Schools: Sample size
Never-SWD-Acct
Schools: Mean
(Percent)
Never-SWD-Acct Schools:
SE Difference Difference:
SE Difference:
p value
California 138 39.1 4.2 226 32.7 3.1 6.4 5.2 0.221 Florida 73 57.5 5.8 12 58.3 14.9 -0.8 15.5 0.959 Georgia 172 51.7 3.8 40 32.5 7.5 19.2* 8.4 0.022 North Carolina 29 55.2 9.4 16 62.5 12.5 -7.3 15.6 0.640 Wisconsin 101 34.7 4.8 61 24.6 5.6 10.1 7.3 0.171
Overall (5 states)‡ 513 46.0 2.2 355 33.4 2.5 12.6* 3.3 0.000
Iowa 73 43.8 5.8 --- --- --- --- --- --- Maryland 128 47.9 4.7 --- --- --- --- --- --- Massachusetts 139 40.3 4.2 --- --- --- --- --- ---
Overall (3 states) 340 44.1 2.8 --- --- --- --- --- ---
SOURCE: 2010–11 Special Education Designee Survey. NOTES: ‡The overall means for always-SWD-accountable schools and never-SWD-accountable schools in 5 states are the means across schools in the sample states from which both types of schools were sampled. The overall mean for always-SWD-accountable schools in 3 states is the mean across schools in the remaining sampled states. “---” indicates that survey data were not gathered for the analysis. Differences that are statistically significant at the .05 level, two-tailed, are indicated by an asterisk (*).
189