Embed Size (px)
Citation preview

School Property Tax Relief in Wisconsin
Association for Equity in FundingMilwaukee, January 19, 2012
Andrew ReschovskyProfessor of Public Affairs and Applied
EconomicsRobert M. La Follette School of Public Affairs
University of Wisconsin-Madison

2
Outline
Analysis of the School Levy Credit and the First Dollar Credit
Assessing other kinds of property tax relief Revenue caps and levy limits Circuit Breakers—the homestead credit
Equitable school funding and effective property tax relief

3
General Aid Equalization Aid $4,722,745,900 $4,799,501,900 * $4,652,500,000 ** $4,652,500,000 $4,261,954,000 $4,293,658,000 High Poverty Aid 9,000,000 12,000,000 18,700,000 18,700,000 16,830,000 16,830,000 Low Revenue Ceiling Aid 6,200,000
Categorical Aid Special Education 350,192,500 368,939,100 368,939,100 . 368,939,100 368,939,100 . 368,939,100 High Cost Special Ed. 3,500,000 3,500,000 3,500,000 3,500,000 3,500,000 . 3,500,000 SAGE 111,984,100 111,984,100 109,184,500 109,184,500 109,184,500 109,184,500 English Language Learners 9,890,400 9,890,400 9,544,200 9,544,200 8,589,800 8,589,800 Transportation Aid 27,292,500 27,292,500 26,337,300 26,337,300 23,703,600 23,703,600 Sparsity Aid 0 3,644,600 3,517,100 14,948,100 13,453,300 13,453,300 All Other Categorica Aid 105,672,400 125,652,900 123,128,300 121,381,400 81,106,000 126,505,100
Total Categorical 608,531,900 650,903,600 644,150,500 653,834,600 608,476,300 653,875,400
Total State Aid $5,340,100,000 $5,462,405,500 $5,315,350,500 $5,325,034,600 $4,893,460,300 $4,964,363,400
Addendum: School Levy & 1st $ Credits $672,400,000 $822,400,000 $892,400,000 $897,400,000 $897,400,000 $897,400,000
*Includes $552,278,000 of federal stimulus (ARRA) funds**Includes $236,722,000 of federal stimulus (ARRA) funds
Fiscal Year 2012 Fiscal Year 2013Fiscal Year 2008
Wisconsin State School AidsFY 2008 through FY 2013
Fiscal Year 2011Fiscal Year 2009 Fiscal Year 2010

4
Percentage Change in Inflation-Adjusted Componentsof State Support for Public Education, 2008 to 2013

5
Analyzing the School Levy Credit
Credit is allocated to municipalities in proportion to their share of the statewide school property tax levy Property wealthy municipalities generally
have higher property tax levies and hence get larger credits
Within a municipality, each taxpayer’s credit is equal to her share of total municipal assessed property value Those with more valuable property tend to
have higher incomes and lower property tax burdens

6

7
Who Benefits from the School Levy Credit?
71% of residential property tax revenue is paid by Wisconsin homeowners on their principle residence
This means that only 51% of the School Levy Credit provides tax relief to WI homeowners on their principle residence
About 26% of credit goes to owners of non-residential property (many of them non-residents) and non-resident owners of vacation property in Wisconsin
Average credit ~ 16% of property tax levy
8
Less than 250,000 3 8,202 1.0% $411250,000-324,999 24 22,900 2.7% 455325,000-400,000 84 203,871 23.7% 590400,000-499,999 86 221,697 25.8% 683500,000-749,999 127 250,698 29.1% 958750,000-999,999 47 106,664 12.4% 1,3321,000,000-1,999,999 33 37,442 4.4% 1,8092,000,000 and over 21 8,903 1.0% 2,767
Total 425 860,377 100.0% $869
Number Percentage CreditNumber
School Levy Credit per Student, 2008-09by Equalized Property Value per Student
per Student
School Levy
per Student of Districts of Students of Students
Equalized Property Value

9
School District
Appleton Area 14,472 $686Beloit 7,183 368Green Bay Area 20,451 665Iowa-Grant 761 498Madison Metropolitan 25,003 1,636Menomonee Falls 4,117 1,397Mequon-Thiensville 3,647 2,054Middleton-Cross Plains 5,870 1,511Milwaukee 87,140 549River Ridge 551 571Stanley-Boyd Area 964 438Superior 4,906 597
State Average $869
Students per StudentSchool Levy Credit
School Levy Credit per Student in SelectedWisconsin School Districts, 2008-09
Number of

10
First Dollar Credit
Credit goes to all improved parcels Credit = school mill rate x credit base
(first $X of assessed value) $X determined each year by the total dollar
amount allocated to the First Dollar Credit In 2010(11) credit base = $6,900; average
credit = $67
Credit as a % of levy higher for low-value property

11

12
Tony Evers Proposal to End theSchool Levy Credit
Proposal: Use the money now allocated to the SLC for equalization aid
Analysis: As long as the revenue cap remains unchanged, any additional aid will translate into property tax relief
The taxpayers who benefit the most from the reform proposal will be different than those that benefit from the SLC, but in the end total property tax relief and total school revenues will remain unchanged

13
Criteria by Which to JudgeProperty Tax Relief Policies
Tax relief measures should not interfere with the freedom of elected local officials to determine the level of property taxation within their community
Relief measures should do nothing to limit or distort the essence of the property tax as a tax on the market value of property
Property tax relief should be targeted to taxpayers for whom the property tax causes substantial economic hardship
14
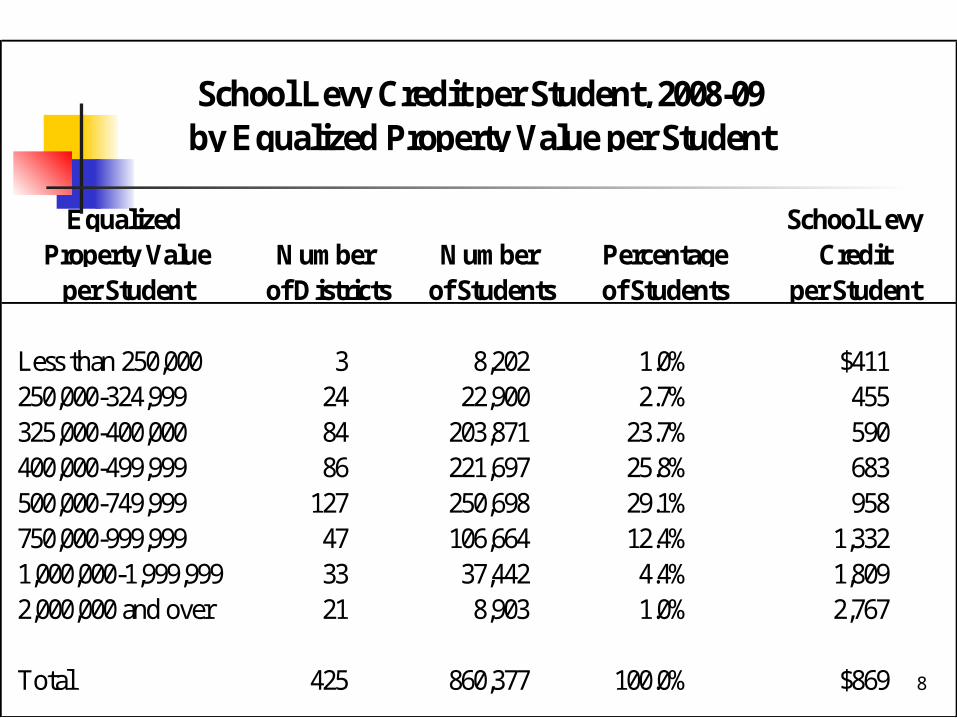
Assessing Property Tax Reliefin Wisconsin
School revenue caps and county and municipal levy limits reduce local control
They provide untargeted property tax relief by forcing reductions in mill rates
These limits take no account of variations across communities in the “costs” of providing public services
The effect is inadvertently to create tighter limits in the places facing higher costs, e.g. more low-income students to educate

15
Assessing Property Tax Reliefin Wisconsin (cont.)
Targeted property tax relief only through the Homestead Credit 2009-10, $129.2 mil. to 76,200 claimants Total credit = 1.4% of total property tax
levy Maximum credit = $1,184; maximum income
for eligibility=$24,500
DOR estimated that only 43% of eligible taxpayers received the credit

16
Gross and Net Property Tax BurdensWisconsin Homeowners, 2005

17

18
General Number of Average Reduction Number of Average IncreaseAid School Districts per Student School Districts per Student
Less than $300,000 16 18,356 2.1% -$527 -$176 13 $399 3 $338$300,000-$374,999 58 152,430 17.8% -534 -546 27 238 31 0$375,000-$450,000 86 198,732 23.2% -511 -533 22 168 64 123$450,000-$549,999 73 159,705 18.6% -501 -562 11 86 62 99$550,000-$749,999 96 195,768 22.8% -506 -460 74 108 22 161$750,000-$999,999 44 95,308 11.1% -573 -263 43 313 1 190$1,000,000-$1,999,999 30 28,395 3.3% -602 -49 30 553 0 0$2,000,000 and over 21 8,564 1.0% -639 -14 21 625 0 0
Total 424 857,258 100.0% -$524 -$465 241 $222 183 $114
*Average reductions calculated only for those school districts required to reduce property tax levies to meet revenue limits.
**Average increases calculated only for those school districts allowed to increase property tax levies.
Equalized Average Change per Student
Changes in Revenue Limits and General Aid between 2010-11 and 2011-12by Equalized Property Value per Student
Property Value RevenueNumber Number PercentageMandated Property Tax Reductions* Allowable Property Tax Increases**
Limitper Student of Districts of Students of Students

19
Number of Wisconsin School Districts That Took Following Actions This Year
Wisconsin Assoc. of School Boards Survey (Nov. 2011)
YES NOIncrease elementary class sizes? 144 207Cut/increase class sizes: AP? 51 285Foreign language? 90 264Math/English/Science/Social Studies? 126 229Art/Music/Phys. Ed.? 159 196Vocational/Tech? 155 193Increase student fees? 78 278Cut sports or extracurriculars? 40 319

20
Number of Wisconsin School Districts Expectations About Next Year’s Cuts
Wisconsin Assoc. of School Boards Survey (Nov. 2011)
Same 122Greater 116Less 47Don't know 72No answer 67
Next Year's Cuts

21

22
Federal Number of Number of
5th percentile Median 95th percentile range ratio1 districts students
United States $8,135 $11,259 $23,611 1.9 13,525 48,187,791
Kentucky 8,548 9,728 11,725 0.4 174 666,019Alabama 9,077 10,165 12,597 0.4 131 742,919Tennessee 6,949 7,932 9,873 0.4 135 966,963Maryland 13,257 14,470 18,915 0.4 24 845,700Wisconsin 10,634 12,235 15,962 0.5 426 867,929
Wyoming 14,499 20,255 41,772 1.9 48 85,991Arizona 7,263 10,209 21,256 1.9 216 987,234New Hampshire 11,128 15,849 32,745 1.9 162 195,668Alaska 12,049 25,997 53,648 3.5 53 130,624Nevada 9,426 11,037 45,484 3.8 17 428,776
Total revenues per pupil at the 5th percentile, median, and 95th percentile & federal range ratio, FY2008
Total revenues per pupilState

23
Fiscal Equalization Among K-12 School Districts, 2010-11
Success in Achieving Access Equality and Spending Equalization
Spending-Effort Ratio
Less than 250,000 3 7,542 0.9% 8,029 11,654 10.0 1,171250,000-324,999 28 25,353 3.0% 7,437 11,391 9.8 1,166325,000-400,000 80 246,228 28.7% 6,795 12,256 10.5 1,172400,000-499,999 93 178,976 20.9% 6,122 11,230 9.4 1,190500,000-749,999 125 266,892 31.1% 4,779 11,501 9.8 1,172750,000-999,999 44 95,308 11.1% 2,336 12,100 9.9 1,2261,000,000-1,999,999 30 28,395 3.3% 974 13,166 8.3 1,5822,000,000 and over 21 8,564 1.0% 131 14,854 4.7 3,132
Total 424 857,258 100.0% $5,302 $11,815 9.8 1,202
Spendingper Student
MillRate
General Aidper Student of Districts of Students of Students per Student
Property Value Number Number PercentageEqualized