Embed Size (px)
Citation preview

NBER WORKING PAPER SERIES
SCHOOL, WHAT IS IT GOOD FOR? USEFUL HUMAN CAPITAL AND THE HISTORYOF PUBLIC EDUCATION IN CENTRAL EUROPE
Tomas CvrcekMiroslav Zajicek
Working Paper 19690http://www.nber.org/papers/w19690
NATIONAL BUREAU OF ECONOMIC RESEARCH1050 Massachusetts Avenue
Cambridge, MA 02138December 2013
We thank Jeremy Atack, Howard Bodenhorn, Timothy Guinnane, Alex Klein, Naomi Lamoreaux,Peter Lindert, Melinda Miller, David Mitch, Joel Mokyr, Aldo Mussachio, Steven Nafziger, the participantsof Clemson Public Economics Workshop and of the Yale Economic History Workshop for their usefulcomments. All errors are our own. The views expressed herein are those of the authors and do notnecessarily reflect the views of the National Bureau of Economic Research.
NBER working papers are circulated for discussion and comment purposes. They have not been peer-reviewed or been subject to the review by the NBER Board of Directors that accompanies officialNBER publications.
© 2013 by Tomas Cvrcek and Miroslav Zajicek. All rights reserved. Short sections of text, not to exceedtwo paragraphs, may be quoted without explicit permission provided that full credit, including © notice,is given to the source.

School, what is it good for? Useful Human Capital and the History of Public Education inCentral EuropeTomas Cvrcek and Miroslav ZajicekNBER Working Paper No. 19690December 2013JEL No. H52,I25,N3,N43
ABSTRACT
The rise of education has featured prominently in the debate on the sources of modern long-term economicgrowth. Existing accounts stress the positive role of public education and the importance of politicalsupport for its provision. We argue that such an explanation for the spread of schooling is probablya poor fit for many nations’ schooling histories and provide an example, using detailed data on schoolingsupply from the Habsburg Empire. We show that while economic development made schooling moreaffordable and widespread, the politics of demand for schools was not motivated by expectations ofeconomic development but by the ongoing conflict between nationalities within the Empire. We findthat public schools offered practically zero return education on the margin, yet they did enjoy significantpolitical and financial support from local political elites, if they taught in the “right” language of instruction.Our results suggest that, for some countries at least, the main link, historically, went from economicdevelopment to public schooling, not the other way round.
Tomas CvrcekDepartment of EconomicsClemson University213 Sirrine HallClemson, SC 29634and [email protected]
Miroslav ZajicekKatedra institucionální ekonomieNárodohospodá�ská fakultaVysoká škola ekonomická v Prazenám. W. Churchilla 4130 67 Praha [email protected]

2
1. Introduction
Moderneconomicgrowthhasbeencorrelatedwithconcurrentincreaseinschoolingand
humancapitalaccumulation.IthasbeeninvestigatedinnumerousBarro‐stylecross‐sectional
regressionsandproposalsregardingtheprovisionofschoolingcountamongcorepolicy
recommendationsissuedtodevelopingcountriesaroundtheworld(Sala‐i‐Martin,1997).The
strongcorrelationbetweenhumancapitalandgrowthappearsnotonlyinthecross‐sectionbut
alsoacrosstime.Ithasbecomeanintegralpartoftheoreticalmodelingofindustrialization,long‐
termgrowthandtheaccompanyingdemographictransition(Galor,2011).
Thereislesscertaintyabouthowthehumancapitalisaccumulatedandwhatkindofhuman
capitalexactlymattersforgrowth.Formalschoolinghaslongbeenconsideredoneofthemost
efficientchannels(Easterlin,1981).Thislineofargument,recentlyrevisitedbyLindert(2004),
GoandLindert(2010),MariscalandSokoloff(2000)andothers,seesmoderngrowthasa
consequenceof(amongotherthings)theriseofnationalpublicsystemsofeducationwhich
themselvesweretheproductofincreasedpoliticalvoiceand,eventually,electoralsupportfor
tax‐basedschooling.Oncloserinspection,anyofthesecausallinksbecomesmorecomplicated
(Mokyr,2013).WhileBeckeretal.(2009)claimthatPrussiacaughtupwithUKonlythanksto
herschools,Mitch(1999)arguesthatBritain’sindustrializationwasorthogonaltoher
educationalsystem.Sandberg(1979)citesSwedenasacaseof“impoverishedsophisticate”
wherehumancapitalreportedlystoodentirelyoutofproportiontothecountry’slevelofincome.
Asforthelinkfrompoliticalvoicetoeducation,theimpulsefornation‐wideeducationmaycome
(andhascomeinmanyinstances)notfromsavvyvotersbutfromtherulingeliteswhose
motiveshadmoretodowithpoliticalcontrolthaneconomicdevelopment(VanHornMelton,
1988).Evendemocraticpoliticsmustcontendwithquestionsaboutwhomayormaynotenroll,
3
whopaysfortheschools,whatistobetaughtanditisfarfromobviousthattheanswerhas
alwaysbeen“more,better,broader”(Naidu,2012;Palma&Reis,2012;Troen,1975).
Weaimtointroducemorenuancetotheargumentbyinvestigatingthesedetailsofpublic
educationdecisions.OurresearchquestionslieattheheartoftheEasterlin‐Lindertstory.Using
datafromtheHabsburgEmpire,weask:howwellwasitseducationalsystemrespondingto(and
therebyaiding)economicdevelopment?Howdidtheprovisionofschoolinginfrastructure
interactwiththeEmpire’seconomicdevelopment?Howimportantwaseducationalpoliticsvis‐
à‐viseconomicfactors?Howdidindividualsrespondtothepublicschoolingprovisionandtothe
localeconomicdevelopmentinmakingtheirdecisionsaboutinvestinginhumancapital?In
contrasttotheEasterlin‐Lindertstoryofcredit‐constrainedbutnewlyenfranchisedpoor
parentswiselyvotingthemselvesmorepublicschoolprovisiontobefinancedbystingyelitesto
furthertheeconomicfortunesoftheirchildrenandtheircountry,wedescribeasystemwhere
thelocalelitefoistsapolitically‐motivatedandeconomicallyirrelevanteducationonlukewarm
masseswhilemakingthempayforitmostlyoutoftheirownpockets.1Ourhypothesisisnotnew
(Lindert,2004:100‐103)but,asfarasweareaware,oursisthefirstattempttoempiricallytest
itusinghistoricalstatisticalevidence.
2. Explainingtheriseofschooling
Afrequentpointofdeparturefortheliteratureontheprovisionofschoolingandeconomic
growthisthehighcross‐sectionalvariationamongnationstates(Easterlin,1981).Lindert
(2004:87‐88)opensbynotingthatBritain,theleaderinschoolenrollmentinearly19thcentury,
wasovertakenby1880byFranceandGermany(Prussia).Hisexplanationisthatforawidely
1Easterlin(1981:10‐11),citingtheexampleofChurch‐controlledSpanisheducationalsystem,isawareofthefactthatnotallkindsofformalschoolingareequallyuseful,yethestillseestheriseofschoolingprimarilyinthecontextofdemocratizationofopportunityandofthepoliticallife,notingthatabsolutemonarchiesareusuallysuspiciousofmasseducation’ssubversivepotential.

4
availableschoolingsystemtodevelop,threeingredientshadtocometogether:(i)local
autonomysothatlocaldecision‐makerscouldappropriatelyrespondtolocaleconomic
developments,(ii)politicalvoice,i.e.amechanismwherebybroadpublicsupportfortax‐based
schoolingcouldbeconvertedintoactualpolicy,and(iii)low‐costprovisionwhichamountedto
cheap,abundantteachingstaff.Thereasonwhyschoolingalmostalwaysendedupbeingpublicly
financedinspiteofbeingamongthemostprofitableprivateinvestmentswasthatmostofthe
populationwascredit‐constrainedandpositiveexternalitiesweretooweaktointerestmoneyed
localelitesingeneratingcriticalmassofschoolingthroughphilanthropicactivity.Theargument
wasfurtherdevelopedinGoandLindert(2007,2010)whereitwastestedonenrollmentand
schoolingdatafromUScensusesof1840and1850.Thiscounty‐levelanalysisusedinformation
onvotescastinpresidentialelectionsandpropertyrestrictionsoneligibilitytostatelegislatures
asameasureofpoliticalvoiceandshowedapositiveeffectofpoliticalvoiceonenrollmentand
onpublicspendingperpupil.StudiesinsimilarveinhaveappearedorareunderwayforBritain,
Brazil,Russia,IndiaandChina(Mitch,2012;Chaudharyetal.,2011;Musacchioetal.,2012).
Onerecurringproblemthatthesestudiesencounteristhattheyhavetoworkaroundalack
ofsuitablereliabledata.Ananalysisofschoolingprovisionwouldideallyrequiredatathatare
bothsufficientlybroadinscopetoencompassallthenecessaryeconomic,politicaland
educationalindicatorsandsufficientlydetailedgeographicallysoastocapturethelocal
variation.Asitstands,educationalstatistics(enrollments,attendancerecords,age‐schooling
profiles)areoftenunreliableorincomplete;economicstatistics,suchasGDPpercapitaorreal
wages,rarelyexistonthesub‐nationallevel;andmeasuresofpoliticalvoicearehardto
constructandinterpret.Asaresult,bothChaudharyetal.(2011)andMusacchioetal.(2012)
havetostayattheleveloffederalstatesorcorrespondingunits,whichisaconsiderablygreater
levelofaggregationthanGoandLindert’s(2010)UScounties.GoandLindert(2007,2010),on

5
theotherhand,havenoeconomicvariablesonthelocalcountylevelandgiventhatthewhole
education‐growthnexusisriddledwithendogeneityanyway,theyproposetosidesteptheissue
andestimatethedemand(andsupply)ofeducationinreducedform.
Thereisafurtherissuewithmeasuresofpoliticalvoice.Go&Lindert’s(2010)choiceofvotes
castinpresidentialelectionsmakessenseinthecontextofAmericanpoliticalinstitutionsbutfor
mostcountriessuchmeasureistoorestrictive,ifitexistsatall.ManyEuropeancountriesatthe
timeofIndustrialRevolutionhadscarcelyanydemocraticinstitutionsandthevariationin
suffrage,whereitexisted,wassmallacrosslocalities.Thisdoesnotmeanthatvariousspecial
interestsandsegmentsofpopulationhadnowaytovoicetheirconcerns;itdoesmean,however,
thattheirpoliticalvoicewasmuchlessformalizedandthusmuchhardertomeasure.
Howexactlythatpoliticalvoicewouldshapeeducationalpoliciesisalsofarfromobvious.The
citedstudiesusuallyposittheissueintheformofadichotomybetweeneliteswhowere
ambivalentabouteducatingthemassesandstronglyopposedtohavingpayforitandthegeneral
population,whichwoulddemandmoreeducationalinfrastructure,ifonlyithadmorepolitical
clout.Musacchioetal.(2012),forexample,showthatexogenouspositiveshockstovarious
statesoftheBrazilianfederationhaddifferentialimpactonlocalpublicspendingoneducation
dependingonwhetherthestate’sinstitutionsweremoreorlessdemocratic.Similarly,
Chaudharyetal.(2011)blamelowenrollmentratesinearly20thcenturyBRICsonabsenceof
masspoliticalvoiceandcorrelatetheprovisionofschoolingwiththecharacteristicsoflocal
eliteswhodidhavepoliticalvoice.Butinmanycases,amongwhichtheHabsburgEmpireisone,
theoriginalandcontinuingimpetusforthespreadofprimaryschoolingcamedecidedlyfromthe
topofthepoliticalhierarchy.PalmaandReis(2012),usingPortugalastheirexample,gosofara
toarguethatanauthoritarianstatemaybe,forvariousreasons,moreeffectiveinachieving
literacythanarepublicanregime.Inothercases,thedichotomybetweencentralizationand

6
decentralizationisfalse,asmanyeducationalsystemssettledforsomehybridarrangement.Such
wouldbethecaseinPrussia(aswellastheHabsburgEmpire)wheretheoversightovercontent
ofeducationwasrelativelycentralizedandtightlycontrolledwhiletheschoolfinancingwas
local.Undersuchcircumstances,thelocalpopulardemandformoreeducationalinfrastructure
willlikelydependonwhatkindofeducationthestatedeemsallowable.Ficker(1873)
documents,forexample,thatforthewholefirsthalfofthe19thcentury,theAustriangovernment
pushedforthespreadofprimaryschoolingbutresistedthegrowthofsecondary,particularly
technical,schooling.
Allthingsconsidered,notalldemandforeducationtakestheformofpublicorpolitical
action,nordoesapoliticalactivitynecessarilyreflectwidespreadindividualdemandamongthe
localpopulation.Ourcontributionistoattempt(i)toseparateindividualdemandformore
education,drivenpresumablybyrisingreturnstoeducation,fromthepublic/politicaldemand
formoreeducationalfacilitiesand(ii)inanalyzingthepublicdemandforeducational
infrastructure,toseparatetheinfluenceofeconomicdevelopmentfromthatofpolitical
clout/voice.
WeexploittherichdetailofschoolinginformationintheHabsburgschoolcensusof1865and
combineitwithdataonlocaleconomicdevelopment,suchasindustrialemployment,local
railroadaccessanduseofsteampower.Thedescriptivestatisticsfromtheschoolcensusfor
relevantvariablesarereportedinTable1.Notallprovincesreportedthefullslateofvariables.
Thosethatdidwecall“coreprovinces”–theyhappentobetheones,whichhavelivedunderthe
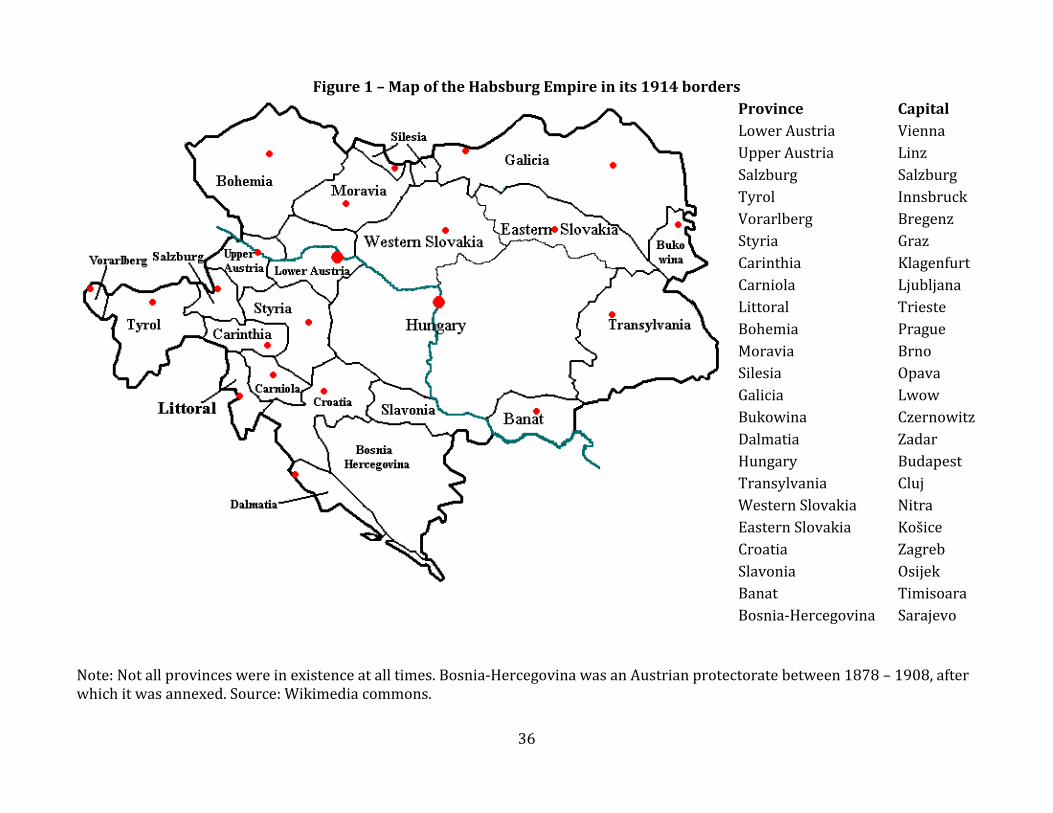
HabsburgsceptersinceatleastthelateMiddleAges(seeFigure1).2Theunitofobservationisa
2Incontrast,Galicia,BukowinaandDalmatiacameundertheHabsburgrulebetweenthePartitionofPoland(1772)andthePeaceofVienna(1815).Wethereforecallthesethe“newprovinces”.WealsohavenodataonHungaryandtherestoftheeasternhalfoftheEmpire(Transleithania).

7
schooldistrict–anaveragedistrictencompassedanareaofabout363km2andwasahometoan
averageof3.036childrenaged6‐12.3
[Figure1here]
[Table1here]
Wealsohavedataonallsecondaryschoolswithintheempire,soastoaccountforthatpart
ofthereturnstoprimaryschoolingthatconsistedinenablingastudenttocontinuewithhis(but
nother!)education.Welinkoureducationdatawithinformationonlocalethniccompositionto
capturethepoliticalaspectoftheproblem:sinceeducationcontentwascentrallydetermined
andschoolprovisionandattendancewerecompulsorybylaw,thelanguageofinstructionwas
education’smostprominentfeatureoflocalpoliticalimport.4Weusethisfactortotestthe
importanceofpoliticalvoiceinschooling.
Wemergedthisschoolingdatasetwithinformationonthestructureofemployment,
containedinthe1869census.Thisgivesusshareofworkersemployedinservices,agriculture,
severaldifferentsectorsofindustry,aswellasthosewhodidnotreportanyoccupation.5Weuse
itasourmeasureofeconomicdevelopmentandasameasureofthehumancapitaldemand
arisingfromthelocallabormarketinindividualschooldistricts.
3. EducationintheHabsburgEmpirecca1865
Fromthestart,thespreadofprimaryeducationthroughtheEmpirewasshapedby
governmentpolicy.Theschoolinglawof1774wasthefoundationalactofsystematicprimary
3Consideringthattheseagecohortsusuallyrepresentabout13‐14%ofthetotalpopulation,weinferthattheaveragedistricthadabout22–24.000inhabitants.4Otheraspects,suchascontentandteachingmethods,weredeterminedcentrally,notlocally,andlocalreligiousvariationhadceasedtobeapoliticalmatter,giventhatschoolcurriculumallowedforseparatereligiousinstructionforProtestantchildren.5The1869censusunfortunatelydoesnotdifferentiateemploymentbygender,reportingonlythetotalineachlocationandsector,sowesupplementthisinformationbyusingthe1880censusfigures.

8
schooling.Itintroducedseveralbasicfeaturesthatsurviveduntilthenextmajorreformof1869,
suchasthe6‐yearcompulsoryschoolingforbothboysandgirlsaged6to12,thestresson
religionandthetriviumineducation,thedistinctionbetweentwo‐gradecountryschoolsand3‐
or4‐gradetownschools,thecompulsorycertificationofteachersandthestrictcontrolofthe
curriculum.Anamendmentofthislaw,promulgatedin1805duringtheNapoleonicWars,
tightenedgovernmentcontrolovertheschoolingsystemand,inconsequenceoftheHabsburgs’
contemptfortheideasoftheFrenchRevolution,reinforceditsconservativethrust.Thesystem
alsobetrayedapreferencefor(thoughnotinsistenceon)instructioninGerman.6Caseswhere
“RomanianchildrenweretaughtinPolishtoreadfromaGermantextbook”(Prausek,1868:6)
openedthesystemtoaccusationsofGermanization.Therevolutionsof1848producedafew
changesinlegislation,mostnotablyanexplicitstatementinfavorofinstructioninone’smother
tongue,freedomofteachingmethods,anexpansionofprimaryschoolsfromtwogradestothree
gradesandanextensionofteachingcollegesfromoneyeartotwo.Butotherattemptsatliberal
educationweresoonquashedthroughtheConcordatof1855,whichputtheChurchyetagain
firmlyinchargeoftheschoolsupervisionandteacherappointments.Eventhelanguage
provisionswerelessthanperfectlyenforced,asweshallsee,andthefreedomofteaching
methodfellflat.7
Untilthesecularizationreformsof1868‐69,thecurriculumwassaturatedwithreligious
instruction.Pacher(2008)quotesa“recommended”schooltimetablewherecatechismand
biblicalhistorytookupsixoutofeighteenweeklylessonsforthe9‐12year‐oldsandfouroutof
6Thelocalprimaryschools,eventhosewithaSlaviclanguageofinstruction,werecalled“Germanschools”.7The1805lawrecommendedthatteacherscommittheteachermanualtomemorysoastominimizedeviationsfromitintheclassroom.Itexplicitlystatedthat“theBell‐Lancastermethod”ofpeerlearning,thenpopularinEngland,“wasbanishedfromourclass‐rooms.”Post‐1848,teacherswerenolongerboundbytheseprovisionsbut,forvariousreasons,onlyfewteacherstookuptheopportunitytoupdatetheirmethods(Ficker,1873:40).

9
nineweeklylessonsamongthe6‐8yearolds.Thelawstipulatedthataschooldayshould
preferablybeginandendwithalessonofreligion(Helfert,1860:286).Writing,readingand
countingwerenextinimportance,apportionedequallyacrosstheremainingweeklylessons,
withafewlessonssparedforsinging.
[Figure2]
Figure2offersarudimentarymeasureoftheeffectivenessoftheseschools.Itplotsthe
averageenrollmentrecordedforthegenerationborninthe1830sagainsttheliteracyratesof
thatsamecohortinthe1890census.Atfirstglance,theschoolsseemtohavebeenadequately
successfulinteachingliteracy:thescatterplotbyandlargeliesalongthe45°lineandsimple
correlationbetweenthetwovariablesis0.98formenand0.99forwomen.Buttherearealso
someworryingsigns.ConsiderthecaseofCarinthianwomen(denotedKT).While47.4%ofthem
enrolledinschoolduringtheirschool‐ageyears,only30%reportedthemselvescapableof
readingandwritinginthe1890census.Ofcourse,historicalliteracyratesaresusceptibleto
biasessuchaseducationcreep,selectivemortalityandselectivemigration.Thefirsttwoofthese,
however,biasliteracyupwards(asilliteratesdieoutfasterthanliteratesandsurvivingilliterates
reportthemselvesmoreeducatedthantheyreallyare),sointheCarinthiancase,onewouldhave
topositanenormousselectiveemigrationofliteratewomen(butnotliteratemenwhoaremuch
closertothe45°line)togeneratethemorethan17‐pointshortfallinliteracyrelativeto
enrollment.Clearly,themoreplausibleexplanationisthattheenrolledgirlsdidnotattendvery
diligently,oriftheydidattend,theydidnotlearnmuch,oreveniftheydidlearn,theylaterlost
theirliteracyskillsforlackofuse.Noneofthesehypothesesbodeswellfortheeffectivenessof
theeducationalsystem.
Schoolingwascompulsoryforchildrenaged6to12.Figure3suggeststhatatleastinsome
provincestheenrollmentwassuccessfullyenforced.Butitalsoshowsatellingcontrastwith

10
enrollmentratesreportedduringthesametimeperiodinthoseUSstateswhereschool
attendancewasnotyetcompulsory.8ThegradualarcoftheAmericanage‐enrollmentprofile
capturesvoluntarydecisions,basedpresumablyonone’sweighingtheprosandconsofeach
extrayearofeducation.Ontheotherhand,thesharpincreaseinenrollmentat6andthesharp
declineat12insomeHabsburgprovincessuggestsenrollmentconformingnotsomuchtothe
schoolingpreferencesofchildrenortheirparentsbutrathertothelaw’sdemands.Together
withtheCarinthianexampleofashortfallinliteracy,discussedearlier,thisconstitutesa
particularlydamningindictment:aschoolingsystemthatunderperformsintermsofeducation,
yetforcesthepopulationtodevotetimetoitoverandbeyonditsusefulmargin.
[Figure3here]
Apartfromcompellingpupilstoattend,thelawalsorequiredlocalcommunitiestosupplythe
resourcesforschoolprovision.Thisconsistedofconstructionandmaintenanceoftheschool
building,payingteachersalaryandprovidingteacheraccommodation.Inprinciple,wherever
100school‐agechildrenlivedwithinhalf‐hourofwalkingdistance,aschoolwastobebuiltwith
ideally80butcertainlynomorethan100pupilsperclassroom.Table1,column(ii)showsthat,
with12.04classroomsper1000school‐agechildrenonaverage,thisregulationwasupheldin
manydistrictsbutthehighstandarddeviationaroundthisaveragerevealsthatthelegal
benchmarkwasfarfromuniversal.
Whenaschoolwasbuilt,theareaaroundit,usuallycorrespondingtotheparish,was
considered“covered”(eingeschult)andtheschool‐agechildrenlivingtherewereobligedbylaw
toenrollandattendtheparticularlocalschool.9Allcoreprovincesweremorethan80%covered,
althoughthereweredistrictsintheAustrianLittoralwherecoveragesankbelow30%.Lessthan8ThedataforUSstateswerekindlysharedbyKarenClayandherco‐authorsinClayetal.(2012).9Whenavillageoranareawasnotcovered,thelocalpriestnonethelesshadtoreporttohissuperiorsonthenumberofchildreninschoolage,whichishowwecametoknowtheirnumbers.

11
fullcoverageindicatesthatsomecommunitiesdidnotmeetthestipulationsofthelaw.Ifatown
oraparishfailedtoprovideschooling,thedistrictauthoritieshadattheirdisposalsomecarrots
intheformofsubsidiesandsomesticksintheformofpowertosequesteraportionofthelocal
budgetandassignittoschooling.Theupperechelonofbothpublicandchurchadministration
expressed,however,astrongpreferenceforusingcarrotsandavoidingunnecessaryconflict
betweendistrictsupervisorsandindividualcommunities(Helfert,1860:19).Communitieswere
expectedtoenforceattendance.Withoverallenrollmentreachingonly70.2%(Table1),itis
clearthatinsomeschooldistricts–especiallyinthe“new”provinces–schoolingwas
compulsoryinnameonly.10
Asregardstheethnic/languagequestion,post‐1848officialpolicynolongerendorsed
educationinGermanexplicitlybutissuesoflanguageofinstructionandofpublicsupportfor
non‐Germanschoolsremainedasorespotpracticallytotheendofthemonarchy.Non‐German
nationalitiescontinuouslycomplainedabouttheresidualGermanizingtendenciesofthe
educationalsystem,whichwas,afterall,runbyanoverwhelminglyGermancivilandchurch
administrationsanddesignedbyGermanpolicymakers.Our1865datasetincludes22school
districtswithzeroGermanstudentswhichnonethelesshadatleastoneGermanorbilingual
school.ThebroadoutlinesofthesituationaresummarizedinTable2,whichalsoreportssimple
t‐testsformeandifferences.TheGerman‐majoritydistrictsdidhavealmosteverythingbetter
andbyasignificantmargin:moreclassroomsandteachersper1000school‐agechildren,more
publicspendingperchildandbettercoveragebyschoolinfrastructure.Onlythecurriculum
extent,measuredbytheaveragenumberofgradesperschool,wascomparablebetweenGerman
andnon‐Germandistricts.TheGermandistrictsfellbehind,however,inprovisionofeducationin10Austrianstatisticsmakenoconceptualdistinctionbetweenenrollmentandattendance.ThefiguresreportedinTable1comefromstatisticslabeled“Schulbesuch”(schoolattendance)intheoriginaldocument.Butfromthecontextoftheoperationoftheschools,itisclearthattheywereenrollmentnumbers.

12
minoritylanguages,i.e.inbuildingschoolsforthelocalSlavminorities,whileGermanminorities
innon‐Germandistrictshadalmostcertainaccesstoinstructionintheirmothertongue.11The
betterschoolprovisioninGermandistrictscouldbearesultoftheirhigherlevelofeconomic
developmentbuttheeconomicvariablesatthebottomofTable2castsomedoubtonthat:some
arebetterinGermandistricts,someinnon‐Germanones,someshownosignificantdifference.
[Table2here]
TheGermanelementundoubtedlyhadthestrongestpoliticalvoiceamongallthe
nationalities,althoughintheHabsburgcontextitwouldbecounterproductivetotrytomeasure
itusingelectoralstatistics.12Table2suggeststhattheGermanpoliticalvoice,howeverinformal
andunobservabledirectly,mayhavehadmeasureableimpactonthedisbursementofpublic
fundsinmattersofschoolingandespeciallyminorityGermanschooling.Recallthatthedistrict
authorities–thepoliticalelitesinourcase–werenotinastrongpositiontopreventaschool
frombeingbuiltbyadeterminedcommunity,buttheycouldmakeitsignificantlyeasierand
cheaperbyprovidingasubsidytoawithin‐districtminoritywhomaynothavebeenbigenough
tosupportaschoolonitsown.
Animportantpartofourempiricalanalysisistoseewhethertheseplaindifferencesinmean
alongethniclinessurvivewhenwecontrolforotherlocalfactors.Themainlessonfromourbrief
outlineoftheAustrianeducationalsystemisthat–unlikeintheEasterlin‐Lindertstory,where
politicalvoiceisanallyofeconomicdevelopment–inourcasethetwoforcesare,ifnotset
againsteachother,thencertainlynotpushinginthesamedirection.Ifthepro‐German
advantagesdonotsurvivecontrollingforeconomicvariables,thenapparentlypoliticalvoice11Notethattheseparticularmeasuresarecalculatedfromasubsampleofdistrictswithmorethan100minoritystudents,i.e.thosewhereaminorityschoolmaybereasonablyjustified.12Asof1865,theEmpirehadhadexperiencewithmeretwonation‐wideelections(1848and1861),thesuffragewashighlyconstrainedandtoocomplicatedtointerpreteasily,fallingintofourdifferentelectoralcollegesofunequalimportance;andinanycase,itencompassedonlyatinyfractionofthepublic.

13
matteredlessthandevelopment.If,ontheotherhand,economicvariablesturnoutnottomatter
inthepresenceoftheethnicvariables,thenitsuggeststhattheschoolwasnotsomuchan
engineofgrowthasaculturalbattlefield.
4. Estimation
Weseparateourempiricalanalysisintothreeparts.First,ontheindividuallevel,economic
developmentmaypotentiallyaffectone’sdemandindependentlyoftheprovisionofschooling.
Thatis,whetherparentschoosetoenrolltheirchildinaschool,givensomeexistingsupply,
dependsontheexpectedreturnstoeducation.Second,onthedistrictlevel,theprovisionof
schoolingmayrespondtoeconomicdevelopmentthroughtwochannels:byincreasingthetax
basewhichwillmakepublicfinancingoflocalschoolseasierandpresumablythroughgreater
demandforsuchprovision.Finally,toassesstheimportanceofpoliticalvoicerelativetothe
economy,welookfordifferencesinthetreatmentofGermanminoritiesinnon‐Germandistricts
andnon‐GermanminoritiesinGermandistrictsalongtheethnicboundarieswithintheEmpire.
4.1. Individualdemandforeducation
Weinvestigatehowenrollmentinadistrictrespondedtoeconomicchanges,conditionalon
theexistingsupplyofschools.Ideally,onewouldliketoknowtheexpectedreturnstoprimary
educationforindividualchildrenandseehowthesevariedwithdevelopment.Wedonothave
suchdetailedinformationandsoweexploitthedifferenceinpost‐primaryschoolcareersopen
toboysandtogirls.Foreachdistrict,weconstructadependentvariablethatmeasures
enrollmentofboysandgirlsseparately.Sincethisvariationtookplacewithindistricts,weare
abletoincludedistrict‐levelfixedeffectsthatwillcapturedistrict‐specificlevelsoflaw
enforcement,supervisionandothercharacteristicsoftheschoolsupply.Sinceboysandgirlsface
thesameschoolsupplyandprimaryschoolingwasoverwhelminglycoeducationalintermsof

14
extentandcontent,anydifferencesbetweenboys’andgirls’enrollmentwillbeduetodifferences
intheirexpectedreturnstoeducation:thepost‐primary‐schoolprospects.13
Girlsdidnotcontinuewiththeireducationbeyondprimaryschool;secondaryschoolswere
forboysonly.Weusethesumofallsecondaryschools’enteringclassslotswithin50kmofa
districttomeasuretheprospectsofsecondaryeducationforboys;forgirls,thisvalueissetto
zero.Girlsandboysalsobenefiteddifferentiallyfromeconomicmodernizationintheir
employmentprospectsaftergraduation.Whileindustrializationgeneratednewemployment
opportunitiesformenandwomenalike,somesectorsweremorefeminizedthanothers.We
measuretheimpactofeconomicdevelopmentonprivatedemandforeducationbyconstructing
whatwecallliteracycontentoflocallabormarket:fromthe1869populationcensus,wetake
sectoralsharesofemploymentwithin50kmofeachschooldistrict,estimateproportionsof
womenineachsectorandevaluateeachoccupationintermsofitsliteracyusage,usingMitch’s
(1992:213‐4)classificationformid‐19thcenturyjobs.14Theresultisanindexbetween0and1
where1meansthatalllocaljobsrequiredliteracyand0meansthatliteracywasnotinanyway
usefulinthelocallabormarket.Figure4displaysthevaluesformenandwomenineachdistrict.
[Figure4here]
Schoolattendancewascompulsorybylawandeventhoughitsenforcementwasfarfrom
perfect,theactualobservedenrollmentswerepresumablyatleastpartiallyaffectedbythe
existingthreatsoffinesandotherpenalties.However,inallthedistrictsinourdataset,actual
enrollmentsincludedchildrenwhowerenotunderlegalcompulsion.First,therewerechildren
wholivedinvillagescurrentlynotcoveredbyschoolprovision(nichteingeschulteOrtschaften)
anditisclearfromthedatathatinmanyplacesthesedidactuallyenrollinwhicheverschoolwas
13Wealsoincludeaboysfixedeffecttocapturepotentialother,non‐economic,genderbiases.14SeeAppendix1formoredetailontheconstructionofthisvariable.

15
closest.15Second,whilecompulsoryeducationextendedtoage12,allbutthreedistrictsreport
positiveenrollmentamongchildrenover12.Forthesetwogroups,theenrollmentwas
voluntary,soastoavoidtheproblemofacensoreddependentvariable.Wethereforeuse,asour
dependentvariableYis,enrollmentpercoveredschool‐agechild.Thepresenceofthetwogroups
ofvoluntaryenrolleesexplainswhyinmanydistrictsthismeasurewouldexceed1.
Ourspecificationis:
Eq.(1) Yis 1 2ECis 3LCis 41(Boys)is iDi i
whereECisstandsforsecondaryschoolenteringclasseswithin50kmoftheschooldistrict,LCisis
theliteracycontentoflocallabormarket,1(Boys)isisagenderfixedeffectandDiisavectorof
schooldistrictfixedeffects.Subscriptiindexesschooldistricts,subscriptsgenders.
[Table3here]
Table3presentstheresultsoftheleast‐squaresestimation.Forcomparison,wealsopresent
amodelwithnofixedeffectsincolumn(i)andwithdiocese(butnotdistrict)fixedeffectsin
column(ii).Ourbaselinespecificationisincolumn(iii).Overall,thecoefficientsonliteracy
contentdonotindicateaverylargeimpactonenrollment.Usingthestandarddeviationfrom
Table1,increasingliteracycontentby0.04willincreaseenrollmentby2.5percentagepoint.
Eventhesecondaryschoolprospectshaveaweakimpact.16Toseehowrobusttheseresultsare,
were‐estimatedthesamespecificationonvarioussubsamples,aspresentedincolumns(iv)–
(vii).Perhapsthebiggestworry,givenourdefinitionofthedependentvariable,wouldbethat15Coverage(Einschulung)meantthateachchildwasassignedtoaparticularschool.Teacherswererequiredtoturnawaypupilswhowereassignedtoadifferentschoolbutthelawwassilentonchildrenwhowerenotassignedtoanyschool.16Interestingly,giventhattheschoolinglawwasambiguousenoughtoallowforacertainageoverlapbetweenprimaryandsecondaryschools,thenegativesignofthiscoefficientsuggeststhatanincreaseinavailablesecondaryschoolslotsproducednomorethanarelocationofsomepupilsfromprimaryschoolstoasecondaryschool.Thiscorrespondsalsowiththesizeofthecoefficient–onestandarddeviationincreaseinsecondaryschoolspotsdecreasesenrollmentratebyabout1percentagepoint–i.e.verylittle;andsecondaryschoolenrollmentusuallyhoveredaround1‐2percentofanagecohort(seeFigure3).

16
districtswithalreadyfullcoveragewouldinevitablyshowconsiderablylessvariationin
enrollmentbecausevoluntaryenrollmentcanonlyhappentherealongtheagemargin,butnot
thecoveragemargin.ThelasttwocolumnsofTable3givesomecredencetothis.Thedifference
intheliteracycontentcoefficientsisafactorofthreeandahalf.Still,eventhelargecoefficientin
column(vii)wouldimplyanincreaseinenrollmentof4.2percentagepointsasaresultofextra
0.04increaseinliteracycontentinthelocallabormarket.Inshort,theeffectsinanyofthe
subsamplesareeffectivelyzero,andafairlypreciselyestimatedzeroatthat.Ifonaverage95.2
outofevery100coveredschoolagechildrenwenttoschool,itwasnotthelureoflabormarket
payofftoliteracythatwasdoingtheheavylifting.
4.2. Determinantsofschoolsupply
Theindividualdemandforeducationthereforedoesnotseemtohaverespondedvery
stronglytoeconomicdevelopment.Eithertheeducationofferedinschoolwasnotastrong
complementtomodernindustry,orschools–andtheenforcementthatwentwiththem–were
built“aheadofdemand”,therebyplacingamoreorlessbindingconstraintonwhoenrolled.
Sincewedonothaveanydirectmeasureofthestrengthofenforcement,whichwouldbe
capturedbythedistrictfixedeffectsanyway,andweknowthatanestablishedteacherina
schoolwasthe“firstinstance”ofenforcementofcompulsoryattendance,thisquestionultimately
speakstothedeterminantsofthesupplyofschools:werethedevelopedcommunitiesbuilding
moreschoolsbecausetheyprovedusefultoeconomicdevelopmentinawaynotcapturedby
Table3?Orwastheindustrializationmerelymakingcompliancewiththeschoolinglaweasier?
Wechoosethreeschoolcharacteristicstocapturetheextentandqualityofschoolprovision.
Thesearealldefinedonthelevelofaschooldistrict.Ourmainmeasureofcurriculumqualityis
17
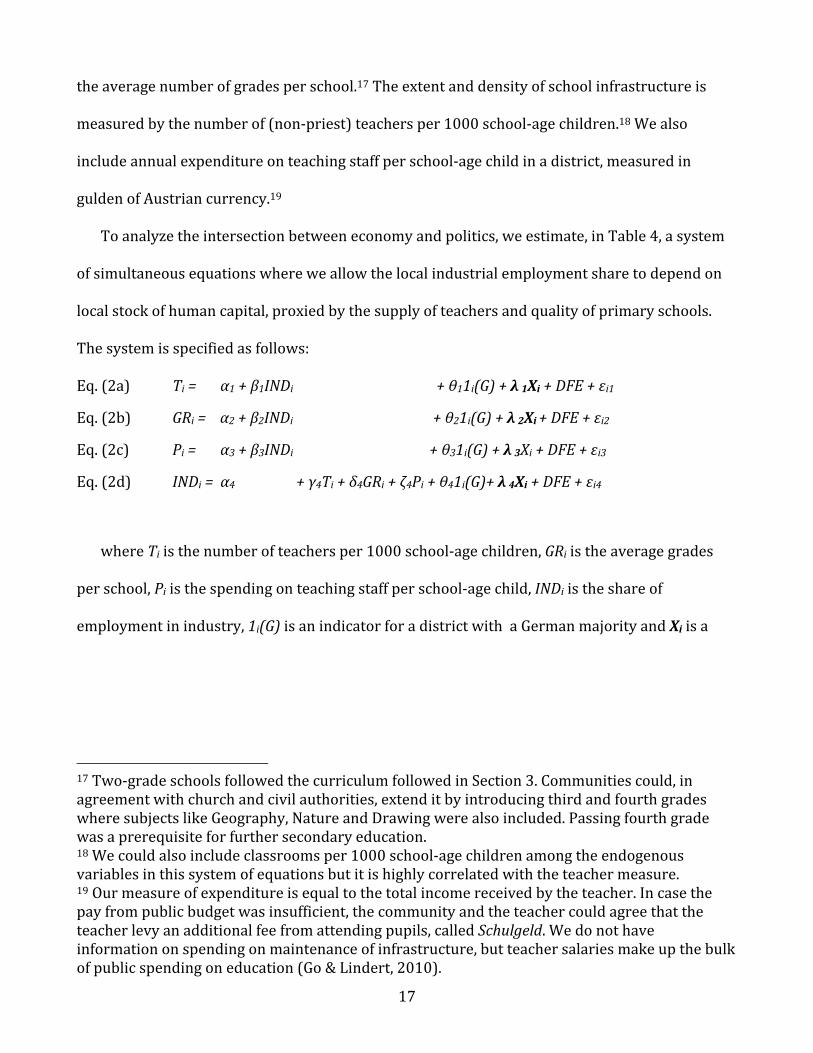
theaveragenumberofgradesperschool.17Theextentanddensityofschoolinfrastructureis
measuredbythenumberof(non‐priest)teachersper1000school‐agechildren.18Wealso
includeannualexpenditureonteachingstaffperschool‐agechildinadistrict,measuredin
guldenofAustriancurrency.19
Toanalyzetheintersectionbetweeneconomyandpolitics,weestimate,inTable4,asystem
ofsimultaneousequationswhereweallowthelocalindustrialemploymentsharetodependon
localstockofhumancapital,proxiedbythesupplyofteachersandqualityofprimaryschools.
Thesystemisspecifiedasfollows:
Eq.(2a) Ti= α1+β1INDi +θ11i(G)+λ1Xi+DFE+εi1
Eq.(2b) GRi=α2+β2INDi +θ21i(G)+λ2Xi+DFE+εi2
Eq.(2c) Pi= α3+β3INDi +θ31i(G)+λ3Xi+DFE+εi3
Eq.(2d) INDi=α4 +γ4Ti+δ4GRi+ζ4Pi+θ41i(G)+λ4Xi+DFE+εi4
whereTiisthenumberofteachersper1000school‐agechildren,GRiistheaveragegrades
perschool,Piisthespendingonteachingstaffperschool‐agechild,INDiistheshareof
employmentinindustry,1i(G)isanindicatorforadistrictwithaGermanmajorityandXiisa
17Two‐gradeschoolsfollowedthecurriculumfollowedinSection3.Communitiescould,inagreementwithchurchandcivilauthorities,extenditbyintroducingthirdandfourthgradeswheresubjectslikeGeography,NatureandDrawingwerealsoincluded.Passingfourthgradewasaprerequisiteforfurthersecondaryeducation.18Wecouldalsoincludeclassroomsper1000school‐agechildrenamongtheendogenousvariablesinthissystemofequationsbutitishighlycorrelatedwiththeteachermeasure.19Ourmeasureofexpenditureisequaltothetotalincomereceivedbytheteacher.Incasethepayfrompublicbudgetwasinsufficient,thecommunityandtheteachercouldagreethattheteacherlevyanadditionalfeefromattendingpupils,calledSchulgeld.Wedonothaveinformationonspendingonmaintenanceofinfrastructure,butteachersalariesmakeupthebulkofpublicspendingoneducation(Go&Lindert,2010).

18
vectorofexogenousvariableswhichensurethattheorderconditionsofidentificationbe
satisfied.20DFEstandfordiocesefixedeffects.
TheresultsarepresentedinTable4andtheysuggestalinkfromindustrialdevelopmentto
schoolsupplybutnotnecessarilytheotherwayround.Shareofindustrialemployment
positivelyimpactswithallthreemeasuresofschoolprovision;inequations2band2c,the
impactissizeable.Onestandard‐deviationincreaseinindustrialshare(13.9percentagepoints–
or0.139)wouldadd0.4grades21ineachschoolinthedistrictandincreasethespendingon
teachingstaffby0.68guldenperschool‐agechild.Ontheotherhand,thecoefficientsonthe
schoolvariablesincolumn2dareallimpreciselyestimatedanddonotevenoperateinthesame
direction.Thepositiveeffectsofgradesperschoolandspendingonteachersareinfactmore
thanoutweighedbythenegativeimpactofteachersupply,whenallthreemeasuresare
increasedbyonestandarddeviation.Theseconclusionsarereinforced,when,inPanelB,were‐
estimatethesystemwithoutVienna,aclearoutlieralongmostdimensions(seeTable1,column
(iv)).
[Table4here]
ThecoefficientsontheGermandummyvariablesuggestthateconomicfactorsareunableto
accountfullyfordifferencesinschoolprovisionbetweennationalitiesbuttheresultsare
somewhatambiguous.Germandistrictsseemtoenjoysignificantlyhigherteachersupplyper
20ThevectorXimustincludeenoughexogenousshiftersforthesystemtobeidentified.Theseare:ameasureofpopulationdispersioninEq.(2a),numberofspotsinlocalsecondaryschoolsinEq.(2b),distancetoprovincialcapitalinEq.(2c)andtotalpopulationlivinginurbancenterswithmorethan5000inhabitantsinEq.(2d).Thesearedeterminedexogenously(outsidethemodel)buthaveadirectbearingonthedependentvariables.Forexample,populationdispersionwillincreasethedemandforteachersbecausedistrictswithmanysmallvillageswillhavetobuildmoresmallerschoolscomparedtoamoreconcentrateddistrict,eveniftheybothhavecomparablepopulationsofschool‐agechildren.21Giventhatgradesareindivisible,perhapsabetterwayofexpressingtheresultisthatallschoolsinadistrictwouldberaisedfromtwo‐gradeschoolstothree‐gradeschools–abigchange–,ifindustrialshareincreasedby35percentagepoints.

19
childthannon‐Germandistrictbuttheyalsoseemtohaveaslightlylowerqualityofschools
(coefficientincolumn2dis‐0.22,statisticallysignificantbutsmall),withnodifferencein
spendingonteachers(column2c).ButGermandistrictshappentobemoreindustrial(after
controllingforotherfactors),soonthebasisofTable4aloneonecouldarguethatthe
advantagesofGermandistricts,reportedinTable2asunconditionalmeans,werereallyaresult
ofdifferenteconomicconditions,whichcorrelatewithGermanpopulation.
Overall,theevidenceinTable4indicatesastronginteractionbetweenthelocaleconomyand
thelocalschoolsupply.Theextentofindustrialdevelopmentispositivelyandnon‐trivially
correlatedwithinvestmentinschoolqualityaswellasschoolquantity.Thedifferencesbetween
schoolsinGermanandnon‐Germandistrictsdonotquitegoawayaftercontrollingforthe
economicenvironment,althoughtheyarediminishedalongsomedimensions.
4.3. Treatmentofethnicminorities:aspatialdiscontinuityregression
Toisolatetheimpactof(thepro‐German)politicalvoiceoftheelitesvsthatofthelocal
massesascleanlyaspossible,wegobelowthelevelofschooldistrictsandcomparethe
treatmentofGermanminoritiesinnon‐Germandistrictsagainstthetreatmentofnon‐German
minoritiesinGermandistricts.Asmentionedbefore,districtorhigherauthoritieshadscarcely
anyofficialmeanstopreventaschoolfrombeingestablished;infact,theywereexpectedto
enforcealaw,whichrequiredfullschoolcoverageandfullattendance.Theycould,however,be
moreorlesscooperativeinprovidingasubsidytosmallcommunitieswhoexpressedadesireto
buildaschoolbutclaimedtolacksufficientmeanstosustainit.Suchcouldreasonablybethe
caseoflocalethnicminorities.Ifpoliticalvoicematteredinthisway,thenwewouldexpect–

20
sincepublicadministrationwasoverwhelminglyGerman22–thatGermanminoritieswouldbe
moresuccessfulinsecuringsuchaidthannon‐Germanones.
Toexplorethisidea,weexploitthefactthatthe1865schoolcensusreportedthelanguageof
instructionforeachschoolineachdistrict,togetherwiththenumberofstudentsofeachmother
tongue.Evenwhensomeminoritiesweretoosmalltohavetheirownschools,therecordnotedif
alocalschoolwasbilingual,providingatleastaparallelclassintheminoritylanguage.To
controlforasmuchvariationinothercharacteristicsofthesedistricts,welookforGermanand
non‐Germandistrictsstraddlinglong‐standingethnicboundarieswithintheEmpire.Weare
confidentthattheseareexogenoustoschoolingprovision,astheywerearesultofmediaeval
settlementpatterns,andintheopinionof19thcenturydemographerstheyscarcelymoved
(Rauchberg,1905;Ficker,1864;Czoernig,1855).Theboundarieswerealsoquitesharp,somuch
sothattherewerepairsofdistricts,nomorethan15milesapart,oneithersideofanethnic
boundarythatreportednominoritystudentsatall.However,wewereabletolocate34pairsof
Germanandnon‐Germandistrictssuchthattheybothcontainedalinguisticminoritythateither
hadaschooloperatinginitsownlanguageorwasbigenoughthatitshouldhavehadone(i.e.it
numberedover100studentsofagivenmothertongue).Ofthese34matches,27areGerman‐
CzechinBohemia,MoraviaandSilesia,5areGerman‐SloveneinStyria,CarinthiaandCarniola
and2areGerman‐ItalianinSouthTyrol.
The34matchesconsistof68districts,eachappearinginexactlyonematch,andeachdistrict
contributestwoobservations:oneforthelocalmajorityschoolsandoneforlocalminority
schools.23
22Until1880,GermanwasthesolelanguageofadministrationbothinternallyandexternallyandclerksofGermanmothertonguedisproportionatelyoutnumberedothernationalities(Jaszi,1929:273‐279)23Schoolsthatofferedbothlocallanguagesofinstructionarecountedasminorityschools.

21
Eq.(4) Yi 11i(G) 21i(Min) 31i(GMin) 4INDi 51i(U) jDji ij
OurregressionspecificationincludesdummyvariablesforaGermanmajoritydistrict,1i(G),for
minoritystatus,1i(Min),foraGermanminorityschool,1i(GMin),aswellas34matchfixedeffects,
Dj.Thevariable1i(U)isadummyforurbanschooldistricts.Sincethedistrictsareimmediate
neighbors(averagedistancebetweentheiradministrativecentersbeing11miles),anylocal
specificsarelikelytooperateinbothmatcheddistrictsandwillbecapturedbythematchfixed
effect.Wealsoincludethelocalshareofindustrialemployment,INDi,tocontrolforwithin‐match
variationineconomicdevelopment.Giventhisset‐upthereareseveralwaysinwhichthe
importanceofpoliticalvoicecanplayout:(i)ifβ2=β3=0,thenwefindnoconclusiveevidenceof
minoritiesofeitherkindreceivinganysystematicallydifferenttreatment,soitwillbedifficultto
arguethatdistrictauthoritieswereplayingfavorites;(ii)ifβ2≠β3=0,thenminoritiesofany
kindaretreateddifferentlyandtheadvantageofpoliticalvoicerestswithdistrictmajorities
ratherthanwithGermans;(iii)ifβ3≠0,thentheGermanminorityisclearlygettingadifferent
treatment(forbetterorworse)andsopoliticalvoicematters.
Thesimultaneousequationsframeworkemployedinprevioussectionrestedontheunstated
assumptionthateconomicdevelopment,measuredbyINDi,couldbeendogenoustotheschool
supply.Thestockofschoolinginfrastructure,availablein1865,islikelyhighlycorrelatedwith
paststockofschoolinginfrastructure(sinceschoolbuildings,teachingstaffandevenpublic
budgetitemshavecertaininertia),whichinturnaffectslocalliteracylevelsand,byextension,
economicdevelopment.Consistencyalonerequiresthatthepotentialendogeneityweassumed
inEqs.2a‐2dbeaccountedforinthespatialdiscontinuityregressionalso,whichiswhywe
instrumentforINDi.Relyingonanoldempiricalregularity,observedalreadybyAustrian
contemporaries,thateconomicdevelopmentfollowsaWest‐Eastgradient,weinstrumentINDi
withlongitude(Good,1984:11).

22
TheresultsarepresentedinTable5.Theinstrument,thoughnotperfect,seemstoperform
reasonablywell:thefirst‐stageF‐statisticisequalto13.4.With34fixedeffectsand8other
variablesinaregressioncounting136observations,statisticalsignificanceisinevitablygoingto
suffer.Yetinspiteofthat,someclearpatternsemerge.Acrossthedifferentspecifications,wesee
β1eitherpositiveorastatisticalzero,indicatingthatGerman‐majoritydistrictshadatleastsome
advantage,alreadyseeninTables2and4.Butitwentdeeperthanthat:β2<0andisstatistically
significantinallfourregressions,whileβ3>0inallandsignificantinthreeofthem.Thebottom
ofTable5showsaseriesoft‐testsforβ2+β3=0,toseewhethertheGermanminoritieshad
enoughclouttooutweightheotherwisenegativeeffectofminoritystatus.Asitturnedout,β2+
β3>0unambiguouslyinthreespecifications,i.e.theGermanminoritieswereactuallydoing
betterintermsofthesupplyofteachers,classroomsandpublicfundsperschool‐agechildthan
thelocalmajorities(insomeaspects,theywereevenslightlybetteroffthanGermanschoolsin
Germandistricts,β2+β3>β1).Overall,theseresultsadduptoafairlyconsistentevidenceof
significantadvantagefortheGermans–itmeansthatwhenitcametoastand‐offbetweenthe
GermanelitesandlocalSlavmajorities,theeliteswereabletoimpresstheirpreferencesonthe
ethnicmixoflocalschooling.
[Table5here]
Withinthenarrowconfinesofmatcheddistrictpairs,theimpactofeconomicdevelopmentis
onlyimpreciselyestimatedbecausethereisusuallyrelativelylittlevariationinindustrial
employment(incontrasttothesharpethnicboundarywhichdistrictpairsstraddle).The
coefficientsaremostlypositive(withtheexceptionofcolumn(iv))butnotpractically
meaningful.Perhapsonlyforgradesperschool(column(i))andspendingperschool‐agechild
(column(ii))canitbesaidtohaveanoteworthyimpact:anincreaseinINDibythestandard

23
deviationof0.143inthesubsamplewouldadd0.21florinstoper‐childspendingandadd0.25
gradestoeveryschoolinadistrict.
5. Conclusions
TheevidencerevealstwoimportantfeaturesoftheHabsburgeducationalsystem.First,we
findstrongersupportfortheclaimthateconomicdevelopmentenabledamoreextensivesupply
ofeducationalfacilities,perhapsthroughbroadeningofthetaxbase,thanforthenotionthat
economicdevelopmentgeneratedastrongindividualdemandforpubliceducation,suchas
throughraisingreturnstoprimaryeducation.NotthattheHabsburgschoolsfailedinimparting
literacyacrosstheboard–thecorrelationsinFigure2aretoostrongforsuchaclaim.Butthe
curriculumalsoincludedalotofextramaterialthatdidnotgenerateusefulhumancapital.
Apparently,theViennesegovernmentdesignedaflawedproduct,decreedthatitbeoversupplied
andburdenedlocalcommunitieswithpayingforit.Wehavenoestimateofhowmuch
deadweightlossthispolicygeneratedbutwecannotfindanypositiveeffectofthispolicyon
economicdevelopment.
Second–andcloselyrelated,thereasonwhyeconomicconsiderationsweresidelinedistobe
foundinthepoliticsofschooling.Politicalvoiceseemstohaveplayedarole.Accountsof
Austrianpoliticalhistoryshowunequivocallythateducation,itsextent,availabilityandlanguage
ofinstructionwerehighlypoliticizedmatters.Wefindevidencethatthisnationalistpolitics
impactededucationalchoicesmadeontheground,evenatthelocallevel.
Overall,thisaddsuptoadifferentpicturetothatpaintedregardingthemodernriseofpublic
education.Whilealltheelementsoftheusualstory–theindustrialization,thepublicprovisionof
schools,thepoliticalvoiceofimportantpressuregroups–arepresentintheAustriancase,they
combineinawayverydifferentfromhow,forexample,GoandLindert(2007,2010)have
describedtheriseofAmericanpublicschooling.Ratherthaneducationandhumancapital

24
accumulationbeingamongthedriversofeconomicgrowth,weseehoweconomicdevelopment
providestheresourcesfortheHabsburgEmpire’sownversionof“culturewars”wherebythe
schooldistrictelites–farfromwithholdingpublicresourcesfromeducation–activelysubsidize
thatkindofschoolingwhichcorrespondstotheirethnicpreferences.Forthosewholacked
politicalvoice–inourcase,thenon‐Germannationalities–theroadaheaddidnotpassfirst
throughenfranchisementtopubliceducationandeventuallytoeconomicdevelopmentbut
exactlytheotherway:economicgrowthallowedthemtocatchup(atleastinsomerespects)in
matterseducationalwhich–agenerationlater(andoutsidethescopeofourpaper)–ledtotheir
politicalself‐assertion.Andwhilethisorderofcausationdoesnotinanywayrefutethemore
traditionalaccount,atleastasitappliestotheUnitedStates,forexample,ithighlightsthatthe
interplayofeducation,politicsanddevelopmentcanbemuchmorevaried.

25
Appendix1–Measuringliteracycontentoflocallabormarket
Thevariable“Literacycontentoflocallabormarket”,usedinTable3,isacombinationof
threepiecesofinformation.Thefirstpieceisthestructureofemploymentoflocallabormarket.
Wedrawonthedatapublishedinthe1869Cisleithaniancensus(K.k.StatistischeZentral‐
Commission,1871).Itcontainsemploymenttotalsforeachof813Gerichts‐bezirks,thesmallest
administrativeunitstheninexistence,splitinto50occupations(seeTableA1belowfordetail).
Separatecategoriesformenwithoutanoccupation,womenwithoutanoccupationandchildren
undertheageof14werealsoincludedsoastofullyaccountforthewholepopulationineach
Gerichts‐bezirk.
Unfortunately,theoccupationsinthe1869censuswerenotdisaggregatedbygender.
Therefore,thesecondpieceofinformationcomesfromthe1880census,whichprovidedgender‐
specificemploymentfiguresforbroadlysimilaroccupationalcategories.24Thesewereavailable
foreachprovinceandtheyvariedfromzeroshareofwomen(amongarmyofficers)tozeroshare
ofmen(amongnunsandmidwives).
ThethirdandfinalpieceofinformationcamefromMitch(1992:213‐214).Itisa
classificationofoccupationsbyuseofliteracyformid‐19thcenturyEngland.Wemakethe
assumptionthattheclassificationisapplicabletotheHabsburgEmpirewithoutmajorchanges,
especiallysincemostoftheassignmentsareprobablyquiteuncontroversial.Onepotentially
significantdeviationfromMitch(1992)consistsinreassigningfarmersfromthelikelycategory
totheambiguouscategorybutitisachangethatdoesnotaffecttheresultsinTable3andonly
leadstoanincreaseintheliteracycontentmeasureacrosstheboard.
24Severalgendercompositionsforsomeindustrialsectorshadtobesuppliedfromthe1890census.

26
Thesethreefactorsarecombinedtoproducetheliteracycontentvariable.Foreach
schooldistrict,wetaketheemploymentdatainGerichts‐bezirksthatarewithin50kmofthe
schooldistrict,calculatethesharesofemploymentseparatelyformenandwomenandweigh
thembytheassignedliteracyweightL(notedinTableA1).
TableA1–AssignmentofoccupationstovariousliteracycategoriesLiteracyrequired(L=1)Priestsandnuns,publicsectorclerks,armyofficers,teachers,students,writers,artists,lawyers,doctors,surgeons,midwives,pharmacists,sanitationworkers,clerksintheprivatesector*,entrepreneursandbusinessowners*,employeesinfinanceLiteracylikelytobeuseful(L=0.7)Employeesinthetradingsector,rentiersandrentersofrealpropertyOccupationswithpossible(orambiguous)useofliteracy(L=0.3)Farmers,sharecroppers,laborers*,domesticserviceOccupationsunlikelytouseliteracy(L=0)Agriculturallaborersandfarmservants,fishermen,industriallaborers*,thosewithoutoccupationNote:TheassignmentsarebasedonMitch(1992:213‐214).The*denotesthoseoccupationswhichintheoriginaldocumentarefurtherdisaggregatedintovarioussectors(e.g.8separateindustrialsectors).

27
References
BeckerSasha,HornungEricandWoessman,Ludger.“Catchmeifyoucan:EducationandCatch‐upinIndustrialRevolution”,CESifowp#2816,October2009
ChaudharyL.,MusacchioA.,NafzigerS.andYanSe.“BigBRICs,WeakFoundations:ThebeginningofPublicElementaryEducationinBrazil,Russia,IndiaandChina”,NBERwp#17852,February2012
ClayKaren,LingwallJeffandStephens,Melvin.“Doschoolinglawsmatter?EvidencefromtheintroductionofcompulsoryattendancelawsintheUnitedStates,”NBERwp#18477,2012
Czoernig,Karlvon.EthnographiederOesterreichischenMonarchie.Kaiserliche&KonglicheDirectionderAdministrativenStatistik,Wien,1857
Easterlin,Richard.“WhyIsn’ttheWholeWorldDeveloped?”,JournalofEconomicHistory41(1),1981,pp.1–19
Ficker,Adolf.DieBevolkerungdesKonigreichsBohmeninihrenwichtigstenstatistischenVerhaltnissen,EduardHolzel’sVerlag,WienandOlmutz,1864
Ficker,Adolf.BerichtuberosterreichischesUnterrichtswesen.AusAnlassderWeltausstellung1873.AlfredHolder,Wien,1873
Galor,Oded.UnifiedGrowthTheory.PrincetonUniversityPress,Princeton,2011
Go,SunandLindert,Peter.“TheCuriousDawnofAmericanPublicSchools”,NBERworkingpaper#13335,August2007
Go,SunandLindert,Peter.“TheUnevenRiseofAmericanPublicSchoolsto1850,”JournalofEconomicHistory70(1),March2010,pp.1–26
Good,DavidF.TheEconomicRiseofTheHabsburgEmpire,1750–1914.UniversityofCaliforniaPress,Berkeley,1984
Heiler,BernhardandLebman,Rosa.“DieEntwicklungderallgemeindebildendenPflichtschuleninOesterreich”inGeschichteundErgebnissederzentralenamtlichenStatistikinOsterreich1829‐1979,Kommissionsverlag,ÖsterreichischeStaatsdruckerei,Vienna,1979,pp.513–544
Helfert,JosephAlexandervon.DieösterreichischeVolksschule:Geschichte,System,Statistik–I.Band.Prague,1860
Jaszi,Oszkar.TheDissolutionoftheHabsburgEmpire,UniversityofChicagoPress,Chicago,1929
K.K.StatistischeZentral‐Commission.“DieDampfmaschinenderOesterreichischenMonarchienachderimJahre1863vorgenomennenZahlung”,MittheilungenausderGebietderStatistik11(2),Vienna1864
K.K.StatistischeZentral‐Commission.StatistischesJahrbuchderOesterreichischenMOnarchiefürdasJahr1865.Kaiserlich‐KöniglicheHof‐undStaatsdruckerei,Vienna,1867
K.K.StatistischeZentral‐Commission.Detail‐ConscriptionderVolksschulenderimReichsrathevertretenenKonigreichenundLandernnachdemStandevomEndedesSchuljahres1865.Vienna,1870

28
K.K.StatistischeZentral‐Commission.BevölkerungundViehstandderimReichsrathevertretenenKönigreicheundLänder,dannderMilitärgrenzenachderZählungvom31.Dezember1869.Kaiser‐königlicheHof‐undStaatsdrückerei,Vienna,1871
K.K.StatistischeZentral‐Commission.DieBevölkerungderimReichsrathevertretenenKönigreicheundLändernachBerufundErwerb:3.HeftderErgebnissederVolkszählungunddermitderselbenverbundenenZählungderHäuslichenNutzthierevom31.December1880.In:ÖsterreichischeStatistik–Band1:Heft3.Kaiserlich‐KöniglicheHof‐undStaatsdruckerei,Vienna,1882
Kohn,Ignaz.EisenbahnJahrbuchderOesterreichischen‐UngarischenMonarchie:NeueFolge–DritterJahrgang.Lehmann&Wentzel,Vienna1881
LindertPeter.GrowingPublic:SocialSpendingandEconomicGrowthsincetheEighteenthCentury.CambridgeUniversityPress,2004–Chapter5–TheRiseofMassPublicSchoolingbefore1914
Mariscal,ElisaandSokoloff,Kenneth.“Schooling,SuffrageandthePersistenceofInequalityintheAmericas”,inHaber,Stephen.PoliticalInstitutionsandEconomicGrowthinLatinAmerica:EssaysinPolicy,HistoryandPoliticalEconomy,HooverInstitutionPress,2000,pp.159–218
Mitch,David.TheRiseofPopularLiteracyinVictorianEngland:theInfluenceofPrivateChoiceandPublicPolicy.UniversityofPennsylvaniaPress,Philadelphia,1992
Mitch,David.TheRoleofEducationandSkillintheBritishIndustrialRevolution.In:JoelMokyr(ed.),TheBritishIndustrialRevolution:AnEconomicPerspective,2ndedition.Boulder:Westview,1999,pp.241‐279
Mitch,David.“LandedSociety,FarmSize,andSupportforPublicSchoolinginNineteenthCenturyEngland”,workingpaper2012
Mokyr,Joel.“HumanCapital,UsefulKnowledgeandLong‐TermEconomicGrowth”,EconomiaPolitica:JournalofAnalyticalandInstitutionalEconomics,forthcoming2013
Musacchio,Aldo,FritscherAndreM.andViarengoM.“ColonialInstitutions,TradeShocks,andtheDiffusionofElementaryEducationinBrazil,1889–1930”workingpaper,Dec2012
Naidu,Suresh.“Suffrage,schoolingandsortinginthePost‐BellumU.S.South”NBERwp#18129,June2012
Pacher,LieselotteMaria.DieelementareRechenunterrichindeutschsprachigenLehrbuchernOesterreichsvonMariaTheresiabiszumEndederMonarchie.Unpublishedthesis,UniversityofVienna,Vienna,2008
Palma,Nuno&Reis,Jaime.“ATaleofTwoRegimes:EducationalAchievementandInstitutionsinPortugal,1910–1950”,workingpaper2012
Prausek,Vinzenz.DieVerbesserungderVolksschulemibesondereBerucksichtigungOesterreichs.Sallmayer&Co.,Wien,1868
Rauchberg,Heinrich.DerNationaleBesitzstandinBohmen.Dunkler&Humblot,Leipzig,1905
Sandberg,LarsG.“TheCaseoftheImpoverishedSophisticate:HumanCapitalandSwedishEconomicGrowthbeforeWorldWarI”,JournalofEconomicHistory39(1),March1979,pp.225–241
29
Troen,SelwynK.ThePublicandtheSchools:ShapingtheSt.LouisSystem,1838–1920.UniversityofMissouriPress,Columbia,1975
VanHornMelton,James.AbsolutismandtheeighteenthcenturyoriginsofcompulsoryschoolinginPrussiaandAustria.CambridgeUniversityPress,Cambridge,England,1988

30
Table 1 - Descriptive statistics (i) (ii) (iii) (iv)
All
provinces Core
provinces New
provinces Vienna
Number of school districts 730 546 184 1
Number of school-age children 3036 2882 3491 37958 [2514] [2394] [2797]
Average number of grades 2.17 3.91 [0.48]
Non-priest teachers per 1000 school-age children
11.62 12.71 8.37 15.39 [7.82] [6.73] [9.72]
Classrooms per 1000 school-age children
12.04 12.17 [6.2]
Teaching staff expenditure per school-age child
2.16 5.22 [0.9]
Percent school-age children covered by school provision (school coverage)
95.7 100.0 [9.69]
Percent school-age children enrolled 70.2 84.1 29.1 86.1 [29.53] [17.31] [17.49]
Enrollment per 100 covered school-age children
95.2 96.0 [16.92]
# steam engines in school district 4.0 5.0 0.7 156.0 [12.01] [13.62] [2.92]
Share of industrial employment (%) (from 1869 census)
19.2 22.7 8.9 65.0 [13.8] [13.9] [6.3]
Distance to railroad (km) 44.8 20.9 115.6 0.0 [75.44] [22.15] [120.27]
Secondary school slots within 50 km 191.2 220.1 105.2 920.9 [188.4] [201.9] [100.8]
Literacy content of labor market (boys) 0.241 0.247 0.224 0.358 [0.041] [0.043] [0.029]
Literacy content of labor market (girls) 0.092 0.105 0.053 0.186 [0.037] [0.032] [0.024]
Note: Core provinces are Lower Austria, Upper Austria, Salzburg, Styria, Carinthia, Carniola, the Austrian Littoral, Tyrol and Vorarlberg, Bohemia, Moravia and Silesia. New provinces are Galicia, Bukowina and Dalmatia.

31
Table 2 - Comparison of education variables in core provinces Means t-test p-value
German (N=274) Non-German (N=272)
Average grades per school 2.17 2.17 -0.04 0.96 Classrooms per 1000 school-age children 13.97 10.09 -7.69 0.00 Teachers per 1000 school-age children 15.06 10.34 -8.73 0.00 Spending on staff per child (in fl per year) 2.28 2.05 -3.09 0.00 School coverage 96.98 94.38 -3.16 0.00 *School with minority language of instruction is present 70.40 87.10 2.46 0.02
*Parallel class with minority language of instruction is present 85.20 95.30 2.09 0.04
Percentage of school-age children enrolled 90.10 78.04 -8.68 0.00 Number of steam engines 4.82 5.26 0.38 0.70 Share of industrial employment (%) 24.9 20.4 -3.78 0.00 1(railroad access) 37.50 30.30 1.78 0.08 Distance to railroad 22.12 19.69 -1.28 0.20 Note: *based on 139 districts with at least 100 German students and 100 non-German students.

32
Table 3 - Individual demand for school enrollment (OLS) (i) (ii) (iii) (iv) (v) (vi) (vii)
Dependent variable: Enrolled pupils per 100 covered school-age children
Sample: Full sample Full sample
Full sample
German districts
Non-German districts
Full-coverage districts
Districts with less than full coverage
Secondary school slots -0.011 -0.010 -0.011 -0.003 -0.023 -0.006 -0.016 [0.004] [0.003] [0.002] [0.002] [0.004] [0.002] [0.004]
Literacy content of labor market 126.201 59.030 61.084 15.566 63.560 30.018 105.143 [15.718] [13.648] [10.871] [9.942] [18.317] [15.432] [15.827]
1(Boys) -11.391 -2.097 -2.271 0.075 2.127 -0.403 -5.463 [2.212] [1.850] [1.495] [1.227] [2.820] [2.359] [1.992]
Constant 79.700 86.776 86.559 97.617 80.707 92.658 79.194 [1.811] [1.515] [1.182] [1.216] [1.734] [1.596] [1.781]
N 1092 1092 1092 548 544 506 586 Adjusted R2 0.067 0.609 0.856 0.841 0.856 0.826 0.874 Fixed effects None Diocese District District District District District Note: “Secondary school slots” measures the number of entry-level spots in secondary schools within 50km of each school district. “Literacy content of local labor market “ is a weighted index capturing the demand for literacy in the labor market within 50km of a school district. It is based on data on employment composition in the 1869 census (see Appendix 1 for more detail). Diocese fixed effects in column (ii) are 22 dummy variables for individual bishoprics. The estimation sample is limited to school districts in core provinces. Standard errors in brackets. See text for further details.

33
Table 4 - Interdependence of school supply and economic development Eq. 2a Eq. 2b Eq. 2c Eq. 2d Teachers per 1000
school-age children Grades
per school Staff expenditure
per school-age child Share of industrial
employment Panel A. Full sample - Core provinces (N = 546) Teachers per 1000 school-age children
-0.063 [0.047]
Average number of grades
0.082 [0.303]
Staff expenditure per school-age child
0.130 [0.193]
Share of industrial employment
0.215 2.857 4.875 [4.588] [0.610] [1.190]
1(German) 2.745 -0.220 -0.106 0.221 [0.565] [0.076] [0.152] [0.91]
1(Urban) 0.867 0.026 0.262 0.023 [0.463] [0.059] [0.124] [0.034]
Population dispersion
0.003 [0.005]
Secondary school spots
0.096 [0.042]
Distance to provincial capital
-0.001 [0.001]
Urban population 0.000 [0.001]
Constant 8.329 1.557 0.757 0.350 [1.345] [0.223] [0.366] [0.676]
Panel B. Core provinces, excluding Vienna (N = 545) Teachers per 1000 school-age children
-0.071 [0.045]
Average number of grades
0.125 [0.281]
Staff expenditure per school-age child
0.108 [0.172]
Share of industrial employment
2.340 3.245 5.126 [4.591] [0.639] [1.186]
1(German) 2.567 -0.255 -0.125 0.249 [0.568] [0.081] [0.154] [0.093]
1(Urban) 0.726 0.012 0.240 0.027 [0.458] [0.065] [0.124] [0.034]
Population dispersion
0.005 [0.005]
Secondary school spots
0.074 [0.048]
Distance to provincial capital
-0.001 [0.001]
Urban population 0.000 [0.002]
Constant 7.878 1.451 0.710 0.363 [1.351] [0.236] [0.368] [0.655]

34
Note: “Secondary school slots” measures the number of entry-level spots in secondary schools within 50km of each school district. “Population dispersion” is calculated as number of villages per 1000 school-age children in a district. “Urban population” is the total population in a district, living in towns of more than 5000 inhabitants. Standard errors are in brackets.

35
Table 5 - Regression results for spatial discontinuity regression (IV-2SLS) (i) (ii) (iii) (iv)
Dependent variable Grades per school
Spending on teaching staff per school-age child
Classrooms per 1000 school-age children
Teachers per 1000 school-age children
sub-sample mean 2.191 2.559 10.852 16.684 sub-sample s.d. 0.731 1.32 4.607 7.062 1(majority German district)
0.026 0.502 1.695 3.294 [0.152] [0.262] [0.888] [1.289]
1(minority school) -0.136 -0.444 -1.234 -2.276 [0.141] [0.243] [0.823] [1.194]
1(minority German school)
0.086 1.295 3.136 5.268 [0.199] [0.344] [1.164] [1.689]
Share of industrial employment
1.811 1.556 5.089 -1.773 [2.044] [3.535] [11.974] [17.372]
Urban dummy 0.483 0.128 -1.387 -1.982 [0.209] [0.361] [1.222] [1.773]
Constant 1.198 1.457 5.443 12.748 [0.925] [1.600] [5.418] [7.860]
t-tests: β2+β3=0 0.13 12.26 5.34 6.27 (p-val) 0.72 0.00 0.02 0.01 First-stage F: 13.42 13.42 13.42 13.42 Note: Standard errors are in brackets.
36
Figure1–MapoftheHabsburgEmpireinits1914bordersProvince CapitalLowerAustria ViennaUpperAustria LinzSalzburg SalzburgTyrol InnsbruckVorarlberg BregenzStyria GrazCarinthia KlagenfurtCarniola LjubljanaLittoral TriesteBohemia PragueMoravia BrnoSilesia OpavaGalicia LwowBukowina CzernowitzDalmatia ZadarHungary BudapestTransylvania ClujWesternSlovakia NitraEasternSlovakia KošiceCroatia ZagrebSlavonia OsijekBanat TimisoaraBosnia‐Hercegovina Sarajevo
Note:Notallprovinceswereinexistenceatalltimes.Bosnia‐HercegovinawasanAustrianprotectoratebetween1878–1908,afterwhichitwasannexed.Source:Wikimediacommons.

37
Figure2–Enrollmentandliteracyofthe1830‐1839birthcohort
Note:Averageenrollmentiscalculatedastheaverageenrollmentacrossyears1836‐1851whenthe1830‐1839birthcohortwasinschoolage(6‐11.9yearsold).Two‐letterabbreviationsdenoteindividualprovinces:BO–Bohemia,BU–Bukowina,DA–Dalmatia,GA–Galicia,KI–Carniola(Krain),KS–AustrianLittoral(Küstenland),KT–Carinthia(Kärnten),MA–Moravia,NO–LowerAustria(Nieder‐Österreich),OO–UpperAustria(Ober‐Österreich),SB–Salzburg,SI–Silesia,ST–Styria,TV–Tyrol&Vorarlberg
NOOO
SB
ST
KT
KI
KS
TVBOMA
SI
GABUDA
NOOO
SB
ST
KT
KI
KS
TVBO
MA
SI
GABU
DA0.0
0.1
0.2
0.3
0.4
0.5
0.6
0.7
0.8
0.9
1.0
0.0 0.2 0.4 0.6 0.8 1.0
Literacy rates (1890
cen
sus)
Average enrollment (1836 ‐ 1851)
Men
Women

38
Figure3–Age‐enrollmentprofileinAustria(1865)andUS(1850‐70)
Note:USdatacomefromClayetal(2012).Austrianprovinces=LowerAustria,UpperAustria,Salzburg,Styria,Carinthia,Tyrol&Vorarlberg.Czechprovinces=Bohemia,Moravia,Silesia.SomeAdriaticprovinces=AustrianLittoralandCarniola.Thepost‐age‐12enrollmentfortheHabsburgempireincludesenrollmentinsecondaryschools,namelyGymnasiaandRealschulen.
0
0.1
0.2
0.3
0.4
0.5
0.6
0.7
0.8
0.9
1
<6 6 7 8 9 10 11 12 13 14 15 16 17
Prop
ortio
n en
rolled
Age
Austrianprovinces
Czechprovinces
SomeAdriaticprovinces
USstates(1850)
USstates(1870)

39
Figure 4
Note: For construction of literacy content, see Appendix 1.