Embed Size (px)
Citation preview
Contact: Email: [email protected] Press office: 020 7783 8300 Public enquiries: 0370 000 2288
School Workforce in England: November
2016
SFR 25/2017, 22 June 2017
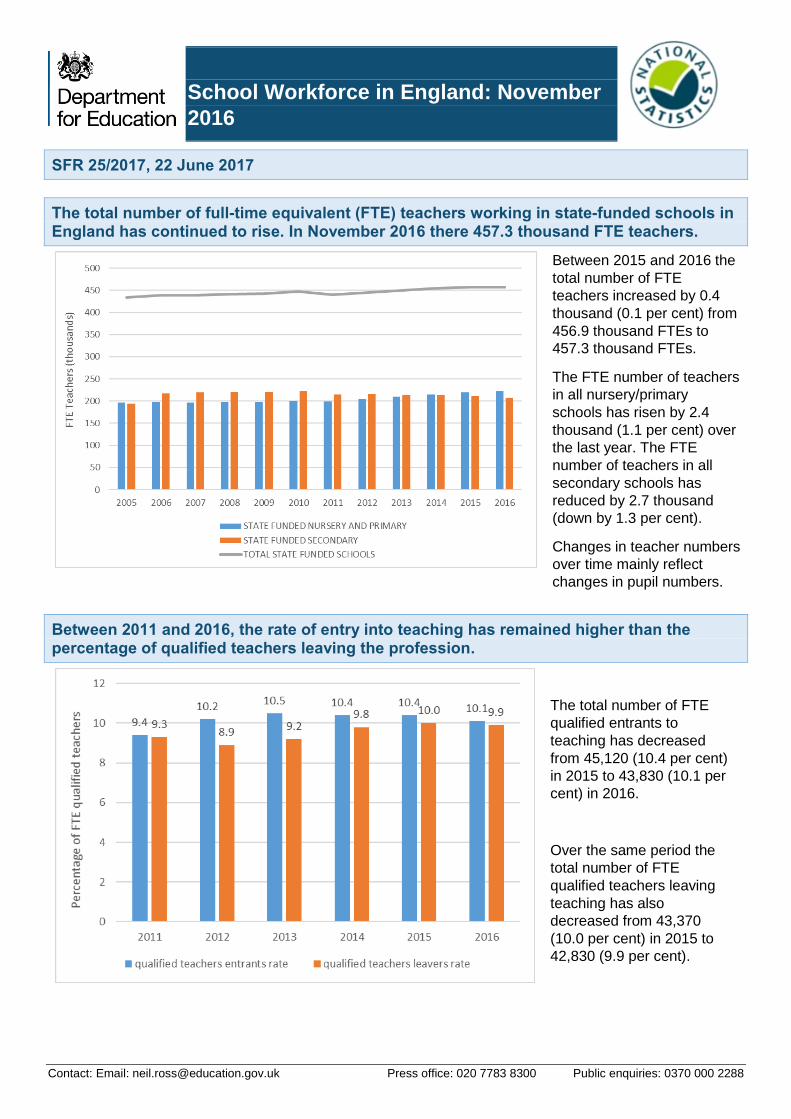
The total number of full-time equivalent (FTE) teachers working in state-funded schools in England has continued to rise. In November 2016 there 457.3 thousand FTE teachers.
Between 2015 and 2016 the
total number of FTE
teachers increased by 0.4
thousand (0.1 per cent) from
456.9 thousand FTEs to
457.3 thousand FTEs.
The FTE number of teachers
in all nursery/primary
schools has risen by 2.4
thousand (1.1 per cent) over
the last year. The FTE
number of teachers in all
secondary schools has
reduced by 2.7 thousand
(down by 1.3 per cent).
Changes in teacher numbers
over time mainly reflect
changes in pupil numbers.
Between 2011 and 2016, the rate of entry into teaching has remained higher than the percentage of qualified teachers leaving the profession.
The total number of FTE
qualified entrants to
teaching has decreased
from 45,120 (10.4 per cent)
in 2015 to 43,830 (10.1 per
cent) in 2016.
Over the same period the
total number of FTE
qualified teachers leaving
teaching has also
decreased from 43,370
(10.0 per cent) in 2015 to
42,830 (9.9 per cent).
Contact: Email: [email protected] Press office: 020 7783 8300 Public enquiries: 0370 000 2288
Contents
The size of the schools’ workforce (SFR Tables 1, 2a, and 2b) ............................................. 4
Key changes between 2014 and 2015....................................................................................... 5
Teacher flows (SFR Tables 7a, 7b and 8) ............................................................................. 6
Deployment and characteristics of teachers and other schools staff (SFR Tables 3, 4, 5
and 6) ............................................................................................................................ 7
Teachers with and without Qualified Teacher Status ................................................................. 7
Gender of school staff ................................................................................................................ 7
Disabled school teachers ........................................................................................................... 8
Age of school teachers .............................................................................................................. 8
Ethnicity of school staff .............................................................................................................. 9
Full and part-time working amongst school staff ........................................................................ 9
Teachers’ pay (SFR Tables 9a, 9b, 9c and 9d) ....................................................................... 10
Teachers’ qualifications and curriculum taught (SFR Tables 10, 11, 12 and 13) ..................... 10
Teacher vacancies (SFR Tables 14 and 15) ...................................................................... 10
Teacher sickness absence (SFR Table 16) ................................................................. 11
Pupil teacher ratios (SFR Tables 17a and 17b) ................................................................... 11
Teacher retirements and out of service teachers (SFR Tables 18 – 23) ........................... 12
Accompanying tables ........................................................................................ 13
Further information is available .......................................................................... 14
National Statistics .............................................................................................. 15
Technical information ........................................................................................ 16
Get in touch ....................................................................................................... 16
Media enquiries ....................................................................................................................... 16
Other enquiries/feedback ......................................................................................................... 16
Contact: Email: [email protected] Press office: 020 7783 8300 Public enquiries: 0370 000 2288
About this release
This statistical first release provides the latest information on the composition of the school workforce employed in local authority maintained nursery, primary, secondary and special schools and all primary, secondary, and special academy schools and free schools in England.
The release is based on data collected from schools and local authorities in November 2016 as part of the seventh annual School Workforce Census. Data on independent schools, sixth form colleges and further education establishments are not included.
The census collects detailed information on teachers, teaching assistants and other non-classroom based school support staff. The SFR includes statistics showing the time series of school staff numbers by grade/role and by school phase. It also provides detailed characteristics data on school staff e.g. their age, gender, ethnicity and whether they work full or part-time.
The SFR also includes statistics on teachers’ salaries, qualifications and sickness absence levels. In addition, for a sample of secondary school teachers, statistics are published on the curriculum subject taught, whether teachers have qualifications in the subjects they teach and the hours spent teaching by subject.
In addition, the SFR includes statistics on the number of teaching vacancies (and by subject for secondary schools) and the number of teaching posts that are filled on a temporary basis.
The quality of data in this release depends on schools correctly completing their returns. Each year we review the process to consider what additional validation checks we can build into the collection process to help schools, and how we can supplement the data schools return with other data we hold to improve the data quality.
In this publication
This statistical release contains time series statistics on the number of teachers, teaching assistants and support staff employed by state-funded schools and local authorities in England. It also provides details on teacher and support staff characteristics and deployment, teacher flows, teacher pay, teacher sickness absence, teacher qualifications and curriculum taught, as well as teaching vacancies and pupil teacher ratios. These tables are contained in (Excel .xls)
In addition, there are statistics on teacher retirements and out of service teachers in (Excel .xls) and school level statistics (with LA and Region summaries) in the underlying data (open format .csv and metadata .txt)
The accompanying quality and methodology information document, provides information on the data sources, their coverage and quality and explains the methodology used in producing the data.
Feedback
We are changing how our statistical releases look and welcome feedback on any aspect of this document at [email protected]
4
The size of the schools’ workforce (SFR Tables 1, 2a, and 2b)
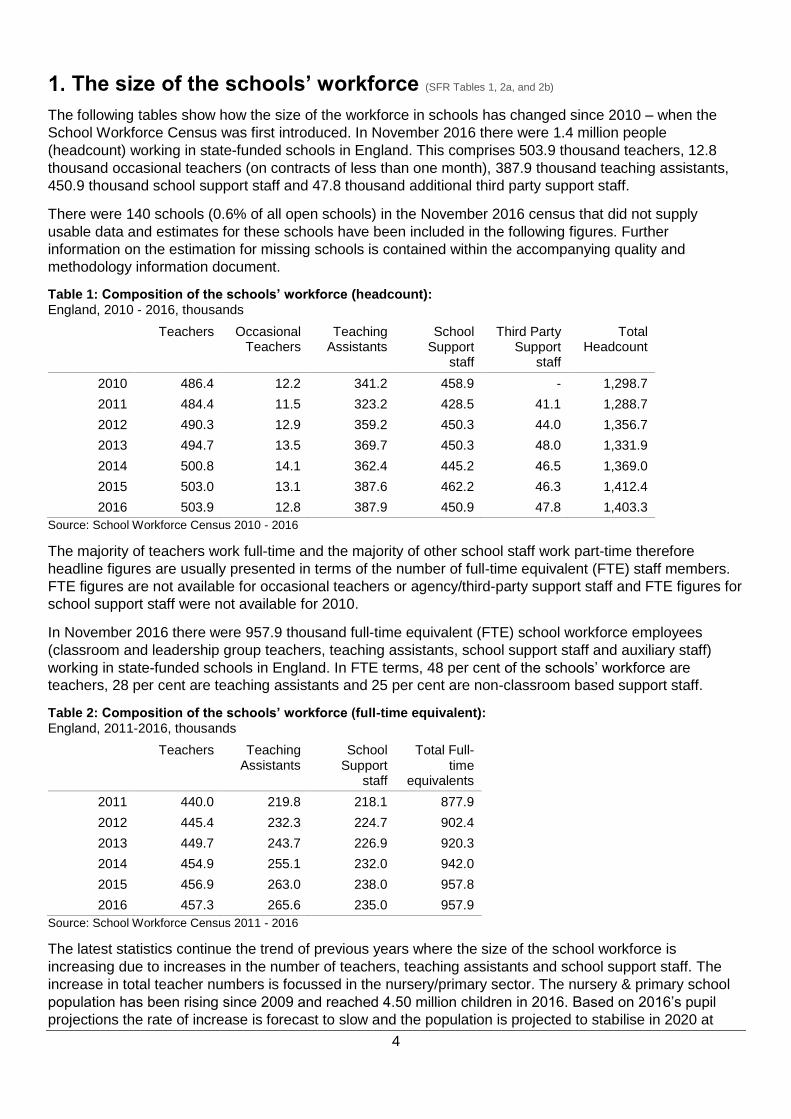
The following tables show how the size of the workforce in schools has changed since 2010 – when the
School Workforce Census was first introduced. In November 2016 there were 1.4 million people
(headcount) working in state-funded schools in England. This comprises 503.9 thousand teachers, 12.8
thousand occasional teachers (on contracts of less than one month), 387.9 thousand teaching assistants,
450.9 thousand school support staff and 47.8 thousand additional third party support staff.
There were 140 schools (0.6% of all open schools) in the November 2016 census that did not supply
usable data and estimates for these schools have been included in the following figures. Further
information on the estimation for missing schools is contained within the accompanying quality and
methodology information document.
Table 1: Composition of the schools’ workforce (headcount): England, 2010 - 2016, thousands
Teachers Occasional Teachers
Teaching Assistants
School Support
staff
Third Party Support
staff
Total Headcount
2010 486.4 12.2 341.2 458.9 - 1,298.7
2011 484.4 11.5 323.2 428.5 41.1 1,288.7
2012 490.3 12.9 359.2 450.3 44.0 1,356.7
2013 494.7 13.5 369.7 450.3 48.0 1,331.9
2014 500.8 14.1 362.4 445.2 46.5 1,369.0
2015 503.0 13.1 387.6 462.2 46.3 1,412.4
2016 503.9 12.8 387.9 450.9 47.8 1,403.3
Source: School Workforce Census 2010 - 2016
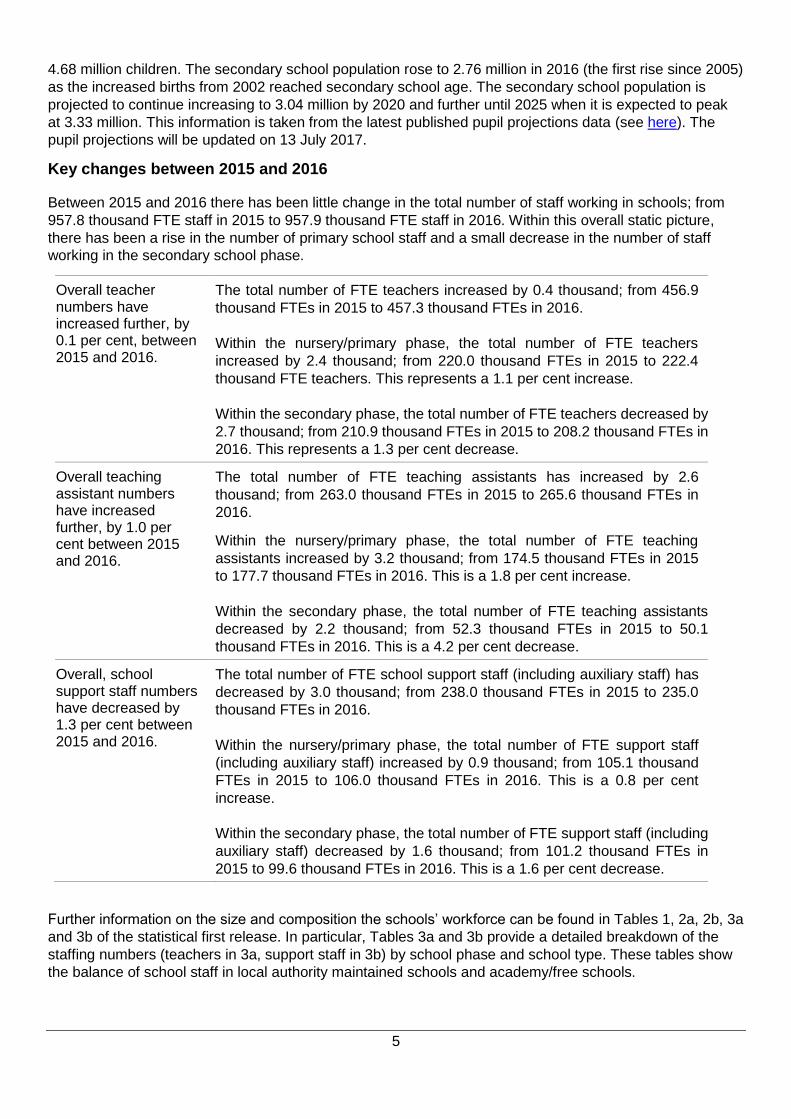
The majority of teachers work full-time and the majority of other school staff work part-time therefore
headline figures are usually presented in terms of the number of full-time equivalent (FTE) staff members.
FTE figures are not available for occasional teachers or agency/third-party support staff and FTE figures for
school support staff were not available for 2010.
In November 2016 there were 957.9 thousand full-time equivalent (FTE) school workforce employees
(classroom and leadership group teachers, teaching assistants, school support staff and auxiliary staff)
working in state-funded schools in England. In FTE terms, 48 per cent of the schools’ workforce are
teachers, 28 per cent are teaching assistants and 25 per cent are non-classroom based support staff.
Table 2: Composition of the schools’ workforce (full-time equivalent): England, 2011-2016, thousands
Teachers Teaching Assistants
School Support
staff
Total Full-time
equivalents
2011 440.0 219.8 218.1 877.9
2012 445.4 232.3 224.7 902.4
2013 449.7 243.7 226.9 920.3
2014 454.9 255.1 232.0 942.0
2015 456.9 263.0 238.0 957.8
2016 457.3 265.6 235.0 957.9
Source: School Workforce Census 2011 - 2016
The latest statistics continue the trend of previous years where the size of the school workforce is
increasing due to increases in the number of teachers, teaching assistants and school support staff. The
increase in total teacher numbers is focussed in the nursery/primary sector. The nursery & primary school
population has been rising since 2009 and reached 4.50 million children in 2016. Based on 2016’s pupil
projections the rate of increase is forecast to slow and the population is projected to stabilise in 2020 at
5
4.68 million children. The secondary school population rose to 2.76 million in 2016 (the first rise since 2005)
as the increased births from 2002 reached secondary school age. The secondary school population is
projected to continue increasing to 3.04 million by 2020 and further until 2025 when it is expected to peak
at 3.33 million. This information is taken from the latest published pupil projections data (see here). The
pupil projections will be updated on 13 July 2017.
Key changes between 2015 and 2016
Between 2015 and 2016 there has been little change in the total number of staff working in schools; from
957.8 thousand FTE staff in 2015 to 957.9 thousand FTE staff in 2016. Within this overall static picture,
there has been a rise in the number of primary school staff and a small decrease in the number of staff
working in the secondary school phase.
Overall teacher numbers have increased further, by 0.1 per cent, between 2015 and 2016.
The total number of FTE teachers increased by 0.4 thousand; from 456.9
thousand FTEs in 2015 to 457.3 thousand FTEs in 2016.
Within the nursery/primary phase, the total number of FTE teachers
increased by 2.4 thousand; from 220.0 thousand FTEs in 2015 to 222.4
thousand FTE teachers. This represents a 1.1 per cent increase.
Within the secondary phase, the total number of FTE teachers decreased by
2.7 thousand; from 210.9 thousand FTEs in 2015 to 208.2 thousand FTEs in
2016. This represents a 1.3 per cent decrease.
Overall teaching assistant numbers have increased further, by 1.0 per cent between 2015 and 2016.
The total number of FTE teaching assistants has increased by 2.6
thousand; from 263.0 thousand FTEs in 2015 to 265.6 thousand FTEs in
2016.
Within the nursery/primary phase, the total number of FTE teaching
assistants increased by 3.2 thousand; from 174.5 thousand FTEs in 2015
to 177.7 thousand FTEs in 2016. This is a 1.8 per cent increase.
Within the secondary phase, the total number of FTE teaching assistants
decreased by 2.2 thousand; from 52.3 thousand FTEs in 2015 to 50.1
thousand FTEs in 2016. This is a 4.2 per cent decrease.
Overall, school support staff numbers have decreased by 1.3 per cent between 2015 and 2016.
The total number of FTE school support staff (including auxiliary staff) has
decreased by 3.0 thousand; from 238.0 thousand FTEs in 2015 to 235.0
thousand FTEs in 2016.
Within the nursery/primary phase, the total number of FTE support staff
(including auxiliary staff) increased by 0.9 thousand; from 105.1 thousand
FTEs in 2015 to 106.0 thousand FTEs in 2016. This is a 0.8 per cent
increase.
Within the secondary phase, the total number of FTE support staff (including
auxiliary staff) decreased by 1.6 thousand; from 101.2 thousand FTEs in
2015 to 99.6 thousand FTEs in 2016. This is a 1.6 per cent decrease.
Further information on the size and composition the schools’ workforce can be found in Tables 1, 2a, 2b, 3a
and 3b of the statistical first release. In particular, Tables 3a and 3b provide a detailed breakdown of the
staffing numbers (teachers in 3a, support staff in 3b) by school phase and school type. These tables show
the balance of school staff in local authority maintained schools and academy/free schools.
6
As the number of academy and free schools increases and the number of LA maintained schools reduces
this affects the distribution of school staff between school type within the primary and secondary school
phases.
More academies… In November 2016, there were 6,273 academy schools which represents an
increase of 863 schools compared to 2015 when there were 5,410 academy
schools. Academy schools accounted for 28 per cent of all schools and 44
per cent of teachers at the time of the census.
… means more academy teachers…
In November 2016, there were 194.3 thousand FTE teachers in academy
schools up 14.5 thousand FTE (8 per cent increase) from 179.8 thousand
FTE teachers in academy schools in November 2015.
… and more teachers in free schools…
5.0 thousand FTE teachers were employed in the 287 primary and secondary
free schools in November 2016. This is an increase of 1.3 thousand FTE
teachers compared with the previous year. In addition, there were a further
1.1 thousand FTE teachers in University Technical Colleges and studio
schools.
… and fewer teachers in local authority maintained schools…
In November 2016, there were 252.6 thousand FTE teachers in LA
maintained schools down 5.7 per cent compared with the 267.9 thousand in
November 2015.
… and fewer centrally employed teachers.
As more schools convert to academy status the support required from local
authorities diminishes. In addition, many centrally employed staff worked in
pupil referral units which are now standalone schools. These changes have
resulted in the continued decline of centrally employed teachers; from 4.4
thousand FTE teachers in 2015 to 4.3 thousand FTE teachers in 2016.
Teacher flows (SFR Tables 7a, 7b and 8)
The total number of FTE qualified entrants to teaching has increased over time from 39,710 in 2011 to
43,830 in 2016 (peaking at 45,290 in 2014). As a percentage of the stock of qualified teachers the teacher
entrants rate increased between 2011 and 2015; from 9.4 per cent in 2011 to 10.5 per cent in 2013.
However, between 2013 and 2016 the FTE qualified entrants rate has reduced to 10.4 per cent in 2014 and
2015 and 10.1 per cent in 2016.
The number of qualified entrants in any one year includes newly qualified teachers, those teachers new to
the state-funded sector and those returning to teaching after a break. In 2016, newly qualified teachers
accounted for 55 per cent of the total qualified entrants, 32 per cent of entrants are returners and 13 per
cent are teachers new to the sector.
The total number of FTE qualified leavers has also increased over time from 39,370 in 2011 to 43,370 in
2015 and then decresed to 42,830 in 2016. As a percentage of the stock of qualified teachers the teacher
leavers rate has also increased over the same period; from 9.3 per cent in 2011 to 10.0 per cent in 2015;
falling to 9.9 per cent in 2016.
The number of qualified leavers in any one year includes teachers taking retirement, those taking a break
from teaching (e.g. maternity leave, secondments) and who may come back as returners in a later year and
those leaving the profession (both these groups are in the ‘out of service’ category). Between 2011 and
2016 the FTE number of teacher retirements has decreased (from 13,880 to 7,760) and the FTE number of
out of service teachers has increased (from 25,260 to 34,910). In 2016, out of service teachers accounted
for 82 per cent of the total qualified leavers and retirements accounted for 18 per cent.
Teacher retention has remained broadly stable since 2006. The percentage of teachers that are still in post
one year after qualifying and starting a job has remained static at 87 per cent. Table 8 shows the
7
percentage of teachers that are still in post each year after qualifying and entering service. For example,
the percentage of teachers that were still in post three years after qualifying and entering service was 74
per cent, a small decrease on the previous year’s figure of 75 per cent. The percentage of teachers that
were still in post five and ten years after qualifying and entering service was 69 per cent and 60 per cent
respectively. 48 per cent of teachers were still in service 20 years after qualifiying and entering service.
Deployment and characteristics of teachers and other schools staff (SFR Tables 3, 4, 5 and 6)
The size of the schools’ workforce is such that the characteristics (gender, age, ethnicity etc.) of its
employees changes very little between consecutive years.
Teachers with and without Qualified Teacher Status
The percentage of FTE qualified teachers (those with Qualified Teacher Service) in all state-funded schools
is 94.7 per cent; a decrease from 95.1 per cent in 2015.
The total number of teachers without QTS increased between 2015 and 2016; from 22.5 thousand FTEs in
2015 to 24.0 thousand FTEs in 2016. This represents an increase in the percentage of FTE teachers
without QTS; from 4.9 per cent in 2015 to 5.3 per cent in 2016. As reported by schools the percentage of
teachers without QTS that were working towards gaining QTS had also increased; from 15.0 per cent in
2010 to 20.0 per cent in 2015 and 21 per cent in 2016.
The percentage of FTE teachers that do not have QTS varies by school type. 3.4 per cent of teachers in all
nursery/primary schools do not have QTS; compared with 6.2 per cent in all secondary schools.
Within the nursery/primary sector, 3.5 per cent of FTE teachers in LA maintained nursery schools do not have
QTS and 3.0 per cent of FTE teachers in maintained primary schools do not have QTS. The percentage
without QTS rises to 4.2 per cent in primary academy convertor schools, 5.9 per cent in sponsor-led primary
academies and 12.3 per cent in primary free schools.
4.9 per cent of FTE teachers in maintained secondary schools do not have QTS. This rises to 5.4 per cent in
secondary academy convertor schools, 9.6 per cent in sponsor-led secondary academies and 11.3 per cent
in secondary free schools.
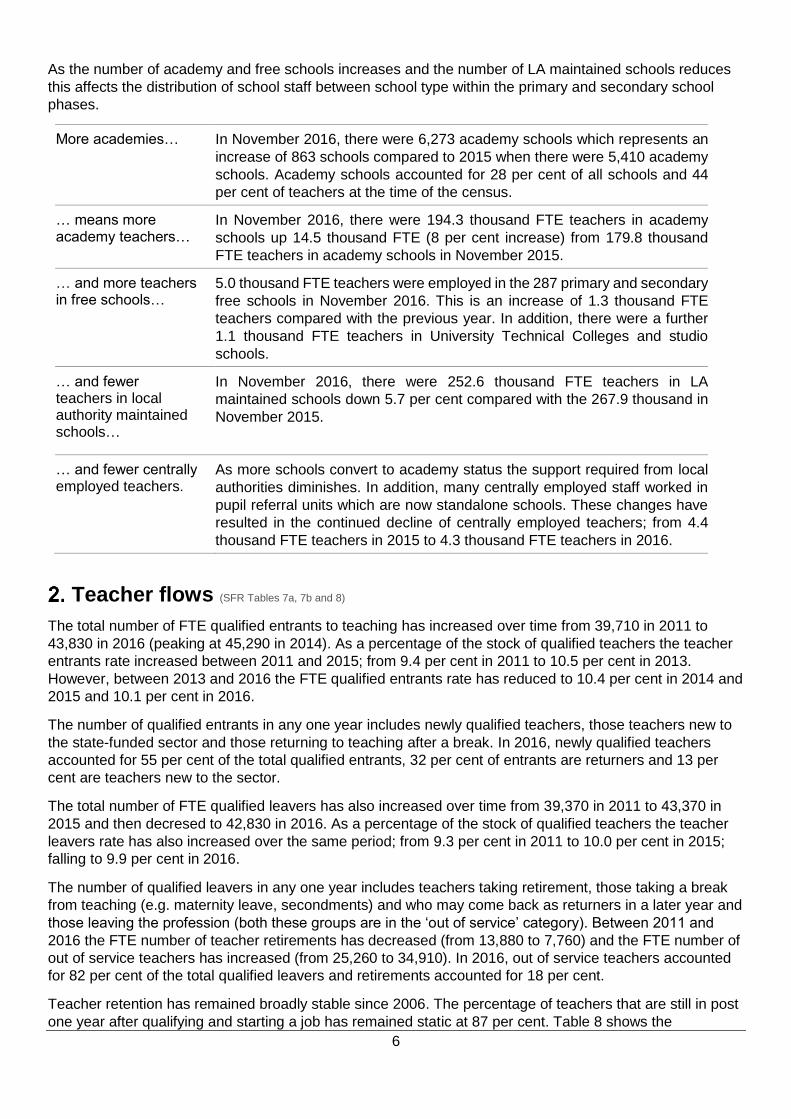
Gender of school staff
Almost three out of four school teachers are female and four out of five school employees are female.
The percentage of full-time equivalent school staff by gender: November 2016
73.9 per cent of FTE
teachers are female.
84.6 per cent of FTE
nursery/primary
school teachers are
female and 62.5 per
cent of secondary
school teachers.
91.4 per cent of
teaching assistants
and 82.2 per cent of
school support staff
are female.
Overall, 80.2 per cent
of all school staff are
female.
8
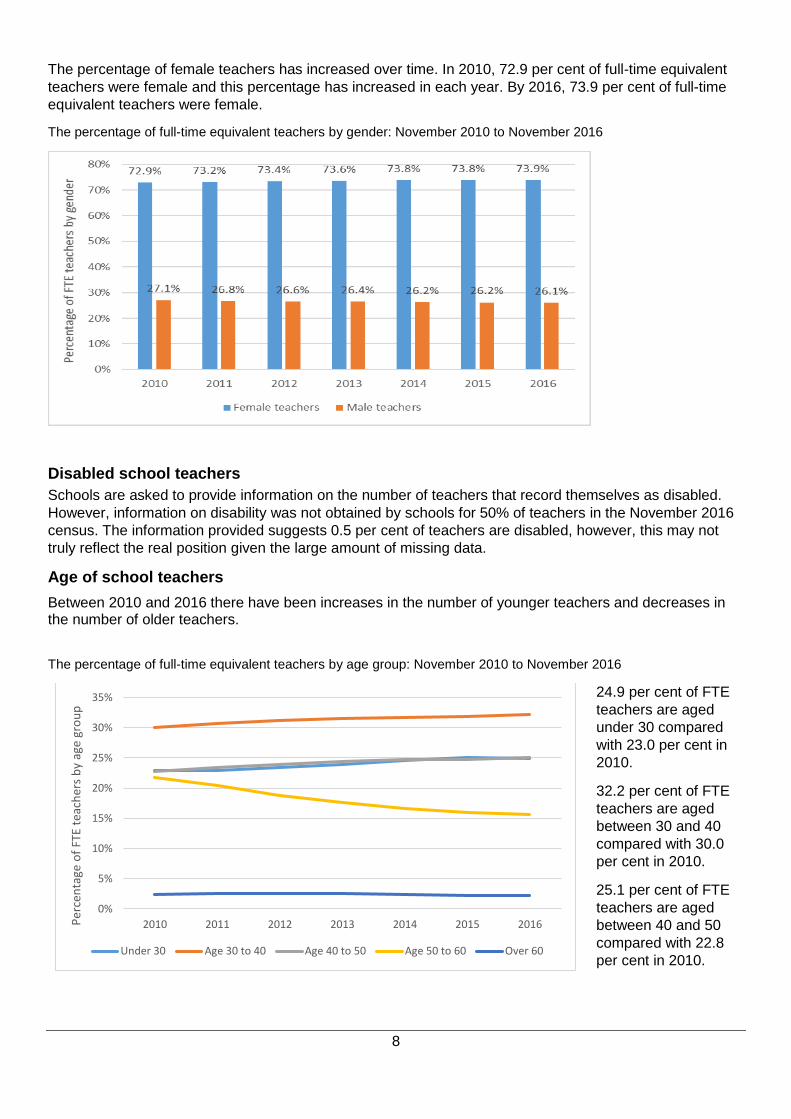
The percentage of female teachers has increased over time. In 2010, 72.9 per cent of full-time equivalent
teachers were female and this percentage has increased in each year. By 2016, 73.9 per cent of full-time
equivalent teachers were female.
The percentage of full-time equivalent teachers by gender: November 2010 to November 2016
Disabled school teachers
Schools are asked to provide information on the number of teachers that record themselves as disabled.
However, information on disability was not obtained by schools for 50% of teachers in the November 2016
census. The information provided suggests 0.5 per cent of teachers are disabled, however, this may not
truly reflect the real position given the large amount of missing data.
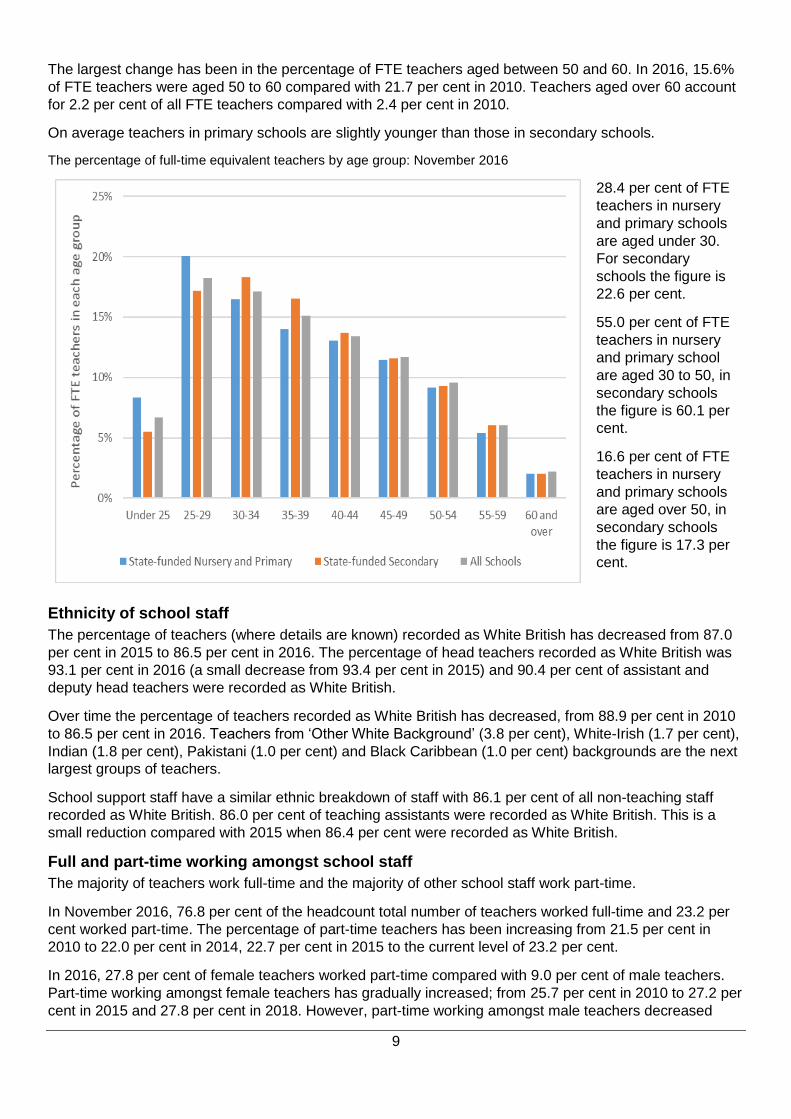
Age of school teachers
Between 2010 and 2016 there have been increases in the number of younger teachers and decreases in the number of older teachers.
The percentage of full-time equivalent teachers by age group: November 2010 to November 2016
24.9 per cent of FTE
teachers are aged
under 30 compared
with 23.0 per cent in
2010.
32.2 per cent of FTE
teachers are aged
between 30 and 40
compared with 30.0
per cent in 2010.
25.1 per cent of FTE
teachers are aged
between 40 and 50
compared with 22.8
per cent in 2010.
0%
5%
10%
15%
20%
25%
30%
35%
2010 2011 2012 2013 2014 2015 2016Per
cen
tage
of
FTE
teac
her
s b
y ag
e gr
ou
p
Under 30 Age 30 to 40 Age 40 to 50 Age 50 to 60 Over 60
9
The largest change has been in the percentage of FTE teachers aged between 50 and 60. In 2016, 15.6%
of FTE teachers were aged 50 to 60 compared with 21.7 per cent in 2010. Teachers aged over 60 account
for 2.2 per cent of all FTE teachers compared with 2.4 per cent in 2010.
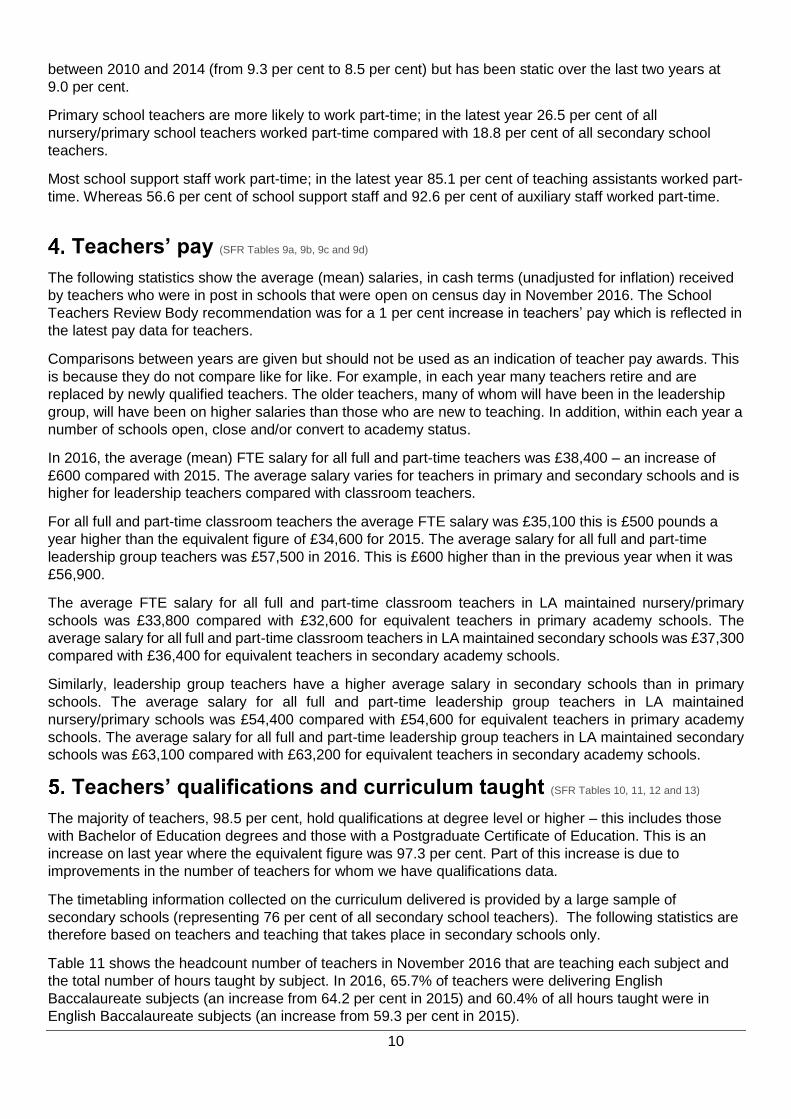
On average teachers in primary schools are slightly younger than those in secondary schools.
The percentage of full-time equivalent teachers by age group: November 2016
28.4 per cent of FTE
teachers in nursery
and primary schools
are aged under 30.
For secondary
schools the figure is
22.6 per cent.
55.0 per cent of FTE
teachers in nursery
and primary school
are aged 30 to 50, in
secondary schools
the figure is 60.1 per
cent.
16.6 per cent of FTE
teachers in nursery
and primary schools
are aged over 50, in
secondary schools
the figure is 17.3 per
cent.
Ethnicity of school staff
The percentage of teachers (where details are known) recorded as White British has decreased from 87.0
per cent in 2015 to 86.5 per cent in 2016. The percentage of head teachers recorded as White British was
93.1 per cent in 2016 (a small decrease from 93.4 per cent in 2015) and 90.4 per cent of assistant and
deputy head teachers were recorded as White British.
Over time the percentage of teachers recorded as White British has decreased, from 88.9 per cent in 2010
to 86.5 per cent in 2016. Teachers from ‘Other White Background’ (3.8 per cent), White-Irish (1.7 per cent),
Indian (1.8 per cent), Pakistani (1.0 per cent) and Black Caribbean (1.0 per cent) backgrounds are the next
largest groups of teachers.
School support staff have a similar ethnic breakdown of staff with 86.1 per cent of all non-teaching staff
recorded as White British. 86.0 per cent of teaching assistants were recorded as White British. This is a
small reduction compared with 2015 when 86.4 per cent were recorded as White British.
Full and part-time working amongst school staff
The majority of teachers work full-time and the majority of other school staff work part-time.
In November 2016, 76.8 per cent of the headcount total number of teachers worked full-time and 23.2 per
cent worked part-time. The percentage of part-time teachers has been increasing from 21.5 per cent in
2010 to 22.0 per cent in 2014, 22.7 per cent in 2015 to the current level of 23.2 per cent.
In 2016, 27.8 per cent of female teachers worked part-time compared with 9.0 per cent of male teachers.
Part-time working amongst female teachers has gradually increased; from 25.7 per cent in 2010 to 27.2 per
cent in 2015 and 27.8 per cent in 2018. However, part-time working amongst male teachers decreased
10
between 2010 and 2014 (from 9.3 per cent to 8.5 per cent) but has been static over the last two years at
9.0 per cent.
Primary school teachers are more likely to work part-time; in the latest year 26.5 per cent of all
nursery/primary school teachers worked part-time compared with 18.8 per cent of all secondary school
teachers.
Most school support staff work part-time; in the latest year 85.1 per cent of teaching assistants worked part-
time. Whereas 56.6 per cent of school support staff and 92.6 per cent of auxiliary staff worked part-time.
Teachers’ pay (SFR Tables 9a, 9b, 9c and 9d)
The following statistics show the average (mean) salaries, in cash terms (unadjusted for inflation) received
by teachers who were in post in schools that were open on census day in November 2016. The School
Teachers Review Body recommendation was for a 1 per cent increase in teachers’ pay which is reflected in
the latest pay data for teachers.
Comparisons between years are given but should not be used as an indication of teacher pay awards. This
is because they do not compare like for like. For example, in each year many teachers retire and are
replaced by newly qualified teachers. The older teachers, many of whom will have been in the leadership
group, will have been on higher salaries than those who are new to teaching. In addition, within each year a
number of schools open, close and/or convert to academy status.
In 2016, the average (mean) FTE salary for all full and part-time teachers was £38,400 – an increase of
£600 compared with 2015. The average salary varies for teachers in primary and secondary schools and is
higher for leadership teachers compared with classroom teachers.
For all full and part-time classroom teachers the average FTE salary was £35,100 this is £500 pounds a
year higher than the equivalent figure of £34,600 for 2015. The average salary for all full and part-time
leadership group teachers was £57,500 in 2016. This is £600 higher than in the previous year when it was
£56,900.
The average FTE salary for all full and part-time classroom teachers in LA maintained nursery/primary
schools was £33,800 compared with £32,600 for equivalent teachers in primary academy schools. The
average salary for all full and part-time classroom teachers in LA maintained secondary schools was £37,300
compared with £36,400 for equivalent teachers in secondary academy schools.
Similarly, leadership group teachers have a higher average salary in secondary schools than in primary
schools. The average salary for all full and part-time leadership group teachers in LA maintained
nursery/primary schools was £54,400 compared with £54,600 for equivalent teachers in primary academy
schools. The average salary for all full and part-time leadership group teachers in LA maintained secondary
schools was £63,100 compared with £63,200 for equivalent teachers in secondary academy schools.
Teachers’ qualifications and curriculum taught (SFR Tables 10, 11, 12 and 13)
The majority of teachers, 98.5 per cent, hold qualifications at degree level or higher – this includes those
with Bachelor of Education degrees and those with a Postgraduate Certificate of Education. This is an
increase on last year where the equivalent figure was 97.3 per cent. Part of this increase is due to
improvements in the number of teachers for whom we have qualifications data.
The timetabling information collected on the curriculum delivered is provided by a large sample of
secondary schools (representing 76 per cent of all secondary school teachers). The following statistics are
therefore based on teachers and teaching that takes place in secondary schools only.
Table 11 shows the headcount number of teachers in November 2016 that are teaching each subject and
the total number of hours taught by subject. In 2016, 65.7% of teachers were delivering English
Baccalaureate subjects (an increase from 64.2 per cent in 2015) and 60.4% of all hours taught were in
English Baccalaureate subjects (an increase from 59.3 per cent in 2015).
11
Where teachers have both timetabling information and qualifications data these can be combined to show
whether teachers have relevant post A level qualifications in the subjects they are teaching. This
information is contained in Table 12. Table 13 shows the percentage of lessons taught by teachers with
relevant post A level qualifications. The tables show the percentage of teachers with relevant qualifications
for the subjects they teach has increased for nearly every subject compared with last year and the
percentage of hours taught by teachers with relevant qualifications for the subjects they teach has also
increased for nearly every subject. However, part of this is due to improvements in the number of teachers
for whom we have qualifications data.
Teacher vacancies (SFR Tables 14 and 15)
In November 2016, there were 920 vacancies for full-time permanent teachers in state-funded schools, a
rate of 0.3 per cent. The teacher vacancy rate remains low and has been around one per cent or below (of
all teaching posts) since 2000.
In addition to these 920 vacancies, a further 3,280 full-time posts (0.9 per cent) were being temporarily
filled by a teacher on a contract of at least one term but less than one year.
Following an upwards trend between 2010 and 2015 there has been a further increase in the percentage of
schools which have at least one advertised vacancy or temporarily-filled post. In 2016, 12.3 per cent of all
schools reported having at least one advertised vacancy or temporarily-filled post on the census day in
November. For primary schools, it rose from 6.9 per cent in 2015 to 8.9 per cent in 2016, and for secondary
schools it rose from 23.0 per cent in 2015 to 27.0 per cent in 2016. For further information, please see
Tables 3.1 and 3.2 of the Local analysis of teacher workforce: 2010 to 2015.
Teacher sickness absence (SFR Table 16)
In the 2015/16 academic year, 54 per cent of teachers in service at any time during the year had at least
one period of sickness absence compared with 56 per cent in 2014/15. For those teachers taking sickness
absence the average number of days lost was 7.5; lower than the 7.6 days lost during the previous year.
In previous years (between 2000 and 2013), the percentage of teachers taking sickness absence has
varied between 55 and 57 per cent. However, the average number of days taken as sickness absence has
been falling slowly; from an average of 9.9 days in 2000 to 7.5 days in 2015/16.
In 2015/16, a total of 2.16 million days were lost to sickness absence, which is lower than in all previous
years (2000 to date). The total number of days lost equates to an average of 4.1 days lost for every
teacher. This is the lowest rate seen over the period from 2000 (calendar year) to 2015/16 academic year.
Pupil teacher ratios (SFR Tables 17a and 17b)
The pupil teacher ratio is derived by combining teacher numbers from the November School Workforce
Census with the pupil numbers from the following January School Census. In 2016, the pupil teacher ratio
was 17.6; this is the number of full-time equivalent pupils for each full-time equivalent teacher working in
state-funded schools in England. The pupil teacher ratio for all schools has increased by 0.2 percentage
points from the 2015 position (17.4) and is higher than the previous three years where it was static at 17.2
(in 2011, 2012 and 2013).
Between 2011 and 2016 the pupil teacher ratio in nursery schools has steadily increased from 16.2 to 19.8.
During the same period there was little change in the pupil teacher ratio in maintained primary schools. It
was 20.5 in both 2011 and 2012 fell to 20.3 in 2014 but then increased again to 20.4 in 2015 and has
returned to 2012 levels – 20.5. The pupil teacher ratio in primary academy schools has remained the same
as the previous year 20.9 in both 2015 and 2016. Across the entire nursery/primary sector, the pupil
teacher ratio is 20.6 – which is 0.1 percentage point higher than the levels in recent previous years.
Within secondary schools there are fewer pupils per teacher than in the nursery/primary school sector – a
pupil teacher ratio of 15.6 compared with 20.6.
12
Between 2011 and 2016 the pupil teacher ratio in all secondary schools has steadily increased from 14.9 to
15.6. During the same period the pupil teacher ratio in maintained secondary schools has fallen from 15.0
in 2011 to 14.8 in 2013 and then risen to 15.4 in 2016. The pupil teacher ratio in secondary academy
schools has increased from 14.8 in 2011 to 15.6 in 2016.
Teacher retirements and out of service teachers (SFR Tables 18 – 23)
The following statistics on teacher retirements and out of service teachers use the administrative data that
is collected as part of the Teachers’ Pension Scheme. Statistics are provided showing the number of
teachers retiring from state-funded schools in England in each financial year and the reason for doing
so. In addition, statistics are provided showing the number of those qualified teachers that currently are not
in service and those with no current recorded service.
The latest data, as at March 31st 2016, shows the total (headcount) number of teachers taking retirement
(throughout the financial year) is 15,200. This is lower than in 2014-15 where the number of teachers
retiring was 17,300 and it continues the downward trend from the peak year of 2011-12 when the number
of teacher retirements was 21,620.
54 per cent of those retiring in 2015-16 did so as they had reach their retirement age, 43 per cent retired
early (some with actuarially reduced benefits) and three per cent retired through ill-health.
The percentage of teachers retiring early has varied between 40 per cent and 45 per cent over the last ten
years. The main change in the trend has been the reduction in those retiring through ill-health. The current
percentage of teachers retiring through ill-health (three per cent) is substantially lower than the historic
figures; where it was 11 per cent in 2004-05 and over 25 per cent throughout the 1990s. Consequently, a
higher percentage of those teachers retiring do so at their relevant retirement age.
The current number of qualified teachers aged under 60 (and not in receipt of a pension from the Teachers’ Pension Scheme) with some previous teaching experience in the education sector in England and were not employed as at March 31st 2015 is 243.9 thousand. These figures may include some teachers who are working outside of the state-funded sector or in education sectors in the other UK countries. Some teachers do return to service in the state-funded sector. In addition, there are currently 104.7 thousand teachers aged under 60 (and not in receipt of a pension from the Teachers’ Pension Scheme) that since qualifying have had no recorded service in a state-funded school. Some maybe in service outside of the state-funded sector or in education sectors in the other UK countries. Some newly qualified teachers with no service will enter service in the future (delayed entry). For example, the latest figures show there are 7.2 thousand teachers that qualified in calendar year 2013 that have no recorded service. The figures published last year for those qualifying in calendar year 2013 showed 10.6 thousand with no recorded service.
13
Accompanying tables
The following tables are all available in Excel format. Table 1 Full-time equivalent teachers and support staff in state-funded schools: 1995, 2000, and 2005 to 2016. Table 2a Headcount of full-time, part-time and full-time equivalent number of teachers in state-funded schools by sector and grade or post, 2010 to 2016. Table 2b Full-time equivalent number of teaching assistants and other support staff in state-funded schools by sector and grade or post, January 1995, 2000, 2005 and 2010, November 2010 to 2016. Table 3a Headcount and full-time equivalent numbers of regular qualified and unqualified teachers and occasional teachers in state-funded schools by qualification status, gender and sector, 2016. Table 3b Headcount and full-time equivalent numbers of teaching assistants and support staff in state-funded schools by qualification status, gender and sector, 2016. Table 4 Full-time equivalent number of regular teachers in state-funded schools by sector, grade, gender and age, 2016. Table 5 Percentages of the headcount of regular teachers in state-funded schools by sector, grade, gender and ethnic origin, 2016. Table 6 Percentages of the headcount of teaching assistants and support staff in state-funded schools by sector, grade, gender and ethnic origin, 2016. Table 7a Qualified teacher entrants and wastage in state-funded schools by sector, gender and full and part-time status (headcounts), March 2005 to 2011, November 2011 to 2016. Table 7b Qualified teacher entrants and wastage in state-funded schools by sector, gender and full and part-time status (FTE), November 2011 to 2016. Table 8 Full and part-time teachers by year of gaining qualified teacher status, who were in service the following year and the percentage recorded in service in state-funded schools in England in each year after. Table 9a Full and part-time regular school teachers in state-funded schools by salary, sector, gender and age, 2016. Table 9b Full and part-time regular classroom teachers in state-funded schools by salary bands, average salary, sector, gender and age, 2016. Table 9c Full and part-time regular leadership teachers in state-funded schools by salary bands, average salary, sector, gender and age, 2016. Table 9d Full and part-time regular head teachers in state-funded schools by salary bands, average salary, sector, gender and age, 2016. Table 10 Headcount of regular teachers in all state-funded schools by phase, grade and highest level of post A level qualification, 2016. Table 11 Headcount of teachers and number of hours taught by subject and key stage to year groups 7-13 in all state-funded secondary schools, 2016.
14
Table 12 Highest post A level qualifications held by state-funded secondary school teachers (headcount) in the subjects they taught to year groups 7-13, 2016. Table 13 Hours taught in a typical week to pupils in years 7 to 13 by highest post A level qualifications of the teacher teaching the lesson, 2016. Table 14 Full-time teacher vacancies temporarily filled posts and rates in state-funded schools by sector and grade, 2000 and 2005 to 2016. Table 15 Full-time classroom teacher vacancies and temporary filled number of posts and rates in state-funded secondary schools by subject, 2010 to 2016. Table 16 Full and part-time teacher sickness absence in state-funded schools, calendar years 2000, 2005 to 2009 and academic years 2009-2010 to 2014-2016. Table 17a Pupil:teacher ratios and pupil:adult ratios in state-funded schools, 2000, 2005 to 2016. Table 17b Pupil:teacher ratios and pupil:adult ratios in academies, 2012 to 2016. Table 18 Teacher retirements from state-funded schools: Type of award by gender and year, 1989-90 to 2014-16. Table 19 Teacher Retirements: Type of award by last known sector of service, grade and gender, 2015/16. Table 20 Retirements from state-funded schools: Type of award by gender and age on retirement, 2015/16. Table 21 Retirements from state-funded schools: Type of award by gender, year of retirement, new and current awards and average benefits awarded: 1998-99 to 2015-16. Table 22 Qualified teachers out of service aged under 60 who were previously in service, by last known sector, calendar year of last service, gender and age, 2015. Table 23 Teachers with qualified teacher status who have never been in service aged under 60, by calendar year qualified, gender and age, 2015.
Further information is available
School, local authority and regional figures.
School level school workforce data is available within the additional tables published alongside this statistical release. The school data contains a range of information for each school following the same themes as set out in this document. It also includes both local authority and regional level summaries. The total number of teachers in schools will not sum to the LA, region or national total. This is because the LA and region totals include those employed directly by LAs and the national totals include estimates for missing schools.
Statistics on teacher retirements and out of service teachers.
The additional tables also include the latest statistics on the number of teachers who have retired from service and those who are out of service. This information is derived from data that is collected as part of the administration of the teachers’ pension scheme.
15
Want previously published figures?
The publications relating to the 2010 to 2015 collections can be found on gov.uk.
Want these figures, related to Performance Tables?
Eight school level school workforce indicators are included as part of each year’s School Performance Tables. The indicators include FTE and headcount statistics for the number of teachers, teaching assistants and school support staff, the average salary of teachers and the pupil teacher ratio.
School level school workforce data from 2016 will be included in the next set of tables to be published at the end of 2017. For the latest School Performance Tables visit gov.uk.
Want data for Wales, Scotland or Northern Ireland?
The School Workforce Census only collects information from schools in England. Education in Wales, Scotland and Northern Ireland is a devolved matter for the Welsh, Scottish and Northern Irish Governments. For information for Wales, Scotland and Northern Ireland, contact the departments below or access their statistics at the following links:
Wales: [email protected] or http://wales.gov.uk/statistics-and-research/schools-census/?skip=1&lang=en
Scotland: [email protected] or http://www.gov.scot/Topics/Statistics/Browse/School-Education
Northern Ireland: [email protected] or http://www.deni.gov.uk/index/facts-and-figures-new/education-statistics.htm
Teacher training statistics.
Statistics on initial teacher training and the annual survey of newly qualified teachers can be found on gov.uk.
National Statistics
The United Kingdom Statistics Authority has designated these statistics as National Statistics, in
accordance with the Statistics and Registration Service Act 2007 and signifying compliance with the Code
of Practice for Official Statistics.
Designation can be broadly interpreted to mean that the statistics:
meet identified user needs;
are well explained and readily accessible;
are produced according to sound methods, and
are managed impartially and objectively in the public interest.
Once statistics have been designated as National Statistics it is a statutory requirement that the Code of
Practice shall continue to be observed.
The Department has a set of statistical policies in line with the Code of Practice for Official Statistics.
16
Technical information
A quality and methodology information document accompanies this SFR. This provides further information
on the data sources, their coverage and quality and explains the methodology used in producing the data,
including how it is validated and processed.
More technical information is available on gov.uk.
Get in touch
Media enquiries
Press Office News Desk, Department for Education, Sanctuary Buildings, Great Smith Street, London
SW1P 3BT.
Tel: 020 7783 8300
Other enquiries/feedback
Neil Ross, Data Outputs Division, Department for Education, 2 St Paul’s Place, Sheffield, S1 2FJ.
Tel: 0114 2742190 Email: [email protected]
© Crown copyright 2016
This publication (not including logos) is licensed under the terms of the
Open Government Licence v3.0 except where otherwise stated. Where
we have identified any third party copyright information you will need to
obtain permission from the copyright holders concerned.
To view this licence:
visit www.nationalarchives.gov.uk/doc/open-government-licence/version/3
email [email protected]
write to Information Policy Team, The National Archives, Kew, London, TW9 4DU
About this publication:
Enquiries: Neil Ross, Data Outputs Division, Department for Education, 2 St Paul’s Place,
Sheffield. Tel: 0114 2742190.
Email: [email protected]
https://www.gov.uk/government/collections/statistics-school-workforce
Reference: [SFR 21/2016]
Follow us on Twitter: @educationgovuk
Like us on Facebook: facebook.com/educationgovuk