Embed Size (px)
Citation preview

SchoolChoice Round 1 Analysis
Spring 2014
Denver Public Schools

Table of Contents
3: Executive Summary
4 – 6: Round 1 Participation
7 – 8: Round 1 Seat Offers
9 – 14: Non-participation
15 – 18: Round 1 Results
19 – 22: School Demand
2

Executive Summary
Summary Participation Seat Offers Non-
participants Results
School Demand
Appendix
3
Participation 22,729 applicants participated in Round 1.
This turnout was slightly lower than 2013, but rates remained stable across transition grades .
Non-
participation
3,154 transition grade-level students did not participate in SchoolChoice and were assigned by default to
their neighborhood boundary school. The FRL qualification and ethnicity of these students is consistent
with the overall DPS student body.
Southwest Denver has the highest concentration of families not participating in SchoolChoice.
Seat Offers
ECE seat offers are limited in supply due to state funding.
With the exception of secondary grade levels in the Far Northeast, the number of seats offered exceeds
the number of applicants in every region in transition grade levels.
Results 94% of Denver residents in transition grade levels (Kinder, 6th and 9th) received one of their preferred
schools. This is within 1% of the 2013 results.

2014 Round 1 Participation
Grade Number of
Participants % of total
EC 4,445 19.6%
Kinder 5,560 24.5%
1st 824 3.6%
2nd 489 2.2%
3rd 471 2.1%
4th 434 1.9%
5th 435 1.9%
6th 4,870 21.4%
7th 537 2.4%
8th 427 1.9%
9th 3,620 15.9%
10th 342 1.5%
11th 188 0.8%
12th 87 0.4%
Grand Total 22,729 100.0%
Total Number of 2014 Participants
Grade # of 2013
Participants
# of 2014
Participants
Year Over
Year Change
%
Change
EC 4,812 4,445 -367 -8%
Kinder 5,859 5,560 -299 -5%
1st 855 824 -31 -4%
2nd 509 489 -20 -4%
3rd 423 471 48 11%
4th 407 434 27 7%
5th 423 435 12 3%
6th 4,703 4,870 167 4%
7th 472 537 65 14%
8th 384 427 43 11%
9th 3,745 3,620 -125 -3%
10th 235 342 107 46%
11th 171 188 17 10%
12th 68 87 19 28%
Grand Total 23,066 22,729 -337 -1%
The Number of 2014 Participants Compared to 2013
62% of Round 1 participants are in transition grade levels (Kinder, 6th and 9th).
There was an increase in the number of 6th grade participants this year compared to 2013 but overall the number of
students who participated in Round 1 this year was slightly lower.
4
Summary Participation Seat Offers Non-
participants Results
School Demand
Appendix
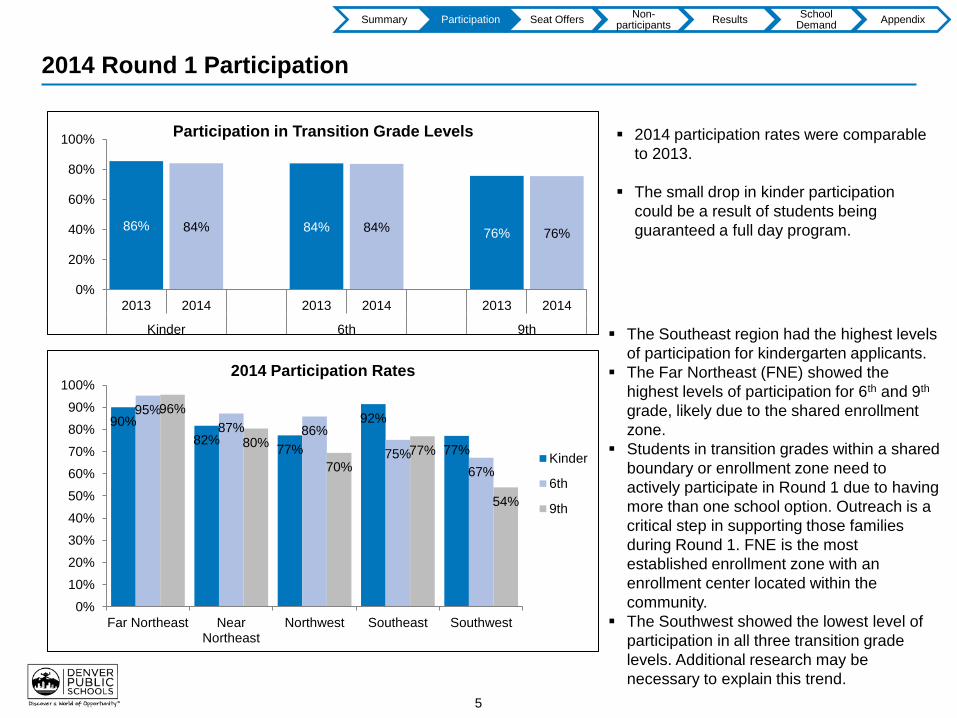
2014 Round 1 Participation
2014 participation rates were comparable
to 2013.
The small drop in kinder participation
could be a result of students being
guaranteed a full day program.
The Southeast region had the highest levels
of participation for kindergarten applicants.
The Far Northeast (FNE) showed the
highest levels of participation for 6th and 9th
grade, likely due to the shared enrollment
zone.
Students in transition grades within a shared
boundary or enrollment zone need to
actively participate in Round 1 due to having
more than one school option. Outreach is a
critical step in supporting those families
during Round 1. FNE is the most
established enrollment zone with an
enrollment center located within the
community.
The Southwest showed the lowest level of
participation in all three transition grade
levels. Additional research may be
necessary to explain this trend.
5
Summary Participation Seat Offers Non-
participants Results
School Demand
Appendix
86% 84% 84% 84% 76% 76%
0%
20%
40%
60%
80%
100%
2013 2014 2013 2014 2013 2014
Kinder 6th 9th
Participation in Transition Grade Levels
90%
82% 77%
92%
77%
95%
87% 86%
75%
67%
96%
80%
70%
77%
54%
0%
10%
20%
30%
40%
50%
60%
70%
80%
90%
100%
Far Northeast NearNortheast
Northwest Southeast Southwest
2014 Participation Rates
Kinder
6th
9th

2014 Round 1 Participation
Half of participating
families submitted only
one or two schools on
their choice form.
There is a 10%-pt. gap
between White
participation and Black
and Hispanic
participation
6
Summary Participation Seat Offers Non-
participants Results
School Demand
Appendix
33%
16%
16%
9%
26%
0%
10%
20%
30%
40%
50%
60%
70%
80%
90%
100%
1 School 2 Schools 3 Schools 4 Schools 5 Schools
The Number of Schools Listed on Each Application
72%
88% 84% 84%
90%
76%
94%
0%
20%
40%
60%
80%
100%
AmericanIndian or
Alaskan Native
Asian Black Hispanic Multi-Racial NativeHawaiian orOther Pacific
Islander
White
Participation Rates By Race/Ethnicity for Transition Grade Levels (Kinder, 6th and 9th)

2014 Round 1 Seat Offers
Grade Seat Offers
2013-2014
Seat Offers
2014-2015 Comparison
EC 4,076 4,370 294
Kinder 6,786 7,026 240
1 1,175 1,029 -146
2 932 839 -93
3 670 921 251
4 756 661 -95
5 837 906 69
6 5,980 5,716 -264
7 857 870 13
8 633 698 65
9 5,674 5,515 -159
10 900 1,148 248
11 817 1,051 234
12 619 834 215
K-12 Total 26,636 27,214 578
EC-12 Total 30,712 31,584 872
Grade Seat Offers
2014-2015
2014-2015 Denver
Applicants
Seat:Applicant
Ratio
EC 4,370 4,287 1.0
Kinder 7,026 5,305 1.3
1 1,029 752 1.4
2 839 435 1.9
3 921 420 2.2
4 661 398 1.7
5 906 399 2.3
6 5,716 4,571 1.3
7 870 440 2.0
8 698 343 2.0
9 5,515 3,344 1.6
10 1,148 298 3.9
11 1,051 141 7.5
12 834 69 12.1
K-12 Total 27,214 16,915 1.6
EC-12 Total 31,584 21,202 1.5
ECE seat offers are limited in supply due to funding.
There was a 3% increase in the number of seats offered in Round 1.
As a whole district the number of seats meets or exceeds the number of Denver resident participants at each grade
The Number of Seats Offered in Round 1 Round 1 Seat offers Compared to Denver Applicants
7
Summary Participation Seat Offers Non-
participants Results
School Demand
Appendix

2014 Round 1 Seat Offers
EC Kinder 6th 9th
Region Seats Applicants
Seat:
Applicant
Ratio
Seats Applicants
Seat:
Applicant
Ratio
Seats Applicants
Seat:
Applicant
Ratio
Seats Applicants
Seat:
Applicant
Ratio
Southeast 796 844 0.9 1,399 1,196 1.2 1,415 1,058 1.3 1,577 890 1.8
Near
Northeast 987 1,027 1.0 1,776 1,320 1.3 1,252 957 1.3 1,107 511 2.2
Southwest 1,007 836 1.2 1,348 1,040 1.3 1,115 517 2.2 1,409 530 2.7
Northwest 969 741 1.3 1,160 760 1.5 928 945 1.0 704 654 1.1
Far
Northeast 611 839 0.7 1,343 989 1.4 1,006 1,094 0.9 718 759 0.9
Grand
Total 4,370 4,287 1.0 7,026 5,305 1.3 5,716 4,571 1.3 5,515 3,344 1.6
The supply of seats in ECE across the district is limited due to the lack of full state funding. ECE applications in the Southeast
and Far Northeast regions exceeded the number of seats offered. These regions are identified in the SRA as needing
additional ECE capacity.
With the exception of Far Northeast secondary grade levels, the number of seats offered exceeded the number of applicants in
kinder 6th and 9th grade in every region. Despite capacity constraints, all students who live in the Far Northeast enrollment zone
are guaranteed a seat to one of the schools within the enrollment zone. Additional MS and HS seats will be available in 2015
and increase capacity.
Round 1 Seat Offers Compared to Denver Applicants Across Each Region
8
Summary Participation Seat Offers Non-
participants Results
School Demand
Appendix

2014 Non-Participants: Kinder
9
Kindergarten students who did not participate in Round 1 and defaulted to
their neighborhood boundary school
Race/Ethnicity % Race/
Ethnicity
Hispanic 62%
Black (Not Hispanic) 21%
White, not Hispanic 11%
Asian 2%
Multiple races 2%
American Indian or
Alaskan Native 1%
Native Hawaiian or
Other Pacific Islander 0%
Grand Total 100%
Non-participation rates among Black and Hispanic families are disproportionately higher than that of White families.
When looking at specific locations of low-participation, SW Denver and NNE Denver have the highest rates.
Summary Participation Seat Offers Non-
participants Results
School Demand
Appendix

2014 Non-Participants: Kinder
10
School Name
% of Round 1
assignments
who were
non-participants
Trevista (K-8) 65%
Columbine Elementary 64%
Barrett Elementary 64%
Smith Renaissance 62%
Fairview Elementary 61%
Cole Arts and Science 61%
Colfax Elementary 59%
CMS Community School 53%
Cheltenham Elementary 50%
Goldrick Elementary 43%
Top 10 Kinder Programs with the Highest Percent of Non-participant Boundary Assignments
Kinder non-participation rates are difficult to determine,
because the only way of identify incoming kinder
students is if they are currently enrolled in an ECE
program in DPS.
Enrollment is an ongoing process and it is likely that
additional kinder students who did not participate in the
SchoolChoice process who were not enrolled in an
ECE program who will continue to show up.
When looking at the schools with the lowest
participation rate, many of them are lower performing
schools.
Summary Participation Seat Offers Non-
participants Results
School Demand
Appendix

2014 Non-Participants: 6th Grade
11
6th grade students who did not participate in Round 1 and defaulted to their
neighborhood boundary school
Race/Ethnicity % Race/
Ethnicity
%
FRL*
Hispanic 68% 88%
Black (Not Hispanic) 11% 93%
White, not Hispanic 14% 47%
Asian 2% 57%
Multiple races 3% 70%
American Indian or
Alaskan Native 2% 73%
Native Hawaiian or
Other Pacific Islander 0% 67%
Grand Total 100% 81%
*FRL qualification is based on non-participants
who were identified in 2013 October Count.
Students enrolled after October 1st, 2013 are
not included.
81% of the 6th grade population who did not participate in Round 1 qualify for free and reduced lunch, roughly 9%-points
higher than the general student population.
Similar to kindergarten, the highest concentration of non-participation is in SW Denver, followed by NNE Denver.
Summary Participation Seat Offers Non-
participants Results
School Demand
Appendix

2014 Non-Participants: 6th Grade
12
School Name
% of Round 1
assignments
who were
non-participants
% of
non-participants
who are
FRL qualified*
% FRL School
Total
Trevista (K-8) 67% 88% 95%
Bruce Randolph MS (6-12) 63% 92% 97%
Kepner MS 60% 91% 97%
Henry World School 47% 84% 84%
Place Bridge Academy (K-8) 45% 80% 95%
Grant Beacon MS 44% 85% 87%
Hill MS 38% 69% 55%
Skinner MS 33% 82% 82%
Hamilton MS 29% 74% 53%
Denver Green School (K-8) 25% 50% 58%
Merrill MS 21% 58% 76%
Grant Ranch (K-8) 20% 100% 56%
Whittier Elementary (K-8) 17% 100% 89%
Morey MS 14% 47% 48%
Non-participant Boundary Assignments for 6th Grade
*FRL qualification is based on non-participants who were identified in 2013 October Count. Students
enrolled after October 1st, 2013 are not included.
Summary Participation Seat Offers Non-
participants Results
School Demand
Appendix

2014 Non-Participants: 9th Grade
13
9th grade students who did not participate in Round 1 and defaulted to their
neighborhood boundary school
Race/Ethnicity % Race/
Ethnicity
%
FRL*
Hispanic 67% 85%
Black (Not Hispanic) 12% 86%
White, not Hispanic 13% 40%
Asian 4% 79%
Multiple races 2% 62%
American Indian or
Alaskan Native 1% 85%
Native Hawaiian or
Other Pacific Islander 1% 57%
Grand Total 100% 78%
*FRL qualification is based on non-participants
who were identified in 2013 October Count.
Students enrolled after October 1st, 2013 are
not included.
The FRL % of non-participants is 5%-points higher than the general student population.
SW Denver has by far the highest non-participation rate in the city, though North HS has the highest %
of students assigned to their school that were non-participants
Summary Participation Seat Offers Non-
participants Results
School Demand
Appendix

2014 Non-Participants: 9th Grade
14
School Name
% of Round 1
assignments
who were
non-participants
% of
non-participants
who are
FRL qualified
% FRL School
Total
North HS 74% 87% 89%
Manual HS 64% 80% 80%
John F. Kennedy HS 57% 71% 72%
Abraham Lincoln HS 52% 88% 95%
Thomas Jefferson HS 34% 64% 56%
George Washington HS 29% 74% 54%
East HS 11% 62% 36%
South HS 9% 65% 72%
Non-participant Boundary Assignments for 9th Grade
*FRL qualification is based on non-participants who were identified in 2013 October Count. Students
enrolled after October 1st, 2013 are not included.
Summary Participation Seat Offers Non-
participants Results
School Demand
Appendix

2014 Round 1 Results
Grade
Level
Preference Selections
1st 1st or 2nd 1st-3rd 1st-4th 1st-5th
EC 71% 79% 83% 85% 86%
Kinder 80% 88% 91% 92% 93%
1st-5th 55% 66% 71% 73% 74%
6th 76% 87% 92% 93% 94%
7th-8th 45% 55% 60% 63% 64%
9th 81% 92% 95% 95% 95%
10th-12th 59% 70% 74% 76% 77%
K-12 Total 73% 83% 87% 88% 89%
EC-12 Total 72% 82% 86% 88% 89%
SchoolChoice Assignment Summary :
Denver Applicants in All Grade Levels
Grade
Level
Preference Selections
1st 1st or 2nd 1st-3rd 1st-4th 1st-5th
Kinder 80% 88% 91% 92% 93%
6th 76% 87% 92% 93% 94%
9th 81% 92% 95% 95% 95%
Total 78% 89% 92% 93% 94%
SchoolChoice Assignment Summary :
Denver Applicants in Transition Grade Levels
78%
11% 3% 1% 1%
0%
10%
20%
30%
40%
50%
60%
70%
80%
90%
100%
1stChoice
2ndChoice
3rdChoice
4thChoice
5thChoice
Round 1 Assignments for Transition Grade Levels
15
94% of Denver participants in transition grade levels
were assigned to one of their preferred schools.
95% of 9th grade Denver participants were assigned
to one of their top three schools.
Overall 89% of Denver participants in EC-12 were
assigned to one of their preferred schools.
Summary Participation Seat Offers Non-
participants Results
School Demand
Appendix

2014 Round 1 Results: Year Over Year Comparison
Grade
Level
Preference Selections
1st 1st or 2nd 1st-3rd 1st-4th 1st-5th
Kinder 80% 89% 92% 94% 95%
6th 78% 90% 94% 95% 95%
9th 80% 91% 94% 95% 96%
Total 80% 90% 93% 94% 95%
2013 SchoolChoice Assignments for Denver Applicants
Grade
Level
Preference Selections
1st 1st or 2nd 1st-3rd 1st-4th 1st-5th
Kinder 80% 88% 91% 92% 93%
6th 76% 87% 92% 93% 94%
9th 81% 92% 95% 95% 95%
Total 78% 89% 92% 93% 94%
2014 SchoolChoice Assignments for Denver Applicants
Grade
Level
Preference Selections
1st 1st or 2nd 1st-3rd 1st-4th 1st-5th
Kinder -0.8% -0.7% -1.0% -1.3% -1.2%
6th -2.3% -3.2% -2.1% -1.6% -1.2%
9th 0.6% 0.6% 0.1% -0.3% -0.2%
Total -1.0% -1.2% -1.1% -1.1% -0.9%
2014 SchoolChoice Assignments Compared to 2013
16
Overall there was a slight decrease in the percent of Denver applicants who were assigned to one of their five
choices.
There was an increase in the number of 6th grade applicants who received one of their preferred schools.
Summary Participation Seat Offers Non-
participants Results
School Demand
Appendix

Results: Participants who did not receive one of their preferred schools
Grade 2013 Unassigned % of Total 2014 Unassigned % of Total Difference
EC 230 5% 117 3% -2%
Kinder 8 <1% 69 1% 1%
1st-5th 49 2% 43 2% 0%
6th 12 <1% 14 <1% 0%
7th-8th 2 <1% 14 2% 2%
9th 3 <1 3 <1% 0%
10th-12th 0 0% 4 1% 1%
K-12 Total 74 0% 147 1% 0%
EC-12 Total 304 1% 264 1% 0%
Only 23 Denver participants in transition grades who made five choice selections did not receive one of their
preferred schools, out of more than 14,000 participants at these grades (less than 1/10 of 1%)
17
Race/Ethnicity % Race/
Ethnicity
White, not Hispanic 46%
Hispanic 30%
Black (Not Hispanic) 11%
Multiple races 7%
Asian 6%
American Indian or Alaskan Native 0%
Grand Total 100%
Summary Participation Seat Offers Non-
participants Results
School Demand
Appendix

Results: Participants who did not receive one of their preferred schools
18
K-12 Participants who listed 5 choices but were not assigned to one of their preferred schools
Summary Participation Seat Offers Non-
participants Results
School Demand
Appendix

School Demand: ECE
School Name Number of students who listed each
school as their 1st preference
2014
Rank
2013
Rank
Stephen Knight Center for Early Ed 239 1 1
Escalante-Biggs Academy 227 2 3
Swigert International School 195 3 2
Academia Ana Marie Sandoval 188 4 4
Pascual LeDoux Academy 178 5 17
Westerly Creek Elementary 140 6 5
Green Valley Ranch 135 7 8
Rocky Mountain Prep 126 8 13
William (Bill) R. Roberts 119 9 10
Lincoln Elementary 119 9 9
Top 10 Requested Programs for 2014-2015:
School Name Total Number of
Seats Offered
Number of seats
available to non-
boundary applicants
Number of
students
waitlisted
Carson Elementary School 20 0 65
Edison Elementary School 28 0 39
Pioneer Charter School 0 0 17
Steck Elementary School 18 1 77
Westerly Creek Elementary 75 5 255
Denver Green School 14 1 43
William (Bill) R. Roberts School 73 6 243
Florida Pitt-Waller ECE-8 School 61 3 121
Isabella Bird Community School 38 2 46
McGlone Elementary School 40 2 35
ECE programs that were the hardest for non-boundary applicants to get into:
19
Summary Participation Seat Offers Non-
participants Results
School Demand
Appendix

School Demand: Kinder
School Name Number of students who listed each
school as their 1st preference
2014
Rank
2013
Rank
Escalante-Biggs Academy 191 1 3
Swigert International 169 2 1
Polaris at Ebert 126 3 5
Denver Language School 117 4 4
Green Valley Ranch 112 5 17
Brown International Academy 105 6 29
Stephen Knight Center for Early Ed 101 7 8
McGlone Elementary 100 8 21
Slavens Elementary 98 9 7
Westerly Creek Elementary 90 10 14
Top 10 Requested Programs for 2014-2015:
School Name Total Number of
Seats Offered
Number of seats
available to non-
boundary applicants
Number of
students
waitlisted
Swigert International School 81 0 150
Force Elementary School 75 0 21
Southmoor Elementary School 44 0 42
Steck Elementary School 41 1 100
Carson Elementary School 50 2 103
Lowry Elementary 67 1 39
Slavens Elementary School 59 3 104
Isabella Bird Community School 72 2 46
Bromwell Elementary School 30 3 66
Asbury Elementary School 44 1 20
Kindergarten programs that were the hardest for non-boundary applicants to get into:
20
Summary Participation Seat Offers Non-
participants Results
School Demand
Appendix

School Demand: 6th Grade
School Name Number of students who listed
each school as their 1st preference
2014
Rank
2013
Rank
McAuliffe International School 350 1 2
DSST: Green Valley Ranch MS 287 2 1
DSST: Stapleton MS 251 3 6
Denver School of Arts MS 220 4 3
STRIVE Prep - Westwood 204 5 5
Hamilton Middle School 194 6 4
DSST: College View MS 169 7 21
Skinner Middle School 154 8 12
DCIS MS 151 9 9
Kunsmiller Creative Arts Academy MS 143 10 16
Top 10 Requested Programs for 2014-2015:
School Name Total Number of
Seats Offered
Number of seats
available to non-
boundary applicants
Number of
students
waitlisted
Denver Language School 0 0 12
Bryant Webster Dual Language (K-8) 0 0 6
Marie L Greenwood Academy (K-8) 77 0 35
Bruce Randolph Middle School (6-12) 156 0 25
Denver Green School (K-8) 8 0 29
DSST: Green Valley Ranch MS 158 1 194
Odyssey Charter School (K-8) 1 1 39
Highline Academy (K-8) 2 2 48
Place Bridge Academy (K-8) 11 1 16
STRIVE Prep – GVR 130 7 88
6th Grade programs that were the hardest for non-boundary applicants to get into:
21
Summary Participation Seat Offers Non-
participants Results
School Demand
Appendix

School Demand: 9th Grade
School Name
Number of students who listed
each school as their 1st
preference
2014
Rank
2013
Rank
East High School 715 1 1
South High School 290 2 2
George Washington High School 242 3 7
STRIVE Prep - SMART Academy 235 4 10
Thomas Jefferson High School 216 5 4
CEC Middle College of Denver 214 6 5
DSST: Green Valley Ranch HS 204 7 3
Abraham Lincoln High School 170 8 7
Martin Luther King, Jr. Early College HS 168 9 9
John F. Kennedy High School 134 10 6
Top 10 Requested Programs for 2014-2015:
School Name
Total Number
of Seats
Offered
Number of seats
available to non-
boundary applicants
Number of
students
waitlisted
Escuela Tlatelolco (6-12) 0 0 2
DSST: Green Valley Ranch HS 14 2 222
DCIS at Montbello HS (6-12) 68 1 34
North High School 304 3 48
Noel Community Arts HS (6-12) 30 1 8
DSST: Stapleton HS 37 37 151
Martin Luther King, Jr. Early College HS (6-12) 204 5 9
DCIS HS (6-12) 32 32 52
CEC Middle College of Denver 130 130 111
STRIVE Prep - SMART Academy 150 150 96
9th Grade programs that were the hardest for non-boundary applicants to get into:
22
Summary Participation Seat Offers Non-
participants Results
School Demand
Appendix

Appendix: Participants who did not receive one of their preferred schools
Grade 2013
Unassigned % of Total
2014
Unassigned % of Total Difference
EC 917 19% 619 14% -5%
Kinder 53 1% 198 4% 3%
1st-5th 399 17% 629 26% 9%
6th 123 3% 149 3% 0%
7th-8th 127 18% 280 36% 17%
9th 105 3% 92 3% 0%
10th-12th 48 13% 119 23% 11%
K-12 Total 855 5% 1467 9% 4%
EC-12 Total 1772 8% 2086 10% 2%
Denver participants who made at least one valid selection and did not
receive one of their preferred schools
23
Race/Ethnicity % Race/
Ethnicity % FRL*
Hispanic 40% 52%
White, not Hispanic 38% 16%
Black (Not Hispanic) 11% 50%
Multiple races 5% 32%
Asian 4% 29%
American Indian or Alaskan Native 0% 44%
Grand Total 100% 36%
36% of the population of students
who listed at least 1 school on the
choice form and did not receive
one of their preferences qualify for
free and reduced lunch.
21% qualify for free and reduced
lunch and are Hispanic.
Summary Participation Seat Offers Non-
participants Results
School Demand
Appendix

Appendix: Participants who did not receive one of their preferred schools
24
EC-12 Participants who listed 5 choices but were not assigned to one of their preferred schools
Summary Participation Seat Offers Non-
participants Results
School Demand
Appendix