Embed Size (px)
Citation preview
8/14/2019 SCHS Report Card 2008
http://slidepdf.com/reader/full/schs-report-card-2008 1/9
Stark County High School 1-088-1000-26-0001
9 10 11 12
tark County High School
13.518.018.3292.712.213.815.4
19.618.118.1
96.899.899.5
2,074,16793.314.94.17.541.10.23.919.919.254.087894.310.62.70.027.40.01.30.60.597.229292.76.62.70.019.50.01.40.00.797.9
oulon, ILLINOIS
RADES :
--------
ate and federal laws require public school districts to release report cards to the public each year.
he 2007/2008 school year is the first time that Limited English Proficient (LEP) students, who would have taken the IMAGE ine past, took either the ISAT or PSAE with accommodations; therefore, any comparisons with previous years' achievementvels for this subgroup and their schools and school districts should be made with appropriate caution.
RACIAL/ETHNIC BACKGROUND AND OTHER INFORMATION
White Black Hispanic
Asian/PacificIslander
NativeAmerican
Low-Income
Rate
Limited-English-
ProficientRate
High Sch.Dropout
Rate
ChronicTruancy
RateMobility
RateAttendance
RateTotal
Enrollment
choolistricttate
Limited-English-proficientstudents are those students eligible for transitional bilingual programs.Mobility rateis based on the number of times students enroll in or leave a school during the school yeChronic truants are students who are absent from school without valid cause for 18 or more of the lasschool days.
w-incomestudents come from families receiving public aid; live intitutions for neglected or delinquent children; are supported in foster homesh public funds; or are eligible to receive free or reduced-price lunches.
STUDENT-TO-STAFF RATIOS
AVERAGE CLASS SIZE(as of the first school day in May)
ARENTAL CONTACT*
1 3 6 8 9 - 12
Pupil-Administrator
Pupil-Certified
Staff
Pupil-Teacher
Secondary
Pupil-Teacher
ElementaryPercent
choolistricttate
K
arental contact includes parent-teacher conferences, parental visits to school, school visits to home, telephone conversations, and written correspondence.
211.6
ILLINOISSCHOOLREPORTCARD
STUDENTS
INSTRUCTIONAL SETTING
tark County CUSD 100
1.02.62.5
2008
Multiracial
/Ethnic
0.00.62.7
7542
tateistrictchool
Grades
chool
tateistrict
Asian/PacificIslander
TotalNumber FemaleMale
NativeAmericanHispanicBlackWhite
EACHER INFORMATION(Full-Time Equivalents)
100.0 0.0 0.0 0.0 0.0 25.2 74.8 6684.9 8.7 4.9 1.3 0.2 22.9 77.1 131,488
8/14/2019 SCHS Report Card 2008
http://slidepdf.com/reader/full/schs-report-card-2008 2/9
Stark County High School 2-088-1000-26-0001
tate
% of Teachers withEmergency or
ProvisionalCredentials
% of Teachers
withMaster's& Above
% of Teachers
withBachelor'sDegrees
% of Classes NotTaught by
Highly QualifiedTeachers
istrict
AverageTeaching
Experience(Years)
chool -- -- --
EACHER INFORMATION( Continued )
18.1 62.2 37.8 1.5 0.012.4 46.7 53.2 0.7 0.7
0.0 0.0
SCHOOL DISTRICT FINANCES
me teacher/administrator data are not collected at the school level.
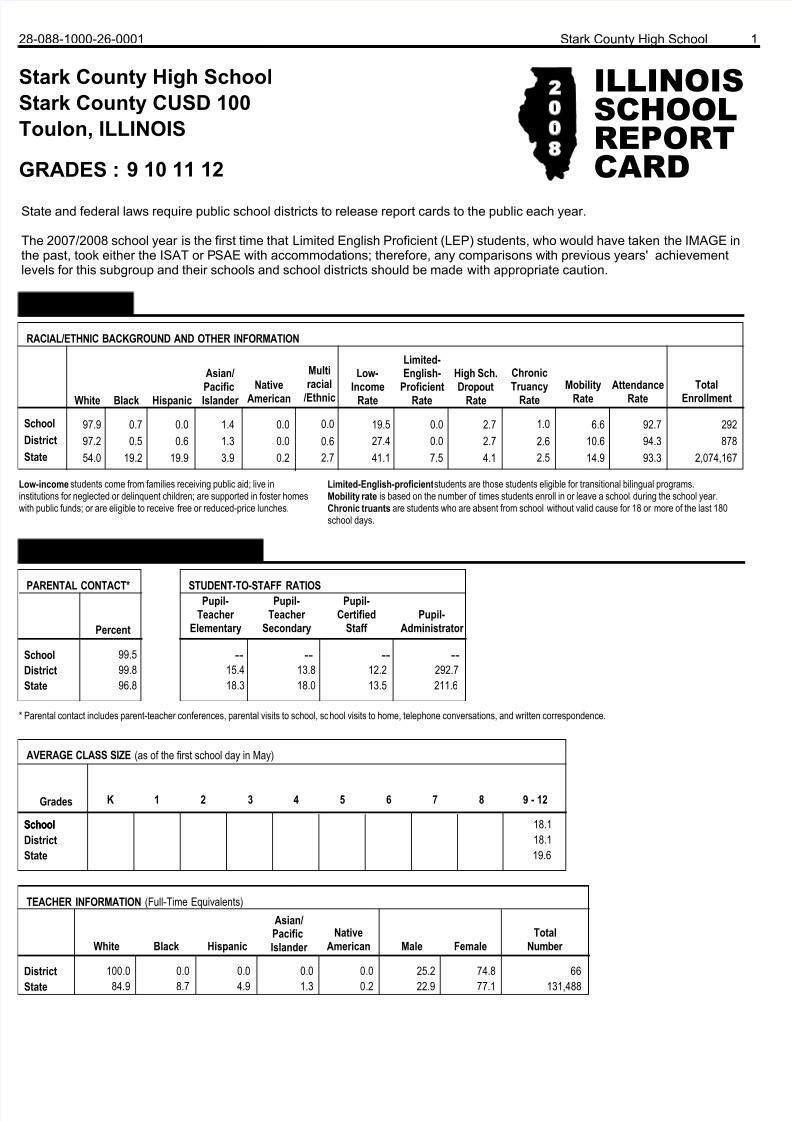
Salaries and counts of staff are summedacross a district based on the percentage of time that each individual is employed as ateacher or an administrator and may or maynot reflect the actual paid salaries for thedistrict.
TEACHER/ADMINISTRATOR SALARIES(Full-Time Equivalents)
Average Teacher Salary Average Administrator Salary
State
District
$0
$40,000
$80,000
$120,000
$160,000
$200,000
$47,642$60,871
$89,291$105,117
EXPENDITURE BY FUNCTION 2006-07(Percentages)
0.0
10.0
20.0
30.0
40.0
50.0
60.0
41.7
47.5
2.0 2.5
24.8
32.4 31.4
17.6
Instruction General Administration
SupportingServices
Other Expenditures
District
State
8/14/2019 SCHS Report Card 2008
http://slidepdf.com/reader/full/schs-report-card-2008 3/9
Stark County High School 3-088-1000-26-0001
EVENUE BY SOURCE 2006-07State %District %District
OTAL
ederal Funding
Other State Funding
General State Aid
Other Local Funding
ocal Property Taxes
State %District %DistrictEXPENDITURE BY FUND 2006-07
TOTALCapital Improvement
Site & Construction/Fire Prevention & Safety
Social SecurityMunicipal Retirement/
RentBond and InterestTransportationOperations & MaintenanceEducation$4,428,280
$839,597
$2,039,496
$681,889
$355,231
$5,559,503$806,040$475,440$552,327
$0
$163,490$1,209,889
$1,165,930$9,932,619
53.1
10.1
24.4
8.2
4.3
$8,344,493
56.08.14.85.60.0
1.612.2
11.7
57.6
7.3
18.1
9.7
7.3
72.68.53.96.70.0
1.80.9
5.6
OTHER FINANCIAL INDICATORS2005 Equalized
Assessed Valuationper Pupil
2006-07 OperatingExpenditure
per Pupil
2006-07 InstructionalExpenditure
per Pupil
tateistrict
Due to the way Illinois school districts are configured, state averages for equalized assessed valuation per pupil and total school tax rate per $100 are not provided.ualized assessed valuation includes all computed property values upon which a district's local tax rate is calculated.tal school tax rate is a district's total tax rate as it appears on local property tax bills.structional expenditure per pupilincludes the direct costs of teaching pupils or the interaction between teachers and pupils.perating expenditure per pupil includes the gross operating cost of a school district excluding summer school, adult education, bond principal retired, and capital expenditures
** **$90,626 5.69
2005 Total SchoolTax Rateper $100
$5,204$5,808
$8,180$9,907
ACADEMIC PERFORMANCE
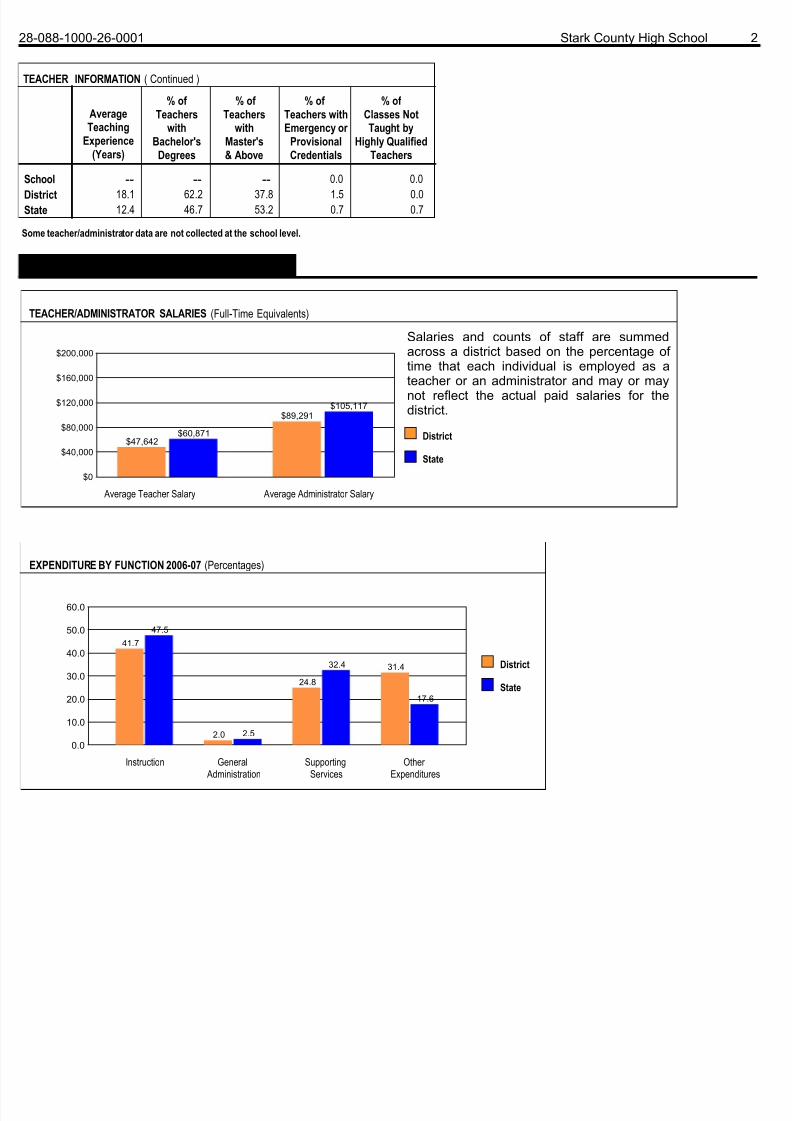
ACT ASSESSMENT: GRADUATING CLASS OF 2008 *
0.0
4.0
8.0
12.0
16.0
20.0
24.0
28.0
32.0
36.0
20.9 20.9 20.5 20.4 20.4 20.1 21.0 21.0 20.6 20.9 20.9 20.4 20.7 20.7 20.3
Composite English Mathematics Reading Science
School District State
* Includes graduating students' most recent ACT Assessment scores from an ACTnational test date or PSAE testing. Excludeshe scores of students who took the test withspecial accommodations. State averages for ACT data are based on regular public schoolsand do not include private and specialpurpose schools.
The number and percent of students takinghe ACT are no longer reported sincevirtually every eleventh grade student takes
he ACT as part of the PSAE.
HIGH SCHOOL GRADUATION RATE
All Male Female
Gender
White Black Hispanic
Asian/PacificIslander
NativeAmerican LEP
Studentswith
Disabilities
Econo-micallyDisad-
vantaged
Race / Ethnicity
Migrant
StateDistrictSchool 78.9 64.5 96.2 78.6 100.0 100.0 100.0
78.9 64.5 96.2 78.6 100.0 100.0 100.086.5 84.2 88.8 92.5 93.4 81.2 78.2
Multiracial
/Ethnic
8/14/2019 SCHS Report Card 2008
http://slidepdf.com/reader/full/schs-report-card-2008 4/9
Stark County High School 4-088-1000-26-0001
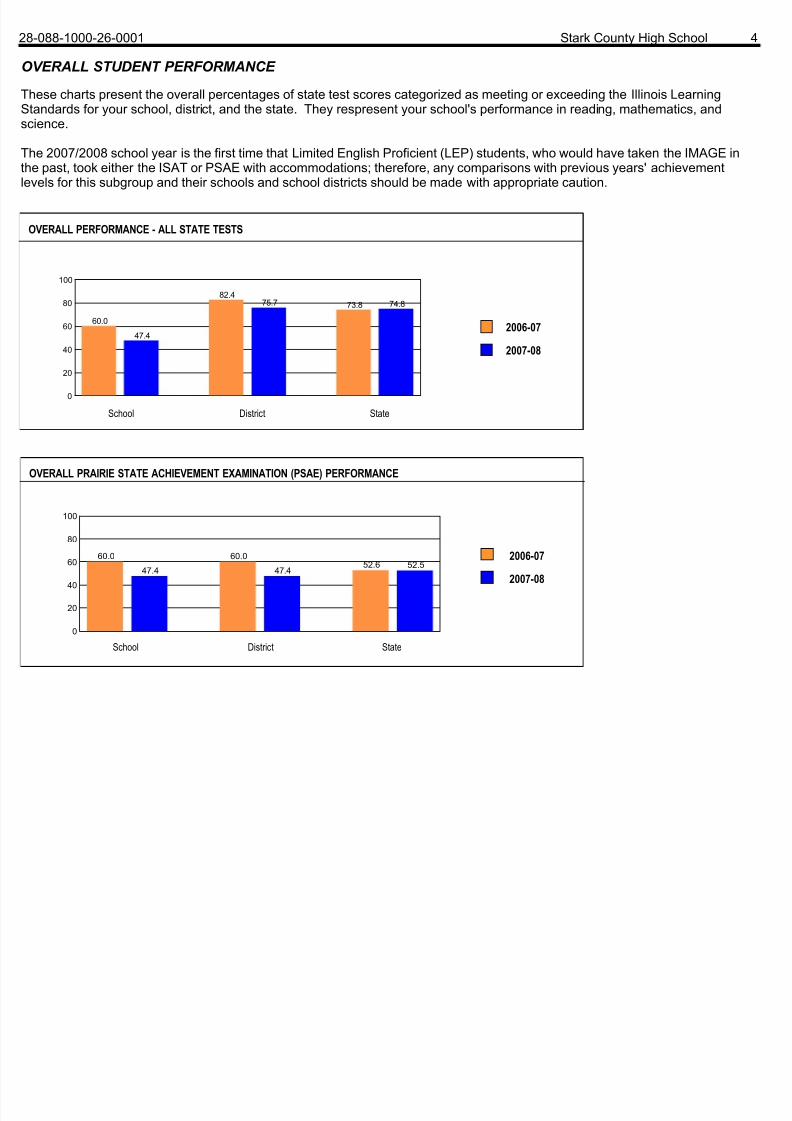
VERALL STUDENT PERFORMANCE
hese charts present the overall percentages of state test scores categorized as meeting or exceeding the Illinois Learningandards for your school, district, and the state. They respresent your school's performance in reading, mathematics, andience.
he 2007/2008 school year is the first time that Limited English Proficient (LEP) students, who would have taken the IMAGE ine past, took either the ISAT or PSAE with accommodations; therefore, any comparisons with previous years' achievementvels for this subgroup and their schools and school districts should be made with appropriate caution.
OVERALL PERFORMANCE - ALL STATE TESTS
0
20
40
60
80
100
60.0
47.4
82.475.7 73.8 74.8
School District State
2006-07
2007-08
OVERALL PRAIRIE STATE ACHIEVEMENT EXAMINATION (PSAE) PERFORMANCE
0
20
40
60
80
100
60.0
47.4
60.0
47.452.6 52.5
2006-07
2007-08
School District State
8/14/2019 SCHS Report Card 2008
http://slidepdf.com/reader/full/schs-report-card-2008 5/9
Stark County High School 5-088-1000-26-0001
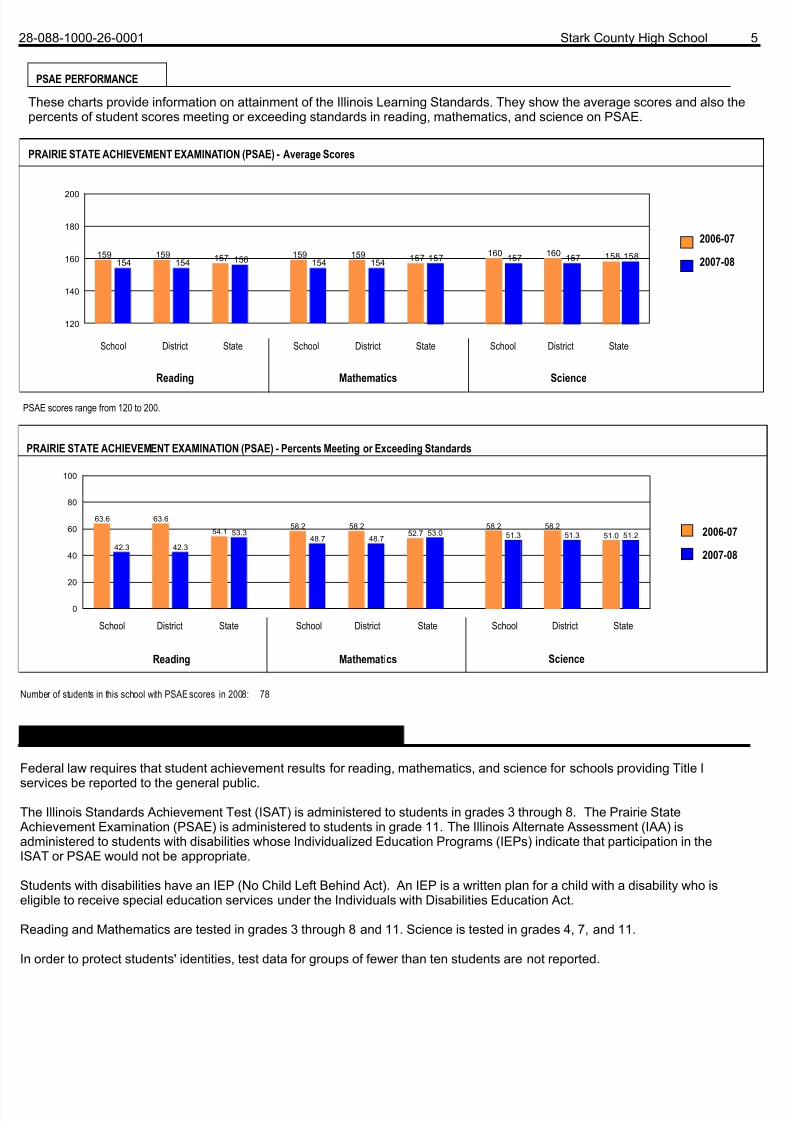
PSAE PERFORMANCE
These charts provide information on attainment of the Illinois Learning Standards. They show the average scores and also thepercents of student scores meeting or exceeding standards in reading, mathematics, and science on PSAE.
PRAIRIE STATE ACHIEVEMENT EXAMINATION (PSAE) - Average Scores
120
140
160
180
200
159154
159154 157 156 159
154159
154 157 157 160 157 160 157 158 158
MathematicsReading
School District State School District State
SAE scores range from 120 to 200.
StateDistrictSchool
Science
2007-08
2006-07
RAIRIE STATE ACHIEVEMENT EXAMINATION (PSAE) - Percents Meeting or Exceeding Standards
Reading Mathematics
School District State School District State
0
20
40
60
80
100
63.6
42.3
63.6
42.3
54.1 53.358.2
48.7
58.2
48.752.7 53.0
58.251.3
58.251.3 51.0 51.2
mber of students in this school with PSAE scores in 2008: 78
2006-07
2007-08
StateDistrictSchool
Science
PERFORMANCE ON STATE ASSESSMENTS
deral law requires that student achievement results for reading, mathematics, and science for schools providing Title I
rvices be reported to the general public.
he Illinois Standards Achievement Test (ISAT) is administered to students in grades 3 through 8. The Prairie Statechievement Examination (PSAE) is administered to students in grade 11. The Illinois Alternate Assessment (IAA) isministered to students with disabilities whose Individualized Education Programs (IEPs) indicate that participation in theAT or PSAE would not be appropriate.
udents with disabilities have an IEP (No Child Left Behind Act). An IEP is a written plan for a child with a disability who isgible to receive special education services under the Individuals with Disabilities Education Act.
ading and Mathematics are tested in grades 3 through 8 and 11. Science is tested in grades 4, 7, and 11.
order to protect students' identities, test data for groups of fewer than ten students are not reported.
8/14/2019 SCHS Report Card 2008
http://slidepdf.com/reader/full/schs-report-card-2008 6/9
Stark County High School 6-088-1000-26-0001
0.20.2
28,936
1
Multiracial
/Ethnic
89
552,428
EconomicallDisadvantage
0.50.5
153,444
0.20.20.6
0.00.0
1
0.00.0
12
0.30.3
459,3
0.30.3
349
0.20.2
71,5921,747
0.10.1
42,677
0.30.3
211,723
0.60.1
584,551 209,802
0.10.20.2
528,334
0.30.3
0.30.3
1,080,912
0.00.0
1484
0.00.0
447
0.00.0
210
0.00.0
243
0.00.0
453
0.00.0
11
0.00.0
78
0.00.0
33
0.00.0
45
0.00.0
78
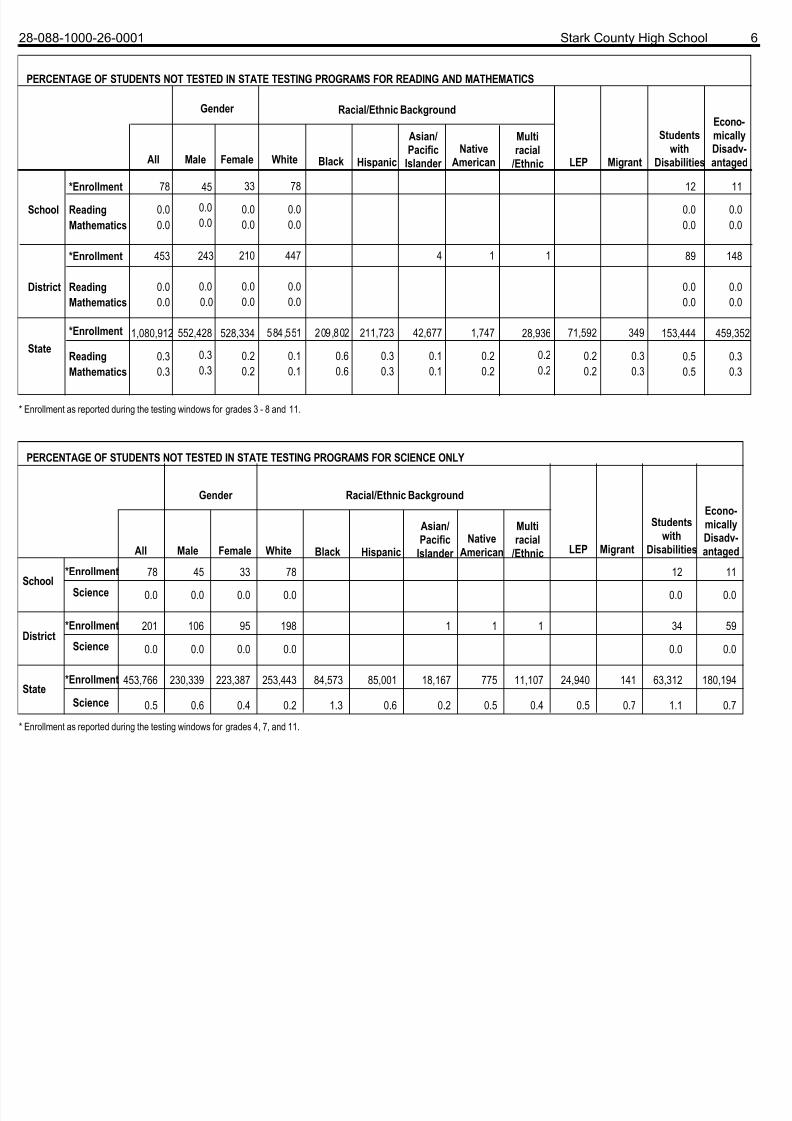
nrollment as reported during the testing windows for grades 3 - 8 and 11.
*Enrollment
*Enrollment
ReadingMathematics
ReadingMathematics
*Enrollment
ReadingMathematics
School
District
State
All
Gender
Male Female
Racial/Ethnic Background
White Black Hispanic
Asian/Pacific
Islander Native
American LEP Migrant
Studentswith
Disabilities
ERCENTAGE OF STUDENTS NOT TESTED IN STATE TESTING PROGRAMS FOR READING AND MATHEMATICS
nrollment as reported during the testing windows for grades 4, 7, and 11.
ERCENTAGE OF STUDENTS NOT TESTED IN STATE TESTING PROGRAMS FOR SCIENCE ONLY
ate
istrict
chool*Enrollment
*Enrollment
*Enrollment
Science
Science
Science
Racial/Ethnic BackgroundGender
FemaleMale
Multiracial
/EthnicNative
American
Asian/Pacific
Islander HispanicBlackWhite
Studentswith
DisabilitiesMigrantLEPAll
Econo-micallyDisadv-antaged
45
106
230,339
78
201
453,766
0.0
0.0
0.5
0.0
0.0
0.6
33
95
223,387
0.0
0.0
0.4
78
198
253,443
0.0
0.0
0.2
84,573
1.3
85,001
0.6
1
18,167
0.2
1
775
0.5
1
11,107
0.4
24,940
0.5
141
0.7
12
34
63,312
0.0
0.0
1.1
11
59
180,194
0.0
0.0
0.7
8/14/2019 SCHS Report Card 2008
http://slidepdf.com/reader/full/schs-report-card-2008 7/9
Stark County High School 7-088-1000-26-0001
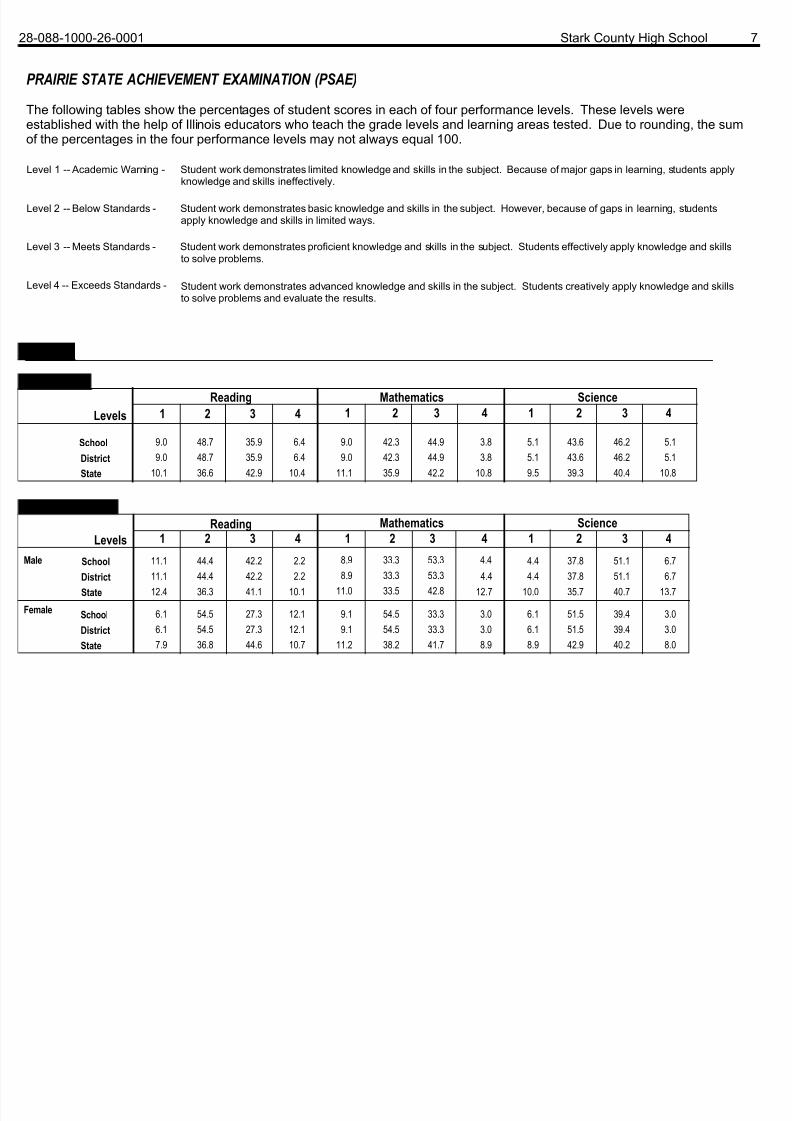
PRAIRIE STATE ACHIEVEMENT EXAMINATION (PSAE)
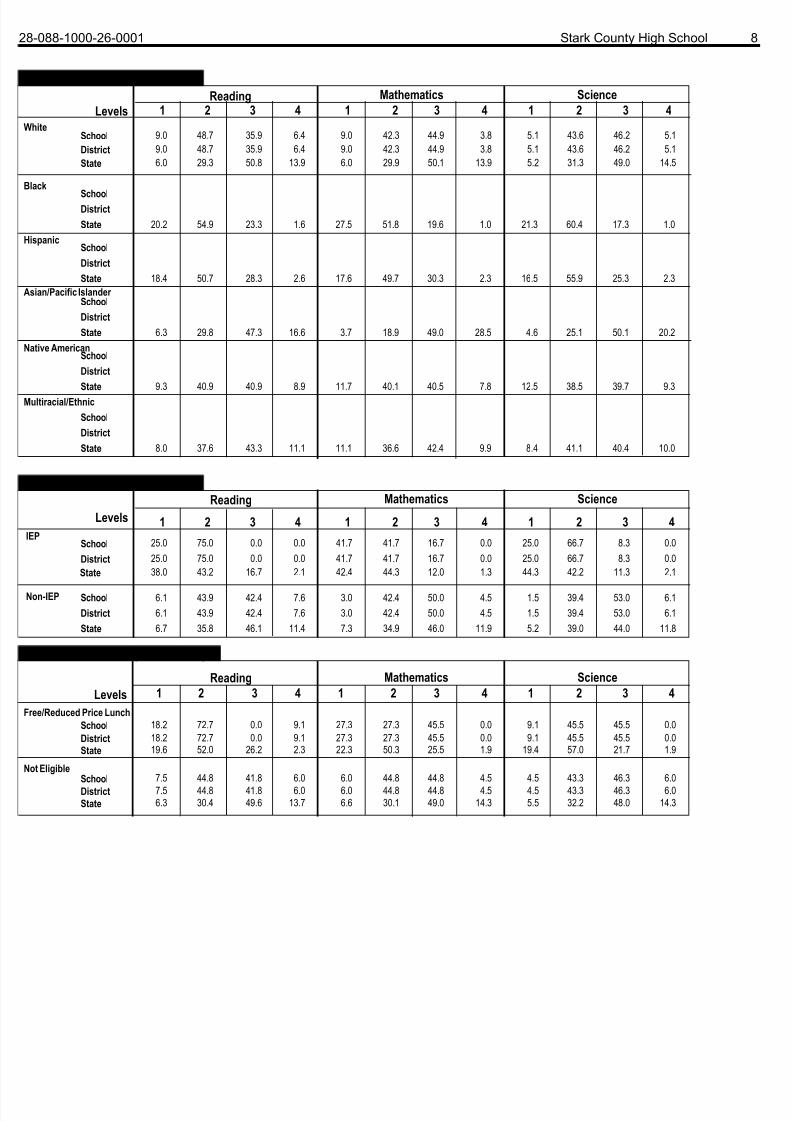
The following tables show the percentages of student scores in each of four performance levels. These levels werestablished with the help of Illinois educators who teach the grade levels and learning areas tested. Due to rounding, the sumf the percentages in the four performance levels may not always equal 100.
evel 1 -- Academic Warning - Student work demonstrates limited knowledge and skills in the subject. Because of major gaps in learning, students applyknowledge and skills ineffectively.
evel 2 -- Below Standards - Student work demonstrates basic knowledge and skills in the subject. However, because of gaps in learning, studentsapply knowledge and skills in limited ways.
evel 3 -- Meets Standards - Student work demonstrates proficient knowledge and skills in the subject. Students effectively apply knowledge and skillsto solve problems.
evel 4 -- Exceeds Standards - Student work demonstrates advanced knowledge and skills in the subject. Students creatively apply knowledge and skillsto solve problems and evaluate the results.
rade 11
ade 11 - All
StateDistrict
Levels 1 2 3 4Reading
School
Science1 2 3 4
Mathematics4321
9.0 48.7 35.9 6.49.0 48.7 35.9 6.4
10.1 36.6 42.9 10.4
9.0 42.3 44.9 3.89.0 42.3 44.9 3.8
11.1 35.9 42.2 10.8
5.1 43.6 46.2 5.15.1 43.6 46.2 5.19.5 39.3 40.4 10.8
emale School
State
District
1 2 3 4Levels
ade 11 - Gender Reading
Schoolale
DistrictState
21 3 4Mathematics
1 2 3 4Science
11.1 44.4 42.2 2.211.1 44.4 42.2 2.2
12.4 36.3 41.1 10.1
8.9 33.3 53.3 4.48.9 33.3 53.3 4.4
11.0 33.5 42.8 12.7
4.4 37.8 51.1 6.74.4 37.8 51.1 6.7
10.0 35.7 40.7 13.7
6.1 54.5 27.3 12.16.1 54.5 27.3 12.17.9 36.8 44.6 10.7
9.1 54.5 33.3 3.09.1 54.5 33.3 3.0
11.2 38.2 41.7 8.9
6.1 51.5 39.4 3.06.1 51.5 39.4 3.08.9 42.9 40.2 8.0
8/14/2019 SCHS Report Card 2008
http://slidepdf.com/reader/full/schs-report-card-2008 8/9
Stark County High School 8-088-1000-26-0001
Schoolultiracial/Ethnic
StateDistrict
Schoolsian/Pacific Islander
StateDistrict
Schoolack
StateDistrict
ade 11 - Racial/Ethnic BackgroundReading
1 2 3 4Levels
SchoolWhite
Schoolispanic
StateDistrict
Schoolative American
StateDistrict
District
Mathematics Science4321 4321
9.0 48.7 35.9 6.49.0 48.7 35.9 6.46.0 29.3 50.8 13.9
9.0 42.3 44.9 3.89.0 42.3 44.9 3.86.0 29.9 50.1 13.9
5.1 43.6 46.2 5.15.1 43.6 46.2 5.15.2 31.3 49.0 14.5
20.2 54.9 23.3 1.6 27.5 51.8 19.6 1.0 21.3 60.4 17.3 1.0
18.4 50.7 28.3 2.6 17.6 49.7 30.3 2.3 16.5 55.9 25.3 2.3
6.3 29.8 47.3 16.6 3.7 18.9 49.0 28.5 4.6 25.1 50.1 20.2
State
9.3 40.9 40.9 8.9 11.7 40.1 40.5 7.8 12.5 38.5 39.7 9.3
8.0 37.6 43.3 11.1 11.1 36.6 42.4 9.9 8.4 41.1 40.4 10.0
Schoolon-IEP
ade 11 - Students with DisabilitiesReading
1 2 3 4LevelsEP
StateDistrict
Mathematics
4321 4321
Science
25.0 75.0 0.0 0.025.0 75.0 0.0 0.038.0 43.2 16.7 2.1
School
StateDistrict
41.7 41.7 16.7 0.041.7 41.7 16.7 0.042.4 44.3 12.0 1.3
25.0 66.7 8.3 0.025.0 66.7 8.3 0.044.3 42.2 11.3 2.1
6.1 43.9 42.4 7.66.1 43.9 42.4 7.66.7 35.8 46.1 11.4
3.0 42.4 50.0 4.53.0 42.4 50.0 4.57.3 34.9 46.0 11.9
1.5 39.4 53.0 6.11.5 39.4 53.0 6.15.2 39.0 44.0 11.8
DistrictState
ot EligibleSchool
ade 11 - Economically Disadvantaged
Reading1 2 3 4Levels
ee/Reduced Price LunchSchool
DistrictState
1Science2 3 4
Mathematics4321
18.2 72.7 0.0 9.118.2 72.7 0.0 9.119.6 52.0 26.2 2.3
27.3 27.3 45.5 0.027.3 27.3 45.5 0.022.3 50.3 25.5 1.9
9.1 45.5 45.5 0.09.1 45.5 45.5 0.0
19.4 57.0 21.7 1.9
7.5 44.8 41.8 6.07.5 44.8 41.8 6.06.3 30.4 49.6 13.7
6.0 44.8 44.8 4.56.0 44.8 44.8 4.56.6 30.1 49.0 14.3
4.5 43.3 46.3 6.04.5 43.3 46.3 6.05.5 32.2 48.0 14.3
8/14/2019 SCHS Report Card 2008
http://slidepdf.com/reader/full/schs-report-card-2008 9/9
Stark County High School 9-088-1000-26-0001
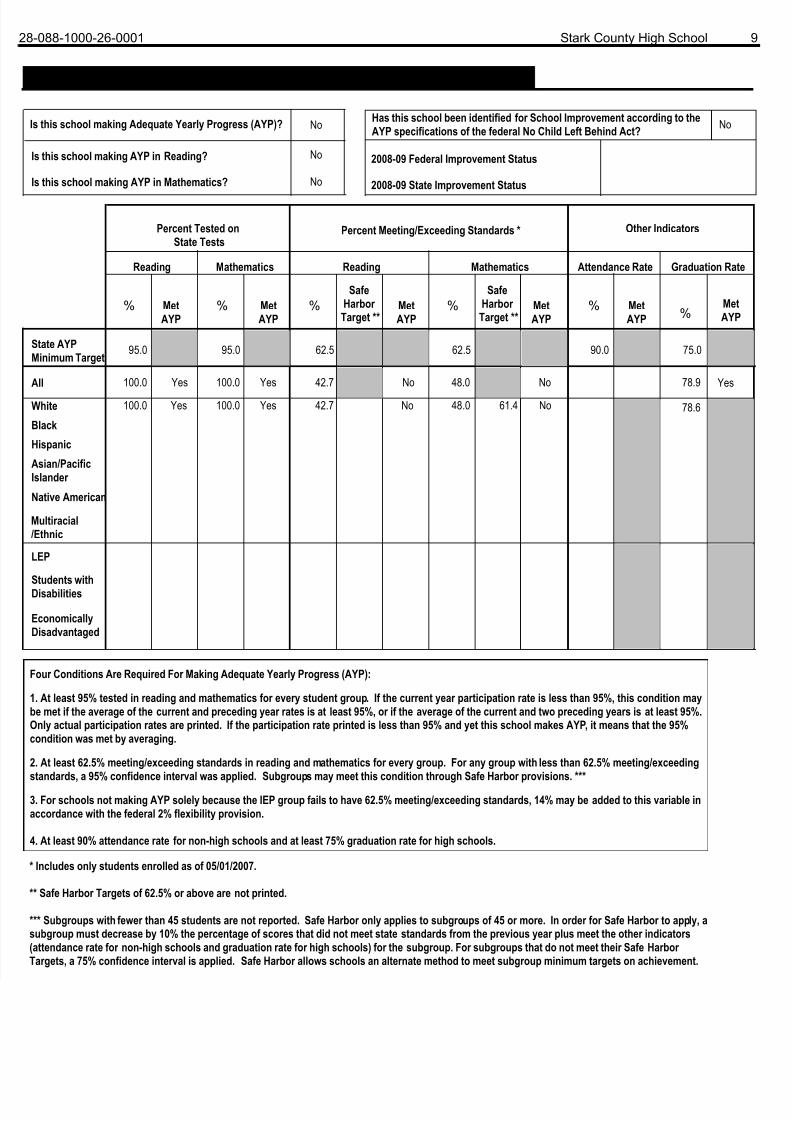
008 ADEQUATE YEARLY PROGRESS (AYP) Status Report
Has this school been identified for School Improvement according to theAYP specifications of the federal No Child Left Behind Act?
SafeHarbor Target **
SafeHarbor Target **
% % % % % %MetAYP
MetAYP
MetAYP
MetAYP
MetAYP
Mathematics MathematicsReadingReading Graduation RatAttendance Rate
Percent Meeting/Exceeding Standards *Percent Tested onState Tests
Other Indicators
MetAYP
State AYPMinimum Target
All
White
Black
Hispanic
Asian/PacificIslander
Native American
100.0
100.0
Yes
Yes
100.0
100.0
Yes
Yes
42.7
42.7
No
No
48.0
48.0 61.4 No
78.9
78.6
Is this school making Adequate Yearly Progress (AYP)?
YesNo
Multiracial/Ethnic
95.0 95.0 62.5 62.5 90.0 75.0
* Includes only students enrolled as of 05/01/2007.
** Safe Harbor Targets of 62.5% or above are not printed.
*** Subgroups with fewer than 45 students are not reported. Safe Harbor only applies to subgroups of 45 or more. In order for Safe Harbor to apply, asubgroup must decrease by 10% the percentage of scores that did not meet state standards from the previous year plus meet the other indicatorsattendance rate for non-high schools and graduation rate for high schools) for the subgroup. For subgroups that do not meet their Safe Harbor
Targets, a 75% confidence interval is applied. Safe Harbor allows schools an alternate method to meet subgroup minimum targets on achievement.
Four Conditions Are Required For Making Adequate Yearly Progress (AYP):
1. At least 95% tested in reading and mathematics for every student group. If the current year participation rate is less than 95%, this condition maybe met if the average of the current and preceding year rates is at least 95%, or if the average of the current and two preceding years is at least 95%.Only actual participation rates are printed. If the participation rate printed is less than 95% and yet this school makes AYP, it means that the 95%condition was met by averaging.
2. At least 62.5% meeting/exceeding standards in reading and mathematics for every group. For any group with less than 62.5% meeting/exceedingstandards, a 95% confidence interval was applied. Subgroups may meet this condition through Safe Harbor provisions. ***
3. For schools not making AYP solely because the IEP group fails to have 62.5% meeting/exceeding standards, 14% may be added to this variable inaccordance with the federal 2% flexibility provision.
4. At least 90% attendance rate for non-high schools and at least 75% graduation rate for high schools.
EconomicallyDisadvantaged
Students withDisabilities
LEP
Is this school making AYP in Reading?
Is this school making AYP in Mathematics?
No
No
No
No
2008-09 State Improvement Status
2008-09 Federal Improvement Status