Embed Size (px)
Citation preview

HCEO WORKING PAPER SERIES
Working Paper
The University of Chicago1126 E. 59th Street Box 107
Chicago IL 60637
www.hceconomics.org

1
First-in-their-family students at university:
Can non-cognitive skills compensate for social origin?
Rebecca Edwards^
University of Sydney
Rachael Gibson
University of Sydney
Colm Harmon
University of Edinburgh & IZA Bonn
Stefanie Schurer
University of Sydney & IZA Bonn
27 March 2021
Abstract: We study the role of non-cognitive skills (NCS) in university readiness and performance of first-in-family students (FIFS) using both nationally representative survey data and linked survey-administrative data on an incoming student cohort at a leading Australian university. In both data sources we find that FIFS enter university with lower cognitive skills (-0.3 SD), but with the same NCS as non-FIFS. FIFS have 0.24 SD lower grade-point averages (GPA) and are up to 50 percent more likely to drop-out after Year 1 than non-FIFS. Yet, FIFS catch up with non-FIFS by the end of Year 2. Conscientiousness, Extraversion, Openness (when adjusting for measurement error with anchoring vignettes), and Locus of Control (when allowing for non-linearities) are predictive of GPA. High levels of Conscientiousness offset FIFS performance penalties; low levels exacerbate them, especially when controlling for measurement error. Our findings accentuate the importance of NCS as facilitator of educational mobility.
Keywords: Non-cognitive skills, university performance, socioeconomic gradient in education, first-in-family, linked survey and administrative data, anchoring vignettes.
JEL Codes: A22, J24
^Corresponding author: Rebecca Edwards. School of Economics, University of Sydney, Sydney, NSW, 2006, Australia. Email: rebecca.edwards[at]sydney.edu.au

2
1. Introduction
Higher education is arguably the single most important facilitator of social and economic mobility
(Breen & Muller 2020, Chetty et al. 2014, Haveman & Smeeding 2006, Blanden, Gregg &
Macmillan 2007, Blanden, Gregg & Machin 2005). However, children from disadvantaged homes
find it harder to pursue higher education opportunities (Jerrim & Vignoles 2015). In OECD
countries, only 1 in 5 adults whose parents did not complete upper secondary education, complete
tertiary education. In contrast, 2 in 3 adults whose parents were university educated, complete
tertiary education (OECD 2018, based on PIAAC data). In some countries, socioeconomic gaps
in university participation have widened in recent years (Page & Scott-Clayton 2016).
In recent decades, universities worldwide have paid heightened attention to the educational
barriers faced by disadvantaged students. Many have taken affirmative action to ensure equal
access opportunities (Bonadies Torres 2020).1 Definitions of disadvantage vary widely, ranging
from general (residential location information) to specific (student is eligible for high school
meals). Some institutions use information on whether an applicant is first-in-their family to attend
university (so-called FIF students or FIFS) (see Adamecz-Völgyi, Henderson & Shure 2020a for
an overview). FIFS status is of particular interest, because the fact that neither parent has university
education means that the student lacks family capital in education and experience with the tertiary
education system. Recently, Adamecz-Völgyi, Henderson & Shure (2020a) validated this marker
in the context of the British tertiary education system. They show that FIFS status is an important
barrier to both university participation and graduation, over and above the influence of standard
measures of disadvantage (e.g. parental income). FIFS are also less likely to study at elite
institutions, are more likely to study high-income generating subjects, and are more likely to drop
out after the first year of studies (Henderson, Shure & Adamecz-Völgyi 2020). For female FIFS,
these constraints also translate into lower wages (Adamecz-Völgyi, Henderson & Shure 2020b).
Outside Britain, little is known about the barriers and academic performance of FIFS.
In this study, we present the first evidence on the university preparedness, academic
performance and drop-out propensities of FIFS in the Australian higher education context. We
answer the following questions. First, are FIFS in Australia less well equipped for university studies
in terms of their cognitive (CS) and non-cognitive skills (NCS) than students from parents with
higher education backgrounds? Second, do FIFS have lower grade point averages (GPA) at
1 Previous literature has studied the impact of affirmative action on the academic performances of all students, concluding that affirmative action policies which admit more disadvantaged students in the US does not negatively affect academic performance (Fisher & Massey, 2007).
3
university?, and if yes, can they be explained by variation in CS and NCS? Third, do CS and NCS
compensate for disadvantage due to social origin?
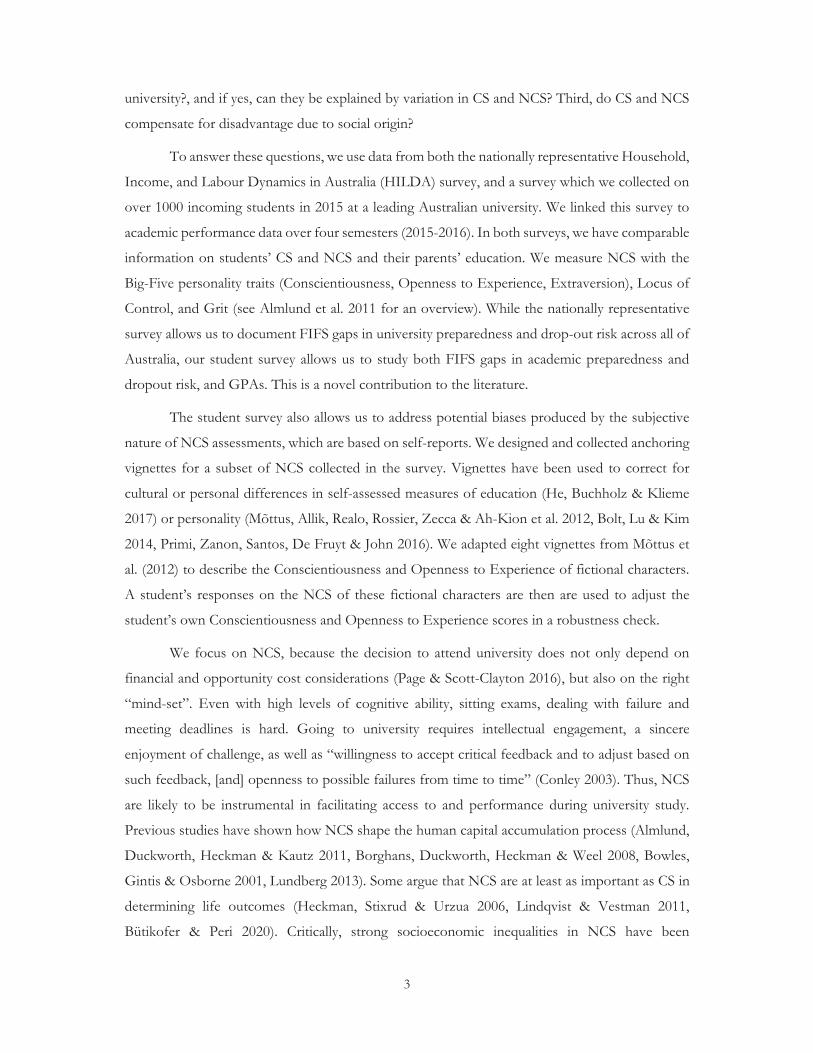
To answer these questions, we use data from both the nationally representative Household,
Income, and Labour Dynamics in Australia (HILDA) survey, and a survey which we collected on
over 1000 incoming students in 2015 at a leading Australian university. We linked this survey to
academic performance data over four semesters (2015-2016). In both surveys, we have comparable
information on students’ CS and NCS and their parents’ education. We measure NCS with the
Big-Five personality traits (Conscientiousness, Openness to Experience, Extraversion), Locus of
Control, and Grit (see Almlund et al. 2011 for an overview). While the nationally representative
survey allows us to document FIFS gaps in university preparedness and drop-out risk across all of
Australia, our student survey allows us to study both FIFS gaps in academic preparedness and
dropout risk, and GPAs. This is a novel contribution to the literature.
The student survey also allows us to address potential biases produced by the subjective
nature of NCS assessments, which are based on self-reports. We designed and collected anchoring
vignettes for a subset of NCS collected in the survey. Vignettes have been used to correct for
cultural or personal differences in self-assessed measures of education (He, Buchholz & Klieme
2017) or personality (Mõttus, Allik, Realo, Rossier, Zecca & Ah-Kion et al. 2012, Bolt, Lu & Kim
2014, Primi, Zanon, Santos, De Fruyt & John 2016). We adapted eight vignettes from Mõttus et
al. (2012) to describe the Conscientiousness and Openness to Experience of fictional characters.
A student’s responses on the NCS of these fictional characters are then are used to adjust the
student’s own Conscientiousness and Openness to Experience scores in a robustness check.
We focus on NCS, because the decision to attend university does not only depend on
financial and opportunity cost considerations (Page & Scott-Clayton 2016), but also on the right
“mind-set”. Even with high levels of cognitive ability, sitting exams, dealing with failure and
meeting deadlines is hard. Going to university requires intellectual engagement, a sincere
enjoyment of challenge, as well as “willingness to accept critical feedback and to adjust based on
such feedback, [and] openness to possible failures from time to time” (Conley 2003). Thus, NCS
are likely to be instrumental in facilitating access to and performance during university study.
Previous studies have shown how NCS shape the human capital accumulation process (Almlund,
Duckworth, Heckman & Kautz 2011, Borghans, Duckworth, Heckman & Weel 2008, Bowles,
Gintis & Osborne 2001, Lundberg 2013). Some argue that NCS are at least as important as CS in
determining life outcomes (Heckman, Stixrud & Urzua 2006, Lindqvist & Vestman 2011,
Bütikofer & Peri 2020). Critically, strong socioeconomic inequalities in NCS have been
4
documented both in childhood (Attanasio, Blundell, Conti & Mason 2020, Elkins & Schurer 2020,
Heckman & Mosso 2014) and adulthood (Gensowski, Goertz & Schurer 2021).
Studying FIFS gaps in university preparedness, performance, and drop-out probabilities in
the Australian education policy context is of great interest to the international debate on how to
successfully widen university participation. Even though Australia has prided itself on being a
country of a ‘fair go’ (Bolton 2003), we observe remarkable inequities in higher education. Youth
from family backgrounds without university education have significantly lower tertiary education
participation rates than youth from households where at least one parent has a university degree.
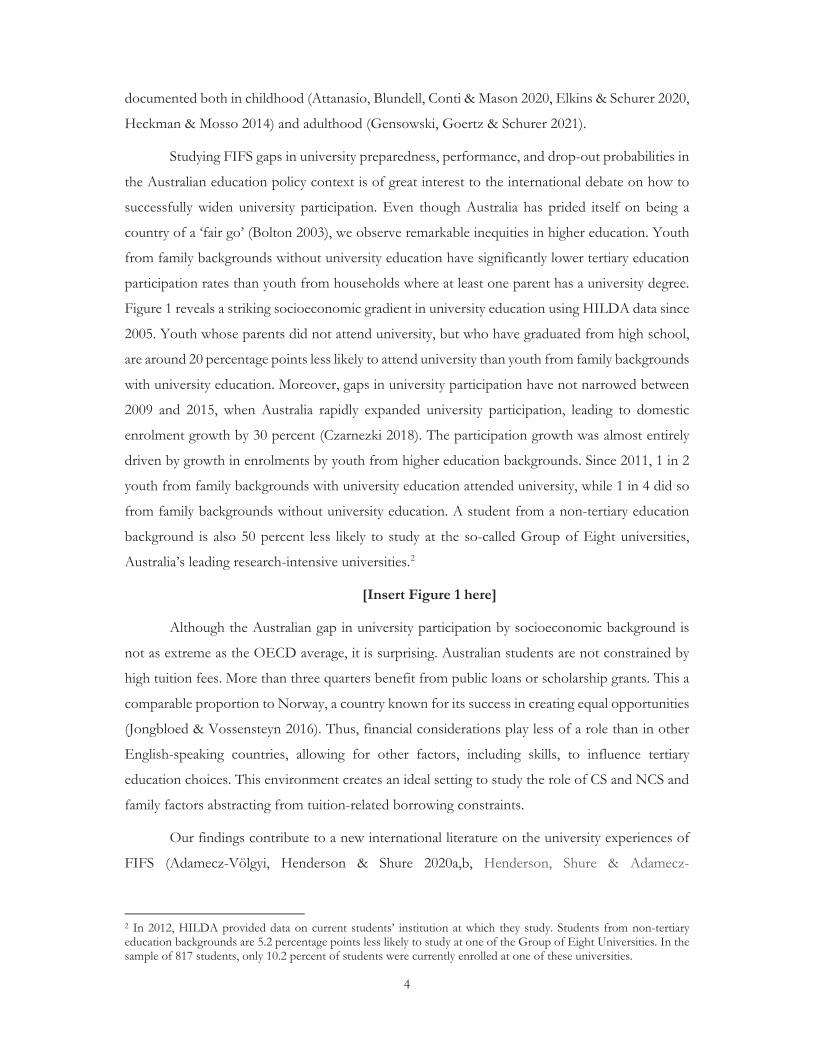
Figure 1 reveals a striking socioeconomic gradient in university education using HILDA data since
2005. Youth whose parents did not attend university, but who have graduated from high school,
are around 20 percentage points less likely to attend university than youth from family backgrounds
with university education. Moreover, gaps in university participation have not narrowed between
2009 and 2015, when Australia rapidly expanded university participation, leading to domestic
enrolment growth by 30 percent (Czarnezki 2018). The participation growth was almost entirely
driven by growth in enrolments by youth from higher education backgrounds. Since 2011, 1 in 2
youth from family backgrounds with university education attended university, while 1 in 4 did so
from family backgrounds without university education. A student from a non-tertiary education
background is also 50 percent less likely to study at the so-called Group of Eight universities,
Australia’s leading research-intensive universities.2
[Insert Figure 1 here]
Although the Australian gap in university participation by socioeconomic background is
not as extreme as the OECD average, it is surprising. Australian students are not constrained by
high tuition fees. More than three quarters benefit from public loans or scholarship grants. This a
comparable proportion to Norway, a country known for its success in creating equal opportunities
(Jongbloed & Vossensteyn 2016). Thus, financial considerations play less of a role than in other
English-speaking countries, allowing for other factors, including skills, to influence tertiary
education choices. This environment creates an ideal setting to study the role of CS and NCS and
family factors abstracting from tuition-related borrowing constraints.
Our findings contribute to a new international literature on the university experiences of
FIFS (Adamecz-Völgyi, Henderson & Shure 2020a,b, Henderson, Shure & Adamecz-
2 In 2012, HILDA provided data on current students’ institution at which they study. Students from non-tertiary education backgrounds are 5.2 percentage points less likely to study at one of the Group of Eight Universities. In the sample of 817 students, only 10.2 percent of students were currently enrolled at one of these universities.

5
Völgyi 2020). We find that FIFS in Australia are not disadvantaged in terms of their pre-university
NCS, but they start university with significantly lower pre-university achievement test scores. This
finding holds for both nationally representative data and for our specific university sample.
Unsurprisingly, we observe in our student survey that FIFS have lower GPAs by about a quarter
of a standard deviation and they experience greater dropout probabilities after Year 1 by between
30 (HILDA data) and 50 percent (our student survey) than non-FIFS. The good news is that the
performance penalty disappears by semester 4. This effect is partly explained by FIFS closing
knowledge gaps over time and not just by selection. This is an important finding, as FIFS with the
lowest semester 1 academic performance are more likely to drop out.
Both pre-study NCS and achievement tests are strong predictors of subsequent academic
performance at university for both FIFS and non-FIFS. Conscientiousness is a particularly
beneficial NCS. High levels of Conscientiousness help compensate for the performance penalty
experienced by FIFS; low levels exacerbate it. Correcting for measurement error in
Conscientiousness using the anchoring vignettes widens the FIFS performance penalty for low
levels of Conscientiousness, while it narrows the FIFS performance premium for high levels.
A key limitation of our study is that some of our findings are based on a selective sample
of university students that is not representative of the overall population, but representative for
students at elite institutions. In our student-survey sample, we have a higher proportion of female
students, and a lower proportion of international students or students from disadvantaged
backgrounds. However, we have some certainty that our findings are not entirely sample specific,
as we find similar FIFS gaps in pre-university CS, and absence of FIFS gaps in NCS (e.g.
Conscientiousness) and comparable Year 1 drop-out rates in both HILDA and our own survey.
We can therefore say that our findings on university preparedness and university attachment of
FIFS are representative for the whole Australian youth population, while our findings on FIFS
gaps in academic performance are valid for university students in the context of elite university
education. We conclude that NCS are a good indicator for university readiness, and they have the
potential to help close socioeconomic gaps in academic performance.
The remainder of this paper proceeds as follows. We present a theoretical framework for
the decision to pursue a university education and an overview of recent literature in Section 2.
Section 3 describes our linked survey and administrative data. In Section 4 we present results on
university preparedness. In Section 5 we present estimation results on academic performance,
subject choice and risk of drop out. In Section 6 we discuss the implications of our findings for
policies that promote upward mobility and conclude.

6
2. Background
2.1. Theoretical framework
Our study focuses on the relationship between socioeconomic status (proxied by First-in-Family
Student status, short FIFS) and academic performance. Specific attention is paid to the role of
cognitive (CS) and non-cognitive skills (NCS) in determining university readiness and
performance, and in moderating the socioeconomic gradient in performance. We assume that
children from disadvantaged backgrounds have higher psychic and opportunity costs of university
education and that these costs are a function of their cognitive and non-cognitive abilities. These
higher costs emerge for FIFS because their parents did not attend university and thus are less well
equipped to prepare their children for and guide them through university life.
A typical model of post-secondary education choice (e) models the decision to attend
university as a function of its net benefits (see Heckman et al. 2006, Carneiro, Hansen & Heckman
2003, Cunha, Heckman & Navarro 2005). Students choose the level of education, which
maximises net benefits : = arg max{ },
where the net benefit of education is: = + + + for = 1, … , .
is a vector of observable characteristics which includes perceived wage returns, perceived costs
including psychic and opportunity costs associated with each level of education, and socio-
demographics. Factor loadings and are associated with cognitive and non-cognitive latent
abilities and respectively, influencing the potential education benefit. Students with high
cognitive and non-cognitive skills will attain a greater net benefit from education, whereby and
may be considered parameters on preferences, technology and endowments of skills and which generate academic outcomes. represents an idiosyncratic error for each level of
education, independent across levels of education and independent of , and .
This model highlights that the socioeconomic gradient in university education could arise from
heterogeneity in both the benefits and the costs, financial and non-financial, of university
education. Of major interest are the psychic costs. Jacob (2002) suggests that NCS are good proxies
for these psychic costs, as they help students to “navigate college life” (Jacob 2002).3 Other studies
3 Jacob (2002) finds that non-cognitive skills affect the gender gap in higher education attendance, where non-cognitive skills are measured by grades and effort in school, student behaviour and if a student had ever been retained in a grade.

7
proxy psychic costs with measures of cognitive ability (Carneiro et al. 2003, Cunha et al. 2005).
The consequence is that students at university are highly selected by their CS and NCS (see
Kassenboehmer, Leung & Schurer 2018). These psychic costs may be greater for students from
disadvantaged backgrounds, because their parents have scarcer resources and information to help
their children with building CS and NCS and making the right educational choices. If it is true that
FIFS have poorer CS and NCS than students from more privileged backgrounds, then the model
would predict that FIFS are less likely to attend university than students from privileged
backgrounds. This assumption can be directly tested.
The model does not speak to the likely performance of FIFS at university. To model academic
achievement, we consider a typical achievement production function (Todd & Wolpin 2007). In
such a model, test scores are a function of past parental investments (proxied by socioeconomic
status or FIFS status), endowments (e.g. CS, NCS and health), and contemporaneous inputs (e.g.
study hours). We will use such a model in the empirical specification in Section 4.2.
2.2. What do we know empirically about FIFS disadvantage in academic performance?
Most of what we know about university preparedness, participation and drop-out rates of FIFS is
based on most recent data from the British (Adamecz-Völgyi, Henderson & Shure 2020a,b,
Henderson, Shure & Adamecz-Völgyi 2020) and US American higher education system (e.g.
Pascarella, Pierson, Wolniak & Terenzini 2004). Three very recent studies by Adamecz-Völgyi,
Henderson & Shure (2020a,b) and Henderson, Shure & Adamecz-Völgyi (2020) use nationally
representative data from the Next Steps – formerly the Longitudinal Study of Young People in
England, LSYPE – which follows a cohort of young people born in 1989/1990. An important
insight from Henderson, Shure & Adamecz-Völgyi (2020) is that FIFS make up almost two thirds
of the English student body, which is attributed to decades of widening participation programs in
the UK. However, the study also finds that FIFS make up only one third of students at the elite
Oxbridge institutions. FIFS are marginally more likely to drop out after the first year of studies
relative to students whose parents have higher education backgrounds. Adamecz-Völgyi,
Henderson & Shure (2020a) show that FIFS status measures more than just socioeconomic
disadvantage, as gradients in participation, subject choice and drop-out rates persist when
controlling for pre-university educational attainment and school fixed effects.4 What is not known
4 It is widely established that FIFS experience greater drop-out rates from university education and are less well prepared than non-FIFS in the US higher education context (see Pascarella, Pierson, Wolniak & Terenzini 2004 for a review of this literature). It is thus not surprising that FIFS in England have higher drop-out rates as well.

8
from these two studies is how FIFS perform at university, but Adamecz-Völgyi, Henderson &
Shure (2020b) demonstrate that for female FIFS, being disadvantaged at university studies persists
long-term: female FIFS earn almost 10 percent lower wages in adulthood.
The only study we found about the academic performance gap of FIFS and their year-to-
year university experiences is Pascarella, Pierson, Wolniak & Terenzini (2004). Using data from
eighteen four-year colleges in the United States, the study finds that FIFS are more likely to engage
in outside employment and to study fewer units. They are less likely to live on the college campus,
to participate in extra-curricular activities or to be accustomed to college expectations (for example,
the importance of deadlines). Despite a lighter academic load, FIFS had significantly lower
cumulative grades than similar students whose parents were both college graduates, although the
authors caution that the magnitude of the gap is relatively small.
The findings on FIFS echo the evidence presented in other studies which document
educational inequalities and mobility, where socioeconomic disadvantage is usually defined by
parental income in the US (e.g. Bloome, Dyer & Zhu 2018) or the UK (Blanden & Macmillan
2016). For instance, Blanden & Macmillan (2016) show that youth with parents who are in the
bottom quintile of the income distribution have an 18 percent probability of enrolment in
university, while youth from the top income quintile are three times more likely (55 percent
probability). There are competing hypotheses for why youth from disadvantaged backgrounds are
less likely to pursue or complete higher education. Some say is it a financial constraint. Students
from disadvantaged backgrounds in Australia are indeed less likely to receive financial support
from their parents (Cobb-Clark & Gørgens 2012). It is thus not surprising that they are more likely
to work outside university which takes time away from study (Walpole 2003, 2008). 5 However,
others question the financial constraints hypothesis, because even in colleges where full tuition
and board subsidies are provided to students, a socioeconomic gradient in academic performance
and dropout is observed (Stinebrickner & Stinebrickner 2003).
Another hypothesis is based on socioeconomic gradients in family social support and
cultural capital. Cheng, Ickes & Verhofstadt (2012) find that family encouragement is a key
predictor of both levels and stability of grade point averages, particularly for female students.
5 The evidence on the link between outside work and academic performance is mixed. Using data from the 1996 Beginning Postsecondary Students Longitudinal Study, Bozick (2007) finds that students from low socioeconomic backgrounds are more likely to engage in outside employment. He estimates that working more than 20 hours per week is associated with a higher incidence of dropping out of college, conditional on sociodemographic characteristics, family obligations, financial aid and state unemployment rates. DeSimone (2008) uses an instrumental variable approach to measure the relationship between employment and academic performance. Using paternal schooling achievement and religion as factors affecting student labour supply but unrelated to academic performance, the study finds an additional work hour each week is associated with a fall in GPA by 0.011 points. In contrast, Dustmann and van Soest (2007) find that employment does not significantly affect performance of full-time students.
9
Doren & Grodsky (2016) show that inequality in parenting skills is likely to explain the
socioeconomic gradient in student academic performance. Walpole (2003) suggests that
differences in cultural capital are responsible for SES gaps in education. “Cultural capital refers to
specialized or insider knowledge which is not taught in schools, such as knowledge of high culture,
and to educational credentials” (Walpole 2003, p. 49).
Another hypothesis is that children from disadvantaged backgrounds are less well prepared
for academic life. Lower levels of pre-university academic achievement (a noisy proxy of cognitive
skills), which is used in many countries to regulate university access, is likely to lead to poorer
academic performance at university. In Australia, universities select students based on a
standardised university admissions test score, the so-called ATAR score (see Section 3.2. for
details). Previous research shows a strong socioeconomic gradient in these ATAR scores (Li &
Dockery 2015). Yet, students from low socioeconomic status backgrounds do not perform worse
at university than students from more privileged schools, holding their past academic achievement
constant. Messinis & Sheehan (2015) show that the socioeconomic gradient of academic
performance holds only for students with low ATAR scores, while students from disadvantaged
backgrounds, but with high ATAR scores, outperform more privileged students.
2.3. Non-cognitive skills and academic performance
Non-cognitive skills (NCS) are today accepted as key predictors of educational attainment and
academic performance, being on par with cognitive skills (e.g. Heckman, Stixrud & Urzua 2006).
NCS encompass a variety of traits, thus it is not surprising that some are more important than
others in shaping educational outcomes. The most important ones mentioned in the literature are
Conscientiousness, one of the Big Five personality traits that captures diligence and hard work;
Internal Locus of Control, which captures an individual’s beliefs about whether she can influence
the important outcomes in their lives; and Grit, which captures an individual’s perseverance, and
motivation to reach a goal and to surpass obstacles (see Almlund et al. 2011 for an overview).
Some suggest that broader measures of childhood social skills (e.g. behavioural issues observed in
school, strengths and difficulties) are equally important predictors of educational attainment
(Blanden, Gregg & MacMillan 2007, Carneiro, Crawford & Goodman 2007). As this is a
burgeoning literature, we restrict ourselves to highlighting some key findings.
Komarraju, Karau, Schmeck & Avdic (2011) find that the Big Five personality traits
combined explain 14 percent of the variance in grade point averages. Conscientiousness, frequently
credited as a super-trait (Roberts, Lejuez, Krueger, Richards & Hill 2014), is highly predictive of

10
academic achievement both in high school (Noftle & Robins 2007) and at university (Chamorro-
Premuzic & Furnham 2003, Kappe & van der Flier 2012, Trapmann, Hell, Hirn & Schuler 2007).
Delaney, Harmon & Ryan (2013) find that Conscientiousness predicts undergraduate study
behaviours, including lecture attendance and extra study hours which are important inputs in the
test score production function. Some consider Conscientiousness more powerful in predicting
grade point averages than intelligence (Kappe & van der Flier 2012).
Internal locus of control has been shown to predict grade point averages both among
school children (Multon, Brown & Lent 1991) and college students (Richardson, Abraham & Bond
2012). Multon, Brown & Lent (1991) find that variations in Internal Locus of Control explain
approximately 14 percent of the variance in academic performance. Duckworth, Peterson,
Matthews & Kelly (2007) find that Grit explains 4 percent of the variance in long-term outcomes
such as educational attainment among adults, university marks among students in elite universities,
performance in military school, and performance in spelling bees. This study also shows that
perseverance is not related to cognitive skills.
Duncan et al. (2007) focuses on school readiness measured at school entry and later
educational achievement, using data from six longitudinal studies of children that cover the UK,
the US, and Canada. They find that the best predictors of educational achievement at school entry
are math and reading scores, and attention skills, while other measures of socio-emotional
behaviours at school entry had limited power in explaining educational success. Importantly, the
results hold true equally for children with high levels of behavioural problems, boys and girls and
for children from different socioeconomic groups, making this finding of general interest.
Finally, CS and NCS may produce better educational outcomes in an interactive way.
Carneiro, Crawford & Goodman (2007) show that a primary school student with high levels of
both social skills and cognitive skills is much more likely to stay in school beyond age 16 than a
student with high cognitive but low social skills. This study also suggests that social skills, which
are related to intra-familial relationships, number of siblings and the interest of the mother in her
child’s education, are potentially more malleable than cognitive skills.
2.4. Contribution of this study
We contribute to the literature in various ways. We explicitly study preparedness for and academic
performance at university for students from highly disadvantaged backgrounds. Although we are
not the first to study university experiences of first-in-family students (see Adamecz-Völgyi,
Henderson & Shure 2020a for a recent discussion in economics, and Pascarella et al. 2004 for an

11
overview in educational studies), we are the first to systematically study the link between CS and
NCS endowments and academic performance for FIFS. We contribute to the literature by
documenting potential gaps in the context of a country with de-facto universal access to tertiary
education, a national identity built on equity, and recent political attempts to broaden higher
education participation. This is an important contribution, because most studies on socioeconomic
barriers to higher education are from countries where socioeconomic disadvantage is considered
a bigger barrier to educational mobility than in Australia. Finally, we are also the first to adjust for
measurement error in the self-reports of NCS using anchoring vignettes of fictional characters.
3. Data
3.1. Linked Survey and Administrative Data
We use unique data from a survey which we fielded at a leading Australian university in the first
week of study in 2015. The survey was advertised widely across campus and participating students
had to give their permission to link their survey and administrative data. Selection and external
validity concerns are of course problems that plague every university cohort study (e.g.
Stinebrickner and Stinebrickner 2003). We provide a detailed description of the survey, linkage
and sample selection in Appendix B. In our case, 98 percent of survey respondents agreed to have
their records linked. In the survey, we collected information on students’ socioeconomic status
such as both parents’ education, and important family determinants of the decision to pursue
university education (financial support, encouragement, role models) and NCS measures.
We linked survey responses to administrative student record data, which includes
information on four semesters of students’ grade point averages (2015-2016), university records
on parental socioeconomic status, and proxies for pre-university cognitive skills (standardised
university admissions test scores, the so-called ATAR). In total, 1,010 students started the survey.
Of these, 851 gave permission to link the survey to administrative records and provided a student
identification code to use to conduct the linkage. Of these, 820 provided correct linkage key
information, so that the linkage could be conducted. Of these, 733 at least partially completed the
survey, which made them eligible for entering the draw of a prize lottery which we offered.
We dropped students who were enrolled in postgraduate studies (34 individuals), students
who were 35 years of age or older (9 individuals), and students with missing information on their
NCS (24 individuals). Some students did not have information on other relevant characteristics.
The final estimation sample is 641 students, aged 17-34 who were enrolled in semester 1 of a
Bachelor degree in March 2015. Although around 13 percent of the full available sample dropped

12
out from their studies after Year 1 (106 out of 820 individuals), which is consistent with the general
student population in Australia (Table 2), only 5.6 percent of our estimation sample dropped out.
3.2. Definitions and summary statistics
3.2.1. Socioeconomic disadvantage
We define a first-in-family student (FIFS) as coming from a home where both parents have at
most graduated from high school. Similar definitions have been used in the previous literature (e.g.
Adamecz-Völgyi, Henderson & Shure 2020a, b; Pascarella et al. 2004) and are often used by
universities to grant access to tertiary education for disadvantaged children as part of so-called
‘Widening Participation’ programs (O’Shea et al. 2017). This is our primary and preferred measure
of socioeconomic status, as parents’ education level may act as a proxy for family wealth while also
encompassing family attitudes towards learning, parental skills and familiarity with the university
system. Of the sample, 27 percent of students are FIFS.
We also use the official university definition of low socioeconomic status (SES), which is
based on the student’s place of residence (postcode) upon enrolment. In line with the Universities
Admission Centre (UAC), we flag a student as disadvantaged if he or she lived in the bottom 25
percent of areas, as ranked by the Socio-Economic Indexes for Areas (SEIFA).6 The university
administrative data indicates 5.2 percent of our student sample is of ‘Low SES’.
[TABLE 1 ABOUT HERE]
3.2.2. Non-cognitive skills and anchoring vignettes
To deal with measurement error in NCS self-assessments, we collected anchoring vignettes on
Conscientiousness and Openness to Experience. Each vignette is a short description of a fictional
character with a specific NCS profile. Survey participants were asked to rate the fictional character
using the same personality inventory and scales used to rate their own NCS (Online Appendix C).
The anchoring vignettes are used to purge individual-specific fixed effects from self-assessments.
To do so, we use a fixed effects model where the NCS measure is the outcome variable, controlling
for the type of personality trait, for example, Openness to Experience, and dummy variables for
6 SEIFA is a product developed by the Australian Bureau of Statistics (ABS) that ranks areas in Australia according to relative socio-economic advantage and disadvantage using information from the National Census collected every five years. https://www.abs.gov.au/websitedbs/censushome.nsf/home/seifa

13
one’s own assessment, the vignette name, the gender of the vignette, own gender and age, and a
fixed effect. This is feasible because we varied both the gender and vignette type across the
fictional characters (Table C2, Online Appendix). The unadjusted and adjusted NCS distributions
are similar but differ at the extreme ends of each NCS assessment (Figure C1, Online Appendix).
3.2.3. Cognitive skills
Cognitive skills are assessed by students’ university admissions test score, the Australian Tertiary
Admission Rank (ATAR), which provides a measure of a student’s overall academic achievement
at high school (Universities Admissions Centre 2017). The ATAR is the main criteria by which a
student is accepted into universities in Australia. Available for 72 percent of the students in the
sample, the average ATAR score was 89.0 with a standard deviation of 8.2.
3.2.4. Academic achievement
Students’ academic performance at university was tracked through their first four semesters, from
semester 1 in 2015 to the end of semester 2 in 2016. Our primary outcome measure for academic
performance is the student’s grade point average by semester, referred to in our administrative
data as the student’s weighted average mark (WAM). The average WAM was 66.4 (out of 100)
with a standard deviation of 16.9 (Table 2).
3.2.5. Other covariates
Table 2 shows summary statistics of covariates for our estimation sample. The average age of
students is just under 19 years, with a range between 17 and 34. About 10 percent of students are
over 20 years of age. Slightly more than two thirds of our sample is female. About two thirds of
students in our sample live with their parents or receive financial support. For those who receive
financial support, the average amount is $700 per month. Almost 90 percent were encouraged by
their parents to study at university. One in three students came from a public high school, while
fewer than one in four came from an independent private school. About 12 percent are
international students. One in four was treated for anxiety at least once in his or her life.
3.3. Representativeness of our sample
In comparison to nationally representative data (Table 2, column (5)), our surveyed students are
more likely to be married (0.04 vs 0.02), diagnosed with anxiety (0.26 vs 0.14), and living at home
(0.68 vs 0.51). They have higher ATAR scores than the normalised national average (89 vs 70), but
almost identical to the average ATAR score of the top three universities in Australia, (87.1). The
students in our sample are less likely to be international students (0.11 vs 0.25), of low

14
socioeconomic status (0.05 vs 0.14), to be FIFS (0.27 vs 0.54), and to have graduated from a public
high school (0.35 vs 0.51). Given the academic selectivity of the university at which the survey was
fielded, this is not surprising.
[TABLE 2 ABOUT HERE]
4. Do first-in-family students start university life with disadvantage?
4.1. Evidence from the student survey
FIFS differ markedly from students who were not first-in-their-family to attend university (Table
3). They are significantly older by almost 11 months, on average. FIFS are also three times more
likely to come from a residential area with higher levels of socioeconomic disadvantage (9.4 vs 3.4
percent ‘Low SES’), and a third less likely to come from a high SES neighbourhood (35.0 vs 57.5
percent ‘High SES’). They are also significantly less likely to have receive parental financial support
(56.5 vs. 69.0 percent) and encouragement (83.1 vs 88.8 percent) to attend university. Non-FIFS
(A$694) receive A$91 more than FIFS (A$603) in financial support per month, although the
difference is statistically insignificant. Nevertheless, FIFS do not differ from non-FIFS in their
likelihood to have ever been treated for anxiety (26.0 vs 25.9), to live at home (67.9 vs 65.0), and
of not engaging in outside work (50.3 vs 53.0).
[TABLE 3 ABOUT HERE]
Figure 2(a) shows that FIFS start university with significantly lower ATAR scores (86.8) than non-
FIFS (89.9), with a mean difference of almost 3 points. The whole ATAR score distribution is
significantly shifted to the left for FIFS relative to non-FIFS (p-value<0.001, Kolmogorov
Smirnov (KS) test). Even larger ATAR score gaps emerge when using the official university
definition for socioeconomic disadvantage (Figure 2(b)). Students who resided in ‘Low SES’
postcodes upon enrolment had an average ATAR score of 84.9, students from ‘Medium SES’
postcodes had an average of 87.4, and students from ‘high SES’ postcodes had an average ATAR
score of 90.5. ATAR gaps between ‘High’ and ‘Low SES’ postcode groups of 5.5 are likely to be
the consequence of postcode differences in high school quality.7
[FIGURE 2 ABOUT HERE]
7 Some argue that differences in ATAR scores are postcode specific and thus university admission may as well be organised by postcode as argued by Dr Claire Brown in The Conversation (2013). Retrieved on 11 March 2021, https://theconversation.com/atars-you-may-as-well-use-postcodes-for-university-admissions-19154.

15
Figures 3(a) and 3(b) show that the socioeconomic gradients in NCS are less pronounced than for
cognitive skills. Although the distributions of most NCS for FIFS (or students from ‘Low SES’
postcodes) generally lie to the left of that for non-FIFS students (or students from ‘High SES’
backgrounds) – with the exception of Conscientiousness -- mean scores do not differ markedly.
We suggest that this is preliminary evidence that socioeconomically disadvantaged students are not
disadvantaged in their NCS upon enrolment to university.
[FIGURE 3 ABOUT HERE]
These conclusions do not change even when controlling for differences in observable
characteristics between FIFS and non-FIFS (Table 4, column (1)).8 There are no statistically
significant FIFS penalties in NCS once controlling for differences in observable characteristics.
FIFS score around 0.05 SD higher on Conscientiousness and 0.09 SD lower on Openness to
Experience, 0.12 SD lower on Extraversion, 0.11 SD lower on Internality, and 0.07 SD lower on
Grit, but the gaps are not statistically significant at the 10 percent level. This conclusion does not
change for Conscientiousness or Openness to Experience when controlling for reporting
heterogeneity with anchoring vignettes, although the estimated FIFS penalty in Openness to
Experience is larger in magnitude, moving from 0.09 SD to 0.11 SD (Table C3, Online Appendix).
The ATAR penalty for FIFS is 0.25 SD and is statistically significant (p-value < 0.01). A similar
conclusion is drawn when defining socioeconomic disadvantage with postcode of residence, with
a markedly larger gradient in ATAR scores. Students from ‘High SES’ postcodes score 0.32 SD
above students from ‘Medium SES’ postcodes, while students from ‘Low SES’ postcodes score
0.20 SD lower. Thus, the gap between students from ‘High SES’ and ‘Low SES’ postcodes is over
0.50 SD (see Table 4, columns (3) and (4)).
4.2. Evidence from nationally representative data
We also obtain similar findings using nationally representative data on young Australians sourced
from the Household, Income and Labour Dynamics Survey (HILDA), in which we have the same
NCS measures available (except for Grit) and a comparable measure of first-in-family status.
HILDA does not collect ATAR scores, but a general measure of cognitive skills that is constructed
8 All models control for gender, age category dummy variables, international student status, whether the student is living at home and whether the student is financially supported by the parents, and a dummy variable for whether the student has ever been diagnosed with anxiety. In the regressions with a non-cognitive skill as the dependent variable, we include the ATAR score as an additional covariate. In the regressions with cognitive skill as outcome variable, we include non-cognitive skills as additional control variables. The conclusions are also not sensitive to controlling furthermore for parental encouragement living with parents, hand used for writing, school type. Provided upon request.

16
as a weighted average of test scores on short-term memory, executive function and language ability
(see Wooden 2013).9
We find a statistically significant FIFS penalty in cognitive skills in the HILDA survey (0.30
SD), but no significant FIFS penalties in NCS (with the exception of Openness to Experience).
Importantly, the estimated coefficients are similar between the two data sources. For instance, in
the HILDA survey we find that FIFS score 0.06 SD higher on Conscientiousness, while in our
survey data they score 0.05 SD higher (although in both surveys the estimates are not statistically
significant). The FIFS penalty for Openness to Experience is -0.11 SD in our student survey when
adjusting for reporting heterogeneity, and -0.19 SD in the HILDA survey (p-value < 0.01).
These findings suggest that FIFS start university life with a significant disadvantage in CS
relevant for academic achievement, but they are not disadvantaged in terms of their NCS, mental
health, and parental support. The only difference is that they are less likely to receive financial
support from their parents. The findings on the FIFS gap in CS could be interpreted in two
different ways. On the one hand, it may be the case that FIFS have lower innate cognitive ability.
On the other hand, it may just reflect elements of economic privilege, including for example, being
better prepared at taking tests or having access to educational resources, which is most likely
explained by the fact that they grew up in residential locations with poorer high school quality.
This would explain why FIFS are less likely to attend university. Such finding is consistent with
the model of selection into university presented above (Section 2.1). In that model, the net benefit
to tertiary education is increasing in cognitive ability which can be a proxy for the psychic costs of
education. Hence, the estimated relationship between socioeconomic status and ATAR suggests
that the net benefit of tertiary education may be smaller for disadvantaged students. In the next
section we explore whether pre-university gaps in academic achievement translate into gaps in
academic achievement at university for FIFS.
5. Socioeconomic gradients in academic achievement at university
5.1. Raw performance differences
Figure 4 documents strong socioeconomic gradients in academic performance at university in the
raw data, which are consistent with strong socioeconomic gradients in pre-university academic
9 We use unit record data from the Household, Income and Labour Dynamics in Australia (HILDA) Survey (Melbourne Institute 2017). The HILDA project was initiated and is funded by the Australian Government Department of Social Services (DSS) and is managed by the Melbourne Institute of Applied Economic and Social Research (Melbourne Institute). The findings and views reported in this paper, however, are those of the author and should not be attributed to either DSS or the Melbourne Institute.

17
achievement (ATAR). FIFS (left panel) scored lower WAMs on average, with a mean of 63.5,
while non-first-in-family students scored 67.4 on average across four semesters. The distributions
of WAM between FIFS and non-FIFS groups differ significantly (KS test p-value<0.001). FIFS
also have a higher probability of dropping out of their studies after Year 1, with a risk of 18.1
percent, relative to 11.8 percent of non-FIFS (Table 3).
[Figure 4 ABOUT HERE]
Figure 4(b) demonstrates that alternative definitions of socioeconomic disadvantage lead to
similar conclusions. Students from ‘Low SES’ postcodes had average WAM of 61.9, from ‘Medium
SES’ postcodes of 66.3 and from ‘high SES’ postcodes of 67.3. The WAM distribution of ‘high
SES’ students are significantly different from both ‘low SES’ and ‘Medium SES’ students. Perhaps
surprising, dropout propensities after Year 1 are highest for students from ‘High SES’ postcodes
(16.1 percent), and lowest for students from ‘low SES’ postcodes (9.4 percent), although the mean
dropout propensities do not differ in a statistical sense (p-value=0.231).
5.2. Controlling for observable differences
Next, we explore whether academic achievement gaps can be explained by observable differences
between FIFS and non-FIFS, in particular due to differences in cognitive (CS) and non-cognitive
skills (NCS). We also ask whether CS and NCS moderate the FIFS gap in academic performance.
We model academic performance using a random effects (RE) specification, exploiting the time
variation in test scores, and controlling for a set of observable characteristics as follows:10 = + + + + + , , (3)
is the standardised weighted average mark for individual i in semester t (t=1, …, 4) and
, the coefficient on the SES indicator, is our parameter of interest. Demographic characteristics
( ) and pre-study cognitive skills ( ) (ATAR score) are included as controls to capture past inputs
and cognitive ability. contains gender, age, domestic student status, mental health problems,
living with parents and whether student receives financial support. Random shocks, , , and time-
10 This model is an extension of the standard cognitive achievement production function as laid out in Todd & Wolpin (2007), among others, to the context of academic achievement in tertiary education.

18
invariant, individual-specific heterogeneity, , capture unobserved random and student-specific
variation in WAM, respectively.
To test whether NCS mediate the relationship between FIFS status and academic
performance, we add our measures of NCS, as shown in Equation (4): = + + + + + + , . (4)
Although Equations (3) and (4) allow for individual-specific unobserved heterogeneity, the RE
specification assumes that this unobserved heterogeneity is independent of the other regressors in
the model, including socioeconomic status. This does not allow for unobservable, cumulative
inputs into the youth production function of academic achievement. Following Todd & Wolpin
(2003, 2007), one solution is a value-added model, in which we condition the analysis on lagged
measures of the outcome variable.11 We use lagged achievement at university ( , ) as a
proxy for both innate ability and previous inputs in the study process, over and above the influence
of pre-university, measured cognitive (ATAR) and non-cognitive skills:12 = + + + + + , + + , . (5)
The main coefficient of interest is . It identifies the association between WAM and FIFS,
conditional on controls and past weighted average marks.
Table 5 shows the estimation results obtained from Eqs. (3) to (5). Going across the table,
each subsequent column gradually adds sets of control variables. In a model without control
variables, FIFS achieve WAMs that are 0.28 standard deviation (SD) lower than that of their peers
(p<0.01). This penalty is equivalent to a gap of approximately five marks, or half of the number
of marks lying between a credit and distinction average. As control variables are gradually added,
the size of the estimated coefficient on FIFS shrinks. In a model with full controls (column (4)),
the FIFS penalty in WAM is equivalent to 0.16 SD (p<0.10).13
[TABLE 5 ABOUT HERE]
The coefficient on FIFS drops most significantly in absolute value when controlling for
pre-university cognitive skills (ATAR), from 0.23 SD (p<0.01) to 0.15 SD (not significant). This is
11 Todd & Wolpin (2003) and Fiorini & Keane (2014) use the so-called value-added model in the context of skill development of children. Both studies model the production function of cognitive and non-cognitive skills in children, explicitly modelling a child’s development as dependent on the historical accumulation of family inputs, schooling inputs and innate ability. Kassenboehmer et al. (2018) and Elkins et al. (2017) use the value-added model in the context of youth non-cognitive skill development. 12 The key assumption of the model is that the effect of the non-cognitive and cognitive skills declines over time, at the rates and respectively. 13 Full estimation results of Equation (4) are shown in Table A1 (Online Appendix).

19
consistent with the findings and discussion in Section 4.1 above. The ATAR score appears to be
a noisy measure of cognitive skills, proxying also for, or at least highly correlated with,
socioeconomic disadvantage. When using alternative definitions of low socioeconomic status,
including school type, the university’s official socioeconomic status indicator, or whether the
student lives with their parents, we obtain similar findings. There is no statistically significant
association between socioeconomic status and WAM when defining disadvantage through
geographic inequality (postcode) or school type.14
Controlling for NCS has little impact on the first-in-family penalty (column (4)), which is
not surprising as we did not find a FIFS gradient in NCS. Pre-university non-cognitive skills are
however significantly associated with academic performance. For instance, a 1 SD increase in
Conscientiousness corresponds to a 0.12 SD increase in WAM (p<0.01), while a 1 SD increase in
Extraversion is associated with a fall of 0.11 SD in WAM (p<0.01). Although not as large as the
effect size of the ATAR score, these associations are sizable. After controlling for reporting
heterogeneity in personality assessment using the anchoring vignettes, we obtain similar results for
Conscientiousness, although the estimated coefficient is slightly larger in magnitude moving from
0.12 SD to 0.14 SD (Table C4, Online Appendix). We obtain different results for Openness to
Experience: without vignette-adjustment, the Openness to Experience coefficient is 0.05 SD and
not statistically significant. Once controlling for reporting heterogeneity, the estimates coefficient
is 0.08 SD and is statistically significant (p<0.05). Grit and Internal Locus of Control are not
significantly associated with WAM in this linear specification.
In a robustness check we add further control variables (Table A1, Online Appendix). Our
conclusions remain unchanged when adding controls for current family situation (e.g., having
children, being married) or innate ability differences (e.g., birth order, being left-handed). When
including additional controls for socioeconomic status, such as the SES of the residential location,
the FIFS penalty increases to 0.2 SD (p-value<0.05). This suggests that FIFS status measures more
than just socioeconomic position and material disadvantage.
5.3. Heterogeneity by semester and gender
We explore heterogeneity in the FIFS achievement gap across semesters. In Table 6, we report the
estimated FIFS gap in academic achievement for each semester (with a full set of control variables,
as in column (4), Table 5). In semester 1, the FIFS penalty is 0.19 SD (p<0.05). From semester 2
14 See Table A4, Online Appendix.

20
onward, the penalty shrinks significantly. By semester 4, the penalty is neither statistically nor
economically significant, with a magnitude of 0.06 SD.
This conclusion does not qualitatively change when conditioning the analysis on a
balanced sample (466 participants who were observed in each of the four semesters). On average,
the FIFS gap in WAM is the same for both the full and balanced samples, which are -0.16 SD and
-0.13 SD (p-value=0.98). However, FIFS who stay on throughout all four semesters navigate each
semester with different constraints. For the balanced sample, FIFS have no disadvantage in WAM
in Semester 1 (-0.09 SD, not significant) and Semester 4 (-0.08 SD, not significant). However, for
this selected sample the FIFS penalty is in fact larger in Semesters 2 (-0.15 SD, p-value <0.10) and
3 (-0.21 SD, p-value<0.05). Thus, the trajectory between the samples is slightly different.
[TABLE 6 ABOUT HERE]
Overall, our findings suggest that performance in Semester 1 determines subsequent
performance. Such intertemporal dependence, if left unaccounted for, may lead to an over-
estimate of the FIFS penalty in academic achievement. Controlling for the intertemporal
dependence in academic performance using a value-added model as outlined in Eq. (5), we find
the FIFS academic penalty fully disappears. The coefficient estimate is statistically and
economically insignificant with a magnitude of 0.02 SD. The coefficient on the lagged WAM is
statistically significant and large in magnitude (0.61 SD, p<0.01). That is, consistent with the
semester-by-semester results from Table 6, the value-added model suggests that FIFS perform
poorly in the first semester but catch up over time. This result is in line with the hypothesis that
familiarity with and an understanding of university expectations shapes student achievement.
There is also no FIFS gap in the within-student variation in marks, as measured by the standard
deviation of marks across all four semesters (see Table 5, Model (6)).
Separating the analysis by gender (Table 6, Panels C and D), shows that the FIFS penalty is
larger in magnitude for young men (-0.32 SD) in Semester 1 than for women (-0.13 SD), although
the difference is not statistically significant (p-value=0.453). The FIFS penalty differs however
significantly in Semester 4 between female and male FIFS. In Semester 4, female FIFS score
significantly lower WAMs than female non-FIFS (0.18 SD, p-value < 0.10). In contrast, male FIFS
score 0.27 SD higher WAMs than male non-FIFS (not statistically significant). The difference of
almost 0.5 SD in WAM between female and male FIFS is statistically significant (p-value<0.05).
This suggests that in fact it is male FIFS who catch up over time, while female FIFS continue to
experience academic performance gaps throughout their studies.

21
5.4. Subject choice and drop-out probabilities
Our data also allow us to explore whether FIFS choose easier or more difficult subjects than their
peers and whether they are more likely to drop out after Year 1 (Table 7). Over a four-semester
window, FIFS are significantly more likely to take introductory (Year 1) units which are generally
easier than advanced subjects (e.g. Year 3 subjects). The magnitude of the effect is 3.5 percentage
points (p-value < 0.10), or 6.3 percent relative to the base probability of 55.1 percent. This may
imply that FIFS are more unsure of their long-term study plans relative to non-FIFS. In their
second year, there is no significant difference in the probability of taking Year 3 subjects, which
are perceived as harder between FIFS and non-FIFS students. FIFS are significantly more likely
to drop out from their studies after Year 1 by 2.8 percentage points (p-value<0.05), or by 48
percent relative to the base probability of 5.9 percent.
There are important and significant gender differences in subject choice but not in the drop-
out probabilities. It is only female FIFS who are more likely to take easier Year 1 subjects, by 5.1
percentage points (or 9.1 percent relative to the base probability of 55.2, p-value < 0.05), while for
male FIFS the effect is -2.0 percentage points and not statistically significant. The difference in
the estimated coefficients across gender is not statistically significant (p-value of 0.14). Female
FIFS are less likely to take Year 3 subjects (by -2.0 percentage points or 30 percent relative to the
base probability of 6.7 percent) while male FIFS are 3.4 percent more likely (or 47 percent relative
to the base probability). This difference by gender is statistically significant (p-value < 0.10).
5.5. Non-linearities and interaction effects between FIFS and skills
Finally, we test whether the FIFS penalty in academic achievement is moderated by cognitive and
non-cognitive skills. To do so, we extend Eq. (4), including interactions between socioeconomic
status and each of the cognitive or non-cognitive skill measures in turn ( × ): = + + + + + × + + , , (6)
is our parameter of interest. If is zero, we conclude that skills do not moderate the
socioeconomic gradient in university performance. To allow and test for non-linearities in this
relationship, we include higher polynomials of the skill measure, using the Akaike information
criteria to select the optimal order of the polynomial.
With Conscientiousness the only exception, we find no significant interaction effects
between FIFS and skills. However, we find important non-linearities in the relationship between
skills and academic achievement for the ATAR score, Conscientiousness, Extraversion and

22
Internal Locus of Control. According to the AIC, we model an interaction effect between FIFS
status and Conscientiousness, allowing for a cubic polynomial in Conscientiousness. For the
ATAR score, Internality and Extraversion, we allow for a quadratic, cubic and quartic polynomial
in skill, respectively.15 Figure 5 summarises the non-linear relationship between skills and academic
achievement, separately by FIFS status for the most interesting cases. We present predicted WAM
scores expressed in standard deviations away from a 0 mean, over the full range of the skill
measure, and 95 percent confidence intervals.
We find that Conscientiousness is the only skill which moderates FIFS penalties. Figure
5(a) shows that FIFS with medium to low levels of Conscientiousness (0-2 SD below the mean)
experience substantial WAM penalties (0.25-0.5 SD). High levels of Conscientiousness are
associated with WAM of 0.3 SD above the mean for FIFS. Non-FIFS experience a similar non-
linear relationship between Conscientiousness and WAM. However, the penalties associated with
very low levels of Conscientiousness are small in magnitude, and the premium for very high levels
of Conscientiousness is both small in magnitude and statistically insignificant.
Controlling for measurement error in Conscientiousness with anchoring vignettes
increases the penalty for low levels of Conscientiousness faced by FIFS. It also reduces WAM
premia of high levels of Conscientiousness for FIFS but increases them for non-FIFS (Figure
5(b)). This finding is important. First, it suggests that FIFS and non-FIFS experience different
measurement error in NCS assessment, and that correction for measurement error affects the
opposite ends of the skill distribution for each group in different ways. One explanation for this
result may be that very low-performing FIFS rank themselves too highly on the Conscientiousness
scale, while mid to low-performing students rank themselves too negatively relative to others, a
phenomenon also reported in West et al. (2016).16 Second, it suggests that low levels of
Conscientiousness create performance problems for FIFS, and less so for non-FIFS.
Figures 5(c) and 5(d) document strong non-linearities for cognitive skills and Internal
Locus of Control, respectively. Low cognitive skills between the middle and lower end of the skill
distribution are associated with high WAM penalties (~0.5 SD lower than the mean), while very
high levels of CS (e.g. 1-2 SD above the mean) translate into 0.8-1.5 SD higher WAM (Figure 5(c)).
The non-linear WAM returns are the same between FIFS and non-FIFS. Critically, the WAM
15 Estimated coefficients for FIFS status and skills and AIC are presented in Table A2. 16 West et al (2016) find evidence for this hypothesis analysing data on students who entered a Boston-based charter school through a lottery. The authors find that students who enter highly selective charter schools tend to adjust their Conscientiousness and Grit scores downward because they adopt a new, higher standard of what they consider as high level.
23
penalty is the same for almost all levels of low CS (starting from -0.5 SD below the 0 mean). Yet,
even small increments above the CS sample mean lead to ever increasing WAM returns.
[FIGURE 5 ABOUT HERE]
Figure 5(d) reveals a hump-shaped relationship between Internality and WAM, which was
masked by the linear specification presented in Table 5. In fact, both very low and very high levels
of Internality are significantly associated with WAM penalties, while Internality scores around the
mid-range (within -0.5 and +1.5 SD from the 0 mean) are not linked with academic achievement.
6. Discussion and conclusion
We study the tertiary education constraints and facilitators of first-in-their family students (FIFS)
in Australia. With the exception of Adamecz-Völgyi, Henderson & Shure (2020a,b) and
Henderson, Shure & Adamecz-Völgyi (2020), who study university experiences of FIFS in
England, little empirical evidence exists on this policy-relevant population outside Britain.
Our findings are multi-fold. Most importantly, FIFS experience no inequalities in pre-
university non-cognitive skills but arrive at university with lower pre-university cognitive skills,
which we proxied with standardised university admissions test scores. This finding is consistent
with supplementary evidence obtained from the analysis of a sample sourced from a nationally
representative survey, the Household, Income, and Labour Dynamics in Australia (HILDA).
Second, FIFS have lower grade-point averages (GPA) at the beginning of their studies, but they
tend to catch up over time. This result is driven by male FIFS, while female FIFS continue to
experience GPA gaps by semester 4. Our finding is consistent with Adamecz-Völgyi, Henderson
& Shure (2020b), who show that female FIFS with a university degree in England experience
labour-market penalties. These wage gaps of female FIFS with university education may be the
result of poorer GPAs at university, which affect the quality of first job placements post-
graduation. FIFS in Australia are also more likely to drop out after Year 1, which we find both in
our own survey and in nationally representative data. The elevated risk of dropping out is 3-4
percentage points, which is comparable to risks estimated in Henderson, Shure & Adamecz-Völgy
(2020) for England. However, we find larger effects relative to the mean risk in the sample.
Third, we find that NCS (Conscientiousness, Extraversion) predict academic performance
strongly, independent of the model specification. Both have about 30-50 percent of the predictive
power of cognitive skills. Low levels of Conscientiousness are associated with lower GPAs for
both FIFS and non-FIFS but the penalty for low Conscientiousness is much larger for FIFS. High

24
levels of Conscientiousness compensate for the academic penalties produced by social origin, but
they also generate high GPA returns for non-FIFS.
Adjusting for measurement error in NCS assessment and non-linearities in the relationship
between skills and academic performance reveals important insights. The academic return to NCS
is generally stronger once controlling for measurement error in NCS. For instance, while we find
no significant link between Openness to Experience and GPAs in the benchmark model, we find
a significant and economically meaningful relationship once adjusting for measurement error with
anchoring vignettes. This is a critical finding, as Lundberg (2013) suggests that Openness to
Experience helps disadvantaged men and women to graduate from university.
Second, after controlling for measurement error, we no longer find that high levels of
Conscientiousness compensate for social origin, while we see an increase in the premia for high
levels of Conscientiousness for non-FIFS. On the flipside, controlling for the measurement error
significantly widens the achievement penalty for very low levels of Conscientiousness for FIFS
relative to non-FIFS. This suggests that students at very low levels of Conscientiousness understate
their low levels. FIFS with higher levels of Conscientiousness and performance generally overstate
their Conscientiousness, while comparable non-FIFS generally understate it.
Our findings contribute to an international literature that considers the role of both
cognitive and non-cognitive skills instrumental in facilitating social mobility (Heckman and Mosso
2014; Heckman 2000) and success in life (Almlund et al. 2011). Our findings accentuate the
importance of non-cognitive skills, and Conscientiousness in particular, in influencing academic
outcomes for disadvantaged students. Conscientiousness has often been discussed in the literature
as a super-trait because of its health benefits and its association with job and academic performance
(Roberts et al. 2014). It is positive to see that FIFS have no Conscientiousness disadvantage upon
entry into university and that this skill helps students to achieve high GPAs.
Our study also contributes to an emerging literature that questions the reliability of self-
assessed non-cognitive skill measures (see Almlund et al. 2011, West et al. 2016). We build on
previous studies which developed and applied so-called anchoring vignettes to be able to compare
education outcomes based on self-assessed measures across cultures (He, Buchholz & Klieme
2017) and in the context of personality assessment (Mõttus, Allik, Realo, Rossier, Zecca & Ah-
Kion et al. 2012, Bolt, Lu & Kim 2014, Primi, Zanon, Santos, De Fruyt & John 2016). To the best
of our knowledge, our study is one of the first to show that individual-specific, extreme response
styles in personality assessment tasks may lead to over- or under-estimates of the benefits of
Conscientiousness in the context of inequalities in educational achievement. Certainly, more

25
research is needed to better understand the breadth of response styles in any given population.
Specifically, in our study we assume that response heterogeneity is fixed across personality
assessments of your own and fictional others’ profiles. Other response types are possible.
What is left unanswered in our study are the mechanisms that could explain achievement
gaps, catch-up and drop out after the first year. For instance, it is likely that FIFS accumulate more
human and cultural capital during their time spent at university, which could explain why they
catch up with their peers over time. Kassenboehmer, Leung and Schurer (2018) suggest that some
non-cognitive skills, although not Conscientiousness, are endogenous to students’ experiences at
university, especially for students from socioeconomically disadvantaged backgrounds. Pascarella
et al. (2004) find that student experiences affect non-cognitive skill development differently for
FIFS. Models of academic achievement should incorporate the possibility that disadvantaged
students accumulate more cultural capital during university life than more privileged students.
Furthermore, given that FIFS are less likely to be supported financially by their parents
during their studies, they are more likely to work outside university. This could lead to less time
available for studies and weaker attachment to university and thus increase the probability of
dropping out from university studies. To make statements about the mechanisms, one would need
additional survey data on the current study experiences and habits of FIFS, outside workhours and
human capital by semester, which was not possible for the purpose of this study. Such questions
can however be answered with for instance, the US American Barea Panel Study (Stinebrickner &
Stinebrickner 2003) or the English BOOST2018 Study (Del Bono, Delavande & Holdford 2021).

26
Acknowledgements
The authors acknowledge financial support from an Australian Research Council Early Career Discovery Program Grant to Schurer (DE140100463) and the Australian Research Council Centre of Excellence for Children and Families over the Life Course (project number CE140100027). Approval to conduct the study was obtained from the Human Research Ethics Committee (Low Risk) of the university at which the study was conducted on 11 November 2014 (Nr. 2014/921).
Declarations of interest
None
27
References
Adamecz-Völgyi, A, Henderson, M, & Shure, N 2020a. ‘Is ‘first in family’ a good indicator for widening university participation?’, Economics of Education Review, vol. 8, pp. 102038.
Adamecz-Völgyi, A, Henderson, M, Shure, N 2020b, ‘The Labor Market Returns to 'First in
Family' University Graduates’, IZA DP No. 13911, IZA Bonn.
Almlund, M, Duckworth, AL, Heckman, JJ, & Kautz, T 2011, ‘Personality Psychology and Economics’. In E. A. Hanushek, S. Machin, and L. Woessmann (Eds.), Handbook of the Economics of Education, Vol. 4, Volume 4, Chapter 1, pp. 1-181, Elsevier B.V.
Attanasio, O, Blundell, R, Conti, G, & Mason, G 2020, ‘Inequality in Socio-Emotional Skills: A Cross-cohort Comparison’, Journal of Public Economics, vol. 96, no. 4, pp. 898-912.
Blanden, J, Gregg, P, & Machin, S 2005, ‘Intergenerational Mobility in Europe and North America’, London: Centre for Economic Performance, London School of Economics.
Blanden, J, Gregg, P, & Macmillan, L 2007, ‘Accounting for Intergenerational Income Persistence: Noncognitive Skills, Ability and Education’, Economic Journal, vol. 117, pp. C43–C60.
Blanden, J, & Macmillan, L 2016, ‘Educational inequality, educational expansion and intergenerational mobility’, Journal of Social Policy, vol. 45, no. 4, pp. 589–614.
Bloome D, Dyer S, & Zhou X 2018, ‘Educational Inequality, Educational Expansion, and Intergenerational Income Persistence in the United States’, American Sociological Review, vol. 83, no. 6, pp. 1215-1253.
Bolt DM, Lu Y, & Kim J-S 2014, ‘Measurement and control of response styles using anchoring vignettes: A model-based approach’. Psychological Methods, vol 19, no 4, pp. 528.
Bolton, T 2003, ‘Land of the Fair Go - An Exploration of Australian Identity’ AQ: Australian Quarterly,
vol. 75, no. 2, pp. 16–40. Bonadies Torres, G 2020, 'Affirmative Action in Higher Education: Relevance for Today's Racial
Justice Battlegrounds', Human Rights Magazine, col. 44, no. 4: Black to the Future Part II January 06.
Borghans, L., Duckworth, A., Heckman, J. & Weel, B. 2008, ‘The Economics and Psychology of
Personal Traits’, The Journal of Human Resources. 43. 10.1353/jhr.2008.0017. Bowles, S, Gintis, H, & Osborne, M 2001, ‘Incentive-Enhancing Preferences: Personality,
Behavior, and Earnings’. American Economic Review, vol. 91, no. 2, pp. 155-158.
Bozick, R 2007, ‘Making it through the First Year of College: The Role of Students’ Economic Resources, Employment and Living Arrangements’, Sociology of Education, vol. 80, no. 3, pp. 261-284.
Breen, R., & Muller, W. 2020, ‘Education and Intergenerational Social Mobility in Europe and the United States’. Stanford, California: Stanford University Press.
Bütikofer, A, & Peri, G 2020, ‘How Cognitive Ability and Personality Traits Affect Geographic Mobility’, Journal of Labor Economics (forthcoming).

28
Carneiro, P, Crawford, C, & Goodman, A 2007, ‘The Impact of Early Cognitive and Non-Cognitive Skills on Late Outcomes’, London School of Economics Centre for the Economics of Education, ISBN 978-0-85328-188-7
Carneiro, P, Hansen, KT, & Heckman, JJ 2003, ‘2001 Lawrence R. Klein Lecture: Estimating Distributions of Treatment Effects with an Application to the Returns to Schooling and Measurement of the Effects of Uncertainty on College Choice’, International Economic Review, vol. 44, no. 2, pp. 361-422.
Chamorro-Premuzic, T, & Furnham, A 2003, ‘Personality predicts academic performance: Evidence from two longitudinal university samples’, Journal of Research in Personality vol. 37, no. 4, pp. 319-338.
Czarnecki, K. 2018, ‘Less inequality through universal access? Socioeconomic background of tertiary entrants in Australia after the expansion of university participation’, Higher Education vol. 76, pp. 501–518.
Cheng, W, Ickes, W, & Verhofstadt, L 2012, ‘How is family support related to students’ GPA scores? A longitudinal study’, Higher Education, vol. 64, no. 3, pp. 399-420.
Chesters, J, & Watson, L 2013, ‘Understanding the Persistence of Inequality in Higher Education: Evidence from Australia’, Journal of Education Policy 28(2), 198–215.
Chetty, R, et al. 2014, ‘Is the United States still a land of opportunity? Recent trends in intergenerational mobility’, American Economic Review, vol. 104(5), 141–147.
Cobb-Clark, D, & Gørgens, T 2012, ‘Parents’ Economic Support of Young-Adult Children: Do Socioeconomic Circumstances Matter?’, Journal of Population Economics, vol. 27, pp. 447–471
Cobb-Clark, D., & Schurer, S. 2012, ‘The stability of the Big-Five personality traits’, Economics Letters, vol. 115, no. 1, pp. 11-15.
Cobb-Clark, D, & Schurer, S 2013, ‘Two economists' musings on the stability of locus of control’, Economic Journal, vol. 123, no. 570, pp. F358-F400.
Cobb-Clark, D, Kassenboehmer, S, & Schurer, S 2014, ‘Healthy habits: What explains the connection between diet, exercise, and locus of control?’ Journal of Economic Behavior & Organization vol. 98, pp. 1-28.
Conley, D. T. 2003, Understanding university success. Eugene, OR: Center for Educational Policy Research, University of Oregon.
Cunha, F, Heckman, JJ, & Navarro, S 2005, ‘The 2004 Hicks Lecture: Separating Uncertainty from Heterogeneity in Life Cycle Earnings’, Oxford Economic Papers, vol. 57, no. 2, pp. 191-261.
Delaney, L, Harmon, C, & Ryan, M 2013, ‘The role of noncognitive traits in undergraduate study behaviours’, Economics of Education Review, vol. 32, pp. 181-195.
Del Bono, E, Delavande, A, Holdford, A 2021, ‘Academic and non-academic investments at university: The role of expectations, preferences and constraints’, Journal of Econometrics, forthcoming.

29
Department of Education and Training 2016, Driving Innovation, Fairness and Excellence in Australian Higher Education, viewed 12 May 2017, https://docs.education.gov.au/system/files/doc/other/he_reform_paper_driving_innovation_fairness_and_excellence_3_may_2016.pdf.
Department of Education and Training 2017, Completion Rates of Higher Education Students – Cohort Analysis, 2005-2014, viewed 12 May 2017, https://docs.education.gov.au/system/files/doc/other/cohort_analysis_2005-2014_0.pdf.
DeSimone, JS 2008, ‘The impact of employment during school on college student academic performance’, NBER Working Paper 14006, viewed 24 October 2017, http://www.nber.org/papers/w14006.
Doren, C, & Grodsky, E 2016, ‘What Skills Can Buy: Transmission of Advantage through Cognitive and Noncognitive Skills’, Sociology of Education, vol. 89, no. 4, pp. 321-342.
Duckworth, AL, Peterson, C, Matthews, MD & Kelly, DR 2007, ‘Grit: Perseverance and Passion for Long-Term Goals’, Journal of Personality and Social Psychology, vol. 92, no. 6, pp. 1087-1101.
Duckworth AL, & Quinn PD 2009, ‘Development and Validation of the Short Grit Scale (GRIT-S)’, Journal of Personality Assessment, vol. 91, no. 2, pp. 166-74.
Duncan GJ, Dowsett CJ, Claessens A, Magnuson K, Huston AC, Klebanov P, Pagani LS, Feinstein L, Engel M, Brooks-Gunn J, Sexton H, Duckworth K, Japel C 2007, ‘School readiness and later achievement’, Developmental Psychology, vol. 43, no. 6, pp. 1428-1446.
Dustmann, C, & van Soest, A 2007, ‘Part-time work, school success and school leaving’, Empirical Economics, vol. 32, pp. 277-299.
Elkins, RK, Kassenboehmer, SC, & Schurer, S 2017, ‘The stability of personality traits in adolescence and young adulthood’, Journal of Economic Psychology, vol. 60, pp. 37-52.
Elkins, R, & Schurer, S 2020, ‘Exploring the role of parental engagement in noncognitive skill development over the lifecourse’, Journal of Population Economics, vol. 33, pp. 957-1004.
Fiorini, M, & Keane, MP 2014, ‘How the Allocation of Children’s Time Affects Cognitive and Noncognitive Development’, Journal of Labour Economics, vol. 32, no. 4, pp. 787-836.
Fischer, M & Massey, D 2007, ‘The effects of affirmative action in higher education’, Social Science Research, vol. 36, pp. 531-549.
Gatz, M., & Karel, M. J. 1993, ‘Individual change in perceived control over 20 years’, International Journal of Behavioral Development, 16(2), 305–322.
Gensowski, M, Goertz, M, & Schurer, S 2021, ‘Inequality in Personality over the Life Cycle’, Journal of Economic Behavior & Organization, vol.184, pp. 46-77.
Goldberg, LR 1992, ‘The Development of Markers for the Big-Five Factor Structure’, Psychological Assessment, vol. 4, no. 1, pp. 26-41.

30
Haveman, R., & Smeeding, T. 2006, ‘The Role of Higher Education in Social Mobility’, The Future of children / Center for the Future of Children, the David and Lucile Packard Foundation. 16. 125-50. 10.1353/foc.2006.0015.
He, J., Buchholz, J., & Klieme, E 2017, ‘Effects of anchoring vignettes on comparability and predictive validity of student self-reports in 64 cultures’, Journal of Cross-Cultural Psychology, vol. 48, pp. 319–334.
Heckman, JJ 2000. ‘Policies to foster human capital’, Research in Economics, vol. 54, pp. 3–56
Heckman, JJ, Stixrud, J, & Urzua, S 2006, ‘The Effects of Cognitive and Noncognitive Abilities on Labour Market Outcomes and Social Behaviour’, Journal of Labour Economics, vol. 24, no. 3, pp. 411-482.
Heckman, J.J., & Mosso, S. 2014, ‘The Economics of Human Development and Social Mobility’, Annual Review of Economics, vol. 6, no. 1, pp. 689-733.
Henderson, H, Shure, N & Adamecz-Völgy, A 2020, ‘Moving on up: ‘first in family’ university graduates in England’, Oxford Review of Education, vol. 46, no. 6, pp. 734-751.
Jacob, BA 2002, ‘Where the boys aren’t: non-cognitive skills, returns to school and the gender gap in higher education’, Economics of Education Review, vol. 21, no. 6, pp. 589-598.
Jerrim, J, & Vignoles, A 2015, ‘University access for disadvantaged children: A comparison across countries’, Higher Education, 70. 10.1007/s10734-015-9878-6.
Jongbloed, B, & Vossensteyn, H 2016, ‘University funding and student funding: international comparisons’, Oxford Review of Economic Policy, vol. 32, no. 4, pp. 576–595
Kappe, R. & van der Flier, H. 2012, ‘Predicting academic success in higher education: what's more important than being smart?’, European Journal of Psychology of Education, vol. 27, no. 4, pp. 605-619.
Kassenboehmer, S, Leung, F, & Schurer, S 2018, ‘University education and non-cognitive skill development’, Oxford Economic Papers, vol. 70, no. 2, pp. 538-562.
King, G, Murray, CJL, Salomon, JA, & Tandon, A 2005. ‘Enhancing the validity and cross-cultural comparability of measurement in survey research’ American. Political Science Review, vol. 98, no., 1:191-207.
King G, & Wand J 2007, ‘Comparing incomparable survey responses: Evaluating and selecting
anchoring vignettes’, Political Analysis, vol 15, no 1, pp. 46-66. Komarraju, M, Karau, SJ, Schmeck, RR & Avdic, A 2011, ‘The Big Five personality traits, learning
styles, and academic achievement’, Personality and Individual Differences, vol. 51, no. 4, pp. 472-477.
Leigh, A. 2007, ‘Intergenerational Mobility in Australia’, The B.E. Journal of Economic Analysis & Policy, vol. 7(2),no.6.
Li, IW, & Dockery, AM 2015, ‘Does School Socio-economic Status Influence University Outcomes?’, Australian Journal of Labour Economics, vol. 18, no. 1, pp. 75-94.
31
Lindqvist, E. & Vestman, R 2011, ‘The Labor Market Returns to Cognitive and Noncognitive Ability: Evidence from the Swedish Enlistment’, American Economic Journal: Applied Economics, vol. 3, pp. 101-128.
Losoncz, I. 2009, ‘Personality Traits in HILDA’, Australian Social Policy No. 8, 169.
Lundberg, S 2013, ‘The College Type: Personality and Educational Inequality’, Journal of Labour Economics, vol. 31, no. 3, pp. 421-441.
Melbourne Institute, HILDA Survey, viewed 29 October 2017, http://melbourneinstitute.unimelb.edu.au/hilda.
Mendolia, S. & Siminski, P. 2016, ‘New Estimates of Intergenerational Mobility in Australia’, Economic Record, 92: 361-373. doi:10.1111/1475-4932.12274
Messinis, G, & Sheehan, P 2015, ‘The academic performance of first year students at Victoria University by Entry Score and SES, 2009-2013’, Victoria Institute of Strategic Economic Studies, Melbourne, https://www.vu.edu.au/sites/default/files/cses/pdfs/the-academic-performance-of-first-year-students-at-VU-by-entry-score-and-SES-2009-2013.pdf.
Mõttus, R., Allik, J., Realo, A., Rossier, J., Zecca, G., Ah-Kion, J., Amoussou-Yéyé, D., Bäckström, M., Barkauskiene, R., Barry, O., Bhowon, U., Björklund, F., Bochaver, A., Bochaver, K., de Bruin, G., Cabrera, H.F., Chen, S.X., Church, A.T., Cissé, D.D., Dahourou, D., Feng, X., Guan, Y., Hwang, H.S., Idris, F., Katigbak, M.S., Kuppens, P., Kwiatkowska, A., Laurinavicius, A., Mastor, K.A., Matsumoto, D., Riemann, R., Schug, J., Simpson, B., Tseung-Wong, C.N., Johnson, W 2012, ‘The effect of response style on self-reported conscientiousness across 20 countries’, Personality and Social Psychology Bulletin, vol. 38, pp. 1423–1436.
Multon, KD, Brown, SD, & Lent, RW 1991, ‘Relation of Self-Efficacy Beliefs to Academic
Outcomes: A Meta-Analytic Investigation’, Journal of Counseling Psychology, vol. 38, no.1, pp. 30-38.
Noftle, EE, & Robins, RW 2007, ‘Personality predictors of academic outcomes: Big Five correlates of GPA and SAT scores’, Journal of Personality and Social Psychology, vol. 93, no. 1, pp. 116-130.
OECD (2018), Equity in Education: Breaking Down Barriers to Social Mobility, PISA, OECD Publishing, Paris, https://doi.org/10.1787/9789264073234-en.
Page, LC, & Scott-Clayton, J 2016, ‘Improving college access in the United States: Barriers and policy responses’, Economics of Education Review, vol.51, pp. 4-22.
Pascarella, ET, Pierson, CT, Wolniak, GC & Terenzini, PT 2004, ‘First-Generation College Students: Additional Evidence on College Experiences and Outcomes’, The Journal of Higher Education, vol. 75, no. 3, pp. 249-284.
Pearlin, L, & Schooler, C 1978, ‘The structure of coping’, Journal of Health and Social Behavior, vol. 19, pp. 2-21.

32
Primi, R, Zanon, C, Santos, D, De Fruyt, F, & John, OP 2016, ‘Anchoring vignettes: can they make adolescent self-reports of social-emotional skills more reliable, discriminant, and criterion-valid?’, European Journal of Psychological Assessment, vol. 32, pp. 39–51.
Richardson, M, Abraham, C, & Bond, R 2012, ‘Psychological Correlates of University Students’
Academic Performance: A Systematic Review and Meta-Analysis’, Psychological Bulletin, vol. 138, no. 2, pp. 353-387.
Roberts, BW, Lejuez, C, Krueger, R.F, Richards, JM & Hill, PL 2014, ‘What is conscientiousness and how can it be assessed?’, Developmental Psychology, vol. 50, no. 5, pp. 1315-1330.
Saucier, G. 1994, Mini-Markers: A brief version of Goldberg's unipolar Big-Five markers. Journal of Personality Assessment, 63(3), 506–516.
Stinebrickner, R, & Stinebrickner, TR 2003, ‘Understanding Educational Outcomes of Students from Low-Income Families: Evidence from a Liberal Arts College with a Full Tuition Subsidy Program’, Journal of Human Resources, vol. 38, no. 3, pp. 591-617.
Todd, PE, & Wolpin, KI 2003, ‘On the specification and estimation of the production function for cognitive achievement’, The Economic Journal, vol. 113, no. 485, pp.F3-F33.
Trapmann, S, Hell, B, Hirn, J-OW, & Schuler, H 2007, ‘Meta-analysis of the relationship between the Big Five and academic success at university’, Zeitschrift fur Psychologie, vol. 215, no. 2, pp. 132-151.
Walpole, M 2003, ‘Socioeconomic Status and College: How SES Affects College Experiences and Outcomes’, The Review of Higher Education, vol. 27, no. 1, pp. 45-73.
Walpole, M 2008, ‘Emerging from the Pipeline: African American Students, Socioeconomic Status, and College Experiences and Outcomes’, Research in Higher Education, vol. 49, no. 3, pp. 237-255.
West, MR, Kraft, MA, Finn, AS, Martin, RE, Duckworth, AL, Gabrieli, CFO & Gabrieli, JDE 2016, ‘Promise and Paradox: Measuring Students’ Non-Cognitive Skills and the Impact of Schooling’, Educational Evaluation and Policy Analysis, vol. 38, no. 1, pp. 148-170.
Universities Admissions Centre 2017, Australian Tertiary Admission Rank (ATAR), viewed 5 May 2017, http://www.uac.edu.au/atar/
Universities Australia 2016, University Participation and Quality, viewed 21 May 2017, https://www.universitiesaustralia.edu.au/uni-participation-quality

33
Tables and Figures
Table 1. Personality Instruments Big Five Personality Traits A7 How well do the following words describe you? For each word, cross one box to indicate how well that word describes you. There are no right or wrong answers. Does not describe me at all
Describes me very well
1 2 3 4 5 6 7 Tick X one box for each word
A7a Talkative A7t Intellectual A7c Orderly A7u Extroverted A7e Deep A7w Disorganized A7h Systematic A7y Complex A7j Philosophical A7z Shy A7k Bashful A7ab Efficient A7m Inefficient A7ad Imaginative A7o Creative A7aj Lively A7p Quiet A7r Sloppy Grit A9 Here are a number of statements that may or may not apply to you. For the most accurate score, when responding, think of how you compare to most people -- not just the people you know well, but most people in the world. There are no right or wrong answers, so just answer honestly! Please answer with the following categories Very much like me
Mostly like me Somewhat like me
Not much like me
Not like me at all
1 2 3 4 5 Tick X one box for each statement
A9a New ideas and projects sometimes distract me from previous ones. A9b Setbacks don’t discourage me. A9c I have been obsessed with a certain idea or project for a short time but later lost interest. A9d I am a hard worker. A9e I often set a goal but later choose to pursue a different one. A9f I have difficulty maintaining my focus on projects that take more than a few months to complete. A9g I finish whatever I begin. A9h I am diligent. Locus of control A8 Please indicate, by crossing one box on each line, how much you agree or disagree with each of the following statements. The more you agree, the higher the number of the box you should cross. The more you disagree, the lower the number of the box you should cross.

34
Strongly Disagree
Strongly Agree
1 2 3 4 5 6 7 A8a I have little control over the things that happen to me A8b There is really no way I can solve some of the problems I have A8c There is little I can do to change many of the important things in my life A8d I often feel helpless in dealing with the problems of life A8e Sometimes I feel that I’m being pushed around in life A8f What happens to me in the future mostly depends on me A8g I can do just about anything I really set my mind to

35
Table 2. Summary statistics
Mean Std Dev Min Max National***
(1) (2) (3) (4) (5)
Age in Semester 1, 2015 18.758 2.033 17 34 20.3b
Female 0.714 0.452 0 1 0.54a
Married 0.043 0.202 0 1 0.02b
International student 0.116 0.321 0 1 0.25a
Ever diagnosed with anxiety 0.248 0.432 0 1 0.14b
ATAR Score* 88.998 8.171 66 100 70 a
First in family 0.269 0.443 0 1 0.58b
Lives at Home 0.673 0.469 0 1 0.51b
Parent Encouragement 0.882 0.322 0 1 NA
Receives Family Financial Support 0.660 0.474 0 1 NA
Monthly Financial Support ($), if > 0 698 1202 15 15750 NA
Low Socioeconomic Status** 0.051 0.221 0 1 0.14b
Medium Socioeconomic Status 0.324 0.468 0 1 0.33b
High Socioeconomic Status 0.499 0.500 0 1 0.53b
Public High School Student** 0.350 0.477 0 1 0.51 b
Catholic High School Student 0.137 0.344 0 1 0.25
Private High School Student 0.220 0.414 0 1 0.23
Number of Courses taken per semester 3.859 0.713 1 7 NA
Weighted Average Mark (WAM) 66.370 16.939 0 97 NA
Drops out after first year full sample 0.136c 0.343 0 1 0.16a, 0.09b
Balanced sample 0.819 0.385 0 1
Number of Students 641
NA
Observations 2277
NA Notes: *ATAR Score is available for 442 students. Students without an ATAR or comparable entry score are mostly international or mature aged students. We control for these missing ATAR scores in the regression analysis. **Socioeconomic status is defined as low, medium or high according to the ABS socioeconomic disadvantage status as defined by the Australian Bureau of Statistics (ABS). Low SES is defined as students who resided in a postcode that ranked in the bottom 25th percentile of the so-called SEIFA classification. This definition is in line with what University Admission Centre (UAC) uses in Australia to define socioeconomic disadvantage. All domestic students have a socioeconomic indicator, whilst the 68 that do not are international students. For this reason, the proportion of students in the low, medium and high socioeconomic status groups do not sum to 1. The same applies for the type of high school attended – this is unavailable for international students. *** Data constructed from Australian Government reports, Department of Education, Skills and Employment (a) and Household, Income, Labour Dynamics in Australia survey (HILDA) (b). (c) Estimation sample: 0.057.

36
Table 3: Socioeconomic indicators for first-in-family student status Not First-in-
family students
(1)
First-in-family students
(2)
t-test for difference in means: (1)-(2)
(3) Mean Mean p-value Source: Administrative data Age 18.634 19.266 0.004 Female 0.718 0.729 0.778 Low SESa 0.032 0.096 0.007 Medium SES 0.282 0.401 0.005 High SES 0.575 0.350 0.001 International student 0.099 0.147 0.113 Source: Survey data Parental encouragement 0.888 0.831 0.072 Lives at home 0.679 0.650 0.488 Ever diagnosed with anxiety 0.259 0.260 0.974 Not working currently 0.530 0.503 0.537 Work hours, if working 6.739 7.525 0.334 Receives financial support 0.690 0.565 0.004 Financial support ($), if received 693.762 603.450 0.378 Number of individuals 464 177 Note: First in family students are defined as students for who neither parent obtained university education. Not FIFS are students for who at least one parent obtained university education. aSocioeconomic status is defined as low, medium or high according to the ABS socioeconomic disadvantage status as defined by the Australian Bureau of Statistics (ABS). Low SES is defined as students who resided in a postcode that ranked in the bottom 25th percentile of the so-called SEIFA classification. This definition is in line with what University Admission Centre (UAC) uses in Australia to define socioeconomic disadvantage.

37
Table 4: Socioeconomic gradient in cognitive and non-cognitive skills Socioeconomic indicator: First-in-family student Low SES High SES
Student surveya HILDAb Relative to Medium SES Dependent variable: Non-cognitive skills
Conscientiousness 0.048 0.055 -0.022 0.037 (0.091) (0.054) (0.229) (0.089) Openness -0.096 -0.187*** -0.339 0.033 (0.091) (0.053) (0.209) (0.088) Extraversion -0.116 -0.035 -0.062 0.189** (0.087) (0.054) (0.191) (0.090) Internality -0.122 0.019 0.164 0.076 (0.093) (0.059) (0.190) (0.095) Grit -0.075 NA 0.028 0.012 (0.086) (0.188) (0.090) Cognitive skills ATAR/Ability tests -0.264*** -0.303*** -0.206 0.313*** (0.072) (0.064) (0.180) (0.078) Observations 641 1847 641 641 Notes: Each row shows the coefficient estimate on the socioeconomic indicator variable from a separate regression with the dependent variable as listed in the left-most column. Each of the dependent variables are standardised to have a mean 0 and variance of 1. Covariates included but not shown here are a gender dummy, a full series of age (in years) fixed effects, a dummy for international students and a dummy variable for whether the student has ever been diagnosed with anxiety. In the regressions with a non-cognitive skill as the dependent variable, we include the ATAR score as an additional covariate. Robust standard errors are shown in parentheses. *** p<.01, ** p<0.05, *p<0.1. a Student survey: We deal with missings on internality (9) and grit (20) and cognitive skills (ATAR) (188) by recording the missings to 0 and flag these observations with an indicator variable. b Household Income and Labour Dynamics in Australia (HILDA) survey: Estimation sample is 1,611 for Conscientiousness, Openness to experience and Extraversion; 1,847 for Internality and 1,018 for cognitive ability, which is a summary measure of backward digit span, symbol coding and word knowledge. Skill data in HILDA is available in Waves 3, 4, 5, 7, 9, 11, 12, 15, and 18.

38
Table 5: First-in-family student status, skills and academic achievement Benchmark model: Student performance
(WAM) across all four semesters Value added model
Standard deviation in WAM
(1) (2) (3) (4) (5) (6) First-in-family student -0.275*** -0.237*** -0.153* -0.155* -0.023 -0.092 (0.093) (0.090) (0.088) (0.088) (0.046) (0.584) Cognitive skills ATAR score (std) 0.335*** 0.316*** 0.133*** -1.500*** (0.045) (0.044) (0.027) (0.300) Non-cognitive skills Conscientiousness (std) 0.116*** 0.065*** -0.611** (0.039) (0.024) (0.282) Openness (std) 0.054 0.020 0.282 (0.037) (0.025) (0.311) Extraversion (std) -0.107*** -0.054*** 0.187 (0.036) (0.020) (0.246) Grit (std) 0.008 0.017 -0.680** (0.032) (0.023) (0.281) Internality (std) 0.048 0.011 0.118 (0.038) (0.023) (0.278) Lagged WAM (in t-1) 0.607*** (0.043) Constant -0.007 0.422** 0.376** 0.365** 0.062 6.485*** (0.043) (0.167) (0.159) (0.153) (0.106) (1.167) Basic control variables1 No Yes Yes Yes Yes Yes Observations 2277 2277 2277 2277 1596 2277 No. of students 641 641 641 641 602 641 Notes: The dependent variable is the standardized (mean 0, standard deviation 1) Weighted Average Mark (WAM) observed over four semesters in Models (1)-(5), and each model is estimated with Panel Data Random Effects Models, allowing for unobserved heterogeneity in the intercept. In Model (6) the outcome variable is the standard deviation of WAM over four semesters and the model is estimated with OLS. The average WAM in the sample is 66.8 with a standard deviation of 16.3 and a minimum of 0 and a maximum of 97.2. The average standard deviation in WAM is 6.8 marks with a standard deviation of 6.7, and a minimum standard deviation of 0 and a maximum of 46.1. In columns (1) to (4) the estimated model is Eq. (4). In column (5) the estimated model is Eq. (5). 1 We control in each equation for gender, age categories, mental health, international student status, semester dummy variables, whether student lives with parents and whether student receives financial support, dummy variables for missing observations in ATAR score, internality and grit. Full estimation results for the preferred specification (Model (4)) are reported in Table A1, column (1), Online Appendix A. Cluster robust standard errors (clustered at the individual) are reported in parentheses. *** p<0.01, ** p<0.05, * p<0.1.

39
Table 6: Academic achievement gap for first-in-family students, by semester (1) (2) (3) (4) (5) All
semesters pooled
Semester 1 Semester 2 Semester 3 Semester 4
Panel A: Full sample -0.155* -0.193** -0.108 -0.146 -0.064 (0.088) (0.094) (0.096) (0.101) (0.093) Observations 2277 641 589 549 498 Panel B: Balanced -0.132* -0.093 -0.148* -0.214** -0.077 sample (0.071) (0.078) (0.090) (0.087) (0.094) Observations 1864 466 466 466 466 Test: Diff full-balanced (p-value)
.985 .194 .532 .317 .665
Panel C: Female -0.136* -0.134 -0.112 -0.113 -0.184* (0.078) (0.100) (0.105) (0.101) (0.103) Observations 1625 462 422 389 352 Panel D: Male -0.114 -0.315 -0.137 -0.217 0.265 (0.169) (0.231) (0.216) (0.238) (0.216) Observations 652 179 167 160 146 Test: Diff Female-Male (p-value)
.906 .453 .913 .672 .048
Notes: Reported are the first-in-family gaps in academic achievement by sub-samples. The dependent variable is the standardized WAM for the given semester (standardised to mean 0 and standard deviation 1). We control in each equation for gender, age categories, mental health, international student status, semester dummy variables, whether student lives with parents and whether student receives financial support, cognitive and non-cognitive skills, dummy variables for missing observations in ATAR score, internality and grit. Robust standard errors are in parentheses. *** p<0.001, ** p<0.05, * p<0.1.
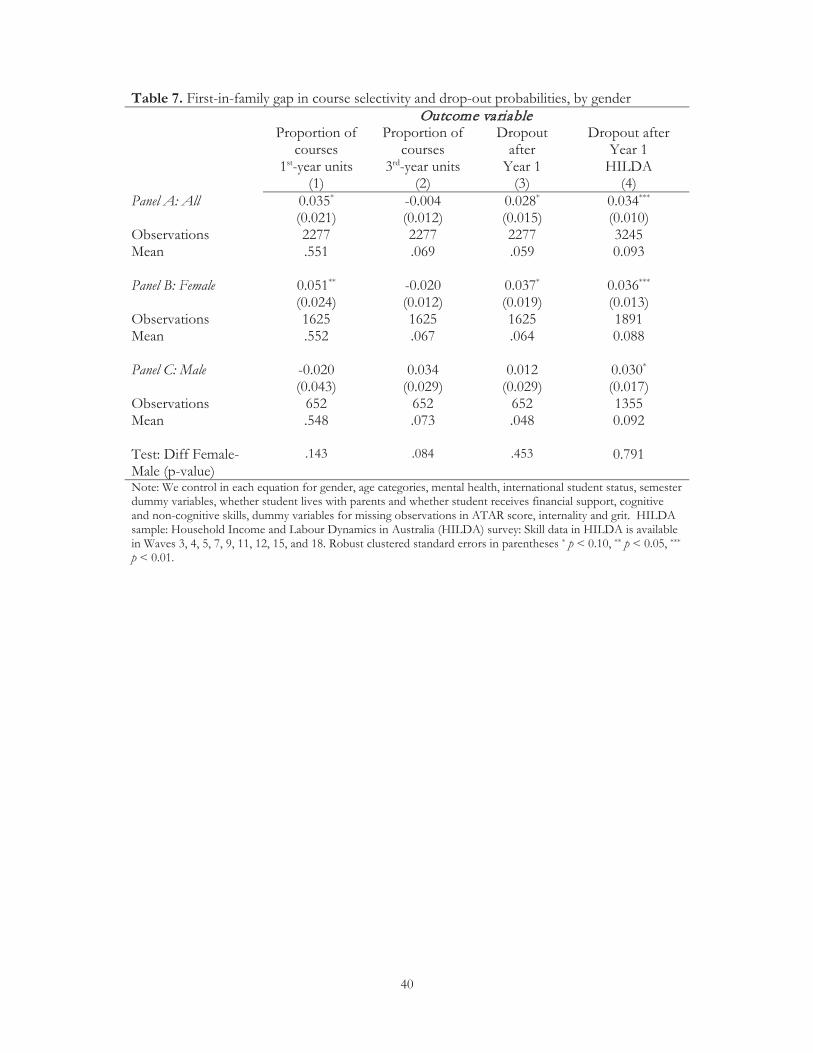
40
Table 7. First-in-family gap in course selectivity and drop-out probabilities, by gender OOutcome variable Proportion of
courses 1st-year units
Proportion of courses
3rd-year units
Dropout after
Year 1
Dropout after Year 1
HILDA (1) (2) (3) (4) Panel A: All 0.035* -0.004 0.028* 0.034*** (0.021) (0.012) (0.015) (0.010) Observations 2277 2277 2277 3245 Mean .551 .069 .059 0.093 Panel B: Female 0.051** -0.020 0.037* 0.036*** (0.024) (0.012) (0.019) (0.013) Observations 1625 1625 1625 1891 Mean .552 .067 .064 0.088 Panel C: Male -0.020 0.034 0.012 0.030* (0.043) (0.029) (0.029) (0.017) Observations 652 652 652 1355 Mean .548 .073 .048 0.092 Test: Diff Female-Male (p-value)
.143 .084 .453 0.791
Note: We control in each equation for gender, age categories, mental health, international student status, semester dummy variables, whether student lives with parents and whether student receives financial support, cognitive and non-cognitive skills, dummy variables for missing observations in ATAR score, internality and grit. HILDA sample: Household Income and Labour Dynamics in Australia (HILDA) survey: Skill data in HILDA is available in Waves 3, 4, 5, 7, 9, 11, 12, 15, and 18. Robust clustered standard errors in parentheses * p < 0.10, ** p < 0.05, *** p < 0.01.

41
Figure 1. Probability of attending university, by parental education background
Note: Data sourced from the nationally representative Household, Income, and Labour Dynamics in Australia (HILDA) survey, waves 2005-2018. Estimation sample of youth younger than 30 years, who graduated from high school but who do not have a higher education degree. The dependent variable is whether the individual is currently enrolled in a Bachelor degree program at one of Australia’s 40 universities. Predicted probabilities are calculated from a regression model in which we regress a binary indicator for being enrolled in a Bachelor program on indicators of age, sex, state, region, and wave, in addition to an interaction term between parental education background and the wave of observation.
.2.3
.4.5
.6Pr
obab
ility
of a
ttend
ing
univ
ersi
ty
5 6 7 8 9 10 11 12 13 14 15 16 17 18HILDA Waves 5-18 (2005-2018)
At least one parent has university educationNeither parent has university education
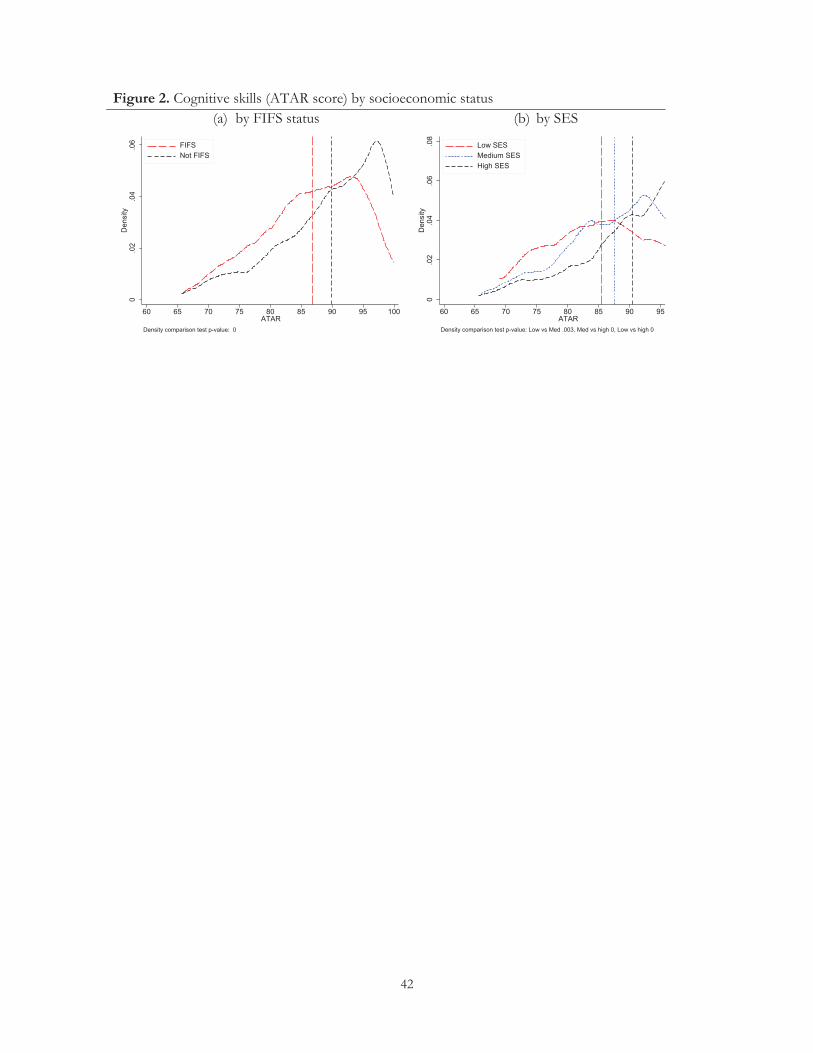
42
Figure 2. Cognitive skills (ATAR score) by socioeconomic status (a) by FIFS status (b) by SES
0.0
2.0
4.0
6D
ensi
ty
60 65 70 75 80 85 90 95 100ATAR
FIFSNot FIFS
Density comparison test p-value: 0
0.0
2.0
4.0
6.0
8D
ensi
ty
60 65 70 75 80 85 90 95ATAR
Low SESMedium SESHigh SES
Density comparison test p-value: Low vs Med .003, Med vs high 0, Low vs high 0
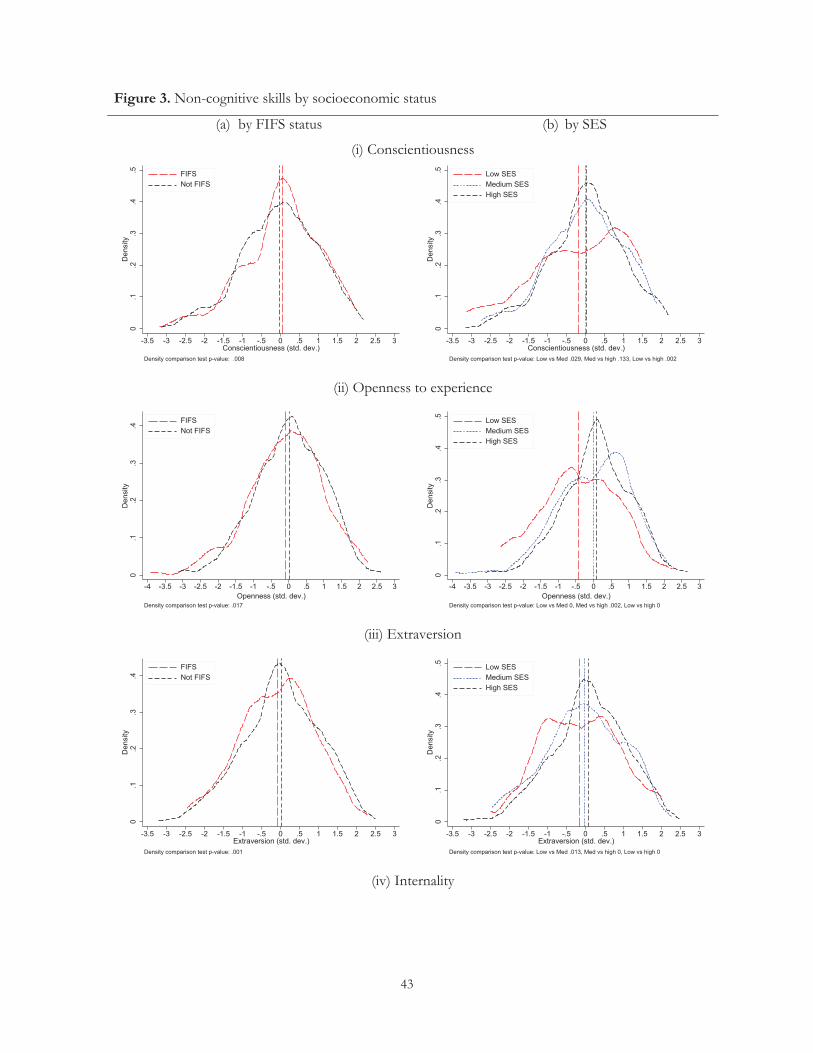
43
Figure 3. Non-cognitive skills by socioeconomic status
(a) by FIFS status (b) by SES
(i) Conscientiousness
(ii) Openness to experience
(iii) Extraversion
(iv) Internality
0.1
.2.3
.4.5
Den
sity
-3.5 -3 -2.5 -2 -1.5 -1 -.5 0 .5 1 1.5 2 2.5 3Conscientiousness (std. dev.)
FIFSNot FIFS
Density comparison test p-value: .008
0.1
.2.3
.4.5
Den
sity
-3.5 -3 -2.5 -2 -1.5 -1 -.5 0 .5 1 1.5 2 2.5 3Conscientiousness (std. dev.)
Low SESMedium SESHigh SES
Density comparison test p-value: Low vs Med .029, Med vs high .133, Low vs high .002
0.1
.2.3
.4D
ensi
ty
-4 -3.5 -3 -2.5 -2 -1.5 -1 -.5 0 .5 1 1.5 2 2.5 3Openness (std. dev.)
FIFSNot FIFS
Density comparison test p-value: .017
0.1
.2.3
.4.5
Den
sity
-4 -3.5 -3 -2.5 -2 -1.5 -1 -.5 0 .5 1 1.5 2 2.5 3Openness (std. dev.)
Low SESMedium SESHigh SES
Density comparison test p-value: Low vs Med 0, Med vs high .002, Low vs high 0
0.1
.2.3
.4D
ensi
ty
-3.5 -3 -2.5 -2 -1.5 -1 -.5 0 .5 1 1.5 2 2.5 3Extraversion (std. dev.)
FIFSNot FIFS
Density comparison test p-value: .001
0.1
.2.3
.4.5
Den
sity
-3.5 -3 -2.5 -2 -1.5 -1 -.5 0 .5 1 1.5 2 2.5 3Extraversion (std. dev.)
Low SESMedium SESHigh SES
Density comparison test p-value: Low vs Med .013, Med vs high 0, Low vs high 0
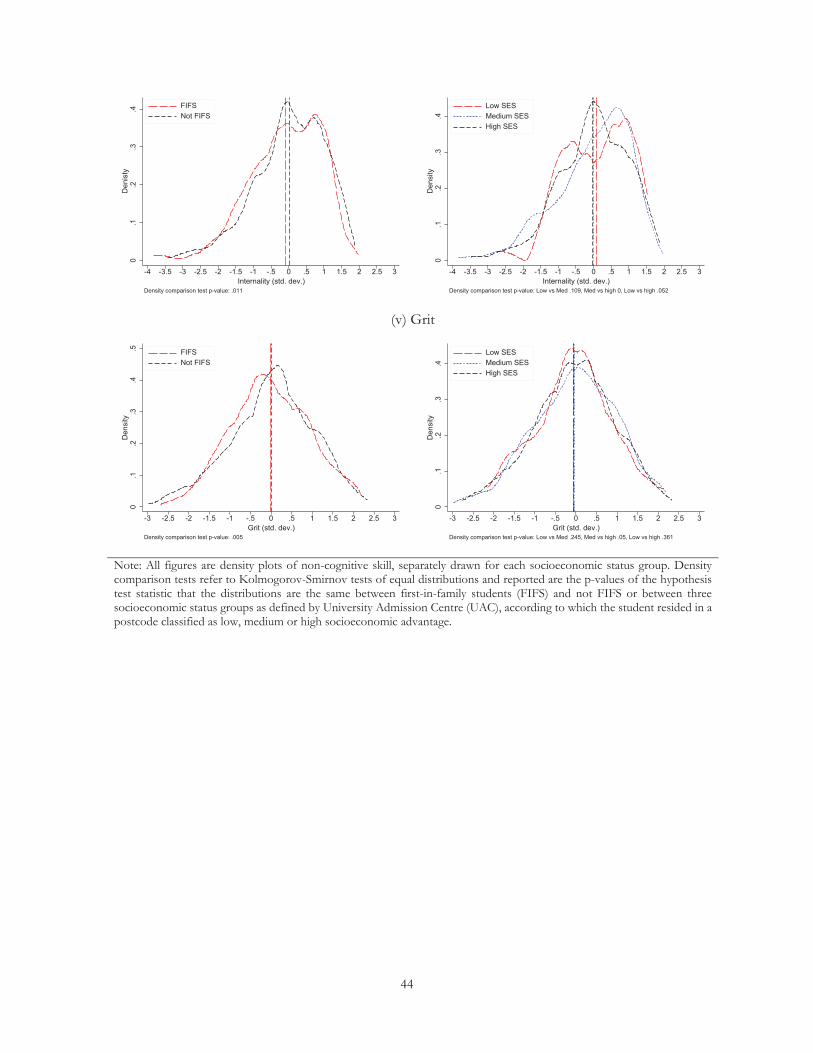
44
(v) Grit
Note: All figures are density plots of non-cognitive skill, separately drawn for each socioeconomic status group. Density comparison tests refer to Kolmogorov-Smirnov tests of equal distributions and reported are the p-values of the hypothesis test statistic that the distributions are the same between first-in-family students (FIFS) and not FIFS or between three socioeconomic status groups as defined by University Admission Centre (UAC), according to which the student resided in a postcode classified as low, medium or high socioeconomic advantage.
0.1
.2.3
.4D
enis
ty
-4 -3.5 -3 -2.5 -2 -1.5 -1 -.5 0 .5 1 1.5 2 2.5 3Internality (std. dev.)
FIFSNot FIFS
Density comparison test p-value: .011
0.1
.2.3
.4D
ensi
ty
-4 -3.5 -3 -2.5 -2 -1.5 -1 -.5 0 .5 1 1.5 2 2.5 3Internality (std. dev.)
Low SESMedium SESHigh SES
Density comparison test p-value: Low vs Med .109, Med vs high 0, Low vs high .052
0.1
.2.3
.4.5
Den
sity
-3 -2.5 -2 -1.5 -1 -.5 0 .5 1 1.5 2 2.5 3Grit (std. dev.)
FIFSNot FIFS
Density comparison test p-value: .005
0.1
.2.3
.4D
ensi
ty
-3 -2.5 -2 -1.5 -1 -.5 0 .5 1 1.5 2 2.5 3Grit (std. dev.)
Low SESMedium SESHigh SES
Density comparison test p-value: Low vs Med .245, Med vs high .05, Low vs high .361
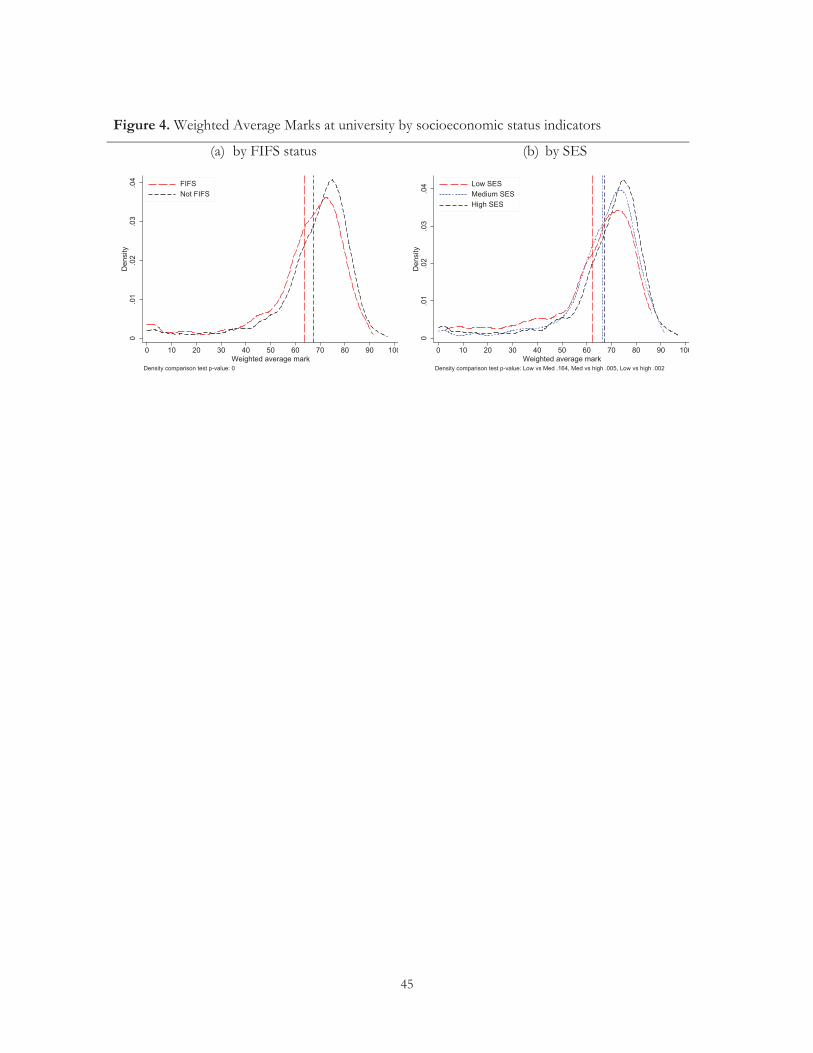
45
Figure 4. Weighted Average Marks at university by socioeconomic status indicators
(a) by FIFS status (b) by SES
0.0
1.0
2.0
3.0
4D
ensi
ty
0 10 20 30 40 50 60 70 80 90 100Weighted average mark
FIFSNot FIFS
Density comparison test p-value: 0
0.0
1.0
2.0
3.0
4D
ensi
ty
0 10 20 30 40 50 60 70 80 90 100Weighted average mark
Low SESMedium SESHigh SES
Density comparison test p-value: Low vs Med .164, Med vs high .005, Low vs high .002

46
Figure 5. Non-linear relationship between skills and academic achievement, by FIFS status (a) Conscientiousness (b) Conscientiousness vignette adjusted
(a) ATAR (b) Internal locus of control
Notes: Reported are the predicted weighted average mark (WAM) scores (standardised to mean 0 and standard deviation 1), separately for FIFS and non-FIFS. Each model allows for non-linearities in the relationship between skills and WAM, and an interaction term between FIFS and non-linear skill measures. Each dot represents the predicted WAM at a particular level of skill. Capped lines graph 95% confidence intervals. The estimated specification is Model (4), Table 5, with a full set of control variables. The degree of the polynomial in the given skill and interacted with the first generation indicator variable is chosen according to the AIC. Estimated coefficients are shown in Table A2 in the Online Appendix A. Figures for all skills are shown in Figure A1 in the Online Appendix A.
-1-.5
0.5
11.
52
Pred
icte
d W
AM (S
td)
-2 -1 0 1 2Conscientiousness in Std
Non-FIFSFIFS
-1-.5
0.5
11.
52
Pred
icte
d W
AM (S
td)
-2 -1 0 1 2Conscientiousness (Adj.) in Std
Non-FIFSFIFS
-1-.5
0.5
11.
52
Pred
icte
d W
AM (S
td)
-2 -1 0 1 2ATAR score in Std
Non-FIFSFIFS
-2-1
.5-1
-.50
.51
Pred
icte
d W
AM (S
td)
-2 -1 0 1 2Internality in Std
Non-FIFSFIFS
i
Supplementary Material: Online Appendix
Appendix A

ii
Table A1. Relationship between first-in-family student status, skills, and academic achievement: Full estimation results (1) (2) (3) (4) (5) (6) Benchmark
model + Married Children
+ ability proxies + SES of residential location
+ Parental encouragement
and financial support
+ Drop out after Year 1
First in family (0, 1) -0.155* -0.171* -0.182** -0.197** -0.207** -0.157* (0.088) (0.088) (0.088) (0.090) (0.090) (0.086) Female (0, 1) 0.157* 0.163** 0.179** 0.182** 0.176** 0.195** (0.081) (0.081) (0.083) (0.083) (0.084) (0.082) Age < 20 (base) 0.000 0.000 0.000 0.000 0.000 0.000 (.) (.) (.) (.) (.) (.) 19 < Age < 26 (0, 1) -0.164 -0.175 -0.182 -0.169 -0.154 -0.129 (0.135) (0.135) (0.143) (0.143) (0.143) (0.137) Age > 25 (0, 1) -0.784** -0.889** -0.912** -0.904** -0.929** -0.765** (0.373) (0.380) (0.377) (0.378) (0.378) (0.359) Diagnosed with anxiety -0.188** -0.201** -0.210** -0.187* -0.186* -0.151 (0.096) (0.095) (0.096) (0.096) (0.097) (0.092) International 0.005 0.017 -0.014 -0.536** -0.534** -0.625*** (0.143) (0.142) (0.149) (0.269) (0.272) (0.161) Semester 1 (base) 0.000 0.000 0.000 0.000 0.000 0.000 (.) (.) (.) (.) (.) (.) Semester 2 (0, 1) -0.056* -0.055* -0.057* -0.057* -0.057* -0.071** (0.029) (0.029) (0.030) (0.030) (0.030) (0.030) Semester 3 (0, 1) -0.076** -0.076** -0.083** -0.083** -0.083** -0.110*** (0.034) (0.034) (0.035) (0.035) (0.035) (0.035) Semester 4 (0, 1) -0.107*** -0.107*** -0.121*** -0.122*** -0.121*** -0.148*** (0.041) (0.041) (0.043) (0.043) (0.043) (0.043) Lives with parents (0,1) -0.275*** -0.292*** -0.295*** -0.318*** -0.311*** -0.295*** (0.096) (0.096) (0.096) (0.098) (0.099) (0.095) Financial support (0,1) -0.015 -0.033 -0.073 -0.088 -0.073 -0.029 (0.080) (0.081) (0.087) (0.086) (0.088) (0.083) ATAR score (std) 0.316*** 0.318*** 0.320*** 0.333*** 0.333*** 0.328***

iii
(0.044) (0.045) (0.046) (0.047) (0.047) (0.045) Entry mark miss (0, 1) 0.060 0.052 0.107 0.092 0.082 0.075 (0.115) (0.114) (0.112) (0.113) (0.112) (0.108) Conscientiousness (Std) 0.116*** 0.123*** 0.137*** 0.139*** 0.143*** 0.125*** (0.039) (0.038) (0.040) (0.040) (0.040) (0.039) Openness to exp (Std) 0.054 0.054 0.047 0.046 0.044 0.036 (0.037) (0.037) (0.039) (0.039) (0.039) (0.037) Extraversion (Std) -0.107*** -0.108*** -0.110*** -0.105*** -0.104*** -0.112*** (0.036) (0.036) (0.037) (0.037) (0.037) (0.036) Grit (Std) 0.008 0.008 -0.004 -0.007 -0.007 -0.005 (0.032) (0.032) (0.032) (0.032) (0.032) (0.033) Internal LOC (Std) 0.048 0.042 0.043 0.043 0.044 0.041 (0.038) (0.038) (0.038) (0.039) (0.039) (0.035) Internality missing (0, 1) -0.562 -0.450 0.000 0.000 0.000 0.000 (0.426) (0.427) (.) (.) (.) (.) Grit missing (0, 1) 0.179 0.653 0.885* 0.916* 0.934* 0.773* (0.197) (0.399) (0.481) (0.489) (0.488) (0.456) Not Married (base) 0.000 0.000 0.000 0.000 0.000 (.) (.) (.) (.) (.) Married (0, 1) 0.204 0.208 0.192 0.184 0.150 (0.210) (0.218) (0.222) (0.220) (0.198) Married miss (0, 1) -0.595 -2.687*** -2.637*** -2.636*** -2.733*** (0.448) (0.187) (0.193) (0.193) (0.184) No Kids (base) 0.000 0.000 0.000 0.000 0.000 (.) (.) (.) (.) (.) Has kids (0, 1) 0.965* 1.009* 1.005* 1.042* 0.849* (0.548) (0.522) (0.544) (0.554) (0.503) Kids missing (0, 1) 0.000 0.000 0.000 0.000 0.000 (.) (.) (.) (.) (.) Birth order miss (0, 1) 0.001 -0.010 -0.018 -0.100 (0.107) (0.107) (0.108) (0.103) First-born (0, 1) -0.078 -0.079 -0.079 -0.088 (0.089) (0.089) (0.088) (0.086)

iv
Last-born (base) 0.000 0.000 0.000 0.000 (.) (.) (.) (.) Middle born (0, 1) -0.194 -0.194 -0.200 -0.168 (0.121) (0.122) (0.123) (0.118) Don't know (0, 1) -0.306 -0.236 -0.353 -0.595** (0.213) (0.223) (0.252) (0.233) Does not live with parents 0.091 0.084 0.080 0.091 (0.104) (0.106) (0.105) (0.101) Lives with parents (base) 0.000 0.000 0.000 0.000 (.) (.) (.) (.) Postcode SES missing 0.490* 0.502* 0.599*** (0.277) (0.276) (0.160) SES low (0, 1) -0.085 -0.088 -0.131 (0.185) (0.184) (0.185) SES medium (0, 1) 0.000 0.000 0.000 (.) (.) (.) SES high (0, 1) -0.118 -0.121 -0.074 (0.080) (0.080) (0.076) Parents do not encour. 0.121 0.187 (0.132) (0.128) Parents encourage study (base)
0.000 0.000
(.) (.) Financial support am (1,000) -0.143 -0.245 (0.302) (0.286) Dropout Year 1 (0, 1) -0.865*** (0.158) Constant 0.365** 0.401*** 0.469*** 0.575*** 0.562*** 0.572*** (0.153) (0.155) (0.161) (0.168) (0.168) (0.161) Observations 2277 2277 2178 2178 2178 2178 Note: The dependent variable is the standardized (mean 0, standard deviation 1) Weighted Average Mark (WAM) observed over four semesters in Models (1)-(5), and each model is estimated with Panel Data Random Effects Models, allowing for unobserved heterogeneity in the intercept. Cluster robust standard errors in parentheses. *** p<0.001, ** p<0.05, * p<0.1.

v
Table A2. Academic achievement model allowing for non-linear skill measures and/or Interaction effects between skill and first-in-family status (1) (2) (3) (4) (5) (6) ATAR Consc Open Extra LoC Grit No interaction terms Panel A: Linear skill FIFS -0.1551* -0.1551* -0.1551* -0.1551* -0.1551* -0.1551* (0.087) (0.087) (0.087) (0.087) (0.087) (0.087) Skill 0.3162*** 0.1158*** 0.0540 -0.1072*** 0.0479 0.0077 (0.044) (0.039) (0.037) (0.036) (0.038) (0.032) AIC 5229.9320 5229.9320 5229.9320 5229.9320 5229.9320 5229.9320 Panel B: Quadratic FIFS -0.1211 -0.1535* -0.1569* -0.1465* -0.1560* -0.1544* (0.086) (0.086) (0.087) (0.087) (0.088) (0.088) Skill 0.4428*** 0.1439*** 0.0598 -0.0964*** 0.0343 0.0091 (0.043) (0.039) (0.038) (0.035) (0.040) (0.033) Skill × skill 0.1724*** 0.0826*** 0.0243 0.0632** -0.0191 0.0050 (0.036) (0.024) (0.022) (0.026) (0.031) (0.026) AIC 5211.8610 5222.7514 5231.0107 5227.0885 5231.3982 5231.9006 Panel C: Cubic FIFS -0.1203 -0.1556* -0.1575* -0.1415 -0.1609* -0.1500* (0.086) (0.086) (0.087) (0.087) (0.086) (0.087) Skill 0.4206*** 0.2402*** 0.0730 -0.0144 0.1406*** 0.0637 (0.077) (0.063) (0.053) (0.061) (0.054) (0.057) Skill × skill 0.1916*** 0.0446 0.0192 0.0472* -0.1147** -0.0078 (0.054) (0.032) (0.028) (0.028) (0.045) (0.029) Skill × skill × skill 0.0133 -0.0403** -0.0048 -0.0331* -0.0523*** -0.0213 (0.031) (0.019) (0.011) (0.018) (0.020) (0.017) AIC 5213.7200 5220.8182 5232.9088 5226.6178 5224.5122 5232.8537 Panel D; Quartic FIFS -0.1197 -0.1556* -0.1578* -0.1387 -0.1598* -0.1489* (0.086) (0.086) (0.088) (0.087) (0.086) (0.088) Skill 0.3785*** 0.2387*** 0.0401 -0.0469 0.2138*** 0.0940 (0.114) (0.069) (0.061) (0.065) (0.083) (0.064) Skill × skill 0.1681** 0.0422 -0.0245 -0.0390 -0.0784 0.0611 (0.079) (0.062) (0.050) (0.065) (0.051) (0.067)

vi
Skill × skill × skill 0.0463 -0.0394 0.0121 -0.0150 -0.0962** -0.0375* (0.070) (0.027) (0.018) (0.020) (0.045) (0.022) Skill × skill × skill × skill 0.0146 0.0006 0.0092 0.0208 -0.0154 -0.0167 (0.028) (0.013) (0.008) (0.013) (0.013) (0.013) AIC 5215.5103 5222.8166 5233.7388 5226.3162 5224.7868 5233.7312 Interaction Terms Panel E: Linear FIFS -0.1549* -0.1544* -0.1593* -0.1567* -0.1542* -0.1532* (0.086) (0.087) (0.088) (0.088) (0.087) (0.088) Skill 0.3158*** 0.0918** 0.0723* -0.1011*** 0.0429 -0.0124 (0.054) (0.041) (0.040) (0.039) (0.039) (0.034) FIFS × skill 0.0016 0.0887 -0.0621 -0.0253 0.0178 0.0808 (0.097) (0.087) (0.083) (0.094) (0.099) (0.087) AIC 5231.9317 5230.6841 5231.2754 5231.8361 5231.8808 5230.9529 Panel F: Quadratic FIFS -0.1210 -0.2438** -0.1745* -0.1683 -0.1179 -0.1050 (0.105) (0.109) (0.098) (0.110) (0.103) (0.111) Skill 0.4280*** 0.1085*** 0.0743* -0.0923** 0.0378 -0.0160 (0.049) (0.042) (0.040) (0.037) (0.042) (0.037) FIFS × skill 0.0757 0.1308 -0.0481 -0.0149 -0.0164 0.0724 (0.103) (0.083) (0.090) (0.094) (0.109) (0.091) Skill × skill 0.1720*** 0.0574** 0.0173 0.0583** -0.0075 0.0220 (0.043) (0.028) (0.027) (0.026) (0.035) (0.028) FIFS × skill × skill 0.0161 0.0924* 0.0140 0.0223 -0.0373 -0.0638 (0.069) (0.052) (0.046) (0.078) (0.076) (0.078) AIC 5215.4427 5222.9449 5234.4381 5230.9206 5234.9336 5234.1597 Panel G: Cubic FIFS -0.1057 -0.2244** -0.1642 -0.1816* -0.0269 -0.0758 (0.113) (0.109) (0.104) (0.110) (0.126) (0.110) Skill 0.3792*** 0.1818*** 0.0724 0.0252 0.1373* -0.0007 (0.093) (0.067) (0.063) (0.070) (0.070) (0.062) FIFS × skill 0.1358 0.2086 -0.0237 -0.1600 0.0158 0.2469* (0.170) (0.158) (0.129) (0.145) (0.123) (0.148) Skill × skill 0.2073*** 0.0292 0.0177 0.0345 -0.0805** 0.0143 (0.060) (0.036) (0.029) (0.029) (0.039) (0.029)
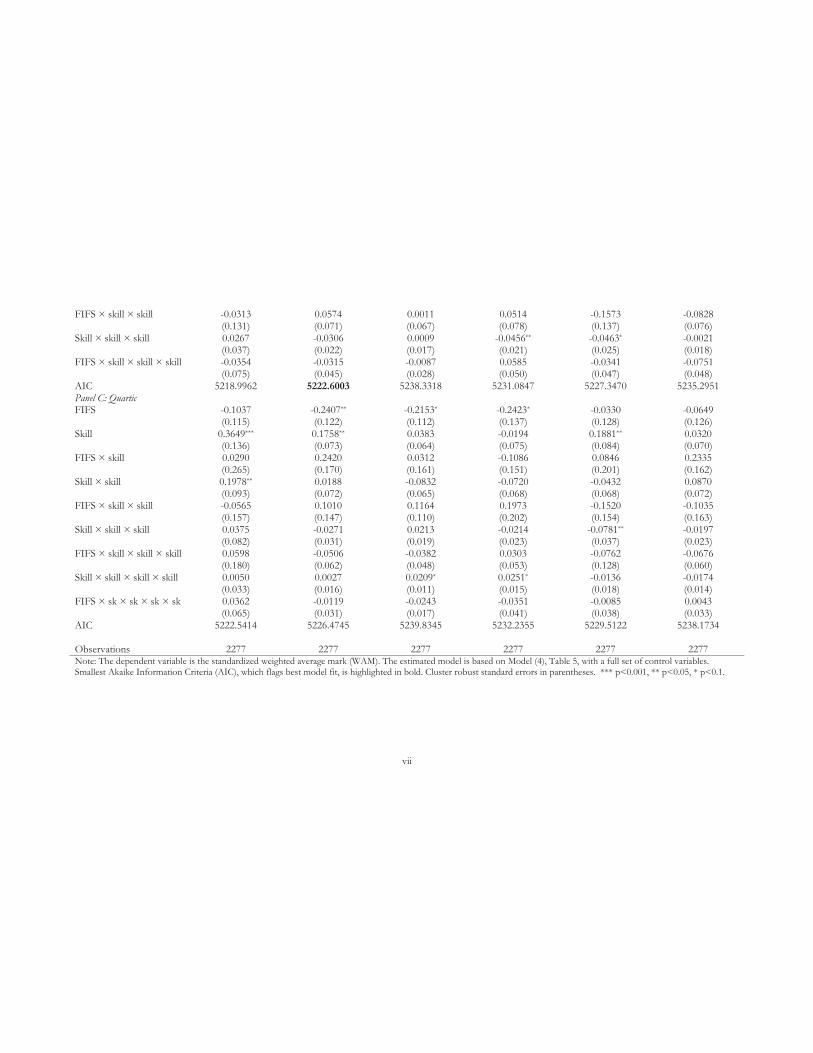
vii
FIFS × skill × skill -0.0313 0.0574 0.0011 0.0514 -0.1573 -0.0828 (0.131) (0.071) (0.067) (0.078) (0.137) (0.076) Skill × skill × skill 0.0267 -0.0306 0.0009 -0.0456** -0.0463* -0.0021 (0.037) (0.022) (0.017) (0.021) (0.025) (0.018) FIFS × skill × skill × skill -0.0354 -0.0315 -0.0087 0.0585 -0.0341 -0.0751 (0.075) (0.045) (0.028) (0.050) (0.047) (0.048) AIC 5218.9962 5222.6003 5238.3318 5231.0847 5227.3470 5235.2951 Panel C: Quartic FIFS -0.1037 -0.2407** -0.2153* -0.2423* -0.0330 -0.0649 (0.115) (0.122) (0.112) (0.137) (0.128) (0.126) Skill 0.3649*** 0.1758** 0.0383 -0.0194 0.1881** 0.0320 (0.136) (0.073) (0.064) (0.075) (0.084) (0.070) FIFS × skill 0.0290 0.2420 0.0312 -0.1086 0.0846 0.2335 (0.265) (0.170) (0.161) (0.151) (0.201) (0.162) Skill × skill 0.1978** 0.0188 -0.0832 -0.0720 -0.0432 0.0870 (0.093) (0.072) (0.065) (0.068) (0.068) (0.072) FIFS × skill × skill -0.0565 0.1010 0.1164 0.1973 -0.1520 -0.1035 (0.157) (0.147) (0.110) (0.202) (0.154) (0.163) Skill × skill × skill 0.0375 -0.0271 0.0213 -0.0214 -0.0781** -0.0197 (0.082) (0.031) (0.019) (0.023) (0.037) (0.023) FIFS × skill × skill × skill 0.0598 -0.0506 -0.0382 0.0303 -0.0762 -0.0676 (0.180) (0.062) (0.048) (0.053) (0.128) (0.060) Skill × skill × skill × skill 0.0050 0.0027 0.0209* 0.0251* -0.0136 -0.0174 (0.033) (0.016) (0.011) (0.015) (0.018) (0.014) FIFS × sk × sk × sk × sk 0.0362 -0.0119 -0.0243 -0.0351 -0.0085 0.0043 (0.065) (0.031) (0.017) (0.041) (0.038) (0.033) AIC 5222.5414 5226.4745 5239.8345 5232.2355 5229.5122 5238.1734 Observations 2277 2277 2277 2277 2277 2277 Note: The dependent variable is the standardized weighted average mark (WAM). The estimated model is based on Model (4), Table 5, with a full set of control variables. Smallest Akaike Information Criteria (AIC), which flags best model fit, is highlighted in bold. Cluster robust standard errors in parentheses. *** p<0.001, ** p<0.05, * p<0.1.

viii
Figure A1. Non-linearities in the relationship between skills and academic achievement, by FIFS status (a) ATAR (b) Conscientiousness
(c) Openness (d) Extraversion
(e) Internality (f) Grit
Notes: Reported are the predicted weighted average mark (WAM) scores (standardised to mean 0 and standard deviation 1), separately for FIFS and non-FIFS. Each model allows for non-linearities in the relationship between skills and WAM, and an interaction term between FIFS and non-linear skill measures. Each dot represents the predicted WAM at a particular level of skill. Capped lines graph 95% confidence intervals. The estimated specification is Model (4), Table 5, with a full set of control variables. Estimated coefficients are shown in Table A2 in the Online Appendix A. The degree of the polynomial in the given skill and interacted with the first generation indicator variable is chosen according to the AIC.
-1-.5
0.5
11.
52
Pred
icte
d W
AM (S
td)
-2 -1 0 1 2ATAR score in Std
Non-FIFSFIFS
-1-.5
0.5
11.
52
Pred
icte
d W
AM (S
td)
-2 -1 0 1 2Conscientiousness in Std
Non-FIFSFIFS
-1-.5
0.5
11.
52
Pred
icte
d W
AM (S
td)
-2 -1 0 1 2Openness in Std
Non-FIFSFIFS
-1-.5
0.5
11.
52
Pred
icte
d W
AM (S
td)
-2 -1 0 1 2Extraversion in Std
Non-FIFSFIFS
-2-1
.5-1
-.50
.51
Pred
icte
d W
AM (S
td)
-2 -1 0 1 2Internality in Std
Non-FIFSFIFS
-2-1
.5-1
-.50
.51
Pred
icte
d W
AM (S
td)
-2 -1 0 1 2Grit in Std
Non-FIFSFIFS

ix
Figure A2. Non-linearities in the relationship between skills and academic achievement-adjusted for reporting heterogeneity with anchoring vignettes, by FIFS status
(a) Conscientiousness
(b) Conscientiousness-adjusted
(c) Openness
(c) Openness-adjusted
Notes: Reported are the predicted weighted average mark (WAM) scores (standardised to mean 0 and standard deviation 1), separately for FIFS and non-FIFS. Each model allows for non-linearities in the relationship between skills and WAM, and an interaction term between FIFS and non-linear skill measures. Each dot represents the predicted WAM at a particular level of skill. Capped lines graph 95% confidence intervals. The estimated specification is Model (4), Table 5, with a full set of control variables. Estimated coefficients are shown in Table A2 in the Online Appendix A. The degree of the polynomial in the given skill and interacted with the first generation indicator variable is chosen according to the AIC.
-1-.5
0.5
11.
52
Pred
icte
d W
AM (S
td)
-2 -1 0 1 2Conscientiousness in Std
Non-FIFSFIFS
-1-.5
0.5
11.
52
Pred
icte
d W
AM (S
td)
-2 -1 0 1 2Conscientiousness (Adj.) in Std
Non-FIFSFIFS
-1-.5
0.5
11.
52
Pred
icte
d W
AM (S
td)
-2 -1 0 1 2Openness in Std
Non-FIFSFIFS
-1-.5
0.5
11.
52
Pred
icte
d W
AM (S
td)
-2 -1 0 1 2Openness (Adj.) in Std
Non-FIFSFIFS

x
Appendix B. Survey details and our sample
Our bespoke survey was fielded at a leading Australian university in the first week of study in
semester 1 of 2015 (March). The survey was advertised widely across campus through posters and
fliers. We also sent a series of emails to incoming students in a faculty of arts and social sciences.
Students had to give their permission to link their survey and administrative data.
In total, 1,010 students responded to the survey with minimal information provided on the
introduction page. Of these, 846 gave permission to link the survey to administrative records, at
the beginning of the survey (5 individuals at the end when participants were prompted again) and
provided a student identification code we could use to conduct the linkage. Of these, 820 provided
correct linkage key information, so that the linkage could be conducted. Of these, 733 at least
partially completed the survey, which made them eligible for entering the draw of a lottery which
we offered.
Students who completed the survey and allowed us to link it entered a draw for a lottery for 5
iPads, and 50 iMusic vouchers.Participants who provided their student identification code and started
and completed the survey entered a draw of a lottery in each we gave away 5 ipads valued at $500 each and
50 iMusic vouchers valued at $25 each. Overall, 98 percent of survey respondents agreed to have their
records linked.
We collected information on
students’ socioeconomic status including both parents’ education
family determinants of the decision to pursue university education (financial support,
encouragement, role models).
non-cognitive skill (NCS) measures
We linked survey responses to administrative student record data, which includes information on:
four semesters of students’ grade point averages (2015-2016)
university records on parental socioeconomic status
proxies for pre-university cognitive skills (standardised university admissions test scores,
the so-called ATAR).
We dropped students who:
were enrolled in postgraduate studies (34 individuals)
students who were 35 years of age or older (9 individuals), and

xi
students with missing information on their NCS (24 individuals).
Some students did not have information on other relevant characteristics. The final estimation
sample was 641 students, aged 17-34 who are enrolled in semester 1 of a Bachelor degree in March
2015.
Around 13 percent of the full available sample dropped out from their studies after Year 1 (106
out of 820 individuals). This is comparable to the general student population in Australia (see
Table 2 in the main text), only 5.6 percent dropped out from our estimation sample.

xii
Appendix C. Vignettes
Participants completed 13 self-report items designed to elicit measures of two Five Factor Model (FFM) personality traits: conscientiousness (C) and openness to experience (O). The Big Five ‘trait descriptive adjective’ (TDA) marker method upon which our measurement strategy is based was originally developed by Goldberg (1992) and a shorter version (the ‘Mini-Markers’), was developed and validated by Saucier (1994). We utilise an adapted subset of the Mini-Markers based on Losoncz (2009) and Cobb-Clark & Schurer (2012), in which C and O are indexed by seven and six TDA items respectively. Participants indicate the degree to which each of the 13 adjectives describes them on a seven-point response scale, ranging from 1 (“Does not describe me at all”) to 7 (“Describes me very well”). The items, in order of presentation, are: Orderly (C), Philosophical (O), Systematic (C), Inefficient* (C), Creative (O), Sloppy* (C), Intellectual (O), Disorganised* (C), Complex (O), Imaginative (O), Efficient (C), Careless* (C), and Deep (O); asterisks identify items that require reverse-coding and letters in brackets indicate the trait for which the item loads most strongly.
Participants are then asked to respond to a set of anchoring vignettes, a strategy designed to allow for the correction of bias induced by heterogeneity in the interpretation of response categories (termed response category differential item function; DIF). The survey instrument is shown below. The task asks the participant to read and assess three vignettes, randomly selected from the eight possible vignettes (listed below). Each consists of a brief sketch depicting a hypothetical third person whose gender is randomised for each scenario. The traits of the hypothetical characters are designed to align with various levels of the traits loading onto C and O. The participant is to assess each character using the same items and response scale as they did to rate themselves. In Table C1 below we provide the classification of each vignette as high/low on C and O.
The vignettes enable the construction of a common response scale across participants and estimation of the measurement error resulting from DIF. The multidimensional item response theory method proposed by King et al. (2004, 2007) and Bolt et al. (2014) is utilised to incorporate the anchoring vignettes as indicators of an individual’s response style.
In Table C2 we present the results of our individual fixed effects regression used to extract the adjusted self-assessed conscientiousness and openness to experience score as used in Figure 4, Panel C. To extract the vignette adjusted C and O, we use the responses to the 3 vignettes for each non-cognitive skill C and O and the self-assessed personality scores for C and O, giving up to 8 reports per individual. We use an individual fixed effects regression flexibly controlling for the vignettes the respondent faced in the survey and the vignette and respondent gender. The adjusted C and O scores for each survey respondent are then constructed using the residuals from this regression.
The distributions of the adjusted self-assessed C and O scores are shown relative to the unadjusted scores in Figure C1 for all students and for the sub-sample of first-in-family students. The distribution of C and O scores for first-generation and non-first-generation students is shown in Figure C2. Tables C3 and C4 present our robustness checks of our main results using the adjusted C and O scores.

xiii
Survey instruments
Below (C and C1) are the vignette survey instruments presented to respondents. Immediately following, we include the full text of the vignettes, describing the eight hypothetical people.
C Your perceptions about others
Below you will find descriptions of the behaviour of three people. Please rate each person’s personality similarly to how you have rated yourself in Part A.
[Note: Survey participants are presented with three randomly chosen sketches from the eight sketches listed below]
C1 How well do the following words describe [Name]. For each word, cross one box to indicate how well that word describes [Name]. There are no right or wrong answers.
Does not describe [Name] at all
Describes [Name] very well
1 2 3 4 5 6 7 Tick X one box for each word (a number for each name and adjective)
Adjectives Name 1 Name 2 Name 3 C1a Orderly C1b Philosophical C1c Systematic C1d Inefficient C1e Creative C1f Sloppy C1g Intellectual C1h Disorganized C1i Complex C1j Imaginative C1k Efficient C1m Deep
Hypothetical person sketches
1. [Mary] runs a company she founded on her own, raises three children and takes care of her household meticulously. In addition, she is active in sports and in community life. Despite her wide range of activities, she has time for her parents and to go hiking with friends. She likes reading and discussing philosophy and experimenting with new foods.
2. Already as a child [Anette] wanted to become a doctor. At school she was a moderate student lacking depth and creativity and her teachers did not believe she would be admitted to university. She did not succeed the first time, but [Anette] did not give up, she worked as an orderly at a hospital for a year, took private lessons and at second attempt she was admitted to university. Presently [Anette] is a registered doctor and the manager of a small practice.
3. [Nancy] discontinued her studies and she hasn’t been able to find a steady job for 10 years. She lives with her parents, who have difficulty coping financially. Due to being
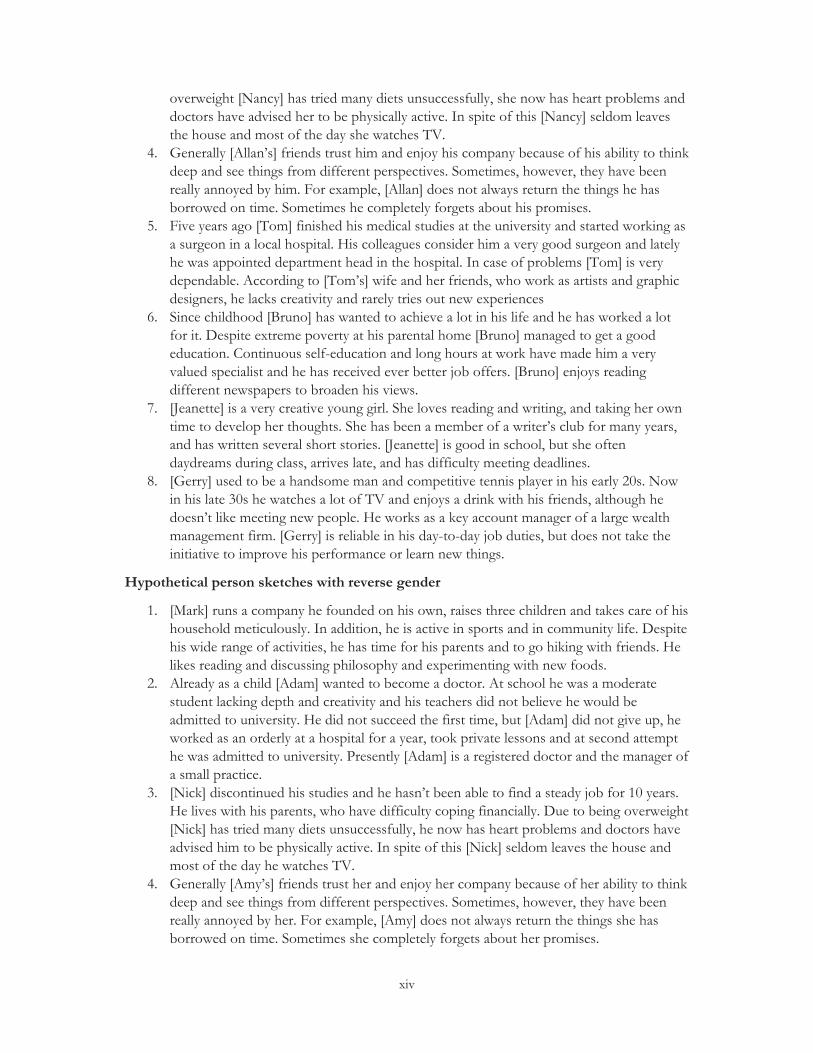
xiv
overweight [Nancy] has tried many diets unsuccessfully, she now has heart problems and doctors have advised her to be physically active. In spite of this [Nancy] seldom leaves the house and most of the day she watches TV.
4. Generally [Allan’s] friends trust him and enjoy his company because of his ability to think deep and see things from different perspectives. Sometimes, however, they have been really annoyed by him. For example, [Allan] does not always return the things he has borrowed on time. Sometimes he completely forgets about his promises.
5. Five years ago [Tom] finished his medical studies at the university and started working as a surgeon in a local hospital. His colleagues consider him a very good surgeon and lately he was appointed department head in the hospital. In case of problems [Tom] is very dependable. According to [Tom’s] wife and her friends, who work as artists and graphic designers, he lacks creativity and rarely tries out new experiences
6. Since childhood [Bruno] has wanted to achieve a lot in his life and he has worked a lot for it. Despite extreme poverty at his parental home [Bruno] managed to get a good education. Continuous self-education and long hours at work have made him a very valued specialist and he has received ever better job offers. [Bruno] enjoys reading different newspapers to broaden his views.
7. [Jeanette] is a very creative young girl. She loves reading and writing, and taking her own time to develop her thoughts. She has been a member of a writer’s club for many years, and has written several short stories. [Jeanette] is good in school, but she often daydreams during class, arrives late, and has difficulty meeting deadlines.
8. [Gerry] used to be a handsome man and competitive tennis player in his early 20s. Now in his late 30s he watches a lot of TV and enjoys a drink with his friends, although he doesn’t like meeting new people. He works as a key account manager of a large wealth management firm. [Gerry] is reliable in his day-to-day job duties, but does not take the initiative to improve his performance or learn new things.
Hypothetical person sketches with reverse gender
1. [Mark] runs a company he founded on his own, raises three children and takes care of his household meticulously. In addition, he is active in sports and in community life. Despite his wide range of activities, he has time for his parents and to go hiking with friends. He likes reading and discussing philosophy and experimenting with new foods.
2. Already as a child [Adam] wanted to become a doctor. At school he was a moderate student lacking depth and creativity and his teachers did not believe he would be admitted to university. He did not succeed the first time, but [Adam] did not give up, he worked as an orderly at a hospital for a year, took private lessons and at second attempt he was admitted to university. Presently [Adam] is a registered doctor and the manager of a small practice.
3. [Nick] discontinued his studies and he hasn’t been able to find a steady job for 10 years. He lives with his parents, who have difficulty coping financially. Due to being overweight [Nick] has tried many diets unsuccessfully, he now has heart problems and doctors have advised him to be physically active. In spite of this [Nick] seldom leaves the house and most of the day he watches TV.
4. Generally [Amy’s] friends trust her and enjoy her company because of her ability to think deep and see things from different perspectives. Sometimes, however, they have been really annoyed by her. For example, [Amy] does not always return the things she has borrowed on time. Sometimes she completely forgets about her promises.
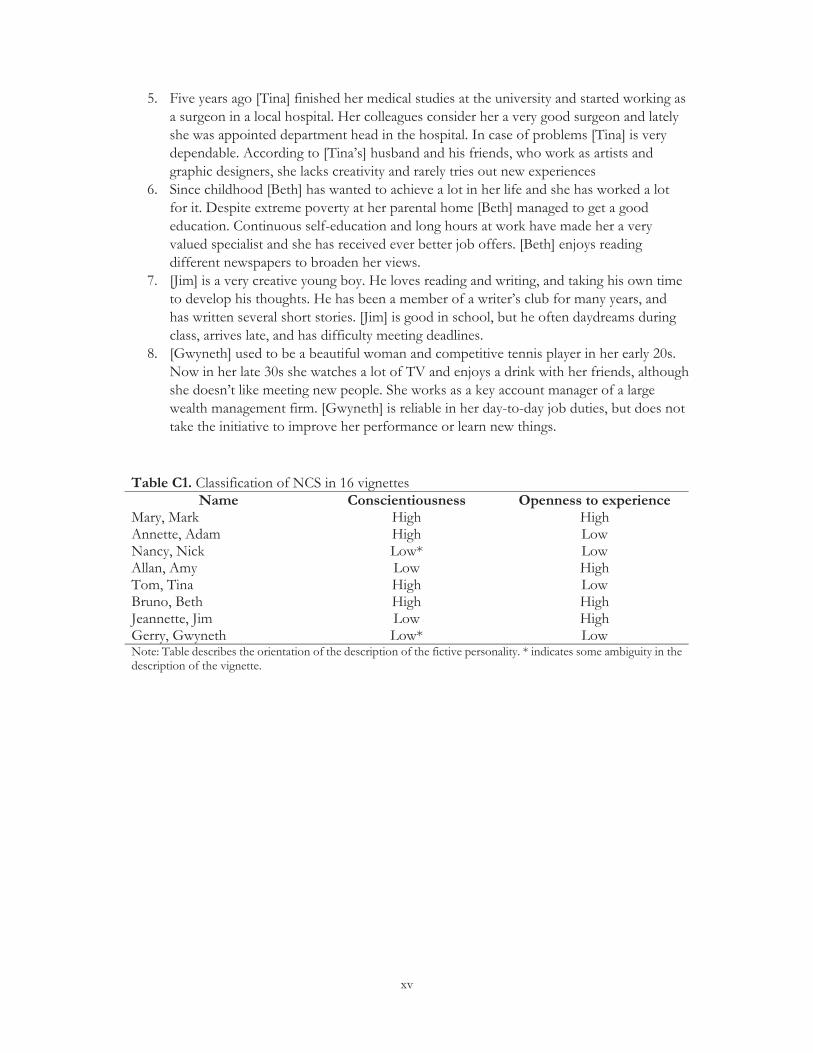
xv
5. Five years ago [Tina] finished her medical studies at the university and started working as a surgeon in a local hospital. Her colleagues consider her a very good surgeon and lately she was appointed department head in the hospital. In case of problems [Tina] is very dependable. According to [Tina’s] husband and his friends, who work as artists and graphic designers, she lacks creativity and rarely tries out new experiences
6. Since childhood [Beth] has wanted to achieve a lot in her life and she has worked a lot for it. Despite extreme poverty at her parental home [Beth] managed to get a good education. Continuous self-education and long hours at work have made her a very valued specialist and she has received ever better job offers. [Beth] enjoys reading different newspapers to broaden her views.
7. [Jim] is a very creative young boy. He loves reading and writing, and taking his own time to develop his thoughts. He has been a member of a writer’s club for many years, and has written several short stories. [Jim] is good in school, but he often daydreams during class, arrives late, and has difficulty meeting deadlines.
8. [Gwyneth] used to be a beautiful woman and competitive tennis player in her early 20s. Now in her late 30s she watches a lot of TV and enjoys a drink with her friends, although she doesn’t like meeting new people. She works as a key account manager of a large wealth management firm. [Gwyneth] is reliable in her day-to-day job duties, but does not take the initiative to improve her performance or learn new things.
Table C1. Classification of NCS in 16 vignettes Name Conscientiousness Openness to experience
Mary, Mark High High Annette, Adam High Low Nancy, Nick Low* Low Allan, Amy Low High Tom, Tina High Low Bruno, Beth High High Jeannette, Jim Low High Gerry, Gwyneth Low* Low Note: Table describes the orientation of the description of the fictive personality. * indicates some ambiguity in the description of the vignette.

xvi
Table C2. Estimation model Vignette adjustment NCS score Conscientiousness (base: Openness) 0.0005 (0.025) Self-assessed -0.899*** (0.084) Annette -0.733*** (0.108) Nancy -1.993*** (0.100) Allan -0.965*** (0.116) Tom -0.715*** (0.121) Bruno -0.291** (0.130) Jeanette -0.728*** (0.095) Gerry -1.426*** (0.119) Mark -0.033 (0.127) Adam -0.852*** (0.126) Nick -2.029*** (0.118) Amy -0.878*** (0.099) Tina -0.618*** (0.101) Beth -0.252** (0.113) Jim -0.874*** (0.129) Gwyneth -1.261*** (0.096) Female vignette -0.098 (0.065) Constant 0.982*** (0.102) Observations 4961 Individuals 663 # of obs per individual: Min, avg, max 2, 7.5, 8 Fraction of variance due to individual FE 0.170 Explained within variation 0.227 Explained between variation 0.142 Note: Model is estimated with panel data fixed effects model, where personality assessment is the dependent variable, and the independent variables are: dummy variables for own assessment and dummy variables for each vignette name, and whether it is a female vignette. We allow for individual-specific effects that correlate with the right-hand side variables. Openness is the reference trait, and Nancy (with the highest O and C scores) is the reference vignette. Standard errors in parentheses. * p < 0.10, ** p < 0.05, *** p < 0.01.

xvii
Table C3. Pre-university skills by First-in-family student status, vignette adjusted (1) (2) (3) (4) Conscientiousness (Std) Openness to experience (Std) Original Vignette
Adjusted Original Vignette
Adjusted FIFS 0.054 0.064 -0.087 -0.112 (0.092) (0.090) (0.091) (0.090) Observations 641 641 641 641 Notes: FIFS: First in family student. The estimated equation is (1). Each column shows the coefficient estimates from a separate regression with the dependent variable as listed at the top of the column. Each of the dependent variables are standardised to have a mean 0 and variance of 1 We control in each equation for gender, age categories, mental health, international student status, semester dummy variables, whether student lives with parents and whether student receives financial support, cognitive and non-cognitive skills, dummy variables for missing observations in ATAR score, internality and grit. Robust standard errors in parentheses. *** p<.001, ** p<0.05, *p<0.1.

xviii
Table C4. First in family status, skills and academic achievement – robustness to adjusted Conscientiousness and Openness to Experience
(1) (2) (3) (4) (5) (6) WAM (In Std) WAM (In Std) + control for
lagged WAM Standard deviation of
WAM NCS
Original NCS
Vignette-adjusted
NCS Original
NCS Vignette-adjusted
NCS Original
NCS Vignette-adjusted
First in family -0.155* -0.155* -0.023 -0.023 -0.092 -0.091 (0.088) (0.088) (0.046) (0.047) (0.584) (0.584) Cognitive skills (in Std) ATAR score (std) 0.316*** 0.308*** 0.133*** 0.128*** -1.500*** -1.465*** (0.044) (0.045) (0.027) (0.027) (0.300) (0.300) Non-cognitive skills (in Std) Conscientiousness 0.116*** 0.142*** 0.065*** 0.083*** -0.611** -0.693*** (0.039) (0.036) (0.024) (0.022) (0.282) (0.254) Openness 0.054 0.083** 0.020 0.040* 0.282 0.083 (0.037) (0.036) (0.025) (0.024) (0.311) (0.294) Extraversion -0.107*** -0.106*** -0.054*** -0.054*** 0.187 0.196 (0.036) (0.036) (0.020) (0.020) (0.246) (0.243) Grit 0.008 0.003 0.017 0.015 -0.680** -0.660** (0.032) (0.032) (0.023) (0.023) (0.281) (0.281) Internal LOC 0.048 0.047 0.011 0.010 0.118 0.122 (0.03 8) (0.038) (0.023) (0.023) (0.278) (0.277) Lagged WAM 0.607*** 0.606*** (0.043) (0.043) Constant 0.365** 0.363** 0.062 0.061 6.485*** 6.553*** (0.153) (0.152) (0.106) (0.105) (1.167) (1.162) Observations 2277 2277 1595 1595 2237 2237 Notes: FIFS: First in family student. All models control for the full set of control variables. Models (1), (3), and (5) use the original non-cognitive skills measures for Conscientiousness and Openness to Experience, and Models (2), (4), and (6) use the vignette measures. We control in each equation for gender, age categories, mental health, international student status, semester dummy variables, whether student lives with parents and whether student receives financial support, cognitive and non-cognitive skills, dummy variables for missing observations in ATAR score, internality and grit. Cluster robust standard errors (clustered at the individual) are presented in parentheses. *** p<0.001, ** p<0.05, * p<0.1.

xix
Figure C1. Comparison of NCS distributions between unadjusted and vignette-adjusted measures
(a) Conscientiousness
(ii) Openness
0.1
.2.3
.4fra
ctio
n
-4 -2 0 2 4Conscientiousness
AdjustedUnadjusted
Density comparison test p-val: .9401
0.1
.2.3
.4fra
ctio
n
-4 -2 0 2 4Openness
AdjustedUnadjusted
Density comparison test p-val: .801