Embed Size (px)
Citation preview

RBC Capital Markets, LLCBulent Ozcan, CFA (Analyst)(212) [email protected]
Sector: Brokers, Asset Managers & Exchanges
OutperformNYSE: SCHW; USD 29.21
Price Target USD 38.00Scenario Analysis*
DownsideScenario
23.0020%
CurrentPrice
29.21
PriceTarget
38.0031%
UpsideScenario
44.0051%
*Implied Total Returns
Key StatisticsShares O/S (MM): 1,305.8Dividend: 0.24
Market Cap (MM): 38,142Yield: 0.8%Avg. Daily Volume: 7,146,679
RBC EstimatesFY Dec 2014A 2015E 2016E 2017EEPS, Rpt Diluted 0.95 1.10 1.58 1.82P/Rpt EPS 30.7x 26.6x 18.5x 16.0xEBITDA 2,314.0 2,665.4 3,725.6 4,307.6DPS 0.24 0.24 0.33 0.40Div Yield 0.8% 0.8% 1.1% 1.4%BVPS Basic 8.97 10.27 12.11 14.20P/BVPS 3.26x 2.84x 2.41x 2.06x
EPS, Rpt Diluted Q1 Q2 Q3 Q42014 0.24A 0.23A 0.24A 0.25A2015 0.26E 0.26E 0.27E 0.30E2016 0.39E 0.37E 0.39E 0.42EEBITDA2014 570.0A 569.0A 567.0A 608.0A2015 616.6E 652.0E 655.1E 741.7E2016 903.8E 895.7E 915.6E 1,010.4EAll values in USD unless otherwise noted.
March 26, 2015
The Charles Schwab CorporationInitiating at Outperform: With Ample Catalysts,Expect Strong Earnings GrowthOur view: Charles Schwab stands out as having the strongest franchiseamongst its peers. We believe that its diversified business model willallow the firm to capitalize on numerous secular tailwinds to generateasset growth. Furthermore, the firm is the most asset-sensitive and shouldbenefit disproportionately from higher interest rates. We expect EPS togrow at a CAGR of over 25% over the next three years.
Key points:Our in-depth study of the latest industry dynamics and our extensiveanalysis on the company's interest rate sensitivity leads us to believe thatthat The Charles Schwab Corporation is uniquely positioned to generatestrong earnings growth.
We expect numerous secular trends to contribute to top line expansion:
• Growth of independent RIAs: Schwab is the largest custodian forindependent RIAs. Our analysis indicates that wirehouse departures willaccelerate, with over $64 billion of assets likely to move this year. RIAassets under management are expected to reach $3.4 trillion in 2015.
• Growth of advice-based revenues: We estimate that valuations couldbenefit by $3 to $5 if the company were to increase the percentage ofretail clients' AUM that is receiving advice from 17% to 30%.
• Increase in popularity of ETFs: Passively managed products haveenjoyed increasing demand among investors. Schwab generatesrevenues through management fees, "program fees", and platform fees,among others. PwC expects that industry-wide ETF assets could doubleby 2020 and exceed $5 trillion.
• Introduction of the robo-advisor product: We believe that Schwabcould grow its assets by providing services to the general public whohave been unable to retain professional asset allocation advice.
Furthermore, we expect rising interest rates and cost control efforts tocontribute to margin expansion:
• Higher interest rates could boost earnings and margins: We expectrising interest rates to disproportionately benefit Schwab. We estimatethat a 50 basis points increase in interest rates could add $0.31 per shareto earnings.
• Expense saves could add incrementally to margin expansion: Effortssuch as relocating employees to low-cost locations and back officeefficiency improvements should contribute to margin expansion.
We are modeling pre-tax operating margins of 45% for 2016, up from 35%in 2014. Our above-consensus price target of $38 is based on a 26x P/Emultiple and 2016E EPS of $1.58.
Priced as of prior trading day's market close, EST (unless otherwise noted).For Required Conflicts Disclosures, see Page 47.

Target/Upside/Downside Scenarios
Exhibit 1: The Charles Schwab Corporation
150m
100m
50m
N2012
D J F M A M J J A S O N2013
D J F M A M J J A S O N2014
D J F2015
M
UPSIDE 44.00TARGET 38.00
CURRENT 29.21
DOWNSIDE 23.00
Mar 2016
423732
27
22
17
12
125 Weeks 02NOV12 - 25MAR15
SCHW Rel. S&P 500 COMPOSITE MA 40 weeks
Source: Bloomberg and RBC Capital Markets estimates for Upside/Downside/Target
Target price/base caseOur 12-month price target for SCHW is $38. We arrive at ourprice target using a price-to-earnings multiple of 26.0x on our2016 calendar year earnings estimate of $1.58 per dilutedweighted average shares. We then discount the resultingvaluation using a cost of equity of 10.7%.
Our base case scenario valuation is based on theseassumptions for 2016: Net interest margins of 175 basis pointsby 2016; interest-earning assets of $162.9 billion; total fundingsources of $158.3 billion; daily average revenue trades of319,000; average revenue per revenue trade of $12.05; and apre-tax margin of 44.7%.
Upside scenarioOur valuation is $44 based on 2016 EPS of $1.69 and a price-to-earnings multiple of 28.0x.
Our upside scenario valuation is based on these assumptionsfor 2016: Net interest margins of 189 basis points by 2016;interest- earning assets of $162.9 billion; total funding sourcesof $158.3 billion; daily average revenue trades of 321,000;average revenue per revenue trade of $12.05; and a pre-taxmargin of 46.3%.
Downside scenarioOur valuation is $23 based on 2016 EPS of $1.47 and a price-to-earnings multiple of 17.0x.
Our downside scenario valuation is based on theseassumptions for 2016: Net interest margins of 160 basis pointsby 2016; interest-earning assets of $162.9 billion; total fundingsources of $158.3 billion; a daily average revenue trades of317,000; average revenue per revenue trade of $12.05; and apre-tax margin of 43.1%.
Investment summaryWe are rating the shares of The Charles Schwab Corporationat Outperform, as we believe that the firm's diverse businessmodel allows it to capitalize on numerous opportunities togrow earnings.
Potential Catalysts• Growth of independent RIAs: Schwab is the largest
custodian to independent RIAs. Our analysis indicates thatwirehouse departures will accelerate, with over $64 billionof assets moving this year.
• Growth of advice-based revenues: We estimate thatvaluations could benefit by $3 to $5 if the company were toincrease percentage of retail clients' AUM that is receivingadvice from 17% to 30%.
• Increase in popularity of ETFs: Schwab generates revenuesthrough management fees, "program fees", and platformfees among others. PwC expects that industry-wide ETFassets could double by 2020 and exceed $5 trillion.
• Introduction of the robo-advisor product: We believe thatSchwab could grow its assets by providing services tothe general public, which has not been able to retainprofessional asset allocation advice.
• Higher interest rates could boost earnings and margins:We expect rising interest rates to disproportionately benefitSchwab. We estimate that a 50 basis points increase ininterest rates could add $0.31 per share to earnings.
• Expense saves could add incrementally to marginexpansion: Efforts such as relocating employees to low costlocations and back office efficiency improvements shouldcontribute to margin expansion.
Risks:• Prolonged period of low interest rates could lead to a decline
in net interest margins and earnings.• Unforeseen regulatory changes could impact growth and
profitability.• Increased competition could lead to balance sheet growth
below our expectation and earnings shortfall.• Losses from credit exposure could negatively impact
earnings.• Drop in consumer confidence and equity markets could
negatively impact trading revenues and fee-based earnings.
The Charles Schwab CorporationBrokers, Asset Managers & Exchanges
March 26, 2015 Bulent Ozcan, CFA (212) 863-4818; [email protected] 2

Key questions
Our view
1. Given Schwab’s size, can the company continue growing assets at a fast pace?
We believe that Schwab can continue to grow its balance sheet and add client assets at an attractive pace. We think that there are certain secular trends that could support our assertion. We expect that advisors could leave wirehouses at an accelerated rate, favoring open architecture. We expect demand for exchange traded funds (ETFs) to increase. We believe that Schwab should be able to gain traction with some of the new products it has been working on, such as ETF-based 401k plans or the firm’s “robo-advisor” that is going to be rolled out in 1Q/15 (see section on “innovative operator” beginning on page 5).
2. How should investors think about the firm’s interest rate sensitivity?
Schwab is by far the most asset-sensitive name among the discount brokers. About 75% of the assets are sensitive to movements in short-term rates. We estimate that the elimination of money market fee waivers alone could add about 16 cents to earnings. That is equal to 17% of the firm’s 2014 earnings per diluted share. Furthermore, Schwab earns a net interest margin on assets on its balance sheet. We would expect net interest margins to widen as interest rates move higher. We estimate this could add another $0.15 for a 50-bps move in rates. Thus, earnings could increase by over 30% for a 50-bps increase in interest rates. Furthermore, we would expect asset sensitivity to increase from recent changes enacted to sweep account thresholds. Schwab is now routing money coming to the broker–dealer onto its balance sheet at an increased rate. This decision is expected to add about $6 billion to Schwab’s balance sheet in 2015 alone. We believe an improving interest rate environment could significantly alter the value proposition. Our economists expect yield on the three-month treasury bill to increase from 0.04% in 2014, to 0.90% in 2015, and to further increase to 2.80% in 2016.
3. Are there any regulatory headwinds investors should be concerned about?
We believe that some of the most significant regulatory changes have already taken place. The SEC has provided new rules in respect to money market funds, which worked out in Schwab’s favor. The company has disclosed its expectation around the impact of the new Liquidity Coverage Ratio rules on its earnings—which is about half a penny per year.
4. How well does the company manage its balance sheet and its credit exposure?
We believe that the management team has been a good steward of capital. The ratio of non-performing assets to average loans and real estate owned has fluctuated around 50 basis points since 2009, peaking at 68 basis points in 2010. This ratio has declined further in 2014. As of December 31, 2014, outstanding mortgage and home equity loans were about $11 billion. We would not expect a sharp increase in default rates and thus see credit risk as not significant.
The Charles Schwab CorporationBrokers, Asset Managers & Exchanges
March 26, 2015 Bulent Ozcan, CFA (212) 863-4818; [email protected] 3

Table of contents
An innovative operator with multiple levers to generate asset growth, we expect strong top line growth .......................................................................................................... 5
Well positioned to take advantage of growth of independent RIAs ................................... 6
Advisory opportunity to deepen share of wallet; could add $3 to $5 to valuation ............ 9
Growth in usage of ETFs could boost asset growth at Schwab ......................................... 10
Robo-advisors could help the firm grow assets by focusing on an untapped market ...... 14
Concluding thoughts on ability to grow assets ................................................................. 15
We expect incremental contributions to earnings growth and margin expansion from rising interest rates and efforts to control costs ................................................................. 19
We expect rising interest rates to benefit Schwab’s earnings more than that of its peers ................................................................................................................................. 19
Expense saves could add to the bottom line and help expand margins ........................... 23
Where we could be wrong ................................................................................................. 27
Interest rate sensitivity could be a headwind, compressing net interest margins, if rates do not rise ................................................................................................................ 27
Given reliance on offices and infrastructure, required investments could lead to lower margins ................................................................................................................... 27
Schwab is under the supervision of a number of regulators putting the company at a disadvantage with respect to capital deployment ......................................................... 27
Valuation framework ......................................................................................................... 29
Risks and price target impediments ................................................................................... 31
Quick overview of Charles Schwab Corp. ............................................................................ 32
Revenue break-down ......................................................................................................... 35
Sources of revenue ........................................................................................................... 35
Business segments ............................................................................................................ 36
Products ............................................................................................................................. 38
Distribution ........................................................................................................................ 41
Competitors ....................................................................................................................... 42
History................................................................................................................................ 43
Management team ............................................................................................................. 44
The Charles Schwab CorporationBrokers, Asset Managers & Exchanges
March 26, 2015 Bulent Ozcan, CFA (212) 863-4818; [email protected] 4

An innovative operator with multiple levers to generate asset growth, we expect strong top line growth
Having built the most diverse business model among its peers, we believe that Schwab has multiple opportunities it can capitalize on to grow assets. Today, Schwab offers a full range of services, including wealth management, securities brokerage, banking, money management, and financial advisory services. It serves individual investors, as well as institutional clients. The firm has been an early adopter of technology and management seems comfortable with exploring new venues of revenues in order to remain relevant. While commissions were the main driver of earnings in the past, today, about half of the client assets are under some form of fee-based advisory relationship.
The table below compares the breadth of Schwab’s offerings versus those of its peers.
Exhibit 2: Charles Schwab offers a wide range of services and products
SCHW AMTD ETFC
Brokerage
Full range of investment products
Third-party research
In-house research
Mutual funds
Proprietary funds
Third-party funds
Exchange Traded Funds
Proprietary funds
Third-party funds
Advice - In-House
Investment advice
Tailored portfolio construction
Portfolio management
Separately managed accounts
Financial consultants 1,200 ~700 300
RIA relationships 7,000 ~5,000
Number of branches 325+ 105 30
Corporate services
Retirement plans (401k)
Equity compensation plans
Banking services
Full service bank
Trust
Custody services
Administrative trustee services
Source: Company reports, RBC Capital Markets
The firm has built a diversified business, offering more products and services than its peers do
The Charles Schwab CorporationBrokers, Asset Managers & Exchanges
March 26, 2015 Bulent Ozcan, CFA (212) 863-4818; [email protected] 5

Clearly, the distinction between services a traditional broker and Schwab can offer is not as clear-cut as it once was. Schwab continues to innovate and be an early adopter of products and technologies management deems worthwhile pursuing. This is exactly why we like the company: Management seems to have created a unique culture of innovation and adaptation, which we deem essential to succeed in a fast-paced industry.
Given Charles Schwab’s strong corporate culture, we would expect the firm to remain innovative and to pursue various opportunities to generate growth. Below are some of these potential opportunities. Please refer to our industry piece for a detailed discussion on current industry themes and drivers.
Well positioned to take advantage of growth of independent RIAs We view the independent RIA market as a meaningful venue of growth for Charles Schwab. We expect record advisor departures from wirehouses in 2015 and estimate that independent RIAs could control $3.4 trillion of assets by the end of this year. This provides multiple opportunities to grow revenues.
While not entirely new, Schwab has been a custodian for 25 years, recent developments bode well for the company. Today, Schwab Advisor Services is the largest custodian, serving more than 7,000 independent registered investment advisors (RIAs) with $1 trillion of assets under their management (as of September 30, 2014). About 1,800 professionals provide custody, trading, and operations support. Their role is to help RIAs focus on their main objective, namely growing their business. A custodian holds the clients’ assets, but can also provide investment products, practice management solutions, back-office technology, and service support.
We believe that wirehouse departures will not only continue, but they can accelerate.
The RIA industry is growing very rapidly as more advisors are leaving the wirehouses either to retain more of the revenues they would otherwise have to share, because they like the open architecture firms such as Schwab can provide, or due to pressure by the wirehouses to eliminate less-profitable clients. Some advisors who have left the wirehouses complain that the push to move “upmarket” makes it less profitable for the advisor to serve mass-affluent clients. Merrill Lynch, for example, is implementing rules in 2015 that will negatively impact brokers’ payouts if they service a large number of affluent client households with under $250,000 in assets. Regulatory changes/scrutiny is also contributing to departures. Some advisors do not like the additional compliance and administrative burdens that come with being part of a wirehouse.
According to InvestmentNews, advisor-move activity is expected to pick up in 2015 should the economy continue to recover. Investment News projects that there will be an increase in the assets moving by an average of about 15%. Thus, assuming that the same ratio of advisors decide to leave the wirehouse channel as in 2014 to become independent (vs. moving to another wirehouse), there could be a record $64.3 billion of assets these advisors could take with them in 2015. The exhibit below shows. Assuming that Schwab’s market share of the RIA custody market is about 45%, as per Bernie Clark who is the executive vice president of Schwab Advisor Services, we calculate that the move by wirehouse advisors could add another $29b of new client assets.
We believe that breakaway brokers represent a very appealing opportunity, as Schwab is the largest custodian for independent RIAs
We estimate that breakaway brokers could add about $29 billion to Schwab’s net client assets in 2015
The Charles Schwab CorporationBrokers, Asset Managers & Exchanges
March 26, 2015 Bulent Ozcan, CFA (212) 863-4818; [email protected] 6

Exhibit 3: Wirehouse departures could accelerate in 2015 ($ in billion)
$27.1
$35.7
$62.6 $58.7
$55.9
$64.3
0%
10%
20%
30%
40%
50%
60%
70%
80%
$0
$10
$20
$30
$40
$50
$60
$70
$80
2010 2011 2012 2013 2014 2015E
Amount of Total AUM Leaving Wirehouses As % of Total AUM Moving
Source: InvestmentNews; RBC Capital Markets estimates
In addition, existing RIAs are growing their practices faster and adding assets, which helps discount brokers. RIA assets grew by 19.2% in 2013, following an increase of 15.5% in 2012, according to InvestmentNews. While some of the growth was attributable to movements in the markets, a larger portion of the growth seems to have been driven either by new assets that the RIAs did not manage before or by an increase in the assets provided by their existing clients. About 45% of the new assets were from new clients and another 16% were from existing clients in 2013. As a comparison, about 39% of new assets were from new clients and 22% of assets were from existing clients in 2012.
We estimate that the assets managed by RIAs were about $2 trillion by the end of 2012. Assuming a 19.2% growth in 2013, assets would have been around $2.4 trillion. Using the same assumptions for 2014 and 2015, we would expect RIA assets under management to be around $3.4 trillion by the end of 2015.
Exhibit 4: Assets managed by RIAs could reach $3.4 trillion by 2015 ($ in trillion)
$2.0
$2.4
$2.8
$3.4
$-
$0.5
$1.0
$1.5
$2.0
$2.5
$3.0
$3.5
$4.0
2012 2013 2014E 2015E
Source: InvestmentNews; RBC Capital Markets estimates
Is the 19.2% growth assumption reasonable? We believe so and think that this estimate could be somewhat conservative if we assume that the growth rate for all RIAs corresponds
Existing RIAs continue to grow their client assets, with over a third of these assets coming from new clients
The Charles Schwab CorporationBrokers, Asset Managers & Exchanges
March 26, 2015 Bulent Ozcan, CFA (212) 863-4818; [email protected] 7

to what the top 50 RIAs have been able to achieve. Data collected by InvestmentNews shows that the AUM grew at a CAGR of 23% over the past two years for the top 50 fee-only RIAs. While assets stood at $277.8 billion in 2012, that figure increased to nearly $416.9 billion by 2014.
Exhibit 5: Fee-only RIAs are managing more assets than a few years ago ($ in millions)
$277,767
$310,579
$416,855
$-
$50,000
$100,000
$150,000
$200,000
$250,000
$300,000
$350,000
$400,000
$450,000
2012 2013 2014
Total AUM of the top 50 fee-only RIAs
Source: InvestmentNews; RBC Capital Markets
The increase in assets managed by RIAs could benefit the discount brokers as they act as custodians for them. The exhibit below shows a ranking by number of RIA clients. Schwab serves more independent RIAs than any of its competitors.
Exhibit 6: SCHW is the top custodian based on number of RIA relationships (2014)
($ in billion)
# of RIA
clients
RIA Assets in
Custody
Schwab Advisor Services 7,000 $1,081.0
TD Ameritrade Institutional 4,500 $300.0
Fidelity Institutional Wealth Services 2,948 n/a
Trade-PMR Inc. 1,525 n/a
Interactive Brokers 1,388 $150.0
Shareholders Service Group 1,255 n/a
Scottrade Advisor Services 1,100 n/a
Pershing Advisors Solutions 562 $106.4
Folio Institutional 325 n/a
Raymond James Investment Advisors Division 285 $100.0
LPL Financial LLC 282 $78.0
Source: InvestmentNews; RBC Capital Markets
Schwab, as the largest custodian for independent RIAs, stands to benefit from growth in RIA assets
The Charles Schwab CorporationBrokers, Asset Managers & Exchanges
March 26, 2015 Bulent Ozcan, CFA (212) 863-4818; [email protected] 8

Discount brokers do not usually charge custodian fees. Nonetheless, the firms can generate revenues as they are charging trading commissions, earning fees when an ETF is part of a customer’s model portfolio the company runs (advisory fees), and charging sales commissions. The ETF provider also pays a platform fee to be on the discount broker’s platform.
There is also room to grow by focusing on existing relationships. The firm’s share of wallet of its RIA assets is about 45% at this point and Schwab is keen to grow this. These RIAs are using multiple custodians. The firm should be able to get more of the assets by eliminating the need to have multiple custodians. There could be a benefit to the RIA to deal with one custodian, but the RIA has to be comfortable with the product offering, service, and counterparty risk. We believe that Schwab can address these concerns over time.
Advisory opportunity to deepen share of wallet; could add $3 to $5 to valuation We believe there is a significant opportunity to generate advice-based revenues from retail clients by increasing the share of wallet from currently 17% to the industry standard of 30%.
Currently, Schwab manages about $183 billion of retail client assets under an advisor relationship. Thus, only about 17% of the current retail clients’ AUM receive some sort of advice. This compares to about 30% to 35% for the wirehouses. Put differently, we believe there is an opportunity to gain some of the 83% of assets that are currently “self-directed”. Assuming that the firm manages to achieve the wirehouse-average of 30% of assets in an advisory relationship, we think there could be a significant opportunity to add to earnings and valuation.
Exhibit 7: Increasing the share of wallet to 30% could add $0.12 to $0.20 to earnings
Assumed incremental margins 35% 40% 45% 50% 55% 60%
Incremental EPS per diluted share @
18% share of wallet $0.01 $0.01 $0.01 $0.01 $0.01 $0.02
19% share of wallet $0.02 $0.02 $0.02 $0.03 $0.03 $0.03
20% share of wallet $0.03 $0.03 $0.03 $0.04 $0.04 $0.05
21% share of wallet $0.04 $0.04 $0.05 $0.05 $0.06 $0.06
22% share of wallet $0.04 $0.05 $0.06 $0.06 $0.07 $0.08
23% share of wallet $0.05 $0.06 $0.07 $0.08 $0.08 $0.09
24% share of wallet $0.06 $0.07 $0.08 $0.09 $0.10 $0.11
25% share of wallet $0.07 $0.08 $0.09 $0.10 $0.11 $0.12
26% share of wallet $0.08 $0.09 $0.10 $0.11 $0.13 $0.14
27% share of wallet $0.09 $0.10 $0.11 $0.13 $0.14 $0.15
28% share of wallet $0.10 $0.11 $0.13 $0.14 $0.15 $0.17
29% share of wallet $0.11 $0.12 $0.14 $0.15 $0.17 $0.18
30% share of wallet $0.12 $0.13 $0.15 $0.16 $0.18 $0.20
@ 50 bps management fees
Source: Company filings; RBC Capital Markets estimates
The above scenario assumes retail AUM of $1,077 billion. Furthermore, we are assuming a 38% tax rate. Applying a 25x P/E multiple on these earnings would add anywhere from $2.89 to $4.95 to valuations by our calculations—this excludes any organic growth.
Schwab can generate revenues in multiple ways when serving as a custodian: Management fees on funds and ETFs, commission revenues, and shelf space fees charged to fund manufacturers are just some examples
The firm could add about $3–$5 per share to its valuation by broadening its advisory relationship with clients from 17% to an industry average of 30%
The Charles Schwab CorporationBrokers, Asset Managers & Exchanges
March 26, 2015 Bulent Ozcan, CFA (212) 863-4818; [email protected] 9

Exhibit 8: At 30% share of wallet, valuations could improve between $3 to $5
Assumed incremental margins 35% 40% 45% 50% 55% 60%
Incremental EPS per diluted share @
18% share of wallet $0.22 $0.25 $0.29 $0.32 $0.35 $0.38
19% share of wallet $0.44 $0.51 $0.57 $0.63 $0.70 $0.76
20% share of wallet $0.67 $0.76 $0.86 $0.95 $1.05 $1.14
21% share of wallet $0.89 $1.02 $1.14 $1.27 $1.40 $1.52
22% share of wallet $1.11 $1.27 $1.43 $1.59 $1.74 $1.90
23% share of wallet $1.33 $1.52 $1.71 $1.90 $2.09 $2.28
24% share of wallet $1.55 $1.78 $2.00 $2.22 $2.44 $2.66
25% share of wallet $1.78 $2.03 $2.28 $2.54 $2.79 $3.05
26% share of wallet $2.00 $2.28 $2.57 $2.85 $3.14 $3.43
27% share of wallet $2.22 $2.54 $2.85 $3.17 $3.49 $3.81
28% share of wallet $2.44 $2.79 $3.14 $3.49 $3.84 $4.19
29% share of wallet $2.66 $3.05 $3.43 $3.81 $4.19 $4.57
30% share of wallet $2.89 $3.30 $3.71 $4.12 $4.54 $4.95
@ 50 bps management fees
Source: Company filings; RBC Capital Markets estimates
Growth in usage of ETFs could boost asset growth at Schwab We expect demand for ETFs to increase, providing Schwab with an opportunity to add to its assets under management and revenues. The company offers proprietary and third-party ETFs.
We expect exchange traded funds (ETFs) to continue to gain market share. A recently published study by PricewaterhouseCoopers (ETF 2020 – Preparing for a new horizon) suggests that global ETF assets could grow from $2.6 trillion in 2014 to $5 trillion by 2020. Our own research shows that a majority of active managers were not able to beat their benchmark in 11 out of 13 years under review. We think that ETFs will become increasingly popular and that Schwab should benefit from this trend in multiple ways:
It offers its own proprietary ETFs;
Schwab earns a “program fee” of up to $250,000 for each ETF on its platform that participates in ETF OneSource;
It also earns an annual asset fee of up to 15 basis points on the total ETF asset purchased by customers; and
The firm earns trading commissions when a client buys/sells ETFs that are not on the OneSource platform.
Schwab has a number of proprietary ETFs across three core asset classes (domestic equities, international equities, and bonds). It offers these products in two different flavors: market-cap index ETFs and fundamental index ETFs. These products are offered commission free, but the company generates revenues through management fees. As the exhibit below shows, Schwab’s ETFs are very competitively priced.
PwC expects the ETF market to double in size by 2020 and our research supports this as active managers continue to lag their benchmarks
The Charles Schwab CorporationBrokers, Asset Managers & Exchanges
March 26, 2015 Bulent Ozcan, CFA (212) 863-4818; [email protected] 10

Exhibit 9: Schwab’s ETFs are very competitively priced (2014)
Strategy Schwab Vanguard iShares
Multi-cap core 4 bps 5 bps 15 bps
Large-cap core 4 bps 9 bps 7 bps
Large-cap growth 7 bps 9 bps 15 bps
Large-cap value 7 bps 9 bps 18 bps
Equity income 7 bps 10 bps 12 bps
Mid-cap core 7 bps 9 bps 14 bps
Small-cap core 8 bps 9 bps 14 bps
Real estate 7 bps 10 bps 35 bps
Core bond 6 bps 8 bps 8 bps
Inflation protected bond 7 bps 10 bps 10 bps
Short-term US Treasury 8 bps n/a 15 bps
General US Treasury 10 bps 12 bps 15 bps
Source: Company reports; RBC Capital Markets
In addition, Schwab offers a product called Schwab ETF OneSource. This platform allows the firm’s customers to trade about 200 exchange traded funds from 13 providers commission free. The exhibit below compares Schwab’s offering versus its peers.
Exhibit 10: Schwab has the broadest ETF selection among peers (2014)
Schwab E*TRADE AMTD Fidelity
Commission free ETFs 198 108 101 76
# of ETF providers 13 3 9 2
Morningstar categories covered 64 37 44 51
Source: Company reports; RBC Capital Markets
As active managers underperform their benchmark, we would expect Schwab to be a beneficiary of increased demand for passive strategies We would expect continued growth in the usage of exchange traded funds and indexed funds. As we have outlined in our industry note, we are continuing to see a majority of active asset managers underperform their benchmark. Performance in 2014 seems to have gotten worse, not better.
Exhibit 11: Active managers continued to underperform in 2014
ALL US open-ended funds
Nov-13 Dec-13 Jan-14 Feb-14 Mar-14 Apr-14 May-14 Jun-14 Jul-14 Aug-14 Sep-14 Oct-14 Nov-14# of funds beating benchmark 2550 2598 2522 2599 2524 2457 2318 2530 2416 2397 2315 2213 2083# of funds with data 5904 5959 5964 5968 5972 5977 5979 5985 5987 5989 5995 5996 5995% of funds beating benchmark 43.2% 43.6% 42.3% 43.5% 42.3% 41.1% 38.8% 42.3% 40.4% 40.0% 38.6% 36.9% 34.7%
ALL US open-ended FIXED INCOME funds
Nov-13 Dec-13 Jan-14 Feb-14 Mar-14 Apr-14 May-14 Jun-14 Jul-14 Aug-14 Sep-14 Oct-14 Nov-14# of funds beating benchmark 545 528 466 473 484 463 464 582 592 601 589 509 453# of funds with data 1023 1033 1034 1035 1036 1036 1036 1036 1038 1038 1040 1041 1039% of funds beating benchmark 53.3% 51.1% 45.1% 45.7% 46.7% 44.7% 44.8% 56.2% 57.0% 57.9% 56.6% 48.9% 43.6%
ALL US open-ended EQUITY funds
Nov-13 Dec-13 Jan-14 Feb-14 Mar-14 Apr-14 May-14 Jun-14 Jul-14 Aug-14 Sep-14 Oct-14 Nov-14# of funds beating benchmark 1555 1608 1620 1672 1609 1567 1398 1366 1207 1098 1043 1039 979# of funds with data 3174 3197 3200 3202 3204 3208 3210 3215 3215 3216 3217 3217 3219% of funds beating benchmark 49.0% 50.3% 50.6% 52.2% 50.2% 48.8% 43.6% 42.5% 37.5% 34.1% 32.4% 32.3% 30.4%
Note: 1-year returns ending in the month. Benchmark used is the primary prospectus benchmark for each fund. Actively managed US mutual funds, ex-index funds. Fund returns exclude sales charges, but include management, administrative, and 12b-1 fees. Source: Morningstar, RBC Capital Markets
The Charles Schwab CorporationBrokers, Asset Managers & Exchanges
March 26, 2015 Bulent Ozcan, CFA (212) 863-4818; [email protected] 11
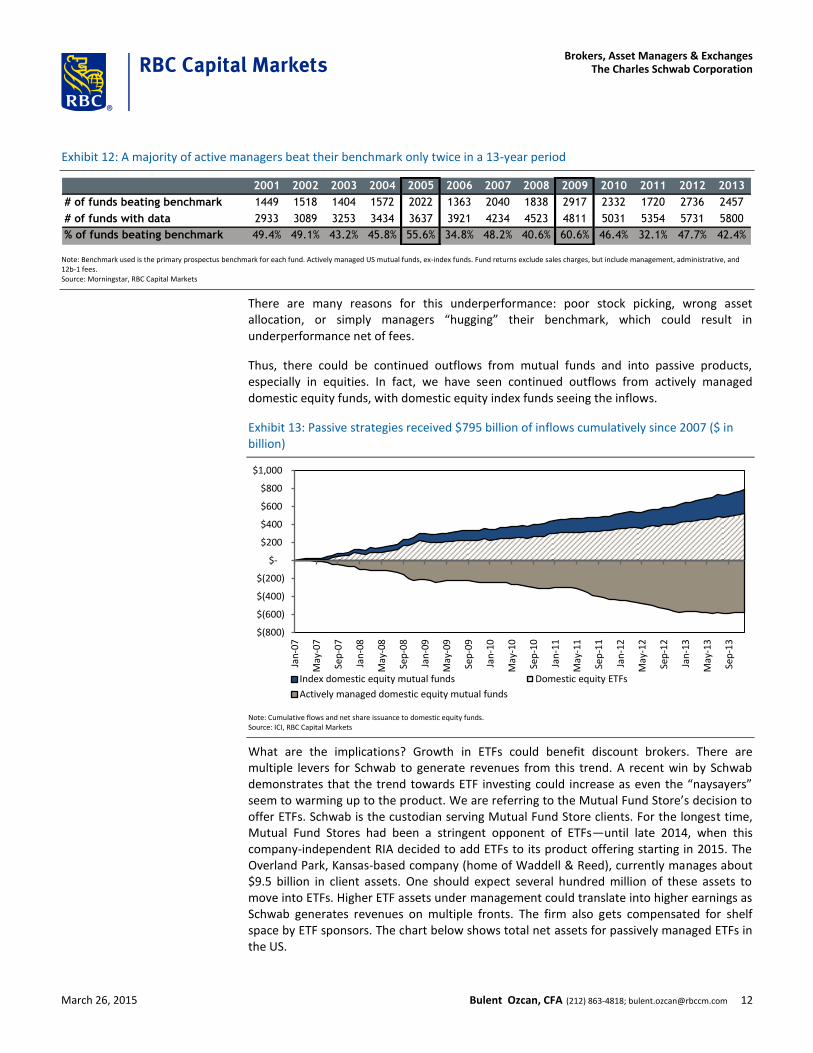
Exhibit 12: A majority of active managers beat their benchmark only twice in a 13-year period
2001 2002 2003 2004 2005 2006 2007 2008 2009 2010 2011 2012 2013
# of funds beating benchmark 1449 1518 1404 1572 2022 1363 2040 1838 2917 2332 1720 2736 2457
# of funds with data 2933 3089 3253 3434 3637 3921 4234 4523 4811 5031 5354 5731 5800
% of funds beating benchmark 49.4% 49.1% 43.2% 45.8% 55.6% 34.8% 48.2% 40.6% 60.6% 46.4% 32.1% 47.7% 42.4%
Note: Benchmark used is the primary prospectus benchmark for each fund. Actively managed US mutual funds, ex-index funds. Fund returns exclude sales charges, but include management, administrative, and 12b-1 fees. Source: Morningstar, RBC Capital Markets
There are many reasons for this underperformance: poor stock picking, wrong asset allocation, or simply managers “hugging” their benchmark, which could result in underperformance net of fees.
Thus, there could be continued outflows from mutual funds and into passive products, especially in equities. In fact, we have seen continued outflows from actively managed domestic equity funds, with domestic equity index funds seeing the inflows.
Exhibit 13: Passive strategies received $795 billion of inflows cumulatively since 2007 ($ in billion)
$(800)
$(600)
$(400)
$(200)
$-
$200
$400
$600
$800
$1,000
Jan
-07
May
-07
Sep
-07
Jan
-08
May
-08
Sep
-08
Jan
-09
May
-09
Sep
-09
Jan
-10
May
-10
Sep
-10
Jan
-11
May
-11
Sep
-11
Jan
-12
May
-12
Sep
-12
Jan
-13
May
-13
Sep
-13
Index domestic equity mutual funds Domestic equity ETFs
Actively managed domestic equity mutual funds
Note: Cumulative flows and net share issuance to domestic equity funds. Source: ICI, RBC Capital Markets
What are the implications? Growth in ETFs could benefit discount brokers. There are multiple levers for Schwab to generate revenues from this trend. A recent win by Schwab demonstrates that the trend towards ETF investing could increase as even the “naysayers” seem to warming up to the product. We are referring to the Mutual Fund Store’s decision to offer ETFs. Schwab is the custodian serving Mutual Fund Store clients. For the longest time, Mutual Fund Stores had been a stringent opponent of ETFs—until late 2014, when this company-independent RIA decided to add ETFs to its product offering starting in 2015. The Overland Park, Kansas-based company (home of Waddell & Reed), currently manages about $9.5 billion in client assets. One should expect several hundred million of these assets to move into ETFs. Higher ETF assets under management could translate into higher earnings as Schwab generates revenues on multiple fronts. The firm also gets compensated for shelf space by ETF sponsors. The chart below shows total net assets for passively managed ETFs in the US.
The Charles Schwab CorporationBrokers, Asset Managers & Exchanges
March 26, 2015 Bulent Ozcan, CFA (212) 863-4818; [email protected] 12

Exhibit 14: ETF assets under management have grown at a CAGR of 22.7% since 2005
276 382
547 465
686
886 934
1,201
1,474
1,735
0
200
400
600
800
1,000
1,200
1,400
1,600
1,800
2,000
2005 2006 2007 2008 2009 2010 2011 2012 2013 2014
AU
M (
$B
)
Passively Managed, Long-term ETF AUM
Source: Morningstar; RBC Capital Markets
Consider this: While assets under management have grown at a compounded growth rate of 22.7% since 2005, assets for actively managed US open-ended funds have grown at a rate of 8.5% for the same time period. As of the end of 2014, ETFs composed about 15% of the combined assets. We believe there is further growth momentum.
There has been an increase in exposure to ETFs and there is further growth potential among existing users. Schwab’s 2014 ETF Investor Study found that ETFs make up only about 18% of the assets of investors who hold them in their portfolios. As a comparison, a 2008 study found that while 80% of RIAs owned ETFs, the average exposure to ETFs was only 10%. As for the future, about half of all investors think that ETFs will be a larger portion of their total portfolio. And an earlier study done by Schwab in 2013 (Independent Advisor Outlook Study – Fall 2013) concluded that 55% of the RIAs think that future client investment interest will focus on low-cost index funds and ETFs. We think the writing is on the wall.
Despite the company’s size and its diverse product offerings, Schwab continues to introduce new products to capitalize on the ETF opportunity. For instance, the company launched Schwab Index Advantage 401(k) plans in 2012. This product combines internal and external, low-cost index funds with third-party investment advice services. Two years later, in 2014, the company built upon this platform and introduced a second version of this product using ETFs only. This is yet another example of a disruptive product that the company launched. Certainly, there are intense discussions among pension consultants whether having an ETF in a 401(k) plan makes sense as there is potential for tracking error and no need for intraday liquidity. Some think that employers will not add ETFs to their 401k offering if the consultants do not recommend those. After all, revenue-sharing helps to pay for the costs of operating a pension plan. ETFs would not provide such arrangements or not to the same degree as actively managed mutual funds, i.e., there is less of an incentive for pension consultants to include ETFs in a pension plan. This is the kind of idea that could once again change the status quo. Certainly, others have introduced similar products. TD Ameritrade’s product gives plan participants the choice between mutual funds and ETFs. However, given Schwab’s marketing power and its ability to cut fees, we would expect increased demand for a low-cost retirement product offering. Assuming an employee works and saves over the next 40 years, a reduction in fund expenses could significantly boost returns.
The firm has come a long way despite entering the ETF space late. Schwab introduced its first ETFs in 2009 and had $200 million of assets under management (AUM) as of December 2009.
Schwab continues to introduce products most industry participants would consider disruptive – such as ETF-based 401k plans and a “robo-advisor”
Despite recent growth, we estimate that ETFs comprise about 15% of total retail assets in the US. We believe there is room for growth
The Charles Schwab CorporationBrokers, Asset Managers & Exchanges
March 26, 2015 Bulent Ozcan, CFA (212) 863-4818; [email protected] 13

The industry had about $690 billion of AUM at that point. Today, Schwab manages about $27 billion of assets in its proprietary exchange traded funds. This shows the power of distribution, especially since its competitors have been claiming that their ETFs would not sell as they did not have the liquidity needed to succeed. The 401k industry is about $3.2 trillion in size and Schwab has a 3.1% market share. Close to 100% of the assets are currently in the company’s traditional 401k plans. There is certainly an opportunity for growth, despite the firm’s limited target market of plans with $20m to $1 billion of plan assets.
Robo-advisors could help the firm grow assets by focusing on an untapped market We view the robo-advisor product as an opportunity to tap a new market: We believe that Schwab could grow its assets by providing services to the general public who have been unable to retain professional asset allocation advice.
Another product that could significantly alter the current landscape are robo-advisors. Robo-advisors are online portfolio management tools that help determine an optimum asset allocation strategy relying on algorithms and Modern Portfolio Theory. We believe that this product will allow Schwab to target a new client base that it had not previously, namely parts of the mass market and the middle market. Schwab believes that this is a $400 billion market. We believe that this could be a conservative assumption given that households with investable assets of less than $500,000 hold combined assets of $7 trillion. We view this opportunity as an option and do not incorporate associated earnings into our model.
We are optimistic about this product as early surveys point to a high uptake rate. Charles Schwab provided some context during its 2015 Winter Business Update. About 83% of the company’s retail assets are currently self-directed. Management stated that it has been to 15 branches since the beginning of this year and that there is significant interest in Schwab’s robo-advisor. About half of the financial consultants management met with stated that they have won clients from competing firms in anticipation of enrolling in Schwab’s robo-advisor called “Schwab Intelligent Portfolios” (SIP).
Schwab is currently introducing SIP to its retail clients, and will roll out to RIAs shortly thereafter. It offers a number of exchange traded funds to customers to construct their portfolios. This product will be an RIA offering (RIA advisory account vs. brokerage account), meaning that it will be a fiduciary-based product. In fact, management stated that only one of the ETFs it offers on Schwab ETF OneSource passes the screen to be on this platform.
The firm will not charge advisory fees, trading commissions, or account-servicing fees. However, the firm will earn fund-management fees on Schwab’s proprietary ETFs, platform revenues from ETF providers, and will be able to earn a yield on cash balances held by clients. The ultimate goal is to attract new clients outside its core baby boomer base, namely, Generation X and Millennial clients. This product is important, as it should allow the firm to move “down-market”, targeting less-affluent clients.
Sure, Schwab is not the first firm to offer this technology. However, we would expect an increased adoption rate among consumers once Charles Schwab puts its marketing machine into gear. We would expect Schwab to surpass competitors in terms of AUM given the firm’s relationship with over 7,000 independent RIAs who manage about $2.4 trillion in assets.
We believe that the impact of technology on financial advisors could be similar to that of exchange traded funds on active managers. Will robo-advisors put human advisors out of work? We do not believe so, but they will have to work harder to retain assets if they are
The Charles Schwab CorporationBrokers, Asset Managers & Exchanges
March 26, 2015 Bulent Ozcan, CFA (212) 863-4818; [email protected] 14

targeting the mass-affluent segment. There could also be fee pressure unless human advisors can demonstrate that they are providing genuine value-added services. However, advisors who are merely in the asset gathering business could lose assets as investors could use Schwab’s robo-advisor to construct an auto-balancing portfolio based on their individual risk profile and investment horizon. We believe some advisors will have to rethink their approach and refocus on providing value-added advice. Based on Schwab’s Independent Advisor Outlook Study, which was given to 720 advisors and published June 2014, 56% of the advisors responded that they believe robo-advisors can supplement their current offer/help grow their business. The remaining 44% see robo-advisors as a threat to their business.
Concluding thoughts on ability to grow assets We do not believe that Charles Schwab’s ability to grow assets is constrained by the firm’s size. In fact, we would expect strong growth given secular tailwinds.
A key question on investors’ minds is whether the firm will be able to grow assets as it is already the largest discount broker by a wide margin. Our answer would be yes and, as we stated at the beginning of this note, it all comes down to the company’s culture. We believe that the company has demonstrated, over time, that it is willing to explore new opportunities and navigate uncharted waters in pursuit of profit. The organization is constantly evolving and innovation remains a key driver of the firm’s success. Charles Schwab seems to have a very good understanding of consumer behavior and market dynamics – and is willing to adapt to these changes in order to capitalize on the opportunity set. However, management is not taking a “risk it all” approach. It is content with being an early adopter, as demonstrated above, if the long-term growth opportunity justifies the investment. We think the company’s culture reflects this, and believe that it provides the appropriate mix of entrepreneurial spirit and risk management.
The exhibit below shows the evolution of Schwab in pursuit of opportunities. While trading contributed to total revenues to the tune of 40% a decade ago, commissions comprise only about 15% of total revenues today.
Exhibit 15: Today, Schwab is less dependent on commission revenues than ever
39% 40%
15%
49%
21%
38%
7%
27% 42%
12%
6%4%
0%
20%
40%
60%
80%
100%
120%
1990 2000 2014
Commission revenues Interest revenues Asset management Other
Source: Company filings; RBC Capital Markets
An added benefit of this evolution is that the firm’s diversified revenue mix should provide added downside protection versus its peers. Trading is highly dependent on volatility and
We like the fact that Schwab continues to explore a multitude of opportunities to find catalysts of growth—the firm’s change in revenue mix reflects this effort
The Charles Schwab CorporationBrokers, Asset Managers & Exchanges
March 26, 2015 Bulent Ozcan, CFA (212) 863-4818; [email protected] 15
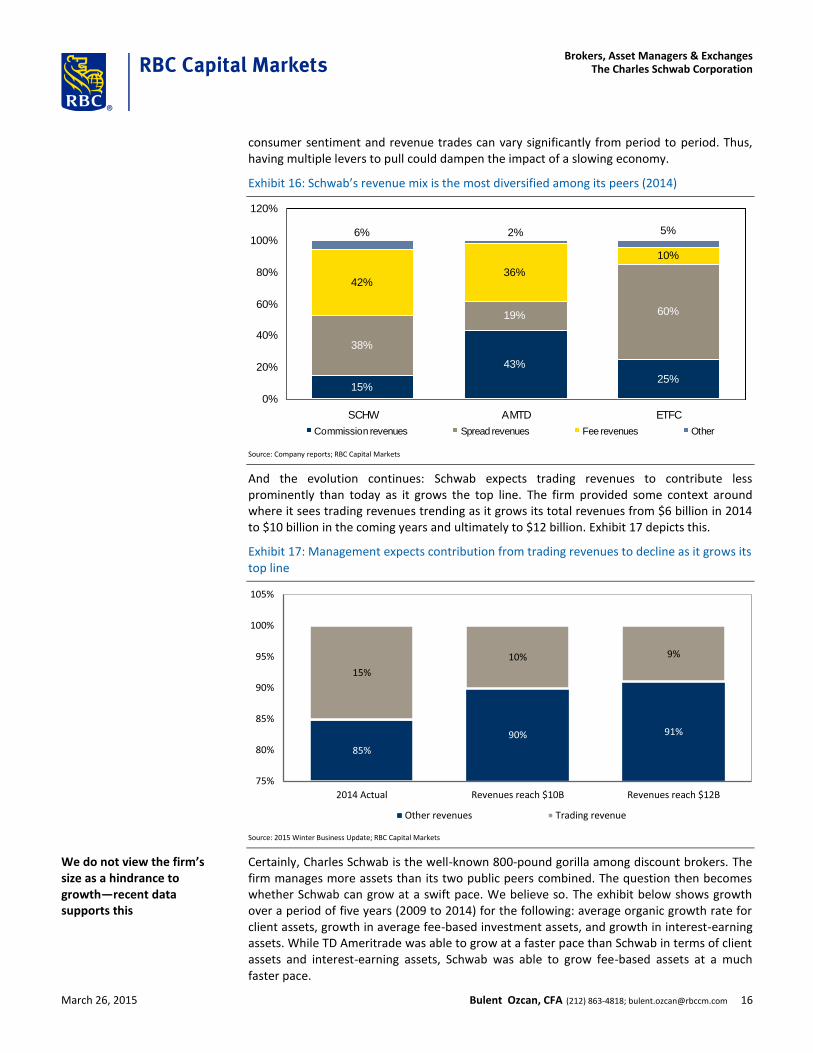
consumer sentiment and revenue trades can vary significantly from period to period. Thus, having multiple levers to pull could dampen the impact of a slowing economy.
Exhibit 16: Schwab’s revenue mix is the most diversified among its peers (2014)
15%
43%
25%
38%
19% 60%
42%36%
10%
2% 5%6%
0%
20%
40%
60%
80%
100%
120%
SCHW AMTD ETFC
Commission revenues Spread revenues Fee revenues Other
Source: Company reports; RBC Capital Markets
And the evolution continues: Schwab expects trading revenues to contribute less prominently than today as it grows the top line. The firm provided some context around where it sees trading revenues trending as it grows its total revenues from $6 billion in 2014 to $10 billion in the coming years and ultimately to $12 billion. Exhibit 17 depicts this.
Exhibit 17: Management expects contribution from trading revenues to decline as it grows its top line
85%
90% 91%
15%
10% 9%
75%
80%
85%
90%
95%
100%
105%
2014 Actual Revenues reach $10B Revenues reach $12B
Other revenues Trading revenue
Source: 2015 Winter Business Update; RBC Capital Markets
Certainly, Charles Schwab is the well-known 800-pound gorilla among discount brokers. The firm manages more assets than its two public peers combined. The question then becomes whether Schwab can grow at a swift pace. We believe so. The exhibit below shows growth over a period of five years (2009 to 2014) for the following: average organic growth rate for client assets, growth in average fee-based investment assets, and growth in interest-earning assets. While TD Ameritrade was able to grow at a faster pace than Schwab in terms of client assets and interest-earning assets, Schwab was able to grow fee-based assets at a much faster pace.
We do not view the firm’s size as a hindrance to growth—recent data supports this
The Charles Schwab CorporationBrokers, Asset Managers & Exchanges
March 26, 2015 Bulent Ozcan, CFA (212) 863-4818; [email protected] 16

Exhibit 18: Schwab’s five-year compound annual growth rate versus peers (2009 to 2014)
5%
11%
5%
24%
20%
n/m
16% 17%
-2%-5%
0%
5%
10%
15%
20%
25%
30%
35%
40%
SCHW AMTD ETFC
Client assets organic growth Avg. fee based investment balances Avg. Interest rate sensitive assets
Source: Company filings; RBC Capital Markets
What are our expectations for asset growth? We remain optimistic that the firm will continue to grow its balance sheet smartly. Management provided some guidance during its Interim Business Update in October 2014. It expects to add about $12–$15 billion to its interest-earning assets in 2015. Investors were provided with a breakdown of these new assets: $6bn will be due to organic growth of money funds; $3bn–5bn will be added from changing sweep account thresholds for advisors, and $3–4bn will be in potential bulk transfers. Our 2015 earnings estimate incorporates asset growth at the lower end of this guidance, leaving room for a positive surprise. As for 2016, we are assuming that total interest-earning assets could grow by about $13 billion as interest rates rise. The main drivers of asset growth are innovative products that meet clients’ needs and distribution, in our view. Schwab has both. Going back to our ETF example, Schwab did not have a presence in the market in 2009. Today, the firm is a top 8 ETF provider.
However, there are also other initiatives that can add to balance sheet growth. The firm is optimizing how it uses its balance sheet. Schwab recently announced changes to its sweep account option and is now routing more of the new cash from clients onto their balance sheet, as opposed to the broker–dealer business. Previously, if an advisor had client assets of over $100,000, any cash held by the client would qualify to be invested in money market funds. The hurdle rate for retail clients was $500,000, as a comparison. Schwab has raised the limit to use money market funds as a sweep option to $500,000 for clients of its independent advisors. Consequently, the firm expects to direct more cash onto its balance sheet where it currently earns a yield of 160 bps, versus 12 bps on money market funds. The yield of 160 bps could grow to over 300 bps in a normal rate environment. The yield on money market funds is about 55 bps in a normal rate environment.
The firm has raised the threshold for the bank sweep default from advisor services to $500k a month ($1.5bn a quarter), so that it syncs with the retail services. Clearly, the sweep assets that can be invested on its balance sheet are one of the most profitable cash products, with Schwab earning about 145 bps above what it could at the broker–dealer. However, there will be some limitations to growth, as Schwab would have to hold additional capital to support the balance sheet. As a reminder, there are no capital charges for money market funds as these are segregated assets.
As for the future, we expect growth to be driven by smarter usage of its balance sheet, increased cross selling, and introduction of new products
The Charles Schwab CorporationBrokers, Asset Managers & Exchanges
March 26, 2015 Bulent Ozcan, CFA (212) 863-4818; [email protected] 17

We expect incremental contributions to earnings growth and margin expansion from rising interest rates and efforts to control costs
We expect rising interest rates to benefit Schwab’s earnings more than that of its peers Schwab is by far the most asset sensitive of the discount brokers. We estimate a 50 bps increase in short term rates could add about $0.31 to earnings per share (33% accretive based on 2014 EPS).
Our Chief US Economist, Tom Porcelli, holds a constructive view on the economy and expects the first Fed hike as early as June. Specifically, he expects the three-month treasury rate to be 90 basis points by the end of 2015 and to increase to 280 basis points by 2016. Likewise, he believes that the rate on the two-year Treasury note could increase from 66 basis points as of the end of 2014 to 200 basis points by the end of 2015 and further to 320 basis points by 2016.
Our Head of US Rate Strategy, Michael Cloherty, holds a similar view and expects rate increases in the near term. More importantly, he expects rate increases to happen gradually over time for the following reasons: First, the Fed needs to learn to use its new tools in an utterly changed regulatory environment. The Fed will be treading carefully in order not to negatively impact the economic recovery. Second, the massive volatility we saw on October 15, 2014 suggests the market will not be able to handle rapid tightening, and as the Fed can't move rapidly without shocking the markets, it will need to start tightening its monetary policy well before inflation appears.
We would be buyers of Schwab under this premise. Our analysis demonstrates that the firm’s earnings are the most sensitive to movements in short-term rates and should benefit disproportionately from rising rates.
To be precise, about 75% of the firm’s assets are sensitive to movements in short-term rates. One of the key drivers of this interest rate sensitivity is money market funds. Charles Schwab is the only discount broker that offers proprietary money market funds to its clients. In fact, Charles Schwab is the seventh largest money market mutual fund manager in the US. As of 4Q/14, the firm was managing close to $168 billion of money market funds. While this exposure has been a hindrance to earnings growth in the current low interest rate environment, we expect the company’s shares to outperform its peers in a rising rate environment.
Consider this: Instead of earning a normalized fee of 58 basis points (bps) on its money market fund assets, the company was able to earn an effective fee rate of only 13 bps during the most recent quarter. Like other money market fund managers, Charles Schwab voluntarily “waived fees” to ensure that investors were not earning a negative yield on the funds. These money market fund fee waivers are material. The exhibit below shows the amount of money market fund waivers over time. The past year stands out with $751 million of revenues that were lost as Schwab reduced its management fees to ensure clients would not experience negative returns on their cash balances.
Our Chief US Economist and our Head of US Rate Strategy both expect the Fed to start tightening its monetary policy at a measured pace this year
The Charles Schwab CorporationBrokers, Asset Managers & Exchanges
March 26, 2015 Bulent Ozcan, CFA (212) 863-4818; [email protected] 18

Exhibit 19: Money market fund fee waivers have been increasing since 2009 ($ in millions)
$224
$433
$568 $587
$674
$751
$-
$100
$200
$300
$400
$500
$600
$700
$800
2009 2010 2011 2012 2013 2014
Source: Company filings; RBC Capital Markets
Should short-term interest rates rise, we could see a significant uptick in earnings at Schwab. Unlike asset managers who have been “sharing the pain” with distributors when interest rates declined, Schwab had to absorb the impact of money market fee waivers dollar-for-dollar. Thus, when interest rates start increasing, Schwab should be able to experience accelerated earnings growth relative to asset managers such as Federated Investors (ticker: FII) that will now have to share the incremental management fee revenues with their distributors as interest rates rise. Schwab is the only discount broker among its peers providing proprietary money market funds.
Assuming interest rates rise to pre-financial crisis levels allowing Schwab to earn 58 bps on its money market mutual funds, a 38% tax rate, and no growth in money market fund AUM, we calculate incremental earnings of $0.16 per diluted shares. This estimate is based on an assumption that about 60% of money market fund assets would not have to waive fees, Schwab keeps 25% of the incremental revenues for growth initiatives and invests the capital back into the business. Furthermore, we are using our 2015 projected diluted weighted average share count of 1,327 million shares. As a reference point, Schwab earned $0.95 per diluted share in 2014. Thus, we estimate a rise in interest rates would be accretive to the tune of 17% based on 2014 earnings.
The current rate environment is certainly unusual given historical patterns and not sustainable over the long run, in our view. The exhibit below alludes to this and shows the effective federal funds rate over time. As a reference, this rate was around 5% in 2006 and 2007.
EPS could increase by 16 cents if 60% of money market fund assets were not to waive fees with higher rates
The Charles Schwab CorporationBrokers, Asset Managers & Exchanges
March 26, 2015 Bulent Ozcan, CFA (212) 863-4818; [email protected] 19

Exhibit 20: Monetary easing has resulted in record low federal fund rates
0%
2%
4%
6%
8%
10%
12%
14%
16%
18%
19
55
19
58
19
61
19
64
19
67
19
70
19
73
19
76
19
79
19
82
19
85
19
88
19
91
19
94
19
97
20
00
20
03
20
06
20
09
20
12
Source: Board of Governors of the Federal Reserve System; RBC Capital Markets
We estimate that a rise of 45 bps in the federal funds rate should result in the elimination of 60 percent of fee waivers.
Money market fund waivers impact asset management and administration fee revenues. However, this is not the only component of revenues that could be positively impacted by rising rates. Net interest revenues contribute to a significant portion of revenues. Broker–dealers are putting clients’ cash to work in a similar fashion to a bank. Discount brokers earn a yield on these “interest-earning assets”. In its 10k filings, the company provided the results of a simulation of changes in interest rates and the impact on net interest revenue. The exhibit below assumes a 100-bps gradual increase/decrease in market interest rates relative to Schwab’s market rates forecast over a 12-month period (base case).
Exhibit 21: Impact on net interest revenue from rising interest rates seems meaningful
11.1% 11.0%
-4.2% -4.5%
-9%
-4%
1%
6%
11%
16%
Sep 30, 2014 Dec 31, 2013
Increase of 100 bps Decrease of 100 bps
Source: Company filings; RBC Capital Markets
We can only assume what the base case assumption is for the firm. Thus, we do not view the sensitivity provided by the firm in its annual filings as useful.
The Charles Schwab CorporationBrokers, Asset Managers & Exchanges
March 26, 2015 Bulent Ozcan, CFA (212) 863-4818; [email protected] 20

Our approach to determine Schwab’s interest rate sensitivity Charles Schwab has provided some data points, which we used to come up with our interest rate sensitivity. The company disclosed that a 100-bps increase in rates will add about 60 bps to net interest margins. A further 100-bps increase will add another 60 bps. Assuming average interest-bearing assets of $142.5 billion, the first 100-bps increase would add $855 million of incremental net interest revenue, while a 200-bps increase would add about $1.7 billion of incremental revenue. There seems to be a linear relationship. Hence, if we assume a 50-bps increase in interest rates, net interest revenues could add about $0.32 per diluted share—again, we are using our projected share count of 1,327 million shares. Were we to assume that 75% of this amount flows through to shareholders and a 38% tax rate, we calculate earnings could increase by $0.15 on top of the $0.16 from recouping 60% of money market fund fee waivers. Thus, earnings could pick up by $0.31.
We believe that the impact on earnings from a 50-bps increase will be driven by elimination of money market fund fee waivers and expansion of net interest revenues. Thereafter, net interest revenue will be the main driver of earnings expansion. We show this below.
Exhibit 22: Elimination of fee waivers could meaningfully add to EPS
Assumed marginsMoney Market Funds 70% 75% 80% 85% 90%
2014 Fee waivers ($MM) $751 $751 $751 $751 $751Recovery percentage 60% 60% 60% 60% 60%Fee rate 13bps 13bps 13bps 13bps 13bpsNormalized rate 58bps 58bps 58bps 58bps 58bpsDelta 45bps 45bps 45bps 45bps 45bps
Incremental revenues for 50 bps increase
in rates $451 $451 $451 $451 $451Tax rate 38% 38% 38% 38% 38%Share count (2015E) 1,327 1,327 1,327 1,327 1,327
EPS Impact $0.15 $0.16 $0.17 $0.18 $0.19
Source: Company reports; RBC Capital Markets estimates
The exhibit below shows impact on earnings using various margin and changes in interest rate assumptions:
Elimination of fee waivers could add $0.16 to earnings per diluted share, assuming that the company retains 25% of revenues for growth initiatives
The Charles Schwab CorporationBrokers, Asset Managers & Exchanges
March 26, 2015 Bulent Ozcan, CFA (212) 863-4818; [email protected] 21

Exhibit 23: Impact on EPS due to margin expansion
Assumed margins
Net interest revenue 70% 75% 80% 85% 90%
Average interest-earnings assets ($B) $142.5 $142.5 $142.5 $142.5 $142.5
Incremental revenues ($MM) - 50 bps $427.5 $427.5 $427.5 $427.5 $427.5
Incremental revenues ($MM) - 100 bps $854.9 $854.9 $854.9 $854.9 $854.9
Incremental revenues ($MM) - 200 bps $1,709.9 $1,709.9 $1,709.9 $1,709.9 $1,709.9
Tax rate 38% 38% 38% 38% 38%
Share count (2015E) 1,327 1,327 1,327 1,327 1,327
EPS Impact - 50 bps $0.14 $0.15 $0.16 $0.17 $0.18
EPS Impact - 100 bps $0.28 $0.30 $0.32 $0.34 $0.36
EPS Impact - 200 bps $0.56 $0.60 $0.64 $0.68 $0.72
Source: Company reports; RBC Capital Markets estimates
While there are a number of assumptions in our analysis, the main point should not be missed. Rising interest rates will have a significant impact on earnings. Thus, assuming no growth, we estimate elimination of fee waivers and higher net interest revenues could add about $0.31 to earnings. Put differently, 2014 earnings per share could have been 30%-plus higher in a more benign interest rate environment.
The company provided an updated earnings-sensitivity to movements in the Federal Funds rate in February 2015, which seems consistent with our analysis. Management expects the first 100-bps increase to add about $1.6 billion to revenues. It expects a further 100-bps increase to add an incremental $800 million to revenues. Thus, revenues could rise by $2.4 billion for a 200-bps move in the Federal Funds rate without any asset growth. Based on this model, earnings could move about $0.28 for a 50-bps increase in rates, were we to assume a margin of 75%, a 38% tax rate and 1,327 million diluted shares outstanding. While this figure seems slightly more conservative than our own calculation, one should not ignore that $0.28 would still be 29% accretive to 2014 earnings.
Expense saves could add to the bottom line and help expand margins Controlling expenses will continue to remain a priority at Schwab with its clients benefitting in the form of lower fees. Expense savings should lead to increased investments in new products, revenue growth and better margins.
Another driver of margin expansion and earnings growth could be expense saves. We believe that the current efforts to control costs in combination with an increase in revenues could bear fruit over coming years. While the company does not provide specific guidance on the dollar amount of expense saves, it discloses certain efforts. A recent one of these efforts would be the relocation of employees from higher cost locations such as San Francisco to lower cost markets such as Denver, Austin and El Paso. Management indicated that this is a multi-year effort. The goal is to relocate about half of the 2,400 employees that are currently working out of the San Francisco office. There are first signs that the management is moving forward with its plan. The past year’s margins were compressed as the company is altering its geographic footprint. Schwab took a severance charge of $68 million in 3Q/14.
A 50-bps move in short-term rates could add $0.15 to earnings per share; however, should rates move by 200 basis points, investors could see an increase of $0.60 in EPS—assuming 75% incremental margins
The Charles Schwab CorporationBrokers, Asset Managers & Exchanges
March 26, 2015 Bulent Ozcan, CFA (212) 863-4818; [email protected] 22
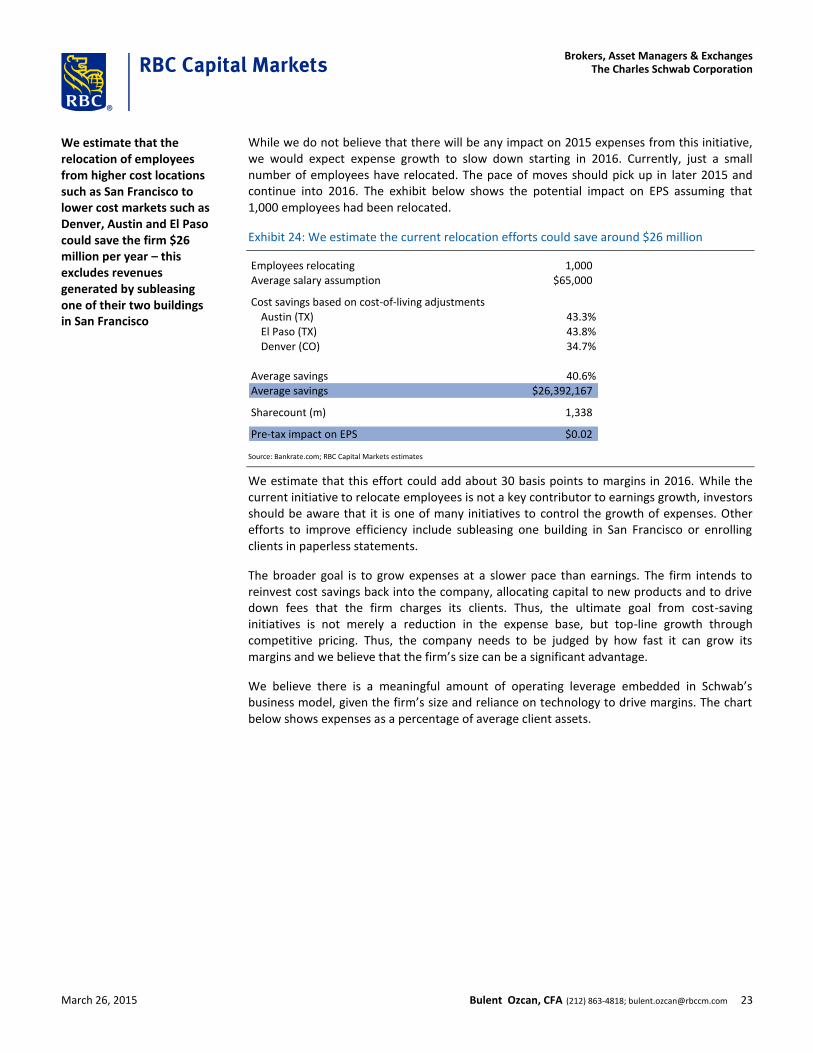
While we do not believe that there will be any impact on 2015 expenses from this initiative, we would expect expense growth to slow down starting in 2016. Currently, just a small number of employees have relocated. The pace of moves should pick up in later 2015 and continue into 2016. The exhibit below shows the potential impact on EPS assuming that 1,000 employees had been relocated.
Exhibit 24: We estimate the current relocation efforts could save around $26 million
Employees relocating 1,000 Average salary assumption $65,000
Cost savings based on cost-of-living adjustmentsAustin (TX) 43.3%El Paso (TX) 43.8%Denver (CO) 34.7%
Average savings 40.6%Average savings $26,392,167
Sharecount (m) 1,338
Pre-tax impact on EPS $0.02
Source: Bankrate.com; RBC Capital Markets estimates
We estimate that this effort could add about 30 basis points to margins in 2016. While the current initiative to relocate employees is not a key contributor to earnings growth, investors should be aware that it is one of many initiatives to control the growth of expenses. Other efforts to improve efficiency include subleasing one building in San Francisco or enrolling clients in paperless statements.
The broader goal is to grow expenses at a slower pace than earnings. The firm intends to reinvest cost savings back into the company, allocating capital to new products and to drive down fees that the firm charges its clients. Thus, the ultimate goal from cost-saving initiatives is not merely a reduction in the expense base, but top-line growth through competitive pricing. Thus, the company needs to be judged by how fast it can grow its margins and we believe that the firm’s size can be a significant advantage.
We believe there is a meaningful amount of operating leverage embedded in Schwab’s business model, given the firm’s size and reliance on technology to drive margins. The chart below shows expenses as a percentage of average client assets.
We estimate that the relocation of employees from higher cost locations such as San Francisco to lower cost markets such as Denver, Austin and El Paso could save the firm $26 million per year – this excludes revenues generated by subleasing one of their two buildings in San Francisco
The Charles Schwab CorporationBrokers, Asset Managers & Exchanges
March 26, 2015 Bulent Ozcan, CFA (212) 863-4818; [email protected] 23

Exhibit 25: Schwab’s cost base appears to be the lowest among peers
0.64%0.58%
0.55%
0.33%
0.18%
0.60%0.56%
0.41%
0.29%
0.17%
0.0%
0.1%
0.2%
0.3%
0.4%
0.5%
0.6%
0.7%
MS BoA ETFC AMTD SCHW
2013 2014
Source: Company filings; RBC Capital Markets
Given our expectation of increasing interest rates, balance sheet growth, and efforts to control costs, we would expect a significant improvement in the company’s pre-tax margins over the next three years. We are showing our estimates below.
Exhibit 26: Schwab’s margins have been expanding constantly, with further improvement projected
30%
18%
30% 30%31%
35%37%
45%
0%
5%
10%
15%
20%
25%
30%
35%
40%
45%
50%
2009 2010 2011 2012 2013 2014 2015E 2016E
Source: Company reports; RBC Capital Markets estimates
How has Schwab done historically in controlling expenses? We have analyzed expenses as a percentage of ending client assets over time and have found that Schwab was able to control expenses beginning in 2010. The exhibit below depicts this. For our model, we are assuming that expenses as a percentage of ending client assets will not decline further in arriving at our earnings estimates. One could argue that this is a conservative assumption. However, we are expecting pre-tax operating margins to expand north of 40% despite the conservatism over the next two years.
The Charles Schwab CorporationBrokers, Asset Managers & Exchanges
March 26, 2015 Bulent Ozcan, CFA (212) 863-4818; [email protected] 24

Exhibit 27: Schwab is benefiting from economies of scale as it is growing assets (expenses as % of ending client assets)
0.21%0.22%
0.20%
0.18%0.17% 0.16% 0.16% 0.16%
0.00%
0.05%
0.10%
0.15%
0.20%
0.25%
2009 2010 2011 2012 2013 2014 2015E 2016E
Note: Calculated using simple averages; figures differ from expense ratios provided by the companies in Exhibit 25 Source: Company filings; RBC Capital Markets estimates
The firm disclosed during its recent Business Update meeting that while assets have grown by 75% over the last five years, expenses have increased by 35% only. The key takeaway would be that Charles Schwab is more efficient than wirehouses and its peers. Thus, we would expect asset growth to add incrementally more to the bottom line versus peers.
Charles Schwab provided some guidance for 2015 during its Business Update meeting in February. The firm wants the gap between revenue and expense growth to be at least 150 basis points. Could there be some conservatism in this figure? We believe so. Management had set a goal of growing revenues by 300 to 500 basis points faster than expenses. The firm ended the year with a gap of 580 basis points.
While there are a number of short-term catalysts that could lead to strong performance, we believe that Charles Schwab has created a strong franchise that could bode well for asset growth. The following section will cover these growth opportunities.
The Charles Schwab CorporationBrokers, Asset Managers & Exchanges
March 26, 2015 Bulent Ozcan, CFA (212) 863-4818; [email protected] 25

Where we could be wrong
Interest rate sensitivity could be a headwind, compressing net interest margins, if rates do not rise We consider Schwab to be the most asset sensitive discount broker. Our investment thesis is based on our expectation that interest rates rise. This perspective is based on our house view that the Federal Reserve Bank could raise interest in mid-year. However, it is difficult to predict with certainty what might/could expire in the current year. There are certain global developments to consider.
Investors view the US dollar as a safe haven. Geopolitical and economic difficulties abroad could lead to capital influx into the US, offsetting any efforts undertaken by the Board of Governors of the Federal Reserve System to raise interest rates. Lower interest rates would mean continued fee waivers on money market funds and thus lower revenues than we expect.
Absent of a meaningful revenue growth, it would be difficult for Schwab to expand margins as the cost-cutting efforts are really reducing expenses. These efforts are geared towards reducing the pace of expense growth.
Given reliance on offices and infrastructure, higher than expected investments could lead to lower margins Another “drag” on earnings could be increased investments in infrastructure. Unlike its peers, Schwab relies extensively on its branch offices. There are currently over 300 branch offices and our discussions with the company indicate that this number could increase as interest rates rise. Their market research indicates that affluent clients are more likely to use branches in a higher rate environment. We assume that this could be driven by perceived wealth as rising rates point to a stronger economy and higher stock market valuations.
Assuming we are right with our expectation that interest rates do indeed rise, the company could incur additional expenses not factored into our model. Put differently, margin expansion at Schwab could fall below our estimate as the company expands its branch offices.
Schwab is under the supervision of a number of regulators putting the company at a disadvantage with respect to capital deployment Given the company’s size and business model, Schwab is under the supervision of a number of regulators. The Charles Schwab Corporation (CSC) is a savings and loan holding company and Schwab Bank is a federal savings banks. While CSC is regulated by the Federal Reserve Bank, Schwab Bank is regulated by the Office of the Comptroller of the Currency. Schwab’s principal broker–dealers are members of FINRA and are also regulated by the Commodities Futures Trading Commission. Furthermore, Dodd-Franks created the Consumer Financial Protection Bureau, which could negatively impact the range of products offered and the profitability of products sold by Schwab.
As one can see, a number of regulators control how the company conducts its business and ultimately determine how much capital Schwab can return to its shareholders in the form of dividends and share buybacks. This is in stark contrast to TD Ameritrade, which operates under a “capital light model” and under less regulatory scrutiny.
The Charles Schwab CorporationBrokers, Asset Managers & Exchanges
March 26, 2015 Bulent Ozcan, CFA (212) 863-4818; [email protected] 26

Given the size of Schwab Bank, with a balance sheet of $105.6 billion, the firm has to comply with rules that don’t apply to its peers. An example of this would be a quantitative liquidity requirement consistent with the liquidity coverage ratio (LCR) standard established by Basel III. The LCR ratio compares the ratio of high-quality liquid assets that the firm needs to hold to potential cash outflows under certain scenarios. While LCR applies to all international banks, Schwab has to comply with a modified LCR approach as mandated by the federal reserve bank. Schwab will be required to be fully compliant by January 1, 2017. The company disclosed that compliance would impact annual returns by less than half a penny. However, there are still some uncertainties around how the rules will apply to the brokerage business. There are also other considerations to take into account as the company becomes compliant with Basel III rules. Here are some excerpts from the company’s 2013 10K filing:
Revise required minimum risk-based and leverage capital requirements by (1) establishing a new minimum Common Equity Tier 1 Risk Based Capital Ratio of 4.5%; (2) raising minimum Tier 1 Risk Based Capital Ratio from 4% to 6%; (3) maintaining the minimum Total Risk Based Capital Ratio of 8%; and (4) maintaining a minimum Tier 1 Leverage Ratio of 4%
Add a requirement to maintain a minimum capital conservation buffer, composed of common equity Tier 1 capital, of 2.5% of risk-weighted assets, which means that banking organizations, on a fully phased-in basis no later than January 1, 2019, must maintain a Common Equity Tier 1 Risk Based Capital Ratio greater than 7% and Tier 1 Risk Based Capital Ratio greater than 8.5% and a Total Risk based Capital Ratio greater than 10.5%
Change the definition of capital categories for insured depository to be considered “well capitalized”, Schwab Bank must have a Common Equity Tier 1 Risk Based Capital Ratio of at least 6.5%, a Tier 1 Risk Based Capital Ratio of at least 8%, a Total Risk Based Capital Ratio of at least 10% and a Tier 1 Leverage Ratio of at least 5%.
The new minimum regulatory capital ratios and changes to the calculation of risk-weighted assets are effective beginning January 1, 2015. The required minimum capital conservation buffer will be phased in incrementally, starting at 0.625% on January 1, 2016 and increasing to 1.25% on January 1, 2017, 1.875% on January 1, 2018, and 2.5% on January 1, 2019
Schwab might appear to have less flexibility in terms of how it can deploy capital versus peers. E*TRADE, for instance, has a tier 1 leverage ratio of 9.2% vs. Schwab’s 6.6%. We are not suggesting that the firm is close to violating any regulatory guideline as their portfolio differs significantly from E*TRADE’s. Not at all. However, there are more variables to consider from a compliance perspective that its peers do not have to worry about to the same degree.
The Charles Schwab CorporationBrokers, Asset Managers & Exchanges
March 26, 2015 Bulent Ozcan, CFA (212) 863-4818; [email protected] 27
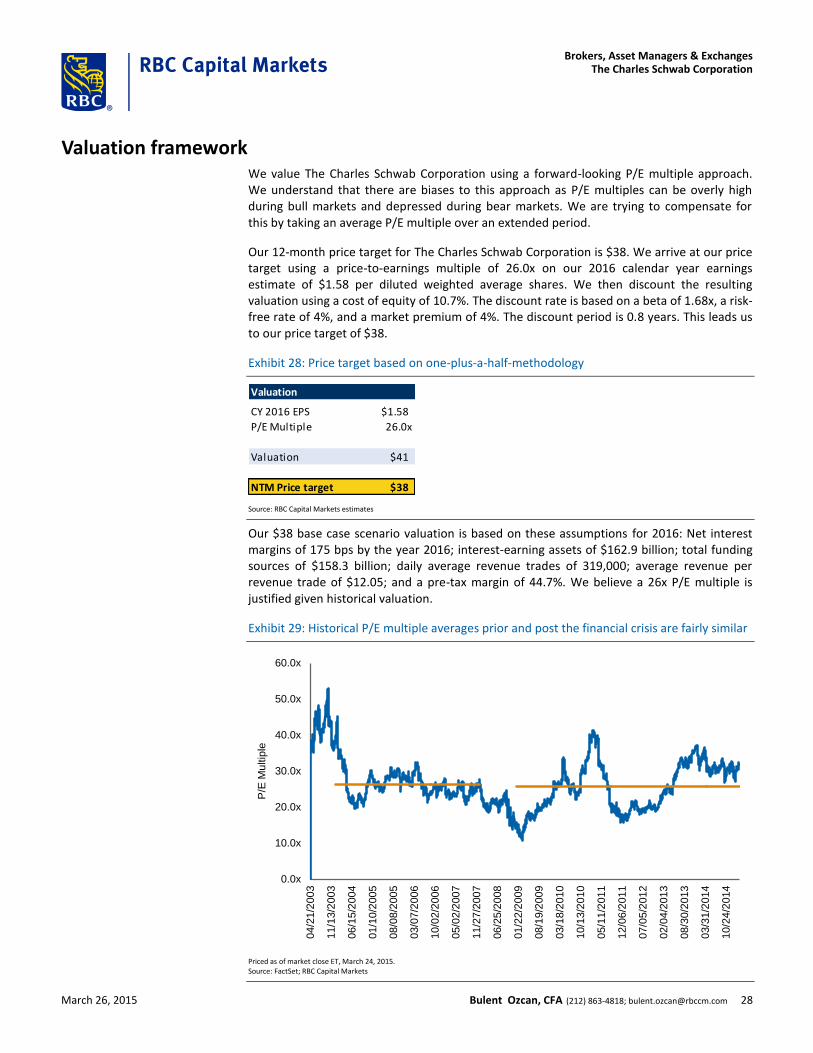
Valuation framework We value The Charles Schwab Corporation using a forward-looking P/E multiple approach. We understand that there are biases to this approach as P/E multiples can be overly high during bull markets and depressed during bear markets. We are trying to compensate for this by taking an average P/E multiple over an extended period.
Our 12-month price target for The Charles Schwab Corporation is $38. We arrive at our price target using a price-to-earnings multiple of 26.0x on our 2016 calendar year earnings estimate of $1.58 per diluted weighted average shares. We then discount the resulting valuation using a cost of equity of 10.7%. The discount rate is based on a beta of 1.68x, a risk-free rate of 4%, and a market premium of 4%. The discount period is 0.8 years. This leads us to our price target of $38.
Exhibit 28: Price target based on one-plus-a-half-methodology
Valuation
CY 2016 EPS $1.58
P/E Multiple 26.0x
Valuation $41
NTM Price target $38
Source: RBC Capital Markets estimates
Our $38 base case scenario valuation is based on these assumptions for 2016: Net interest margins of 175 bps by the year 2016; interest-earning assets of $162.9 billion; total funding sources of $158.3 billion; daily average revenue trades of 319,000; average revenue per revenue trade of $12.05; and a pre-tax margin of 44.7%. We believe a 26x P/E multiple is justified given historical valuation.
Exhibit 29: Historical P/E multiple averages prior and post the financial crisis are fairly similar
0.0x
10.0x
20.0x
30.0x
40.0x
50.0x
60.0x
04/2
1/2
003
11/1
3/2
003
06/1
5/2
004
01/1
0/2
005
08/0
8/2
005
03/0
7/2
006
10/0
2/2
006
05/0
2/2
007
11/2
7/2
007
06/2
5/2
008
01/2
2/2
009
08/1
9/2
009
03/1
8/2
010
10/1
3/2
010
05/1
1/2
011
12/0
6/2
011
07/0
5/2
012
02/0
4/2
013
08/3
0/2
013
03/3
1/2
014
10/2
4/2
014
P/E
Multip
le
Priced as of market close ET, March 24, 2015. Source: FactSet; RBC Capital Markets
The Charles Schwab CorporationBrokers, Asset Managers & Exchanges
March 26, 2015 Bulent Ozcan, CFA (212) 863-4818; [email protected] 28

We have looked at P/E multiples going back to April 2003. On average, shares of SCHW have traded at a 26.4x P/E multiple. The average P/E multiple prior to 2008 was 26.3x, as well. As for the period post the financial crisis, our data shows that SCHW has been trading at an average P/E multiple of 25.6x. We are utilizing a long-term historical average of 26.0x P/E multiple to arrive at our price target.
The Charles Schwab CorporationBrokers, Asset Managers & Exchanges
March 26, 2015 Bulent Ozcan, CFA (212) 863-4818; [email protected] 29
Risks and price target impediments Prolonged period of low interest rates Our price target assumes that interest rates will rise. The company is the most asset sensitive among its peers in our view. Consequently, we would have to adjust our price target and our earnings estimate should interest rates remain low for a prolonged period. This could lead to a decline in net interest margins. Furthermore, should interest rates remain low for a prolonged period and the economic recovery slow down or reverse, clients could move their investments back onto the company’s balance sheet in the form of cash. The firm would have to hold additional capital for these assets.
Unforeseen regulatory changes could impact profitability The Dodd-Frank Act had a tremendous impact on the financial services industry. With the elimination of the Office of Thrift Supervision, The Charles Schwab Corporation came under the supervision of the Federal Reserve and the OCC became the primary regulator of Schwab Bank. As the company points out, there are multiple studies mandated by the new legislation that could result in additional legislative or regulatory action. This could affect how the company conducts its business, the growth trajectory, and ultimately profitability.
Balance sheet growth below our expectation could lead to earnings shortfall The discount brokerage business is characterized by intense competition. Peers may attempt to gain market share by reducing trade commissions, offering higher yields on deposits and lower interest rates on loans, or reducing the fees they are charging for services. The firm also faces competition from wirehouses and traditional banks. Increased competition could lead to lower asset growth and a decline in profitability.
Losses from credit exposure could negatively impact shares The company is subject to counterparty risk. Its exposure results from margin lending, clients’ options trading, securities lending, and mortgage lending. The firm has exposure to credit risk through its investments in US agency and non-agency mortgage-backed securities, corporate debt securities, and commercial papers among others. Loans to clients are in the form of mortgages and home equity lines of credit. A deterioration of the credit portfolio could result in increased loan provisions and charge-offs, and could negatively impact the company’s share price.
Drop in consumer confidence A decline in trading volume could negatively impact commission revenues and earnings. Trading volume is to a high degree dependent on market volatility. However, a prolonged period of market volatility in declining markets could lead to a decrease in consumer confidence and thus trading activity.
Sharp decline in equity markets The firm earns asset management-related revenues based on assets it manages in its proprietary funds and through fees on RIA assets. A sharp decline in markets could lead to lower asset management-related earnings. Furthermore, clients could start withdrawing funds based on fears about the direction of the market. This would result in lower topline growth, a decline in margins, and earnings growth below our projection.
The Charles Schwab CorporationBrokers, Asset Managers & Exchanges
March 26, 2015 Bulent Ozcan, CFA (212) 863-4818; [email protected] 30
Quick overview of Charles Schwab Corp. Founded in 1986 and headquartered in San Francisco, California, Charles Schwab Corporation is engaged in brokerage, banking, money management, and advisory services. The company offers a range of products to meet customers’ varying investment and financial needs.
Charles Schwab’s business model is the most diverse among its peers and thus, as appealing to us. While the firm has its origins in discount brokerage, the business model has evolved over time. We believe that it would be difficult for competitors to replicate the firm’s business model today. These days, the lines between a discount broker and a full-service brokerage firm are not as clear-cut as they were in the past, and Schwab was certainly a contributor to this development. Despite having gone through many changes and iterations, we believe that the firm continues to follow a simple mantra: Be disruptive and question the status quo.
This perspective seems to have served the company well. It was one of the first firms to embrace new trading rules after the SEC mandated negotiated commission rates for all security transactions in 1975. This was the beginning of an industry today known as discount brokerage. Regulatory changes opened up the financial markets to ordinary citizens, that is, to retail clients. While established broker/dealers such as Merrill Lynch saw this as an opportunity to raise commissions, Charles “Chuck” Schwab, the company’s founder, took an entirely different stance. He saw the regulatory changes as an opportunity to reach the masses by reducing commissions. The firm’s target market became the price-sensitive individual investor, who did not need access to extensive research and “white glove” advisory services. Prior to the deregulation, commissions could be as high as 10% of invested capital and mutual funds often carried 9% sales loads. The emergence of the discount brokerage changed this, ultimately resulting in commission fee rates dropping from hundreds of dollars per trade to less than $10 today.
We would argue that “creative destruction” is in Schwab’s DNA. The company is willing to take uncharted roads in order to pursue long-term growth objectives. And sometimes, the strategy can appear to be counter-intuitive or might even seem to cannibalize its sales— such as opening up branch offices while other discount brokers did not see the need, or considered branches as too capital intensive. Consider this: By 1985, the firm had 90 branches and 1.2 million customers. Despite building a brick-and-mortar business, which seemed the “traditional” way of doing business, adapting the latest technological innovation remained a focus. In order to improve services, the firm introduced products like the Equalizer (a DOS-based personal computer software) and SchwabQuotes (a touch-tone quote system) in 1985. Clients could now place orders via computers, as well as call up stock information and obtain research reports. Thus, being an early adopter of technology was an integral part of the firm’s strategy and more in line with how discount brokers differentiate themselves from traditional brokers.
After going public and barely managing to get through the stock market crash of 1987, the company once again embraced a growth strategy. With the acquisition of Chicago-based Rose & Co. in 1989, the fifth-largest discount broker at that time in the US, the firm controlled around 40% of the discount brokerage market. However, their market share equated to about 8% of all retail commissions only. Maybe this was the impetus needed to grow to a full-service brokerage house. Furthermore, we expect falling commission revenues due to the recession in the early 1990s likely reinforced management’s decision to diversify the firm’s revenue stream.
Schwab has evolved from a discount broker to a full-service brokerage firm. However, the firm has not changed its perspective on its business. It follows a simple mantra: Be disruptive and question the status quo
The Charles Schwab CorporationBrokers, Asset Managers & Exchanges
March 26, 2015 Bulent Ozcan, CFA (212) 863-4818; [email protected] 31

Today, the company’s business model has evolved to a point where advisory-based services have replaced trading revenue as the significant producer of revenue. As of September 2014, approximately 50% of all Schwab assets are utilizing Schwab’s advisory services.
Exhibit 30: Assets under an advisory relationship
$640
$1,015
$107
$177
$747
$1,192
Q3 '11 Q3 '14
Advisor Services Retail & other advisory solutions
17% of retail assets are enrolled in an advice solution
Note: 50% of all Schwab assets are now receiving some form of ongoing advisory service Source: Company reports; RBC Capital Markets
Schwab offers a wide range of products including:
Brokerage – Brokerage accounts including selected accounts with check-writing features, debit card, and bill pay; individual retirement accounts; retirement plans for businesses; college savings accounts; equity incentive plan accounts; and margin loans
Mutual funds – third-party mutual funds; proprietary mutual funds from two-fund families – Schwab Funds and Laudus Funds; other third-party mutual funds; and mutual fund trading and clearing services to broker–dealers
Exchange traded funds – third-party and proprietary ETFs
Advice solutions – separately managed accounts; customized advice for tailored portfolios; and specialized planning and full-time portfolio management
Banking – checking accounts linked to brokerage accounts; savings accounts, certificates of deposit; demand deposit accounts; residential mortgage loans; home equity lines of credit; personal loans; and entity lending
Trust services – custody services; personal trust reporting services; and administrative trustee services
As of December 2013, the company had $2.25 trillion in client assets, 9.1 million active brokerage accounts, 1.3 million corporate retirement plan participants, 916,000 banking accounts, and about 13,800 full-time employees.
The Charles Schwab CorporationBrokers, Asset Managers & Exchanges
March 26, 2015 Bulent Ozcan, CFA (212) 863-4818; [email protected] 32

Exhibit 31: SCHW snapshot
Charles Schwab Corp Snapshot
Founded 1986
Headquarters San Francisco, California, USA
President and CEO Walter W. Bettinger II
Employees 13,800 (as of December 31, 2013)
Business Segments Investor Services and Advisor Services
Total Revenue US$5.435 Billion (as of December 31, 2013)
Total Client Assets US$2.4 Trillion (as of September 30, 2014) ; Active brokerage accounts US$9.3 Million
Source: Company reports; RBC Capital Markets
Key subsidiaries through which SCHW conducts its business include:
Charles Schwab & Co., Inc., incorporated in 1971, is a securities broker–dealer with over 300 domestic branch offices in 45 states;
Charles Schwab Bank, commenced operations in 2003, is a federal savings bank located in Reno, Nevada; and
Charles Schwab Investment Management—the investment advisor to the Schwab mutual Funds and Schwab ETF.
The Charles Schwab CorporationBrokers, Asset Managers & Exchanges
March 26, 2015 Bulent Ozcan, CFA (212) 863-4818; [email protected] 33

Revenue breakdown
Sources of revenue The company’s major sources of revenues are asset management and administration fees, net interest revenue, and trading revenue.
Asset management and administration fees This includes mutual fund service fees and fees for asset-based financial services provided to individual and institutional clients. The company generates mutual fund service fees for shareholder services, administration, and investment management provided to its proprietary funds, and recordkeeping and shareholder services provided to third-party funds. The company also earns asset management fees for advice solutions, which include advisory and managed account services.
The current low short-term interest rate environment is affecting this revenue head. As the overall yields on money market mutual funds remain below the management fee, Schwab continues to waive a portion of its management fees. As of September 30, 2014, fee waivers eroded 0.45% of average fees earned on Schwab money market funds.
Net interest revenue Net interest revenue is the spread between interest earned on assets and interest paid on funding sources. Net interest revenue depends on changes in the volume and mix of these assets and liabilities, as well as by fluctuations in interest rates. The company’s strategy is that when interest rates fall, the company may attempt to alleviate some of the impact by extending the maturities of assets and lowering rates paid to clients on liabilities. The management has indicated that the prevailing low interest rate environment limits the extent to which the company can reduce interest expense on funding sources.
Trading revenue Trading revenue comprises commission and principal transaction revenues. Commission revenue is largely dependent on the number of trades and the average revenue earned per trade.
Principal transaction revenue is primarily comprised of revenue from trading activity in fixed income securities. To enable clients to trade in fixed income trading, the company maintains positions in fixed income securities. Principal transaction revenue is the spread between the price at which the company buys and sells securities to and from its clients and other brokers.
The Charles Schwab CorporationBrokers, Asset Managers & Exchanges
March 26, 2015 Bulent Ozcan, CFA (212) 863-4818; [email protected] 34

Exhibit 32: Revenue breakdown LTM Sep’14 vs. FY’99 ($M)
Asset management & admin fees,
42%
Net interest revenue, 38%
Trading revenue, 15%
Other, 5%
SCHW's LTM Sep'14 Revenues (in $M)
Asset management & admin fees,
19%
Net interest revenue,
18%
Trading revenue, 60%
Other, 3%
SCHW's FY'99 Revenues (in $M)
Source: Company reports; RBC Capital Markets
The company has diversified its revenue stream since FY’99. From a transactional-based revenue model in 1999, the company has now moved to a more advisory-based revenue model. As depicted in the chart, during FY’99, the majority of revenues were from trading revenues (60%) followed by asset management and administration fees (19%), net interest revenue (18%), and the remaining through other (5%). However, during LTM ended Sep’14, the majority of revenues were generated through asset management and administration fees (42%), followed by net interest revenue (38%), trading revenue of (15%), and the remaining through other (5%).
Business segments The company provides financial services to individuals and institutional clients through two segments—Investor Services and Advisor Services.
Investor services The Investor Services segment provides retail brokerage and banking services to individual investors, retirement plan services, and corporate brokerage services. For the year ended December 2013, investor services accounted for 77% of the net revenue.
Advisor services The Advisor Services segment provides custodial, trading, and support services to independent investment advisors (IAs), and retirement business services to independent retirement plan advisors and record-keepers. For the year ended December 2013, Investor Services accounted for 23% of the net revenue.
The Charles Schwab CorporationBrokers, Asset Managers & Exchanges
March 26, 2015 Bulent Ozcan, CFA (212) 863-4818; [email protected] 35

Exhibit 33: Revenue breakdown of business segments
Investor Services LTM Sep'14 Revenues
(in $M)
Asset management & admin fees, 38%
Net interest revenue,
44%
Trading revenue,
14%
Other, 4%
Investor Services LTM Sep'14 Revenues (in $M)
Advisor Services LTM Sep'14 Revenues
(in $M)
Asset management & admin fees, 56%
Net interest revenue,
18%
Trading revenue,
21%
Other, 5%
Advisor Services LTM Sep'14 Revenues(in $M)
Source: Company reports; RBC Capital Markets
During LTM Sep’14, the company’s Investor Services segment generated the majority of its revenue as net interest revenues (44%) coupled with asset management & admin fees (38%), followed by trading revenue of 14%, and the remaining through other (4%).
During LTM Sep’14, the company’s Advisor Services segment generates majority of its revenue asset management & admin fees (56%), followed by trading revenue (21%), net interest revenues (18%), and the remaining through other (5%).
The Charles Schwab CorporationBrokers, Asset Managers & Exchanges
March 26, 2015 Bulent Ozcan, CFA (212) 863-4818; [email protected] 36

Products Exhibit 34: Revenues from business segments
Traditional products Account Solutions Portfolio Solutions Additional Services
for direct investing for specialized strategies for comprehensive
guidance
to help clients achieve
their goals
• Stocks • Schwab Managed
Portfolios
• Schwab Private Client • Banking
• Bonds • Windhaven Portfolios • Schwab Advisor
Network
• Mortgage
• Mutual Funds • Thomas Partners • HELOC
• ETFs • Managed Account
Select
• Insurance
• Margin Lending • Global Trading • Income Solutions
• Charitable Giving
Source: Company presentation; RBC Capital Markets
Besides the traditional offering of brokerage, mutual funds, ETFs, banking, and custody services, SCHW offers certain unique and distinguished products based on customers’ needs and financial goals. The various product offerings include:
Schwab Managed Portfolios, Windhaven, and Thomas Partners programs Schwab provides customers with investment options that allow them to completely delegate their investment decisions. Schwab provides clients access to a diversified account invested completely in either mutual funds or ETFs through the Schwab Managed Portfolios and Windhaven, or in equities through Thomas Partners programs.
Windhaven, with AUM of $17.7bn in 3Q14, follows a broadly diversified ETF strategy focusing on limiting the downside and seeking to capture growth in rising markets over full cycles. This essentially also leads to lower upside in a bull market.
The Charles Schwab CorporationBrokers, Asset Managers & Exchanges
March 26, 2015 Bulent Ozcan, CFA (212) 863-4818; [email protected] 37

Exhibit 35: Windhaven AUM ($bn)
8.6
10.311.1
12.513.6
15.6
17.318.2 18.5 18.5 19
17.7
$0
$2
$4
$6
$8
$10
$12
$14
$16
$18
$20
1Q11 1Q12 2Q12 3Q12 4Q12 1Q13 2Q13 3Q13 4Q13 1Q14 2Q14 3Q14
Source: Company presentation; RBC Capital Markets
Thomas Partners, with AUM of $6.1bn in 3Q14, follows a dividend income strategy, which is highly appealing to investors in a low rate environment.
Exhibit 36: ThomasPartners AUM ($bn)
2.42.6 2.8
3.3
4.5
5.0
5.76.1
$0
$1
$2
$3
$4
$5
$6
$7
4Q12 1Q13 2Q13 3Q13 4Q13 1Q14 2Q14 3Q14
Source: Company presentation; RBC Capital Markets
Schwab’s portfolio consultants This service provides guidance to clients and access to online portfolio planning tools and professional advice. These consultants support clients in developing an investment strategy and carrying out investment and portfolio management decisions and offer a range of fully delegated managed solutions providing ongoing portfolio management.
Schwab Equity Ratings Schwab offers a few Internet-based research and analysis tools, including Schwab Equity Ratings. The tool is a quantitative model-based stock rating system, which provides ratings on approximately 3,000 US stocks and about 4,000 non-US stocks traded on 27 foreign equity markets.
The Charles Schwab CorporationBrokers, Asset Managers & Exchanges
March 26, 2015 Bulent Ozcan, CFA (212) 863-4818; [email protected] 38

Schwab Private Client This includes a designated portfolio consultant who designs a customized investment strategy based on customer’s requirement. This is based on a non-discretionary model wherein customers are given personalized recommendations and trades are approved by customers. As of quarter ended September 2014, client assets managed by Schwab Private Client totaled $70.6bn ($51.9bn in 4Q12).
Trading products For customers who trade actively, Schwab and optionsXpress, Inc. both offer integrated trading platforms, with several features such as, real-time market data, options trading, premium stock or futures research, and multi-channel access, risk management tools, decision support tools, and dedicated personal support.
Foreign equity investing
For customers looking to invest in foreign equities, Schwab offers access to certain foreign equity markets with the ability to trade in local currencies. Additionally, they also serve both foreign investors and non-English-speaking U.S. clients who wish to trade or invest in U.S. dollar-based securities. Schwab also serves foreign language (Chinese, Spanish, and Vietnamese) speaking clients through a combination of its branch offices and Web-based and telephonic services in the United States.
Retirement Plan Services, Corporate Brokerage Services, Stock Plan Services, and Compliance Solutions business units Retirement Plan Services include a bundled retirement plan product that provides sponsors with a wide array of investment options, trustee or custodial services, and participant-level recordkeeping. Schwab offers plan sponsors the capability to manage their plans, including plan-specific reports, studies and research, access to legislative updates, and benchmarking reports. Charles Schwab is a leading retirement investment asset custodian with ~25% market share and client assets under advisor services (excl. Retirement Business Services assets) totaling $1,015.3bn in 3Q14 ($788.5bn in 4Q12).
Corporate Brokerage Services includes brokerage-related services to corporate clients and mutual fund clearing services to banks, brokerage firms, and trust companies, and offers proprietary mutual funds, ETFs, collective trust funds, and investment management to institutional channels.
Stock Plan Services supports equity compensation plan sponsors with full-service recordkeeping for stock plans, stock options, restricted stock, performance shares, and stock appreciation rights.
Compliance Solutions provides solutions for compliance departments of regulated companies and firms with special requirements to monitor employee personal trading, including trade surveillance technology.
Investment advisors – Advisory Services segment The company provides custodial, trading, and support services to IAs. IAs who have custody client accounts at Schwab can leverage proprietary software that provides updated client information along with trading capabilities. In addition, the company offers online cashiering services, as well as Internet-based eDocuments sites for both IAs and their clients.
The Charles Schwab CorporationBrokers, Asset Managers & Exchanges
March 26, 2015 Bulent Ozcan, CFA (212) 863-4818; [email protected] 39

Distribution The company aims to offer a range of brokerage, wealth management, and asset management, banking, and trust and custodian services through its multi-channel service delivery model. Schwab strives to serve its customers by being accessible through multiple channels of distribution: namely online, mobile, telephonic, and branch.
SCHW’s branches and regional telephone service centers staff trained and experienced financial consultants focused on building and sustaining client relationships. The company aims to provide integrated, individually tailored solutions to its clients. The company believes that its branch capabilities are a competitive strength compared to the fragmented or limited offering of other firms.
SCHW holds a robust branch network with more than 300 local branches with about 1,100 financial consultants. The consultants enable the clients to work with a broad range of specialists based on their requirement. SCHW’s branch network offers wealth management services to more than 700,000 clients—78% of whom are served by an in-branch relationship. SCHW’S in-branch relationships hold approximately $1.3 million worth of household assets.
The company’s online, mobile, and telephonic channels help clients gain access to an extensive range of research tools, trade execution, and administrative services according to their requirements. These channels provide expert tools and extensive service capabilities with experienced, knowledgeable teams of trading specialists and integrated products, supporting clients who trade more actively.
SCHW offers online portfolio planning tools with research, analytic tools, performance reports, market analysis, and educational material to all clients. Further, the online service also offers professional advice through its portfolio consultants in developing an investment strategy and executing investment and portfolio management decisions. The service also offers managed solutions for ongoing portfolio management.
The company offers services to both foreign investors and non-English-speaking US clients interested in investing in US dollar-based securities. In addition, the company serves Chinese, Spanish, and Vietnamese-speaking clients through a combination of its branch offices and Web-based and telephonic services.
The Charles Schwab CorporationBrokers, Asset Managers & Exchanges
March 26, 2015 Bulent Ozcan, CFA (212) 863-4818; [email protected] 40

Competitors Charles Schwab’s competitors include a wide range of brokerage, wealth management, and asset management firms, as well as banks and trust companies. Charles Schwab’s closest competitors in terms of client assets under management are Bank of America Merrill Lynch and Morgan Stanley global wealth management.
Exhibit 37: Schwab’s AUM is approaching that of Merrill Lynch
Total Client Assets $ billions
$2,498
$2,025
$672
$290
$2,464
$-
$500
$1,000
$1,500
$2,000
$2,500
$3,000
1Q10 3Q10 1Q11 3Q11 1Q12 3Q12 1Q13 3Q13 1Q14 3Q14Bank of America Merrill Lynch Morgan StanleyAmeritrade E*TradeCharles Schwab
Note: TD Ameritrade assets as of December 31, 2014
Source: Publicly available company reports for each period
The Charles Schwab CorporationBrokers, Asset Managers & Exchanges
March 26, 2015 Bulent Ozcan, CFA (212) 863-4818; [email protected] 41

History Exhibit 38: Milestones
Year Highlights
1963 Chuck Schwab and two other partners launch Investment Indicator, an investment advisory newsletter.
1971 Incorporated in California as First Commander Corporation, a subsidiary of Commander Industries, Inc.
1972-1974 Chuck Schwab buys all stock from Commander Industries.
Corporate name changes to Charles Schwab & Co., Inc.
SEC mandates a 13-month trial period for the deregulation of certain brokerage transactions.
1981 Schwab becomes a member of the NYSE. The firm opens its first location in Manhattan. Larry Stupski is named
President and COO of the firm.
1983 Bank of America acquires the firm for $55 million. Schwab introduces the new Schwab One brokerage account.
1985 In August, Schwab records its 1-millionth client account. By year-end, client accounts reach 1.2 million with client
assets of $7.6 billion.
1987 In July, management leads a buyback from Bank of America for $280 million. In September, the Charles Schwab
Corporation completes its initial public offering.
1988 Financial Advisors Service exceeds $1 billion in client assets after just one year of business.
1990 Introduces Schwab Funds money market mutual funds.
1991 Introduces the Schwab 1000 Fund, an equity index fund that reaches $191 million in client assets by year-end.
1992 Charles Schwab Trust Company is created. Introduces no-annual-fee IRA and the Schwab Mutual Fund OneSource
service.
1995 Acquires U.K.-based discount broker ShareLink and 401(k) plan recordkeeper the Hampton Company, founded by
Walter W. Bettinger II.
1998 Acquires two Canadian brokerages to form Charles Schwab Canada. Post acqusition, online accounts reach 2
million.
2000 Schwab acquires CyBerCorp, Inc. to serve active on-line traders.
The company introduces pre-market trading for Nasdaq and listed securities and PocketBroker wireless investing
service.
2001 CyBerCorp, Inc. renames itself to Cyber Trader Inc. and enhances its service with improved software, educational
tools and tiered pricing.
2003 Schwab launches Charles Schwab Bank and introduces Schwab Small-Cap Equity Fund.
2007 Schwab completes the acquisition of The 401(k) Company, a retirement plan provider in Austin, TX.
Charles Schwab Investment Management completes the acquisition of Global Real Analytics, LLC (GRA).
2010 Schwab completes the acquisition of Windward Investment Management, Inc. and renames it as Windhaven.
2011 The Charles Schwab Corporation acquires optionsXpress Holdings, Inc. and Compliance11.
2012 The company enters into an agreement with Piper Jaffray to expand its access in new-issue municipal bonds
through the Schwab BondSource platform.
Schwab completes the acquisition of dividend income-focused asset management firm, named as ThomasPartners
Inc.
2013 The company launches "Schwab ETF OneSource" platform, featuring commission-free trades on ETFs from most of
the major ETF providers.
Source: Company reports and presentations; RBC Capital Markets
The Charles Schwab CorporationBrokers, Asset Managers & Exchanges
March 26, 2015 Bulent Ozcan, CFA (212) 863-4818; [email protected] 42
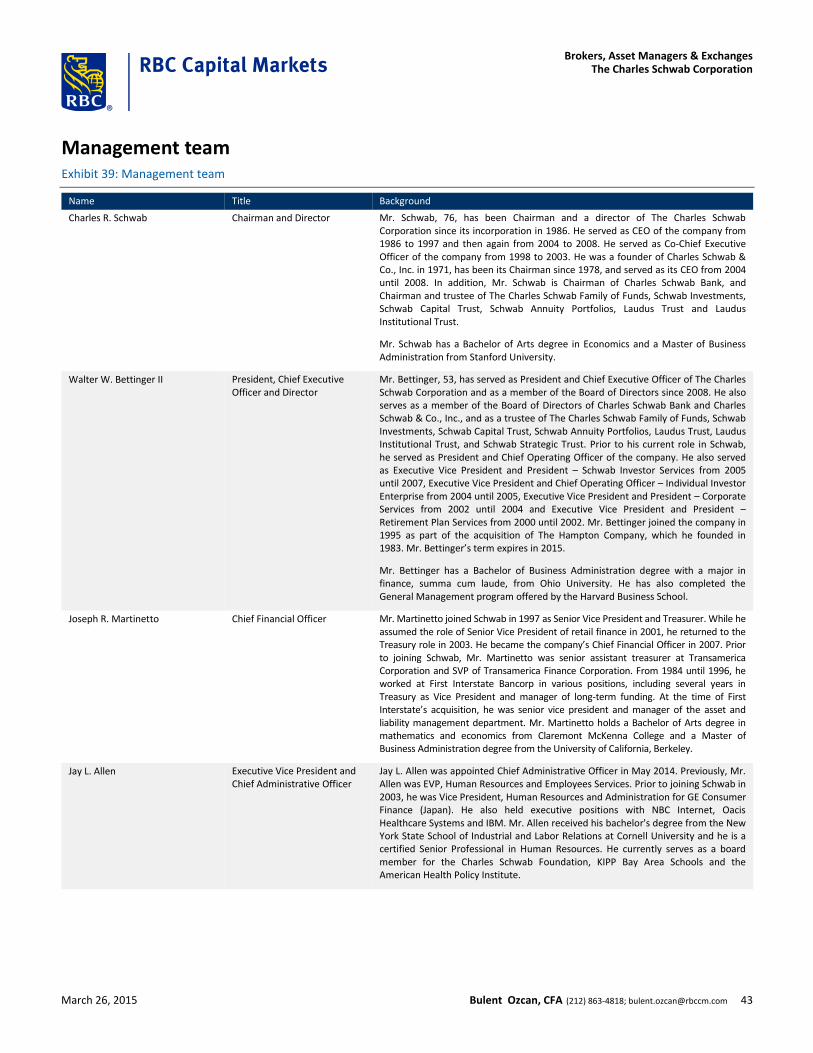
Management team Exhibit 39: Management team
Name Title Background
Charles R. Schwab Chairman and Director Mr. Schwab, 76, has been Chairman and a director of The Charles Schwab Corporation since its incorporation in 1986. He served as CEO of the company from 1986 to 1997 and then again from 2004 to 2008. He served as Co-Chief Executive Officer of the company from 1998 to 2003. He was a founder of Charles Schwab & Co., Inc. in 1971, has been its Chairman since 1978, and served as its CEO from 2004 until 2008. In addition, Mr. Schwab is Chairman of Charles Schwab Bank, and Chairman and trustee of The Charles Schwab Family of Funds, Schwab Investments, Schwab Capital Trust, Schwab Annuity Portfolios, Laudus Trust and Laudus Institutional Trust.
Mr. Schwab has a Bachelor of Arts degree in Economics and a Master of Business Administration from Stanford University.
Walter W. Bettinger II President, Chief Executive Officer and Director
Mr. Bettinger, 53, has served as President and Chief Executive Officer of The Charles Schwab Corporation and as a member of the Board of Directors since 2008. He also serves as a member of the Board of Directors of Charles Schwab Bank and Charles Schwab & Co., Inc., and as a trustee of The Charles Schwab Family of Funds, Schwab Investments, Schwab Capital Trust, Schwab Annuity Portfolios, Laudus Trust, Laudus Institutional Trust, and Schwab Strategic Trust. Prior to his current role in Schwab, he served as President and Chief Operating Officer of the company. He also served as Executive Vice President and President – Schwab Investor Services from 2005 until 2007, Executive Vice President and Chief Operating Officer – Individual Investor Enterprise from 2004 until 2005, Executive Vice President and President – Corporate Services from 2002 until 2004 and Executive Vice President and President – Retirement Plan Services from 2000 until 2002. Mr. Bettinger joined the company in 1995 as part of the acquisition of The Hampton Company, which he founded in 1983. Mr. Bettinger’s term expires in 2015.
Mr. Bettinger has a Bachelor of Business Administration degree with a major in finance, summa cum laude, from Ohio University. He has also completed the General Management program offered by the Harvard Business School.
Joseph R. Martinetto Chief Financial Officer Mr. Martinetto joined Schwab in 1997 as Senior Vice President and Treasurer. While he assumed the role of Senior Vice President of retail finance in 2001, he returned to the Treasury role in 2003. He became the company’s Chief Financial Officer in 2007. Prior to joining Schwab, Mr. Martinetto was senior assistant treasurer at Transamerica Corporation and SVP of Transamerica Finance Corporation. From 1984 until 1996, he worked at First Interstate Bancorp in various positions, including several years in Treasury as Vice President and manager of long-term funding. At the time of First Interstate’s acquisition, he was senior vice president and manager of the asset and liability management department. Mr. Martinetto holds a Bachelor of Arts degree in mathematics and economics from Claremont McKenna College and a Master of Business Administration degree from the University of California, Berkeley.
Jay L. Allen Executive Vice President and Chief Administrative Officer
Jay L. Allen was appointed Chief Administrative Officer in May 2014. Previously, Mr. Allen was EVP, Human Resources and Employees Services. Prior to joining Schwab in 2003, he was Vice President, Human Resources and Administration for GE Consumer Finance (Japan). He also held executive positions with NBC Internet, Oacis Healthcare Systems and IBM. Mr. Allen received his bachelor's degree from the New York State School of Industrial and Labor Relations at Cornell University and he is a certified Senior Professional in Human Resources. He currently serves as a board member for the Charles Schwab Foundation, KIPP Bay Area Schools and the American Health Policy Institute.
The Charles Schwab CorporationBrokers, Asset Managers & Exchanges
March 26, 2015 Bulent Ozcan, CFA (212) 863-4818; [email protected] 43

Steve Anderson Executive Vice President, Retirement Plan Services
Steve Anderson heads Schwab Retirement Plan Services. He joined Schwab in 1999, and has been in his current role since 2008. In his prior roles at Schwab, Mr. Anderson managed various business units in Schwab Corporate Services and Schwab Investor Services. In August of 2004, he joined the leadership team of Schwab Investor Services. Prior to joining Schwab, Anderson provided insurance planning for businesses and high-net-worth individuals. He is a graduate of Miami University and has completed the Harvard Business School General Management Program.
Bernard J. Clark Executive Vice President and Head of Schwab Advisor Services
Bernard J. Clark is the head of Schwab Advisor Services and a member of Charles Schwab’s Executive Committee. Mr. Clark has more than 30 years of financial industry experience. He began his career at Schwab in 1998 as Senior Vice President of trading and operations for Schwab Institutional. He took on his current role as head of Schwab Advisor Services in 2010. Prior to joining Schwab, Mr. Clark has worked with the London office of Deutsche Morgan Grenfell. He also spent 13 years with Salomon Brothers as a member of the executive committee responsible for North American operations. Mr. Clark holds a Bachelor of Science degree in accounting from St. John’s University in New York.
Terri R. Kallsen Executive Vice President, Investor Services
Terri R. Kallsen leads Investor Services division at Charles Schwab Corporation. Previously, Kallsen led the Branch Networks and served as Senior Vice President of Portfolio Consulting. Ms. Kallsen joined Schwab in May 2012, from USAA, where she was Senior Vice President of wealth management. Prior to joining USAA, Ms. Kallsen served as Vice President for Thrivent Financial. She has over 20 years of financial services industry experience. She earned a Bachelor of Science degree from Minnesota and a Master's degree from the University of Wisconsin. She is on the Board of Directors of The Charles Schwab Foundation and serves on the Board of Trustees for the College of Saint Benedict.
Marie A. Chandoha President and CEO, Charles Schwab Investment Management
Marie A. Chandoha is the President and CEO of Charles Schwab Investment Management, Inc., the investment advisor to Schwab Funds, Laudus Funds and Schwab ETFs. Prior to joining Schwab in 2010, Ms. Chandoha spent three years as the global head of the fixed-income business at BlackRock. She previously served as co-head and senior portfolio manager in charge of the Montgomery fixed-income division at Wells Capital Management; a senior bond strategist at Goldman Sachs; and managing director responsible for the global fixed-income research and economics department at Credit Suisse First Boston. Earlier in her career, Ms. Chandoha held research positions at Morgan Stanley and The Federal Reserve Bank of New York. Ms. Chandoha earned a Bachelor of Arts degree in economics from Harvard University.
Andrew Gill Executive Vice President, Investment Management Services
Andrew Gill is the Executive Vice President of Investment Management Services, a part of Charles Schwab Investment Management, Inc, where he leads distribution. Prior to this, Mr. Gill was Executive Vice President and co-leader of Schwab Investor Services. Previously, he served as senior vice president of Schwab’s fixed income organization. Mr. Gill began his career at Charles Schwab in 2001 as Vice President of CyberTrader marketing. Prior to joining Schwab, he was chief marketing officer at Cofiniti, a wealth management software company and at Rx.com, an online pharmacy. He also held various roles at Genesco, Inc., a men’s wholesale and retail footwear company and at Procter and Gamble in sales management and brand management. Mr. Gill holds a Bachelor of Arts degree in economics from Wake Forest University, Winston-Salem, North Carolina.
David R. Garfield Executive Vice President, General Counsel and Corporate Secretary
David R. Garfield was appointed Executive Vice President, General Counsel and Corporate Secretary of The Charles Schwab Corporation in October 2014. Prior to joining Schwab, Mr. Garfield worked for 23 years in the Wells Fargo & Company Law Department. He served as Deputy General Counsel with responsibility for litigation and commercial loan workouts for 16 years. He began his legal career with Davis, Graham & Stubbs. Mr. Garfield received his Bachelor of Arts degree in economics and political science from the University of Denver and his law degree from Brigham Young University.
The Charles Schwab CorporationBrokers, Asset Managers & Exchanges
March 26, 2015 Bulent Ozcan, CFA (212) 863-4818; [email protected] 44

Jonathan M. Craig Executive Vice President, Chief Marketing Officer
Jonathan M. Craig has served as the Chief Marketing Officer, since September 2012, responsible for US and international marketing strategies. He joined Schwab in 2000, and has held a variety of marketing roles, including the Chief of Staff to Charles R. Schwab. He also managed the retail marketing and client acquisition teams. Prior to joining Schwab, he has worked with AT&T, where he held a variety of management positions in marketing, advertising and sales. He received an MBA degree in marketing and finance from the University of California, Berkeley, and has an undergraduate degree in economics and political science from McGill University in Montreal, Canada. In addition, he has completed Executive Education courses at the University of Virginia Graduate School of Business.
Jim McGuire Executive Vice President, Client Solutions
Jim McGuire is the Executive Vice President and Chief Information Officer (CIO) for Schwab Technology Services (STS) responsible for Schwab’s technology innovation, development, infrastructure and operations. McGuire moved to Schwab in August 2009 from eBay, where he was responsible for workplace technology and business support applications at eBay and production site operation of eBay’s PayPal business. Prior to eBay, McGuire also held senior executive positions at companies including Source Informatics and American Express. He earned his Bachelor’s degree in computer information systems at Arizona State University.
Source: Company reports; RBC Capital Markets
The Charles Schwab CorporationBrokers, Asset Managers & Exchanges
March 26, 2015 Bulent Ozcan, CFA (212) 863-4818; [email protected] 45

Scenario shown: Base caseSource: Company filings; RBC Capital Markets estimates($ in million) Fiscal Year
1QA 2QA 3QA 4QA 1QE 2QE 3QE 4QE 2013A 2014A 2015E 2016E 2017EIncome Statement Mar-14 Jun-14 Sep-14 Dec-14 Mar-15 Jun-15 Sep-15 Dec-15 Dec-13 Dec-14 Dec-15 Dec-16 Dec-17
Net revenuesAsset management and administration fees $611 $632 $649 $641 $645 $684 $697 $705 $2,315 $2,533 $2,731 $3,524 $3,789
Interest revenue 579 588 600 607 614 637 672 687 $2,085 $2,374 $2,610 $2,976 $3,362Interest expense (26) (26) (27) (23) (26) (26) (27) (24) (105) (102) (103) (106) (109)
Net interest revenue $553 $562 $573 $584 $588 $611 $645 $663 $1,980 $2,272 $2,507 $2,871 $3,253
Trading revenue 247 212 209 239 243 217 213 256 $913 $907 $929 $969 $1,009Other revenues 68 65 120 90 93 95 98 101 236 343 388 436 491 Provision for loan losses (1) 7 1 (3) - - - - 1 4 - - - Net Impairment losses on securities - - (1) - - - - - (10) (1) - - -
Total net revenue $1,478 $1,478 $1,551 $1,551 $1,569 $1,608 $1,653 $1,725 $5,435 $6,058 $6,555 $7,801 $8,542
Expenses excluding interestCompensation and benefits 528 520 593 543 554 546 593 570 $2,027 $2,184 $2,264 $2,331 $2,401Professional services 106 112 117 122 114 121 121 126 415 457 482 520 557 Occupancy and equipment 80 80 82 82 82 82 84 84 309 324 334 340 347 Advertising and market development 63 65 59 58 65 67 61 60 257 245 252 260 268 Communications 56 57 55 55 56 57 55 55 220 223 224 225 226 Depreciation and amortization 48 48 49 54 54 54 55 56 202 199 219 236 256 Other 75 75 78 83 80 82 84 88 300 311 334 398 436
Total expenses excluding interest $956 $957 $1,033 $997 $1,006 $1,010 $1,053 $1,039 $3,730 $3,943 $4,109 $4,311 $4,491
Income before taxes on income $522 $521 $518 $554 $563 $598 $600 $686 $1,705 $2,115 $2,446 $3,489 $4,052
Taxes on net income 196 197 197 204 213 226 227 259 634 794 925 1,319 1,532 Net income $326 $324 $321 $350 $350 $372 $373 $426 $1,071 $1,321 $1,522 $2,170 $2,520
Preferred stock dividends 8 22 9 21 8 22 9 21 61 60 60 60 60 Net income available to common stockholders $318 $302 $312 $329 $342 $350 $364 $405 $1,010 $1,261 $1,462 $2,110 $2,460
EBITDA $570 $569 $567 $608 $617 $652 $655 $742 $1,907 $2,314 $2,665 $3,726 $4,308
Earnings per share - basic $0.24 $0.23 $0.24 $0.25 $0.26 $0.27 $0.28 $0.31 $0.78 $0.96 $1.11 $1.59 $1.840 $0.00 $0.00 $0.00 $0.00 $0.00 $0.00 $0.00 $0.00 $0.00 $0.00 $0.00 $0.00 $0.00Earnings per share - diluted $0.24 $0.23 $0.24 $0.25 $0.26 $0.26 $0.27 $0.30 $0.78 $0.95 $1.10 $1.58 $1.82
Dividends declared per share - diluted $0.06 $0.06 $0.06 $0.06 $0.06 $0.06 $0.06 $0.06 $0.24 $0.24 $0.24 $0.33 $0.40Dividend pay-out ratio 24.5% 25.9% 25.1% 23.9% 23.0% 22.5% 21.7% 19.5% 30.9% 25.1% 21.6% 20.7% 21.8%
Weighted average share count - basic (million) 1,299 1,302 1,304 1,308 1,311 1,313 1,316 1,318 1,285 1,303 1,315 1,326 1,338 Dilution (million) 12 11 12 12 12 12 12 12 8 12 12 12 12 Weighted average share count - diluted (million) 1,311 1,313 1,316 1,320 1,323 1,325 1,328 1,330 1,293 1,315 1,327 1,338 1,350
Profitability metricsPre-tax operating margin 35.3% 35.3% 33.4% 35.7% 35.9% 37.2% 36.3% 39.7% 31.4% 34.9% 37.3% 44.7% 47.4%Net interest margin (basis points) 164bps 165bps 164bps 163bps 163bps 164bps 168bps 170bps 152bps 164bps 166bps 175bps 182bpsReturn on average stockholders' equity (annualized) 13.3% 12.0% 11.8% 12.2% 12.4% 12.0% 12.0% 12.9% 11.1% 12.4% 12.4% 15.1% 14.7%ROTE 12.1% 10.9% 10.8% 11.1% 11.4% 11.0% 11.1% 12.0% 10.0% 11.3% 11.5% 14.1% 13.9%EBITDA as a percentage of revenues 38.6% 38.5% 36.6% 39.2% 39.3% 40.6% 39.6% 43.0% 35.1% 38.2% 40.7% 47.8% 50.4%
Fiscal Year
Balance Sheet 1QA 2QA 3QA 4QA 1QE 2QE 3QE 4QE 2013A 2014A 2015E 2016E 2017E Cash and cash equivalents $7,173 $6,832 $8,588 $9,193 $9,359 $9,187 $9,035 $8,928 $7,728 $9,193 $8,928 $9,015 $12,242 Cash and investments segregated and on deposit for regulatory purposes20,548 19,093 19,890 19,914 19,938 19,962 19,986 20,010 23,553 19,914 20,010 20,106 20,203 Receivables from brokers, dealers, and clearing organizations 482 522 458 416 420 423 426 430 509 416 430 444 458 Receivables from brokerage clients - net 14,571 14,670 15,416 15,828 16,382 16,955 17,549 18,163 13,951 15,828 18,163 20,842 23,917 Other securities owned - at fair value 456 583 572 572 572 572 572 572 517 572 572 572 572 Securities available for sale 53,080 53,203 52,201 53,060 53,803 54,556 55,320 56,094 51,618 53,060 56,094 59,771 63,689 Securities held to maturity 32,123 32,495 34,007 35,363 36,777 38,248 39,778 41,369 30,318 35,363 41,369 48,396 56,617 Loans to banking clients - net 12,591 12,869 13,080 13,372 13,639 13,912 14,190 14,474 12,419 13,372 14,474 15,667 16,959 Loans held for sale - - - - - - - - - - - - - Equipment, office facilities, and property - net 820 883 991 991 991 991 991 991 790 991 991 991 991 Goodwill 1,227 1,227 1,227 1,227 1,227 1,227 1,227 1,227 1,227 1,227 1,227 1,227 1,227 Intangible assets - net 255 244 233 233 233 233 233 233 266 233 233 233 233 Other assets 740 780 781 781 781 781 781 781 746 781 781 781 781 Total Assets $144,066 $143,401 $147,444 $150,950 $154,121 $157,047 $160,088 $163,272 $143,642 $150,950 $163,272 $178,046 $197,889
Deposits from banking clients $95,591 $95,688 $97,345 $99,746 $102,739 $105,821 $108,996 $112,265 $92,972 $99,746 $112,265 $126,356 $144,996 Payables to brokers, dealers, and clearing organizations 1,918 1,725 2,099 2,099 2,099 2,099 2,099 2,099 1,467 2,099 2,099 2,099 2,099 Payables to brokerage clients 32,308 31,484 33,131 33,836 33,329 32,829 32,336 31,851 35,333 33,836 31,851 29,983 28,224 Accrued expenses and other liabilities 1,532 1,433 1,496 1,646 1,646 1,646 1,646 1,646 1,586 1,646 1,646 1,646 1,646 Long-term debt 1,902 1,901 1,900 1,899 1,897 1,895 1,893 1,891 1,903 1,899 1,891 1,884 1,876 Total Liabilities $133,251 $132,231 $135,971 $139,226 $141,709 $144,289 $146,970 $149,753 $133,261 $139,226 $149,753 $161,967 $178,841
Preferred stock 870 871 872 872 872 872 872 872 869 872 872 872 872 Common stock 15 15 15 15 15 15 15 15 15 15 15 15 15 Additional paid-in capital 3,982 4,012 4,050 4,050 4,400 4,400 4,400 4,400 3,951 4,050 4,400 4,926 5,530 Retained earnings 9,492 9,715 9,949 10,200 10,463 10,734 11,019 11,346 9,253 10,200 11,346 13,019 14,944 Treasury stock (3,652) (3,629) (3,576) ($3,576) ($3,501) ($3,426) ($3,351) ($3,276) (3,716) (3,576) (3,276) (2,916) (2,476) Accumulated other comprehensive income 108 186 163 163 163 163 163 163 9 163 163 163 163 Total Shareholders' Equity $10,815 $11,170 $11,473 $11,724 $12,412 $12,758 $13,118 $13,519 10,381 11,724 13,519 16,079 19,048
Total Liabilities & Shareholders' Equity $144,066 $143,401 $147,444 $150,950 $154,121 $157,047 $160,088 $163,272 $143,642 $150,950 $163,272 $178,046 $197,889
Balance sheet and debt ratiosInterest coverage ratio 31.7x 31.6x 29.8x 33.8x 34.7x 36.3x 36.1x 40.9x 27.6x 31.7x 37.0x 51.9x 60.2xDebt to EBITDA 1.5x 1.5x 1.5x 1.5x 1.4x 1.4x 1.4x 1.2x 1.8x 1.5x 1.3x 0.9x 0.8xLong-term debt to capitalization ratio 15.0% 14.5% 14.2% 13.9% 13.3% 12.9% 12.6% 12.3% 15.5% 13.9% 12.3% 10.5% 9.0%Book value per diluted share $8.31 $8.58 $8.81 $8.97 $9.48 $9.73 $9.98 $10.27 $8.00 $8.97 $10.27 $12.11 $14.20Tangible equity per share $7.17 $7.45 $7.69 $7.86 $8.37 $8.61 $8.87 $9.16 $6.85 $7.86 $9.16 $11.01 $13.11
FY 2015FY 2014
FY 2014 FY 2015
The Charles Schwab CorporationBrokers, Asset Managers & Exchanges
March 26, 2015 Bulent Ozcan, CFA (212) 863-4818; [email protected] 46

Required disclosures
Conflicts disclosuresThe analyst(s) responsible for preparing this research report received compensation that is based upon various factors, includingtotal revenues of the member companies of RBC Capital Markets and its affiliates, a portion of which are or have been generatedby investment banking activities of the member companies of RBC Capital Markets and its affiliates.
Please note that current conflicts disclosures may differ from those as of the publication date on, and as set forth in,this report. To access current conflicts disclosures, clients should refer to https://www.rbccm.com/GLDisclosure/PublicWeb/DisclosureLookup.aspx?entityId=1 or send a request to RBC CM Research Publishing, P.O. Box 50, 200 Bay Street, Royal Bank Plaza,29th Floor, South Tower, Toronto, Ontario M5J 2W7.
RBC Capital Markets, LLC makes a market in the securities of The Charles Schwab Corporation.
Royal Bank of Canada, together with its affiliates, beneficially owns 1 percent or more of a class of common equity securities ofThe Charles Schwab Corporation.
A member company of RBC Capital Markets or one of its affiliates received compensation for products or services other thaninvestment banking services from The Charles Schwab Corporation during the past 12 months. During this time, a membercompany of RBC Capital Markets or one of its affiliates provided non-investment banking securities-related services to The CharlesSchwab Corporation.
A member company of RBC Capital Markets or one of its affiliates received compensation for products or services other thaninvestment banking services from The Charles Schwab Corporation during the past 12 months. During this time, a membercompany of RBC Capital Markets or one of its affiliates provided non-securities services to The Charles Schwab Corporation.
RBC Capital Markets has provided The Charles Schwab Corporation with non-investment banking securities-related services in thepast 12 months.
RBC Capital Markets has provided The Charles Schwab Corporation with non-securities services in the past 12 months.
Explanation of RBC Capital Markets Equity rating systemAn analyst's 'sector' is the universe of companies for which the analyst provides research coverage. Accordingly, the rating assignedto a particular stock represents solely the analyst's view of how that stock will perform over the next 12 months relative tothe analyst's sector average. Although RBC Capital Markets' ratings of Top Pick (TP)/Outperform (O), Sector Perform (SP), andUnderperform (U) most closely correspond to Buy, Hold/Neutral and Sell, respectively, the meanings are not the same becauseour ratings are determined on a relative basis.RatingsTop Pick (TP): Represents analyst's best idea in the sector; expected to provide significant absolute total return over 12 monthswith a favorable risk-reward ratio.Outperform (O): Expected to materially outperform sector average over 12 months.Sector Perform (SP): Returns expected to be in line with sector average over 12 months.Underperform (U): Returns expected to be materially below sector average over 12 months.Risk RatingAs of March 31, 2013, RBC Capital Markets suspends its Average and Above Average risk ratings. The Speculative risk rating reflectsa security's lower level of financial or operating predictability, illiquid share trading volumes, high balance sheet leverage, or limitedoperating history that result in a higher expectation of financial and/or stock price volatility.
The Charles Schwab CorporationBrokers, Asset Managers & Exchanges
March 26, 2015 Bulent Ozcan, CFA (212) 863-4818; [email protected] 47

Distribution of ratingsFor the purpose of ratings distributions, regulatory rules require member firms to assign ratings to one of three rating categories- Buy, Hold/Neutral, or Sell - regardless of a firm's own rating categories. Although RBC Capital Markets' ratings of Top Pick(TP)/Outperform (O), Sector Perform (SP), and Underperform (U) most closely correspond to Buy, Hold/Neutral and Sell, respectively,the meanings are not the same because our ratings are determined on a relative basis (as described below).
Distribution of ratings
RBC Capital Markets, Equity Research
As of 31-Dec-2014
Investment Banking
Serv./Past 12 Mos.
Rating Count Percent Count Percent
BUY [Top Pick & Outperform] 897 52.92 290 32.33
HOLD [Sector Perform] 686 40.47 137 19.97
SELL [Underperform] 112 6.61 6 5.36
References to a Recommended List in the recommendation history chart may include one or more recommended lists or modelportfolios maintained by RBC Wealth Management or one of its affiliates. RBC Wealth Management recommended lists includethe Guided Portfolio: Prime Income (RL 6), the Guided Portfolio: Large Cap (RL 7), the Guided Portfolio: Dividend Growth (RL 8),the Guided Portfolio: Midcap 111 (RL 9), the Guided Portfolio: ADR (RL 10), and the Guided Portfolio: Global Equity (U.S.) (RL 11).RBC Capital Markets recommended lists include the Strategy Focus List and the Fundamental Equity Weightings (FEW) portfolios.The abbreviation 'RL On' means the date a security was placed on a Recommended List. The abbreviation 'RL Off' means the datea security was removed from a Recommended List.
Equity valuation and risksFor valuation methods used to determine, and risks that may impede achievement of, price targets for covered companies, pleasesee the most recent company-specific research report at https://www.rbcinsight.com or send a request to RBC Capital MarketsResearch Publishing, P.O. Box 50, 200 Bay Street, Royal Bank Plaza, 29th Floor, South Tower, Toronto, Ontario M5J 2W7.
Conflicts policyRBC Capital Markets Policy for Managing Conflicts of Interest in Relation to Investment Research is available from us on request.To access our current policy, clients should refer to
The Charles Schwab CorporationBrokers, Asset Managers & Exchanges
March 26, 2015 Bulent Ozcan, CFA (212) 863-4818; [email protected] 48

https://www.rbccm.com/global/file-414164.pdfor send a request to RBC Capital Markets Research Publishing, P.O. Box 50, 200 Bay Street, Royal Bank Plaza, 29th Floor, SouthTower, Toronto, Ontario M5J 2W7. We reserve the right to amend or supplement this policy at any time.
Dissemination of research and short-term trade ideasRBC Capital Markets endeavors to make all reasonable efforts to provide research simultaneously to all eligible clients, havingregard to local time zones in overseas jurisdictions. RBC Capital Markets' equity research is posted to our proprietary websiteto ensure eligible clients receive coverage initiations and changes in ratings, targets and opinions in a timely manner. Additionaldistribution may be done by the sales personnel via email, fax, or other electronic means, or regular mail. Clients may alsoreceive our research via third party vendors. RBC Capital Markets also provides eligible clients with access to SPARC on the Firmsproprietary INSIGHT website, via email and via third-party vendors. SPARC contains market color and commentary regardingsubject companies on which the Firm currently provides equity research coverage. Research Analysts may, from time to time,include short-term trade ideas in research reports and / or in SPARC. A short-term trade idea offers a short-term view onhow a security may trade, based on market and trading events, and the resulting trading opportunity that may be available. Ashort-term trade idea may differ from the price targets and recommendations in our published research reports reflecting theresearch analyst's views of the longer-term (one year) prospects of the subject company, as a result of the differing time horizons,methodologies and/or other factors. Thus, it is possible that a subject company's common equity that is considered a long-term'Sector Perform' or even an 'Underperform' might present a short-term buying opportunity as a result of temporary selling pressurein the market; conversely, a subject company's common equity rated a long-term 'Outperform' could be considered susceptibleto a short-term downward price correction. Short-term trade ideas are not ratings, nor are they part of any ratings system, andthe firm generally does not intend, nor undertakes any obligation, to maintain or update short-term trade ideas. Short-term tradeideas may not be suitable for all investors and have not been tailored to individual investor circumstances and objectives, andinvestors should make their own independent decisions regarding any securities or strategies discussed herein. Please contactyour investment advisor or institutional salesperson for more information regarding RBC Capital Markets' research.
Analyst certificationAll of the views expressed in this report accurately reflect the personal views of the responsible analyst(s) about any and all ofthe subject securities or issuers. No part of the compensation of the responsible analyst(s) named herein is, or will be, directly orindirectly, related to the specific recommendations or views expressed by the responsible analyst(s) in this report.
The Global Industry Classification Standard (“GICS”) was developed by and is the exclusive property and a service mark of MSCI Inc. (“MSCI”) and Standard & Poor’s Financial ServicesLLC (“S&P”) and is licensed for use by RBC. Neither MSCI, S&P, nor any other party involved in making or compiling the GICS or any GICS classifications makes any express or impliedwarranties or representations with respect to such standard or classification (or the results to be obtained by the use thereof), and all such parties hereby expressly disclaim all warrantiesof originality, accuracy, completeness, merchantability and fitness for a particular purpose with respect to any of such standard or classification. Without limiting any of the foregoing,in no event shall MSCI, S&P, any of their affiliates or any third party involved in making or compiling the GICS or any GICS classifications have any liability for any direct, indirect, special,punitive, consequential or any other damages (including lost profits) even if notified of the possibility of such damages.
Disclaimer
RBC Capital Markets is the business name used by certain branches and subsidiaries of the Royal Bank of Canada, including RBC Dominion Securities Inc., RBCCapital Markets, LLC, RBC Europe Limited, RBC Capital Markets (Hong Kong) Limited, Royal Bank of Canada, Hong Kong Branch and Royal Bank of Canada, SydneyBranch. The information contained in this report has been compiled by RBC Capital Markets from sources believed to be reliable, but no representation or warranty,express or implied, is made by Royal Bank of Canada, RBC Capital Markets, its affiliates or any other person as to its accuracy, completeness or correctness. Allopinions and estimates contained in this report constitute RBC Capital Markets' judgement as of the date of this report, are subject to change without notice andare provided in good faith but without legal responsibility. Nothing in this report constitutes legal, accounting or tax advice or individually tailored investmentadvice. This material is prepared for general circulation to clients and has been prepared without regard to the individual financial circumstances and objectives ofpersons who receive it. The investments or services contained in this report may not be suitable for you and it is recommended that you consult an independentinvestment advisor if you are in doubt about the suitability of such investments or services. This report is not an offer to sell or a solicitation of an offer to buyany securities. Past performance is not a guide to future performance, future returns are not guaranteed, and a loss of original capital may occur. RBC CapitalMarkets research analyst compensation is based in part on the overall profitability of RBC Capital Markets, which includes profits attributable to investment bankingrevenues. Every province in Canada, state in the U.S., and most countries throughout the world have their own laws regulating the types of securities and otherinvestment products which may be offered to their residents, as well as the process for doing so. As a result, the securities discussed in this report may not beeligible for sale in some jurisdictions. RBC Capital Markets may be restricted from publishing research reports, from time to time, due to regulatory restrictions and/or internal compliance policies. If this is the case, the latest published research reports available to clients may not reflect recent material changes in the applicableindustry and/or applicable subject companies. RBC Capital Markets research reports are current only as of the date set forth on the research reports. This report isnot, and under no circumstances should be construed as, a solicitation to act as securities broker or dealer in any jurisdiction by any person or company that is notlegally permitted to carry on the business of a securities broker or dealer in that jurisdiction. To the full extent permitted by law neither RBC Capital Markets norany of its affiliates, nor any other person, accepts any liability whatsoever for any direct or consequential loss arising from any use of this report or the informationcontained herein. No matter contained in this document may be reproduced or copied by any means without the prior consent of RBC Capital Markets.
The Charles Schwab CorporationBrokers, Asset Managers & Exchanges
March 26, 2015 Bulent Ozcan, CFA (212) 863-4818; [email protected] 49

Additional information is available on request.
To U.S. Residents:This publication has been approved by RBC Capital Markets, LLC (member FINRA, NYSE, SIPC), which is a U.S. registered broker-dealer and which acceptsresponsibility for this report and its dissemination in the United States. Any U.S. recipient of this report that is not a registered broker-dealer or a bank acting ina broker or dealer capacity and that wishes further information regarding, or to effect any transaction in, any of the securities discussed in this report, shouldcontact and place orders with RBC Capital Markets, LLC.To Canadian Residents:This publication has been approved by RBC Dominion Securities Inc.(member IIROC). Any Canadian recipient of this report that is not a Designated Institution inOntario, an Accredited Investor in British Columbia or Alberta or a Sophisticated Purchaser in Quebec (or similar permitted purchaser in any other province) andthat wishes further information regarding, or to effect any transaction in, any of the securities discussed in this report should contact and place orders with RBCDominion Securities Inc., which, without in any way limiting the foregoing, accepts responsibility for this report and its dissemination in Canada.To U.K. Residents:This publication has been approved by RBC Europe Limited ('RBCEL') which is authorized by the Prudential Regulation Authority and regulated by the FinancialConduct Authority ('FCA') and the Prudential Regulation Authority, in connection with its distribution in the United Kingdom. This material is not for generaldistribution in the United Kingdom to retail clients, as defined under the rules of the FCA. However, targeted distribution may be made to selected retail clients ofRBC and its affiliates. RBCEL accepts responsibility for this report and its dissemination in the United Kingdom.To Persons Receiving This Advice in Australia:This material has been distributed in Australia by Royal Bank of Canada - Sydney Branch (ABN 86 076 940 880, AFSL No. 246521). This material has been preparedfor general circulation and does not take into account the objectives, financial situation or needs of any recipient. Accordingly, any recipient should, before acting onthis material, consider the appropriateness of this material having regard to their objectives, financial situation and needs. If this material relates to the acquisitionor possible acquisition of a particular financial product, a recipient in Australia should obtain any relevant disclosure document prepared in respect of that productand consider that document before making any decision about whether to acquire the product. This research report is not for retail investors as defined in section761G of the Corporations Act.To Hong Kong Residents:This publication is distributed in Hong Kong by RBC Capital Markets (Hong Kong) Limited and Royal Bank of Canada, Hong Kong Branch (both entities which areregulated by the Hong Kong Monetary Authority ('HKMA') and the Securities and Futures Commission ('SFC')). Financial Services provided to Australia: Financialservices may be provided in Australia in accordance with applicable law. Financial services provided by the Royal Bank of Canada, Hong Kong Branch are providedpursuant to the Royal Bank of Canada's Australian Financial Services Licence ('AFSL') (No. 246521). RBC Capital Markets (Hong Kong) Limited is exempt from therequirement to hold an AFSL under the Corporations Act 2001 in respect of the provision of such financial services. RBC Capital Markets (Hong Kong) Limited isregulated by the HKMA and the SFC under the laws of Hong Kong, which differ from Australian laws.To Singapore Residents:This publication is distributed in Singapore by the Royal Bank of Canada, Singapore Branch, a registered entity granted offshore bank licence by the MonetaryAuthority of Singapore. This material has been prepared for general circulation and does not take into account the objectives, financial situation, or needs of anyrecipient. You are advised to seek independent advice from a financial adviser before purchasing any product. If you do not obtain independent advice, you shouldconsider whether the product is suitable for you. Past performance is not indicative of future performance. If you have any questions related to this publication,please contact the Royal Bank of Canada, Singapore Branch. Royal Bank of Canada, Singapore Branch accepts responsibility for this report and its disseminationin Singapore.To Japanese Residents:Unless otherwise exempted by Japanese law, this publication is distributed in Japan by or through RBC Capital Markets (Japan) Ltd., a registered type one financialinstruments firm and/or Royal Bank of Canada, Tokyo Branch, a licensed foreign bank.
.® Registered trademark of Royal Bank of Canada. RBC Capital Markets is a trademark of Royal Bank of Canada. Used under license.Copyright © RBC Capital Markets, LLC 2015 - Member SIPC
Copyright © RBC Dominion Securities Inc. 2015 - Member CIPFCopyright © RBC Europe Limited 2015
Copyright © Royal Bank of Canada 2015All rights reserved
The Charles Schwab CorporationBrokers, Asset Managers & Exchanges
March 26, 2015 Bulent Ozcan, CFA (212) 863-4818; [email protected] 50