Embed Size (px)
Citation preview

The
e Scienand
ence ofnd OW
Rhod
of SettWTS: A
Augu
e Island DeDivis
OnProvi
www
ting BA Liter
ust 8, 2
epartment osion of Planne Capitol Hdence, RI 0
w.planning.r
Buffersrature2014
of Administnning Hill 02908
ri.gov
rs for We Revi
tration
Wetlaiew
ands
Legislative Task Force Literature Review: 8.08.14
2 | D i v i s i o n o f P l a n n i n g
Acknowledgements This review was done by a team of readers made up of Legislative Task Force members and agency staff. The compilation of summaries by all of the readers and master editing was completed by Nancy Hess, Supervising Land Use Planner of the Division of Planning. Thanks go to the following:
Task Force Members:
• James Boyd, Coastal Resources Management Council • Russell Chateauneuf, Civil Engineering Representative • Lorraine Joubert, Environmental Entity – URI NEMO • Thomas Kutcher, Wetlands Biologist, Save the Bay
Department of Environmental Management:
• Carol Murphy, Principal Environmental Scientist
Division of Planning:
• Nancy Hess, Supervising Land use Planner
Legislative Task Force Literature Review: 8.08.14
3 | D i v i s i o n o f P l a n n i n g
Overview of Literature Reviews What is a literature review?
A literature review discusses published information in a particular subject area, and sometimes information in a particular subject area within a certain time period. A literature review can be just a simple summary of the sources, but it usually has an organizational pattern and combines both summary and synthesis. A summary is a recap of the important information of the source, but a synthesis is a re-organization, or a reshuffling, of that information. It might give a new interpretation of old material or combine new with old interpretations. Or it might trace the intellectual progression of the field, including major debates. And depending on the situation, the literature review may evaluate the sources and advise the reader on the most pertinent or relevant.
How is a literature review different from an academic research paper?
The main focus of an academic research paper is to develop a new argument, and a research paper will contain a literature review as one of its parts. In a research paper, you use the literature as a foundation and as support for a new insight that you contribute. The focus of a literature review, however, is to summarize and synthesize the arguments and ideas of others without adding new contributions.
Why do we do literature reviews?
Literature reviews provide you with a handy guide to a particular topic. If you have limited time to conduct research, literature reviews can give you an overview or act as a stepping stone. For professionals, they are useful reports that keep them up to date with what is current in the field. For scholars, the depth and breadth of the literature review emphasizes the credibility of the writer in his or her field. Literature reviews also provide a solid background for a research paper’s investigation. Comprehensive knowledge of the literature of the field is essential to most research papers.
Who writes these things, anyway?
Literature reviews are written occasionally in the humanities, but mostly in the sciences and social sciences; in experiment and lab reports, they constitute a section of the paper. Sometimes a literature review is written as a paper in itself.
Selections typically based on: 1. Relevance of published studies to topic 2. Organization 3. Current study, rationale and contribution to field of knowledge on topic 4. Clarity of writing and interpretation of literature 5. Bibliographic format w/ multiple documents reviewed.
.
Legislative Task Force Literature Review: 8.08.14
4 | D i v i s i o n o f P l a n n i n g
Wetlands Introduction The following summaries address selected wetland buffers and onsite wastewater treatment systems (OWTS) literature/ reports reviewed for:
• New England relevance(other than RI) • timeliness; issued since year 2000 • general wetland setback references • Rhode Island specific summaries • the State of Washington.
Brief summaries of each report are provided but are not a substitute for reading the complete paper. All findings and recommendations are those of the cited authors. Major points are highlighted in bold text. Wetland Readers were: Task Force members James Boyd, Coastal Resources Management Council, and Thomas Kutcher, Wetlands Biologist, Save the Bay, with staff assistance from DEM, Principal Environmental Scientist, Carol Murphy, and DOP, Supervising Land Use Planner, Nancy Hess. Wetland Buffer Reports – New England (other than RI) Berkshire Regional Planning Comm. 2003, The Massachusetts Buffer Manual: Using Vegetated Buffers to Protect Our Lakes and Rivers. Massachusetts Department of Environmental Protection. Appendix A.111pp. Summary: The objective of this manual is for waterfront land owners to understand the importance of vegetated buffers for the protection of water quality, providing wildlife refuge, and for maintenance of their property values. A vegetated buffer is a protective area between water bodies and human activity, such as development or agriculture. The manual describes for readers:
- How buffers capture pollution via chemical, physical, and biological processes; - How shoreline buffers are transition areas where aquatic and terrestrial environments meet, and therefore
where they support a great diversity of wildlife; - That shoreline buffers serve as wildlife travel corridors and food sources, and they shade and cool water
temperatures; and - That vegetated buffers provide homeowner benefits by flood and property protection, protection of
shoreline banks from erosion, increased privacy, and increased property values.
The manual also includes examples of how buffers may be improved and planted to protect a water body and to provide benefits for the property owner. “In general, the wider the buffer and the more complex the vegetation within it, the more effective it is in meeting those purposes.” Appendix A provides a technical description of how buffers work to protect water quality, benefit wildlife, dissipate floodwaters, and stabilize banks.
a. Vegetation layers create a barrier to surface water movement by absorbing the impact of rainfall, the forest floor acts as a sponge, and trunks and stems slow runoff velocity.
b. Vegetated buffers capture and remove sediment and nutrients in runoff over ground, thereby lowering the loads that get to the water. This is a function of the precipitation rates and the buffer width, slope, and soil type.
c. Buffers zones also capture nutrients underground as water travels through the soil, by way of plant root uptake and use by microorganisms.
d. Buffer zones along the shore directly protect aquatic species by shading and cooling waters. Runoff water gets heated and can change a cold water stream and can stress microbes, insects and fish. Temperature increases alter biological and chemical processes unfavorably.
e. Waterfront buffer areas are well used by wildlife, because they are an intersection of aquatic and terrestrial habitat. Rare species rely on these transition zones.
f. Vegetated buffer zones can break the force of floodwaters that overflow banks, and thereby protect structures and property from damage. Tree and plant roots hold soil together and stabilize banks from impacts from waves, ice, and wakes.
Legislative Task Force Literature Review: 8.08.14
5 | D i v i s i o n o f P l a n n i n g
Boyd, L. 2001, Buffer zones and beyond: wildlife use of wetland buffer zones and their protection under the MA Wetland Protection Act. University of Massachusetts. 33 pp. and Appendices. Summary: This report focuses on upland buffer zones adjacent to wetlands and water bodies and their importance for wetland wildlife habitat. Buffer zones are essential habitat for 65 species of Massachusetts freshwater wetland-dependent wildlife. Of the 65 species, 50 use from the wetland edge to 100 feet; 38 use to 200 feet; and 34 use from the edge to beyond 200 feet. Ninety percent (90%) of Massachusetts wetland-dependent reptiles, 96 percent of amphibians, 100 percent of mammals, and 55 percent of wetland-dependent birds have upland requirements. The importance of buffers zones to wildlife is well documented. The report discusses the regulation and adequacy of the 100 foot wetland buffer zone as compared with the 200 foot riverfront area in Massachusetts (General Law, Chap. 131, Sect. 40). The report concludes that the need for buffer protection is understood; however, an appropriate distance is difficult to define. It acknowledges a need to establish more than a 100-foot buffer, because of the number of wetland species that rely on the area greater than 100 and 200 feet from wetland edges. Chase, V., L. Deming, F. Latawiec. 1997, Buffers for wetlands and surface waters: A guidebook for New Hampshire Municipalities. Audubon Society of New Hampshire. 80 pp. Summary: This guidance manual was developed to assist local officials by providing the science behind the importance of buffer protection. A buffer zone is described as a naturally vegetated area adjacent to a wetland or surface water. The manual recognizes that buffer zones reduce adverse effects of human activity, protect water quality in wetlands and surface waters, protect and provide wildlife habitat, reduce disturbances from dumping, noise, pets, and lights, and help to maintain recreational values and aesthetic diversity. The manual provides a thorough discussion of how buffers work, and it describes landscape and site-specific factors that influence a buffer’s effectiveness for habitat, including, land uses, edge effects, vegetation type, and width. Soils, topography, vegetation, land uses, season, and buffer width influence a buffer’s effectiveness for water quality protection. The manual’s authors and working group recommended that 100 feet is generally a minimum required buffer width for water quality purposes. A 100-foot buffer provides some habitat needs for some species. Table 4.2.2 provides examples of what 100 feet provides and what it does not provide for named wildlife species or groups. For example, for area-sensitive forest birds, 100 feet provides some foraging and nesting habitat, but not sufficient breeding habitat. The manual provides recommendations for when more than a minimum 100 foot width may be appropriate for species-specific needs, at water supply resources, at wetlands that provide rare habitat, at sensitive wetlands (such as bogs, fens, Atlantic white cedar swamps), at travel corridors, and at designated wetlands, as well as some situations where 100 feet may not be needed, such as adjacent to human-made wetlands. Murphy, B.D., Position statement. “Utilization of 100 foot buffer zone to protection of riparian areas in Connecticut”. Inland Fisheries Divisions, CT, Undated. Summary: This paper briefly summarizes a literature review completed by a State of Connecticut fishery biologist regarding the utility of a minimum 100-foot buffer zone at perennial streams to protect the stream and the riparian corridor. The paper discusses the benefits and limitations of implementing standard (fixed) width buffer zones versus site-specific (floating) buffer methods. Standard methods are easier to implement, while site-specific buffer methods are tailored to the resource and are not arbitrary, however, they are more time consuming to develop and to implement. A discussion is presented about six riparian buffer functions: sediment control, nutrient removal, temperature control, source of woody debris, food supply for aquatic organisms, and stream flow maintenance.
Legislative Task Force Literature Review: 8.08.14
6 | D i v i s i o n o f P l a n n i n g
• A 100 foot riparian buffer will assist with sediment control and nutrient removal; however, the effectiveness will vary according to site conditions and may not result in complete removal.
• A buffer width more than 80 feet is needed for stream temperature maintenance. • The literature supports a 100-foot buffer zone as a source of large woody debris to streams. • Buffer widths less than 100 feet were not adequately protective of stream invertebrate populations
because of sediment in the streams. Buffers greater than 100 feet were equivalent to unclogged streams.
• The literature documented the importance of riparian buffer zones to stream flow maintenance, especially riparian wetland areas; however, studies on specific buffer widths were not found.
Vermont Agency of Natural Resources. 2005, Riparian Buffers and Corridors Technical Papers Waterbury, Vermont. 39 pp. Summary: These papers provide thorough explanations of water quality, habitat, and channel stability functions of riparian areas, based on reviews of scientific literature on the effectiveness of riparian buffers and their widths. The word riparian means of or pertaining to the bank of a river or lake. The papers describe how riparian buffers work to provide these important functions.
- Riparian buffers protect the quality of the water they border by regulating water temperature by shading and by infiltrating surface runoff. Storing overland runoff moderates stream flows and base flows in low flow months. Riparian buffers trap sediment and nutrients, and vegetation roots stabilize riparian shorelines.
- The technical papers describe how riparian buffers maintain the quality of aquatic habitat by: “ Protecting water quality and quantity; providing food supply; providing woody debris; maintaining lakeshore, stream channel and floodplain stability; and maintaining adjacent wetlands.” Riparian terrestrial habitat is important to amphibians, reptiles, birds, and mammals, including species threatened or endangered in Vermont.
- “Riparian areas provide for channel stability via: flood attenuation, reduced effects of storm events, bank and shoreline stabilization, ice damage control, and maintenance of sediment transport and channel morphology.”
Borrowing from Chase et al. (1995) the Vermont report provides tables of buffer widths for 1) riparian functions (the averages of the ranges are from 37 feet to 225 feet) and 2) for wildlife (from 10 feet to 840 which is “the average distance a blue-winged teal nests from water”). Also included is a table of what a 100-foot riparian buffer provides for wildlife habitat and what it does not provide (Chase et al. 1995). Calhoun, A.J.K. and M. Klemens. 2002. Best Development Practices: Conserving Pool-breeding Amphibians in Residential and Commercial Developments in the Northeastern United States. MCA Technical paper No. 5. Metropolitan Cons. Alliance, Wildlife Conservation Society, Bronx, New York. Summary: This publication presents an approach to ensure vernal pool protection via a multi-step model, including identification and mapping, biological assessment, and conservation planning. Based on the wetland and upland habitat needs of obligate vernal pool wildlife, the paper defines three vernal pool management zones: 1) the vernal pool depression; 2) the vernal pool envelope which is the upland area that is 100 feet around the pool depression; and 3) the critical terrestrial habitat, which is that area within 100 feet to 750 feet around the pool’s edge. The paper discusses the importance of each management zone, and it presents practical development practices applicable to ensure protection of vernal pool water quality and amphibian populations. No disturbance is recommended within the vernal pool depression itself; best development practices are recommended within the 100-foot envelope; and less than 25 % development (and best practices)are recommended within the 750-foot critical terrestrial habitat. Figures 4 and 9 graphically depict the migration distances of New England vernal pool amphibians and the defined management areas.
Legislative
7 | D i v
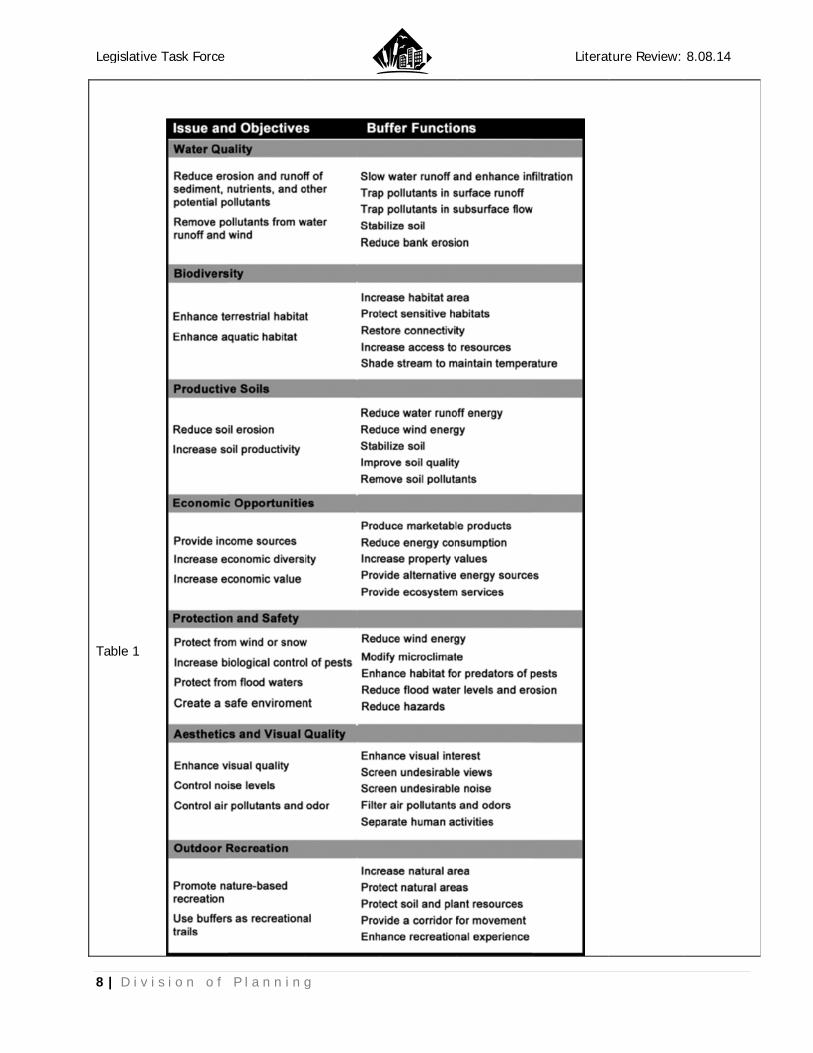
WetlandBentrup, Rep. SRS-SummaryThis reporis not a sclaim it isan abundaand is notrelevant in
• B• B• W• B• N• B
m• B
an• G• C
Figure 5
e Task Force
i s i o n o f
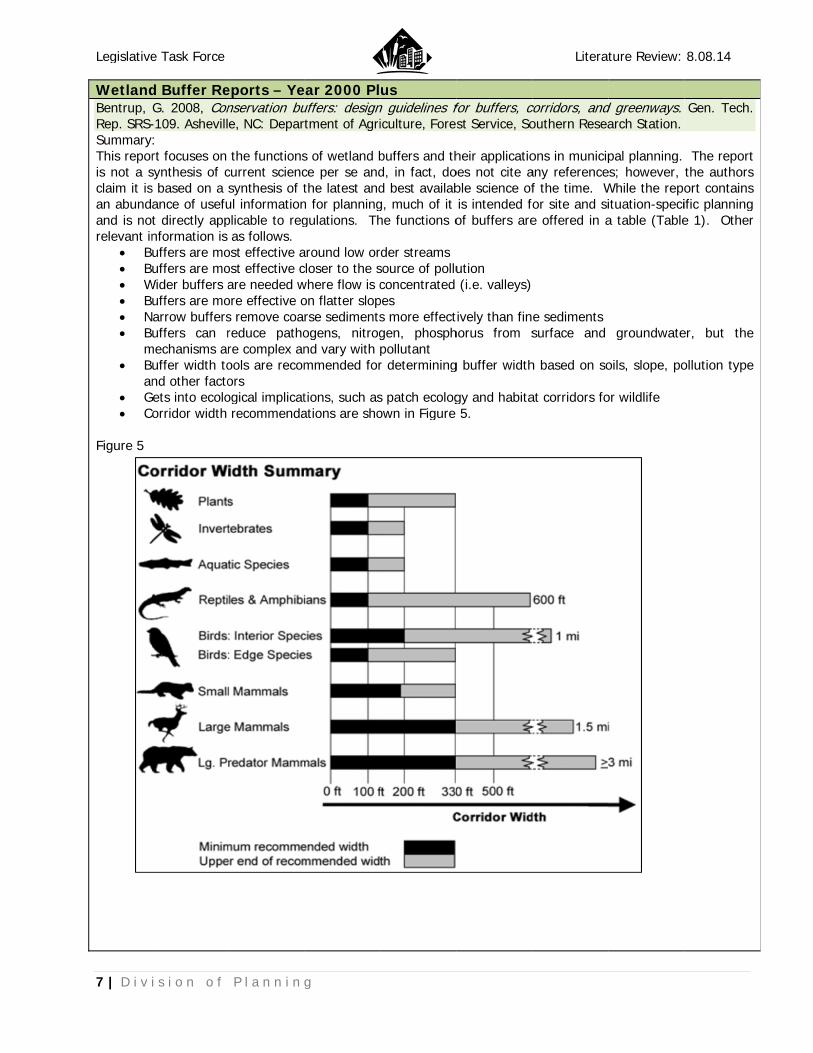
d Buffer ReG. 2008, Con-109. Ashevill: rt focuses on synthesis of cs based on a ance of usefut directly appnformation is uffers are mouffers are mo
Wider buffers auffers are moarrow buffersuffers can r
mechanisms aruffer width tond other factoets into ecoloorridor width
P l a n n i n
eports – Yenservation bue, NC: Depar
the functionscurrent sciencsynthesis of tul informationplicable to regas follows.
ost effective aost effective care needed wore effective os remove coareduce pathore complex anools are recomors ogical implicatrecommenda
g
ear 2000 Pluffers: designrtment of Agri
s of wetland bce per se andthe latest andn for planninggulations. Th
around low orcloser to the swhere flow is con flatter sloprse sedimentsogens, nitrognd vary with mmended for
tions, such asations are sho
us n guidelines ficulture, Fore
buffers and thd, in fact, dod best availabg, much of it he functions o
rder streamssource of polluconcentrated
pes s more effectgen, phosphpollutant r determining
s patch ecologown in Figure
for buffers, cost Service, So
heir applicatiooes not cite able science ofis intended foof buffers are
ution (i.e. valleys)
tively than finhorus from s
g buffer width
gy and habita5.
Literat
corridors, andouthern Resea
ons in municipany referencef the time. Wfor site and sie offered in a
e sediments surface and
h based on so
at corridors fo
ture Review:
d greenways.arch Station.
pal planning. es; however, While the repoituation-specia table (Table
groundwate
oils, slope, po
or wildlife
8.08.14
Gen. Tech.
The report the authors ort contains ific planning e 1). Other
er, but the
ollution type
Legislative
8 | D i v
Table 1
e Task Force
i s i o n o f
P l a n n i n g
Literatture Review: 8.08.14
Legislative Task Force Literature Review: 8.08.14
9 | D i v i s i o n o f P l a n n i n g
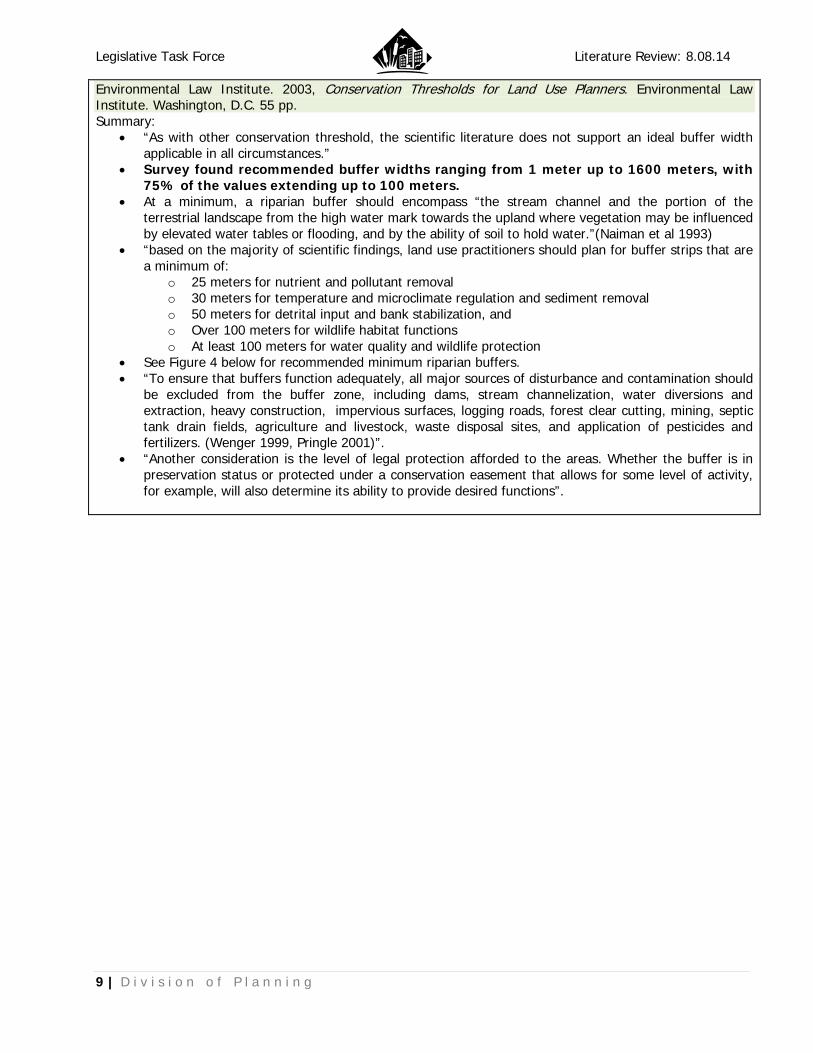
Environmental Law Institute. 2003, Conservation Thresholds for Land Use Planners. Environmental Law Institute. Washington, D.C. 55 pp. Summary:
• “As with other conservation threshold, the scientific literature does not support an ideal buffer width applicable in all circumstances.”
• Survey found recommended buffer widths ranging from 1 meter up to 1600 meters, with 75% of the values extending up to 100 meters.
• At a minimum, a riparian buffer should encompass “the stream channel and the portion of the terrestrial landscape from the high water mark towards the upland where vegetation may be influenced by elevated water tables or flooding, and by the ability of soil to hold water.”(Naiman et al 1993)
• “based on the majority of scientific findings, land use practitioners should plan for buffer strips that are a minimum of:
o 25 meters for nutrient and pollutant removal o 30 meters for temperature and microclimate regulation and sediment removal o 50 meters for detrital input and bank stabilization, and o Over 100 meters for wildlife habitat functions o At least 100 meters for water quality and wildlife protection
• See Figure 4 below for recommended minimum riparian buffers. • “To ensure that buffers function adequately, all major sources of disturbance and contamination should
be excluded from the buffer zone, including dams, stream channelization, water diversions and extraction, heavy construction, impervious surfaces, logging roads, forest clear cutting, mining, septic tank drain fields, agriculture and livestock, waste disposal sites, and application of pesticides and fertilizers. (Wenger 1999, Pringle 2001)”.
• “Another consideration is the level of legal protection afforded to the areas. Whether the buffer is in preservation status or protected under a conservation easement that allows for some level of activity, for example, will also determine its ability to provide desired functions”.
Legislative
10 | D i v
e Task Force
v i s i o n o f
f P l a n n i nn g
Literatture Review: 8.08.14
Figure 4
Legislative Task Force Literature Review: 8.08.14
11 | D i v i s i o n o f P l a n n i n g
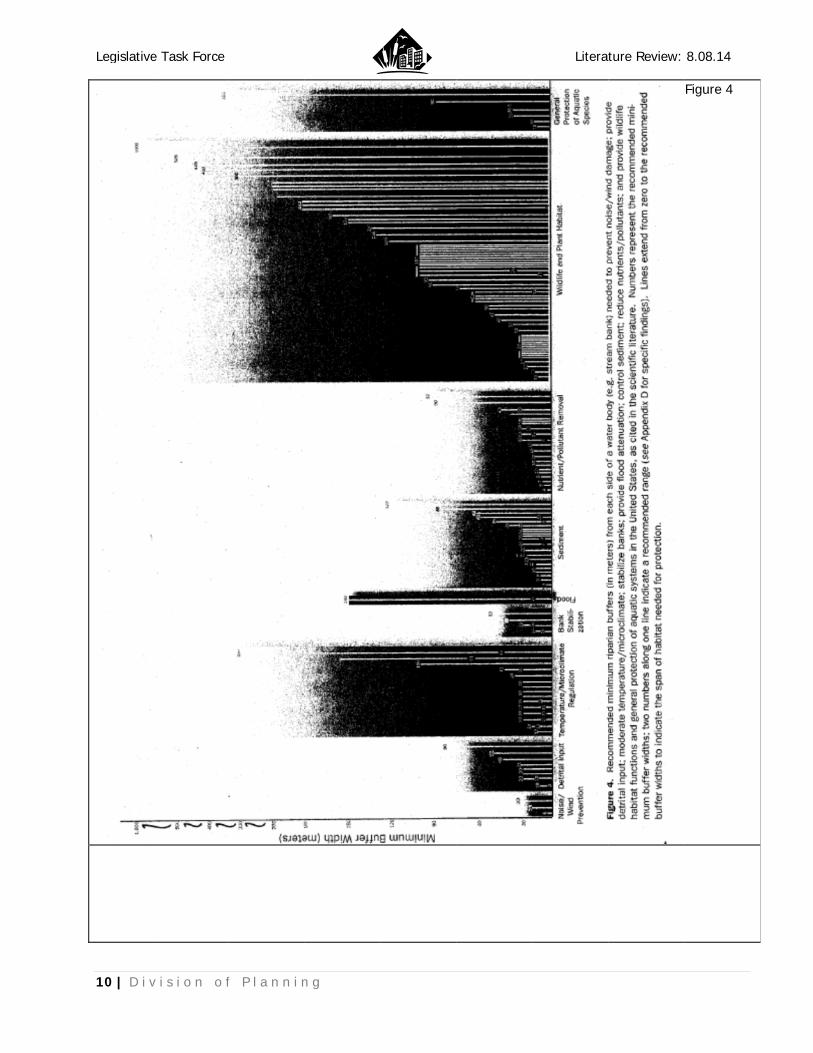
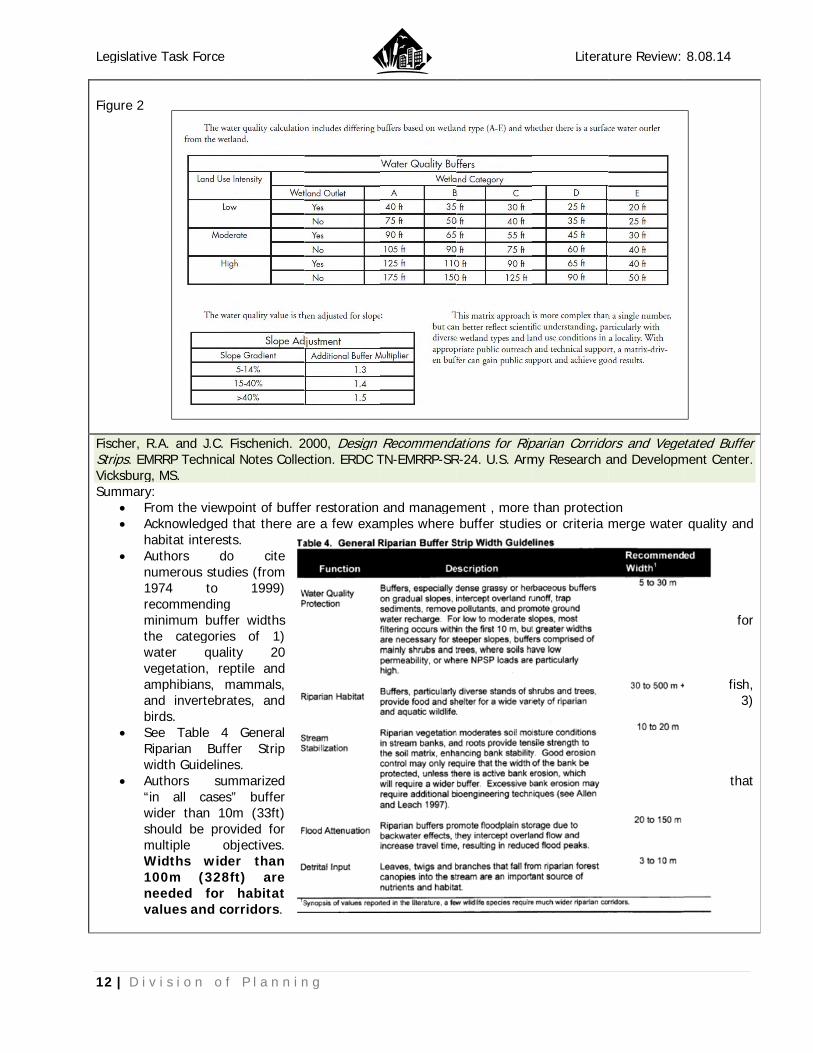
Environmental Law Institute. 2008, Planner’s Guide to Wetland Buffers for Local Governments. Environmental Law Institute. Washington, D.C. 29 pp. Summary: This report investigates municipal ordinances addressing wetlands buffers and the underlying science, under the assumption and assertion that local governments are better suited to authorize wetland buffer regulations than state or federal agencies. The authors reason that local governments are more concerned with broader implications of wetland regulation for their communities. While much of the report covers the elements of local ordinances, many points are relative to the Task Force. The report is based on 50 wetland buffer ordinances and “several hundred” scientific studies, although only 48 papers were cited. Scientific review of buffer literature was conducted and summarized as below. Refer to Figure 1 for the numbers. Figure 1
• Water Quality is affected not just width of buffer, but also by flow pattern, vegetation type, percent slope, soil type, surrounding land use, pollutant type, and precipitation patterns. Buffer width effectiveness is therefore highly variable. For consistent protection, wider buffers are necessary.
• Wildlife Habitat is also affected by buffer width, but is highly variable by species. Upland area surrounding wetlands is considered core habitat for wetland-dependent amphibians and reptiles.
• Outlines some approaches to setting buffer widths including o Fixed non-disturbance width o Non-disturbance width plus additional regulated area of scrutiny o Non-disturbance width plus setback o Matrix based (see Figure 2).
Legislative
12 | D i v
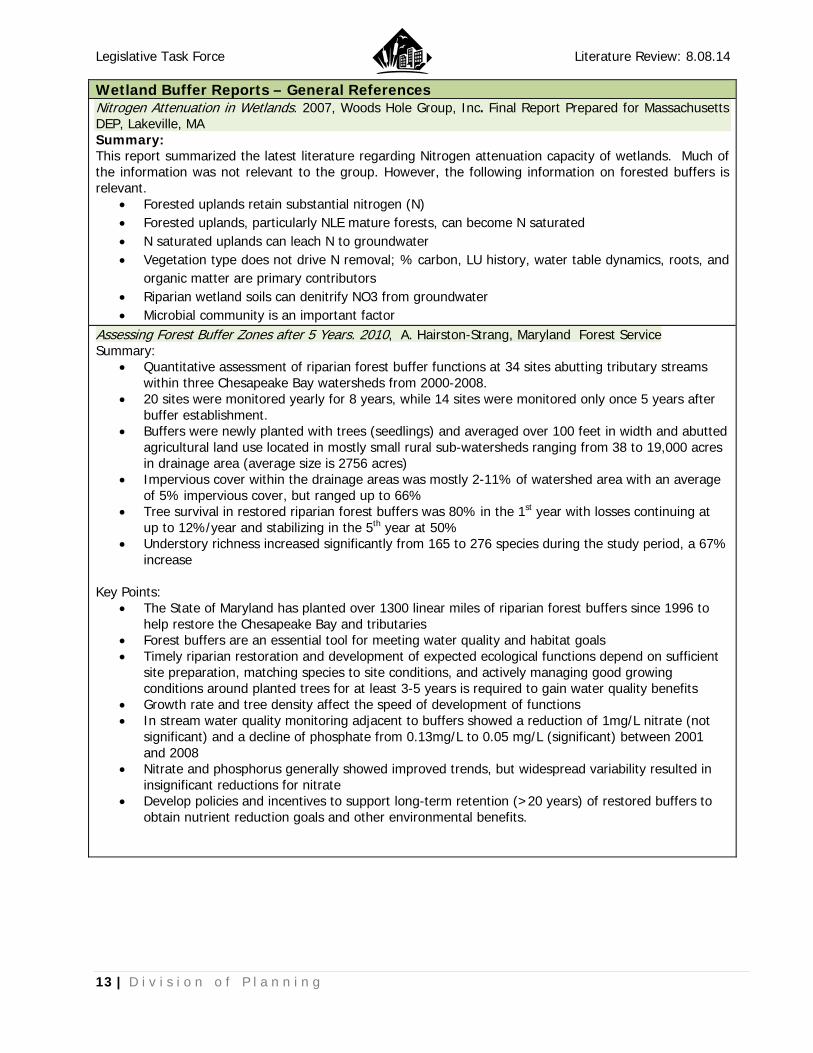
Figure 2 Fischer, RStrips. EMVicksburg,Summary
• Fr• A
ha• A
nu19remthwveamanbi
• SeRw
• A“iwshmW1nva
e Task Force
v i s i o n o f
R.A. and J.C. MRRP Technica, MS. : rom the viewcknowledged abitat interesuthors doumerous stud974 to ecommending
minimum buffhe categorie
water qualegetation, remphibians, mnd invertebrairds. ee Table 4
Riparian Buffwidth Guidelineuthors sun all cases
wider than 10hould be pro
multiple oWidths wid
00m (328eeded for alues and co
f P l a n n i n
Fischenich. 2al Notes Colle
point of buffethat there a
ts. o cite dies (from
1999) g fer widths es of 1) ity 20
eptile and mammals, ates, and
General fer Strip es. mmarized s” buffer 0m (33ft) ovided for objectives. er than
8ft) are habitat
orridors.
n g
2000, Design ction. ERDC T
er restoration re a few exam
RecommendaTN-EMRRP-SR
and managemples where
dations for RipR-24. U.S. Arm
ment , more buffer studie
Literat
parian Corridomy Research a
than protecties or criteria
ture Review:
ors and Vegetand Developm
on merge water
8.08.14
etated Buffer ment Center.
quality and
for
fish, 3)
that
Legislative Task Force Literature Review: 8.08.14
13 | D i v i s i o n o f P l a n n i n g
Wetland Buffer Reports – General References Nitrogen Attenuation in Wetlands. 2007, Woods Hole Group, Inc. Final Report Prepared for Massachusetts DEP, Lakeville, MA Summary: This report summarized the latest literature regarding Nitrogen attenuation capacity of wetlands. Much of the information was not relevant to the group. However, the following information on forested buffers is relevant.
• Forested uplands retain substantial nitrogen (N) • Forested uplands, particularly NLE mature forests, can become N saturated • N saturated uplands can leach N to groundwater • Vegetation type does not drive N removal; % carbon, LU history, water table dynamics, roots, and
organic matter are primary contributors • Riparian wetland soils can denitrify NO3 from groundwater • Microbial community is an important factor
Assessing Forest Buffer Zones after 5 Years. 2010, A. Hairston-Strang, Maryland Forest Service Summary:
• Quantitative assessment of riparian forest buffer functions at 34 sites abutting tributary streams within three Chesapeake Bay watersheds from 2000-2008.
• 20 sites were monitored yearly for 8 years, while 14 sites were monitored only once 5 years after buffer establishment.
• Buffers were newly planted with trees (seedlings) and averaged over 100 feet in width and abutted agricultural land use located in mostly small rural sub-watersheds ranging from 38 to 19,000 acres in drainage area (average size is 2756 acres)
• Impervious cover within the drainage areas was mostly 2-11% of watershed area with an average of 5% impervious cover, but ranged up to 66%
• Tree survival in restored riparian forest buffers was 80% in the 1st year with losses continuing at up to 12%/year and stabilizing in the 5th year at 50%
• Understory richness increased significantly from 165 to 276 species during the study period, a 67% increase
Key Points:
• The State of Maryland has planted over 1300 linear miles of riparian forest buffers since 1996 to help restore the Chesapeake Bay and tributaries
• Forest buffers are an essential tool for meeting water quality and habitat goals • Timely riparian restoration and development of expected ecological functions depend on sufficient
site preparation, matching species to site conditions, and actively managing good growing conditions around planted trees for at least 3-5 years is required to gain water quality benefits
• Growth rate and tree density affect the speed of development of functions • In stream water quality monitoring adjacent to buffers showed a reduction of 1mg/L nitrate (not
significant) and a decline of phosphate from 0.13mg/L to 0.05 mg/L (significant) between 2001 and 2008
• Nitrate and phosphorus generally showed improved trends, but widespread variability resulted in insignificant reductions for nitrate
• Develop policies and incentives to support long-term retention (>20 years) of restored buffers to obtain nutrient reduction goals and other environmental benefits.
Legislative Task Force Literature Review: 8.08.14
14 | D i v i s i o n o f P l a n n i n g
Wetland Buffer Reports – Rhode Island Specific Summaries Desbonnet, A., P. Pogue, V. Lee, and N. Wolff. 1994, Vegetated buffers in the coastal zone - A summary review and bibliography. Coastal Resources Center Technical Report No. 2064. University of Rhode Island Graduate School of Oceanography. Narragansett, RI. Summary: This report provides a synthesis of the literature about vegetated buffers in the coastal zone. It provides sample definitions of buffer zones and discusses the importance of vegetated buffers for many public benefits, including nonpoint source pollution removal and control, erosion and flood control, scenic and aesthetic values, and for wildlife habitat protection. The authors compiled minimum buffer widths to protect wildlife habitat ranging from 15 to 200 meters. They found it difficult to define a best fit vegetated buffer width for general habitat value, and found that many studies relied on species specific needs, especially of rare species. Factors that influence the effectiveness of a buffer for habitat are its width, vegetation type, proximity to other habitats and to predators, noise levels, etc. The report summarizes general wildlife habitat as fair to good with a 75 meter buffer width, good at 100 meters, and excellent at 200 to 600 meters. The authors discuss four approaches for implementation of multipurpose vegetated buffers: fixed-width buffers, fixed-tiered buffer zones, minimum widths based on the size of the property, and based on site-specific characteristics. An ideal buffer for multiple uses is nearly level and has a diversity of native vegetation. Groffman, P., A. Gold, T. Husband, R. Simmons, and W. Eddleman. 1991, An investigation into multiple uses of vegetated buffer strips. Narragansett Bay Project Report No. NBP-91-63. Summary: The goal of this study was to provide Rhode Island-specific information on the ability of land areas to serve as buffers for water quality protection and for wildlife habitat, based on a site’s soils, vegetation, geomorphology, and land uses. The site-specific water quality studies measured pollutant removal effectiveness for above ground and below ground flows through buffers to red maple swamps. The study also developed a microbial index of pollutant removal effectiveness. The wildlife studies determined species richness of birds, reptiles, and amphibians in red maple swamps and developed a model to describe the buffer requirements for protection of wetland-dependent wildlife in Rhode Island. Buffer zones are important sites for foraging, corridors for dispersal, areas to escape from flooding, sites for hibernation, areas for breeding and nesting, areas of low predation, and areas that buffers land disturbances from outside the wetland. The buffer model was based on 1) habitat suitability; 2) wildlife spatial requirements; 3) access to upland habitats; and 4) noise impacts. The report describes that, if the habitat suitability guidelines are not met, the buffer should be restored.
- The minimum recommended buffer is 100 meters (328 feet) if there are threatened / endangered species or neotropical migrant birds.
- The minimum recommended buffer is 15 meters (49 feet) for access to upland nesting sites for turtles. - The minimum wetland buffer required if amphibians or small mammals are present was undetermined. - The minimum buffer requirements for noise attenuation range from 13 to 85 meters (43 to 279
feet).
Legislative
15 | D i v
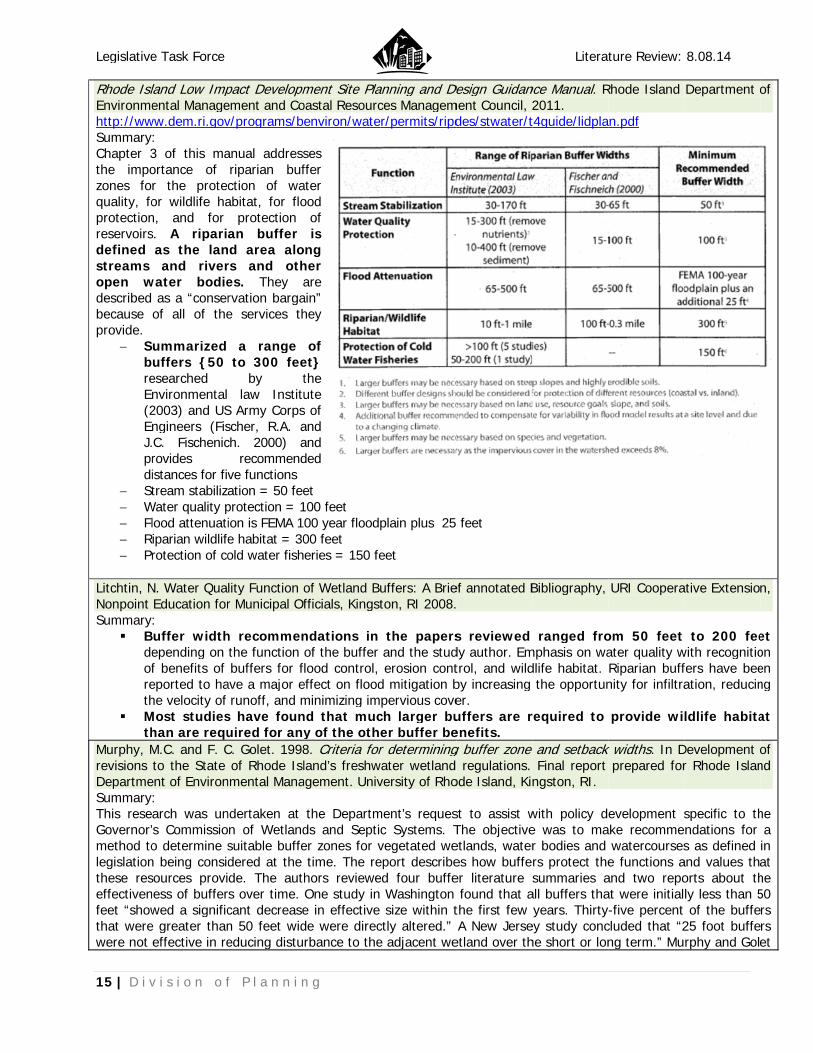
Rhode IslEnvironmehttp://wwSummaryChapter 3the impozones foquality, foprotectionreservoirsdefined streams open wdescribed because provide.
− SbreE(2EJ.prdi
− St− W− Fl− R− Pr
Litchtin, NNonpoint Summary
Bdeofreth
Mth
Murphy, Mrevisions DepartmeSummaryThis reseGovernor’method tolegislationthese reseffectivenfeet “showthat werewere not
e Task Force
v i s i o n o f
land Low Impental Manage
ww.dem.ri.gov: 3 of this maortance of r the protecor wildlife han, and for s. A ripariaas the lanand river
water bodieas a “conser
of all of the
ummarized uffers {50 esearched nvironmental 2003) and USngineers (FisC. Fischenicrovides istances for fivtream stabiliza
Water quality plood attenuati
Riparian wildliferotection of co
N. Water QuaEducation for:
Buffer widthepending on f benefits of eported to hahe velocity of
Most studieshan are requM.C. and F. Cto the State
ent of Environ: arch was un’s Commissioo determine sn being considsources proviness of bufferwed a significe greater thaneffective in re
f P l a n n i n
pact Developmement and Cov/programs/be
anual addressriparian bufction of waabitat, for flo
protection an buffer
nd area alors and othes. They arvation bargae services th
a range to 300 fee
by tlaw Institu
S Army Corpsscher, R.A. ach. 2000) a
recommendve functions ation = 50 feeprotection = 1ion is FEMA 1e habitat = 30old water fish
lity Function or Municipal Of
h recommenthe function buffers for f
ave a major erunoff, and m
s have founuired for anyC. Golet. 1998of Rhode Isl
nmental Mana
ndertaken at n of Wetlandsuitable buffedered at the de. The auths over time. cant decreasen 50 feet wideducing distu
n g
ment Site Plaoastal Resourcenviron/wate
ses ffer ater ood
of is
ng her are ain” hey
of et} the ute s of and and ded
et 100 feet 00 year flood00 feet eries = 150 fe
of Wetland Bufficials, Kingst
ndations in of the buffer lood control,
effect on floodminimizing imnd that mucy of the oth8. Criteria forland’s freshwgement. Univ
the Departmds and Septier zones for vtime. The re
hors revieweOne study ine in effective de were direcrbance to the
anning and Deces Managemr/permits/ripd
plain plus 25
eet
uffers: A Brieton, RI 2008.
the papersand the studerosion cont
d mitigation bpervious cove
ch larger buer buffer ber determining
water wetland versity of Rho
ment’s requesc Systems. Tvegetated weeport describeed four buffe
Washington size within t
ctly altered.” e adjacent we
Design Guidancment Council, 2des/stwater/t
feet
ef annotated B
s reviewed dy author. Emtrol, and wildby increasing er. uffers are renefits. g buffer zone regulations.
ode Island, Kin
st to assist wThe objectiveetlands, wateres how buffeer literature sfound that a
the first few A New Jerse
etland over th
Literat
nce Manual. R2011. t4guide/lidpla
Bibliography,
ranged fromphasis on wadlife habitat.
the opportun
required to
e and setback Final report
ngston, RI.
with policy dee was to mar bodies and rs protect thesummaries a
all buffers thayears. Thirty
ey study conche short or lon
ture Review:
Rhode Island
n.pdf
URI Coopera
om 50 feet ater quality wRiparian buffnity for infiltra
provide wi
k widths. In Dprepared for
evelopment ske recommewatercourses
e functions aand two repoat were initial-five percent
cluded that “2ng term.” Mu
8.08.14
Department o
ative Extensio
to 200 feewith recognitiofers have beeation, reducin
ldlife habita
Development or Rhode Islan
specific to thndations for s as defined
and values thaorts about thly less than 5of the buffe
25 foot bufferphy and Gole
of
n,
et on en ng
at
of nd
he a in at he 50 rs rs et
Legislative Task Force Literature Review: 8.08.14
16 | D i v i s i o n o f P l a n n i n g
also reviewed and summarized the RI coastal zone buffer program and buffer programs in other nearby states. The authors recommended a tiered approach to identify buffer zones and setbacks within a bordering jurisdictional land, based on the wetland types, their functions and values, and sensitivity to human disturbances. The buffer zone is the portion of the bordering land maintained in a natural, undisturbed condition. The setback is the minimum distance from the landward edge of freshwater wetland at which certain approved activities or alterations may take place. Working within the limitations of the bordering land distances, the method recommended and discussed the following buffer tiers:
- Tier 1 is a 150 foot buffer to perennial watercourses. - Tier 2 is a 100 foot buffer for permanent or semi-permanent flooded water bodies and vegetated wetlands,
bogs, and fens, natural heritage areas, and critical amphibian habitat. - Tier 3 is a 75 foot buffer for seasonal standing water bodies other than critical amphibian habitat and
intermittent water courses. - Tier 4 is a 50 buffer to seasonally saturated wetlands.
Palstrom, N. 1991. Vegetated Buffer Strip Designation Method Guidance Manual. IEP, Inc., Northborough, MA Summary: The objective of this manual is to provide guidance for identifying buffer widths for attenuation of pollutants from storm water runoff. While protection of wetland habitat is largely due to buffer widths, wildlife needs, and nearby land uses, water quality protection involves chemical, physical, and biological processes. The author developed a multi-step buffer model, including evaluation of “special conditions” for sensitive wetlands and high impact activities. The model identifies that:
A 300 foot buffer is required between a wetland and a commercial/ industrial facility with hazardous materials onsite.
A buffer consistent with the existing buffers of adjacent properties, but not less than 25 feet, should be maintained at residential infill areas.
Buffers with slopes greater than 15% or with less than 80% vegetative cover are not suitable for water quality protection, and other measure need to be incorporated.
Where wetlands are habitat for endangered or threatened species, the buffer should not be less than the buffer required to remove 85% suspended sediment.
Sensitive wetlands are defined as those in water supply watersheds, vernal pools, cedar swamps, scenic rivers, conservation lands and coastal ponds.
Rhode Island Rivers Council. 2005. Findings and recommendations: Establishment of riparian and shoreline buffers and the taxation of property included in buffers. A report to the Governor, Senate and House. Rhode Island Rivers Council. Providence, RI. Summary:
− Charged to make recommendations with respect to riparian buffers and taxation of property included as buffers. Riparian are along rivers, streams, open waters and coastal waters.
− Stated that preservation and restoration of natural riparian buffers is considered to be the single most important practice to protect water resources.
− Recommended that DEM investigate the NJ 300 foot buffer to high quality river segments and consider adopting regulations.

Legislative Task Force Literature Review: 8.08.14
17 | D i v i s i o n o f P l a n n i n g
Wetland Reports – Washington State Volume 1: A Synthesis of the Science (2005) @ http://www.ecy.wa.gov/programs/sea/wetlands/bas/vol1final/Cover_Table%20of%20Contents.pdf
Summary: Increases in nutrients may have the beneficial function of slowing flood flows by thickening of plant growth and increasing numbers of some invertebrate species but may also have many negative impacts including lowering water quality, changing the chemistry of bogs, and decreasing species richness, where fewer species dominate and invasives may thrive. Nutrient loads from agricultural applications have been studied and have shown impacts on amphibians, water-birds, and other wildlife. Update on Wetland Buffers: The State of the Science (October 2013), State of Washington, Department of Ecology, Publication #13-06-11. @ http://www.ecy.wa.gov/programs/sea/wetlands/bas/BufferUpdate.html @ https://fortress.wa.gov/ecy/publications/publications/1306011.pdf
Summary 1: − Effectiveness of a buffer on removal phosphorus depends on many factors including:
• Soil Type (sorbents, redox state, pH) • Degree of saturation on soil particles • Slope of the land • Type of plants present and how managed • Amount of phosphorus generated by the surroundings • Flow path of groundwater and its interaction with iron, aluminum oxides, or other
minerals that react with dissolved phosphorus − Removal of nitrogen in groundwater flowing through buffers does not appear to be related to buffer
width, while removal of nitrogen from surface water was only partially related to the width of the buffer. The reduction of nitrate in groundwater flowing through a buffer has been attributed to denitrification, uptake by vegetation as a function of its density, and immobilization by micro-organisms.
− The relative removal of nitrate in a buffer is reduced as the concentration of nitrate in the incoming water is increased. (In one study of 14 sites, nitrate removal dropped to 0% when the concentration of nitrate was above 20 mg/l.)
− Contrarily, modelling at the watershed scale supports the view that20m (66ft) is a sufficient buffer for nitrate removal. But other studies indicate that coarse soils in the buffer, the presence of seeps, and the specific site flow path are other factors that need to be taken into account.
Summary 2: This report is based on a national literature search using relevant keywords to identify the most up-to-date and best available science on wetland buffer functions. Main conclusions of the research are as follow. Pollutants
• The function of buffers in flood attenuation has still not been well-studied • Buffers protect water quality by infiltrating surface water • Buffers remove pollutants from groundwater via soil and root interactions • Buffers may become saturated with pollutants and lose effectiveness over time • Buffer width, slope, infiltration rate, rugosity, adjacent LU, vegetation type, vegetation density and
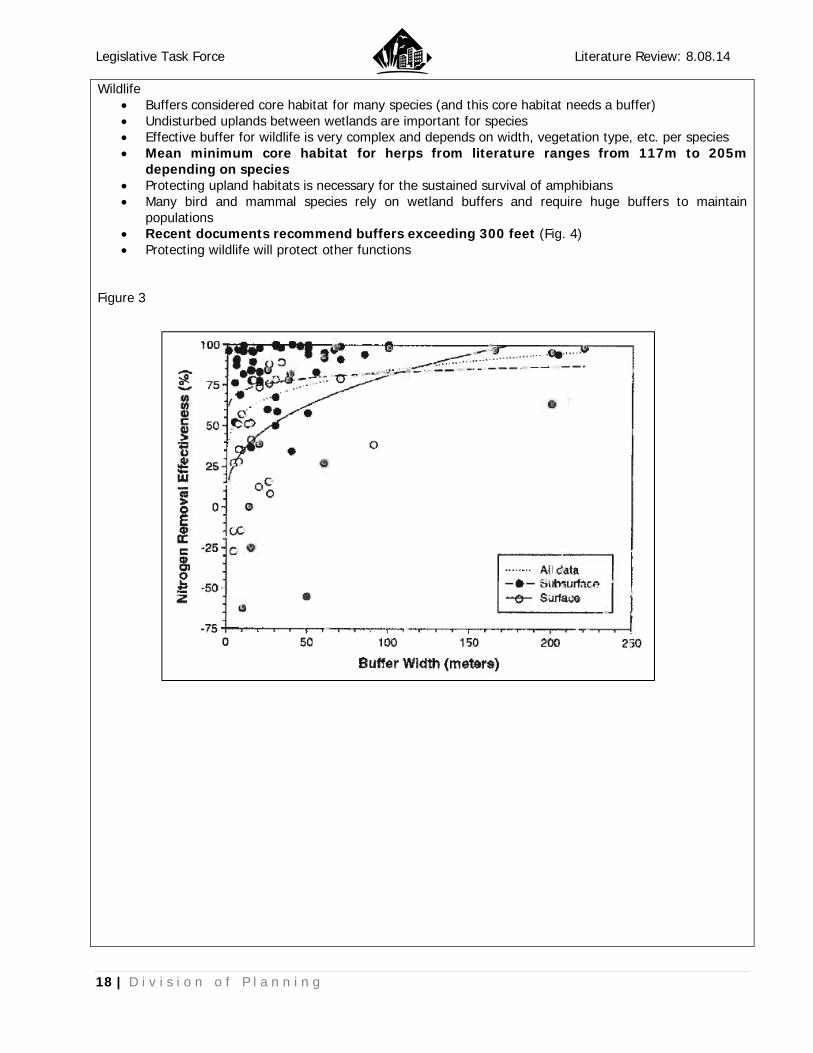
spacing, and flow convergence are all important characteristics for pollution removal • Coarse sediments may be removed by narrow buffers (16-66 feet) • Finer sediments are better removed by wider buffers (66 to 328 feet) • Trapping of sediments is tied to pollutant removal • Buffer width accounts for 35-60% of buffer effectiveness for water pollution • Wider buffers are more reliably effective (Fig. 3)
Legislative Task Force Literature Review: 8.08.14
18 | D i v i s i o n o f P l a n n i n g
Wildlife • Buffers considered core habitat for many species (and this core habitat needs a buffer) • Undisturbed uplands between wetlands are important for species • Effective buffer for wildlife is very complex and depends on width, vegetation type, etc. per species • Mean minimum core habitat for herps from literature ranges from 117m to 205m
depending on species • Protecting upland habitats is necessary for the sustained survival of amphibians • Many bird and mammal species rely on wetland buffers and require huge buffers to maintain
populations • Recent documents recommend buffers exceeding 300 feet (Fig. 4) • Protecting wildlife will protect other functions
Figure 3

Legislative Task Force Literature Review: 8.08.14
19 | D i v i s i o n o f P l a n n i n g
Figure 4
Appendix 8-C- Guidance on Widths of Buffers and Ratios for Compensatory Mitigation for Use with the Western Washington Wetland Rating System, Volume 2, Protecting & Managing Wetlands, Washington state, April 2005. Summary:
• Proposal for guidance on width of buffers linked to the Washington State Wetland Rating System for Western Washington
• System recommendations would: o Standardize a system that classifies wetlands in 4 categories; I - IV o Set widths of buffers are based on wetland category & adjacent land uses o Land uses are classified into 3 categories based on threat of impacts to adjacent wetlands:
low, moderate and high • Buffers are defined as the uplands adjacent to an aquatic resource that can through various physical,
chemical, and biological processes reduce impacts to wetlands from adjacent land uses. • Widths of the buffer are measured along the horizontal plane. • Three alternatives which increase in complexity.
Widths of buffers ranged from 25 to 300 feet.

Legislative Task Force Literature Review: 8.08.14
20 | D i v i s i o n o f P l a n n i n g
Onsite Wastewater Treatment Systems (OWTS)
Introduction & Context The following references focus on field investigations conducted in RI and other research applicable to southern New England. The following summaries address selected OWTS & water quality reports reviewed for:
• Nitrogen & Phosphorus Generally • Denitrification in Riparian Areas • Managing Nitrogen • Nitrogen Removal in Small Streams • Phosphorus Specific • Relationships between RMFS and Water Table Rise • Nutrient Treatment in Shallow Drain Fields
Brief summaries provided but are not a substitute for reading the complete paper. All findings and recommendations are those of the cited authors, except where readers have added comments marked as * Notes. Major points are highlighted in bold text. OWTS Readers were: Task Force members Russell Chateauneuf, Civil Engineering Representative, and Lorraine Joubert, Environmental Entity – URI NEMO, with staff assistance from DOP, Supervising Land Use Planner, Nancy Hess. * Notes: OWTS may impact wetland habitat functions, but the scientific literature on the topic is limited. Wetland setbacks are primarily based on risk to public health as some treated wastewater typically enters the surface environment with the groundwater recharging the vegetated wetland or stream where contact with humans is possible. * Notes: Current RIDEM OWTS setbacks are distances to the resource, not the buffer. In some cases, the setback is equal to the jurisdictional wetland (perimeter wetland). In other cases, the setback is less than the jurisdictional wetland (riverbanks). In such cases, the wetland impacts are reviewed and decided upon first through the wetland permit process. The wetland program does not generally review the WQ impact from the OWTS, giving deference to the OWTS rules and WQ rules. Systems over 5,000 gallons per day require a site specific review under DEM regulations. > 90% of the OWTSs serve single family homes. * Notes: Some information included here was also summarized by Dr. Arthur Gold in his presentation to the Legislative Task Force on 1/21/14, which is available in notes from meeting #5 at http://www.planning.ri.gov/. His closing remarks reflected the uncertainties involved in determining adequate buffer distance and value in taking a conservative approach to prevent pollution. * Notes: Major Findings:
• In the general, the literature does not recommend specific buffer distances based on the WQ impacts to wetlands from OWTS. “There is no “magic” distance. (Gold)
• The majority (>80%) of nitrogen and phosphorus entering a septic tank is discharged into the ground.
• Nutrients impact wetland habitat and WQ functions, but the effectiveness of buffers in removing nutrients is mixed.
• Nutrient treatment and removal in the subsurface is primarily related to site specific factors including saturation of the soil beneath the leachfield, soil chemistry and biology the flow path of the effluent, and the presence of riparian “sinks” along the flow path (GOLD, A.J. and J.T. Sims. 2000) “characterizing subsurface flow requires extensive (and expensive) field work” – hydrologists are not cheap. (Gold)
• In non-calcareous acidic soils common in Rhode Island, the majority of phosphorus is removed in the vadose zone below the leachfield; the remainder moves laterally away but more slowly than the movement of groundwater. Retardation factors of between 20 and 100 have been recorded. (Cesspools are poor treatment devices partly because there is often no vadose zone below.)
Legislative Task Force Literature Review: 8.08.14
21 | D i v i s i o n o f P l a n n i n g
• Nutrient impacts on water quality are the result of cumulative loadings from individual OWTS systems and other non-point pollution sources into a receiving waterbody and the ability of the waterbody to accommodate the loading and still meet water quality standards. (e.g. not exceed the TMDL established for that waterbody).
• Nitrogen is mostly converted to nitrate in the leachfield and moves laterally away from the system in groundwater.
• OWTS derived nitrogen impacts are a much more significant concern in Rhode Island than OWTS derived phosphorus impacts (excepting cesspools and failures).
• OWTS technology solutions for added phosphorous are not readily available. Where residual P loadings area a concern, additional removal may be possible by improved soil categorization and alternative leachfield design.
• OWTS technology solutions for partial nitrogen removal are readily available and are used extensively in RI, Cape Cod, and Chesapeake Bay.
• Periodic monitoring of alternative systems and some compliance oversight is needed to ensure optimum performance (Barnstable County Board of Health).
• Aquifer characteristics are highly uncertain and have strong influence on contamination reaching receiving waters.
• Buffer length reduces contamination “risks”.
Nitrogen and Phosphorus Gold, A. J. and J.T. Sims. 2000. Risk Based Decision Making for On-site Wastewater Treatment. U.S.EPA/EPRI. pp. 114-146 Summary: This “Zhang Paper” develops research priorities to improve risk assessment and management of decentralized wastewater treatment systems to reduce nutrients from these systems. Included is a summary of factors affecting removal of nitrogen and phosphorus from OWTS in riparian zones. The authors note that nitrogen removal in riparian areas is site-specific. “Great uncertainty surrounds the fate of nitrogen in groundwater. A number of studies suggest that N removal cannot be simply related to residence time or travel distance. Instead, N removal depends on the specific characteristics of the receiving aquifer and more specifically with the characteristics that occur in selected environments along the groundwater flowpath.”
Excerpts: IV.B.1.c. Streamside Buffers and Groundwater Nitrate Removal: “Riparian Zones: There is a substantial body of research documenting groundwater nitrate-N removal in riparian zones (Pavel, et al., 1996; Hill, 1996; Correll, 1997; Lowrance, 1998). The extent of removal may be influenced by the hydrology, soils and vegetation of the riparian zone. Removal can occur through plant uptake, immobilization in organic matter or denitrification. In certain settings these streamside zones have been found to be a major sink for groundwater nitrate-N leaving upland agricultural and suburban lands. Their preservation, protection and restoration could be a key factor in sustaining or restoring watershed functions in certain watersheds. (Gilliam et al. 1997).” “Riparian zones display a great variation in groundwater nitrate-N removal. Groundwater nitrate-N removal appears to be limited to riparian zones where the water table is shallow and organic deposits accumulate in surface soils. Soil mappers often use the hydric classification to identify these types of soils. Conversely, riparian zones with deep water tables and non-hydric soils may not serve as groundwater nitrate-N sinks (Correll, 1997).” “Flowpaths influence the extent of groundwater nitrate-N removal in riparian zones (Hill, 1996). Substantial nitrate-N removal has been noted where nitrate-N laden groundwater flows through the upper 1 to 2 m of soil – while minimal removal has been observed when groundwater moves at greater depths below the soil and upwells directly beneath streams and other sources of surface

Legislative Task Force Literature Review: 8.08.14
22 | D i v i s i o n o f P l a n n i n g
water. If groundwater emerges in surface seeps upgradient of riparian wetlands, surface flow can occur rapidly (i.e., 1–2 hours) across the riparian zones, minimizing the potential for N removal. Within riparian zones research is needed on the factors that control the depth of the biologically active zone (i.e., water table dynamics, soils, geomorphology, type of vegetation, age of vegetation) and the relationship between the width of different riparian settings and groundwater nitrate-N removal.” IV.B.1.d. In-stream nitrate-N removal: “The result of recent USGS stream monitoring and modeling (Sparrow Model) also stress the importance of in-stream nitrate-N dynamics to the delivery of land based N to coastal waters. Alexander et al. (2000) concluded that nitrate-N removal is higher in small streams than large rivers. They theorize that denitrification in the bottom sediments of in small, shallow streams can be a significant source of nitrate-N removal. In larger streams they suggest that the proportion of interaction between stream and bottom sediments is too small to have notable effects on nitrate-N dynamics.”
IV.B.2. Phosphorus: [Note: DWTS = decentralized wastewater treatment systems] The more effective attenuation of P transport (relative to nitrate-N) from DWTS to surface waters by soils and aquifer materials has resulted in fewer macro-scale concerns about P impacts on most surface waters, and thus fewer watershed scale research efforts to quantify P losses. In most cases, the general opinion on the impact of P from DWTS on water quality has changed little in the past 25 years. Jones and Lee (1979) assessed the effects of P from DWTS on ground water quality in northwestern Wisconsin from 1972-1976 and stated “...No evidence for phosphate transport from septic tank effluent was found in any of the monitoring wells, even though this is a sand aquifer with a relatively high groundwater velocity” and “in general, phosphate will not be transported from septic tank wastewater disposal systems and thereby contribute to excessive fertilization problems”. The authors speculated that a very limited number of water bodies directly adjacent to septic tank disposal systems might be at risk.
Gilliam and Patmont (1983) conducted a similar study in the Puget Sound watershed n Washington and developed a mathematical analysis (Monte Carlo simulation) of P transport rom DWTS to a small lake. They concluded that “movement of more than1% of effluent P to the lake was rare” and that any P loading to the lake was mostly associated with “septic systems in wet areas that may contribute P to the lake by both shallow groundwater flow and the surfacing of septic effluent and subsequent movement to the lake by overland flow”. Chen(1988) investigated P movement in ground waters from 17 septic tank disposal systems located near the shores of eight lakes in New York State. All systems showed “good removal of ortho-P”. Groundwater in three of the 57 wells monitored exceeded the current USEPA water quality goal of 0.10 mg P/L; one site was located on a steeply sloping (>10%) soil, and he other on a soil with a very shallow water table. Reneau et al. (1989) reviewed the literature on P transport from DWTS to ground and surface waters and stated “...the limited movement of P away from onsite wastewater disposal systems is well-documented” and that “..most field studies indicate that P contamination is limited to shallow groundwater adjacent to the systems”. As noted earlier, Reneau et al. (1989) identified coarse-textured soils with low P sorption capacity, poorly drained soils, and soils with poor effluent distribution as situations with the greatest likelihood for P loss. Weiskel and Howes (1992) monitored “near-field effluent” and groundwater quality in a densely populated (~10 houses/ha) coastal watershed served by DWTS (Buttermilk Bay, Massachusetts). Virtually all (99.7%) of the effluent P was retained in the aquifer at this site. Some “near-field” (5 m down gradient) enrichment of groundwater with P was noted and attributed to reducing conditions induced by DWTS effluent. The authors concluded that while “...septic systems are clearly a major
Legislative Task Force Literature Review: 8.08.14
23 | D i v i s i o n o f P l a n n i n g
potential source of N and P to coastal waters”...septic effluent was a “minor source” of P to coastal waters.
Finally, Robertson et al. (1998) conducted a detailed study of 10 “mature” septic system plumes in central Canada. Six of the 10 sites had P plumes > 10 m in length with P concentrations elevated about 2 orders of magnitude (0.5 to 5.0 mg/L) compared to natural background concentrations. The authors concluded that “...phosphate plume velocities are substantially retarded compared to groundwater velocities at all sites (R=20 to 100)”…but that P migration velocities at some sites (calcareous sands) were fast enough to be of concern. Based on this research, and other studies such as the “micro-scale” research cited earlier, the major “macro-scale” environmental issues with regard to P and DWTS today are: (i) siting considerations related to the proximity of the DWTS to surface waters, such as any site properties that will facilitate more rapid P movement to surface waters. Examples include a better understanding of site hydrology and soil/aquifer geochemistry, both of which affect P retention and the rate of P movement in the landscape;
(ii) density of DWTS in a watershed, which relates to annual loading and water body sensitivity to P. For example in Delaware where total maximum daily loads have been established for the Inland Bays watershed (a national estuary), reductions in P loadings of 40-65% of present values will be required for these estuaries and their tributaries to meet “fishable” and “swimmable” criteria under the Clean Water Act. Thus, the long-term concern is whether the current, (or future, as coastal development proceeds) loading of P to shallow ground waters will eventually deliver, in base flow, P in excess of the TMDLs for the watershed; (iii) system design and management particularly as this affects the likelihood of system failures which can result in more rapid, surface transport of P. Or, the value of innovative designs for new systems that can more efficiently retard P transport and/or remediating existing systems to improve their effectiveness in removing P from ground water discharge.
Denitrification in Riparian Areas Gold, A.J., P.M. Groffman, K. Addy, D.Q. Kellogg, M. Stolt, and A.E. Rosenblatt. 2001. Landscape attributes as controls on ground water nitrate removal capacity of riparian zones. Journal of the American Water Resources Association. 37:1457-1464. Summary: At riparian sites high groundwater nitrate-N removal rates of more than 80% were found in wetlands and hydric soils. The extent of groundwater nitrate removal within the riparian zone is related to the flowpath and travel time through the riparian zone. Higher denitrification rates were observed in outwash soils with shallow groundwater flow paths through the riparian area. Till sites were more steeply sloping and surface seeps were more common resulting in surface flow through the riparian area, bypassing opportunity for denitrification in shallow groundwater. In deep outwash aquifers, a significant portion of the ground water recharge from distant sources may move deep below the riparian zone and upwell vertically to the stream, potentially "bypassing" the biologically active upper portions of hydric soils. Management findings:
• Any channelized surface flow through a riparian area, direct stormwater discharges to riparian areas, tile drains and shoreline alteration were identified as factors bypassing natural N sinks.
• In addition to direct alteration of stream banks, urban and suburban land use can impair denitrification potential at a watershed scale. Increased imperviousness and storm drains induce flashy runoff events often leading to stream bank erosion and incised stream channels. The deeper stream channels in
Legislative
24 | D i v
coriflofoBasu1
Addy, K.Lriparian bSummaryThis studyat two ripSampling group C o http://ww Nitrogen from the srich patchprevious sResults ssuburbancaution agwithout readjacent v * Notes: fon vegeta
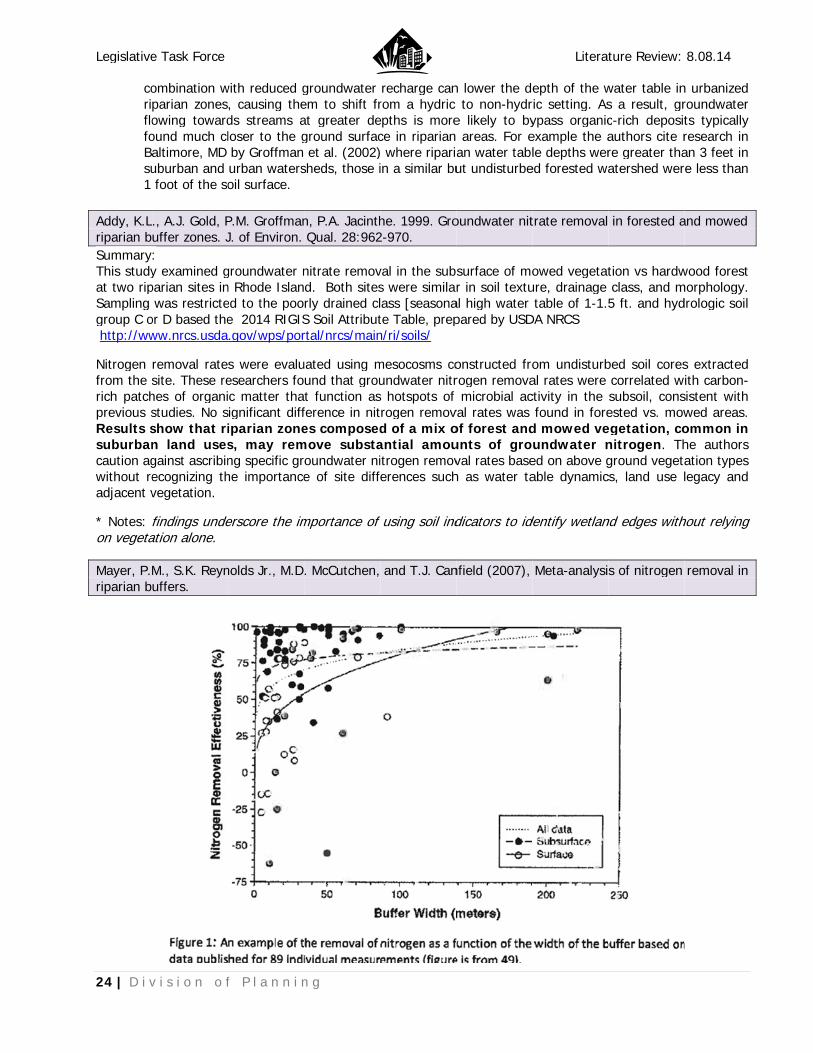
Mayer, P.riparian b
e Task Force
v i s i o n o f
ombination wparian zonesowing towardound much claltimore, MD uburban and foot of the so
., A.J. Gold, Puffer zones. J: y examined gparian sites inwas restricte
or D based theww.nrcs.usda
removal ratesite. These rehes of organistudies. No sshow that rin land usesgainst ascribinecognizing thvegetation.
findings undeation alone.
M., S.K. Reynuffers.
f P l a n n i n
with reduced g, causing theds streams aloser to the gby Groffman urban watersoil surface.
P.M. GroffmanJ. of Environ.
groundwater nn Rhode Islaned to the pooe 2014 RIGIS.gov/wps/por
s were evaluesearchers foc matter thaignificant diffiparian zones, may remng specific grhe importance
erscore the im
nolds Jr., M.D
n g
groundwater em to shift frat greater deground surfacet al. (2002)
sheds, those i
n, P.A. JacinthQual. 28:962
nitrate removd. Both sitesrly drained clS Soil Attributrtal/nrcs/main
uated using mund that grout function asference in nites composed
move substaoundwater nie of site diff
mportance of
. McCutchen,
recharge canrom a hydric epths is morece in riparian ) where ripariain a similar bu
he. 1999. Gro2-970.
val in the subs were similarass [seasonate Table, prepn/ri/soils/
mesocosms coundwater nitrs hotspots of trogen removd of a mix oantial amouitrogen removferences such
f using soil ind
and T.J. Can
n lower the deto non-hydr
e likely to by areas. For ean water tablut undisturbe
oundwater nit
surface of mor in soil textu
al high water pared by USD
onstructed frorogen removamicrobial ac
val rates was of forest andunts of groval rates baseh as water ta
dicators to ide
nfield (2007),
Literat
epth of the wric setting. Asypass organicexample the ale depths wer
ed forested wa
trate removal
owed vegetature, drainage table of 1-1.
DA NRCS
om undisturbal rates were ctivity in the found in fore
d mowed veundwater ned on above gable dynamic
dentify wetlan
Meta-analysi
ture Review:
water table ins a result, grc-rich depositauthors cite rre greater thaatershed wer
in forested a
tion vs hardwclass, and m5 ft. and hyd
bed soil corescorrelated wsubsoil, consested vs. mowegetation, conitrogen. Thground vegetacs, land use l
nd edges with
s of nitrogen
8.08.14
n urbanized roundwater ts typically research in an 3 feet in re less than
and mowed
wood forest morphology. drologic soil
s extracted ith carbon-
sistent with wed areas. ommon in he authors ation types legacy and
hout relying
removal in
Legislative Task Force Literature Review: 8.08.14
25 | D i v i s i o n o f P l a n n i n g
Managing Nitrogen Schipper, L., A.J. Gold and E. Davidson. 2010. Managing Denitrification in Human Dominated Landscapes. Ecological Engineering. 36:1503-1506. Summary: Management recommendations:
• Reduce N inputs to avoid problems. • Use onsite N controls. “The closer to the source of nitrogen the mitigation strategy is placed, the
better.” • Use a watershed scale treatment approach to protect and restore denitrification sinks to augment
onsite controls. (wetlands and buffers are N sinks). Oakely, S.M., A. J. Gold and A. J. Oczkowski. 2010. Nitrogen Control through Decentralized Wastewater Treatment: Process Performance and Alternative Management Strategies. Ecological Engineering. doi:10.1016/j.ecoleng.2010.04.030 Summary: Buffer distance necessary for treatment is highly site specific. Wastewater effluent pathways and transformations are site specific and highly variable:
“While limited or negligible transformations and dilution of OWT plumes have been observed in aerobic, unconfined sand aquifers (Robertson et al., 1991;Ptacek,1998;Harmanetal.,1996), NO3− plumes can exhibit rapid declines in nitrate levels over very short distances (3m) if the plume traverses denitrification hotspots (Groffman et al.,2009), such as carbon enriched deposits along shorelines (Robertson etal.,1991); in these instances the plume must contact carbon-rich medium for denitrification to occur. Most OWTS design cannot meet the rigorous performance targets set by regulators. Variability in treatment performance is high, especially when compared to centralized wastewater treatment facilities where wastewater collection and treatment is closely managed and monitored by staff. The effects of erratic performance from any individual OWTS is moderated by the relatively small scale of the system loading and travel time before it reaches an aquifer, lake or estuary over weeks, months or years. The authors find average loading from decentralized systems is therefore more reflective of the aggregated risks to the aquifer recharge area or coastal watersheds.
Management recommendations:
• Use shallow drainfields such as pressurized shallow narrow drainfields (psnd) or drip irrigation with advanced treatment systems for enhanced N removal.
• Apply watershed scale perspective to identify opportunities for denitrification from the discharge point to receiving waters.
*Notes: Variability in OWTS treatment performance has also been reported by the Barnstable County Board of Health. Summary data is provided at http://www.barnstablecountyhealth.org/ia-systems/information-center/data-and-statistics/.
Legislative Task Force Literature Review: 8.08.14
26 | D i v i s i o n o f P l a n n i n g
Nitrogen Removal In Small Streams Kellogg, D.Q., A.J. Gold, S. Cox, K. Addy, and P.V. August, 2010. A geospatial approach for assessing denitrification sinks within lower-order catchments. Ecological Engineering 36: 1596-1606. Summary: Nitrate sinks include riparian wetlands, lakes and reservoirs, and headwater streams. Riparian Wetlands, reservoirs, and lower (first and second) order streams can function as nitrogen sinks. Particular stream feature such as pools or organic debris play an important role in N removal. Water residence time was a controlling factor for reducing N load in all these settings. In contrast, where landscape sinks are bypassed by land management practices such as tile drains or stormwater conveyance systems, N sources pose a greater risk of watershed N export. Low order streams generally comprise 70-85 of total stream length within a watershed; contribute 80% of stream flow, and > 50% of the total N load delivered to all stream reaches. Alexander, R,B, R.A. Smight and G.E. Schwarz. 2000. “Effect of stream channel size on the delivery of Nitrogen to the Gulf of Mexico. Nature 403:756-761. Summary: Small headwater streams (first and second order) are most effective in protecting water quality despite their small size. These small tributaries, which typically comprise 60-80% of stream miles in less developed watersheds, are considered to have much greater ability to remove pollutants because of their extensive shoreline contact. In larger streams, the proportion of stream flow interacting with bottom sediments is considered too small to have notable effects on nitrogen dynamics. Center for Watershed Protection, 2000. The impact of stormwater on Puget Sound Wetlands. Watershed Protection Techniques 3(2): 670-675. Summary: “Small streams are more susceptible to disturbance because they are abundant in the landscape and may be perceived to be less important. Because of their small size they are more likely to be impaired through direct disturbance during subdivision construction, secondary backyard “improvements”, and by related changes in flow and sedimentation. To protect these valuable small streams, maximum buffer distances are often recommended for third order streams and smaller.”
Phosphorus Multiple documents without dates from website of Barnstable County Board of Health: http://www.barnstablecountyhealth.org/ (Accessed 7.02.14) Summary: Advanced treatment systems - Advanced treatment systems are not designed to remove phosphorus. Sand filter drain fields are not effective in removing phosphorus. Monitored data for one sand filter showed some phosphorus attenuation initially following construction but within one year the P concentrations entering and leaving the sand filter were the same, with no removal.
Summary: Alternative treatment systems - No recommendations provided on horizontal buffer distance but addresses risks. Findings: In a conventional system “any phosphorus which is removed in the septic system probably is removed under the leaching facility by chemical precipitation. To date, no alternative on-site technologies are capable of significant phosphorus removal.” Phosphorus can become mobile in anaerobic conditions such as may occur with groundwater rise into the drainfield. Phosphorus concentrations in wastewater average about 10 mg/l.
Legislative Task Force Literature Review: 8.08.14
27 | D i v i s i o n o f P l a n n i n g
*Note: Advanced treatment systems typically used in RI are not designed to remove phosphorus (G.Loomis, Director, URI New England Onsite Wastewater Training Center). However, Holden et.al. (2004) found between 55% to 100% phosphorus reductions in pressurized shallow narrow drainfields.
Relationship between RMFs and Water Table Rise Morgan, C.P. 2002. An investigation of soil morphology-water table relationships on Block Island. M.S. thesis. Dept. of Natural Resources Science, College of the Environment and Life Sciences, University of Rhode Island, Kingston, RI. Morgan, C.P. and M.H. Stolt. 2006. Soil morphology-water table cumulative duration relationships in southern New England. Soil Sci. Soc. Am. J. 70:816-824. http://www.soils.org/publications/sssaj/pdfs/70/3/816 Stolt, M.H. 2013. Relationships between soil morphology and water table levels. Presentation at the Rhode Island Regulatory Setbacks and Buffers workshop. November 21, 2013. URI, Kingston RI. http://www.uri.edu/ce/wq/nemo/Workshops-Support/Previous_Workshops.htm#Buffers2013
Combined Summary: Morgan and Stolt examined the relationship between redoximorphic features (RMFs) and the frequency and duration of water table rise in Rhode Island soils. This study focused on marginal soils where the seasonal high water table (shwt) is estimated to be 18 to 30 inches from the ground surface based on the RIDEM soil site evaluation procedure. Data loggers and other field monitoring devices were used to record actual water table fluctuations. Results show that RMFs are a good indicator of the “average shwt”, defined as the average depth of the water table between the low and high points during the spring. However, RMFs do not identify the highest the water table rises, or how long the water table remains high. This is a concern because OWTS design is based on the depth to the SHWT where common abundance (2-20%) of RMFs is found. If the water table rises above this level, the separation distance between the bottom of the OWTS drainfield and the water table will be compromised, increasing risk that untreated bacteria will enter groundwater. Nutrient Treatment in Shallow Drain Fields Holden, S.A. 2004. The effectiveness of shallow narrow drainfields to treat domestic wastewater. Master’s Thesis, Department of Natural Resources Science, University of Rhode Island, Kingston, RI, 02881. (pdf not available) Holden, S.A., M.H. Stolt, G.W. Loomis, and A.J. Gold. 2004. Seasonal variation in nitrogen leaching from shallow-narrow drainfields. Proceedings of the Tenth National Symposium on Individual and Small Community Sewage Systems, ASAE.
Combined Summary: Seven residential sites using onsite wastewater treatment systems were monitored in coastal Rhode Island to examine nitrogen removal by pressurized shallow narrow drainfields (PSND) following advanced treatment units. Sites varied in age from four to six years. Five suction-cup lysimeters were installed at each site, three within the PSND and two within a control plot outside the drainfield area. In the SND, lysimeters were installed in the undisturbed soils adjacent to each trench at a depth of 12 inches below the drainfield lines. Control lysimeters were placed at approximately 28 inches below the soil surface. Soil porewater samples were collected through the lysimeters twice seasonally from the winter of 2001 until the summer of 2003 and analyzed for total N. Average concentrations of N entering the groundwater for these seven sites ranged from 2 to 41 mg/l. Six of the seven sites showed a 33 to 73% overall reduction in N levels as a result of treatment
Legislative Task Force Literature Review: 8.08.14
28 | D i v i s i o n o f P l a n n i n g
in the SND. Higher chloride to nitrogen ratios in porewater below the SND indicates removal of N by plant uptake or denitrification rather than dilution. Seasonal affects were recognized for inputs of N into the groundwater for two of the sites – with highest levels measured in the winter and lower levels in the spring and summer and increased levels in the fall. This trend is likely due to reduced biological activity during colder temperatures. There were no observed seasonal effects on the amount that N levels were reduced as a result of treatment in the SND. Porewater samples collected from the control area of two sites had considerably higher levels of total nitrogen (TN) than those below the SND. The higher N levels outside the SND are likely the result of excess fertilizer additions to the lawns. Unpublished data from the Master’s thesis shows that phosphorus reduction below the SND was 55 to 100 % due to adsorption by the soil and uptake by vegetation.
Legislative Task Force Literature Review: 8.08.14
29 | D i v i s i o n o f P l a n n i n g
Other Papers and Reports Introduction The following wetland buffer studies and synopsis papers focus on:
General references for other types of regulatory reviews Buffer Zones for Amphibians / Reptiles Buffers Zones and Other Taxa
The topics are addressed by a variety of organizations from governmental to nonprofits. Not all of these collected and listed here have been read on behalf of the Task Force but represent a collective knowledge of the Literature Review Subgroup of the Task Force on the subject of wetland buffers. The publications were scanned for additional information to supplement the wetlands and OWTS topics that were read above. A brief summary is provided for one key paper but is not a substitute for reading the complete paper. All findings and recommendations are those of the cited authors. General References
A Local Officials Guide to Regulating Land Use in Wetland Buffers and High Water Tables to Protect Water Quality, Pamela Cunningham, Sea Grant Law Fellow, Roger Williams University School of Law, 2009
Berkshire Regional Planning Commission, 2003, The Massachusetts buffer manual: using vegetated buffers to protect our lakes and rivers. Massachusetts Department of Environmental Protection
Brown, M., J. Schaefer and K. Brandt. 1990. Buffer zones for water, wetlands, and wildlife in east Central
Florida. Center for Wetlands. CFW Publication No. 89-07. Gainesville, FL. 71 pp. and Appendices.
Brown, M., and J. Schaefer with K. Brandt, S. Doherty, C. Dove, J. Dudley, D. Eifler, L. Harris, R. Noss, and R.Wolfe. 1987. Buffer zones for water, wetlands, and wildlife. Center for Wetlands. Gainesville, FL.
Houlahan, J. E. and F. Findlay. 2004. Estimating the critical distance at which adjacent land-use degrades
wetland water and sediment quality. Landscape ecology, 19: 677-690.
http://www.umaine.edu/vernalpools/PDFs/Best%20Development%20Practices%20%20-%20%20Conserving%20Pool-breeding%20Amph.pdf
Connecticut River Joint Commission of New Hampshire and Vermont. 2000. Fact sheet series: Riparian
buffers for the Connecticut River Watershed. Charlestown, NH. http://crjc.org/riparianbuffers.htm
Groffman, P., A. Gold, T. Husband, R. Simmons, and W. Eddleman. 1991. An investigation into multiple uses of vegetated buffer strips. Narragansett Bay Project Report No. NBP-91-63.
Lee, P., C. Smith, and S. Boutin. 2004. Quantitative review of riparian buffer width guidelines from Canada
and the United States. Journal of Environmental Management, 70: 165-180.
Nitrogen Attenuation Bibliography, MA DEP_2007.pdf
Palone, R.S. and A.H. Todd (editors.) 1997. Chesapeake Bay riparian handbook: a guide for establishing and maintaining riparian forest buffers. USDA Forest Service. NA-TP-02-97. Radnor, PA. http://www.ecrr.org/publication/watqual_doc7.pdf
Water Quality Function of Wetland Buffers: A Brief Annotated Bibliography, Nathaniel Lichtin, University of
Rhode Island Coastal Fellow, URI Cooperative Extension, RI Nonpoint Education for Municipal Officials, November, 2008
Legislative Task Force Literature Review: 8.08.14
30 | D i v i s i o n o f P l a n n i n g
Wenger, S. 1999. A review of the scientific literature of riparian buffer width, extent, and vegetation.
Institute of Ecology, University of Georgia. Athens, GA.
From Zhang, X., X. Liu, M. Zhang, and R.A. Dahlgren, 2010. A review of vegetated buffers and meta-analysis of their mitigation efficacy in reducing nonpoint source pollution.
Summary: Buffer width alone explains only part of the effectiveness of buffers: (surface and groundwater sources)
• 37% sediments • 60% pesticides • 44% nitrogen • 35% phosphorus •
Slope, soil chemistry, soil structure, and vegetation type are other variables that correlate with removal efficiency. Moreover, there is great variability on the effectiveness of buffers for nutrient removal; the R² of the data is often less than 0.7, the generally accepted value of a good fit, if not far less in most cases.
Buffer Zones and Amphibians / Reptiles
Baldwin, R. F., A.J. K. Calhoun, P. G. deMaynadier. 2006. Conservation planning for amphibian species with complex habitat requirements: a case study using movements and habitat selection of the wood frog Rana sylvatica. Journal of Herpetology, 40(4), 442-453.
Calhoun, A. J. K. and P. G. deMaynadier. (eds.). 2008. Science and conservation of vernal pools in
northeastern North America. CRC Press. Boca Raton, FL.
Crawford, J. A. and R. D. Semlitsch. 2007. Estimation of core terrestrial habitat for stream-breeding salamanders and delineation of riparian buffers for protection of biodiversity. Conservation Biology, 21(1):152-158.
Freidenfelds, N.A., J. L. Purrenhage, and K. J. Babbitt. 2011. The effects of clear cuts and forest buffer
size on post-breeding emigration of adult wood frogs (Lithobates sylvaticus). Forest Ecology and Management 261: 2115–2122.
Gamble, L. R., McGarigal, K., Jenkins, C. L., & Timm, B. C. 2006. Limitations of regulated “buffer zones”
for the conservation of marbled salamanders. Wetlands, 26(2), 298-306.
Harper, E. B., T. A. G. Rittenhouse, and R. D. Semlitsch. 2008. Demographic consequences of terrestrial habitat loss for pool-breeding amphibians: Predicting extinction risks associated with inadequate size of buffer zones. Conservation Biology, 22(5):1205-1215.
Homan, R. N., Windmiller, B. S., & Reed, J. M. 2004. Critical thresholds associated with habitat loss for
two vernal pool-breeding amphibians. Ecological Applications, 14(5), 1547-1553.
McDonough, C. and P.W. C. Paton. 2007. Salamander Dispersal Across a Forested Landscape Fragmented by a Golf Course. Journal of Wildlife Management. 71(4):1163–1169.
Perkins, D.W. and M.L. Hunter, Jr. 2006. Use of amphibians to define riparian zones of headwater streams.
Can. J. For. Res. 36:2124-2130.
Semlitsch, R. D. (1998) Biological Delineation of Terrestrial Buffer Zones for Pond-Breeding Salamanders. Conservation Biology, 12(5): 1113-1119.

Legislative Task Force Literature Review: 8.08.14
31 | D i v i s i o n o f P l a n n i n g
Semlitsch, R.D. and J. R. Bodie. 2003. Biological criteria for buffer zones around wetlands and riparian habitats for amphibians and reptiles. Conservation Biology 17(5):1219-1228.
Steen, D. A., J.P. Gibbs, K.A. Buhlmann, J.L. Carr, B.W. Compton, J.D. Congdon, J.S. Doody, J.C. Godwin,
K.L. Holcomb, D.R. Jackson, F.J. Janzen, G. Johnson, M.T. Jones, J.T. Lamer, T.A. Langen, M.V. Plummer, J.W. Rowe, R.A. Saumure, J.K. Tucker, and D.S. Wilson. 2012. Terrestrial habitat requirements of nesting freshwater turtles. Biological Conservation. 150:121-128.
Veysey, J.S., K.J. Babbitt, and A. Cooper. 2009. An experimental assessment of buffer width: implications for
salamander migratory behavior. Biol. Conserv. 142:2227-2239.
Wilson, J.D. and Dorcas, M.E. (2003) Effects of habitat disturbance on stream salamanders: Implications for buffer zones and watershed management. Conserv. Biol. 17: 763-771.
Buffer Zones and Other Taxa
Fisher, R.A. 2000. Width of riparian zones for birds. U.S. Army Engineer Research and Development Center. EMRRP Technical Notes Collection. TN EMRRP-SI-09.
Lussier, S. M., R.W. Enser, S. N. DaSilva, and M. Charpentier. 2006. Effects of habitat disturbance from
residential development on breeding bird communities in riparian corridors. Environmental Management, Vol. 38 (3): 505-531.
Rodgers, Jr., J. A. and H. T. Smith. 1997. Buffer zone distances to protect foraging and loafing water birds
from human disturbance in Florida. Wildl. Soc. Bull. 25(1): 139-145.
Stoffyn-Egli, P. and J. H. M. Willison. 2011 Including wildlife habitat in the definition of riparian areas: The beaver (Castor Canadensis) as an umbrella species for riparian obligate animals. Environ. Rev. 19: 479-493.
Weston, M. A., M. J. Antos, and H. K. Glover. 2009. Birds, buffers, and bicycles: A review and case study
of wetland buffers. The Victorian Naturalist, 126(3): 79-86.
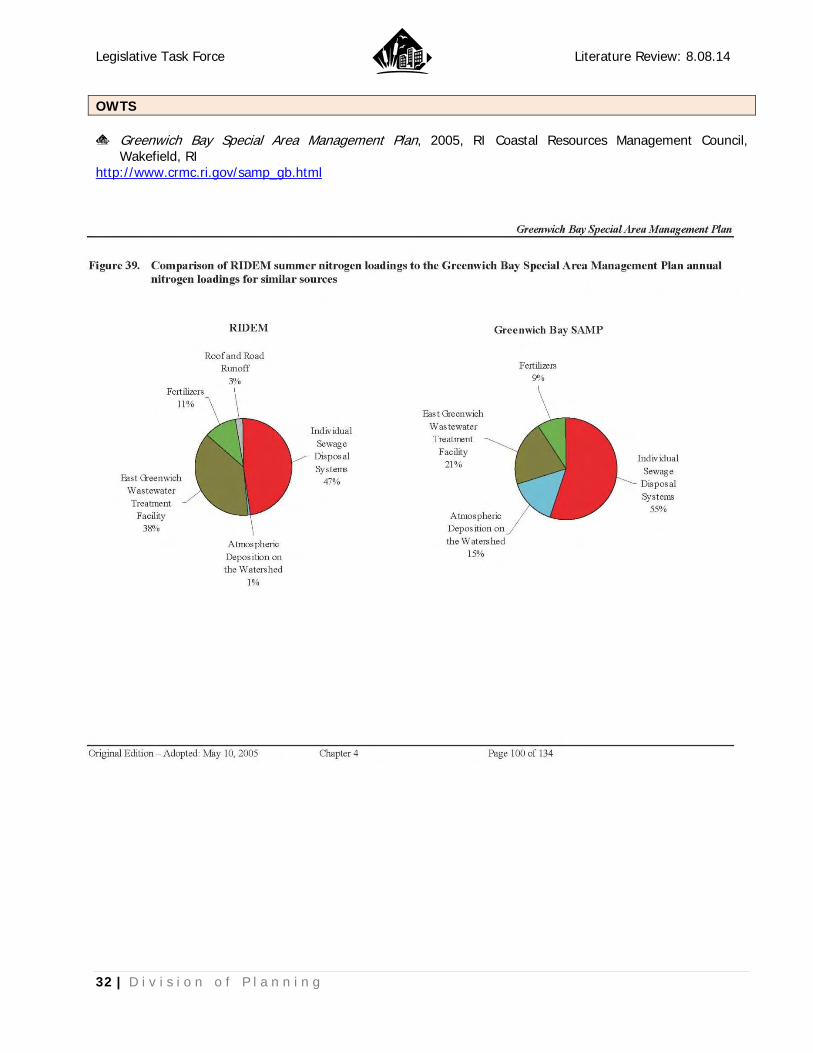
Legislative Task Force Literature Review: 8.08.14
32 | D i v i s i o n o f P l a n n i n g
OWTS
Greenwich Bay Special Area Management Plan, 2005, RI Coastal Resources Management Council, Wakefield, RI
http://www.crmc.ri.gov/samp_gb.html
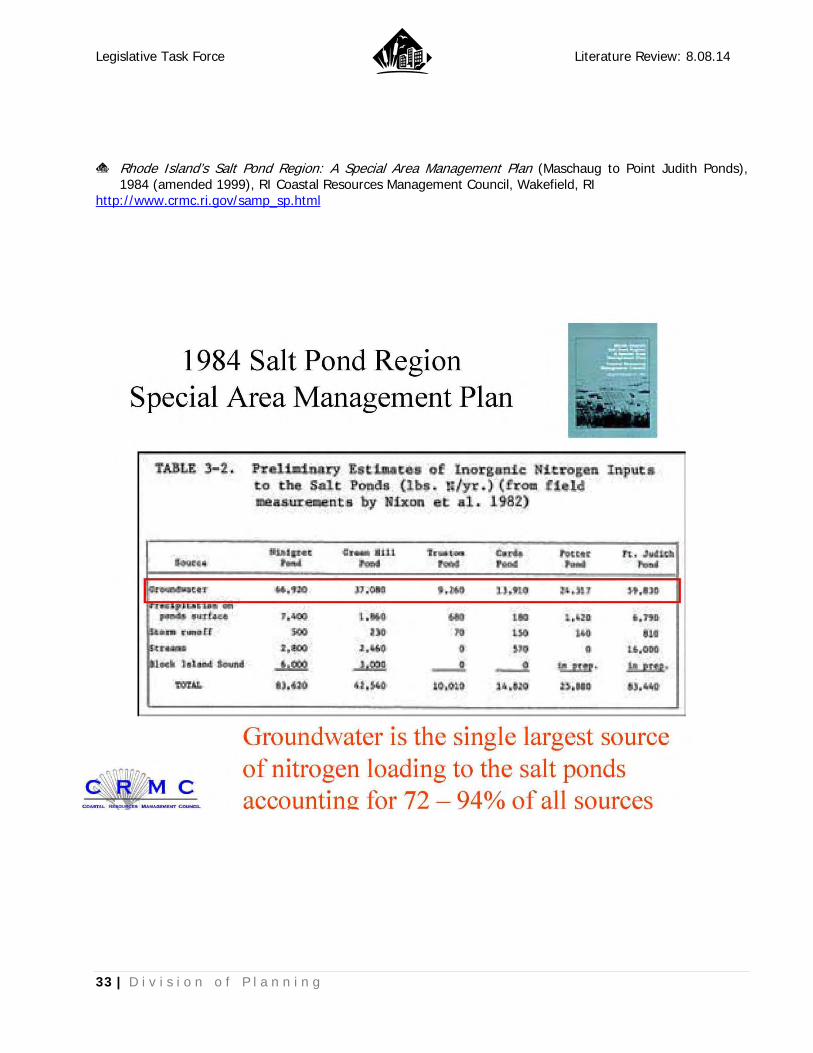
Legislative Task Force Literature Review: 8.08.14
33 | D i v i s i o n o f P l a n n i n g
Rhode Island’s Salt Pond Region: A Special Area Management Plan (Maschaug to Point Judith Ponds), 1984 (amended 1999), RI Coastal Resources Management Council, Wakefield, RI
http://www.crmc.ri.gov/samp_sp.html
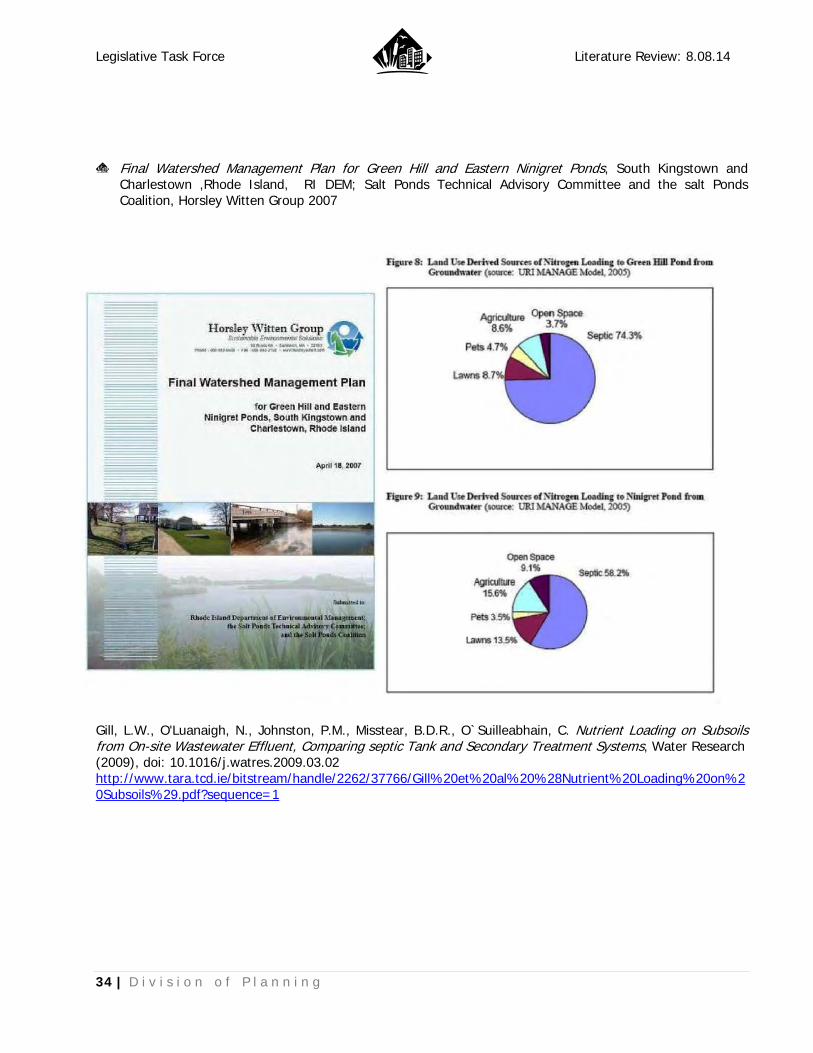
Legislative Task Force Literature Review: 8.08.14
34 | D i v i s i o n o f P l a n n i n g
Final Watershed Management Plan for Green Hill and Eastern Ninigret Ponds, South Kingstown and Charlestown ,Rhode Island, RI DEM; Salt Ponds Technical Advisory Committee and the salt Ponds Coalition, Horsley Witten Group 2007
Gill, L.W., O'Luanaigh, N., Johnston, P.M., Misstear, B.D.R., O`Suilleabhain, C. Nutrient Loading on Subsoils from On-site Wastewater Effluent, Comparing septic Tank and Secondary Treatment Systems, Water Research (2009), doi: 10.1016/j.watres.2009.03.02 http://www.tara.tcd.ie/bitstream/handle/2262/37766/Gill%20et%20al%20%28Nutrient%20Loading%20on%20Subsoils%29.pdf?sequence=1