Embed Size (px)
Citation preview
3 | 1National Science Board | Science & Engineering Indicators 2016
Chapter 3.
Science and Engineering Labor Force
Table of Contents
Highlights ...................................................................................................................................... 3-5U.S. S&E Workforce: Definition, Size, and Growth ........................................................................ 3-5S&E Workers in the Economy .................................................................................................... 3-5S&E Labor Market Conditions .................................................................................................... 3-6Demographics of the S&E Workforce .......................................................................................... 3-6Global S&E Labor Force ............................................................................................................ 3-7
Introduction .................................................................................................................................. 3-8Chapter Overview .................................................................................................................... 3-8Chapter Organization ............................................................................................................... 3-8
U.S. S&E Workforce: Definition, Size, and Growth ........................................................................ 3-12Definition of the S&E Workforce ............................................................................................... 3-12Size of the S&E Workforce ...................................................................................................... 3-14Growth of the S&E Workforce .................................................................................................. 3-18Educational Distribution of Workers in S&E Occupations .............................................................. 3-26Occupational Distribution of S&E Degree Holders and Relationship between Jobs and Degrees ......... 3-30
S&E Workers in the Economy ....................................................................................................... 3-37Employment Sectors .............................................................................................................. 3-37Employer Size ....................................................................................................................... 3-43Industry Employment ............................................................................................................. 3-44Employment by Metropolitan Area ............................................................................................ 3-46Scientists and Engineers and Innovation-Related Activities .......................................................... 3-47
S&E Labor Market Conditions ....................................................................................................... 3-54Unemployment ...................................................................................................................... 3-54Working Involuntarily Out of One's Field of Highest Degree ......................................................... 3-57Earnings ............................................................................................................................... 3-59Recent S&E Graduates ............................................................................................................ 3-64
Age and Retirement of the S&E Workforce ................................................................................... 3-77Age Differences among Occupations ......................................................................................... 3-78Age Differences among Degree Fields ....................................................................................... 3-80Retirement ............................................................................................................................ 3-80
Women and Minorities in the S&E Workforce ............................................................................... 3-83Women in the S&E Workforce .................................................................................................. 3-83Minorities in the S&E Workforce ............................................................................................... 3-90Salary Differences for Women and Racial and Ethnic Minorities .................................................... 3-95
Immigration and the S&E Workforce .......................................................................................... 3-101Characteristics of Foreign-Born Scientists and Engineers ........................................................... 3-102New Foreign-Born Workers .................................................................................................... 3-105
Global S&E Labor Force .............................................................................................................. 3-114Size and Growth of the Global S&E Labor Force ........................................................................ 3-114
Conclusion .................................................................................................................................. 3-120Glossary ..................................................................................................................................... 3-121References ................................................................................................................................. 3-122
List of Sidebars
3 | 2National Science Board | Science & Engineering Indicators 2016
NSF's Scientists and Engineers Statistical Data System .......................................................................... 3-9Projected Growth of Employment in S&E Occupations .......................................................................... 3-19S&E Workers Without a Bachelor's Degree .......................................................................................... 3-28Employment Patterns among Biomedical Sciences Doctorates ............................................................... 3-71Women in Leading Roles and Positions ............................................................................................... 3-86
List of Tables
Table 3-1. Major sources of data on the U.S. labor force ........................................................................ 3-9Table 3-2. Classification of degree fields and occupations ..................................................................... 3-12Table 3-3. Measures and size of U.S. S&E workforce: 2013 and 2014 ..................................................... 3-14Table 3-4. Educational background of college graduates employed in S&E occupations, by broad S&Eoccupational category: 2013 ............................................................................................................. 3-30Table 3-5. Relationship of highest degree to job among S&E highest degree holders not in S&E occupations, bydegree level: 2013 .......................................................................................................................... 3-32Table 3-6. Employment sector of scientists and engineers, by broad occupational category and degree field:2013 ............................................................................................................................................. 3-37Table 3-7. Self-employed scientists and engineers, by education, occupation, and type of business: 2013 .. 3-41Table 3-8. Employment in S&E occupations, by major industry: May 2014 .............................................. 3-45Table 3-9. Metropolitan areas with largest proportion of workers in S&E occupations: May 2014 ................ 3-46Table 3-10. R&D activity rate of scientists and engineers employed in S&E occupations, by broad occupationalcategory and level of highest degree: 2013 ........................................................................................ 3-50Table 3-11. Scientists and engineers participating in work-related training, by labor force status and occupation:2013 ............................................................................................................................................. 3-51Table 3-12. Scientists and engineers who are working involuntarily out of field, by S&E degree field: 2003–13 .. 3-58Table 3-13. Annual salaries in science, technology, and related occupations: May 2011–May 2014 ............. 3-59Table 3-14. Labor market indicators for recent S&E degree recipients up to 5 years after receiving degree, bylevel and field of highest degree: 2013 .............................................................................................. 3-64Table 3-15. Employment characteristics of recent SEH doctorate recipients up to 3 years after receivingdoctorate, by field of degree: 2001–13 .............................................................................................. 3-67Table 3-16. Employed SEH doctorate recipients holding tenure and tenure-track appointments at academicinstitutions, by field of and years since degree: 1993–2013 .................................................................. 3-68Table 3-17. Median salaries for recent SEH doctorate recipients up to 5 years after receiving degree, by field ofdegree and employment sector: 2013 ................................................................................................ 3-69Table 3-18. Median salaries for recent U.S. SEH doctorate recipients in postdoc and non-postdoc positions up to5 years after receiving degree: 2013 ................................................................................................. 3-74Table 3-19. Racial and ethnic distribution of U.S. residents, and of employed individuals in S&E occupations,with S&E degrees, and with college degrees: 2013 .............................................................................. 3-91Table 3-20. Distribution of workers in S&E occupations, by race and ethnicity: 1993–2013 ....................... 3-92Table 3-21. Racial and ethnic distribution of employed individuals with S&E highest degree, by field of highestdegree: 2013 ................................................................................................................................. 3-93Table 3-22. Racial and ethnic distribution of employed individuals with S&E highest degree, by level of highestdegree: 2013 ................................................................................................................................. 3-93Table 3-23. Racial and ethnic distribution of employed women in S&E occupations and with S&E highestdegrees: 1993 and 2013 .................................................................................................................. 3-94Table 3-24. Median annual salary among S&E highest degree holders working full time, by sex, race, andethnicity: 1995, 2003, and 2013 ....................................................................................................... 3-95Table 3-25. Foreign-born workers in S&E occupations, by education level: 1993, 2003, and 2013 ............ 3-101Table 3-26. Annual salaries for new H-1B visa recipients, by occupation: FY 2014 .................................. 3-107

3 | 3National Science Board | Science & Engineering Indicators 2016
Table 3-27. Five-year stay rates for U.S. S&E doctorate recipients with temporary visas at graduation, byselected country/economy: 2011 ..................................................................................................... 3-111Table 3-A. Bureau of Labor Statistics projections of employment and job openings in S&E and other selectedoccupations: 2012–22 ..................................................................................................................... 3-20
List of Figures
Figure 3-1. Employment in S&E occupations, by broad occupational category: 2013 and 2014 .................. 3-17Figure 3-2. S&E degrees among college graduates, by field and level of highest degree: 2013 .................. 3-18Figure 3-3. Individuals employed in S&E occupations in the United States: Selected years, 1960–2013 ...... 3-25Figure 3-4. Average annual growth in the total number of employed individuals with highest degree in S&E, byfield and level of highest degree: 2003–13 ......................................................................................... 3-26Figure 3-5. Educational attainment, by type of occupation: 2013 ........................................................... 3-28Figure 3-6. Occupational distribution of scientists and engineers, by broad field of highest degree: 2013 .... 3-32Figure 3-7. Occupational distribution of S&E highest degree holders, by field of highest degree: 2013 ........ 3-34Figure 3-8. S&E degree holders working in S&E occupations, by level and field of S&E highest degree: 2013 .. 3-35Figure 3-9. S&E degree holders employed in jobs related to highest degree, by level of and years since highestdegree: 2013 ................................................................................................................................. 3-36Figure 3-10. S&E highest degree holders, by degree level and employment sector: 2013 .......................... 3-39Figure 3-11. Broad S&E occupational categories, by employment sector: 2013 ........................................ 3-40Figure 3-12. Scientists and engineers employed in the business sector, by employer size: 2013 ................ 3-44Figure 3-13. Employed scientists and engineers with R&D activity, by broad field of highest degree and broadoccupational category: 2013 ............................................................................................................. 3-49Figure 3-14. Employed SEH doctorate holders with R&D activity, by years since doctoral degree: 2013 ...... 3-51Figure 3-15. Unemployment rates of S&E highest degree holders, by level of and years since highest degree:2013 ............................................................................................................................................. 3-55Figure 3-16. Unemployment rate, by selected groups: 1990–2014 ........................................................ 3-56Figure 3-17. Unemployment rates for S&E, STEM, and the overall labor force: March 2008–June 2015 ....... 3-57Figure 3-18. S&E highest degree holders who are working involuntarily out of field, by field of and years sincehighest degree: 2013 ...................................................................................................................... 3-59Figure 3-19. Median salaries for employed college-educated individuals, by broad field of highest degree andyears since highest degree: 2013 ...................................................................................................... 3-62Figure 3-20. Median salaries for S&E highest degree holders, by broad field of and years since highest degree:2013 ............................................................................................................................................. 3-63Figure 3-21. Median salaries for S&E highest degree holders, by level of and years since highest degree: 2013 . 3-64Figure 3-22. Recent U.S. SEH doctorate recipients in postdoc positions, by field of and years since doctorate:2013 ............................................................................................................................................. 3-74Figure 3-23. Age distribution of scientists and engineers in the labor force, by sex: 1993 and 2013 ........... 3-78Figure 3-24. Age distribution of employed scientists and engineers, by broad occupational category and broadfield of highest degree: 2013 ............................................................................................................ 3-79Figure 3-25. Older scientists and engineers who work full time, by age and highest degree level: 2013 ...... 3-81Figure 3-26. Older scientists and engineers who report not working because of retirement, by age and highestdegree level: 2013 .......................................................................................................................... 3-82Figure 3-27. Women in the workforce and in S&E: 1993 and 2013 ......................................................... 3-84Figure 3-28. Women in S&E occupations: 1993–2013 .......................................................................... 3-85Figure 3-29. Employed women with highest degree in S&E, by degree level: 1993–2013 .......................... 3-88Figure 3-30. Highest degree holders in S&E not in the labor force, by sex and age: 2013 ......................... 3-90Figure 3-31. Estimated salary differences between women and men with highest degree in S&E employed fulltime, controlling for selected characteristics, by degree level: 2013 ....................................................... 3-97

3 | 4National Science Board | Science & Engineering Indicators 2016
Figure 3-32. Estimated salary differences between minorities and whites and Asians with highest degree in S&Eemployed full time, controlling for selected characteristics, by degree level: 2013 ................................... 3-98Figure 3-33. Foreign-born scientists and engineers employed in S&E occupations, by highest degree level andbroad S&E occupational category: 2013 ........................................................................................... 3-103Figure 3-34. Foreign-born individuals with highest degree in S&E living in the United States, by place of birth:2013 ........................................................................................................................................... 3-104Figure 3-35. Temporary work visas issued in categories with many high-skilled workers: FYs 1991–2014 . 3-106Figure 3-36. Plans at graduation of foreign recipients of U.S. S&E doctoral degrees to stay in the United States,by year of doctorate: 1993–2013 .................................................................................................... 3-109Figure 3-37. Stay rates for U.S. S&E doctoral degree recipients with permanent or temporary visas atgraduation, by sex: 1996–2011 ...................................................................................................... 3-111Figure 3-38. S&E doctorate recipients with temporary visas at graduation reporting plans to stay versus actual1-year stay rate: 1999–2007 .......................................................................................................... 3-113Figure 3-39. Estimated number of researchers in selected regions/countries: 2000–13 ........................... 3-116Figure 3-40. Researchers as a share of total employment in selected regions/countries: 2000–13 ............ 3-117Figure 3-41. Gross domestic R&D expenditures (GERD) per researcher in selected regions/countries: 2000–13 .. 3-119Figure 3-A. Projected increases in employment for S&E and other selected occupations: 2012–22 ............. 3-20Figure 3-B. Projected job openings in S&E and other selected occupations: 2012–22 ............................... 3-23
Chapter 3. Science and Engineering Labor Force
3 | 5National Science Board | Science & Engineering Indicators 2016
Highlights
U.S. S&E Workforce: Definition, Size, and Growth
The S&E workforce can be defined in several ways: by workers in S&E occupations, by holders ofS&E degrees, or by the use of S&E technical expertise on the job. The estimated size of the S&Eworkforce varies depending on the definitional criteria chosen.
In 2013, estimates of the size of the S&E workforce ranged from approximately 6 million to more than 21million depending on the definition used.In 2013, an estimated 5.7 million college graduates were employed in S&E occupations in the UnitedStates. The largest S&E occupations were computer and mathematical sciences (2.6 million), followed byengineering (1.6 million). Occupations in life sciences (638,000), social sciences (581,000), and physicalsciences (319,000) combined to about the size of the engineering component.In 2013, about 21.1 million individuals in the United States had a bachelor’s or higher level degree in anS&E field of study. The majority (15.8 million) held their highest level of degree (bachelor’s, master’s,professional, or doctorate) in an S&E field. Of these highest degrees, the most common fields were socialsciences (6.4 million) and engineering (3.4 million). Computer and mathematical sciences (2.6 million),life sciences (2.4 million), and physical sciences (956,000) together were slightly less than the size of thesocial sciences component.Not all S&E degree holders work in jobs formally designated as S&E occupations. The number ofcollege-educated individuals reporting that their jobs require at least a bachelor’s degree level of technicalexpertise in S&E (17.7 million) is substantially higher than the number employed in S&E occupations(nearly 6 million), suggesting that the application of S&E knowledge and skills is widespread across thetechnologically sophisticated U.S. economy and not limited to jobs classified as S&E.
The S&E workforce has grown steadily over time.
Between 1960 and 2013, the number of workers in S&E occupations grew at an average annual rate of3%, compared to the 2% growth rate for the total workforce.Data from more recent years indicate that trends in S&E employment compared favorably to overallemployment trends during and after the 2007–09 economic downturn. Between 2008 and 2014, thenumber of workers employed in S&E occupations rose by about half a million, whereas the total workforcestayed relatively steady.
S&E Workers in the Economy
Scientists and engineers work for all types of employers.
The vast majority of scientists and engineers (individuals trained or employed in S&E) are employed inthe business sector (70%), followed by the education (19%) and government (11%) sectors. Within thebusiness sector, for-profit businesses employ the bulk of scientists and engineers.Among individuals with S&E doctorates, the proportion working in the business sector (46%) is similar tothe proportion working in the education sector (45%). Within the education sector, over 90% work in4-year colleges and universities, including those in postdoctoral and other temporary positions.

Chapter 3. Science and Engineering Labor Force
3 | 6National Science Board | Science & Engineering Indicators 2016
The vast majority of educational institutions and government entities that employ scientists andengineers are large employers (i.e., having 100 or more employees). In contrast, scientists and engineersworking in the business sector are distributed across firms of different sizes.Within the business sector, the industry with the largest number of workers in S&E occupations isprofessional, scientific, and technical services.Employment in S&E occupations is geographically concentrated in the United States. The 20 metropolitanareas with the largest proportion of the workforce employed in S&E occupations in 2014 accounted for18% of nationwide S&E employment, compared to 8% of all employment.
S&E Labor Market Conditions
Whether measured by S&E occupation or degree, S&E workers have higher earnings than othercomparable workers.
Half of the workers in S&E occupations earned $81,000 or more in 2014, which is more than double themedian salaries ($36,000) of the total workforce.Employed college graduates with a highest degree in S&E earn more than those with non-S&E degrees(median salaries in 2013 were $65,000 and $52,000, respectively). For the most part, the earningspremium associated with an S&E degree is present across early, mid, and later career stages.
The S&E labor force is less likely than others to experience unemployment.
Unemployment rates for college-educated individuals in S&E occupations tend to be lower than those forall college graduates and much lower than those for the overall labor force: In February 2013, about3.8% of scientists and engineers and 4.3% of all college-educated individuals in the labor force wereunemployed, about half the official unemployment rate for the entire U.S. labor force (8.1%).Unemployment rates for S&E doctorate holders (2.3%) are even lower than for those at other degreelevels (4.2% and 3.7% among S&E bachelor’s and master’s degree holders, respectively).
Demographics of the S&E Workforce
Mirroring U.S. population trends, the S&E labor force is aging. Additionally, a larger proportion ofolder scientists and engineers remain in the labor force in 2013 than in 1993.
The median age of scientists and engineers in the labor force was 43 years in 2013, compared to 41years in 1993.Between 1993 and 2013, an increasing percentage of scientists and engineers in their 60s reported thatthey were still in the labor force. Whereas 54% of scientists and engineers between the ages of 60 and 69were in the labor force in 1993, the comparable percentage rose to 64% in 2013.
Women remain underrepresented in the S&E workforce, but less so than in the past.
In 2013, women constituted 50% of the college-educated workforce, 39% of employed individuals whosehighest degree was in an S&E field, and 29% of those in S&E occupations. The corresponding 1993 shareswere 43%, 31%, and 23%, respectively.

Chapter 3. Science and Engineering Labor Force
3 | 7National Science Board | Science & Engineering Indicators 2016
Women employed in S&E occupations are concentrated in different occupational categories than men,with relatively high proportions in social sciences (62%) and life sciences (48%) and relatively lowproportions in engineering (15%), physical sciences (31%), and computer and mathematical sciences(25%).
Historically underrepresented racial and ethnic groups, particularly blacks and Hispanics, continue tobe part of the S&E workforce at rates lower than their presence in the U.S. population, whereasAsians and foreign-born individuals are represented in the S&E workforce at higher rates.
Hispanics, blacks, and American Indians or Alaska Natives together make up 27% of the U.S. populationage 21 and older but a much smaller proportion of the S&E workforce: 14% of S&E highest degreeholders and 11% of workers in S&E occupations.Conversely, Asians make up 5% of the U.S. population age 21 and older but account for 17% of thoseemployed in S&E occupations. Asians have a large presence in engineering and computer sciencesoccupations, particularly among computer software and hardware engineers, software developers,bioengineers or biomedical engineers, and postsecondary teachers in engineering.About 70% of workers in S&E occupations are non-Hispanic whites, which is comparable to their overallrepresentation in the U.S. population age 21 and older (66%).Foreign-born individuals account for 27% of all workers in S&E occupations, which is substantially higherthan their share of the entire college-educated workforce (15%).Foreign-born workers employed in S&E occupations tend to have higher levels of education than theirU.S. native-born counterparts.
A variety of indicators point to a decline, albeit temporary, in the immigration of scientists andengineers during the 2007–09 economic downturn.
Declines in temporary work visas issued to high-skill workers during the 2007–09 economic downturnhave reversed in recent years. Issuance of new H-1B visas has shown continued increase since 2009 andby 2014 exceeded the pre-recession levels. In some other temporary work visa categories, however, theissuance of new visas in 2014 remained below pre-recession levels.After rising for most of the decade 2000–09, the number of foreign recipients of U.S. S&E doctoraldegrees declined in 2009 and 2010. It has risen since 2011 and now exceeds pre-recession levels.About two-thirds of temporary visa holders earning a U.S. S&E doctorate remain in the United States atleast 5 years. This proportion reached 67% in 2005, declined during the economic downturn, and thenrose to 66% in 2011.
Global S&E Labor Force
Worldwide, the number of workers engaged in research has been growing.
Among countries with large numbers of researchers—defined as workers engaged in the creation anddevelopment of new knowledge, products, and processes—growth since 2000 has been most rapid inChina and South Korea.The United States and the European Union experienced steady growth but at lower rates than China orSouth Korea.Russia and, to some extent, Japan were exceptions to the worldwide trend. Between 2000 and 2013, thenumber of researchers in Japan rose very slightly; in Russia, the number declined.

Chapter 3. Science and Engineering Labor Force
3 | 8National Science Board | Science & Engineering Indicators 2016
Introduction
Chapter Overview
Policymakers and scholars consistently emphasize innovation based on S&E research and development as a vehiclefor a nation’s economic growth and global competitiveness. In the increasingly interconnected 21st century world,workers with S&E expertise are integral to a nation’s innovative capacity because of their high skill level, theircreative ideas, and their ability not only to advance basic scientific knowledge but also to transform advances infundamental knowledge into tangible and useful products and services. As a result, these workers make importantcontributions to improving living standards and accelerating the pace of a nation’s economic and productivitygrowth.
Chapter Organization
The U.S. workforce includes both individuals employed in S&E occupations and individuals educated in S&E fieldsbut employed in a variety of non-S&E occupations. Many more individuals have S&E degrees than work in S&Eoccupations. Indicative of a knowledge-based economy, many individuals in non-S&E occupations reported thattheir work nevertheless requires a bachelor’s degree level of S&E expertise. Therefore, the first section in thischapter, “U.S. S&E Workforce: Definition, Size, and Growth,” discusses the S&E workforce based on threemeasures: workers in S&E occupations, holders of S&E degrees, and use of S&E technical expertise on the job. Thissection also discusses the interplay between educational background and occupational choice.
The second section in this chapter, “S&E Workers in the Economy,” examines the distribution of S&E workers acrossemployment sectors. It describes the distribution of S&E workers across sectors (e.g., business, education,government) as well as within particular sectors (e.g., local, state, and federal government). This section alsopresents data on geographic distribution of S&E employment in the United States. Data on R&D activity andwork-related training by S&E workers are also discussed.
The third section, “S&E Labor Market Conditions,” looks at labor market outcomes for S&E workers. Data in thissection focus on earnings and unemployment, with a particular focus on recent S&E graduates.
The next three sections cover labor force demographics. “Age and Retirement of the S&E Workforce” presents dataon the age distribution and retirement patterns of S&E workers. “Women and Minorities in the S&E Workforce”focuses on S&E participation by women and by racial and ethnic minorities; this section also presents data onsalary differences by sex and by race and ethnicity. “Immigration and the S&E Workforce” presents data on S&Eparticipation by foreign-born individuals in the United States.
The final section in this chapter is “Global S&E Labor Force.” Although there are indications that the global S&Elabor force has grown, international data on the characteristics of this broader labor force are particularly limitedand are not always comparable with data for the United States. In this final section, data from the Organisation forEconomic Co-operation and Development (OECD) are used to present indicators of worldwide R&D employment.
This chapter uses a variety of data sources, including, but not limited to, the National Science Foundation’s (NSF’s)Scientists and Engineers Statistical Data System (SESTAT), the Census Bureau’s American Community Survey(ACS), the Occupational Employment Statistics (OES) survey administered by the Bureau of Labor Statistics (BLS),and the Current Population Survey (CPS) sponsored jointly by the Census Bureau and BLS. Different sources coverdifferent segments of the population and different levels of detail on the various topics. (See andTable 3-1

Chapter 3. Science and Engineering Labor Force
3 | 9National Science Board | Science & Engineering Indicators 2016
sidebar, ) Although data collection methods and definitionsNSF's Scientists and Engineers Statistical Data Systemcan differ across surveys in ways that affect estimates, combining data from different sources facilitates anaccurate and comprehensive picture of the very specialized S&E workforce. A particular measure or categorizationof the workforce may be better suited for addressing some questions than others, and a particular data source maynot include information in every category. Analyses of long-term trends, international trends, and comparison ofS&E and non-S&E workers are discussed whenever data are available.
NSF's Scientists and Engineers Statistical Data System
NSF's Scientists and Engineers Statistical Data System (SESTAT) provides detailed employment, education,and demographic data for scientists and engineers under age 76 residing in the United States. SESTATcurrently defines scientists and engineers as individuals who have college degrees in S&E or S&E-relatedfields or who are working in S&E or S&E-related occupations. (See for definitions of S&E andTable 3-2S&E-related occupations.) Unless otherwise noted, this chapter uses the term “scientists and engineers” torefer to this broad SESTAT population and the term “college graduates” to refer to the population with atleast a bachelor’s level degree. Data available through SESTAT are collected by two large demographic andworkforce surveys of individuals conducted by NSF: the National Survey of College Graduates (NSCG) andthe Survey of Doctorate Recipients (SDR). SESTAT integrates the data from the two surveys, and togetherthe data provide a comprehensive picture of scientists and engineers in the United States.
The NSCG is the central component of SESTAT, providing data that detail the characteristics of the entirebachelor’s degree holder population in the United States (regardless of their S&E background). Itspopulation of college graduates includes individuals trained as scientists and engineers who hold at least abachelor's degree. Because it covers the entire college graduate population residing in the United States,the NSCG provides information on individuals educated or employed in S&E fields as well as those educatedor employed in non-S&E fields. The data presented in this chapter for all college graduates (regardless ofS&E background) are mostly based on the NSCG.
Whereas NSCG data cover the general college-educated population, the SDR data add to SESTAT doctoralscientists and engineers who earned their research doctoral degree in a science, engineering, or health(SEH) field from a U.S. academic institution. The SDR is a longitudinal biennial survey that has beenconducted since 1973. The survey follows a sample of SEH doctoral degree holders from the year of theirU.S. doctoral degree award until age 76. The panel is refreshed each survey cycle with a sample of newSEH doctoral degree recipients.
For more information on SESTAT, see http://www.nsf.gov/statistics/sestat/
Table 3-1 Major sources of data on the U.S. labor force
Data source Data collectionagency
Datayears
Major topics Respondent Coverage
Workeroccupation
All full-time andpart-time wage and

Chapter 3. Science and Engineering Labor Force
3 | 10National Science Board | Science & Engineering Indicators 2016
Data source Data collectionagency
Datayears
Major topics Respondent Coverage
Occupational EmploymentStatistics (OES), http://www.bls.gov/oes/
Department ofLabor, Bureau ofLabor Statistics
Through2014
Salary Industry Employerlocation(national,state,metropolitanstatisticalarea)
Employingorganizations
salary workers innonfarm industries;does not coverself-employed,owners and partnersin unincorporatedfirms, householdworkers, or unpaidfamily workers
Scientists and EngineersStatistical Data System, http://sestat.nsf.gov. See sidebar"NSF's Scientists andEngineers Statistical DataSystem"
National ScienceFoundation,National Centerfor Science andEngineeringStatistics
Through2013
Employmentstatus Occupation Jobcharacteristics(workactivities,technicalexpertise) Salary Detailededucationalhistory Demographiccharacteristics
Individuals
Individuals withbachelor’s degree orhigher in S&E orS&E-related field orwith non-S&Edegrees but workingin S&E orS&E-relatedoccupation
American Community Survey(ACS), http://www.census.gov/acs/www/
Department ofCommerce,Census Bureau
Through2013
Employmentstatus Occupation Firstbachelor’sdegree field Educationalattainment Demographiccharacteristics
Households U.S. population
Employmentstatus
Chapter 3. Science and Engineering Labor Force
3 | 11National Science Board | Science & Engineering Indicators 2016
Data source Data collectionagency
Datayears
Major topics Respondent Coverage
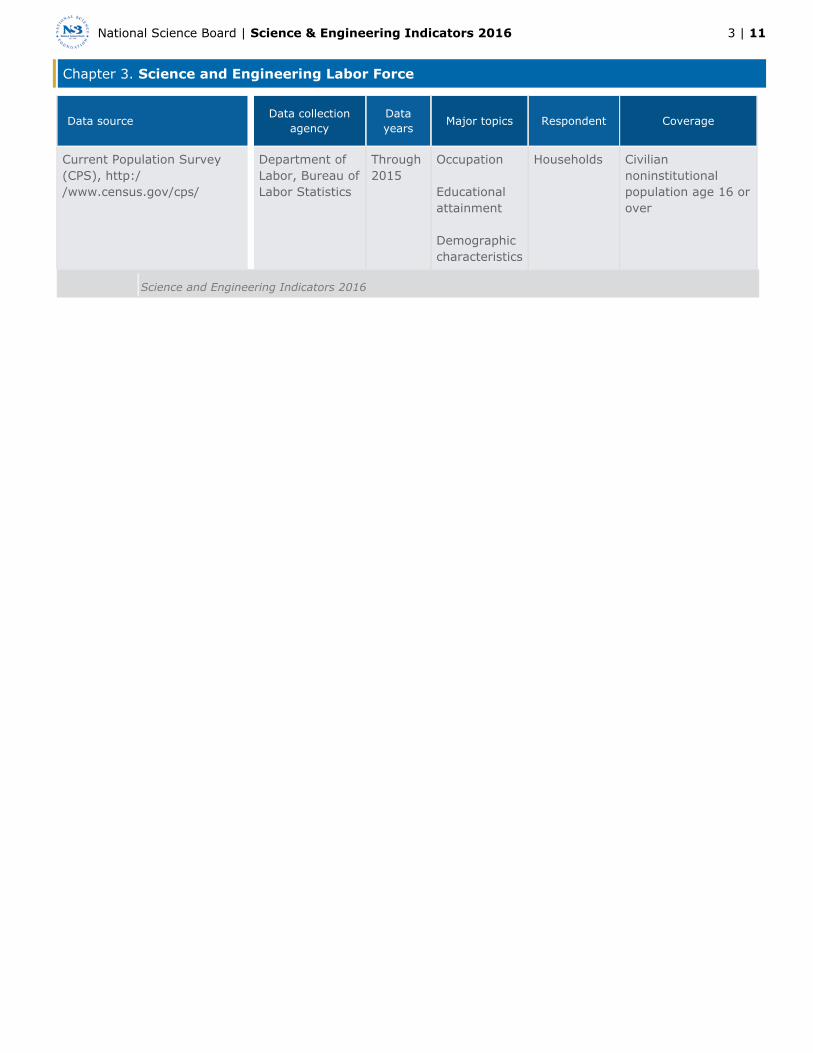
Current Population Survey(CPS), http://www.census.gov/cps/
Department ofLabor, Bureau ofLabor Statistics
Through2015
Occupation Educationalattainment Demographiccharacteristics
Households Civiliannoninstitutionalpopulation age 16 orover
Science and Engineering Indicators 2016

Chapter 3. Science and Engineering Labor Force
3 | 12National Science Board | Science & Engineering Indicators 2016
U.S. S&E Workforce: Definition, Size, and Growth
Definition of the S&E Workforce
Because there is no standard definition of S&E workers, this section presents multiple categorizations for measuring
the size of the S&E workforce. In general, this section defines the S&E workforce to include people who either[i]
work in S&E occupations or hold S&E degrees. However, the application of S&E knowledge and skills is not limitedto jobs classified as S&E; the number of workers reporting that their jobs require at least a bachelor’s degree levelof knowledge in one or more S&E fields exceeds the number of jobs in the economy with a formal S&E label.Therefore, this section also presents data on the use of S&E technical expertise on the job to provide an estimate ofthe S&E workforce. The estimated number of scientists and engineers varies based on the criteria applied to definethe S&E workforce.
U.S. federal occupation data classify workers by the activities or tasks they primarily perform in their jobs. The NSFand Census Bureau occupational data in this chapter come from federal statistical surveys in which individuals orhousehold members provide information about job titles and work activities. This information is used to classify
jobs into standard occupational categories based on the Standard Occupational Classification (SOC) system. In[ii]
contrast, the BLS-administered OES survey relies on employers to classify their workers using SOC definitions.Differences between employer- and individual-provided information can affect the content of occupational data.
NSF has developed a widely used set of SOC categories that it calls . Very broadly, theseS&E occupationsoccupations include life scientists, computer and mathematical scientists, physical scientists, social scientists, andengineers. NSF also includes postsecondary teachers of these fields in S&E occupations. A second category ofoccupations, , includes health-related occupations, S&E managers, S&E technicians andS&E-related occupationstechnologists, architects, actuaries, S&E precollege teachers, and postsecondary teachers in S&E-related fields. TheS&E occupations are generally assumed to require at least a bachelor’s degree level of education in an S&E field.The vast majority of S&E-related occupations also require S&E knowledge or training, but an S&E bachelor’s degreemay not be a required credential for employment in some of these occupations. Examples include healthtechnicians and computer network managers. Other occupations, although classified as maynon-S&E occupations,include individuals who use S&E technical expertise in their work. Examples include technical writers who editscientific publications and salespeople who sell specialized research equipment to chemists and biologists. The NSFoccupational classification of S&E, S&E-related, and non-S&E occupations appears in along with the NSFTable 3-2educational classification of S&E, S&E-related, and non-S&E degree fields.
[i] The standard definition of the term is a subset of the population that includes both those who arelabor forceemployed and those who are not working but seeking work (unemployed); other individuals are not considered tobe in the labor force. Unless otherwise noted, when data refer only to employed persons, the term isworkforceused. For data on unemployment rates by occupation, calculations assume that unemployed individuals are seekingfurther employment in their most recent occupation.
[ii] The SOC is used by federal statistical agencies to classify workers into occupational categories for the purpose ofcollecting, calculating, and disseminating data. Detailed information on the SOC is available at http://www.bls.gov/SOC/.

Chapter 3. Science and Engineering Labor Force
3 | 13National Science Board | Science & Engineering Indicators 2016
Table 3-2 Classification of degree fields and occupations
Occupation
classification
Classification Degree field Occupation STEM S&T
S&E Biological, agricultural, andenvironmental life sciences
Biological, agricultural, andenvironmental life scientists
X X
Computer and mathematical sciences Computer and mathematical scientists X X
Physical sciences Physical scientists X X
Social sciences Social scientists X X
Engineering Engineers X X
S&E postsecondary teachers
S&E-related Health fields Health-related occupations
Science and math teacher education S&E managers X
S&E precollege teachers
Technology and technical fields S&E technicians and technologists X X
Architecture Architects
Actuarial science Actuaries
S&E-related postsecondary teachers
Non-S&E Management and administration Non-S&E managers
Management-related occupations
Education (except science and mathteacher education)
Non-S&E precollege teachers
Non-S&E postsecondary teachers
Social services and related fields Social services occupations
Sales and marketing Sales and marketing occupations
Arts and humanities Arts and humanities occupations
Other fields Other occupations
S&T = science and technology; STEM = science, technology, engineering, and mathematics.
NOTES: The designations STEM and S&T refer to occupations only. For more detailed classification of occupations anddegrees by S&E, S&E-related, and non-S&E, see National Science Foundation, National Center for Science andEngineering Statistics, Scientists and Engineers Statistical Data System (SESTAT), http://sestat.nsf.gov.
Science and Engineering Indicators 2016
Indicative of a knowledge-based economy, the number of individuals who have S&E training or who reportedapplying S&E technical expertise in their jobs exceeds the number of individuals employed in jobs that are

Chapter 3. Science and Engineering Labor Force
3 | 14National Science Board | Science & Engineering Indicators 2016
categorized as S&E. As such, a relatively narrow definition of the S&E workforce consists of workers in occupationsthat NSF designates as S&E occupations. In comparison, a much broader definition of an S&E worker, utilized byNSF’s SESTAT, includes any individual with a bachelor’s or higher level degree in an S&E or S&E-related field ofstudy or a college graduate in any field employed in an S&E or S&E-related occupation. (See sidebar, NSF's
.) As noted earlier, the S&E workforce may also be defined by theScientists and Engineers Statistical Data Systemtechnical expertise or training required to perform a job. Unlike information on occupational categories oreducational credentials, information on the use of technical knowledge, skills, or expertise in a person’s job reflects
that individual’s subjective opinion about the content and characteristics of the job. The next section provides[iii]
estimates of the size of the S&E workforce using all three definitions.
Other general terms, including science, technology, engineering, and mathematics (STEM), science and technology(S&T), and science, engineering, and technology (SET), are often used to designate the part of the labor force thatworks with S&E. These terms are broadly equivalent and have no standard definition.
[iii] As expected, this subjective measure varies across occupations. For example, in 2013, among postsecondaryteachers of chemistry, 96% said that their job required at least a bachelor’s degree level of knowledge inengineering, computer sciences, mathematics, or natural sciences. Among postsecondary teachers of businesscommerce or marketing, 84% said that their job required at least this level of expertise in other fields such ashealth, business, or education. Among the SESTAT population whose occupation is secretary/receptionist/typist,only about 5% said that their job required a bachelor’s degree level of knowledge in engineering, computersciences, mathematics, or natural sciences; about 5% said that their job required at least a bachelor’s degree levelof knowledge in social sciences; and 17% said that their job required at least a bachelor’s degree level of expertisein other fields such as health, business, or education.
Size of the S&E Workforce
When defined by occupation, the S&E workforce totals between 6.2 million and 6.3 million people according to themost recent estimates ( ). Those in S&E occupations who had at least a bachelor’s degree are estimatedTable 3-3
at between 4.6 million and 5.7 million ( ). By far the largest categories of S&E occupations are inTable 3-3 [i]
computer and mathematical sciences and engineering, which together account for about 73% (amongcollege-educated workers) to 84% (among workers of all education levels) of all employed workers in S&Eoccupations ( ). Occupations in life, social, and physical sciences each employ a smaller proportion ofFigure 3-1S&E workers.
[i] Estimates of the size of the S&E workforce may vary across the different surveys because of differences in thescope of the data collection (SESTAT surveys collect data from individuals with at least a bachelor’s degree);because of the type of survey respondent (SESTAT surveys collect data from individuals, OES collects data fromemployers, and ACS collects data from households); or because of the level of detail collected on an occupation,which aids in classifying a reported occupation into a standard occupational category. For example, the SESTATestimate of the number of workers in S&E occupations includes postsecondary teachers of S&E fields; however,postsecondary teachers in ACS are grouped under a single occupation code regardless of field and are therefore notincluded in the ACS estimate of the number of workers in S&E occupations.

Chapter 3. Science and Engineering Labor Force
3 | 15National Science Board | Science & Engineering Indicators 2016
Table 3-3 Measures and size of U.S. S&E workforce: 2013 and 2014
MeasureEducationcoverage
Data sourceNumber ofindividuals
Occupation
Employed in S&E occupations All educationlevels
2014 BLS OES Survey 6,319,000
Employed in S&E occupations Bachelor’s andabove
2013 NSF/NCSESSESTAT
5,749,000
Employed in S&E occupations All educationlevels
2013 Census BureauACS
6,197,000
Employed in S&E occupations Bachelor’s andabove
2013 Census BureauACS
4,630,000
Education
At least one degree in S&E field Bachelor’s andabove
2013 NSF/NCSESSESTAT
21,121,000
Highest degree in S&E field Bachelor’s andabove
2013 NSF/NCSESSESTAT
15,811,000
Job closely related to highest degree Bachelor’s andabove
2013 NSF/NCSESSESTAT
5,847,000
S&E occupation Bachelor’s andabove
2013 NSF/NCSESSESTAT
3,033,000
Other occupation Bachelor’s andabove
2013 NSF/NCSESSESTAT
2,814,000
Job somewhat related to highest degree Bachelor’s andabove
2013 NSF/NCSESSESTAT
3,716,000
S&E occupation Bachelor’s andabove
2013 NSF/NCSESSESTAT
1,050,000
Other occupation Bachelor’s andabove
2013 NSF/NCSESSESTAT
2,665,000
Job requires S&E technical expertise at bachelor’slevel
In one or more S&E fields Bachelor’s andabove
2013 NSF/NCSESSESTAT NSCG
17,655,000
Engineering, computer science, mathematics,or natural sciences
Bachelor’s andabove
2013 NSF/NCSESSESTAT NSCG
12,649,000
Social sciences Bachelor’s andabove
2013 NSF/NCSESSESTAT NSCG
8,094,000
ACS = American Community Survey; BLS = Bureau of Labor Statistics; NSCG = National Survey of CollegeGraduates; NSF/NCSES = National Science Foundation, National Center for Science and Engineering Statistics;OES = Occupational Employment Statistics; SESTAT = Scientists and Engineers Statistical Data System.
NOTES: Estimates of the S&E workforce vary across the example surveys because of differences in the scope of thedata collection (SESTAT surveys collect data from individuals with bachelor’s degrees and above only);

Chapter 3. Science and Engineering Labor Force
3 | 16National Science Board | Science & Engineering Indicators 2016
because of the survey respondent (SESTAT surveys collect data from individuals, OES collects data fromestablishments, and ACS collects data from households); or because of the level of detail collected on anoccupation, which aids in classifying a reported occupation into a standard occupational category. All of thesedifferences can affect the estimates. For example, the SESTAT estimate of the number of workers in S&Eoccupations includes postsecondary teachers of S&E fields; however, postsecondary teachers in ACS aregrouped under a single occupation code regardless of field and are therefore not included in the ACS estimate
of the number of workers in S&E occupations. The total for "at least one degree in S&E field" and "highestdegree in S&E field" includes individuals who are employed as well as those who are unemployed and out ofthe labor force.
SOURCES: BLS, OES Survey (2014); Census Bureau, ACS (2013); NSF/NCSES, NSCG (2013) and SESTAT (2013)integrated file.
Science and Engineering Indicators 2016

Chapter 3. Science and Engineering Labor Force
3 | 17National Science Board | Science & Engineering Indicators 2016
Figure 3-1
Employment in S&E occupations, by broad occupational category: 2013 and 2014
SOURCES: Bureau of Labor Statistics, Occupational Employment Statistics Survey, 2014; National Science Foundation,National Center for Science and Engineering Statistics, Scientists and Engineers Statistical Data System (SESTAT) (2013),http://sestat.nsf.gov.
Science and Engineering Indicators 2016
As noted earlier, S&E degree holders greatly outnumber those currently employed in S&E occupations. In 2013,about 21 million college graduates in the United States had a bachelor’s or higher level degree in an S&E field ofstudy ( ). About three-fourths of these college graduates (15.8 million) attained their highest degree—aTable 3-3bachelor’s, master’s, professional, or doctorate—in an S&E field (in this chapter, these individuals are referred to asS&E highest degree holders). An individual’s highest degree is often an accurate representation of the skills andcredentials that one employs in the labor market, which is why the data presented in this chapter by educationalattainment are generally provided for highest degree. Overall, across all S&E highest degrees, social sciences and
engineering were the most common degree fields ( ). The 15.8 million with an S&E highest degreeFigure 3-2 [ii]
includes 11.4 million with bachelor’s degrees, 3.3 million with master’s degrees, 1.0 million with doctorates, and52,000 with professional degrees.
[ii] Among those with doctorates in an S&E field, life sciences and social sciences were the most common fields,followed by physical sciences, engineering, and computer and mathematical sciences.

Chapter 3. Science and Engineering Labor Force
3 | 18National Science Board | Science & Engineering Indicators 2016
Figure 3-2
S&E degrees among college graduates, by field and level of highest degree: 2013
NOTE: All degree levels includes professional degrees not shown separately.
SOURCE: National Science Foundation, National Center for Science and Engineering Statistics, Scientists and EngineersStatistical Data System (SESTAT) (2013), http://sestat.nsf.gov.
Science and Engineering Indicators 2016
A majority of S&E degree holders (60%) reported that their job was either closely or somewhat related to their fieldof highest degree ( ). Because many of these individuals were employed in occupations not categorizedTable 3-3as S&E, this suggests that the application of S&E knowledge and skills is widespread across the U.S. economy andnot limited to occupations classified as S&E.
The extensive use of S&E expertise in the workplace is also evident from the number of college graduates whoindicate that their job requires technical expertise at the bachelor’s degree level in S&E fields. According to the2013 National Survey of College Graduates (NSCG), nearly 17.7 million college graduates reported that their jobsrequired at least this level of technical expertise in one or more S&E fields ( ); this figure is almost threeTable 3-3times as large as the nearly 6 million college graduates employed in S&E occupations.
Growth of the S&E Workforce
The S&E workforce has grown faster over time than the overall workforce. According to Census Bureau data,
employment in S&E occupations grew from about 1.1 million in 1960 to about 6.2 million in 2013 ( ).Figure 3-3 [i]
This represents an average annual growth rate of 3%, compared to a 2% growth rate in total employment duringthis period. S&E occupational employment as a share of total employment doubled: from about 2% in 1960 to

Chapter 3. Science and Engineering Labor Force
3 | 19National Science Board | Science & Engineering Indicators 2016
about 4% in 2013. See sidebar, for BLS data onProjected Growth of Employment in S&E Occupationsoccupational projections for the period 2012–22.
[i] The data on S&E employment levels for 1960 and 2013 are calculated using the Census Bureau’s 1960 DecennialCensus and 2013 American Community Survey (ACS) microdata, respectively, adjusted by the Integrated PublicUse Microdata Series (IPUMS) from the University of Minnesota’s Minnesota Population Center (http://www.ipums.org). Occupational classification systems have changed over time, which limits the comparability ofoccupational counts over time. For example, computer occupations were not present in the occupationalclassification system used in 1960. For more information on the change in occupational classification systems, seeWyatt and Hecker's report, "Occupational Changes During the 20th Century" ( , March 2006).Monthly Labor ReviewS&E employment levels for 1960 and 2013 include workers at all education levels and do not include S&Epostsecondary teachers. Although the 1960 Decennial Census data allow for separate identification of S&Epostsecondary teachers, the 2013 ACS data aggregate all postsecondary teachers into one occupation code andtherefore do not allow for separate identification of S&E postsecondary teachers. For 1960, including S&Epostsecondary teachers would increase the number of workers employed in S&E occupations to nearly 1.2 million.See Appendix Table 3-1 for a list of S&E occupations in the 1960 Decennial Census and 2013 ACS.
Projected Growth of Employment in S&E Occupations
This sidebar presents the most recent data from the Bureau of Labor Statistics (BLS) on occupationalprojections for the period 2012–22. While interpreting the data, it should be kept in mind that employmentprojections are uncertain. Many industry and government decisions that affect hiring are closely linked tonational and global fluctuations in aggregate economic activity, which are difficult to forecast long inadvance. In addition, technological and other innovations will influence demand for workers in specificoccupations. The assumptions underlying projections are sensitive to fundamental empirical relationships,and, as a result, may become less accurate as overall economic conditions change.*
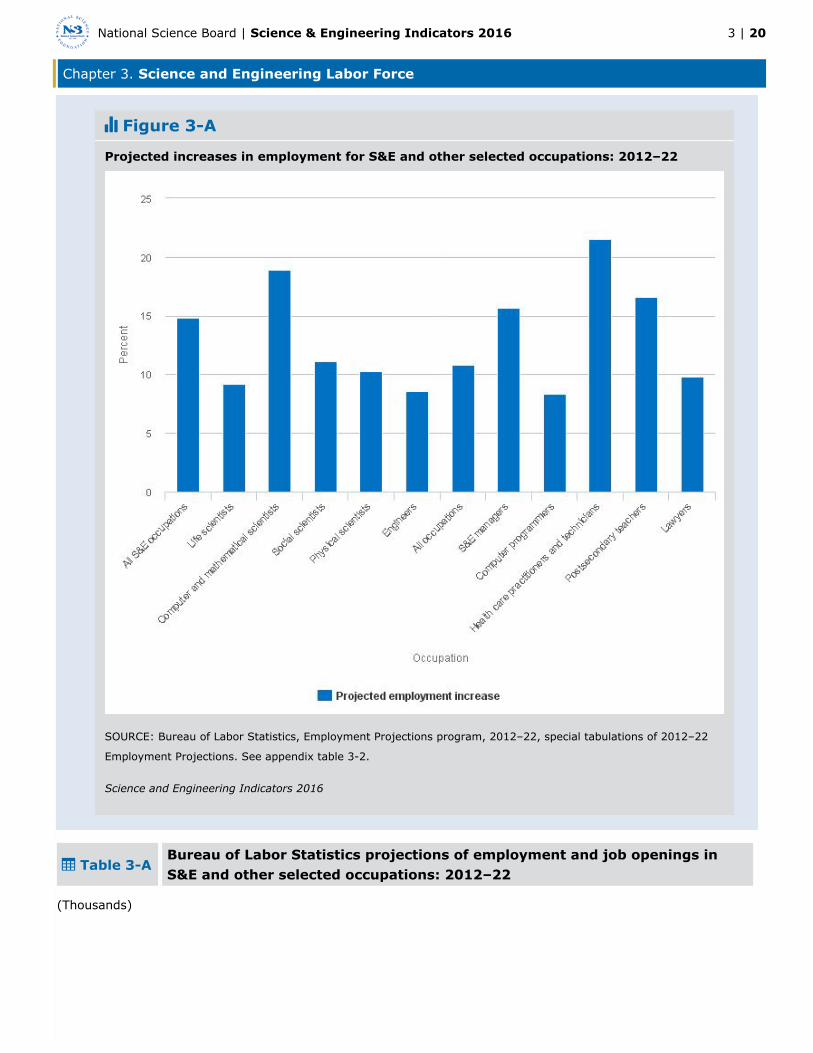
BLS occupational projections for the period 2012–22 suggest that total employment in occupations thatNSF classifies as S&E will increase at a faster rate (15%) than employment in all occupations (11%) (
; ). These projections are based only on the demand for narrowly defined S&EFigure 3-A Table 3-Aoccupations and do not include the wider range of occupations in which S&E degree holders often use theirtraining.
Chapter 3. Science and Engineering Labor Force
3 | 20National Science Board | Science & Engineering Indicators 2016
Figure 3-A
Projected increases in employment for S&E and other selected occupations: 2012–22
SOURCE: Bureau of Labor Statistics, Employment Projections program, 2012–22, special tabulations of 2012–22
Employment Projections. See appendix table 3-2.
Science and Engineering Indicators 2016
Table 3-ABureau of Labor Statistics projections of employment and job openings inS&E and other selected occupations: 2012–22
(Thousands)

Chapter 3. Science and Engineering Labor Force
3 | 21National Science Board | Science & Engineering Indicators 2016
Occupation
BLS National
Employment
Matrix 2012
estimate
BLS
projected
2022
employment
Job openings from
growth and net
replacements,
2012–22
10-year
growth in
total
employment
(%)
10-year job
openings as
percentage of 2012
employment
All occupations 145,356 160,984 50,557 10.8 34.8
All S&E 5,914 6,791 2,047 14.8 34.6
Computer andmathematicalscientists
3,445 4,096 1,177 18.9 34.2
Life scientists 295 322 105 9.2 35.6
Physicalscientists
297 328 111 10.3 37.2
Socialscientists
287 319 110 11.1 38.3
Engineers 1,590 1,726 544 8.6 34.2
S&E-relatedoccupations
S&E managers 894 1,034 321 15.7 35.9
S&Etechniciansandtechnologists
1,126 1,183 331 5.1 29.4
Computerprogrammers
344 372 118 8.3 34.4
Health carepractitionersandtechnicians
8,050 9,783 3,378 21.5 42.0
Selected otheroccupations
Postsecondaryteachers
1,831 2,135 579 16.6 31.6
Lawyers 760 835 197 9.8 25.9
BLS = Bureau of Labor Statistics.
NOTES: Estimates of current and projected employment for 2012–22 are from BLS’s National Employment Matrix; data
in the matrix are from the Occupational Employment Statistics (OES) Survey and the Current Population
Survey (CPS). Together, these sources cover paid workers, self-employed workers, and unpaid family workers

Chapter 3. Science and Engineering Labor Force
3 | 22National Science Board | Science & Engineering Indicators 2016
in all industries, agriculture, and private households. Because data are derived from multiple sources, they can
often differ from employment data provided by OES Survey, CPS, or other employment surveys alone. BLS
does not make projections for S&E occupations as a group and some of the S&E and S&E-related occupational
categories as defined by the National Science Foundation (NSF); numbers in the table are based on the sum of
BLS projections for occupations that the NSF includes in the respective categories. See appendix table 3-2.
SOURCE: BLS, Employment Projections program, 2012–22, special tabulations of 2012–22 Employment Projections.
Science and Engineering Indicators 2016
During the period 2012–22, job openings in NSF-identified S&E occupations are projected to representabout one-third (35%) of current employment in 2012, which is similar to the proportion of job openings inall occupations (35%) ( ). Job openings include both new jobs and openings caused by workersFigure 3-Bpermanently leaving the occupations.

Chapter 3. Science and Engineering Labor Force
3 | 23National Science Board | Science & Engineering Indicators 2016
Figure 3-B
Projected job openings in S&E and other selected occupations: 2012–22
SOURCE: Bureau of Labor Statistics, Employment Projections program, 2012–22, special tabulations of 2012–22
Employment Projections. See appendix table 3-2.
Science and Engineering Indicators 2016
Of the BLS-projected net job openings in NSF-identified S&E occupations, 57% are projected to be incomputer and mathematical sciences occupations, the largest subcategory of S&E occupations (Table 3-A). This occupational group also has the largest projected growth rate (19%) among NSF-identified S&Egroups. Engineering occupations, the second largest subcategory of S&E occupations, are expected togenerate about one-fourth (27%) of all job openings in S&E occupations during the period 2012–22;however, the growth rate in these occupations (9%) is projected to be lower than the growth rate for alloccupations (11%). The other broad categories of S&E occupations—life sciences, social sciences, andphysical sciences occupations—account for much smaller proportions of S&E occupations and are projected

Chapter 3. Science and Engineering Labor Force
3 | 24National Science Board | Science & Engineering Indicators 2016
to have a growth rate between 9% and 11%. Job openings in the broad categories of S&E occupations areprojected to represent relatively similar proportions of current employment in their respective fields,ranging from 34% to 38%.
In addition to S&E occupations, also shows selected other occupations that contain significantTable 3-Anumbers of S&E-trained workers. Among these occupations, the health care practitioners and techniciansgroup, which employs more workers than all S&E occupations combined, is projected to grow 22%, doublethe growth rate for all occupations. The postsecondary teachers group, which includes all fields ofinstruction, and the S&E managers group are projected to grow 17% and 16%, respectively, both of whichare slightly higher than the 15% projected growth rate for all S&E occupations. In contrast, BLS projectsthat the computer programmers group and the S&E technicians and technologists group will grow moreslowly than all S&E occupations.
*The mean absolute percentage error in the 1996 BLS projection of 2006 employment in detailedoccupations was 17.6% (Wyatt 2010). The inaccuracies in the 1996 projection of 2006 employment wereprimarily the result of not anticipating the housing bubble or increases in oil prices (Wyatt 2010).

Chapter 3. Science and Engineering Labor Force
3 | 25National Science Board | Science & Engineering Indicators 2016
Figure 3-3
Individuals employed in S&E occupations in the United States: Selected years, 1960–2013
NOTE: Data include people at all education levels.
SOURCES: Census Bureau, Decennial Census (1960–2000) and American Community Survey (2013) microdata, downloadedfrom the Integrated Public Use Microdata Series (IPUMS), University of Minnesota (http://www.ipums.org).
Science and Engineering Indicators 2016
Data from recent years indicate that trends in S&E employment compared favorably to overall employment trendsduring and after the 2007–09 economic downturn. Occupation-based estimates from BLS indicate that the size ofthe S&E workforce stayed relatively steady between May 2008 (5.8 million) and May 2011 (5.8 million) and thenrose to 6.3 million by May 2014. The broader STEM workforce—including S&E technicians and managers—by May2014 (8.2 million) had surpassed its previous 2008 (7.9 million) high. In contrast, the total workforce declined from135 million in May 2008 to 128 million in May 2011 and then rose to 135 million by May 2014, similar to the 2008level.
The growth in the number of individuals with S&E degrees in recent years can be examined using data fromSESTAT. The total number of S&E highest degree holders employed in the United States grew from 9.6 million to12.4 million between 2003 and 2013, reflecting a 2.7% annual average growth rate. Most broad S&E degree fieldsexhibited growth ( ). (See chapter 2 for a fuller discussion of S&E degrees.)Figure 3-4

Chapter 3. Science and Engineering Labor Force
3 | 26National Science Board | Science & Engineering Indicators 2016
Figure 3-4
Average annual growth in the total number of employed individuals with highest degree in S&E, byfield and level of highest degree: 2003–13
SOURCE: National Science Foundation, National Center for Science and Engineering Statistics, Science and EngineeringStatistical Data System (SESTAT) (2003, 2013), http://sestat.nsf.gov.
Science and Engineering Indicators 2016
A number of factors have contributed to the growth in the S&E labor force over time: the rising demand for S&Eskills in a global and highly technological economic landscape; increases in U.S. S&E degrees earned by women, byracial and ethnic minority groups, and by foreign-born individuals; temporary and permanent migration to theUnited States of those with foreign S&E educations; and the rising number of scientists and engineers who aredelaying their retirement. The demographic sections of this chapter provide data on aging and retirement patternsof scientists and engineers as well as on S&E participation by women, by racial and ethnic minorities, and byforeign-born individuals.
Educational Distribution of Workers in S&E Occupations
Workers in S&E occupations have undergone more formal training than the general workforce ( ). DataFigure 3-5from the 2013 ACS indicate that a larger proportion of workers in S&E occupations (75%) (excluding postsecondary
teachers) hold a bachelor’s or higher degree than workers in all other occupations (31%). The proportion of[i]
workers with advanced degrees beyond the bachelor’s level is 31% in S&E occupations, compared to 11% in allother occupations. About 7% of all S&E workers (again excluding postsecondary teachers) have doctorates.

Chapter 3. Science and Engineering Labor Force
3 | 27National Science Board | Science & Engineering Indicators 2016
[i] Many comparisons using Census Bureau data on occupations are limited to looking at all S&E occupations exceptpostsecondary teachers because the Census Bureau aggregates all postsecondary teachers into one occupationcode. NSF surveys of scientists and engineers and some BLS surveys collect data on postsecondary teachers byfield.

Chapter 3. Science and Engineering Labor Force
3 | 28National Science Board | Science & Engineering Indicators 2016
Figure 3-5
Educational attainment, by type of occupation: 2013
GED = General Equivalency Diploma.
SOURCE: Census Bureau, American Community Survey (2013).
Science and Engineering Indicators 2016
Compared with the rest of the workforce, very few of those employed in S&E occupations have only a high schooldegree. However, many individuals enter the S&E workforce with marketable technical skills from technical orvocational schools (with or without an earned associate’s degree) or college courses; some also acquire these skillsthrough workforce experience or on-the-job training. In information technology, and to some extent in otheroccupations, employers frequently use certification exams, not formal degrees, to judge skills. (See sidebar, S&E
and the discussion on community college in chapter 2 section "InstitutionsWorkers Without a Bachelor's DegreeProviding S&E Education".)
S&E Workers Without a Bachelor's Degree
Although the Scientists and Engineers Statistical Data System (SESTAT) provides detailed information oncollege graduate scientists and engineers, it lacks similar data on individuals who do not have a bachelor’sdegree. In 2013, about 5.7 million workers age 25 and older without a bachelor’s degree were employed inan S&E or S&E-related occupation. Using nationally representative data from the Census Bureau’s AmericanCommunity Survey (ACS), this sidebar looks at the demographic, employment, and educationalbackgrounds of workers without a bachelor’s degree.*
Chapter 3. Science and Engineering Labor Force
3 | 29National Science Board | Science & Engineering Indicators 2016
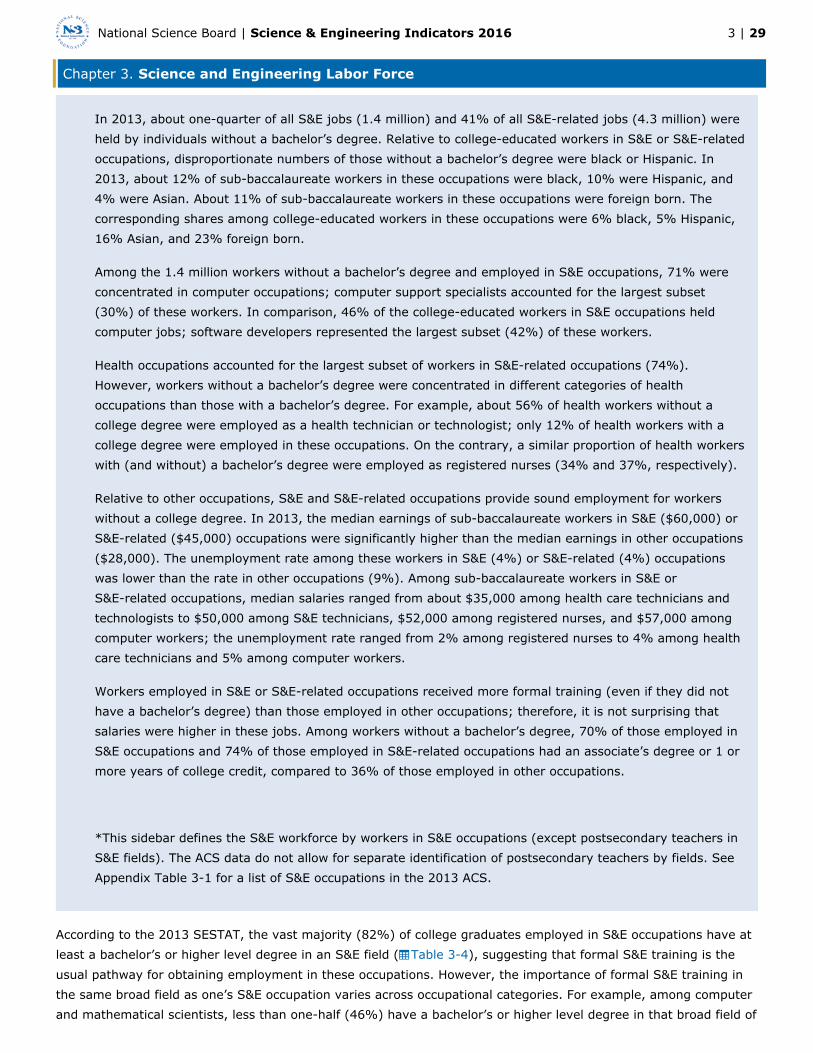
In 2013, about one-quarter of all S&E jobs (1.4 million) and 41% of all S&E-related jobs (4.3 million) wereheld by individuals without a bachelor’s degree. Relative to college-educated workers in S&E or S&E-relatedoccupations, disproportionate numbers of those without a bachelor’s degree were black or Hispanic. In2013, about 12% of sub-baccalaureate workers in these occupations were black, 10% were Hispanic, and4% were Asian. About 11% of sub-baccalaureate workers in these occupations were foreign born. Thecorresponding shares among college-educated workers in these occupations were 6% black, 5% Hispanic,16% Asian, and 23% foreign born.
Among the 1.4 million workers without a bachelor’s degree and employed in S&E occupations, 71% wereconcentrated in computer occupations; computer support specialists accounted for the largest subset(30%) of these workers. In comparison, 46% of the college-educated workers in S&E occupations heldcomputer jobs; software developers represented the largest subset (42%) of these workers.
Health occupations accounted for the largest subset of workers in S&E-related occupations (74%).However, workers without a bachelor’s degree were concentrated in different categories of healthoccupations than those with a bachelor’s degree. For example, about 56% of health workers without acollege degree were employed as a health technician or technologist; only 12% of health workers with acollege degree were employed in these occupations. On the contrary, a similar proportion of health workerswith (and without) a bachelor’s degree were employed as registered nurses (34% and 37%, respectively).
Relative to other occupations, S&E and S&E-related occupations provide sound employment for workerswithout a college degree. In 2013, the median earnings of sub-baccalaureate workers in S&E ($60,000) orS&E-related ($45,000) occupations were significantly higher than the median earnings in other occupations($28,000). The unemployment rate among these workers in S&E (4%) or S&E-related (4%) occupationswas lower than the rate in other occupations (9%). Among sub-baccalaureate workers in S&E orS&E-related occupations, median salaries ranged from about $35,000 among health care technicians andtechnologists to $50,000 among S&E technicians, $52,000 among registered nurses, and $57,000 amongcomputer workers; the unemployment rate ranged from 2% among registered nurses to 4% among healthcare technicians and 5% among computer workers.
Workers employed in S&E or S&E-related occupations received more formal training (even if they did nothave a bachelor’s degree) than those employed in other occupations; therefore, it is not surprising thatsalaries were higher in these jobs. Among workers without a bachelor’s degree, 70% of those employed inS&E occupations and 74% of those employed in S&E-related occupations had an associate’s degree or 1 ormore years of college credit, compared to 36% of those employed in other occupations.
*This sidebar defines the S&E workforce by workers in S&E occupations (except postsecondary teachers inS&E fields). The ACS data do not allow for separate identification of postsecondary teachers by fields. SeeAppendix Table 3-1 for a list of S&E occupations in the 2013 ACS.
According to the 2013 SESTAT, the vast majority (82%) of college graduates employed in S&E occupations have atleast a bachelor’s or higher level degree in an S&E field ( ), suggesting that formal S&E training is theTable 3-4usual pathway for obtaining employment in these occupations. However, the importance of formal S&E training inthe same broad field as one’s S&E occupation varies across occupational categories. For example, among computerand mathematical scientists, less than one-half (46%) have a bachelor’s or higher level degree in that broad field of

Chapter 3. Science and Engineering Labor Force
3 | 30National Science Board | Science & Engineering Indicators 2016
study and nearly one-fourth (23%) do not have any S&E or S&E-related degree. In contrast, 75% of life scientists,73% of physical scientists, 75% of social scientists, and 82% of engineers have a bachelor’s or higher level degreein their respective broad field. The next section presents data on the proportion of S&E degree holders who areemployed in S&E and non-S&E occupational categories.
Table 3-4Educational background of college graduates employed in S&E occupations,by broad S&E occupational category: 2013
(Percent)
Educational background All S&Eoccupations
Biological,agricultural, and
environmental lifescientists
Computer andmathematical
scientists
Physicalscientists
Socialscientists
Engineers
Total (n) 5,749,000 638,000 2,647,000 319,000 581,000 1,564,000
At least one S&Edegree
82.1 89.3 73.3 96.6 81.6 91.2
At least one S&Edegree in field
82.1 75.1 46.1 73.4 75.2 81.5
Highest degree infield
75.5 68.5 42.3 67.4 65.4 74.5
All degrees in S&E 70.7 75.1 63.8 88.1 55.4 82.6
No S&E degrees but atleast one S&E-relateddegree
4.3 6.3 4.3 1.6 2.9 4.5
No S&E or S&E-relateddegree but at least onenon-S&E degree
13.7 4.5 22.5 1.9 15.5 4.3
NOTES: At least one S&E degree in field is the proportion of workers in a particular S&E occupational category with atleast one bachelor's or higher-level degree in the same broad field. Highest degree in field is the proportion of
workers in a particular S&E occupational category with highest degree in the same broad field. For example,among computer and mathematical scientists, these data refer to the proportion with at least one bachelor'sor higher-level degree in the broad field of computer and mathematical sciences and the proportion with
highest degree in the broad field of computer and mathematical sciences, respectively. Detail may not add tototal because of rounding.
SOURCE: National Science Foundation, National Center for Science and Engineering Statistics, Scientists and EngineersStatistical Data System (SESTAT) (2013), http://sestat.nsf.gov.
Science and Engineering Indicators 2016
Occupational Distribution of S&E Degree Holders and Relationship betweenJobs and Degrees
SESTAT provides joint information on both degree achievement and occupational employment of scientists andengineers in the United States, thus enabling a direct comparison of the interplay between degree and occupationfor individuals who earned a highest degree in an S&E discipline and those who earned a highest degree in anon-S&E discipline.
Although an S&E degree is often necessary to obtain S&E employment, many individuals with S&E degrees pursuecareers in non-S&E fields. However, a majority of workers with S&E training who work in non-S&E jobs reported

Chapter 3. Science and Engineering Labor Force
3 | 31National Science Board | Science & Engineering Indicators 2016
that their work is related to their S&E training, suggesting that the application of S&E skills and expertise extendswell beyond jobs formally classified as S&E occupations. (The next section, “S&E Workers in the Economy,”provides data on R&D activity of scientists and engineers employed in S&E and non-S&E occupations.)
Only about half of those with a highest degree in S&E are employed in an S&E (35%) or S&E-related (14%)occupation; the other 51% are employed in non-S&E occupations. shows the occupational distributionFigure 3-6of the S&E workforce with S&E, S&E-related, and non-S&E highest degrees. The largest category of non-S&E jobsfor these S&E degree holders is management and management-related occupations (2.2 million workers), followedby sales and marketing (1.1 million workers) (Appendix Table 3-3). Other non-S&E occupations with a largenumber of S&E-trained workers include social services (457,000) and college and precollege teaching in non-S&Eareas (421,000). S&E degree holders also work in S&E-related jobs such as health (558,000), S&E management(450,000), S&E technician or technologist (501,000), and precollege teaching in S&E areas (219,000).

Chapter 3. Science and Engineering Labor Force
3 | 32National Science Board | Science & Engineering Indicators 2016
Figure 3-6
Occupational distribution of scientists and engineers, by broad field of highest degree: 2013
NOTE: Scientists and engineers include those with one or more S&E or S&E-related degrees at the bachelor's level or higher orthose who have only a non-S&E degree at the bachelor's level or higher and are employed in an S&E or S&E-relatedoccupation.
SOURCE: National Science Foundation, National Center for Science and Engineering Statistics, Scientists and EngineersStatistical Data System (SESTAT) (2013), http://sestat.nsf.gov.
Science and Engineering Indicators 2016
Most individuals with a highest degree in S&E but working in non-S&E occupations do not see S&E as irrelevant.Rather, most indicate that their jobs are either closely (35%) or somewhat (33%) related to their highest degreefield ( ). For example, among S&E degree holders in non-S&E management and management-relatedTable 3-5occupations, about three-quarters indicate that their jobs are either closely (32%) or somewhat (42%) related totheir S&E degree. Among those in social services and related occupations, these numbers are higher (92%); amongthose in sales and marketing, these numbers are lower (51%).
Table 3-5Relationship of highest degree to job among S&E highest degree holders notin S&E occupations, by degree level: 2013
Degree related to job (%)
Highest degree Workers (n) Closely Somewhat Not
All degree levels 8,105,000 34.7 32.9 32.4

Chapter 3. Science and Engineering Labor Force
3 | 33National Science Board | Science & Engineering Indicators 2016
Degree related to job (%)
Highest degree Workers (n) Closely Somewhat Not
Bachelor’s 6,451,000 30.0 34.3 35.7
Master’s 1,405,000 54.4 25.8 19.8
Doctorate 232,000 47.0 35.8 17.2
NOTE: All degree levels includes professional degrees not broken out separately. Detail may not add to total becauseof rounding.
SOURCE: National Science Foundation, National Center for Science and Engineering Statistics, Scientists and EngineersStatistical Data System (SESTAT) (2013), http://sestat.nsf.gov.
Science and Engineering Indicators 2016
Unlike individuals with an S&E highest degree, at least half of those whose highest degrees are either inS&E-related or non-S&E fields are employed in their corresponding broad occupational categories ( ).Figure 3-6For those with an S&E-related highest degree, the largest category of jobs is health occupations (3.4 million); forthose with a non-S&E highest degree, the largest category of jobs is non-S&E management andmanagement-related occupations (873,000) (Appendix Table 3-3). Significant numbers of individuals with anon-S&E highest degree work in computer and information sciences (671,000), in health (590,000), in precollegeteaching in S&E areas (556,000), or as lawyers or judges (562,000).
The pattern that a large proportion of individuals with a highest degree in S&E are employed in areas other thanS&E occupations has been robust over time. SESTAT data from 1993 indicate that 36% of all scientists andengineers with S&E highest degrees were employed in S&E occupations, and the rest held positions in areas otherthan S&E. The comparable proportion in 2013 was 35%.
The proportion of S&E highest degree holders who go on to work in S&E occupations varies substantially by S&Edegree fields and levels of degree and is heavily influenced by those in social sciences. Individuals with socialsciences degrees are the least likely to work in S&E occupations (12%); these individuals work primarily in non-S&Eoccupations (80%) ( ). In contrast, at least half of individuals with a highest degree in computer andFigure 3-7mathematical sciences (54%), physical sciences (49%), or engineering (57%) report working in S&E occupations.This general pattern between study field of degrees and occupations is similar at the bachelor’s and master’s levelbut not at the doctoral level, where S&E doctorates most often work in an S&E occupation similar to their doctoralfield ( ).Figure 3-8

Chapter 3. Science and Engineering Labor Force
3 | 34National Science Board | Science & Engineering Indicators 2016
Figure 3-7
Occupational distribution of S&E highest degree holders, by field of highest degree: 2013
NOTES: Detail may not add to total because of rounding. For each broad S&E highest degree field, S&E occupation (in field ofhighest degree) includes individuals who report being employed in an occupation in the same broad category. For example, forhighest degree holders in computer and mathematical sciences, S&E occupation (in field of highest degree) includes those whoreport the broad field of computer and mathematical sciences as their occupation, and S&E occupation (not in field of highestdegree) includes those who report an S&E occupation other than computer and mathematical sciences occupations.
SOURCE: National Science Foundation, National Center for Science and Engineering Statistics, Scientists and EngineersStatistical Data System (SESTAT) (2013), http://sestat.nsf.gov.
Science and Engineering Indicators 2016

Chapter 3. Science and Engineering Labor Force
3 | 35National Science Board | Science & Engineering Indicators 2016
Figure 3-8
S&E degree holders working in S&E occupations, by level and field of S&E highest degree: 2013
NOTE: Individuals may have degrees in more than one S&E degree field.
SOURCE: National Science Foundation, National Center for Science and Engineering Statistics, Scientists and EngineersStatistical Data System (SESTAT) (2013), http://sestat.nsf.gov.
Science and Engineering Indicators 2016
Whereas shows the proportion of S&E degree holders employed in S&E occupations, showsFigure 3-8 Figure 3-9what proportions of S&E degree holders reported that their work is related (closely or somewhat) to their S&Edegree. Workers with more advanced S&E training were more likely than those with only bachelor’s level degrees towork in a job related to their degree field. Irrespective of degree level, the bulk of degree holders in life sciences(74%), physical sciences (78%), and computer and mathematical sciences (88%), along with engineering (88%),considered their jobs to be related to their degree field. The corresponding percentage of social scientists was 66%.

Chapter 3. Science and Engineering Labor Force
3 | 36National Science Board | Science & Engineering Indicators 2016
Figure 3-9
S&E degree holders employed in jobs related to highest degree, by level of and years since highestdegree: 2013
NOTE: Data include those who report their job is either closely or somewhat related to the field of their highest degree.
SOURCE: National Science Foundation, National Center for Science and Engineering Statistics, Scientists and EngineersStatistical Data System (SESTAT) (2013), http://sestat.nsf.gov.
Science and Engineering Indicators 2016
The pattern of a stronger relationship between S&E jobs and S&E degrees among master’s degree or doctorateholders compared with bachelor’s degree holders is robust across career stages, as seen in comparisons amonggroups of bachelor’s, master’s, and doctoral degree holders at comparable numbers of years since receiving theirdegrees ( ). For each group, the relationship between job and field of highest degree becomes weakerFigure 3-9over time, particularly toward the later career stages. Possible reasons for this decline include changes in careerinterests, development of skills in different areas, promotion to general management positions, or realization thatsome of the original training has become obsolete. Despite these potential factors, the career-cycle decline in therelevance of an S&E degree appears modest.

Chapter 3. Science and Engineering Labor Force
3 | 37National Science Board | Science & Engineering Indicators 2016
S&E Workers in the Economy
To understand the economic and scientific contributions of scientists and engineers, it is important to know howthey are distributed across the economy and what kind of work they perform. This section examines the economicsectors, size, and other characteristics of organizations that employ scientists and engineers (defined both byoccupation and field of education). It also describes the distribution of S&E workers within particular sectors. Theanalysis covers all sectors: private and public educational institutions; for-profit businesses and nonprofitorganizations; and federal, state, and local governments. It also examines self-employed scientists and engineersand the concentration of S&E workers by industry sectors and by geography.
The S&E labor force is a national resource in the continuous productivity increases and innovative capacities thatfuel long-term economic growth and raise public welfare. The chapter concludes with examinations of R&D activityand work-related training as indicators of worker skill level, productivity, and innovative capacity. It distinguishesbetween analyses based on S&E degree field and S&E occupation.
Employment Sectors
The business sector is by far the largest employer of the broad S&E workforce (including those with at least an S&Eor S&E-related bachelor’s degree and those working in an S&E or S&E-related occupation regardless of an S&Edegree). In 2013, the business sector—mostly for-profit businesses—employed about 70% of such individuals (
). The education sector, including private and public institutions, employed another 19%, the bulk inTable 3-62-year and precollege institutions. The government sector—federal, state, and local—employed another 11%. Thisdistribution pattern has been quite stable for decades, except a small rise in the nonprofit segment and a smalldecline in government (Appendix Table 3-4).
Table 3-6Employment sector of scientists and engineers, by broad occupationalcategory and degree field: 2013
Employment sectorAll employedscientists and
engineers
Highestdegree in
S&E
S&Eoccupations
S&E-relatedoccupations
Non-S&Eoccupations
Total (n) 23,557,000 12,446,000 5,749,000 7,439,000 10,368,000
Business/industry (%) 70.1 71.9 69.7 68.8 71.1
For-profit businesses 52.4 58.2 61.6 45.3 52.4
Nonprofit organizations 11.1 7.2 4.8 18.5 9.2
Self-employed,unincorporatedbusinesses
6.6 6.4 3.3 5.0 9.5
Education (%) 18.9 15.6 18.1 22.6 16.8
4-year institutions 7.9 8.3 14.5 7.2 4.8
2-year and precollegeinstitutions
11.0 7.3 3.7 15.4 12.0
Government (%) 11.0 12.5 12.2 8.6 12.1
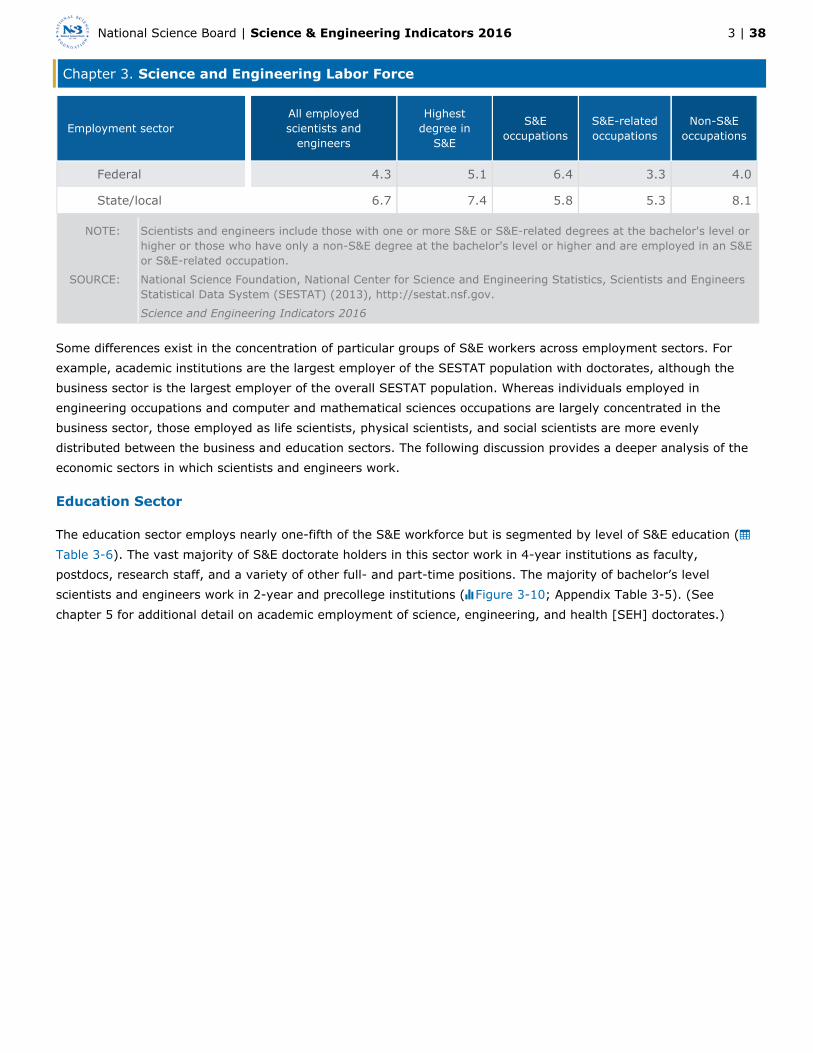
Chapter 3. Science and Engineering Labor Force
3 | 38National Science Board | Science & Engineering Indicators 2016
Employment sectorAll employedscientists and
engineers
Highestdegree in
S&E
S&Eoccupations
S&E-relatedoccupations
Non-S&Eoccupations
Federal 4.3 5.1 6.4 3.3 4.0
State/local 6.7 7.4 5.8 5.3 8.1
NOTE: Scientists and engineers include those with one or more S&E or S&E-related degrees at the bachelor's level orhigher or those who have only a non-S&E degree at the bachelor's level or higher and are employed in an S&Eor S&E-related occupation.
SOURCE: National Science Foundation, National Center for Science and Engineering Statistics, Scientists and EngineersStatistical Data System (SESTAT) (2013), http://sestat.nsf.gov.
Science and Engineering Indicators 2016
Some differences exist in the concentration of particular groups of S&E workers across employment sectors. Forexample, academic institutions are the largest employer of the SESTAT population with doctorates, although thebusiness sector is the largest employer of the overall SESTAT population. Whereas individuals employed inengineering occupations and computer and mathematical sciences occupations are largely concentrated in thebusiness sector, those employed as life scientists, physical scientists, and social scientists are more evenlydistributed between the business and education sectors. The following discussion provides a deeper analysis of theeconomic sectors in which scientists and engineers work.
Education Sector
The education sector employs nearly one-fifth of the S&E workforce but is segmented by level of S&E education (). The vast majority of S&E doctorate holders in this sector work in 4-year institutions as faculty,Table 3-6
postdocs, research staff, and a variety of other full- and part-time positions. The majority of bachelor’s levelscientists and engineers work in 2-year and precollege institutions ( ; Appendix Table 3-5). (SeeFigure 3-10chapter 5 for additional detail on academic employment of science, engineering, and health [SEH] doctorates.)
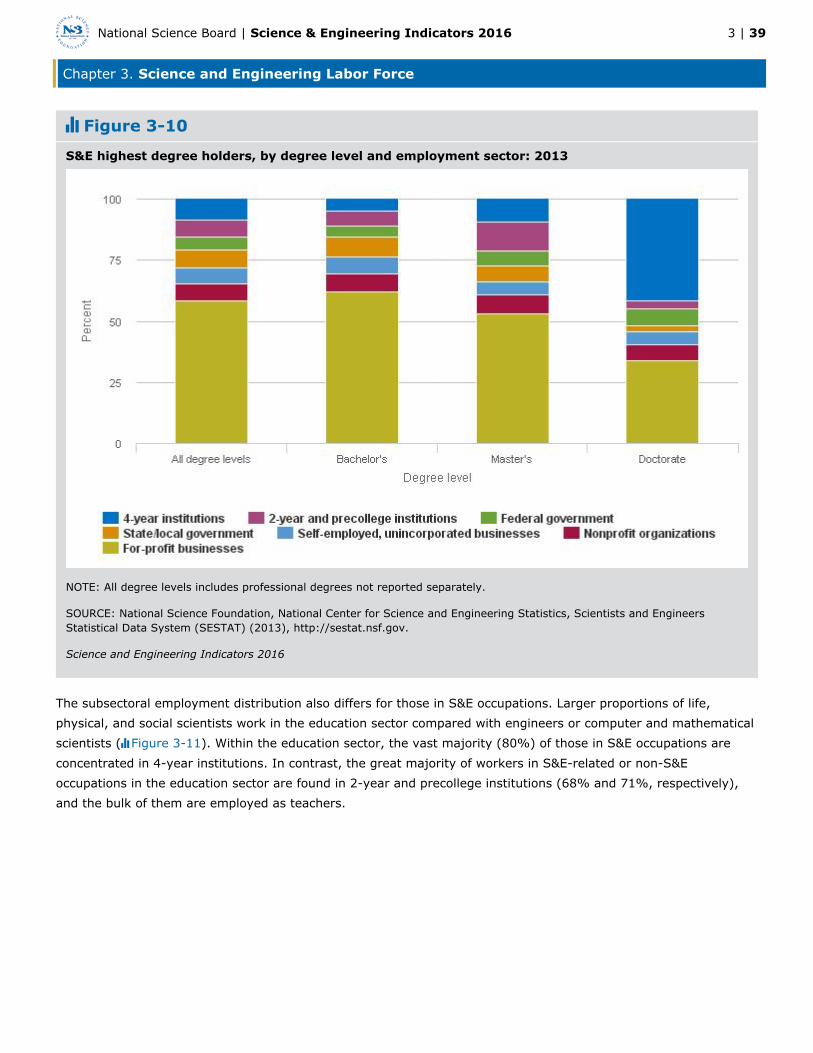
Chapter 3. Science and Engineering Labor Force
3 | 39National Science Board | Science & Engineering Indicators 2016
Figure 3-10
S&E highest degree holders, by degree level and employment sector: 2013
NOTE: All degree levels includes professional degrees not reported separately.
SOURCE: National Science Foundation, National Center for Science and Engineering Statistics, Scientists and EngineersStatistical Data System (SESTAT) (2013), http://sestat.nsf.gov.
Science and Engineering Indicators 2016
The subsectoral employment distribution also differs for those in S&E occupations. Larger proportions of life,physical, and social scientists work in the education sector compared with engineers or computer and mathematicalscientists ( ). Within the education sector, the vast majority (80%) of those in S&E occupations areFigure 3-11concentrated in 4-year institutions. In contrast, the great majority of workers in S&E-related or non-S&Eoccupations in the education sector are found in 2-year and precollege institutions (68% and 71%, respectively),and the bulk of them are employed as teachers.
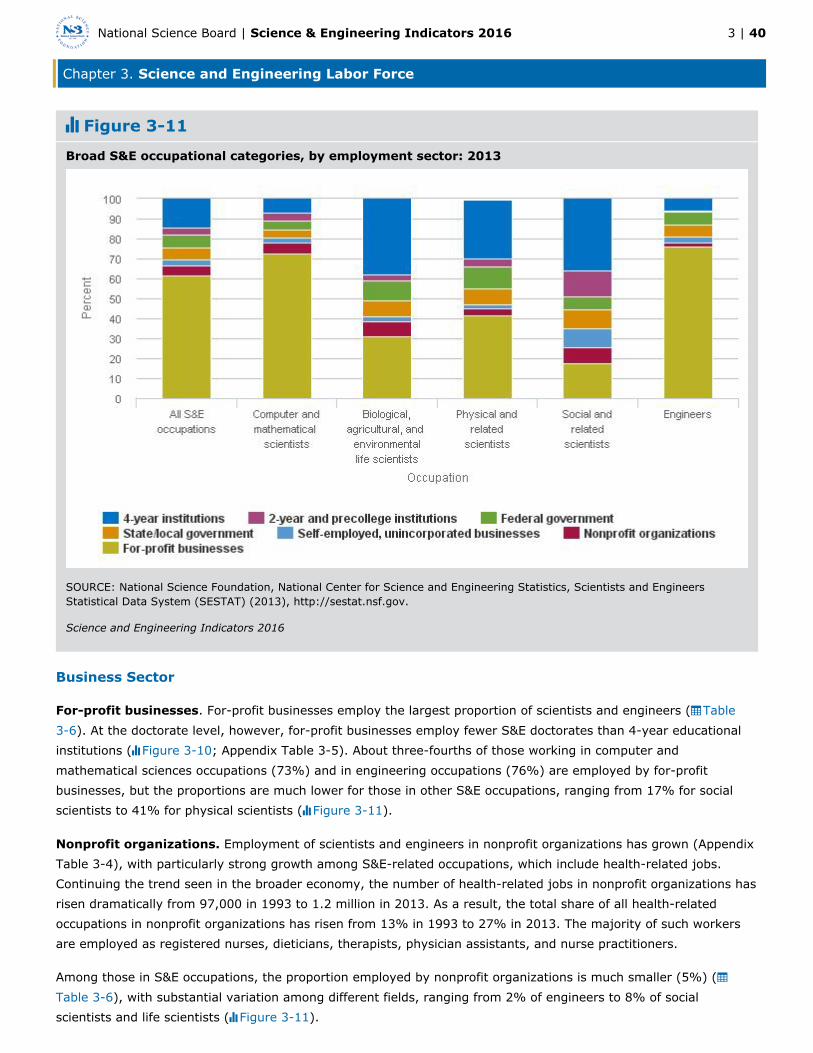
Chapter 3. Science and Engineering Labor Force
3 | 40National Science Board | Science & Engineering Indicators 2016
Figure 3-11
Broad S&E occupational categories, by employment sector: 2013
SOURCE: National Science Foundation, National Center for Science and Engineering Statistics, Scientists and EngineersStatistical Data System (SESTAT) (2013), http://sestat.nsf.gov.
Science and Engineering Indicators 2016
Business Sector
For-profit businesses. For-profit businesses employ the largest proportion of scientists and engineers (Table). At the doctorate level, however, for-profit businesses employ fewer S&E doctorates than 4-year educational3-6
institutions ( ; Appendix Table 3-5). About three-fourths of those working in computer andFigure 3-10mathematical sciences occupations (73%) and in engineering occupations (76%) are employed by for-profitbusinesses, but the proportions are much lower for those in other S&E occupations, ranging from 17% for socialscientists to 41% for physical scientists ( ).Figure 3-11
Nonprofit organizations. Employment of scientists and engineers in nonprofit organizations has grown (AppendixTable 3-4), with particularly strong growth among S&E-related occupations, which include health-related jobs.Continuing the trend seen in the broader economy, the number of health-related jobs in nonprofit organizations hasrisen dramatically from 97,000 in 1993 to 1.2 million in 2013. As a result, the total share of all health-relatedoccupations in nonprofit organizations has risen from 13% in 1993 to 27% in 2013. The majority of such workersare employed as registered nurses, dieticians, therapists, physician assistants, and nurse practitioners.
Among those in S&E occupations, the proportion employed by nonprofit organizations is much smaller (5%) (), with substantial variation among different fields, ranging from 2% of engineers to 8% of socialTable 3-6
scientists and life scientists ( ).Figure 3-11
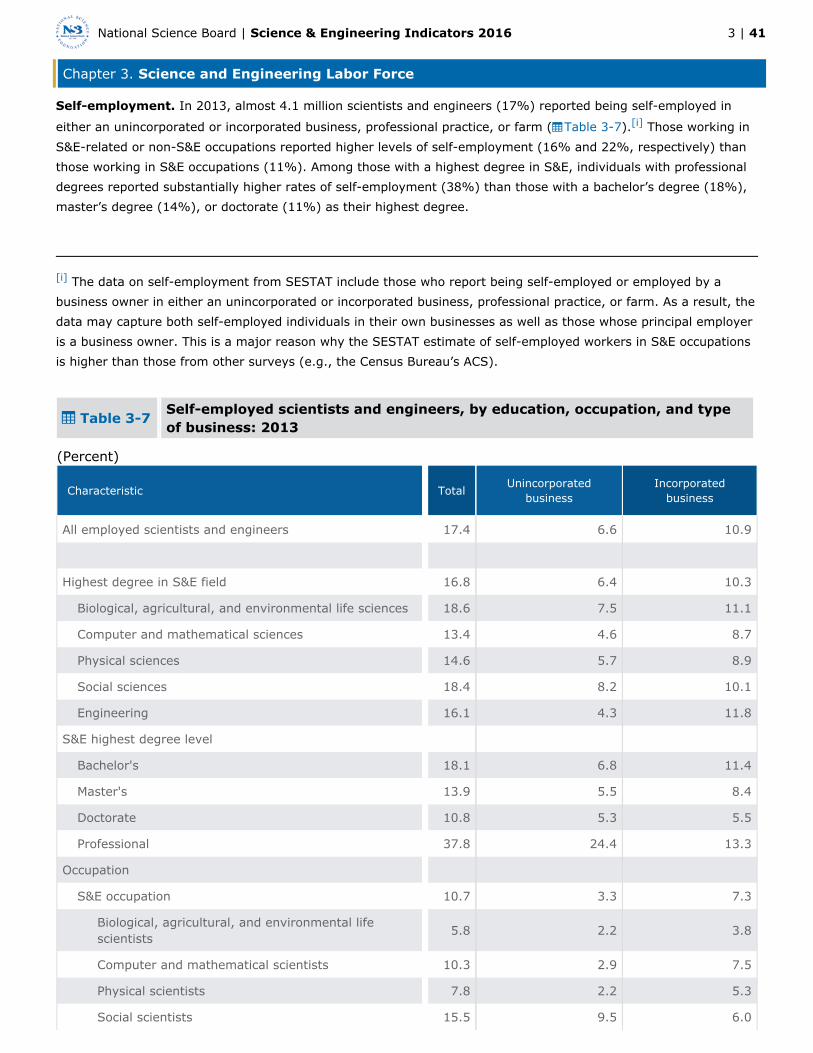
Chapter 3. Science and Engineering Labor Force
3 | 41National Science Board | Science & Engineering Indicators 2016
Self-employment. In 2013, almost 4.1 million scientists and engineers (17%) reported being self-employed in
either an unincorporated or incorporated business, professional practice, or farm ( ). Those working inTable 3-7 [i]
S&E-related or non-S&E occupations reported higher levels of self-employment (16% and 22%, respectively) thanthose working in S&E occupations (11%). Among those with a highest degree in S&E, individuals with professionaldegrees reported substantially higher rates of self-employment (38%) than those with a bachelor’s degree (18%),master’s degree (14%), or doctorate (11%) as their highest degree.
[i] The data on self-employment from SESTAT include those who report being self-employed or employed by abusiness owner in either an unincorporated or incorporated business, professional practice, or farm. As a result, thedata may capture both self-employed individuals in their own businesses as well as those whose principal employeris a business owner. This is a major reason why the SESTAT estimate of self-employed workers in S&E occupationsis higher than those from other surveys (e.g., the Census Bureau’s ACS).
Table 3-7Self-employed scientists and engineers, by education, occupation, and typeof business: 2013
(Percent)
Characteristic TotalUnincorporated
businessIncorporated
business
All employed scientists and engineers 17.4 6.6 10.9
Highest degree in S&E field 16.8 6.4 10.3
Biological, agricultural, and environmental life sciences 18.6 7.5 11.1
Computer and mathematical sciences 13.4 4.6 8.7
Physical sciences 14.6 5.7 8.9
Social sciences 18.4 8.2 10.1
Engineering 16.1 4.3 11.8
S&E highest degree level
Bachelor's 18.1 6.8 11.4
Master's 13.9 5.5 8.4
Doctorate 10.8 5.3 5.5
Professional 37.8 24.4 13.3
Occupation
S&E occupation 10.7 3.3 7.3
Biological, agricultural, and environmental lifescientists
5.8 2.2 3.8
Computer and mathematical scientists 10.3 2.9 7.5
Physical scientists 7.8 2.2 5.3
Social scientists 15.5 9.5 6.0

Chapter 3. Science and Engineering Labor Force
3 | 42National Science Board | Science & Engineering Indicators 2016
Characteristic Total Unincorporatedbusiness
Incorporatedbusiness
Engineers 12.0 2.6 9.5
S&E-related occupations 15.7 5.0 10.7
Non-S&E occupations 22.4 9.5 12.9
NOTE: Scientists and engineers include those with one or more S&E or S&E-related degrees at the bachelor’s level orhigher or those who have only a non-S&E degree at the bachelor’s level or higher and are employed in an S&Eor S&E-related occupation.
SOURCE: National Science Foundation, National Center for Science and Engineering Statistics, Scientists and EngineersStatistical Data System (SESTAT) (2013), http://sestat.nsf.gov.
Science and Engineering Indicators 2016
Incorporated businesses account for at least half of self-employed scientists and engineers in most fields. However,most of those whose highest degree was a professional one worked in unincorporated businesses ( ).Table 3-7This was also the case for individuals in social sciences occupations, whose level of unincorporated self-employmentwas largely driven by psychologists: In 2013, among the 208,000 employed psychologists, 31% wereself-employed, mostly in unincorporated businesses. In addition, 38% of professional degree holders in a field ofpsychology were self-employed, divided almost evenly between unincorporated and incorporated businesses.
Government Sector
Federal government. According to data from the U.S. Office of Personnel Management (OPM), in 2014 the federalgovernment employed approximately 319,000 people in S&E occupations, which represents about 16% of the
federal civilian workforce. , Federal workers in S&E occupations are almost evenly distributed among computer[ii] [iii]
and mathematical sciences occupations (32%); engineering occupations (31%); and life sciences, physicalsciences, and social sciences occupations (36%). The vast majority (81%) of the federal workers in S&Eoccupations have a bachelor’s or higher level degree.
The five federal agencies with the largest proportions of their workforce in S&E jobs are those with strong scientificmissions: the National Aeronautics and Space Administration (65%), the Nuclear Regulatory Commission (62%),the Environmental Protection Agency (61%), NSF (41%), and the Department of Energy (33%). The Department ofDefense has the largest number of workers in S&E occupations (147,000), accounting for 46% of the federal
workforce in S&E occupations.[iv]
State and local government. In 2013, about 1.6 million scientists and engineers (7%) were working in state andlocal governments in the United States ( ). Public educational institutions are included in the educationTable 3-6sector and excluded here. State and local governments employ about 8% of S&E bachelor’s degree holders and 7%of S&E master’s degree holders, compared to only 2% of S&E doctorate holders ( ). Among thoseFigure 3-10employed in S&E occupations, larger proportions of life scientists, physical scientists, and social scientists work instate and local governments compared with engineers and computer and mathematical scientists ( ).Figure 3-11
[ii] The source of the federal S&E employment data is OPM’s Enterprise Human Resources Integration StatisticalData Mart. Coverage is limited to federal civilian employees on pay status with certain exclusions. For informationon specific exclusions and inclusions, see the coverage definition on OPM’s Federal Human Resources Data(FedScope) Web page: http://www.fedscope.opm.gov/datadefn/aehri_sdm.asp#cpdf3

Chapter 3. Science and Engineering Labor Force
3 | 43National Science Board | Science & Engineering Indicators 2016
[iii] Employment in the federal government is largely limited to those with U.S. citizenship. Many federal workerswith S&E employment are in occupations that, nationwide, include relatively large concentrations of foreign-bornpersons, some of whom are not U.S. citizens, rendering them ineligible for many federal jobs.
[iv] This list does not include the National Institutes of Health, which is a part of the Department of Health andHuman Services (DHHS). S&E employment accounted for 19% of total DHHS employment in 2014.
Employer Size
The vast majority of educational institutions and government entities that employ individuals trained in S&E fieldsor working in S&E occupations are large employers (i.e., having 100 or more employees). These large organizationsemploy 87% of scientists and engineers in the education sector and 91% of those in the government sector. Incontrast, scientists and engineers working in the business sector are more broadly distributed across firms ofdifferent sizes ( ).Figure 3-12
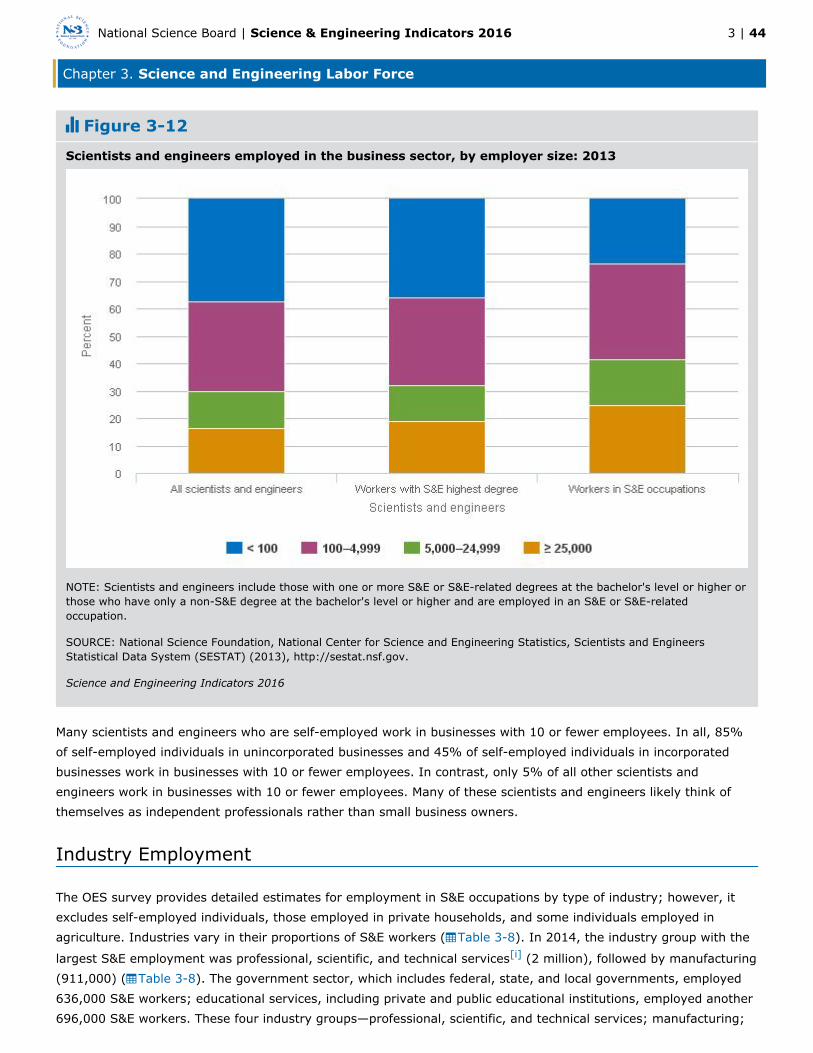
Chapter 3. Science and Engineering Labor Force
3 | 44National Science Board | Science & Engineering Indicators 2016
Figure 3-12
Scientists and engineers employed in the business sector, by employer size: 2013
NOTE: Scientists and engineers include those with one or more S&E or S&E-related degrees at the bachelor's level or higher orthose who have only a non-S&E degree at the bachelor's level or higher and are employed in an S&E or S&E-relatedoccupation.
SOURCE: National Science Foundation, National Center for Science and Engineering Statistics, Scientists and EngineersStatistical Data System (SESTAT) (2013), http://sestat.nsf.gov.
Science and Engineering Indicators 2016
Many scientists and engineers who are self-employed work in businesses with 10 or fewer employees. In all, 85%of self-employed individuals in unincorporated businesses and 45% of self-employed individuals in incorporatedbusinesses work in businesses with 10 or fewer employees. In contrast, only 5% of all other scientists andengineers work in businesses with 10 or fewer employees. Many of these scientists and engineers likely think ofthemselves as independent professionals rather than small business owners.
Industry Employment
The OES survey provides detailed estimates for employment in S&E occupations by type of industry; however, itexcludes self-employed individuals, those employed in private households, and some individuals employed inagriculture. Industries vary in their proportions of S&E workers ( ). In 2014, the industry group with theTable 3-8
largest S&E employment was professional, scientific, and technical services (2 million), followed by manufacturing[i]
(911,000) ( ). The government sector, which includes federal, state, and local governments, employedTable 3-8636,000 S&E workers; educational services, including private and public educational institutions, employed another696,000 S&E workers. These four industry groups—professional, scientific, and technical services; manufacturing;

Chapter 3. Science and Engineering Labor Force
3 | 45National Science Board | Science & Engineering Indicators 2016
government; and educational services—had a disproportionate concentration of S&E workers and togetheraccounted for about 67% of S&E employment, compared with 31% of total employment.
[i] The establishments in this sector provide professional, scientific, and technical services to clients in a variety ofindustries as well as households. The services provided by S&E workers in this industry sector may includecomputer services; engineering and specialized design services; consulting services; research services; advertisingservices; and other professional, scientific, and technical services.
Table 3-8 Employment in S&E occupations, by major industry: May 2014
Workers employed (n)
Industry Alloccupations
S&Eoccupations
Industry workforce in S&Eoccupations (%)
U.S. total—all industries 135,128,260 6,318,580 4.7
Agriculture, forestry, fishing, and hunting 409,720 1,250 0.3
Mining 824,260 61,630 7.5
Utilities 547,980 56,560 10.3
Construction 6,094,090 55,930 0.9
Manufacturing 12,100,740 911,290 7.5
Wholesale trade 5,780,070 236,950 4.1
Retail trade 15,472,510 44,210 0.3
Transportation and warehousing 5,202,640 40,590 0.8
Information 2,735,590 507,080 18.5
Finance and insurance 5,618,720 314,930 5.6
Real estate, rental, and leasing 2,017,970 13,470 0.7
Professional, scientific, and technical services 8,231,540 1,972,220 24.0
Management of companies and enterprises 2,206,620 275,840 12.5
Administrative and support and wastemanagement and remediation
8,627,320 236,180 2.7
Educational services 12,758,610 696,180 5.5
Health care and social assistance 18,341,690 199,980 1.1
Arts, entertainment, and recreation 2,198,590 11,570 0.5
Accommodation and food services 12,548,660 3,680 0.0
Other services (except federal, state, and localgovernment)
3,937,990 43,320 1.1
Federal, state, and local government (OESdesignation)
9,472,980 635,730 6.7

Chapter 3. Science and Engineering Labor Force
3 | 46National Science Board | Science & Engineering Indicators 2016
OES = Occupational Employment Statistics.
NOTES: Industries are defined by the North American Industry Classification System (NAICS). The OES Survey doesnot cover employment among self-employed workers and employment in private households (NAICS 814). Inthe employment total for agriculture, forestry, fishing, and hunting, only the following industries are included:logging (NAICS 1133), support activities for crop production (NAICS 1151), and support activities for animalproduction (NAICS 1152). As a result, the data do not represent total U.S. employment. Differences betweenany two industry groups may not be statistically significant.
SOURCE: Bureau of Labor Statistics, OES Survey (May 2014).
Science and Engineering Indicators 2016
S&E employment intensity, defined by an industry’s S&E employment as a proportion of its total employment, washighest in professional, scientific, and technical services (24%), followed by information (19%) and management ofcompanies and enterprises (13%) ( ). The broad industry sectors with S&E employment intensity belowTable 3-8the national average (4.7%) together employed 60% of all workers in 2014 but only 14% of workers in S&Eoccupations. These sectors with S&E employment intensity below the national average include large employers suchas health care and social assistance, retail trade, and accommodation and food services. The health care and socialassistance industry employed a large number of health workers who fall under NSF’s category of S&E-relatedoccupations ( ).Table 3-2
Employment by Metropolitan Area
The availability of a skilled workforce is an important indicator of a region’s population, productivity, andtechnological growth (Carlino, Chatterjee, and Hunt 2001; Glaeser and Saiz 2003). The federal government usesstandard definitions to describe geographical regions in the United States for comparative purposes. It designatesvery large metropolitan areas, sometimes dividing them into smaller metropolitan divisions that can also besubstantial in size (Office of Management and Budget 2009).
This section presents the following indicators of the availability of S&E workers in a metropolitan area: (1) thenumber of S&E workers in the metropolitan area or division, and (2) the proportion of the entire metropolitan areaworkforce in S&E occupations. Data on the metropolitan areas with the largest proportion of workers in S&Eoccupations in 2014 appear in . These estimates are affected by the geographic scope of eachTable 3-9metropolitan area, which can vary significantly. In particular, comparisons between areas can be strongly affectedby how much territory outside the urban core is included in the metropolitan area.
Table 3-9Metropolitan areas with largest proportion of workers in S&E occupations:May 2014
Workers employed (n)
Metropolitan areaAll
occupationsS&E
occupationsMetropolitan area workforce in
S&E occupations (%)
U.S. total 135,128,260 6,318,580 4.7
San Jose–Sunnyvale–Santa Clara, CA 973,480 163,460 16.8
Boulder, CO 167,200 22,620 13.5
Huntsville, AL 208,480 27,820 13.3
Framingham, MA, NECTA Division 162,170 21,010 13.0
Corvallis, OR 33,450 3,920 11.7

Chapter 3. Science and Engineering Labor Force
3 | 47National Science Board | Science & Engineering Indicators 2016
Workers employed (n)
Metropolitan areaAll
occupationsS&E
occupationsMetropolitan area workforce in
S&E occupations (%)
Durham–Chapel Hill, NC 284,480 33,020 11.6
Washington-Arlington-Alexandria,DC-VA-MD-WV, Metropolitan Division
2,378,260 259,080 10.9
Seattle-Bellevue-Everett, WA, MetropolitanDivision
1,492,650 154,480 10.3
Bethesda-Rockville-Frederick, MD, MetropolitanDivision
566,300 55,860 9.9
San Francisco–San Mateo–Redwood City, CA,Metropolitan Division
1,086,660 105,430 9.7
Ithaca, NY 49,430 4,380 8.9
Ames, IA 42,250 3,740 8.9
Boston-Cambridge-Quincy, MA, NECTA Division 1,795,230 157,300 8.8
Lowell-Billerica-Chelmsford, MA-NH, NECTADivision
118,980 10,420 8.8
Ann Arbor, MI 204,840 17,810 8.7
Columbus, IN 48,120 4,090 8.5
Fort Collins–Loveland, CO 139,530 11,810 8.5
Austin–Round Rock–San Marcos, TX 886,620 72,820 8.2
State College, PA 66,660 5,420 8.1
Madison, WI 347,750 27,250 7.8
NECTA = New England City and Town Area.
NOTES: The data exclude metropolitan statistical areas where S&E proportions were suppressed. Larger metropolitanareas are broken into component metropolitan divisions. Differences between any two areas may not bestatistically significant.
SOURCE: Bureau of Labor Statistics, Occupational Employment Statistics Survey (May 2014).
Science and Engineering Indicators 2016
S&E employment in the United States is geographically concentrated; that is, a small number of geographic areasaccount for a significant proportion of S&E jobs. For example, the 20 metropolitan areas listed in Table 3-9account for 18% of nationwide employment in S&E jobs, compared to about 8% of employment in all occupations.
Scientists and Engineers and Innovation-Related Activities
Who Performs R&D?
R&D creates new types of goods and services that can fuel economic and productivity growth and enhance livingstandards. Thus, the status of the nation’s R&D workforce is a policy area of concern nationally, regionally, and,increasingly, locally. This section uses SESTAT data to examine the R&D activity of scientists and engineers. In this

Chapter 3. Science and Engineering Labor Force
3 | 48National Science Board | Science & Engineering Indicators 2016
section, the R&D workforce is defined as the proportion of workers who reported basic research, applied research,design, or development as a primary or secondary work activity in their principal job (i.e., activities that rank first
or second in total work hours from a list of 14 activities).[i]
Overall, 27% of employed scientists and engineers in 2013 reported R&D as a primary or secondary work activity;the proportions who did so vary substantially across occupations and degrees ( ). The majority ofFigure 3-13individuals in S&E occupations (55%) reported performing R&D, but so did a considerable proportion of those inS&E-related occupations (21%) and non-S&E occupations (15%). This indicates that although R&D activity spans abroad range of occupations, it is concentrated in S&E occupations. Among those with a non-S&E highest degree butworking in an S&E occupation, a sizeable proportion reported R&D activity (44%), although this proportion is lowerthan for their colleagues with a highest degree in an S&E field (58%).
[i] The other 10 activities are used to define four additional broad categories of primary/secondary work activities,including teaching; management and administration; computer applications; and professional services, productionworkers, or other work activities not specified.
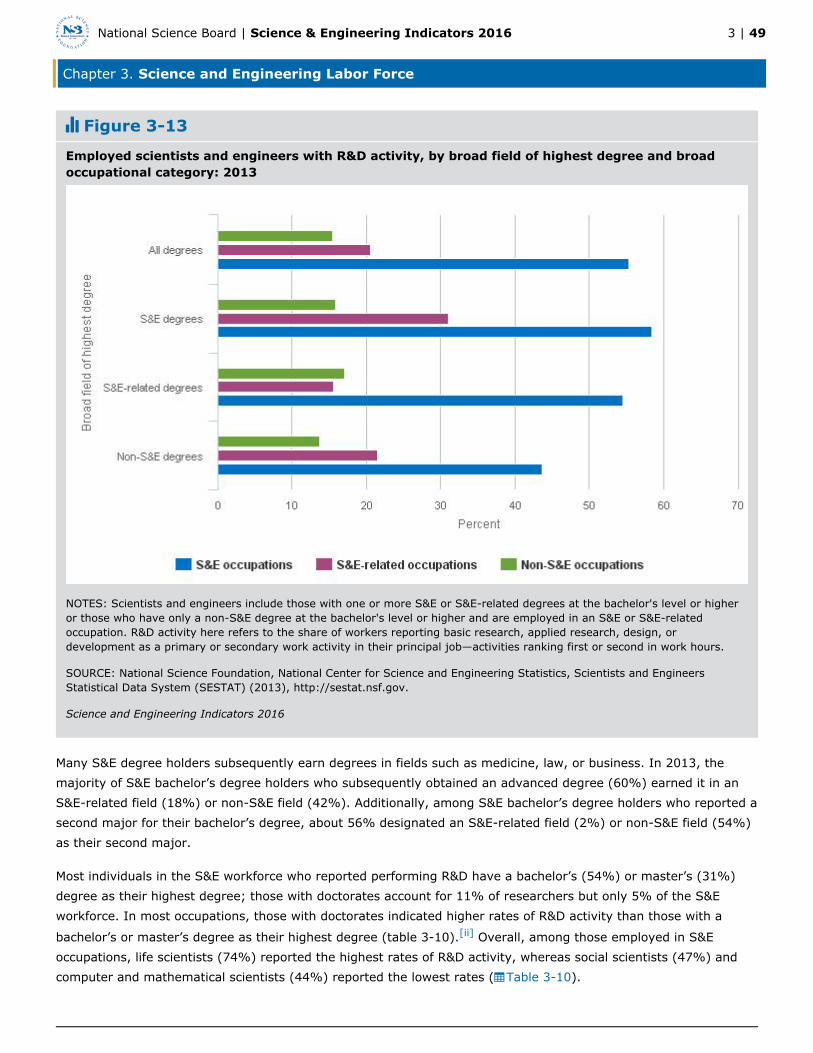
Chapter 3. Science and Engineering Labor Force
3 | 49National Science Board | Science & Engineering Indicators 2016
Figure 3-13
Employed scientists and engineers with R&D activity, by broad field of highest degree and broadoccupational category: 2013
NOTES: Scientists and engineers include those with one or more S&E or S&E-related degrees at the bachelor's level or higheror those who have only a non-S&E degree at the bachelor's level or higher and are employed in an S&E or S&E-relatedoccupation. R&D activity here refers to the share of workers reporting basic research, applied research, design, ordevelopment as a primary or secondary work activity in their principal job—activities ranking first or second in work hours.
SOURCE: National Science Foundation, National Center for Science and Engineering Statistics, Scientists and EngineersStatistical Data System (SESTAT) (2013), http://sestat.nsf.gov.
Science and Engineering Indicators 2016
Many S&E degree holders subsequently earn degrees in fields such as medicine, law, or business. In 2013, themajority of S&E bachelor’s degree holders who subsequently obtained an advanced degree (60%) earned it in anS&E-related field (18%) or non-S&E field (42%). Additionally, among S&E bachelor’s degree holders who reported asecond major for their bachelor’s degree, about 56% designated an S&E-related field (2%) or non-S&E field (54%)as their second major.
Most individuals in the S&E workforce who reported performing R&D have a bachelor’s (54%) or master’s (31%)degree as their highest degree; those with doctorates account for 11% of researchers but only 5% of the S&Eworkforce. In most occupations, those with doctorates indicated higher rates of R&D activity than those with a
bachelor’s or master’s degree as their highest degree (table 3-10). Overall, among those employed in S&E[ii]
occupations, life scientists (74%) reported the highest rates of R&D activity, whereas social scientists (47%) andcomputer and mathematical scientists (44%) reported the lowest rates ( ).Table 3-10

Chapter 3. Science and Engineering Labor Force
3 | 50National Science Board | Science & Engineering Indicators 2016
[ii] Social scientists were exceptions. In 2013, a larger proportion of social scientists with doctorates reported R&Dactivity than social scientists with master’s degrees; however, the difference in R&D activity rates between socialscientists with doctorates and social scientists with bachelor’s degrees was not statistically significant.
Table 3-10R&D activity rate of scientists and engineers employed in S&E occupations,by broad occupational category and level of highest degree: 2013
(Percent)
Highestdegree level
Biological, agricultural, andenvironmental life scientists
Computer andmathematical scientists
Physicalscientists
Socialscientists Engineers
All degreelevels
73.8 44.4 69.9 47.0 66.6
Bachelor's 68.9 41.4 60.2 47.6 64.4
Master's 69.6 48.7 72.3 45.0 66.9
Doctorate 83.7 64.5 79.4 54.0 84.7
NOTES: All degree levels includes professional degrees not broken out separately. R&D activity rate is the proportion ofworkers who report that basic research, applied research, design, or development is a primary or secondarywork activity in their principal job—activities ranking first or second in work hours.
SOURCE: National Science Foundation, National Center for Science and Engineering Statistics, Scientists and EngineersStatistical Data System (SESTAT) (2013), http://sestat.nsf.gov.
Science and Engineering Indicators 2016
R&D activity tends to decline in later career stages ( ). Among S&E doctorate holders who earned theirFigure 3-14doctorate in 2004 or later, 72% reported R&D activity in 2013. Among those receiving degrees between 1984 and2003, 59% reported R&D activity in 2013. For those with degrees pre-dating 1984, 53% reported R&D activity in2013. The decline in R&D activity over the course of individuals’ careers may reflect movement into teaching ormanagement, growth of other career interests, or possession of scientific knowledge and skills that are no longer indemand. It may also reflect increased opportunity for more experienced scientists to perform functions involvingthe interpretation and use of, as opposed to the creation and development of, scientific knowledge.

Chapter 3. Science and Engineering Labor Force
3 | 51National Science Board | Science & Engineering Indicators 2016
Figure 3-14
Employed SEH doctorate holders with R&D activity, by years since doctoral degree: 2013
SEH = science, engineering, and health.
NOTE: R&D activity here refers to the share of workers reporting basic research, applied research, design, or development asa primary or secondary work activity in their principal job—activities ranking first or second in work hours.
SOURCE: National Science Foundation, National Center for Science and Engineering Statistics, Survey of Doctorate Recipients(SDR) (2013), http://sestat.nsf.gov.
Science and Engineering Indicators 2016
Work-Related Training
In addition to formal education, workers receive work-related training. Such training can contribute to innovationand productivity growth by enhancing skills, efficiency, and knowledge. In 2013, 54% of scientists and engineers
reported participating in work-related training within the past 12 months of being surveyed ( ).Table 3-11 [iii]
Among those who were employed, workers in S&E-related jobs (health-related occupations, S&E managers, S&Eprecollege teachers, and S&E technicians and technologists) exhibited higher rates of training (73%) than workersin S&E (54%) or non-S&E occupations (59%). Women participated in work-related training at a higher rate thanmen (56% versus 51%) (Appendix Table 3-6). This difference exists regardless of labor force status.
[iii] Work-related training includes conferences and professional meetings only if the conference or meetingattendance also includes attending a training session; it does not include college coursework while enrolled in adegree program.

Chapter 3. Science and Engineering Labor Force
3 | 52National Science Board | Science & Engineering Indicators 2016
Table 3-11Scientists and engineers participating in work-related training, by laborforce status and occupation: 2013
Labor force status and occupation Number Percent
All scientists and engineers 15,482,000 53.5
Employed 14,705,000 62.4
S&E occupations 3,123,000 54.3
Biological, agricultural, and environmental life scientists 352,000 55.2
Computer and mathematical scientists 1,319,000 49.8
Physical scientists 156,000 48.9
Social scientists 367,000 63.2
Engineers 929,000 59.4
S&E-related occupations 5,452,000 73.3
Non-S&E occupations 6,130,000 59.1
Unemployed 259,000 27.8
S&E occupations 50,000 26.6
Biological, agricultural, and environmental life scientists 8,000 36.4
Computer and mathematical scientists 16,000 18.6
Physical and related scientists 6,000 40.0
Social and related scientists 6,000 30.0
Engineers 14,000 31.1
S&E-related occupations 65,000 39.2
Non-S&E occupations 143,000 26.0
Not in labor force 517,000 11.6
NOTES: Scientists and engineers include those with one or more S&E or S&E-related degrees at the bachelor’s level orhigher or those who have only a non-S&E degree at the bachelor’s level or higher and are employed in an S&Eor S&E-related occupation in 2013. Unemployed individuals are those not working but who looked for a job inthe preceding 4 weeks. For unemployed, the last job held was used for classification. Detail may not add tototal because of rounding.
SOURCE: National Science Foundation, National Center for Science and Engineering Statistics, Scientists and EngineersStatistical Data System (SESTAT) (2013), http://sestat.nsf.gov.
Science and Engineering Indicators 2016
Among scientists and engineers who participated in such work-related training, most did so to improve skills or
knowledge in their current occupational field (53%) (Appendix Table 3-7). Others did so for licensure[iv]
/certification in their current occupational field (23%) or because it was required or expected by their employer(15%). Relative to those who were employed or not in the labor force, those who were unemployed morefrequently reported that they engaged in work-related training to facilitate a change to a different occupationalfield. Those who were not in the labor force more frequently reported that they engaged in this activity for leisureor personal interest than those who were in the labor force.

Chapter 3. Science and Engineering Labor Force
3 | 53National Science Board | Science & Engineering Indicators 2016
[iv] Although SESTAT respondents were allowed to provide more than one reason for participating in work-relatedtraining, the data presented in this section are on the most important reason for participating in such training.

Chapter 3. Science and Engineering Labor Force
3 | 54National Science Board | Science & Engineering Indicators 2016
S&E Labor Market Conditions
This section assesses the overall health of the labor market for scientists and engineers. Indicators of labor marketparticipation (such as rates of unemployment and working involuntarily out of one’s degree field) and earningsprovide meaningful information on economic rewards and the overall attractiveness of careers in S&E fields. Manylabor market indicators are lagging indicators, which change some time after other indicators show that theeconomy has begun to follow a particular trend. For example, although the most recent recession officially began inDecember 2007 and ended in June 2009, unemployment rates continued to rise after the recession had officially
ended. Rates of unemployment, rates of working involuntarily out of one’s field of highest degree, and earnings[i]
should all be considered in this context.
[i] The Business Cycle Dating Committee of the National Bureau of Economic Research is generally the source fordetermining the beginning and end of recessions or expansions in the U.S. economy. See http://www.nber.org/cycles/recessions.html for additional information.
Unemployment
Unemployment among scientists and engineers compares favorably with the rates for the labor force as a wholeand for the college-educated labor force. In February 2013, an estimated 3.8% of the broad SESTAT populationwere unemployed (Appendix Table 3-8); the comparable unemployment rate for the entire U.S. labor force was
more than twice as high, 8.1%. The unemployment rate for the entire college-educated labor force in the same[i]
period was 4.3%. Although the unemployment rate among scientists and engineers in February 2013 was lowerthan in October 2010 (4.3%), it continued to exceed the recession-era October 2008 figure (3.1%) and the October2006 (2.5%) prerecession rate. This underlines that the nation’s S&E population, although somewhat sheltered, isnot immune from fluctuations in broader economic conditions.
In 2013, unemployment rates varied across occupational categories. Among those in S&E occupations,unemployment rates ranged from 2.8% (among engineers) to 4.5% (among physical scientists); among those inS&E-related and non-S&E occupations, the rate was 2.2% and 5.0%, respectively (Appendix Table 3-8).Additionally, advanced degree holders were generally less vulnerable to unemployment than those with onlybachelor’s degrees (Appendix Table 3-8).
The extent of unemployment also varies by career stages. S&E highest degree holders within 5 to 30 years afterobtaining their highest degree were less likely to be unemployed than those at earlier points in their careers (
). As workers strengthen their skills by acquiring labor market experience and adding on-the-jobFigure 3-15knowledge to their formal training, their work situations become more secure. However, in the very late careerstages (30 or more years after obtaining their highest degree), the unemployment rates turn higher than for thosewithin 5 to 30 years after obtaining their highest degree. Growing selectivity about desirable work, skillobsolescence, and other factors may contribute to this phenomenon. The trends of lower unemployment duringearly-to-mid career stages compared with very early or very late stages hold across degree levels ( ).Figure 3-15
[i] The Bureau of Labor Statistics civilian unemployment rate for persons 16 years and over, not seasonallyadjusted, is available at http://data.bls.gov/timeseries/LNU04000000. Accessed 21 November 2014.

Chapter 3. Science and Engineering Labor Force
3 | 55National Science Board | Science & Engineering Indicators 2016
Figure 3-15
Unemployment rates of S&E highest degree holders, by level of and years since highest degree: 2013
NOTE: All degree levels includes professional degrees not shown separately.
SOURCE: National Science Foundation, National Center for Science and Engineering Statistics, Scientists and EngineersStatistical Data System (SESTAT) (2013), http://sestat.nsf.gov.
Science and Engineering Indicators 2016
CPS unemployment rates over the past two decades indicate that workers in S&E occupations have historically[ii]
experienced lower unemployment rates than the overall labor force ( ). Additionally, during theFigure 3-16economic downturn that began in late 2007, unemployment rates among S&E workers generally followed thishistoric pattern ( ). Unemployment peaked at 5.7% in S&E jobs and 6.1% in the broader STEMFigure 3-17occupations, which include computer programmers, S&E technicians, and S&E managers. In comparison, peakunemployment in all occupations was considerably higher (10.5%). In addition to lower rates, unemployment inS&E occupations began declining earlier than in all occupations.
[ii] The CPS is the source of the official unemployment rate.

Chapter 3. Science and Engineering Labor Force
3 | 56National Science Board | Science & Engineering Indicators 2016
Figure 3-16
Unemployment rate, by selected groups: 1990–2014
SOURCES: National Bureau of Economic Research, Merged Outgoing Rotation Group files (1990–2014), Bureau of LaborStatistics, Current Population Survey.
Science and Engineering Indicators 2016

Chapter 3. Science and Engineering Labor Force
3 | 57National Science Board | Science & Engineering Indicators 2016
Figure 3-17
Unemployment rates for S&E, STEM, and the overall labor force: March 2008–June 2015
STEM = science, technology, engineering, and mathematics.
NOTES: Data for S&E, STEM, and the total labor force include people at all education levels. Estimates are not seasonallyadjusted. Estimates are made by combining 3 months of microrecords of the Current Population Survey (CPS) in order toreduce the problem of small sample sizes and therefore will not match official CPS estimates based on a single month.
SOURCE: Bureau of Labor Statistics, CPS, Public Use Microdata Sample (PUMS), January 2008–June 2015.
Science and Engineering Indicators 2016
Working Involuntarily Out of One's Field of Highest Degree
Individuals invest time and financial resources in developing their knowledge and skills. Working outside of one’schosen field of education for involuntary reasons may create skills mismatches and economic inefficiencies that canbe viewed as one indicator of labor market stress. Individuals work outside their highest degree field for a variety ofreasons. Those reporting that they do so because suitable work was not available in their degree field are referredto here as involuntarily out of field (IOF) workers, and their number relative to all employed individuals is the IOFrate.
Of the nearly 24 million employed scientists and engineers in 2013, almost 1.6 million reported working out of theirfield of highest degree because of a lack of suitable jobs in their degree field, yielding an IOF rate of 6.7%. For themore than 12 million whose highest degree was in an S&E field, the IOF rate was 8.3% ( ). SESTATTable 3-12respondents were allowed to provide more than one reason for working out of field. Other reasons cited by S&Edegree holders included pay and promotion opportunities (reported by 1.7 million individuals), change in career orprofessional interests (1.2 million), working conditions (1.5 million), family-related reasons (776,000), job location

Chapter 3. Science and Engineering Labor Force
3 | 58National Science Board | Science & Engineering Indicators 2016
(1.4 million), and other reasons (263,000). This suggests that, in addition to lack of a suitable job, variousjob-related and personal attributes such as compensation, location, and professional interest may result inout-of-field employment.
Table 3-12Scientists and engineers who are working involuntarily out of field, by S&Edegree field: 2003–13
(Percent)
S&E degree field 2003 2006 2008 2010 2013
All scientists and engineers 5.9 6.2 5.3 6.4 6.7
Highest degree in S&E field 7.8 8.1 7.1 8.4 8.3
Biological, agricultural, and environmental life sciences 10.1 9.7 10.1 10.1 9.4
Computer and mathematical sciences 4.9 5.7 4.5 5.1 4.1
Physical sciences 8.8 8.6 7.1 8.2 8.3
Social sciences 10.1 10.6 9.2 11.3 11.8
Engineering 4.2 4.5 3.6 4.9 4.6
NOTES: Scientists and engineers include those with one or more S&E or S&E-related degrees at the bachelor's level orhigher or those who have only a non-S&E degree at the bachelor's level or higher and are employed in an S&Eor S&E-related occupation. The involuntarily out-of-field rate is the proportion of all employed individuals whoreport that their job is not related to their field of highest degree because a job in their highest degree fieldwas not available.
SOURCE: National Science Foundation, National Center for Science and Engineering Statistics, Scientists and EngineersStatistical Data System (SESTAT) (2003–13), http://sestat.nsf.gov.
Science and Engineering Indicators 2016
IOF rates vary by S&E degree fields and levels. Those with a highest degree in engineering or computer andmathematical sciences display lower IOF rates than those with a highest degree in physical, life, or social sciences (
). The high IOF rates among social sciences degree holders, particularly in comparison withTable 3-12engineering and computer and mathematical sciences degree holders, are evident across most of the career cycle (
). Additionally, advanced degree holders are less likely to work involuntarily out of field than thoseFigure 3-18with bachelor’s degrees only: in 2013, the IOF rate was 3.0% among S&E doctorate holders, 4.9% among thosewith S&E master’s degrees, and 9.8% among those with S&E bachelor’s degrees.

Chapter 3. Science and Engineering Labor Force
3 | 59National Science Board | Science & Engineering Indicators 2016
Figure 3-18
S&E highest degree holders who are working involuntarily out of field, by field of and years sincehighest degree: 2013
NOTE: Involuntarily out-of-field rate is the proportion of all employed individuals who reported working in a job not related totheir field of highest degree because a job in that field was not available.
SOURCE: National Science Foundation, National Center for Science and Engineering Statistics, Scientists and EngineersStatistical Data System (SESTAT) (2013), http://sestat.nsf.gov.
Science and Engineering Indicators 2016
Earnings
Based on the OES survey, individuals in S&E occupations earn considerably more than the overall workforce.Median annual salaries in 2014 in S&E occupations (regardless of education level or field) was $80,920, which ismore than double the median for all U.S. workers ($35,540) ( ). This reflects a high level of formalTable 3-13education and technical skills associated with S&E occupations. Median S&E salaries in 2011–14 rose somewhatfaster (1.7%) than for all U.S. workers (1.0%). In 2014, salaries for workers in S&E occupations ranged from$68,910 for social scientists to $89,090 for engineers. Salaries for workers in S&E-related occupations displayedsimilar patterns of higher earnings levels relative to the overall workforce. Health-related occupations, the largestsegment of S&E-related occupations, cover a wide variety of workers ranging from physicians, surgeons, andpractitioners to nurses, therapists, pharmacists, and health technicians; as a result, these occupations display alarge variation in salary levels ( ).Table 3-13
Table 3-13Annual salaries in science, technology, and related occupations: May2011–May 2014

Chapter 3. Science and Engineering Labor Force
3 | 60National Science Board | Science & Engineering Indicators 2016
Mean Median
Occupation
Annualsalariesin 2011
($)
Annualsalaries in2014 ($)
Average annualgrowth rate
2011–14 (%)
Annualsalaries in2011 ($)
Annualsalaries in2014 ($)
Average annualgrowth rate
2011–14 (%)
All U.S. employment 45,230 47,230 1.5 34,460 35,540 1.0
STEM occupations 80,360 85,530 2.1 74,450 78,730 1.9
S&E occupations 81,390 85,980 1.8 76,900 80,920 1.7
Computer andmathematicalscientists
78,810 83,750 2.0 75,150 79,230 1.8
Life scientists 78,570 81,300 1.1 69,240 71,950 1.3
Physicalscientists
81,890 85,140 1.3 73,820 76,390 1.1
Socialscientists
72,400 75,320 1.3 66,370 68,910 1.3
Engineers 89,500 94,250 1.7 84,940 89,090 1.6
Technologyoccupations
76,600 82,300 2.4 63,760 67,650 2.0
S&E-relatedoccupations (notlisted above)
73,980 77,650 1.6 60,840 63,210 1.3
Health-relatedoccupations
73,880 77,570 1.6 60,630 62,980 1.3
Registerednurses
69,110 69,790 0.3 65,950 66,640 0.3
Dentists,general
161,750 166,810 1.0 142,740 149,540 1.6
Family andgeneralpractitioners
177,330 186,320 1.7 167,000 180,180 2.6
OtherS&E-relatedoccupations
79,660 82,400 1.1 72,490 74,500 0.9
Non-STEMoccupations
40,730 42,380 1.3 31,360 32,390 1.1
Chief executives 176,550 180,700 0.8 166,910 173,320 1.3
General andoperationsmanager
114,490 117,200 0.8 95,150 97,270 0.7
Educationadministrators,postsecondary
97,170 101,910 1.6 84,280 88,390 1.6
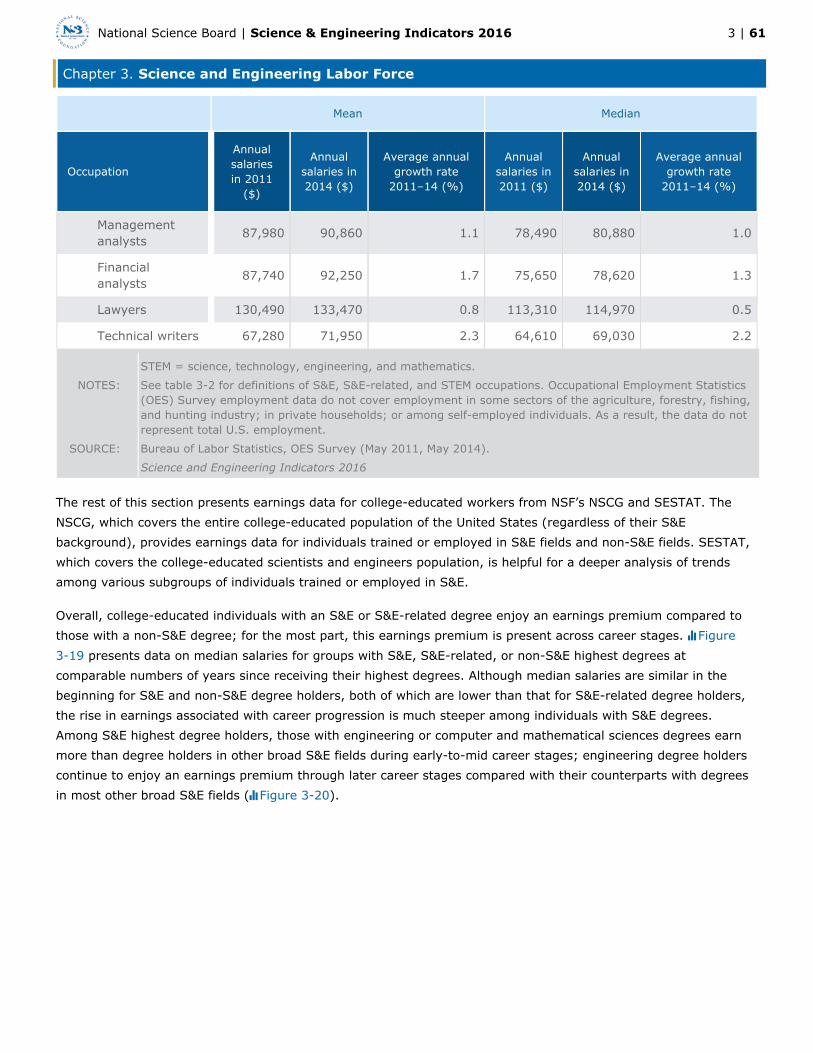
Chapter 3. Science and Engineering Labor Force
3 | 61National Science Board | Science & Engineering Indicators 2016
Mean Median
Occupation
Annualsalariesin 2011
($)
Annualsalaries in2014 ($)
Average annualgrowth rate
2011–14 (%)
Annualsalaries in2011 ($)
Annualsalaries in2014 ($)
Average annualgrowth rate
2011–14 (%)
Managementanalysts
87,980 90,860 1.1 78,490 80,880 1.0
Financialanalysts
87,740 92,250 1.7 75,650 78,620 1.3
Lawyers 130,490 133,470 0.8 113,310 114,970 0.5
Technical writers 67,280 71,950 2.3 64,610 69,030 2.2
STEM = science, technology, engineering, and mathematics.
NOTES: See table 3-2 for definitions of S&E, S&E-related, and STEM occupations. Occupational Employment Statistics(OES) Survey employment data do not cover employment in some sectors of the agriculture, forestry, fishing,and hunting industry; in private households; or among self-employed individuals. As a result, the data do notrepresent total U.S. employment.
SOURCE: Bureau of Labor Statistics, OES Survey (May 2011, May 2014).
Science and Engineering Indicators 2016
The rest of this section presents earnings data for college-educated workers from NSF’s NSCG and SESTAT. TheNSCG, which covers the entire college-educated population of the United States (regardless of their S&Ebackground), provides earnings data for individuals trained or employed in S&E fields and non-S&E fields. SESTAT,which covers the college-educated scientists and engineers population, is helpful for a deeper analysis of trendsamong various subgroups of individuals trained or employed in S&E.
Overall, college-educated individuals with an S&E or S&E-related degree enjoy an earnings premium compared tothose with a non-S&E degree; for the most part, this earnings premium is present across career stages. Figure
presents data on median salaries for groups with S&E, S&E-related, or non-S&E highest degrees at3-19comparable numbers of years since receiving their highest degrees. Although median salaries are similar in thebeginning for S&E and non-S&E degree holders, both of which are lower than that for S&E-related degree holders,the rise in earnings associated with career progression is much steeper among individuals with S&E degrees.Among S&E highest degree holders, those with engineering or computer and mathematical sciences degrees earnmore than degree holders in other broad S&E fields during early-to-mid career stages; engineering degree holderscontinue to enjoy an earnings premium through later career stages compared with their counterparts with degreesin most other broad S&E fields ( ).Figure 3-20

Chapter 3. Science and Engineering Labor Force
3 | 62National Science Board | Science & Engineering Indicators 2016
Figure 3-19
Median salaries for employed college-educated individuals, by broad field of highest degree andyears since highest degree: 2013
NOTE: See table 3-2 for classification of S&E, S&E-related, and non-S&E degree fields.
SOURCE: National Science Foundation, National Center for Science and Engineering Statistics, National Survey of CollegeGraduates (2013).
Science and Engineering Indicators 2016

Chapter 3. Science and Engineering Labor Force
3 | 63National Science Board | Science & Engineering Indicators 2016
Figure 3-20
Median salaries for S&E highest degree holders, by broad field of and years since highest degree:2013
SOURCE: National Science Foundation, National Center for Science and Engineering Statistics, Scientists and EngineersStatistical Data System (SESTAT) (2013), http://sestat.nsf.gov.
Science and Engineering Indicators 2016
Earnings also vary by degree levels. For those with an S&E highest degree, annual median salaries rise with amaster’s or doctoral degree (Appendix Table 3-9), and this pattern holds across career stages ( ).Figure 3-21Among those with an S&E-related or non-S&E highest degree, professional degree holders earn the most (AppendixTable 3-9). The relatively high salaries among S&E-related or non-S&E professional degree holders are drivenprimarily by medical practitioners and lawyers, respectively. A majority of college graduate workers whose highestdegree is a professional degree in an S&E-related field (70%) work as a diagnosing or treating practitioner (with amedian salary of $140,000); a majority of those whose highest degree is a professional degree in a non-S&E field(76%) work as a lawyer or judge (with a median salary of $107,000).

Chapter 3. Science and Engineering Labor Force
3 | 64National Science Board | Science & Engineering Indicators 2016
Figure 3-21
Median salaries for S&E highest degree holders, by level of and years since highest degree: 2013
SOURCE: National Science Foundation, National Center for Science and Engineering Statistics, Scientists and EngineersStatistical Data System (SESTAT) (2013), http://sestat.nsf.gov.
Science and Engineering Indicators 2016
Among employed individuals without a bachelor’s degree, S&E occupations provide stable jobs with competitivesalaries relative to those in non-S&E occupations. (See sidebar, ).S&E Workers Without a Bachelor's Degree
Recent S&E Graduates
In today’s knowledge-based and globally integrated economy marked by rapid information flow and development ofnew knowledge, products, and processes, demand for certain skills and abilities may change fast. The employmentoutcomes of recent graduates are an important indicator of current changes in labor market conditions. Comparedwith experienced S&E workers, recent S&E graduates more often bring new ideas and newly acquired skills to thelabor market. This section examines the employment outcomes of recent recipients of S&E bachelor’s, master’s,and doctoral degrees.
General Labor Market Indicators for Recent Graduates
Table 3-14 summarizes some basic labor market statistics in 2013 for recent recipients of S&E degrees; recenthere is defined as between 1 and 5 years since receiving the highest degree. Among the nearly 24 million SESTATrespondents in February 2013, 2.1 million were S&E degree recipients. Overall, the unemployment raterecentamong recent S&E graduates was 5.7%, compared with the 3.8% unemployment rate overall among the SESTATpopulation of scientists and engineers.

Chapter 3. Science and Engineering Labor Force
3 | 65National Science Board | Science & Engineering Indicators 2016
Table 3-14Labor market indicators for recent S&E degree recipients up to 5 years afterreceiving degree, by level and field of highest degree: 2013
Indicator andhighest degree level
AllS&Efields
Biological, agricultural,and environmental life
sciences
Computer andmathematical
sciences
Physicalsciences
Socialsciences
Engineering
Unemployment rate(%)
All degree levels 5.7 5.6 4.2 3.7 7.9 2.4
Bachelor’s 6.5 6.4 3.3 4.7 9.0 3.1
Master’s 4.2 3.8 6.7 S 5.1 0.8
Doctorate 2.3 2.6 S 5.0 3.1 S
Involuntarilyout-of-field (IOF)rate (%)
All degree levels 11.7 9.5 6.1 6.7 18.5 3.7
Bachelor’s 14.4 10.8 8.2 9.8 22.2 3.9
Master’s 6.0 8.0 S S 9.1 4.8
Doctorate 1.6 2.7 S 5.3 3.2 S
Median annualsalary ($)
All degree levels 40,000 34,000 57,000 34,000 34,000 65,000
Bachelor’s 35,000 30,000 52,000 30,000 31,000 60,000
Master’s 57,000 43,000 77,000 33,000 45,000 75,000
Doctorate 62,000 49,000 76,000 60,000 60,000 88,000
S = suppressed for reasons of confidentiality and/or reliability.
NOTES: Median annual salaries are rounded to the nearest $1,000. All degree levels includes professional degrees not broken out separately. Data include degrees earned from February 2008 to February 2012. The IOF rate is the
proportion of all employed individuals who report that their job is not related to their field of highest degreebecause a job in their highest degree field was not available.
SOURCE: National Science Foundation, National Center for Science and Engineering Statistics, Scientists and EngineersStatistical Data System (SESTAT) (2013), http://sestat.nsf.gov.
Science and Engineering Indicators 2016
Among recent bachelor’s degree holders, the unemployment rate averaged 6.5%, ranging from about 3% for thosewith engineering (3.1%) and computer and mathematical sciences (3.3%) degrees to 9.0% for those with socialsciences degrees. Overall, unemployment was generally lower for those with recent doctorates than for those withrecent bachelor’s or master’s level degrees. Early in their careers, as individuals gather labor market experienceand on-the-job skills, they tend to have a higher incidence of job change and unemployment, which may partiallyexplain some of the higher unemployment rates seen among those with a bachelor’s degree as their highestdegree.

Chapter 3. Science and Engineering Labor Force
3 | 66National Science Board | Science & Engineering Indicators 2016
A useful but more subjective indicator of labor market conditions for recent graduates is the proportion who reportthat their job is unrelated to their highest degree field because a job in their degree field was not available (i.e., theIOF rate). Of the nearly 2.1 million employed scientists and engineers who received their highest degree in an S&Efield in the previous 5 years, an estimated 11.7% indicated working involuntarily out of field in 2013 (Table 3-14). As such, the IOF rate among recent S&E degree recipients in 2013 was higher than the IOF rate among theoverall SESTAT population with an S&E highest degree (8.3%). SESTAT respondents were allowed to report morethan one reason for working out of field as well as the most important reason for working out of field. When askedabout the most important reason for working out of field, the reasons most frequently cited by recent S&E degreerecipients were lack of a suitable job in their degree field (cited by 38% of those working out of field), followed bypay and promotion opportunities (20%) and change in career or professional interests (13%). The responsesprovided by all S&E highest degree holders working out of field (regardless of graduation year) were similar, butthe factors were ranked differently: the most frequently cited reasons were pay and promotion opportunities (citedby 25% of all S&E highest degree holders working out of field), followed by change in career or professionalinterests (20%) and lack of a suitable job in their degree field (19%).
IOF rates vary across S&E degree levels and fields. Overall, IOF rates are lower among advanced degree holderscompared with those with only bachelor’s level degrees, but there exists significant variation across degree fields.Among recent bachelor’s degree holders, the IOF rate ranged from 3.9% among recent engineering graduates to22.2% among recent graduates in social sciences ( ). Among recent bachelor’s degree holders in socialTable 3-14sciences, IOF rates were high in all major fields, including economics, political sciences, psychology, and sociologyand anthropology. However, within social sciences, recent master’s degree and doctorate recipients experiencedsignificantly lower IOF rates than recent bachelor’s degree holders. On the contrary, among recent recipients ofengineering degrees, IOF rates were similar across degree levels.
The median salary for recent S&E bachelor’s degree recipients in 2013 was $35,000, ranging from $30,000 in lifesciences and physical sciences to $60,000 in engineering ( ). Recent master’s degree recipients had aTable 3-14median salary of $57,000, and recent doctorate recipients had a median salary of $62,000.
Recent Doctorate Recipients
The career rewards of highly skilled individuals in general, and doctorate holders in particular, often extend beyondsalary and employment to the more personal rewards of doing the kind of work for which they have trained. Nosingle standard measure satisfactorily reflects the state of the doctoral S&E labor market. This section discusses arange of relevant labor market indicators, including unemployment rates, IOF employment, employment inacademia compared with other sectors, employment in postdoctoral positions, and salaries. Although a doctoratecan expand career and salary opportunities, these opportunities may come at the price of many years of lost labormarket earnings due to the number of years required to earn the degree.
Unemployment. In February 2013, the unemployment rate for science, engineering, and health (SEH) doctoraterecipients up to 3 years after receiving their doctorates was 2.7% ( ), compared to an unemploymentTable 3-15rate of 2.1% for all SEH doctorates. The unemployment rate for recent SEH doctorate recipients was also lowerthan the unemployment rate for the entire SESTAT population regardless of level or year of award of highestdegree (3.8%).

Chapter 3. Science and Engineering Labor Force
3 | 67National Science Board | Science & Engineering Indicators 2016
Table 3-15Employment characteristics of recent SEH doctorate recipients up to 3 years after receiving doctorate, by field ofdegree: 2001–13
Recent doctorates ( )n Unemployment rate (%) Involuntarily out-of-field rate (%)
Field ofdoctorate 2001 2003 2006 2008 2010 2013 2001 2003 2006 2008 2010 2013 2001 2003 2006 2008 2010 2013
All recent SEHdoctorates
48,700 43,700 49,500 52,600 52,700 45,500 1.3 2.5 1.2 1.5 2.3 2.7 2.8 2.1 1.4 1.3 1.8 2.3
Biological,agricultural,andenvironmentallife sciences
12,300 11,200 12,600 13,400 14,100 12,200 1.4 2.4 0.9 1.7 1.5 3.4 2.6 1.0 0.3 1.0 1.5 2.6
Computer andinformationsciences
1,600 1,400 1,500 2,400 2,500 2,000 0.3 4.1 1.9 S S S S S 2.6 1.4 S S
Mathematicsand statistics
2,200 1,600 2,000 2,400 2,400 2,200 0.2 3.4 S S S S 1.4 3.4 2.2 1.1 S S
Physicalsciences
7,700 6,500 7,400 7,500 7,700 6,400 1.5 1.3 1.1 3.0 2.6 4.8 5.4 4.2 2.6 2.3 1.4 1.7
Psychology 7,200 6,300 7,000 5,800 5,400 4,700 1.5 2.7 1.2 0.8 3.8 S 3.0 1.5 1.4 0.8 2.0 S
Social sciences 5,800 6,000 6,200 5,900 6,000 5,400 1.6 3.1 1.4 2.1 3.4 3.8 3.3 3.0 2.3 3.4 3.5 5.9
Engineering 9,400 8,000 9,500 12,000 11,300 9,600 1.5 3.0 1.8 1.2 2.7 2.1 2.0 3.0 1.6 0.7 1.9 2.2
Health 2,400 2,700 3,200 3,300 3,400 3,000 0.4 0.7 0.9 1.2 S S S 1.1 S S S S
S = suppressed for reasons of confidentiality and/or reliability.
SEH = science, engineering, and health.
NOTES: Involuntarily out-of-field rate is the proportion of all employed individuals who report working in a job not related to their field of doctorate because a job in that field wasnot available. Data for 2001 and 2006 include graduates from 12 months to 36 months prior to the survey reference date; data for 2003, 2008, and 2010 includegraduates from 15 months to 36 months prior to the survey reference date; data for 2013 include graduates from 19 months to 36 months prior to the survey reference
date. Detail may not add to total because of rounding.
SOURCE: National Science Foundation, National Center for Science and Engineering Statistics, Survey of Doctorate Recipients (SDR) (2001–13), http://sestat.nsf.gov.
Science and Engineering Indicators 2016
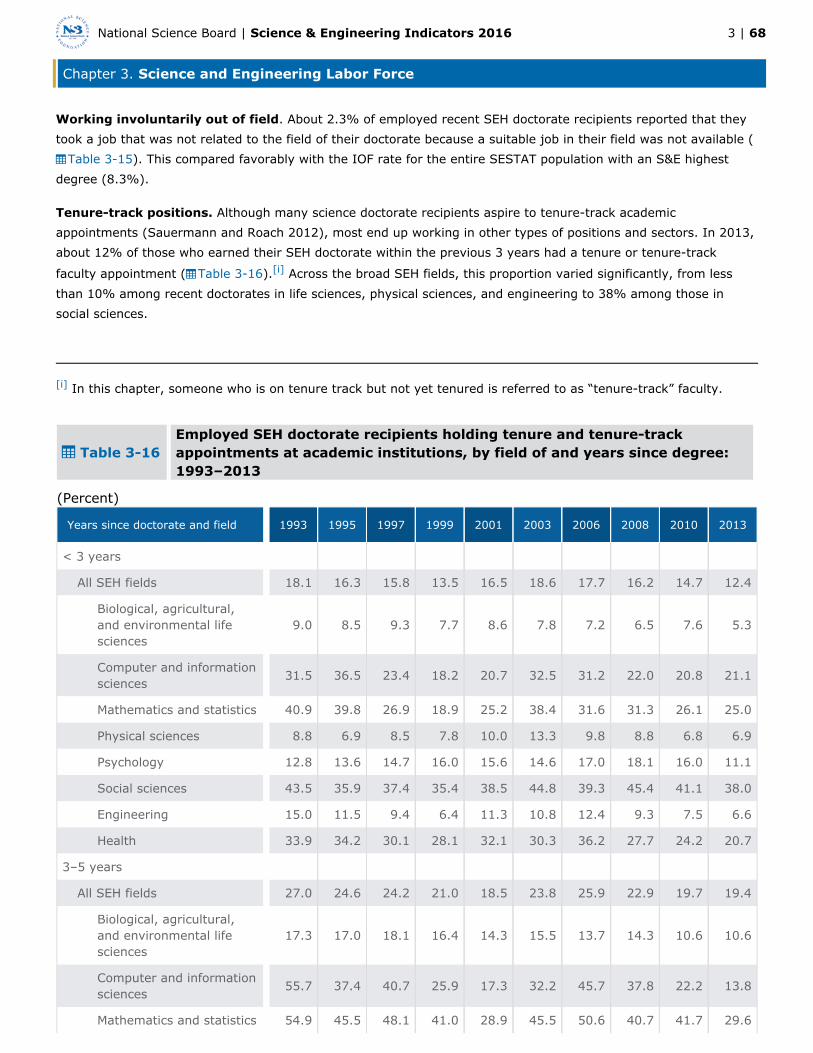
Chapter 3. Science and Engineering Labor Force
3 | 68National Science Board | Science & Engineering Indicators 2016
Working involuntarily out of field. About 2.3% of employed recent SEH doctorate recipients reported that theytook a job that was not related to the field of their doctorate because a suitable job in their field was not available (
). This compared favorably with the IOF rate for the entire SESTAT population with an S&E highestTable 3-15degree (8.3%).
Tenure-track positions. Although many science doctorate recipients aspire to tenure-track academicappointments (Sauermann and Roach 2012), most end up working in other types of positions and sectors. In 2013,about 12% of those who earned their SEH doctorate within the previous 3 years had a tenure or tenure-track
faculty appointment ( ). Across the broad SEH fields, this proportion varied significantly, from lessTable 3-16 [i]
than 10% among recent doctorates in life sciences, physical sciences, and engineering to 38% among those insocial sciences.
[i] In this chapter, someone who is on tenure track but not yet tenured is referred to as “tenure-track” faculty.
Table 3-16Employed SEH doctorate recipients holding tenure and tenure-trackappointments at academic institutions, by field of and years since degree:1993–2013
(Percent)
Years since doctorate and field 1993 1995 1997 1999 2001 2003 2006 2008 2010 2013
< 3 years
All SEH fields 18.1 16.3 15.8 13.5 16.5 18.6 17.7 16.2 14.7 12.4
Biological, agricultural,and environmental lifesciences
9.0 8.5 9.3 7.7 8.6 7.8 7.2 6.5 7.6 5.3
Computer and informationsciences
31.5 36.5 23.4 18.2 20.7 32.5 31.2 22.0 20.8 21.1
Mathematics and statistics 40.9 39.8 26.9 18.9 25.2 38.4 31.6 31.3 26.1 25.0
Physical sciences 8.8 6.9 8.5 7.8 10.0 13.3 9.8 8.8 6.8 6.9
Psychology 12.8 13.6 14.7 16.0 15.6 14.6 17.0 18.1 16.0 11.1
Social sciences 43.5 35.9 37.4 35.4 38.5 44.8 39.3 45.4 41.1 38.0
Engineering 15.0 11.5 9.4 6.4 11.3 10.8 12.4 9.3 7.5 6.6
Health 33.9 34.2 30.1 28.1 32.1 30.3 36.2 27.7 24.2 20.7
3–5 years
All SEH fields 27.0 24.6 24.2 21.0 18.5 23.8 25.9 22.9 19.7 19.4
Biological, agricultural,and environmental lifesciences
17.3 17.0 18.1 16.4 14.3 15.5 13.7 14.3 10.6 10.6
Computer and informationsciences
55.7 37.4 40.7 25.9 17.3 32.2 45.7 37.8 22.2 13.8
Mathematics and statistics 54.9 45.5 48.1 41.0 28.9 45.5 50.6 40.7 41.7 29.6

Chapter 3. Science and Engineering Labor Force
3 | 69National Science Board | Science & Engineering Indicators 2016
Years since doctorate and field 1993 1995 1997 1999 2001 2003 2006 2008 2010 2013
Physical sciences 18.8 15.5 14.5 11.9 15.8 18.3 19.7 16.5 14.7 14.3
Psychology 17.0 20.7 16.8 17.6 17.5 19.9 23.8 18.3 19.1 17.6
Social sciences 54.3 52.4 50.4 46.5 38.8 46.0 50.4 48.9 46.7 48.5
Engineering 22.7 19.3 19.4 12.6 10.8 15.9 16.3 15.5 13.0 14.6
Health 47.4 40.2 41.1 39.5 25.1 40.8 43.1 34.4 33.3 32.4
SEH = science, engineering, and health.
NOTES: Proportions are calculated on the basis of all doctorates working in all sectors of the economy. Data for1993–99, 2001, and 2006 include graduates from 12 months to 60 months prior to the survey reference date;data for 2003, 2008, and 2010 include graduates from 15 months to 60 months prior to the survey referencedate; data for 2013 include graduates from 19 months to 60 months prior to the survey reference date.
SOURCE: National Science Foundation, National Center for Science and Engineering Statistics, Survey of DoctorateRecipients (1993–2013), http://sestat.nsf.gov.
Science and Engineering Indicators 2016
The proportion of SEH doctorates who hold a tenure or tenure-track faculty appointment increases with years ofexperience. In 2013, 19% of SEH doctorates in the labor market for 3 to 5 years had tenure or a tenure-trackappointment, compared with 12% of their colleagues who were within 3 years of doctorate receipt ( ).Table 3-16The extent of the increase varies across the broad areas of training. In social sciences, for example, a relativelylarge percentage of individuals obtain a tenure or tenure-track position within 3 years of earning their doctorate,and the increase associated with 3 to 5 years of labor market exposure is more modest than in some other fields,such as physical sciences or engineering. (See chapter 5 for an in-depth discussion of various types of academicpositions held by S&E doctorate holders.)
The availability of tenure-track positions may be counterbalanced by the availability of desirable nonacademicemployment opportunities. Among recent doctorates in most S&E fields, median salaries are significantly higher inthe business sector than in tenured or tenure-track academic positions ( ). The proportion of recentTable 3-17graduates who obtain tenure or tenure-track employment has declined since 1993 in a number of broad areas ofSEH training ( ). One of the steepest declines occurred in computer sciences, particularly amongTable 3-16individuals within 3 to 5 years of receiving their doctorates, despite the high demand for computer sciences faculty.
Table 3-17Median salaries for recent SEH doctorate recipients up to 5 years afterreceiving degree, by field of degree and employment sector: 2013
(Dollars)
Education
4-year institutions
Field of doctorateAll
sectorsAll
positions
Tenured ortenure-track
positionPostdoc
2-year orprecollegeinstitutions
GovernmentBusiness/industry
All SEH fields 70,000 54,000 71,000 44,000 53,000 79,000 91,000

Chapter 3. Science and Engineering Labor Force
3 | 70National Science Board | Science & Engineering Indicators 2016
Education
4-year institutions
Field of doctorateAll
sectorsAll
positions
Tenured ortenure-track
positionPostdoc
2-year orprecollegeinstitutions
GovernmentBusiness/industry
Biological,agricultural, andenvironmental lifesciences
51,000 46,000 68,000 43,000 46,000 68,000 71,000
Computer andinformation sciences
105,000 78,000 88,000 S S 101,000 120,000
Mathematics andstatistics
72,000 60,000 62,000 63,000 S 89,000 96,000
Physical sciences 63,000 50,000 60,000 46,000 51,000 73,000 90,000
Psychology 62,000 54,000 60,000 42,000 53,000 83,000 66,000
Social sciences 66,000 62,000 68,000 48,000 58,000 89,000 86,000
Engineering 90,000 70,000 82,000 45,000 S 88,000 99,000
Health 78,000 70,000 71,000 42,000 S 79,000 99,000
S = suppressed for reasons of confidentiality and/or reliability.
SEH = science, engineering, and health.
NOTES: Salaries are rounded to the nearest $1,000. Data include graduates from 19 months to 60 months prior to thesurvey reference date. The 2-year or precollege institutions include 2-year colleges and community colleges ortechnical institutes and also preschool, elementary, middle, or secondary schools. The 4-year institutionsinclude 4-year colleges or universities, medical schools, and university-affiliated research institutes.
SOURCE: National Science Foundation, National Center for Science and Engineering Statistics, Survey of DoctorateRecipients (2013), http://sestat.nsf.gov.
Science and Engineering Indicators 2016
Salaries for recent SEH doctorate recipients. For all SEH degree fields in 2013, the median annual salary forrecent doctorate recipients within 5 years after receiving their degrees was $70,000 ( ). Across variousTable 3-17SEH degree fields, median annual salaries ranged from a low of $51,000 in biological sciences to a high of $105,000in computer and information sciences. Between 2010 and 2013, median salaries increased overall among recentrecipients of SEH doctoral degrees (the median salary for recent SEH doctorate recipients in 2010 was $66,000).
By type of employment, salaries for recent doctorate recipients ranged from $44,000 for postdoctoral positions in4-year institutions to $91,000 for those employed in the business sector ( ). Each sector, however,Table 3-17exhibited substantial internal variation by SEH fields of training.
Postdoctoral Positions
A significant number of new S&E doctorate recipients take a postdoctoral appointment (generally known as apostdoc) as their first position after receiving their doctorate. Postdoc positions are defined as temporary,short-term positions, primarily for acquiring additional training in an academic, government, industry, or nonprofit
setting. In many S&E disciplines, a postdoc position is necessary to be competitive for obtaining a faculty[ii]
position.

Chapter 3. Science and Engineering Labor Force
3 | 71National Science Board | Science & Engineering Indicators 2016
Individuals in postdoc positions often perform cutting-edge research and receive valuable training. These positions,however, generally offer lower salaries than permanent positions. A factor that has received much attention inscience policy is the growth seen over the last three decades in the number of postdocs in both traditional (e.g., lifesciences and physical sciences) and nontraditional (e.g., social sciences and engineering) academic disciplines andin an environment where the availability of research-intensive academic positions—the type of jobs for whichpostdocs are typically trained—have not risen at a similar pace (e.g., American Chemical Society 2013; NationalAcademy of Sciences, National Academy of Engineering, and Institute of Medicine 2000 and 2014; NationalInstitutes of Health 2012;). Neither the reasons for this growth nor its effects on the state of scientific research arewell understood. However, possible contributing factors include increases in competition for tenure-track academicresearch jobs, the need for collaborative research in large teams, the influx of graduate students in SEH areas withstrong postdoc traditions, and the need for additional specialized training. (See sidebar,Employment Patterns
.)among Biomedical Sciences Doctorates
[ii] Although the formal job title is often or , titles vary among organizations.postdoc fellowship research associateThis chapter generally uses the shorter, more commonly used, and best understood name, . A postdoc ispostdocgenerally considered a temporary position that individuals take primarily for additional training—a period ofadvanced professional apprenticeship—after completion of a doctorate.
Employment Patterns among Biomedical Sciences Doctorates
Employment patterns in the areas of biomedical sciences have changed in the past two decades. Thegrowth in the number of doctorates trained in the field has far surpassed the growth in tenure-trackacademic positions, intensifying the competition for academic jobs (NIH 2012). This sidebar uses data fromNSF’s Survey of Doctorate Recipients (SDR) to examine the changes over time in employment patternsamong U.S.-trained biomedical sciences doctorates. Foreign-trained doctorates are not covered by the SDRand are therefore not included in the analysis presented in this sidebar.
Between 1993 and 2013, the number of biomedical sciences doctorate holders rose substantially, about83%, from about 105,000 to nearly 192,000.* Over this same time, the proportion employed in 4-yearacademic institutions declined (from 55% to 49%) as did the proportion employed in tenure or tenure-trackpositions (from 35% to 25%) despite the fact that both increased in absolute number. In contrast, theproportion of biomedical sciences doctorates employed in the business sector rose (from 31% to 38%). Thecomparable changes among doctorate holders in other SEH areas of training were smaller: between 1993and 2013, the total size of this population rose 58%, the proportion employed in the 4-year academicinstitutions declined (from 43% to 40%), and the proportion employed in the business sector rose (from45% to 47%).
Between 1993 and 2013, the proportion of biomedical sciences doctorates reporting research (basic orapplied) as their primary or secondary work activity declined in both 4-year academic institutions (from78% to 70%) and businesses (from 55% to 47%). The majority of the increase in the number ofbiomedical sciences doctorates employed in the business sector was driven by those whose jobs did notinvolve research as their primary or secondary work activity. For-profit businesses accounted for two-thirdsof the increase in the overall business sector biomedical workforce, with nonprofit organizations and

Chapter 3. Science and Engineering Labor Force
3 | 72National Science Board | Science & Engineering Indicators 2016
unincorporated businesses accounting for the remainder of the increase. The for-profit business sector alsohas a smaller share of its biomedical doctorates performing research as a primary or secondary workactivity compared to nonprofit organizations.
The field of biomedical sciences has a strong tradition of postdoctoral training. In 2013, among those whoreceived their doctorates within the past 10 years of being surveyed, 26% of biomedical sciencesdoctorates reported being in a postdoctoral position, compared to only 7% of those with a doctorate inanother SEH field. When asked about the primary reason for accepting these positions, “postdoc generallyexpected in field” was reported by 43% of postdocs with a biomedical sciences doctorate, compared toabout 31% of postdocs with a doctorate in another SEH field. However, between 1993 and 2013, theproportion of doctorates employed in postdoc appointments declined both among biomedical sciencesdoctorates (from 30% to 26%) and among doctorates in other SEH fields (from 9% to 7%).
Despite the changes in employment patterns, overall employment indicators for biomedical sciencesdoctorates are generally favorable. In 2013, the unemployment rate for this group was 2.3%, and the rateof working involuntarily out of field (IOF) was 2.9%. These rates are both similar to those for doctorates inother SEH areas of training: an unemployment rate of 2.0% and an IOF rate of 3.0%. The median salaryfor biomedical sciences doctorates was $91,000 (compared to $99,000 for doctorates in other SEH areas oftraining). Median salaries in 4-year academic institutions and for-profit businesses, the two sectors thattogether employed three-fourths of biomedical sciences doctorates, were $78,000 and $120,000,respectively.
Foreign-trained doctorates in the field have grown significantly over time (NIH 2012), but the data on thissegment of the workforce are limited. The SDR data, which cover U.S.-trained doctorate holders, show thatthe number of foreign-born individuals in the field has increased rapidly over the past two decades:between 1993 and 2013, the number of non-U.S. citizens with U.S. biomedical sciences doctorates rose by260%; the comparable increase among other SEH doctorates as a whole, although substantial, was smaller(143%).
* See NIH (2012) for a discussion on the fields of science considered to be biomedical sciences. Based onthe report, the following degree categories from the SDR are included in the data presented in this sidebar:biochemistry and biophysics, bioengineering and biomedical engineering, cell and molecular biology,microbiological sciences and immunology, zoology, biology (general), botany, ecology, genetics (animal andplant), nutritional science, pharmacology (human and animal), physiology and pathology (human andanimal), and other biological sciences. Agricultural and food sciences, and environmental life sciences arenot included in the analysis.
Number of postdocs. The estimated number of postdocs varies depending on the data source used. No singledata source measures the entire population of postdocs. Two NSF surveys, the Survey of Doctorate Recipients(SDR) and the Survey of Graduate Students and Postdoctorates in Science and Engineering, include data related tothe number of postdocs in the United States. The SDR estimated that 27,100 U.S. SEH doctorate recipients in 2013were employed in postdoc positions, compared with 30,800 in 2010 and 19,800 a decade earlier in 2003. The vastmajority of these postdoc positions were in 4-year academic institutions (75% in 2013), with the remainder in thebusiness sector (14% in 2013) and government sector (11% in 2013). Within the business sector, nonprofitorganizations accounted for the vast majority of postdoc positions.

Chapter 3. Science and Engineering Labor Force
3 | 73National Science Board | Science & Engineering Indicators 2016
The estimated totals from NSF’s Survey of Graduate Students and Postdoctorates in Science and Engineering, whichcover academic postdocs, are significantly higher: 61,900 in 2013, compared with 63,400 in 2010 and 46,700 in2003 (NSF/NCSES, 2015a and 2015b). The two surveys cover different segments of the postdoc population. TheSurvey of Graduate Students and Postdoctorates in Science and Engineering gathers information on postdocsemployed in U.S. academic graduate departments, regardless of where these individuals earned their doctorates. Itdoes not cover individuals in nonacademic employment, at non-degree-granting graduate departments, or at someuniversity research centers. In contrast, the SDR covers U.S. residents who earned research doctorates in SEHfields from U.S. universities, but not those with doctorates from non-U.S. universities. Additionally, the SDR does
not cover some recent doctorates. As a result, the SDR omits a large number of postdocs who are foreign trained[iii]
or who had completed a 1-year postdoc immediately after graduation from a U.S. institution. The two surveyestimates overlap in some populations (U.S.-trained doctorates and those working in academia), but differ in others(the Survey of Graduate Students and Postdoctorates in Science and Engineering covers foreign-trained doctoratesbut not those in the industry or government sectors). In addition, the titles of postdoc researchers vary acrossorganizations and often change as individuals advance through their postdoc appointments; both of these factors
further complicate the data collection process (NIH 2012).[iv]
Postdocs by academic discipline. Although postdocs are increasingly common in SEH fields, the extent to whicha postdoc appointment is part of an individual’s career path varies greatly across SEH fields. Postdocs havehistorically been more common in life sciences and physical sciences than in other fields such as social sciences andengineering. Among new doctorate recipients in 2013, nearly 64% in life sciences (including agricultural sciences/natural resources, biological/biomedical sciences, and health sciences) and 54% in physical sciences indicated theywould take a postdoc appointment, compared to 36% in social sciences and 35% in engineering (Appendix Table
3-10). However, in life sciences and physical sciences, the proportion of new doctorate recipients indicating that[v]
they would take a postdoc position rose significantly between the early 1970s and the early 1990s and hasfluctuated within a relatively narrow range since then. In social sciences, the comparable proportion has continuedto rise gradually since the early 1970s. In engineering, the comparable proportion has risen overall between 1973and 2013 despite periodic fluctuations within this 40-year period.
Another indicator of the variation in the postdoc tradition across S&E disciplines is the proportion of recentgraduates who are employed as a postdoc (as opposed to those who plan to take a postdoc position aftergraduation). In 2013, about half of those who received their doctorates in the previous 3 years in biological,agricultural, and environmental life sciences (54%) or physical sciences (45%) were employed in postdoc positions,compared to only 6% of those who received doctorates in social sciences ( ).Figure 3-22
[iii] Data from the 2013 SDR were collected from doctoral graduates who received SEH research degrees from aU.S. academic institution before 1 July 2011 and as such underestimate the number of 1-year postdoctoralappointments completed prior to the reference date of February 2013.
[iv] NSF is currently developing a data collection strategy as part of its Early Career Doctorates Project (ECDP) togather in-depth information about postdoc researchers and other early career doctorates. The ECDP will collectinformation related to educational achievement, professional activities, employer demographics, professional andpersonal life balance, mentoring, training and research opportunities, and career paths and plans for individualswho earned their doctorate in the past 10 years and are employed in an academic institution or a research facility.
[v] These data are from the Survey of Earned Doctorates (SED), which is administered to individuals receivingresearch doctoral degrees from all accredited U.S. institutions.

Chapter 3. Science and Engineering Labor Force
3 | 74National Science Board | Science & Engineering Indicators 2016
Figure 3-22
Recent U.S. SEH doctorate recipients in postdoc positions, by field of and years since doctorate: 2013
SEH = science, engineering, and health.
NOTES: Proportions are calculated on the basis of all doctorates working in all sectors of the economy. Data include graduatesfrom 19 months to 60 months prior to the survey reference date (February 2013). Data for computer and information sciencesdoctorates are suppressed for reasons of confidentiality and/or reliability.
SOURCE: National Science Foundation, National Center for Science and Engineering Statistics, Survey of Doctorate Recipients(2013), http://sestat.nsf.gov.
Science and Engineering Indicators 2016
Postdoc compensation. Low compensation for postdocs is frequently raised as a concern by those who areworried about the effect of the increasing number of postdoc positions on the attractiveness of science careers. In2013, among individuals who had received their doctorate within the past 5 years, the median salary for postdocs($46,000) was just over half the median salary for individuals who were in other employment (e.g., non-postdocpositions) ($80,000) ( ). The postdoc salary differential ranged from about half among individuals withTable 3-18doctorates in engineering (52%) and health (55%) to three-quarters or more among those with doctorates in socialsciences (75%) and mathematics and statistics (85%).
Table 3-18Median salaries for recent U.S. SEH doctorate recipients in postdoc andnon-postdoc positions up to 5 years after receiving degree: 2013
(Dollars)

Chapter 3. Science and Engineering Labor Force
3 | 75National Science Board | Science & Engineering Indicators 2016
Field of doctorate All positions Postdocs Non-postdocs
All SEH 70,000 46,000 80,000
Biological, agricultural, and environmental life sciences 51,000 44,000 66,000
Computer and information sciences 105,000 S 106,000
Mathematics and statistics 72,000 64,000 75,000
Physical sciences 63,000 48,000 77,000
Psychology 62,000 42,000 65,000
Social sciences 66,000 50,000 67,000
Engineering 90,000 47,000 91,000
Health 78,000 45,000 82,000
S = suppressed for reasons of confidentiality and/or reliability.
SEH = science, engineering, and health.
NOTES: Salaries are rounded to the nearest $1,000. Data include graduates from 19 months to 60 months prior to thesurvey reference date.
SOURCE: National Science Foundation, National Center for Science and Engineering Statistics, Survey of DoctorateRecipients (2013), http://sestat.nsf.gov.
Science and Engineering Indicators 2016
Among recent graduates, somewhat larger proportions of postdocs than non-postdocs have access to certainemployer-provided benefits, such as health insurance (96% of postdocs and 91% of non-postdocs) and paidvacation, sick, or personal days (90% of postdocs and 84% of non-postdocs). However, a much smaller proportionof recent graduates in postdoc positions have access to employer-provided pensions or retirement plans (54% ofpostdocs and 82% of non-postdocs) or profit-sharing plans (6% of postdocs and 23% of non-postdocs).Information on the quality of these benefits—for example, the coverage and premium of health insurance plans,number of personal days offered by employers, and type of retirement benefits and profit sharing plans—is notavailable.
Reasons for taking postdoc positions. The 2013 SDR asked individuals in postdoc positions to report theirprimary reason for accepting these appointments. Most responses were consistent with the traditional objective of apostdoc position as a type of advanced apprenticeship for career progression, such as “postdoc generally expectedin field” (37%), “additional training in PhD field” (18%), “training in an area outside of PhD field” (15%), or “workwith a specific person or place” (14%). A smaller proportion (12%) of those in postdoc appointments reported lackof other suitable employment as the primary reason for accepting these positions. However, in life sciences andphysical sciences, the two broad fields with relatively high levels of postdoc appointments, the proportions of thosereporting lack of other employment as the primary reason for accepting a postdoc position were low (11% and15%, respectively) compared with the proportion of those in social sciences (40%), an area where postdocs aretypically not as common.
Characteristics of postdocs. According to the Survey of Graduate Students and Postdoctorates in Science and
Engineering, women held 39% of the nearly 62,000 academic postdoc positions in 2013 in SEH fields. Temporary[vi]
visa holders accounted for 52% of the academic postdocs, and U.S. citizens and permanent residents accounted forthe remaining 48%. Among postdocs in engineering, however, the proportion of women was lower (22%) and theproportion of temporary visa holders was higher (62%) compared to the overall SEH shares. Between 1979 and

Chapter 3. Science and Engineering Labor Force
3 | 76National Science Board | Science & Engineering Indicators 2016
2013, the number of academic postdocs increased threefold, driven primarily by temporary visa holders whoaccounted for nearly two-thirds (60%) of the total increase. The majority of academic postdocs (64%) in 2013 weresupported by research grants; the rest were supported by fellowships, traineeships, or other mechanisms.
[vi] The data tables for the 2013 Survey of Graduate Students and Postdoctorates in Science and Engineering areavailable at http://ncsesdata.nsf.gov/gradpostdoc/2013/ (accessed on 19 August 2015).

Chapter 3. Science and Engineering Labor Force
3 | 77National Science Board | Science & Engineering Indicators 2016
Age and Retirement of the S&E Workforce
The U.S. S&E workforce, reflecting overall population trends, is aging. This section focuses on indicators of theaging of the S&E workforce, including retirement patterns of S&E workers and workforce participation levels amongolder individuals. The age distribution and retirement patterns of S&E workers have important implications for thesupply of S&E expertise in the economy, but the overall effect is uncertain. Over time, members of the S&E laborforce may gain skills, experience, and judgment that translate into rising output and productivity. Consequently,the retirement of large numbers of experienced workers could mean the loss of valuable S&E expertise andknowledge. However, the retirement of older workers also makes room for newly trained S&E workers who may
bring updated skills and new approaches to solving problems.[i]
The aging of the S&E labor force is reflected in the median age, which has risen from 41 years in 1993 to 43 yearsin 2013. For proper context, the median age nationally for the U.S. population was 34 years in 1993 and 38 years
in 2013. Another indicator, the percentage of individuals in the S&E labor force between 51 and 75 years of age,[ii]
has risen from about 20% in 1993 to 34% in 2013 ( ). Over that period, this proportion rose for bothFigure 3-23men and women, but the women in the labor force continue to be younger relative to their male counterparts (
). In 1993, the median ages were 38 years for women and 42 years for men, whereas in 2013 theFigure 3-23median ages were 42 years for women and 45 years for men.
[i] See Stephan and Levin (1992) and Jones, Reedy, and Weinberg (2014) for in-depth discussions on age andscientific productivity.
[ii] The 1993 and 2013 data on median age for the U.S. population are from the U.S. Census Bureau’s PopulationEstimates Program, available at http://www.census.gov/popest/data/historical/index.html. The 2013 data areavailable at http://www.census.gov/popest/data/national/asrh/2013/index.html and the 1993 data are available athttp://www.census.gov/popest/data/national/totals/1990s/tables/nat-agesex.txt (accessed on 2 February 2015).

Chapter 3. Science and Engineering Labor Force
3 | 78National Science Board | Science & Engineering Indicators 2016
Figure 3-23
Age distribution of scientists and engineers in the labor force, by sex: 1993 and 2013
NOTES: For 1993 data, scientists and engineers include those with one or more S&E degrees at the bachelor's level or higheror those who have only a non-S&E degree at the bachelor's level or higher and are employed in an S&E occupation. For 2013data, scientists and engineers include those with one or more S&E or S&E-related degrees at the bachelor's level or higher orthose who have only a non-S&E degree at the bachelor's level or higher and are employed in an S&E or S&E-relatedoccupation. The Scientists and Engineers Statistical Data System (SESTAT) does not cover scientists and engineers over age75.
SOURCE: National Science Foundation, National Center for Science and Engineering Statistics, SESTAT (1993, 2013), http://sestat.nsf.gov.
Science and Engineering Indicators 2016
Age Differences among Occupations
SESTAT respondents working in S&E occupations are younger than those in S&E-related or non-S&E occupations (). In 2013, 28% of those in S&E occupations were between 51 and 75 years of age compared with 34%Figure 3-24
of those in S&E-related occupations and 37% of those in non-S&E occupations. The median age of the SESTATpopulation employed in S&E occupations was 41 years, compared to 44 years among those employed inS&E-related or non-S&E occupations. This may suggest, among other things, that as S&E workers age, theytransition from S&E occupations to S&E-related or non-S&E occupations.

Chapter 3. Science and Engineering Labor Force
3 | 79National Science Board | Science & Engineering Indicators 2016
Figure 3-24
Age distribution of employed scientists and engineers, by broad occupational category and broadfield of highest degree: 2013

Chapter 3. Science and Engineering Labor Force
3 | 80National Science Board | Science & Engineering Indicators 2016
NOTES: Scientists and engineers include those with one or more S&E or S&E-related degrees at the bachelor's level or higheror those who have only a non-S&E degree at the bachelor's level or higher and are employed in an S&E or S&E-relatedoccupation. The Scientists and Engineers Statistical Data System (SESTAT) does not cover scientists and engineers over age75.
SOURCE: National Science Foundation, National Center for Science and Engineering Statistics, SESTAT (2013), http://sestat.nsf.gov.
Science and Engineering Indicators 2016
Age Differences among Degree Fields
Similar to the trend seen across broad occupational categories, S&E highest degree holders are generally youngerthan those holding highest degrees in S&E-related or non-S&E fields ( ). In 2013, a smaller proportionFigure 3-24of S&E highest degree holders (31%) than S&E-related (37%) or non-S&E (36%) highest degree holders werebetween 51 and 75 years of age. In addition, degree holders in different S&E fields varied in their ages. S&Ehighest degree holders in physical sciences, particularly the men in this group, were older than those in other broadS&E fields (Appendix Table 3-11). S&E highest degree holders in computer and information sciences, a relativelynew field with rapid growth, were relatively young: only about 1 out of 5 were between 51 and 75 years of age.
Within broad degree areas, the age profile of different degree fields varies (Appendix Table 3-11). For example,within life sciences degree fields, between 30% and 31% of highest degree holders in biological sciences andenvironmental life sciences were between 51 and 75 years of age compared with 47% of highest degree holders inagricultural and food sciences. In all broad S&E fields of highest degree except computer and mathematicalsciences, women were younger than their male counterparts (Appendix Table 3-11).
Retirement
Trends in labor force participation among older individuals provide useful information about retirement patterns andhow these patterns may have changed over time. Recent patterns of leaving the labor force and shifting topart-time work among older members of the workforce suggest that the labor force participation rate amongscientists and engineers begins to decline sometime between the ages of 55 and 60 and is markedly reduced by thetime workers reach their late 60s. One indication of the relationship between age and the level of labor forceparticipation is illustrated by , which shows the proportions of older scientists and engineers workingFigure 3-25full time. In 2013, at age 50, 79% of scientists and engineers worked full time (35 hours or more per week) in theirprincipal job. Among individuals in their late-50s, this proportion dropped steeply. Among those in their mid-60s,for example, only about one-third worked full time. The overall pattern of declining full-time participation starting inindividuals’ mid- to late-50s held at all degree levels, although doctorate holders generally worked full time athigher rates than bachelor’s degree holders.

Chapter 3. Science and Engineering Labor Force
3 | 81National Science Board | Science & Engineering Indicators 2016
Figure 3-25
Older scientists and engineers who work full time, by age and highest degree level: 2013
NOTES: All degree levels includes professional degrees not reported separately. Scientists and engineers include those withone or more S&E or S&E-related degrees at the bachelor's level or higher or those who have only a non-S&E degree at thebachelor's level or higher and are employed in an S&E or S&E-related occupation.
SOURCE: National Science Foundation, National Center for Science and Engineering Statistics, Scientists and EngineersStatistical Data System (SESTAT) (2013), http://sestat.nsf.gov.
Science and Engineering Indicators 2016
Between 1993 and 2013, increasing proportions of scientists and engineers in their 60s reported still being in thelabor force. Whereas 69% of those aged 60 to 64 were in the labor force in 1993, by 2013 this had risen to 74%.For those between the ages of 65 and 69, the proportion rose from 39% in 1993 to 48% in 2013.
Reasons provided for labor force nonparticipation or part-time work status also shed light on the relationshipbetween age and retirement ( illustrates the relationship between age and labor force nonparticipationFigure 3-26because of retirement). In 2013, about 2.9 million scientists and engineers reported that they were out of the laborforce because of retirement. The vast majority (90%) of retired individuals were 60–75 years of age. Individualswith doctorates typically reported lower rates of retirement than those without doctorates.

Chapter 3. Science and Engineering Labor Force
3 | 82National Science Board | Science & Engineering Indicators 2016
Figure 3-26
Older scientists and engineers who report not working because of retirement, by age and highestdegree level: 2013
S = suppressed for reasons of confidentiality and/or reliability.
NOTES: All degree levels includes professional degrees not reported separately. Scientists and engineers include those withone or more S&E or S&E-related degrees at the bachelor's level or higher or those who have only a non-S&E degree at thebachelor's level or higher and are employed in an S&E or S&E-related occupation.
SOURCE: National Science Foundation, National Center for Science and Engineering Statistics, Scientists and EngineersStatistical Data System (SESTAT) (2013), http://sestat.nsf.gov.
Science and Engineering Indicators 2016
Retirement does not always mean that workers permanently leave the labor force. After nominally retiring fromtheir jobs, some workers continue to work part time, work in a different capacity, or decide to return to the labormarket at a later time. About 1.7 million employed scientists and engineers in 2013 reported that they hadpreviously retired from a job. A total of 757,000 scientists and engineers working part time in 2013 reported theirreason for working part time as having “previously retired or semi-retired.” Individuals who chose to stay in orreturn to the labor market following an occurrence of retirement were younger (median age 61) than those whowere out of the labor force following retirement (median age 66).

Chapter 3. Science and Engineering Labor Force
3 | 83National Science Board | Science & Engineering Indicators 2016
Women and Minorities in the S&E Workforce
As researchers and policymakers increasingly emphasize the need for expanding S&E capabilities in the UnitedStates, many view demographic groups with lower rates of S&E participation as an underutilized source of humancapital for S&E work. Historically, in the United States, S&E fields have had particularly low representation ofwomen and members of several racial and ethnic minority groups (i.e., blacks, Hispanics, American Indians orAlaska Natives), both relative to the concentrations of these groups in other occupational or degree areas andrelative to their overall representation in the general population. More recently, however, women and racial andethnic minorities increasingly have been choosing a wider range of degrees and occupations. This section presentsdata on S&E participation among women and among racial and ethnic minorities. It also presents data on earningsdifferentials by sex and by race and ethnicity.
Women in the S&E Workforce
Historically, men have outnumbered women by wide margins with regards to both S&E employment and S&Etraining. Although the number of women in S&E occupations or with S&E degrees doubled over the past twodecades, the disparity has narrowed only modestly. This imbalance is still particularly pronounced in S&Eoccupations. In 2013, women constituted only 29% of workers in these occupations, although they accounted forhalf of the college-educated workforce overall. Among S&E degree holders, the disparity was smaller butnonetheless significant with women representing 39% of employed individuals with a highest degree in S&E (
).Figure 3-27

Chapter 3. Science and Engineering Labor Force
3 | 84National Science Board | Science & Engineering Indicators 2016
Figure 3-27
Women in the workforce and in S&E: 1993 and 2013
SOURCES: National Science Foundation, National Center for Science and Engineering Statistics, Scientists and EngineersStatistical Data System (SESTAT) and National Survey of College Graduates (NSCG) (1993, 2013), http://sestat.nsf.gov.
Science and Engineering Indicators 2016
Women in S&E Occupations
Although women represented only 29% of individuals in S&E occupations in 2013, women’s presence varies widelyacross S&E occupational fields (Appendix Table 3-12 and ). The percentage of female S&E workersFigure 3-28continues to be lowest in engineering, where women constituted 15% of the workforce in 2013. Among engineeringoccupations with large numbers of workers, women accounted for only 8% of the workforce of mechanicalengineers and about 11% to 12% of the workforce of electrical and computer hardware engineers and ofaerospace, aeronautical, and astronautical engineers (Appendix Table 3-12).

Chapter 3. Science and Engineering Labor Force
3 | 85National Science Board | Science & Engineering Indicators 2016
Figure 3-28
Women in S&E occupations: 1993–2013
NOTE: National estimates were not available from the Scientists and Engineers Statistical Data System (SESTAT) in 2001.
SOURCE: National Science Foundation, National Center for Science and Engineering Statistics, SESTAT (1993–2013), http://sestat.nsf.gov.
Science and Engineering Indicators 2016
Other disproportionately male S&E occupations include physical scientists (31% women) and computer andmathematical scientists (25% women). Within physical sciences occupations, physicists and astronomers have thelargest imbalance (11% women). Within computer and mathematical sciences occupations, the largest component,computer and information scientists, has a smaller proportion of women (24%), compared with the mathematicalscientists component, which is closer to parity (42% women).
In 2013, sex parity in S&E occupations was close among life scientists (48% women). The largest component of lifesciences, biological and medical scientists, had reached gender parity (52% women). The field of social scienceswas majority female (62%). Occupations within social sciences, however, varied widely: women accounted for 49%of economists but for 74% of psychologists. Psychologists, estimated at about 208,000 total workers in SESTAT(Appendix Table 3-12), represent an example of a large S&E occupation with substantially more women than men.
In contrast to jobs in S&E occupations, a majority of jobs in S&E-related occupations (56%) are held by women(Appendix Table 3-12). The largest component, health-related occupations, has a large share of women (69%)whose jobs are primarily as nurse practitioners, pharmacists, registered nurses, dietitians, therapists, physicianassistants, and health technologists and technicians; women represented the vast majority of workers in theseparticular health occupations. In contrast, among health occupations such as diagnosing and treating practitioners,women accounted for a much smaller proportion (37%).

Chapter 3. Science and Engineering Labor Force
3 | 86National Science Board | Science & Engineering Indicators 2016
Since the early 1990s, the number of women working in each broad S&E occupational category has risensignificantly ( ). The rate of growth has been strong among life scientists, computer and mathematicalFigure 3-28scientists, and social scientists. These three broad S&E fields together employed 80% of women in S&E occupationsin 2013, compared with 62% of men in S&E occupations. Between 1993 and 2013, the number of women nearlytripled among life scientists (an increase of 181%) and more than doubled among social scientists (an increase of122%). The number of men also grew, but the rate of growth for women was greater than that for men, resultingin an increase in the proportion of female life scientists and female social scientists.
During the same period, the number of women in computer and mathematical sciences occupations also doubled(an increase of 120%). However, this new, rapidly growing and changing field attracted relatively more men thanwomen (male participation grew 188%). The result has been an overall decline in the proportion of women from31% to 25%. These trends make the gender disparity among computer and mathematical scientists second only tothe gender disparity among engineers. However, the declining proportion of women in computer and mathematicalsciences occupations does not extend to doctorate-level workers: Among those with a doctorate, the proportion ofwomen increased, from 16% in 1993 to 21% in 2013.
During the past two decades, the proportion of women also increased among workers in engineering (from 9% to15%) and in physical sciences (from 21% to 31%). In these two occupational categories, this increase was led byan expansion of women’s numbers in the workforce (by 94% in engineering and 63% in physical sciences) whilemen’s numbers barely changed between 1993 and 2013. (See sidebar forWomen in Leading Roles and Positionsa discussion on the presence of women in leading roles.)
Women in Leading Roles and Positions
This sidebar reports data from NSF’s Scientists and Engineers Statistical Data System (SESTAT) on thepresence of women in various types of leading roles, including management occupations, supervisorypositions, and academic positions. Overall, the data indicate that men outnumber women in a wide range ofleading roles despite the increasing presence of women in many of these positions.
Data from SESTAT indicate that women accounted for 31% of scientists and engineers employed in S&Emanagement occupations in 2013 (Appendix Table 3-12). The gender imbalance was particularlypronounced among engineering managers (11% women), computer and information systems managers(24% women), and natural sciences managers (32% women). In contrast, a majority of medical and healthservices managers were women (55%). Among scientists and engineers employed as non-S&E managers,27% were women, although the proportion of women in these jobs ranged from 25% among top-levelmanagers, executives, and administrators (e.g., chief executive officer/chief operating officer/chief financialofficer, president, district/general manager/provost) to 42% among education administrators (i.e.,registrar, dean, principal).
Data from SESTAT also provide information on work activities in one’s principal job. In 2013, womenaccounted for 37% of the 9 million scientists and engineers who reported supervising the work of others aspart of their principal job, which reflects an increase since 1993 when the comparable proportion was 25%.
Data from the Survey of Doctorate Recipients (SDR) show a similar pattern among academically employedS&E doctorate holders. In 2013, women accounted for 29% of the tenured faculty positions held byU.S.-educated S&E doctorate holders. Women were closer to parity among tenure-track (but not yettenured) faculty (42% women). The number of women in tenured or tenure-track positions has risensignificantly in the past two decades. Between 1993 and 2013, the number of female science, engineering,
Chapter 3. Science and Engineering Labor Force
3 | 87National Science Board | Science & Engineering Indicators 2016
and health (SEH) doctorate holders in such positions more than doubled (from about 27,000 to 62,000).The number of men in these positions also grew (by 5%), although not as fast as the number of women,resulting in an increase in the overall share of women among tenured positions (from 14% to 29%) andtenure-track positions (from 30% to 42%). However, the presence of women significantly varies acrossSEH fields. Life sciences, social sciences, psychology, and health fields generally have higher concentrationsof female faculty than engineering, computer sciences, physical sciences, and mathematics. (See chapter 5for additional details on academic employment of SEH doctorates.)
Additionally, data from the SDR show that in 2013 women accounted for 28% of SEH doctorate holdersemployed as an academic dean, department head, or department chair and for 34% of those employed asan academic president, provost, or chancellor.
Women among S&E Highest Degree Holders
The sex disparity among employed S&E highest degree holders is less than the disparity among those in S&Eoccupations. In 2013, among individuals with a highest degree in an S&E field, women constituted 39% of thosewho were employed, up from 31% in 1993 ( ). The pattern of variation in the proportion of men andFigure 3-27women among degree fields echoes the pattern of variation among occupations associated with those fields(Appendix Table 3-13). In 2013, 55% of S&E highest degree holders in social sciences fields were women, as were48% of those with a highest degree in the biological and related sciences. Men outnumbered women amongcomputer sciences and mathematics highest degree holders (30% women) and among physical sciences highestdegree holders (30% women). Disparities, however, were greatest among those with a highest degree inengineering (15% women).
In all broad fields except computer and mathematical sciences, the proportion of women in the workforce withassociated highest degrees has been increasing since 1993. In computer and mathematical sciences, this proportionhas declined as the number of women with a highest degree in the field has risen, but less rapidly than that of menin this new and rapidly growing field.
Sex differences are not limited to the field of degree, but also extend to the level of S&E degree. Overall, menoutnumber women among S&E highest degree holders at the bachelor’s, master’s, and doctoral levels. The sexdisparity is more severe among S&E doctorate holders than among S&E bachelor’s or master’s degree holders. Forexample, in 2013 women accounted for 39% and 41% of those whose highest degree in S&E was at the bachelor’sand master’s level, respectively, but 32% of those whose highest degree in S&E was at the doctoral level (Figure
). Engineering was an exception: in this field, women represented a similar proportion (14%) of highest degree3-29holders at the bachelor’s and doctorate levels. However, for S&E fields overall at all three degree levels, theproportion of women has risen in the past two decades ( ).Figure 3-29

Chapter 3. Science and Engineering Labor Force
3 | 88National Science Board | Science & Engineering Indicators 2016
Figure 3-29
Employed women with highest degree in S&E, by degree level: 1993–2013
NOTE: National estimates were not available from the Scientists and Engineers Statistical Data System (SESTAT) in 2001.
SOURCE: National Science Foundation, National Center for Science and Engineering Statistics, SESTAT (1993–2013), http://sestat.nsf.gov.
Science and Engineering Indicators 2016
Working men and women with S&E highest degrees also differ in the extent to which they are employed in thesame field as their S&E highest degree. This disparity is largely the result of women having a high concentration inthe two degree areas—social sciences and life sciences—where degree holders most often work in an occupationoutside of S&E. In 2013, these two broad fields accounted for nearly three-fourths (73%) of all employed womenwith S&E highest degrees, compared with 41% of all employed men with S&E highest degrees (Appendix Table3-13).
Across all S&E degree areas, 19% of women with an S&E highest degree are employed in the S&E field in whichthey earned their highest degree compared with 31% of men (Appendix Table 3-14). However, the pattern variesby degree fields. Among life sciences and engineering degree holders, similar proportions of men and women areemployed in the broad S&E field in which they earned their degree. Computer and mathematical sciences fieldsrepresent an exception in which a larger proportion of men (56%) than women (39%) work in an occupation thatmatches their broad degree field and a larger proportion of women (42%) than men (26%) work in non-S&Eoccupations. Among those with life sciences degrees, although a similar proportion of men (23%) and women(23%) work in their degree field, a larger proportion of women (32%) than men (18%) are employed inS&E-related occupations. The vast majority of social sciences degree holders work in non-S&E occupations, and thispattern is observed among both male (80%) and female (79%) degree holders.

Chapter 3. Science and Engineering Labor Force
3 | 89National Science Board | Science & Engineering Indicators 2016
Men and women with a highest degree in an S&E field also differ in their labor force nonparticipation rates.Compared with men, women were more likely to be out of the labor force (22% versus 14% for men). Thedifference in nonparticipation was particularly pronounced between the ages of 30 and 65 ( ). In 2013,Figure 3-3019% of the women in this age group with an S&E highest degree were out of the labor force compared with 8% ofthe men. Many women in this group identified family reasons as an important factor: 39% of women reported thatfamily was a factor for their labor force nonparticipation compared with 9% of men. Within this age range, womenwere also much more likely than men to report that they did not need to work or did not want to work (29% ofwomen versus 16% of men). Men, on the other hand, were much more likely than women to cite retirement as areason for not working (26% of women versus 48% of men).

Chapter 3. Science and Engineering Labor Force
3 | 90National Science Board | Science & Engineering Indicators 2016
Figure 3-30
Highest degree holders in S&E not in the labor force, by sex and age: 2013
NOTE: Not in the labor force includes those neither working nor looking for work in the 4 weeks prior to February 2013.
SOURCE: National Science Foundation, National Center for Science and Engineering Statistics, Scientists and EngineersStatistical Data System (SESTAT) (2013), http://sestat.nsf.gov.
Science and Engineering Indicators 2016
Minorities in the S&E Workforce
The participation of underrepresented racial and ethnic minorities in the S&E workforce has been a concern ofpolicymakers who are interested in the development and employment of diverse human capital to maintain theUnited States’ global competitiveness in S&E. This section addresses the level of diversity in S&E by race and
Hispanic ethnicity. Like the preceding section, this section draws on data from NSF’s SESTAT surveys to report on[i]
levels of S&E participation: first across occupations and then across the overall workforce with S&E degrees.
Whether defined by occupation, S&E degree, or a combination of the two, the majority of scientists and engineersin the United States are non-Hispanic whites. The next largest group of scientists and engineers are Asians. Severalracial and ethnic minority groups, including blacks, Hispanics, and American Indians or Alaska Natives, have lowlevels of participation in S&E fields both compared with other groups and compared with their proportion in thepopulation ( ).Table 3-19
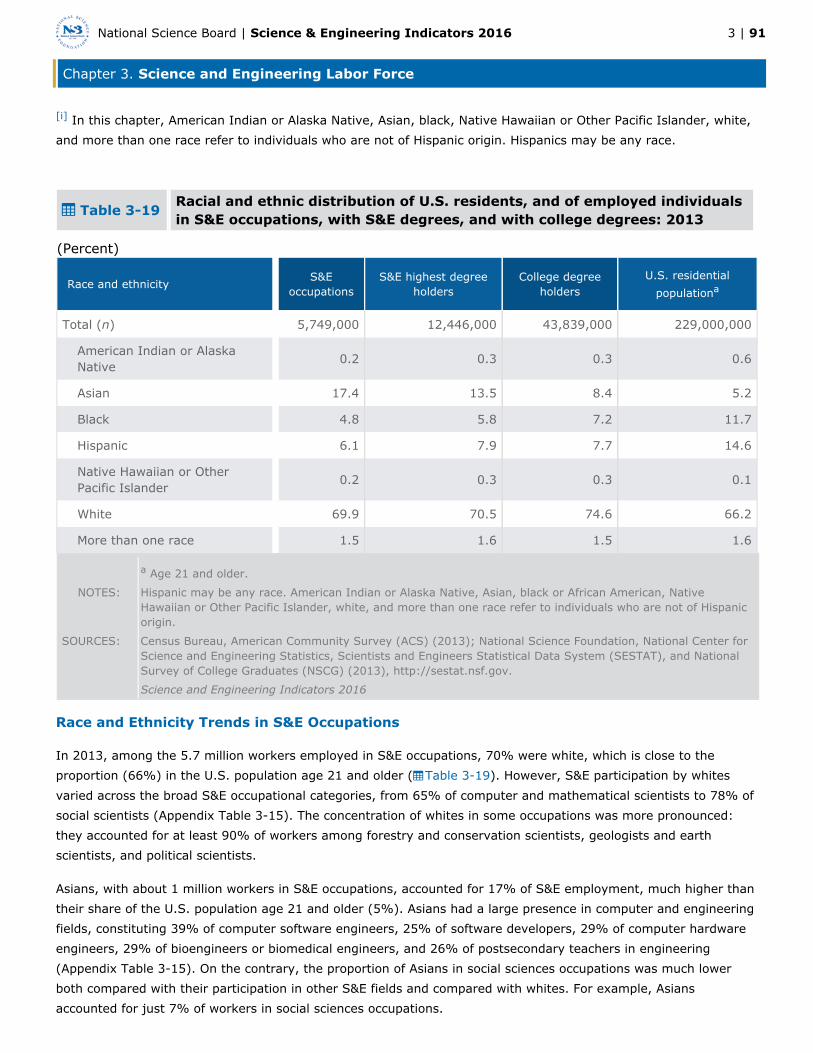
Chapter 3. Science and Engineering Labor Force
3 | 91National Science Board | Science & Engineering Indicators 2016
[i] In this chapter, American Indian or Alaska Native, Asian, black, Native Hawaiian or Other Pacific Islander, white,and more than one race refer to individuals who are not of Hispanic origin. Hispanics may be any race.
Table 3-19Racial and ethnic distribution of U.S. residents, and of employed individualsin S&E occupations, with S&E degrees, and with college degrees: 2013
(Percent)
Race and ethnicity S&Eoccupations
S&E highest degreeholders
College degreeholders
U.S. residentialpopulationa
Total (n) 5,749,000 12,446,000 43,839,000 229,000,000
American Indian or AlaskaNative
0.2 0.3 0.3 0.6
Asian 17.4 13.5 8.4 5.2
Black 4.8 5.8 7.2 11.7
Hispanic 6.1 7.9 7.7 14.6
Native Hawaiian or OtherPacific Islander
0.2 0.3 0.3 0.1
White 69.9 70.5 74.6 66.2
More than one race 1.5 1.6 1.5 1.6
a Age 21 and older.
NOTES: Hispanic may be any race. American Indian or Alaska Native, Asian, black or African American, NativeHawaiian or Other Pacific Islander, white, and more than one race refer to individuals who are not of Hispanicorigin.
SOURCES: Census Bureau, American Community Survey (ACS) (2013); National Science Foundation, National Center forScience and Engineering Statistics, Scientists and Engineers Statistical Data System (SESTAT), and NationalSurvey of College Graduates (NSCG) (2013), http://sestat.nsf.gov.
Science and Engineering Indicators 2016
Race and Ethnicity Trends in S&E Occupations
In 2013, among the 5.7 million workers employed in S&E occupations, 70% were white, which is close to theproportion (66%) in the U.S. population age 21 and older ( ). However, S&E participation by whitesTable 3-19varied across the broad S&E occupational categories, from 65% of computer and mathematical scientists to 78% ofsocial scientists (Appendix Table 3-15). The concentration of whites in some occupations was more pronounced:they accounted for at least 90% of workers among forestry and conservation scientists, geologists and earthscientists, and political scientists.
Asians, with about 1 million workers in S&E occupations, accounted for 17% of S&E employment, much higher thantheir share of the U.S. population age 21 and older (5%). Asians had a large presence in computer and engineeringfields, constituting 39% of computer software engineers, 25% of software developers, 29% of computer hardwareengineers, 29% of bioengineers or biomedical engineers, and 26% of postsecondary teachers in engineering(Appendix Table 3-15). On the contrary, the proportion of Asians in social sciences occupations was much lowerboth compared with their participation in other S&E fields and compared with whites. For example, Asiansaccounted for just 7% of workers in social sciences occupations.

Chapter 3. Science and Engineering Labor Force
3 | 92National Science Board | Science & Engineering Indicators 2016
Overall, Hispanics accounted for 6% of employment in S&E occupations, which is lower than their share of the U.S.population age 21 and older (15%) ( ). Hispanics had a particularly large presence among psychologistsTable 3-19(11%); mathematical scientists (11%); medical scientists (excluding practitioners) (8%); and industrial engineers(10%). Blacks accounted for 5% of S&E employment, which is lower than their share of the U.S. population age 21and older (12%) ( ). Blacks had relatively high participation rates among computer systems analystsTable 3-19(11%), database administrators (13%), information security analysts (16%), and sociologists (10%).
Over the past two decades, the U.S. workforce in S&E occupations has become more diverse with increasingproportions of Asians, blacks, and Hispanics and a decreasing proportion of whites ( ). In 1993, 84% ofTable 3-20workers in S&E occupations reported their race as white. By 2013, this proportion declined to 70%. Most of thedecline in the proportion of whites during this period was offset by an increase in the proportion of Asians and, to alesser degree, by increases in the proportion of other groups, particularly Hispanics.
Table 3-20Distribution of workers in S&E occupations, by race and ethnicity:1993–2013
(Percent)
Race and ethnicity 1993 1995 1997 1999 2003 2006 2008 2010 2013
American Indian or Alaska Native 0.2 0.3 0.3 0.3 0.3 0.4 0.3 0.2 0.2
Asian 9.1 9.6 10.4 11.0 14.2 16.1 16.9 18.5 17.4
Black 3.6 3.4 3.4 3.4 4.3 3.9 3.9 4.6 4.8
Hispanic 2.9 2.8 3.1 3.4 4.4 4.6 4.9 5.2 6.1
Native Hawaiian or Other PacificIslander
NA NA NA NA 0.3 0.5 0.4 0.2 0.2
White 84.1 83.9 82.9 81.8 75.2 73.2 71.8 69.9 69.9
More than one race NA NA NA NA 1.4 1.4 1.7 1.4 1.5
NA = not available.
NOTES: Hispanic may be any race. American Indian or Alaska Native, Asian, black or African American, NativeHawaiian or Other Pacific Islander, white, and more than one race refer to individuals who are not of Hispanic
origin. Before 2003, respondents could not classify themselves in more than one racial and ethnic category,and Asian included Native Hawaiian and Other Pacific Islander.
SOURCE: National Science Foundation, National Center for Science and Engineering Statistics, Scientists and EngineersStatistical Data System (SESTAT) (1993–2013), http://sestat.nsf.gov.
Science and Engineering Indicators 2016
Some of the changes by race over time may reflect changes to the way NSF and other federal government surveyscollect information on this topic. After 2000, respondents to NSF surveys were able to report more than one race.Some of those who self-reported as white in the 1990s may have instead reported a multiracial identity after 2000once they were given this option, which would decrease the estimated numbers of whites. However, because lessthan 2% of S&E workers reported a multiracial identity in years when that option was available, it is unlikely thatthis change contributed much to the decline in the proportion of whites between 1993 and 2013.
Racial and Ethnic Differences among S&E Degree Holders
Among those in the workforce whose highest degree is in S&E, the shares of racial and ethnic groups vary similarlyacross degree fields as they do in occupations ( ; Appendix Table 3-16). Compared to other broad S&ETable 3-21

Chapter 3. Science and Engineering Labor Force
3 | 93National Science Board | Science & Engineering Indicators 2016
fields, Asians have higher participation rates among those with degrees in engineering and in computer andmathematical sciences; blacks have higher participation rates among those with degrees in computer andmathematical sciences and in social sciences; Hispanics have slightly lower participation rates among those withdegrees in computer and mathematical sciences and in physical sciences. Whites represent relatively smallersegments of degree holders in engineering and computer and mathematical sciences than in life, physical, andsocial sciences.
Table 3-21Racial and ethnic distribution of employed individuals with S&E highestdegree, by field of highest degree: 2013
(Percent)
Race and ethnicity All S&Efields
Biological,agricultural, and
environmental lifesciences
Computer andmathematical
sciences
Physicalsciences
Socialsciences
Engineering
Employed withhighest degree inS&E (n)
12,446,000 1,896,000 2,197,000 731,000 4,764,000 2,859,000
American Indianor Alaska Native
0.3 0.3 0.1 0.7 0.3 0.2
Asian 13.5 12.0 20.9 16.1 6.2 20.3
Black 5.8 4.6 7.4 2.3 7.5 3.6
Hispanic 7.9 7.4 5.9 5.2 9.2 8.3
Native Hawaiianor Other PacificIslander
0.3 S 0.1 0.1 0.5 0.2
White 70.5 73.7 64.2 74.1 74.3 66.1
More than onerace
1.6 1.5 1.3 1.4 2.0 1.3
S = suppressed for reasons of confidentiality and/or reliability.
NOTES: Hispanic may be any race. American Indian or Alaska Native, Asian, black or African American, NativeHawaiian or Other Pacific Islander, white, and more than one race refer to individuals who are not of Hispanicorigin.
SOURCE: National Science Foundation, National Center for Science and Engineering Statistics, Scientists and EngineersStatistical Data System (SESTAT) (2013), http://sestat.nsf.gov.
Science and Engineering Indicators 2016
The demographic groups also differ in the level of their highest degree ( ), with Asians accounting forTable 3-22larger proportions of those whose highest degree is at the master’s or doctoral level, relative to their counterpartswith a highest degree at the bachelor’s level. Conversely, blacks, Hispanics, and whites all represent largerproportions of those whose highest degree is at the bachelor’s degree level, relative to those with a doctorate astheir highest degree.
Table 3-22Racial and ethnic distribution of employed individuals with S&E highestdegree, by level of highest degree: 2013
(Percent)
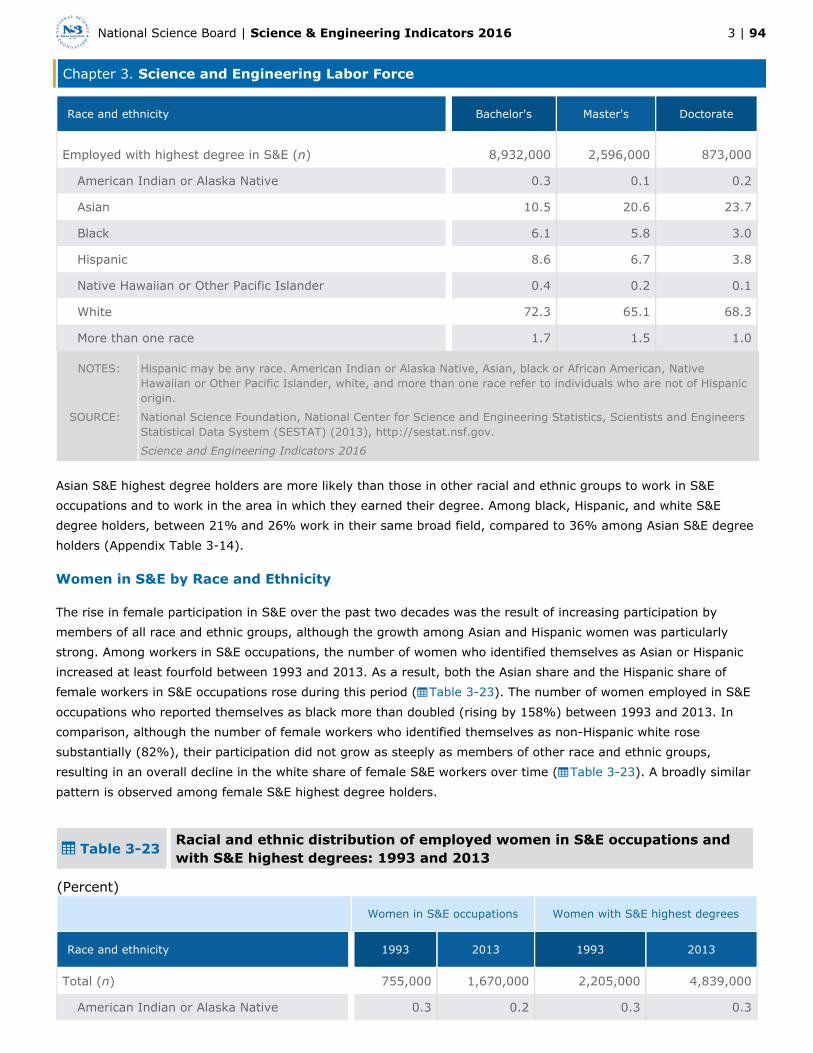
Chapter 3. Science and Engineering Labor Force
3 | 94National Science Board | Science & Engineering Indicators 2016
Race and ethnicity Bachelor's Master's Doctorate
Employed with highest degree in S&E (n) 8,932,000 2,596,000 873,000
American Indian or Alaska Native 0.3 0.1 0.2
Asian 10.5 20.6 23.7
Black 6.1 5.8 3.0
Hispanic 8.6 6.7 3.8
Native Hawaiian or Other Pacific Islander 0.4 0.2 0.1
White 72.3 65.1 68.3
More than one race 1.7 1.5 1.0
NOTES: Hispanic may be any race. American Indian or Alaska Native, Asian, black or African American, NativeHawaiian or Other Pacific Islander, white, and more than one race refer to individuals who are not of Hispanicorigin.
SOURCE: National Science Foundation, National Center for Science and Engineering Statistics, Scientists and EngineersStatistical Data System (SESTAT) (2013), http://sestat.nsf.gov.
Science and Engineering Indicators 2016
Asian S&E highest degree holders are more likely than those in other racial and ethnic groups to work in S&Eoccupations and to work in the area in which they earned their degree. Among black, Hispanic, and white S&Edegree holders, between 21% and 26% work in their same broad field, compared to 36% among Asian S&E degreeholders (Appendix Table 3-14).
Women in S&E by Race and Ethnicity
The rise in female participation in S&E over the past two decades was the result of increasing participation bymembers of all race and ethnic groups, although the growth among Asian and Hispanic women was particularlystrong. Among workers in S&E occupations, the number of women who identified themselves as Asian or Hispanicincreased at least fourfold between 1993 and 2013. As a result, both the Asian share and the Hispanic share offemale workers in S&E occupations rose during this period ( ). The number of women employed in S&ETable 3-23occupations who reported themselves as black more than doubled (rising by 158%) between 1993 and 2013. Incomparison, although the number of female workers who identified themselves as non-Hispanic white rosesubstantially (82%), their participation did not grow as steeply as members of other race and ethnic groups,resulting in an overall decline in the white share of female S&E workers over time ( ). A broadly similarTable 3-23pattern is observed among female S&E highest degree holders.
Table 3-23Racial and ethnic distribution of employed women in S&E occupations andwith S&E highest degrees: 1993 and 2013
(Percent)
Women in S&E occupations Women with S&E highest degrees
Race and ethnicity 1993 2013 1993 2013
Total (n) 755,000 1,670,000 2,205,000 4,839,000
American Indian or Alaska Native 0.3 0.2 0.3 0.3

Chapter 3. Science and Engineering Labor Force
3 | 95National Science Board | Science & Engineering Indicators 2016
Women in S&E occupations Women with S&E highest degrees
Race and ethnicity 1993 2013 1993 2013
Asian 9.3 17.7 7.3 12.2
Black 5.7 6.6 8.1 7.6
Hispanic 3.2 6.9 3.6 9.4
Native Hawaiian or Other Pacific Islander NA 0.1 NA 0.3
White 81.5 66.9 80.6 68.3
More than one race NA 1.4 NA 1.9
NA = not available.
NOTES: Hispanic may be any race. American Indian or Alaska Native, Asian, black or African American, NativeHawaiian or Other Pacific Islander, white, and more than one race refer to individuals who are not of Hispanic
origin. In 1993, respondents could not classify themselves in more than one racial and ethnic category, andAsian included Native Hawaiian and Other Pacific Islander.
SOURCE: National Science Foundation, National Center for Science and Engineering Statistics, Scientists and EngineersStatistical Data System (SESTAT) (1993, 2013), http://sestat.nsf.gov.
Science and Engineering Indicators 2016
Salary Differences for Women and Racial and Ethnic Minorities
Women and racial and ethnic minority groups generally receive less pay than their male and white counterparts (). However, salary differences between men and women were somewhat larger than salary differencesTable 3-24
among racial and ethnic groups ( ; Appendix Table 3-17 and Appendix Table 3-18). Overall, salaryTable 3-24differences between men and women and among racial and ethnic groups remained largely unchanged between1995 and 2013 ( ).Table 3-24
Table 3-24Median annual salary among S&E highest degree holders working full time,by sex, race, and ethnicity: 1995, 2003, and 2013
(Dollars)
Characteristic 1995 2003 2013
All 44,000 60,000 72,000
Sex
Female 34,000 45,000 55,000
Male 49,000 68,000 80,000
Race and ethnicity
American Indian or Alaska Native S 48,000 68,000
Asian 45,000 64,000 80,000
Black 35,000 48,000 58,000
Hispanic 38,000 50,000 59,000
Native Hawaiian or Other Pacific Islander NA 56,000 78,000

Chapter 3. Science and Engineering Labor Force
3 | 96National Science Board | Science & Engineering Indicators 2016
Characteristic 1995 2003 2013
White 45,000 60,000 74,000
More than one race NA 50,000 64,000
NA = not available; S = suppressed for reasons of confidentiality and/or reliability.
NOTES: Salaries are rounded to the nearest $1,000. Data for 1995 include some individuals with multiple races in each category. Hispanic may be any race. American Indian or Alaska Native, Asian, black or African American,
Native Hawaiian or Other Pacific Islander, white, and more than one race refer to individuals who are not ofHispanic origin.
SOURCE: National Science Foundation, National Center for Science and Engineering Statistics, Scientists and EngineersStatistical Data System (SESTAT) (1995, 2003, 2013), http://sestat.nsf.gov.
Science and Engineering Indicators 2016
Differences in average age, work experience, academic training, sector and occupation of employment, and othercharacteristics can make direct comparison of salary statistics misleading. Statistical models can estimate the sizeof the salary difference between men and women, or the salary differences between racial and ethnic groups, whenvarious salary-related factors are taken into account. Estimates of these differences vary somewhat depending onthe assumptions that underlie the statistical model used. The analyses presented in this section show that statisticalmodels to control for effects of education, experience, and other factors on salaries tend to reduce, but not fullyeliminate, the disparities. The remainder of this section presents estimated salary differences between men andwomen among individuals who are otherwise similar in age, work experience, field of highest degree, type ofacademic institution awarding highest degree (by Carnegie 2010 classification and private/public status),occupational field and sector, and other relevant characteristics that are likely to influence salaries. Data related tosalary differences between minorities (American Indians or Alaska Natives, blacks, Hispanics, Native Hawaiians orOther Pacific Islanders, and those reporting more than one race) and Asians and whites are also included.
Accounting only for level of degree, women working full time whose highest S&E degree is at the bachelor’s level
earned 30% less than men ( ). The salary difference is smaller but substantial at both the master’sFigure 3-31 [i]
level (28%) and the doctoral level (21%). The salary differences for non-Asian minorities relative to whites andAsians are narrower ( ). On average, minority salary levels are 19% lower than those of whites andFigure 3-32Asians at the bachelor’s level, 20% lower at the master’s level, and 16% lower at the doctoral level.
[i] Salary differences represent estimated percentage differences in women’s reported full-time annual salaryrelative to men’s reported full-time annual salary as of February 2013. Coefficients are estimated in an ordinaryleast squares regression model using natural log of full-time annual salary as the dependent variable. Thisestimated percentage difference in earnings differs slightly from the observed difference in median earnings by sexbecause the former addresses differences in mean earnings rather than median.

Chapter 3. Science and Engineering Labor Force
3 | 97National Science Board | Science & Engineering Indicators 2016
Figure 3-31
Estimated salary differences between women and men with highest degree in S&E employed fulltime, controlling for selected characteristics, by degree level: 2013
a Included are 20 Scientists and Engineers Statistical Data System (SESTAT) field-of-degree categories (out of 21 S&E fields),38 SESTAT occupational categories (out of 39 categories), 6 SESTAT employment sector categories (out of 7 categories),years since highest degree, years since highest degree squared, Carnegie classification of school awarding highest degree, andprivate or public status of postsecondary institution awarding highest degree.
b In addition to the above education- and employment-related variables, the following indicators are included: nativity andcitizenship, race and ethnic minority, marital status, disability, number of children living in the household, geographic region(classified into 9 U.S. Census divisions), and whether either parent holds a bachelor's or higher-level degree.
NOTES: Salary differences represent the estimated percentage difference in women’s average full-time salary relative to men’saverage full-time salary. Coefficients are estimated in an ordinary least squares regression model using the natural log offull-time annual salary as the dependent variable and then transformed into percentage difference.
SOURCE: National Science Foundation, National Center for Science and Engineering Statistics, SESTAT (2013), http://sestat.nsf.gov.
Science and Engineering Indicators 2016

Chapter 3. Science and Engineering Labor Force
3 | 98National Science Board | Science & Engineering Indicators 2016
Figure 3-32
Estimated salary differences between minorities and whites and Asians with highest degree in S&Eemployed full time, controlling for selected characteristics, by degree level: 2013
a Included are 20 Scientists and Engineers Statistical Data System (SESTAT) field-of-degree categories (out of 21 S&E fields),38 SESTAT occupational categories (out of 39 categories), 6 SESTAT employment sector categories (out of 7 categories),years since highest degree, years since highest degree squared, Carnegie classification of school awarding highest degree, andprivate or public status of postsecondary institution awarding highest degree.
b In addition to the above education- and employment-related variables, the following indicators are included: nativity andcitizenship, sex, marital status, disability, number of children living in the household, geographic region (classified into 9 U.S.Census divisions), and whether either parent holds a bachelor's or higher-level degree.
NOTES: Salary differences represent the estimated percentage difference in the average full-time salary of minorities relativeto the average full-time salary of whites and Asians. Coefficients are estimated in an ordinary least squares regression modelusing the natural log of full-time annual salary as the dependent variable and then transformed into percentage difference.Minorities include American Indian or Alaska Natives, blacks, Hispanics (of any race), Native Hawaiian or Other PacificIslanders, and those reporting more than one race.
SOURCE: National Science Foundation, National Center for Science and Engineering Statistics, SESTAT (2013), http://sestat.nsf.gov.
Science and Engineering Indicators 2016
Effects of Education, Employment, and Experience on Salary Differences
Salaries differ across degree field, occupational field and sector, and experience. Such differences in degree andoccupational fields account for a portion of the salary differences by sex and by race and ethnicity. Median salariesin 2013 were generally higher among full-time workers with a highest degree in engineering ($91,000), physicalsciences ($75,000), or computer and mathematical sciences ($84,000) than for those with a highest degree in lifesciences ($57,000) or social sciences ($56,000). Degree areas with lower salaries generally have higher

Chapter 3. Science and Engineering Labor Force
3 | 99National Science Board | Science & Engineering Indicators 2016
concentrations of women and of racial and ethnic minorities. Disproportionately larger shares of degree holders inlife sciences, and particularly in social sciences, compared to other S&E degree fields, work in occupations notcategorized as S&E, and the salaries for these occupations are generally lower than for S&E occupations (AppendixTable 3-17).
Salaries also differ across employment sectors. Academic and nonprofit employers typically pay less for similarskills than employers in the private sector, and government compensation generally falls somewhere between thesetwo groups. These differences are salient for understanding salary variations by sex and by race and ethnicitybecause men, Asians, and whites are more highly concentrated in the private for-profit sector.
Salaries also vary by indicators of experience, such as age and years since completing one’s degree. Because of therapid increase in female participation in S&E fields in recent years, women with S&E degrees who are employed fulltime generally have fewer years of labor market experience than their male counterparts: the median number ofyears since highest degree is 13 for women versus 17 for men; the median age is 40 years for women versus 43for men. Whites with S&E degrees who are employed full time also generally have more years of labor marketexperience than other racial and ethnic groups: the median number of years since highest degree is 18 years forwhites, 14 years for Asians, 11 years for Hispanics, 12 years for blacks, 17 years for American Indians or AlaskaNatives, and 16 years for Native Hawaiians or Other Pacific Islanders.
Eliminating the effects of differences in field of highest degree, degree-granting institution, field of occupation,
employment sector, and experience, the estimated salary difference between men and women narrows by more[ii]
than half ( ). However, women still earn 10% less than men among individuals whose highest degree isFigure 3-31at the bachelor’s level, and 7%–8% less than men among individuals whose highest degree is at the master’s ordoctoral level. The pattern is similar among racial and ethnic groups: compared with whites and Asians, S&Ehighest degree holders in other racial and ethnic groups working full time earn 6%–7% less at each degree level (
).Figure 3-32
Effects of Demographic and Other Factors on Salary Differences
Salaries vary by factors beyond education, occupation, and experience. For example, marital status, the presenceof children, parental education, and other personal characteristics are often associated with salary differences.These differences reflect a wide range of issues, including, but not limited to, factors affecting individual career-and education-related decisions, differences in how individuals balance family obligations and career aspirations,productivity and human capital differences among workers that surveys do not measure, and possible effects ofemployer prejudice or discrimination. Salaries also differ across regions, partly reflecting differences in the cost ofliving across geographic areas.
However, adding such measures of personal and family characteristics to education, occupation, and experience[iii]
results in only marginal changes in the estimated salary differences between men and women, and among racialand ethnic groups, compared with estimates that account for education, occupation, and experience alone.Women’s adjusted salary differentials are 7% among S&E doctorates and 8% among S&E bachelor’s degree andmaster’s degree holders ( ). Adjusted salary differences among racial and ethnic groups are 5% amongFigure 3-31bachelor’s and doctoral degree holders and 6% among those with master’s degrees ( ).Figure 3-32
The analysis of salary differences suggests that attributes related to human capital (fields of education andoccupation, employment sector, and experience) are much more important than socioeconomic and demographicattributes in explaining the salary differences observed among S&E highest degree holders by sex and across racialand ethnic groups. Nonetheless, the analysis also shows that measurable differences in human capital do not
entirely explain income differences between demographic groups.[iv]

Chapter 3. Science and Engineering Labor Force
3 | 100National Science Board | Science & Engineering Indicators 2016
Salary Differences among Recent Graduates
Salary differences among recent S&E graduates, particularly across racial and ethnic groups, are substantiallynarrower than in the population of S&E degree holders as a whole. Such employment metrics of recent graduateswarrant particular attention as important indicators of current conditions in the labor market, particularly for youngpeople considering S&E careers.
Substantially narrower salary differences among recent versus all S&E graduates, particularly across racial andethnic groups, suggest that recent cohorts of S&E degree holders are getting closer to earnings parity than theirolder counterparts. For example, in 2013, among recent graduates who attained their highest degree in or after2008, minorities working full time earned between 4% (at the bachelor’s level) and 9% (at the doctorate level) lessthan Asians and whites. These salary differences are higher, ranging from 16% to 20%, among all S&E highestdegree holders (regardless of graduation year) ( ).Figure 3-32
After accounting for differences in education, occupation, and experience, the salary differences for recentlygraduated minorities relative to whites and Asians are reduced among master’s and doctoral degree holders(although a 3%–4% salary gap remains) and nearly attenuated among bachelor’s degree holders. In contrast,when all S&E highest degree holders (regardless of graduation cohort) are included in the analysis, a 6%–7%salary gap at each degree level remains unexplained by these human capital attributes ( ).Figure 3-32
After controlling for differences in education, employment, demographic, and socioeconomic attributes, the gendersalary gap among recent graduates ranges from 2% to 6% among master’s and doctoral degree holders, andalmost disappears among bachelor’s degree holders. In comparison, a 7%–8% salary gap remains at each degreelevel among all S&E highest degree holders (regardless of graduation cohort).
[ii] Included are 20 SESTAT field of degree categories (out of 21 S&E fields), 38 SESTAT occupational categories(out of 39 categories), 6 SESTAT employment sector categories (out of 7), years since highest degree, years sincehighest degree squared, Carnegie classification of school awarding highest degree, and private/public status ofpostsecondary institution awarding highest degree.
[iii] In addition to the education- and employment-related variables, the following indicators are included: nativityand citizenship, marital status, disability, number of children living in the household, geographic region (classifiedinto nine U.S. Census divisions), and whether either parent holds a bachelor’s or higher level degree. The sexregression controls for racial and ethnic minority status, and the race and ethnicity regression controls for sex.
[iv] The regression analysis addresses major factors that affect differences in earnings but does not attempt tocover all possible sources of difference. For a more detailed discussion on the topic, see Blau and Kahn (2007),Mincer (1974), Polachek (2008), and Xie and Shauman (2003).

Chapter 3. Science and Engineering Labor Force
3 | 101National Science Board | Science & Engineering Indicators 2016
Immigration and the S&E Workforce
The industrialized nations of the world have long benefitted from the inflow of foreign-born scientists and engineersand the S&E skills and knowledge they bring. S&E skills are more easily transferrable across international bordersthan many other skills, and many countries have made it a national priority to attract international talent in S&E(NSB 2008). A large proportion of workers employed in S&E fields in the United States are foreign born. Thissection presents data on foreign-born scientists and engineers in the U.S. economy, including recent indicators ofmigration to the United States and the rate at which foreign-born recipients of U.S. doctoral degrees remain in theUnited States after earning their degree. Data from various sources, including NSF (SESTAT and Survey of EarnedDoctorates [SED]), the Census Bureau, and the U.S. Citizenship and Immigration Services (USCIS) are discussed to
study the immigrant S&E workforce in the United States.[i]
Foreign-born is a broad category, ranging from long-term U.S. residents with strong roots in the United States torecent immigrants who compete in global job markets and whose main social, educational, and economic ties are intheir countries of origin. When interpreting data on foreign-born workers, the range of individuals in this categoryshould be kept in mind.
Nationally representative survey data, such as SESTAT and ACS, although collected in different ways, yield broadlyconsistent estimates of the number of foreign-born scientists and engineers in the United States. In 2013,foreign-born individuals accounted for 27% of college-educated workers employed in S&E occupations in the UnitedStates ( ), which is higher than their representation in both the overall population (13%) and among allTable 3-25college graduates (15%). Both the number and proportion of foreign-born workers employed in S&E occupations inthe United States have risen over time ( ).Table 3-25
[i] For information on high-skill migration worldwide, see Defoort (2008), Docquier and Rapoport (2012), Docquier,Lowell, and Marfouk (2009), and Docquier and Marfouk (2006).
Table 3-25Foreign-born workers in S&E occupations, by education level: 1993, 2003,and 2013
(Percent)
1993 2003 2013
Education SESTAT SESTAT ACS SESTAT ACS
All college educated 15.8 22.6 25.2 26.5 26.9
Bachelor’s 11.4 16.4 18.7 18.9 19.2
Master’s 20.7 29.4 32.0 34.3 36.7
Doctorate 26.8 36.4 38.7 42.1 42.2
ACS = American Community Survey; SESTAT = Scientists and Engineers Statistical Data System.
NOTES: All college educated includes professional degree holders not broken out separately. The data from the ACSinclude all S&E occupations except postsecondary teachers of S&E because these occupations are notseparately identifiable in the ACS data files.
SOURCES: National Science Foundation, National Center for Science and Engineering Statistics, SESTAT (1993, 2003,2013), http://sestat.nsf.gov; Census Bureau, ACS Public Use Microdata Sample (PUMS) (2003, 2013).

Chapter 3. Science and Engineering Labor Force
3 | 102National Science Board | Science & Engineering Indicators 2016
Science and Engineering Indicators 2016
Characteristics of Foreign-Born Scientists and Engineers
Foreign-born workers employed in S&E occupations tend to have higher levels of education than their U.S.native-born counterparts. Among individuals employed in S&E occupations, 20% of foreign-born workers have adoctorate, compared to 10% of U.S. native-born individuals in these occupations. In most S&E occupations, thehigher the degree level, the greater the proportion of the workforce who are foreign born ( ). ThisFigure 3-33relationship is weakest among social scientists and strongest among computer and mathematical scientists andengineers. In 2013, at the bachelor’s degree level, the proportion of foreign-born individuals in S&E occupationsranged from 12% (social scientists) to 22% (computer and mathematical scientists). However, at the doctoral level,over 40% were foreign born in each S&E occupation except social sciences.

Chapter 3. Science and Engineering Labor Force
3 | 103National Science Board | Science & Engineering Indicators 2016
Figure 3-33
Foreign-born scientists and engineers employed in S&E occupations, by highest degree level andbroad S&E occupational category: 2013
SOURCE: National Science Foundation, National Center for Science and Engineering Statistics, Scientists and EngineersStatistical Data System (SESTAT) (2013), http://sestat.nsf.gov.
Science and Engineering Indicators 2016
In 2013, among SESTAT respondents employed in S&E occupations, foreign-born workers (median age 39 years)were younger than their native-born counterparts (median age 42). The distribution by sex was largely similaracross foreign-born (28% female) and native-born (29% female) workers in S&E occupations. Asians accounted for59% of foreign-born workers in S&E occupations but for only 3% of U.S. native-born workers in these occupations(Appendix Table 3-19). In comparison, whites represented 27% of foreign-born workers in S&E occupations but86% of native-born workers in these occupations. Nearly 90% of all Asians employed in S&E occupations wereforeign born.
In 2013, 57% of foreign-born individuals in the United States with an S&E highest degree were from Asia; another20% were from Europe. North and Central America, the Caribbean, South America, and Africa each supplied 4% to6% of the foreign-born S&E highest degree holders in the United States. In 2013, the leading country of originamong these immigrants was India, which accounted for 20% of the foreign-born S&E degree holders in the UnitedStates ( ). With less than half the total for India, China was the second leading country with 8%.Figure 3-34Source countries for the 402,000 foreign-born holders of S&E doctorates were somewhat more concentrated, withChina providing a higher proportion (22%) than India (14%). These patterns by source region and country forforeign-born S&E highest degree holders in the United States have been stable since at least 2003.

Chapter 3. Science and Engineering Labor Force
3 | 104National Science Board | Science & Engineering Indicators 2016
Figure 3-34
Foreign-born individuals with highest degree in S&E living in the United States, by place of birth:2013
UK = United Kingdom.

Chapter 3. Science and Engineering Labor Force
3 | 105National Science Board | Science & Engineering Indicators 2016
SOURCE: National Science Foundation, National Center for Science and Engineering Statistics, Scientists and EngineersStatistical Data System (SESTAT) (2013), http://sestat.nsf.gov.
Science and Engineering Indicators 2016
The SESTAT surveys ask respondents to provide information on where they received their postsecondary degreesand their motivation for coming to the United States. This information sheds light on the educational and careerpaths of foreign-born scientists and engineers in the United States and possible factors that influence these paths.The majority of foreign-born scientists and engineers in the United States received their initial university trainingabroad. In 2013, there were about 4.6 million college-educated, foreign-born scientists and engineers employed inthe United States; of these, 2.2 million received their first bachelor’s degree abroad. Many of these individualscame to the United States for job or economic opportunities (32%), family-related reasons (27%), or educationalopportunities (21%). In contrast, only 6% of foreign-born scientists and engineers with a U.S. bachelor’s degreecited job or economic opportunities, and many more cited family-related reasons (42%) or educationalopportunities (23%) as their primary reasons for coming to the United States.
A substantial number of foreign-born scientists and engineers in the United States appear to come here for furtherhigher education after receiving their initial university training abroad. Nearly two-thirds (63%) of the 1.1 millionemployed foreign-born scientists and engineers who received their initial university training abroad and who hold amaster’s degree, doctorate, or professional degree completed their highest degree in the United States. Amongthese individuals, the most frequently cited reason for coming to the United States was educational opportunities(43%). Family-related reasons (12%) and job/economic opportunities (12%) were cited by much smallerproportions. Among the foreign-born doctorate holders employed in the United States, 65% received this degreefrom a U.S. institution.
New Foreign-Born Workers
During the 2007–09 economic downturn, two indicators—the number of temporary work visas issued by the U.S.government in visa classes for high-skill workers and the stay rates of foreign-born U.S. doctoraterecipients—showed evidence that the volume of new foreign-born workers entering the U.S. S&E workforce mightbe declining. However, recent data indicate that this period of decline was temporary. In addition to these twoindicators, this section discusses characteristics of workers with temporary work visas and country profiles of newforeign-born workers.
Temporary Visas
The number of temporary work visas issued for high-skill workers provides an indication of new immigrant workers
entering the U.S. labor force. After several years of growth, the largest classes of these temporary visas declined[i]
during the recent economic downturn ( ). Despite the increases in the issuance of temporary visasFigure 3-35since FY 2009, the total numbers of visas issued in some categories have not yet reached the recent highs seen inFY 2007, before the beginning of the economic downturn ( ). A decline in the issuance of these visas,Figure 3-35particularly H-1B visas, had also occurred around the more mild recession in 2001.
[i] For all types of temporary work visas, the actual number of individuals using them is less than the numberissued. For example, some individuals may have job offers from employers in more than one country and maychoose not to foreclose any options until a visa is certain.

Chapter 3. Science and Engineering Labor Force
3 | 106National Science Board | Science & Engineering Indicators 2016
Figure 3-35
Temporary work visas issued in categories with many high-skilled workers: FYs 1991–2014
NOTE: J-1 exchange visitor visa is used for many different skill levels.
SOURCES: U.S. Department of State, Nonimmigrant Visa Issuances by Visa Class and by Nationality and Nonimmigrant Visasby Individual Class of Admission, http://travel.state.gov/content/visas/english/law-and-policy/statistics.html (accessed 18August 2015).
Science and Engineering Indicators 2016
H-1B visas account for a significant proportion of foreign-born high-skill workers employed by U.S. firms ontemporary visas. This type of visa is issued to individuals who seek temporary entry into the United States in aspecialty occupation that requires professional skills. It is issued for up to 3 years with the possibility of anextension to 6 years. In 2014, the United States issued about 161,000 H-1B visas, up 46% from the recent low in2009 (110,000) and higher than the recent peak in 2007 (154,000) ( ).Figure 3-35
Issuance of visas in other temporary work categories that usually contain large numbers of high-skill workers hasalso risen since 2009; however, the H-1B visa category has shown continued increase since 2009, unlike certainother visa classes such as the J-1 and L-1 categories ( ).Figure 3-35
Characteristics of H-1B Visa Recipients
The majority of H-1B visa recipients work in S&E or S&E-related occupations. However, precise counts of H-1Bvisas issued to individuals in these occupations cannot be obtained because USCIS does not classify occupationswith the same taxonomy used by NSF. In FY 2014, workers in computer-related occupations as classified by USCISwere the most common recipients of H-1B visas, accounting for 65% of new H-1B visas issued (Appendix Table3-20). The total number of newly initiated H-1B visas for workers in computer-related fields has increased
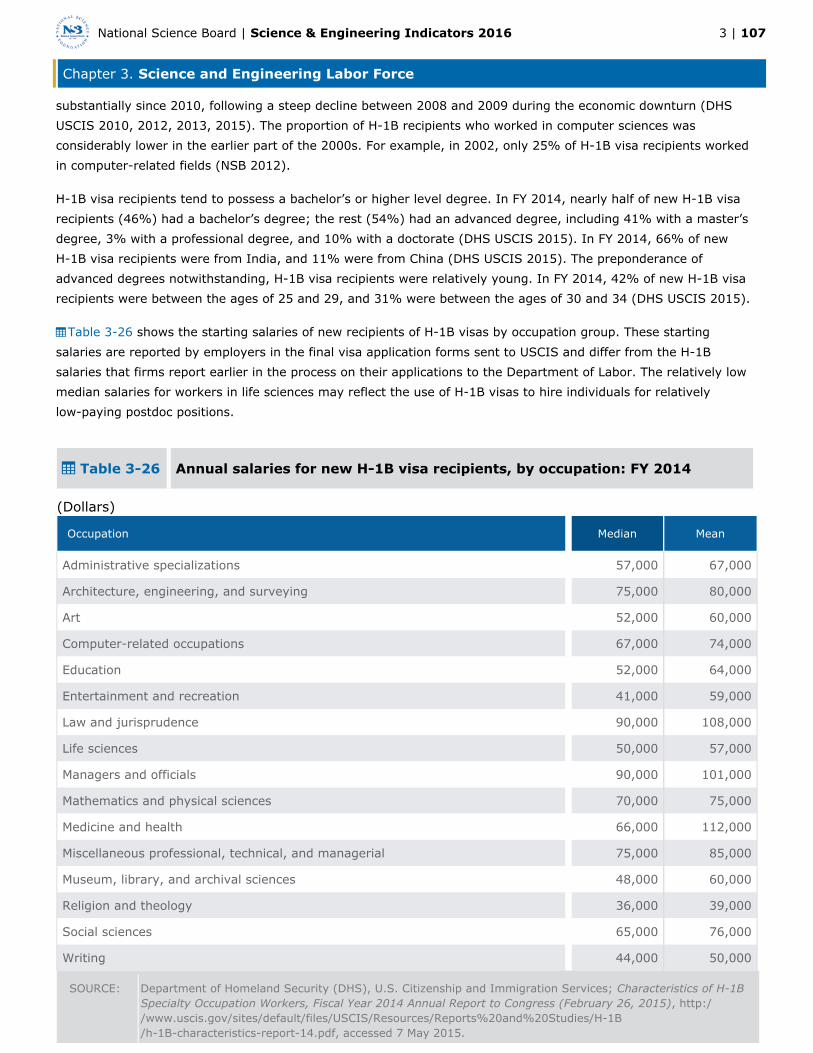
Chapter 3. Science and Engineering Labor Force
3 | 107National Science Board | Science & Engineering Indicators 2016
substantially since 2010, following a steep decline between 2008 and 2009 during the economic downturn (DHSUSCIS 2010, 2012, 2013, 2015). The proportion of H-1B recipients who worked in computer sciences wasconsiderably lower in the earlier part of the 2000s. For example, in 2002, only 25% of H-1B visa recipients workedin computer-related fields (NSB 2012).
H-1B visa recipients tend to possess a bachelor’s or higher level degree. In FY 2014, nearly half of new H-1B visarecipients (46%) had a bachelor’s degree; the rest (54%) had an advanced degree, including 41% with a master’sdegree, 3% with a professional degree, and 10% with a doctorate (DHS USCIS 2015). In FY 2014, 66% of newH-1B visa recipients were from India, and 11% were from China (DHS USCIS 2015). The preponderance ofadvanced degrees notwithstanding, H-1B visa recipients were relatively young. In FY 2014, 42% of new H-1B visarecipients were between the ages of 25 and 29, and 31% were between the ages of 30 and 34 (DHS USCIS 2015).
Table 3-26 shows the starting salaries of new recipients of H-1B visas by occupation group. These startingsalaries are reported by employers in the final visa application forms sent to USCIS and differ from the H-1Bsalaries that firms report earlier in the process on their applications to the Department of Labor. The relatively lowmedian salaries for workers in life sciences may reflect the use of H-1B visas to hire individuals for relativelylow-paying postdoc positions.
Table 3-26 Annual salaries for new H-1B visa recipients, by occupation: FY 2014
(Dollars)
Occupation Median Mean
Administrative specializations 57,000 67,000
Architecture, engineering, and surveying 75,000 80,000
Art 52,000 60,000
Computer-related occupations 67,000 74,000
Education 52,000 64,000
Entertainment and recreation 41,000 59,000
Law and jurisprudence 90,000 108,000
Life sciences 50,000 57,000
Managers and officials 90,000 101,000
Mathematics and physical sciences 70,000 75,000
Medicine and health 66,000 112,000
Miscellaneous professional, technical, and managerial 75,000 85,000
Museum, library, and archival sciences 48,000 60,000
Religion and theology 36,000 39,000
Social sciences 65,000 76,000
Writing 44,000 50,000
SOURCE: Department of Homeland Security (DHS), U.S. Citizenship and Immigration Services; Characteristics of H-1B Specialty Occupation Workers, Fiscal Year 2014 Annual Report to Congress (February 26, 2015), http:/
/www.uscis.gov/sites/default/files/USCIS/Resources/Reports%20and%20Studies/H-1B/h-1B-characteristics-report-14.pdf, accessed 7 May 2015.

Chapter 3. Science and Engineering Labor Force
3 | 108National Science Board | Science & Engineering Indicators 2016
Science and Engineering Indicators 2016
Short-Term Stay Rates for U.S. S&E Doctorate Recipients
Among doctorate recipients, the period immediately after earning their doctorate is a pivotal point that cansubstantially affect long-term career trajectories. During this period, foreign-born doctorate recipients who remainin the United States may set themselves on a path to long-term residency.
At the time they receive their doctorates, foreign-born students at U.S. universities report whether they intend tostay in the United States and whether they have a firm offer to work in the United States (either a postdoc or a job)
the following year. These responses provide estimates of short-term stay rates.[i] [ii]
Most foreign-born noncitizen recipients of U.S. S&E doctorates (including those on temporary and permanent visas)plan to stay in the United States after graduation ( ). According to the most recent estimates, at theFigure 3-36time of doctorate receipt, 75% of foreign-born noncitizen recipients of U.S. S&E doctorates planned to stay in theUnited States, and 44% had either accepted an offer of postdoc study or employment or were continuingemployment in the United States. Both of these proportions have risen since the 1980s. In 1993, 65% planned tostay in the United States after graduation, and 33% said they had firm offers in hand. Throughout the 1980s, theseproportions were about 50% and 33%, respectively (NSB 2012).
[i] This question is part of the SED, which is administered to individuals receiving research doctoral degrees from allaccredited U.S. institutions. For information on the SED, see http://www.nsf.gov/statistics/srvydoctorates/. Theinformation on plans to stay or definite commitments to stay reflects intentions within the year after graduation asreported by the doctorate recipients around their graduation date. As such, any changes in intentions after surveycompletion are not captured.
[ii] Many foreign recipients of U.S. doctorates who report that they plan to stay in the United States the year aftergraduation may do so using their student (F-1) visa and never obtain a new visa that would permit a longer stay.Student visas permit an additional 12-month stay in the United States after graduation if a student applies foroptional practical training (OPT). OPT refers to paid or unpaid work that is performed at least 20 hours a week andthat is related to a student’s field of study. Starting in April 2008, those earning a degree in STEM fields could applyfor an extension of their OPT to a total of 29 months. Data from the Department of Homeland Security’s Studentand Exchange Visitor Information System show that 68% of students with F-1 visas completing a doctorate in anyfield between 1 November 2013 and 31 October 2014 had applied for OPT.

Chapter 3. Science and Engineering Labor Force
3 | 109National Science Board | Science & Engineering Indicators 2016
Figure 3-36
Plans at graduation of foreign recipients of U.S. S&E doctoral degrees to stay in the United States, byyear of doctorate: 1993–2013
NOTE: Data include foreign doctorate recipients on temporary and permanent visas and also those with unknown visa status.
SOURCE: National Science Foundation, National Center for Science and Engineering Statistics, special tabulations of theSurvey of Earned Doctorates (SED) (1993–2013).
Science and Engineering Indicators 2016
Although stay rates have risen over the long haul, they have fluctuated within a relatively narrow range since thebeginning of the 2000s ( and Appendix Table 3-21). Among foreign-born S&E doctorate recipients,Figure 3-36both the percentage reporting plans to stay in the United States and the percentage reporting firm offers to staydeclined approximately since 2006, a period marked by the onset of the economic downturn and its aftermath. Theoverall number of foreign-born S&E doctorate recipients also declined in 2009 and 2010, although the numbershave since risen and the 2013 level exceeded the recent peak seen in 2008.
Overall, S&E short-term stay rates reflect the high short-term stay rates in mathematics and computer science,biological sciences, physical and earth sciences, and engineering (Appendix Table 3-21). According to the mostrecent estimates, the short-term stay rates in these four fields ranged from 77% to 82%, as measured by reportsof intentions to stay in the United States. However, the short-term stay rates for foreign-born U.S. S&E doctoraterecipients in health fields (70%) were somewhat lower, and those in social sciences (56%) were substantially lower.The proportion of foreign S&E doctorate recipients reporting firm offers to work showed a similar pattern acrossdoctorate fields.
Stay rates vary by place of origin. Between 2010 and 2013, the vast majority of U.S. S&E doctorate recipients fromChina (84%) and from India (86%) reported plans to stay in the United States, and close to 55% of these
Chapter 3. Science and Engineering Labor Force
3 | 110National Science Board | Science & Engineering Indicators 2016
individuals reported accepting firm offers for employment or postdoc research in the United States (Appendix Table3-21). U.S. S&E doctorate recipients from Japan, South Korea, and Taiwan were less likely than those from Chinaand India to stay in the United States. No more than half of U.S. S&E doctorate recipients from Turkey, Germany,and Italy had firm plans to stay in the United States after graduation. In North America, the percentage of U.S. S&Edoctorate recipients who had definite plans to stay in the United States was higher for those from Canada than forthose from Mexico.
Among U.S. S&E doctorate recipients from the two top countries of origin, China and India, the proportionsreporting plans to stay in the United States have declined since the early 2000s (Appendix Table 3-21).
Long-Term Stay Rates for U.S. S&E Doctorate Recipients
Long-term stay rates indicate the degree to which foreign-born recipients of U.S. S&E doctorates enter and remainin the U.S. workforce to pursue their careers. For a particular cohort of foreign-born noncitizen S&E doctoraterecipients, the proportion of that cohort who pay federal taxes a given number of years after receiving theirdegrees is an indicator of the cohort’s long-term stay rate. Estimates of short-term stay rates are derived from dataon reported intentions to stay in the United States within the year after graduation. The information on reportedintentions to stay can be compared with stay rates based on tax data to analyze how stated intentions for theperiod immediately after graduation compare with actual behavior.
Stay rate data include foreign-born noncitizen recipients of U.S. S&E doctorates who were on either a permanent ora temporary visa at the time they received their doctorates. For the 1995 and the 2001 graduating cohorts, stayrate data are available separately for men and women. For the 1995 cohort, the stay rates for men declined withadditional years since award of the doctorate whereas the stay rates for women did not show a similar pattern ofdecline ( ). However, the data for the 2001 cohort show comparable changes in stay rates for bothFigure 3-37sexes. The men and women in this more recent cohort both start out with stay rates higher than the earlier cohort,but stay rates for women declined in similar fashion to those for men.

Chapter 3. Science and Engineering Labor Force
3 | 111National Science Board | Science & Engineering Indicators 2016
Figure 3-37
Stay rates for U.S. S&E doctoral degree recipients with permanent or temporary visas at graduation,by sex: 1996–2011
NA = not available.
NOTE: Data are not available for all categories for all years.
SOURCE: Finn, M. 2014. Stay Rates of Foreign Doctoral Recipients from U.S. Universities: 2011. Oak Ridge, TN: Oak RidgeInstitute for Science and Education.
Science and Engineering Indicators 2016
Long-term stay rates vary greatly by country of citizenship, and the patterns are broadly similar to those observedin short-term stay rate data based on stated intentions. While shows the stay rate data annually forFigure 3-37fixed cohorts (1995 and 2001 graduating cohorts), presents data on 5-year stay rates in 2011. TheTable 3-275-year stay rate data in 2011 reflect the stay rate of the cohort who received their doctorates 5 years earlier in2006. Among doctorate recipients with temporary visas at graduation, those from China and India had stay ratesthat were significantly higher than average, and those from South Korea and other Asian countries and economiessuch as Taiwan, Japan, and Thailand had stay rates that were significantly lower than average ( ). InTable 3-27the Middle East, those from Iran had above-average stay rates, whereas those from Egypt and Turkey hadbelow-average stay rates.
Table 3-27Five-year stay rates for U.S. S&E doctorate recipients with temporary visasat graduation, by selected country/economy: 2011
(Percent)
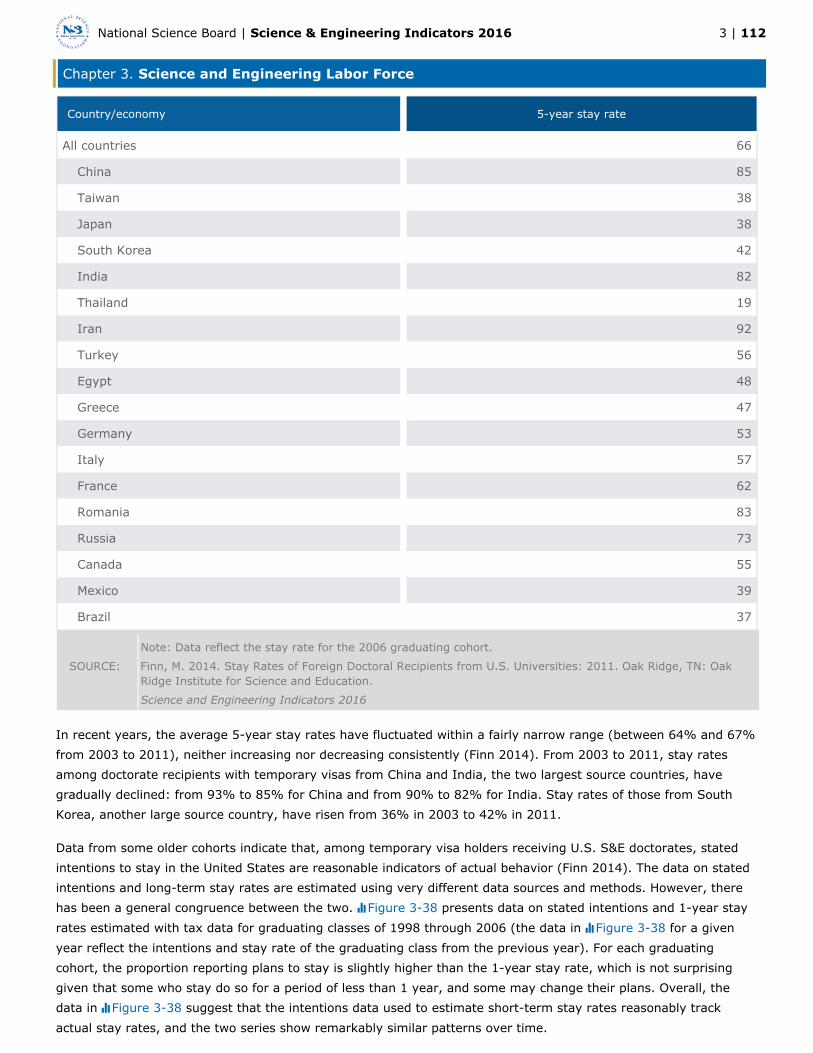
Chapter 3. Science and Engineering Labor Force
3 | 112National Science Board | Science & Engineering Indicators 2016
Country/economy 5-year stay rate
All countries 66
China 85
Taiwan 38
Japan 38
South Korea 42
India 82
Thailand 19
Iran 92
Turkey 56
Egypt 48
Greece 47
Germany 53
Italy 57
France 62
Romania 83
Russia 73
Canada 55
Mexico 39
Brazil 37
Note: Data reflect the stay rate for the 2006 graduating cohort.
SOURCE: Finn, M. 2014. Stay Rates of Foreign Doctoral Recipients from U.S. Universities: 2011. Oak Ridge, TN: OakRidge Institute for Science and Education.
Science and Engineering Indicators 2016
In recent years, the average 5-year stay rates have fluctuated within a fairly narrow range (between 64% and 67%from 2003 to 2011), neither increasing nor decreasing consistently (Finn 2014). From 2003 to 2011, stay ratesamong doctorate recipients with temporary visas from China and India, the two largest source countries, havegradually declined: from 93% to 85% for China and from 90% to 82% for India. Stay rates of those from SouthKorea, another large source country, have risen from 36% in 2003 to 42% in 2011.
Data from some older cohorts indicate that, among temporary visa holders receiving U.S. S&E doctorates, statedintentions to stay in the United States are reasonable indicators of actual behavior (Finn 2014). The data on statedintentions and long-term stay rates are estimated using very different data sources and methods. However, therehas been a general congruence between the two. presents data on stated intentions and 1-year stayFigure 3-38rates estimated with tax data for graduating classes of 1998 through 2006 (the data in for a givenFigure 3-38year reflect the intentions and stay rate of the graduating class from the previous year). For each graduatingcohort, the proportion reporting plans to stay is slightly higher than the 1-year stay rate, which is not surprisinggiven that some who stay do so for a period of less than 1 year, and some may change their plans. Overall, thedata in suggest that the intentions data used to estimate short-term stay rates reasonably trackFigure 3-38actual stay rates, and the two series show remarkably similar patterns over time.

Chapter 3. Science and Engineering Labor Force
3 | 113National Science Board | Science & Engineering Indicators 2016
Figure 3-38
S&E doctorate recipients with temporary visas at graduation reporting plans to stay versus actual1-year stay rate: 1999–2007
NOTE: Data for each year reflect the stated intentions and the stay rate for the cohort that received their doctoral degree inthe previous year.
SOURCE: Finn, M. 2014. Stay Rates of Foreign Doctoral Recipients from U.S. Universities: 2011. Oak Ridge, TN: Oak RidgeInstitute for Science and Education.
Science and Engineering Indicators 2016

Chapter 3. Science and Engineering Labor Force
3 | 114National Science Board | Science & Engineering Indicators 2016
Global S&E Labor Force
The rising emphasis on developing S&E expertise and technical capabilities has been a global phenomenon. S&Ework is not limited to developed economies; it occurs throughout the world. However, much of the work isconcentrated in developed nations, where a significant portion of R&D also takes place. The availability of a suitablelabor force is an important determinant of where businesses choose to locate S&E work (Davis and Hart 2010).Concentrations of existing S&E work, in turn, spawn new employment opportunities for workers with relevant S&Eknowledge and skills. As a result, governments in many countries have made increased investments in S&E-relatedpostsecondary education a high priority. At the same time, high-skill workers, including those educated oremployed in S&E fields, are increasingly mobile. In recent years, many nations, recognizing the value of high-skillworkers for the economy as a whole, have changed their laws to make it easier for such workers to immigrate.These changes indicate an accelerating competition for globally mobile talent (Shachar 2006).
Data on the global S&E workforce are very limited, which makes it difficult to analyze the precise size andcharacteristics of this specialized workforce. Internationally comparable data are limited to establishment surveysthat provide basic information about workers in S&E occupations or on workers with training in S&E disciplines. Incontrast, SESTAT includes far more data on members of the U.S. S&E labor force than is available in other nationalstatistical systems. In addition, although surveys that collect workforce data are conducted in many OECD membercountries, they do not cover several countries—including Brazil and India—that have high and rising levels ofscience and technology capability, and they do not provide fully comparable data for China.
This section provides information about the size and growth of workforce segments whose jobs involve R&D innations for which relevant data exist.
Size and Growth of the Global S&E Labor Force
OECD data covering substantial, internationally comparable segments of the S&E workforce provide strong evidenceof its widespread, though uneven, growth in the world’s developed nations. OECD countries, which include most ofthe world’s highly developed nations, compile data on researchers from establishment surveys in member andselected non-member countries. These surveys generally use a standardized occupational classification that definesresearchers as “professionals engaged in the conception or creation of new knowledge, products, processes,methods and systems and also in the management of the projects concerned” (OECD 2002:93). Because thisdefinition can be applied differently when different nations conduct surveys, international comparisons should bemade with caution. OECD also reports data on a broader measure of all personnel employed directly in R&D. Inaddition to researchers, the data on total R&D personnel include those who provide direct services to R&D such asclerical and administrative staff employed in R&D organizations.
OECD reports an estimated increase in the number of researchers in its member countries from 3.1 million in 2000to 4.4 million in 2012. OECD also publishes estimates for seven nonmember economies, including China andRussia; adding these to the OECD member total for 2012 yields a worldwide estimate of 6.5 million researchers.However, numerous uncertainties affect this estimate, including, but not limited to, lack of coverage of countrieswith significant R&D enterprise as well as methodological inconsistencies over time and across countries. Forexample, some nonmember countries that engage in large and growing amounts of research (e.g., India, Brazil)are omitted entirely from these totals. In addition, for some countries and regions, including the United States andthe European Union (EU; see “Glossary” for member countries), OECD estimates are derived from multiple nationaldata sources and not from a uniform or standardized data collection procedure. For example, China’s data from2009 onwards are collected in accordance with OECD definitions and standards, whereas the data before 2009 are
Chapter 3. Science and Engineering Labor Force
3 | 115National Science Board | Science & Engineering Indicators 2016
not consistent with OECD standards. South Korea’s data before 2007 excludes social sciences and humanitiesresearchers and are therefore not consistent with the data from 2007 onwards.
Despite these limitations for making worldwide estimates of the number of researchers, the OECD data provide areasonable starting point for estimating the rate of worldwide growth. For most economies with large numbers ofresearchers, growth since 2000 has been substantial ( ). China, whose pre-2009 data did not entirelyFigure 3-39correspond to the OECD definition, reported more than twice the number of researchers in 2008 compared with2000, and likewise reported substantial growth in later years. South Korea nearly doubled its number ofresearchers between 2000 and 2006 and continued to grow strongly between 2007 and 2012. The United Statesand the EU experienced steady growth but at a lower rate; the number of researchers grew 29% in the UnitedStates between 2000 and 2012 and 55% in the EU between 2000 and 2013. Exceptions to the overall worldwidetrend included Japan (which experienced little change) and Russia (which experienced a decline; see also Gokhbergand Nekipelova 2002). Trends in full-time equivalent R&D personnel were generally parallel to those for researchersin those cases for which both kinds of data are available (Appendix Table 3-22).

Chapter 3. Science and Engineering Labor Force
3 | 116National Science Board | Science & Engineering Indicators 2016
Figure 3-39
Estimated number of researchers in selected regions/countries: 2000–13
NA = not available.
EU = European Union.
NOTES: Data are not available for all regions/countries for all years. Researchers are full-time equivalents. Counts for Chinabefore 2009 are not consistent with Organisation for Economic Co-operation and Development (OECD) standards. Counts forSouth Korea before 2007 exclude social sciences and humanities researchers.
SOURCE: OECD, (2015/1), http://www.oecd.org/sti/msti.htm.Main Science and Technology Indicators
Science and Engineering Indicators 2016
OECD also estimates the proportion of researchers in the workforce. In OECD’s most recent estimates, smalleconomies in Scandinavia (Denmark, Finland, Norway, Sweden) reported that between 1% and 2% of theiremployed workforce are researchers; small economies in East Asia (Singapore, Taiwan) reported that about 1% oftheir workforce are researchers (Appendix Table 3-23). Among economies with more than 200,000 researchers,OECD’s latest estimates are that researchers make up the highest proportions of the workforce in South Korea(1.3%), Japan (1.0%), the United States (0.9%), and the United Kingdom (0.9%). Although China reported a largenumber of researchers, these workers represent a much smaller percentage of China’s workforce (0.2%) than inOECD member countries. Additionally, China and South Korea have shown marked and continuous increases in thepercentage of their workforce employed as researchers ( ). Since 2000, this percentage remainedFigure 3-40mostly steady in Japan, rose slightly in the United States, and rose steadily in the EU.

Chapter 3. Science and Engineering Labor Force
3 | 117National Science Board | Science & Engineering Indicators 2016
Figure 3-40
Researchers as a share of total employment in selected regions/countries: 2000–13
NA = not available.
EU = European Union.
NOTES: Data are not available for all regions/countries for all years. Researchers are full-time equivalents. Counts for Chinabefore 2009 are not consistent with Organisation for Economic Co-operation and Development (OECD) standards. Counts forSouth Korea before 2007 exclude social sciences and humanities researchers.
SOURCE: OECD, (2015/1), http://www.oecd.org/sti/msti.htm.Main Science and Technology Indicators
Science and Engineering Indicators 2016
The proportion of female researchers varies considerably across OECD economies. According to the most recentestimates for the selected OECD countries for which data by sex are available, Japan (15% women) and SouthKorea (18% women) have a significant imbalance among researchers. By comparison, several European countriessuch as Belgium, Italy, Finland, Sweden, Spain, Norway, United Kingdom, Russia, and Poland, and several othercountries such as Turkey and Singapore are more balanced with women representing between 30% and 40% ofresearchers. In France and Germany, about one-quarter of researchers are women.
OECD also provides data on gross domestic expenditures on R&D (GERD), which cover all R&D performed withinthe region/country/economy in a given year. The data on GERD may be combined with the data on researchers toget an estimate of R&D spending per researcher, which is another useful indicator of national resources devoted toadvancing science and engineering. According to the most recent estimates, the United States, Germany, andAustria have the highest R&D expenditures per researcher (Appendix Table 3-23). Japan, South Korea, and Chinaspend relatively similar amounts per researcher, although the number of researchers as a proportion of totalemployment is significantly lower in China than in Japan and South Korea. Other countries with large numbers of

Chapter 3. Science and Engineering Labor Force
3 | 118National Science Board | Science & Engineering Indicators 2016
researchers, such as Canada, the United Kingdom, Spain, and Russia spend much less. Additionally, since 2000,GERD per researcher (in constant prices and purchasing power parity) has fluctuated within a relatively narrowrange in the United States, the EU, and South Korea ( ). China, whose pre-2009 data did not entirelyFigure 3-41correspond to the OECD definition, reported nearly 60% more GERD per researcher in 2008 compared with 2000,and this number continued to grow between 2009 and 2013.

Chapter 3. Science and Engineering Labor Force
3 | 119National Science Board | Science & Engineering Indicators 2016
Figure 3-41
Gross domestic R&D expenditures (GERD) per researcher in selected regions/countries: 2000–13
NA = not available.
EU = European Union; PPP = purchasing power parity.
NOTES: Data are not available for all regions/countries for all years. Researchers are full-time equivalents. The data for Chinabefore 2009 are not consistent with Organisation for Economic Co-operation and Development (OECD) standards. The data forSouth Korea before 2007 exclude social sciences and humanities R&D.
SOURCE: OECD, (2015/1), http://www.oecd.org/sti/msti.htm.Main Science and Technology Indicators
Science and Engineering Indicators 2016

Chapter 3. Science and Engineering Labor Force
3 | 120National Science Board | Science & Engineering Indicators 2016
Conclusion
The S&E workforce may be defined in a variety of ways. At its core are individuals in S&E occupations, but thosewith S&E degrees who are employed in a variety of other jobs make important contributions to the nation’s welfare.Many more individuals hold S&E degrees than work in S&E occupations. Indicative of a knowledge-based economy,many of those in non-S&E occupations report that their work nonetheless requires at least a bachelor’s degree levelof S&E knowledge and skills. This suggests that the application of S&E knowledge and technical expertise iswidespread across the U.S. economy and not limited to S&E occupations.
In both the United States and the rest of the world, the S&E workforce has experienced strong growth. During the2007–09 recession, U.S. S&E employment remained more resilient than overall employment. Policymakers withotherwise divergent perspectives agree that jobs involving S&E are good for workers and good for the economy asa whole. These jobs pay more, even when compared to non-S&E jobs requiring similar levels of education andcomparably specialized skills. Although S&E workers are not totally shielded from joblessness, workers with S&Etraining or in S&E occupations are less often exposed to periods of unemployment.
Innovation based on S&E R&D is globally recognized as an important vehicle for a nation’s economic growth andcompetitive advantage, and growing numbers of workers worldwide are engaged in research. Growth has beenespecially marked in rapidly developing economies, such as China and South Korea, that have either recently joinedthe ranks of the world’s developed economies or are poised to do so. Mature developed economies in North Americaand Europe have maintained slower growth, but the number of researchers in the struggling Japanese economy hassomewhat stagnated.
The demographic composition of the S&E workforce in the United States is changing. The baby boom portion of theS&E workforce continues to age into retirement. However, increasing proportions of scientists and engineers arepostponing retirement to somewhat later ages. At the same time, members of historically underrepresentedgroups—women and, to a lesser degree, blacks and Hispanics—have played an increasing role in the S&E laborforce; although this has been more the case in some fields (e.g., life sciences and social sciences) than in others(e.g., computer and mathematical sciences, physical sciences, and engineering). Despite the recent increases inS&E participation by women and by racial and ethnic minorities, both groups remain underrepresented in S&Ecompared to their overall labor force participation. For example, women account for less than one-third of allworkers employed in S&E occupations in the United States despite representing half of the college-educatedworkforce.
The United States has remained an attractive destination for foreign students and workers with advancedS&E training. In the wake of the 2001 recession, there were increases in both temporary work visas and stay ratesof foreign recipients of S&E doctorates. Although declines occurred during the 2007–09 economic downturn—aperiod marked by rising unemployment in the United States among workers in S&E as well as in otheroccupations—data since the downturn suggest that the decline may have been temporary.
In today’s dynamic marketplace, where information flows rapidly and technology is always evolving, labor marketconditions change fast. Numerous factors—such as global competition, demographic trends, aggregate economicactivities, and S&E training pathways and career opportunities—will affect the availability of workers equipped withS&E expertise as well as the kinds of jobs that the U.S. economy generates in the future. As a result,comprehensive and timely analysis of current labor force and demographic trends will play a critical role inproviding the information needed to understand the dynamic S&E landscape both in the United States and globally.

Chapter 3. Science and Engineering Labor Force
3 | 121National Science Board | Science & Engineering Indicators 2016
Glossary
European Union (EU): As of September 2015, the EU comprised 28 member nations: Austria, Belgium, Bulgaria,Croatia, Cyprus, Czech Republic, Denmark, Estonia, Finland, France, Germany, Greece, Hungary, Ireland, Italy,Latvia, Lithuania, Luxembourg, Malta, the Netherlands, Poland, Portugal, Romania, Slovakia, Slovenia, Spain,Sweden, and the United Kingdom. Unless otherwise noted, Organisation for Economic Co-operation andDevelopment data on the EU include all of these 28 members.
Involuntarily out of field (IOF) employment: Employment in a job not related to the field of one’s highestdegree because a job in that field was not available. The IOF rate is the proportion of all employed individuals whoreport IOF employment.
Labor force: A subset of the population that includes both those who are employed and those who are not workingbut seeking work (unemployed); other individuals are not considered to be in the labor force.
Organisation for Economic Co-operation and Development (OECD) An international organization of 34:countries headquartered in Paris, France. The member countries are Australia, Austria, Belgium, Canada, Chile,Czech Republic, Estonia, Denmark, Finland, France, Germany, Greece, Hungary, Iceland, Ireland, Israel, Italy,Japan, South Korea, Luxembourg, Mexico, the Netherlands, New Zealand, Norway, Poland, Portugal, SlovakRepublic, Slovenia, Spain, Sweden, Switzerland, Turkey, United Kingdom, and United States. Among its manyactivities, the OECD compiles social, economic, and science and technology statistics for all member and selectednonmember countries.
Postdoc: A temporary position awarded in academia, industry, government, or a nonprofit organization, primarilyfor gaining additional education and training in research after completion of a doctorate.
Scientists and Engineers Statistical Data System (SESTAT): A system of surveys conducted by the NationalScience Foundation that measure the educational, occupational, and demographic characteristics of the S&Eworkforce. The surveys are the National Survey of College Graduates (NSCG) and the Survey of DoctorateRecipients (SDR).
Stay rate: The proportion of foreign recipients of U.S. S&E doctoral degrees who stay in the United States afterreceiving their doctorate.
Workforce: A subset of the labor force that includes only employed individuals.

Chapter 3. Science and Engineering Labor Force
3 | 122National Science Board | Science & Engineering Indicators 2016
References
American Chemical Society. 2013. Advancing Graduate Education in the Chemical Sciences: Summary Report of an. Washington, DC.ACS Presidential Commission
Blau F, Kahn L. 2007. The gender pay gap: Have women gone as far as they can? Academy of Management 21:7–23.Perspectives
Carlino G, Chatterjee S, Hunt R. 2001. . Working PapersKnowledge Spillovers and the New Economy of Cities01-14. Federal Reserve Bank of Philadelphia. http://ideas.repec.org/p/fip/fedpwp/01-14.html. Accessed 30 May2015.
Davis T, Hart DM. 2010. International cooperation to manage high-skill migration: The case of India-U.S. relations. 27(4):509–26.Review of Policy Research
Defoort C. 2008. Long-term trends in international migration: An analysis of the six main receiving countries. 63(2):285–318.Population-E
Department of Homeland Security (DHS), U.S. Citizenship and Immigration Services (USCIS). 2010. Characteristics. http://www.uscis.gov/USCISof H-1B Specialty Occupation Workers, Fiscal Year 2009 Annual Report to Congress
/Resources/Reports%20and%20Studies/H-1B/h1b-fy-09-characteristics.pdf. Accessed 9 January 2015.
Department of Homeland Security (DHS), U.S. Citizenship and Immigration Services (USCIS). 2012. Characteristics. http://www.uscis.gov/USCISof H-1B Specialty Occupation Workers, Fiscal Year 2011 Annual Report to Congress
/Resources/Reports%20and%20Studies/H-1B/h1b-fy-11-characteristics.pdf. Accessed 21 October 2014.
Department of Homeland Security (DHS), U.S. Citizenship and Immigration Services (USCIS). 2013. Characteristics. http://www.uscis.gov/USCISof H-1B Specialty Occupation Workers, Fiscal Year 2012 Annual Report to Congress
/Resources/Reports%20and%20Studies/H-1B/h1b-fy-12-characteristics.pdf. Accessed 21 October 2014.
Department of Homeland Security (DHS), U.S. Citizenship and Immigration Services (USCIS). 2015. Characteristics. http://www.uscis.gov/sitesof H-1B Specialty Occupation Workers, Fiscal Year 2014 Annual Report to Congress
/default/files/USCIS/Resources/Reports%20and%20Studies/H-1B/h-1B-characteristics-report-14.pdf. Accessed 12May 2015.
Docquier F, Lowell B, Marfouk A. 2009. A gendered assessment of highly skilled emigration. Population and 35(2):297–321.Development Review
Docquier F, Marfouk A. 2006. . Ozden C, Schiff M,International migration by educational attainment, 1990–2000 Ineditors, New York: Palgrave Macmillan. pp. 151–200.International Migration, Remittances and the Brain Drain.
Docquier F, Rapoport H. 2012. Globalization, brain drain and development. Journal of Economic Literature50(3):681–730.
Finn M. 2014. . Oak Ridge, TN: Oak RidgeStay Rates of Foreign Doctoral Recipients from U.S. Universities: 2011Institute for Science and Education.
Glaeser EL, Saiz A. 2003. . NBER Working Papers 10191, National Bureau of EconomicThe Rise of the Skilled CityResearch, Inc.

Chapter 3. Science and Engineering Labor Force
3 | 123National Science Board | Science & Engineering Indicators 2016
Gokhberg L, Nekipelova E. 2002. International migration of scientists and engineers in Russia. OECD, In Paris: OECD. pp. 177–188.International Mobility of the Highly Skilled.
Jones B, Reedy EJ, Weinberg B. 2014. . National Bureau of Economic Research WorkingAge and Scientific GeniusPaper no. 19866.
Mincer J. 1974. New York: Columbia University Press.Schooling, Experience and Earnings.
National Academy of Sciences, National Academy of Engineering, and Institute of Medicine. 2000. Enhancing the. Washington, DC: The National Academies Press.Postdoctoral Experience for Scientists and Engineers
National Academy of Sciences, National Academy of Engineering, and Institute of Medicine. 2014. The Postdoctoral. Washington, DC: The National Academies Press.Experience Revisited
National Institutes of Health (NIH). 2012. . http:/Biomedical Research Workforce Working Group Report/acd.od.nih.gov/Biomedical_research_wgreport.pdf. Accessed 14 May 2015.
National Science Board (NSB). 2008. Two volumes. Arlington, VA:Science and Engineering Indicators 2008.National Science Foundation (volume 1, NSB 08-01; volume 2, NSB 08-01A). Available at http://www.nsf.gov/statistics/seind08/.
National Science Board (NSB). 2010. Arlington, VA: National ScienceScience and Engineering Indicators 2010.Foundation (NSB 10-01). Available at http://www.nsf.gov/statistics/seind10/.
National Science Board (NSB). 2012. Arlington, VA: National ScienceScience and Engineering Indicators 2012.Foundation (NSB 12-01). Available at http://www.nsf.gov/statistics/seind12/.
National Science Foundation, National Center for Science and Engineering Statistics (NSF/NCSES). 2015a. Full-TimeGraduate Enrollment in Science and Engineering Rose in 2013, Fueled by a Large Increase in Foreign GraduateEnrollment. NSF 15-318, Kang K. Arlington, VA. Available at http://www.nsf.gov/statistics/2015/nsf15318/.
National Science Foundation, National Center for Science and Engineering Statistics (NSF/NCSES). 2015b. Surveyof Graduate Students and Postdoctorates in Science and Engineering, Fall 2013, Data Tables. Available at http://ncsesdata.nsf.gov/gradpostdoc/2013/
Office of Management and Budget. 2009. . OMBUpdate of Statistical Area Definitions and Guidance on Their UsesBulletin No. 10.02. Available at http://www.whitehouse.gov/sites/default/files/omb/assets/bulletins/b10-02.pdf.
Organisation for Economic Co-operation and Development (OECD). 2002. . Paris: OECD.Frascati Manual
Polachek S. 2008. Earnings over the life cycle: The Mincer earnings function and its applications. Foundations and 4(3):165–272.Trends in Microeconomics
Sauermann H, Roach M. 2012. Science PhD career preferences: Levels, changes, and advisor encouragement. PLoS 7(5):e36307. http://www.plosone.org/article/info:doi/10.1371/journal.pone.0036307#references. AccessedONE
30 April 2013.
Shachar A. 2006. The race for talent: Highly skilled migrants and competitive immigration regimes. New York 81(1):148–206.University Law Review
Stephan P, Levin S. 1992. . New York:Striking the Mother Lode in Science: The Importance of Age, Place, and TimeOxford University Press.

Chapter 3. Science and Engineering Labor Force
3 | 124National Science Board | Science & Engineering Indicators 2016
Wyatt I. 2010. Evaluating the 1996–2006 employment projections. (September):33–69.Monthly Labor Review
Wyatt, I. Hecker, D. 2006. Occupational changes during the 20th century. (March): 35–57.Monthly Labor Review
Xie Y, Shauman K. 2003. Cambridge Massachusetts: HarvardWomen in Science: Career Processes and Outcomes.University Press.


![gender equity - American Chemical Society · Science and Engineering Indicators in 2006 [1], ... students who are female—by 2000, ... parity. In physics, chemical engineering,](https://img.pdfslide.net/doc/110x75/5b7d19ba7f8b9a28438d0adb/gender-equity-american-chemical-society-science-and-engineering-indicators.jpg)