Embed Size (px)
Citation preview

Science and NatureISSN 2324-7290April 2013 Volume 2 Number 2
Contents41
46
51
57
59
65
Morphometric study of the renal arteries in Saudi population from aseer region using 3-D MDCT angiography.Mohamed Atif A Said Ahmed, Hamed A Gobran.
Combined effect of electromag netic field and therapeutic exercises on muscle mass in juvenile rheumatoid arthritis.Mohamed A Eid, Mostafa S Ali.
Delay of skeletal muscle atrophy after transplantation of mesenchymal progenitor cells into transected position.ZHAO Wen-yong, WAN Li-hua, SHU Yong-ping, RAN Xin-ze.
Assessment of some metals in the drinking water of Dal Lake Kashmir.Imtiyaz A Raja, M Y Khan, N A Khan, M R Wani, A A Bhat.
Assessment of watershed management implemented on springal peak flood discharge and flood volume, using HEC-HMS model. (Case study: Kushk Abad sub-basin in Iran)B M Golrang, F S Lai, S H R Sadeghi, Khamurudin M N, Kamziah Abd Kudus, M Mashayekhi, R Bagherian.
Effect of Anthocleista nobilis root extract on the haematological indices of poultry chicken challenged with Newcastle disease virus (NDV).Ayodele PO, Okonko IO, Evans E, Okerentugba PO, Nwanze JC, Onoh CC.
Science and Nature ISSN 2324-7290
Volume 2 Number 2 April 2013
Editorial Department Address
157 East ELM Street, Unit A, Greenwich, CT 06830-6614
E-mail: [email protected]
Publisher and Printer: ZolCat Academic House
604 61st St, Brooklyn, New York, NY 11220
www.zolcat.com | [email protected] | www.zolcat.org
Impact Factor 0 (2012)
Indexed by
Google Scholar; OCLC (810943143) (WorldCat)
www.zolcat.com
www.zolcat.org
Editor-in-chief: Y JuliaEditors: C Ab, M Sophia, AT TillaReviewer: Bjoerk, C Cempel, C Jianguo, EC Chirwa, Juliet T Gopinath, L Shengxiong, L Bo, M Pantic, Staff: L Hao, L Kimberly, W Yuanyuan
Morphometric Study of the Renal Arteries in Saudi Population from Aseer Region Using 3-D MDCT Angiography
Mohamed Atif A Said Ahmed 1, *, Hamed A Gobran 2
1 Introduction
Great technological advances in the field of diagnostic imaging of urology have better morphological referents for the renal vascularization pattern. Angiotomography (Angio-CT) has high sensitivity in the identification of renal arteries.(1) Multi-slice Angio-CT has replaced the conventional arteriography in the evaluation and study of vascular anatomy and diagnosis of vascular diseases of the kidney. El Fettouh and others (2), concluded that the 3-D Angio-CT correctly identified the number and caliber of renal arteries.
It is imperative for the surgeon to know the exact positions of the origin of renal arteries (RAs) and the range of lengths, diameters and the metric relations for care of the renal patients. Anatomical morphometric data could be useful for 1- Selecting donors in renal transplant.(3) 2- Guiding the radiologists during arterial catheterizations. 3- In robotic surgery, where the surgeon does not have the ability to identify the arteries by palpation. 4- Those who design arterial stent grafts and for those who place such a stent.(4) 5-
Mohamed Atif A Said Ahmed, etc. Scince and Nature, April 2013 2(2): 41-45.
Departments of Anatomy1 and Radiology2, College of Medicine, Zagazig University, Egypt.
ABSTRACTThe renal artery exhibits wide
spectrum of origin variation. The renal artery anatomy plays a considerable role in selecting donors. 3-D angiotomography is the best modality for vascular anatomic evaluation. The aim of the present study was first, to provide morphometric data concerning the renal arteries in people of Aseer region, K.S.A. and second, to establish relationships between those arteries. Methods: Data from a retrospective review were performed using 3-D MDCT angiography of 100 consecutive Saudi patients fulfilled all research criteria and had a readable CTA were selected (54 males and 46 females) with mean age 54.7±5.2 years. Results: The median level of the origin of right renal artery and left renal artery is at the level of the lower third of L1 and the disc between L1 and L2, respectively. The mean of the measured angle of the right renal and left renal arteries is 55º±7º and 85º±8º, respectively. There was no difference between the diameters of the main renal arteries. The renal artery diameter had a direct correlation with the angle of origin. The renal artery diameter in kidneys with extra renal artery was significantly lower than those without an extra renal artery. Renal arteries associated with extra renal artery showed greater length. The length of the segment between celiac trunk and the renal arteries was significantly correlated with the length of the abdominal aorta. Conclusion: Understand the position, calibre and angle of the renal arteries, were advantageous to make use of selective arteriography, arterial embolism therapy and plan stent grafts.
Key WordsMorphometric, Renal artery,
CT Angiography, Saudi population.
Correspondence to:
Mohamed Atif A Said AhmedDepartments of Anatomy,
College of Medicine, Zagazig University,
Egypt.E-mail: [email protected]
Mohamed Atif A Said Ahmed, Hamed A Gobran. Morphometric study of the renal arteries in Saudi population from aseer region using 3-D MDCT angiography. Sciene and Nature (2013) 2(2):41-45. (ISSN 2324-7290) © ZolCat Academic House. www.zolcat.com
41
Endovascular, laparoscopic urologic procedures and for medical device development.(5).
The RA emerges from the lateral surface of the aorta in most cases.(6) There is a variation in the RA origin. It emerges from the posterolateral, anterolateral and posterior surfaces with less frequency.(7) It has also been proposed that the origination angle and diameter of the blood vessels share and minimize the forces and maximize fluid conduction.(3) The distance from the RAs origin to the celiac trunk have been taken as reference in determining the level of emergence.(8) Both extra RA and early branching must be examined in patients being evaluated for donor nephrectomy, because of their importance during the procedure. The vast majority of published anatomical data on the origin of RA is based on finding at post-mortem examination.(9,10) To the best of available literature, there are few studies in the literature about detailed morphometric renal arteries have been done in the past(11,12), but not to this extent and not by 3 dimensions multi-detector computed tomography (3-D MDCT) angiography.
The aim of the present study was first, to determine the origin, angle and dimensions of the RAs to provide morphometric data concerning the RAs in Aseer central hospital, K.S.A. and second, to establish existing correlations between those arteries, to enrich knowledge concerning renal vascularization, thereby serving as referent in teaching and clinical practice.
42
Mohamed Atif A Said Ahmed, etc. Scince and Nature, April 2013 2(2): 41-45.
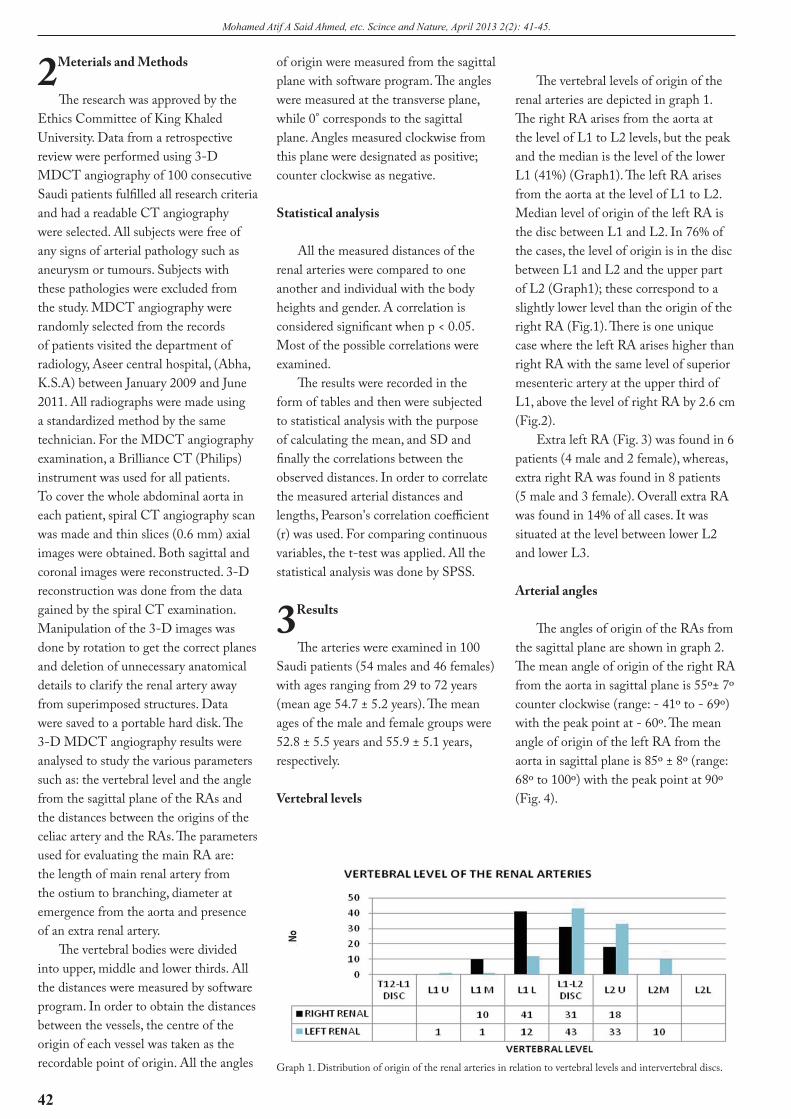
The vertebral levels of origin of the renal arteries are depicted in graph 1. The right RA arises from the aorta at the level of L1 to L2 levels, but the peak and the median is the level of the lower L1 (41%) (Graph1). The left RA arises from the aorta at the level of L1 to L2. Median level of origin of the left RA is the disc between L1 and L2. In 76% of the cases, the level of origin is in the disc between L1 and L2 and the upper part of L2 (Graph1); these correspond to a slightly lower level than the origin of the right RA (Fig.1). There is one unique case where the left RA arises higher than right RA with the same level of superior mesenteric artery at the upper third of L1, above the level of right RA by 2.6 cm (Fig.2).
Extra left RA (Fig. 3) was found in 6 patients (4 male and 2 female), whereas, extra right RA was found in 8 patients (5 male and 3 female). Overall extra RA was found in 14% of all cases. It was situated at the level between lower L2 and lower L3.
Arterial angles
The angles of origin of the RAs from the sagittal plane are shown in graph 2. The mean angle of origin of the right RA from the aorta in sagittal plane is 55º± 7º counter clockwise (range: - 41º to - 69º) with the peak point at - 60º. The mean angle of origin of the left RA from the aorta in sagittal plane is 85º ± 8º (range: 68º to 100º) with the peak point at 90º (Fig. 4).
2 Meterials and Methods
The research was approved by the Ethics Committee of King Khaled University. Data from a retrospective review were performed using 3-D MDCT angiography of 100 consecutive Saudi patients fulfilled all research criteria and had a readable CT angiography were selected. All subjects were free of any signs of arterial pathology such as aneurysm or tumours. Subjects with these pathologies were excluded from the study. MDCT angiography were randomly selected from the records of patients visited the department of radiology, Aseer central hospital, (Abha, K.S.A) between January 2009 and June 2011. All radiographs were made using a standardized method by the same technician. For the MDCT angiography examination, a Brilliance CT (Philips) instrument was used for all patients. To cover the whole abdominal aorta in each patient, spiral CT angiography scan was made and thin slices (0.6 mm) axial images were obtained. Both sagittal and coronal images were reconstructed. 3-D reconstruction was done from the data gained by the spiral CT examination. Manipulation of the 3-D images was done by rotation to get the correct planes and deletion of unnecessary anatomical details to clarify the renal artery away from superimposed structures. Data were saved to a portable hard disk. The 3-D MDCT angiography results were analysed to study the various parameters such as: the vertebral level and the angle from the sagittal plane of the RAs and the distances between the origins of the celiac artery and the RAs. The parameters used for evaluating the main RA are: the length of main renal artery from the ostium to branching, diameter at emergence from the aorta and presence of an extra renal artery.
The vertebral bodies were divided into upper, middle and lower thirds. All the distances were measured by software program. In order to obtain the distances between the vessels, the centre of the origin of each vessel was taken as the recordable point of origin. All the angles
of origin were measured from the sagittal plane with software program. The angles were measured at the transverse plane, while 0° corresponds to the sagittal plane. Angles measured clockwise from this plane were designated as positive; counter clockwise as negative.
Statistical analysis
All the measured distances of the renal arteries were compared to one another and individual with the body heights and gender. A correlation is considered significant when p < 0.05. Most of the possible correlations were examined.
The results were recorded in the form of tables and then were subjected to statistical analysis with the purpose of calculating the mean, and SD and finally the correlations between the observed distances. In order to correlate the measured arterial distances and lengths, Pearson's correlation coefficient (r) was used. For comparing continuous variables, the t-test was applied. All the statistical analysis was done by SPSS.
3 Results
The arteries were examined in 100 Saudi patients (54 males and 46 females) with ages ranging from 29 to 72 years (mean age 54.7 ± 5.2 years). The mean ages of the male and female groups were 52.8 ± 5.5 years and 55.9 ± 5.1 years, respectively.
Vertebral levels
Graph 1. Distribution of origin of the renal arteries in relation to vertebral levels and intervertebral discs.
43
Mohamed Atif A Said Ahmed, etc. Scince and Nature, April 2013 2(2): 41-45.
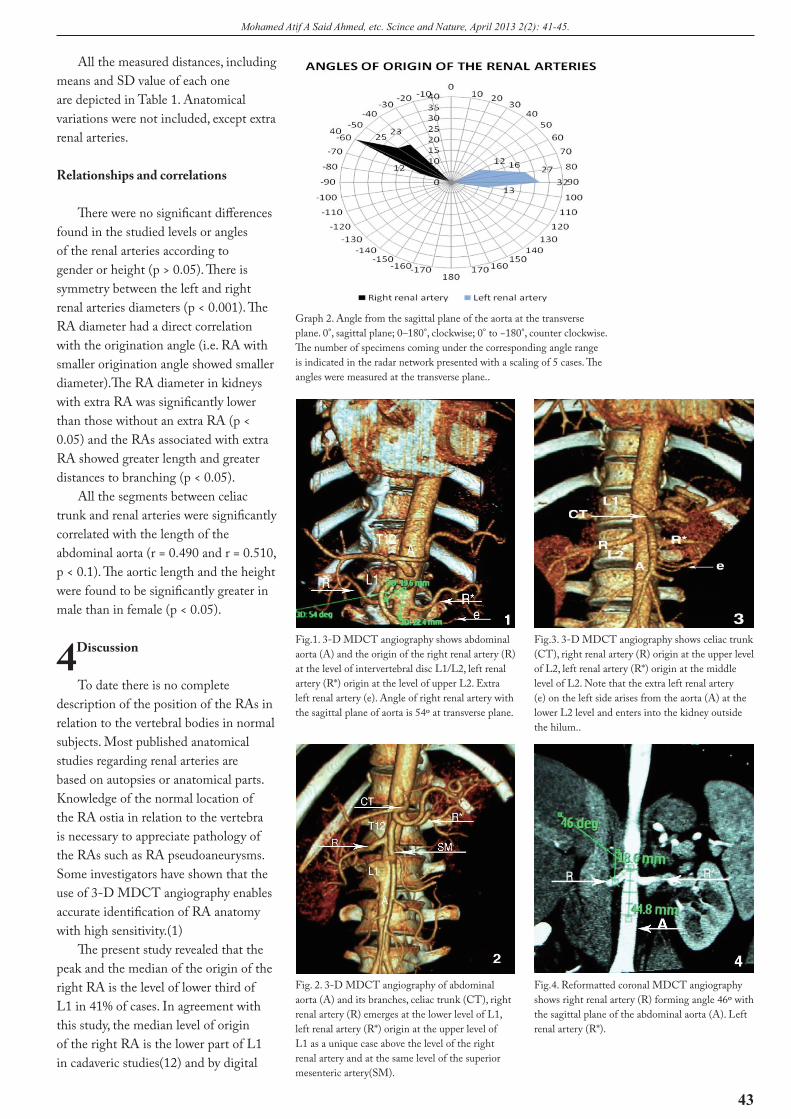
Graph 2. Angle from the sagittal plane of the aorta at the transverse plane. 0°, sagittal plane; 0–180°, clockwise; 0° to −180°, counter clockwise. The number of specimens coming under the corresponding angle range is indicated in the radar network presented with a scaling of 5 cases. The angles were measured at the transverse plane..
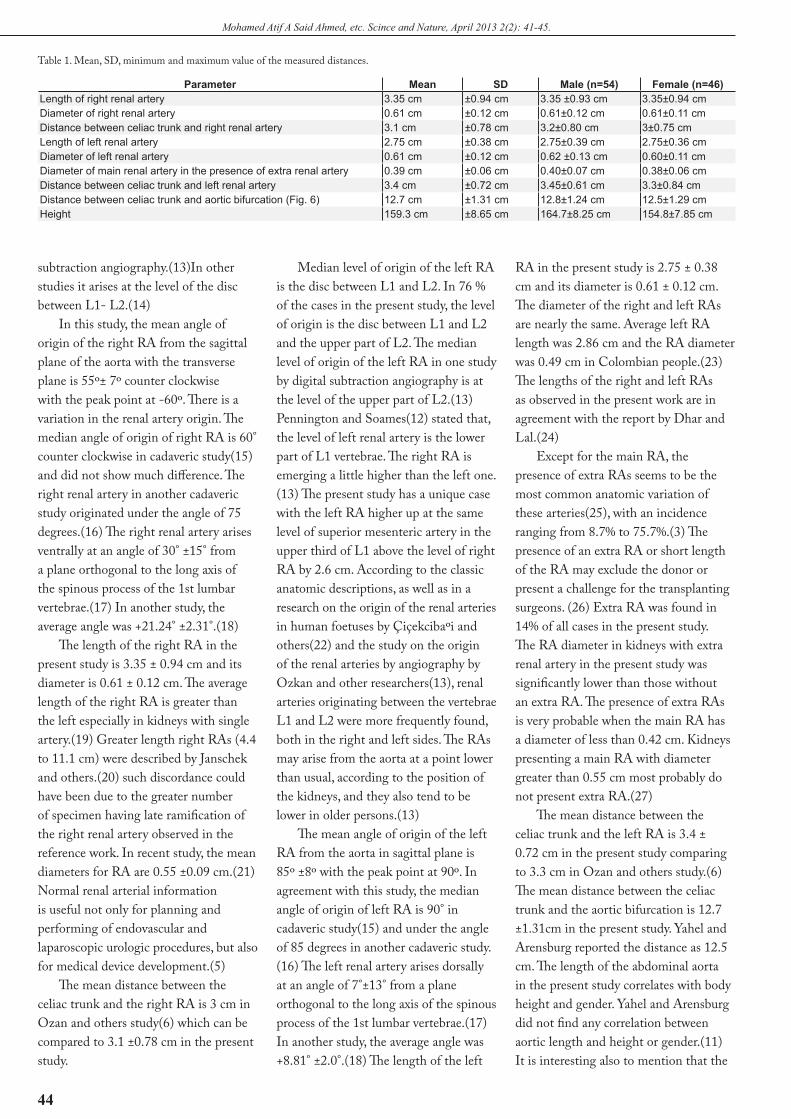
Fig.1. 3-D MDCT angiography shows abdominal aorta (A) and the origin of the right renal artery (R) at the level of intervertebral disc L1/L2, left renal artery (R*) origin at the level of upper L2. Extra left renal artery (e). Angle of right renal artery with the sagittal plane of aorta is 54º at transverse plane.
Fig. 2. 3-D MDCT angiography of abdominal aorta (A) and its branches, celiac trunk (CT), right renal artery (R) emerges at the lower level of L1, left renal artery (R*) origin at the upper level of L1 as a unique case above the level of the right renal artery and at the same level of the superior mesenteric artery(SM).
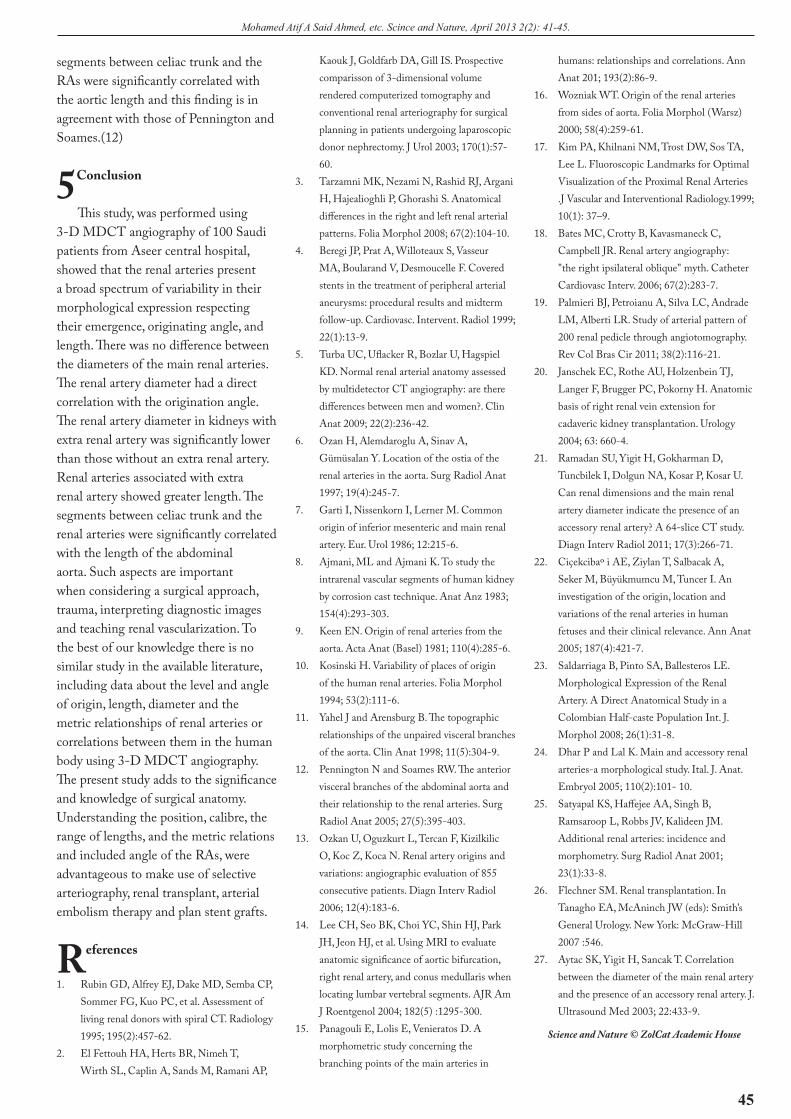
Fig.3. 3-D MDCT angiography shows celiac trunk (CT), right renal artery (R) origin at the upper level of L2, left renal artery (R*) origin at the middle level of L2. Note that the extra left renal artery (e) on the left side arises from the aorta (A) at the lower L2 level and enters into the kidney outside the hilum..
Fig.4. Reformatted coronal MDCT angiography shows right renal artery (R) forming angle 46º with the sagittal plane of the abdominal aorta (A). Left renal artery (R*).
All the measured distances, including means and SD value of each one are depicted in Table 1. Anatomical variations were not included, except extra renal arteries.
Relationships and correlations
There were no significant differences found in the studied levels or angles of the renal arteries according to gender or height (p > 0.05). There is symmetry between the left and right renal arteries diameters (p < 0.001). The RA diameter had a direct correlation with the origination angle (i.e. RA with smaller origination angle showed smaller diameter).The RA diameter in kidneys with extra RA was significantly lower than those without an extra RA (p < 0.05) and the RAs associated with extra RA showed greater length and greater distances to branching (p < 0.05).
All the segments between celiac trunk and renal arteries were significantly correlated with the length of the abdominal aorta (r = 0.490 and r = 0.510, p < 0.1). The aortic length and the height were found to be significantly greater in male than in female (p < 0.05).
4 Discussion
To date there is no complete description of the position of the RAs in relation to the vertebral bodies in normal subjects. Most published anatomical studies regarding renal arteries are based on autopsies or anatomical parts. Knowledge of the normal location of the RA ostia in relation to the vertebra is necessary to appreciate pathology of the RAs such as RA pseudoaneurysms. Some investigators have shown that the use of 3-D MDCT angiography enables accurate identification of RA anatomy with high sensitivity.(1)
The present study revealed that the peak and the median of the origin of the right RA is the level of lower third of L1 in 41% of cases. In agreement with this study, the median level of origin of the right RA is the lower part of L1 in cadaveric studies(12) and by digital
44
Mohamed Atif A Said Ahmed, etc. Scince and Nature, April 2013 2(2): 41-45.
Table 1. Mean, SD, minimum and maximum value of the measured distances.
Parameter Mean SD Male (n=54) Female (n=46)Length of right renal artery 3.35 cm ±0.94 cm 3.35 ±0.93 cm 3.35±0.94 cmDiameter of right renal artery 0.61 cm ±0.12 cm 0.61±0.12 cm 0.61±0.11 cmDistance between celiac trunk and right renal artery 3.1 cm ±0.78 cm 3.2±0.80 cm 3±0.75 cmLength of left renal artery 2.75 cm ±0.38 cm 2.75±0.39 cm 2.75±0.36 cmDiameter of left renal artery 0.61 cm ±0.12 cm 0.62 ±0.13 cm 0.60±0.11 cmDiameter of main renal artery in the presence of extra renal artery 0.39 cm ±0.06 cm 0.40±0.07 cm 0.38±0.06 cmDistance between celiac trunk and left renal artery 3.4 cm ±0.72 cm 3.45±0.61 cm 3.3±0.84 cmDistance between celiac trunk and aortic bifurcation (Fig. 6) 12.7 cm ±1.31 cm 12.8±1.24 cm 12.5±1.29 cmHeight 159.3 cm ±8.65 cm 164.7±8.25 cm 154.8±7.85 cm
subtraction angiography.(13)In other studies it arises at the level of the disc between L1- L2.(14)
In this study, the mean angle of origin of the right RA from the sagittal plane of the aorta with the transverse plane is 55º± 7º counter clockwise with the peak point at -60º. There is a variation in the renal artery origin. The median angle of origin of right RA is 60° counter clockwise in cadaveric study(15) and did not show much difference. The right renal artery in another cadaveric study originated under the angle of 75 degrees.(16) The right renal artery arises ventrally at an angle of 30° ±15° from a plane orthogonal to the long axis of the spinous process of the 1st lumbar vertebrae.(17) In another study, the average angle was +21.24° ±2.31°.(18)
The length of the right RA in the present study is 3.35 ± 0.94 cm and its diameter is 0.61 ± 0.12 cm. The average length of the right RA is greater than the left especially in kidneys with single artery.(19) Greater length right RAs (4.4 to 11.1 cm) were described by Janschek and others.(20) such discordance could have been due to the greater number of specimen having late ramification of the right renal artery observed in the reference work. In recent study, the mean diameters for RA are 0.55 ±0.09 cm.(21) Normal renal arterial information is useful not only for planning and performing of endovascular and laparoscopic urologic procedures, but also for medical device development.(5)
The mean distance between the celiac trunk and the right RA is 3 cm in Ozan and others study(6) which can be compared to 3.1 ±0.78 cm in the present study.
Median level of origin of the left RA is the disc between L1 and L2. In 76 % of the cases in the present study, the level of origin is the disc between L1 and L2 and the upper part of L2. The median level of origin of the left RA in one study by digital subtraction angiography is at the level of the upper part of L2.(13) Pennington and Soames(12) stated that, the level of left renal artery is the lower part of L1 vertebrae. The right RA is emerging a little higher than the left one.(13) The present study has a unique case with the left RA higher up at the same level of superior mesenteric artery in the upper third of L1 above the level of right RA by 2.6 cm. According to the classic anatomic descriptions, as well as in a research on the origin of the renal arteries in human foetuses by Çiçekcibaºi and others(22) and the study on the origin of the renal arteries by angiography by Ozkan and other researchers(13), renal arteries originating between the vertebrae L1 and L2 were more frequently found, both in the right and left sides. The RAs may arise from the aorta at a point lower than usual, according to the position of the kidneys, and they also tend to be lower in older persons.(13)
The mean angle of origin of the left RA from the aorta in sagittal plane is 85º ±8º with the peak point at 90º. In agreement with this study, the median angle of origin of left RA is 90° in cadaveric study(15) and under the angle of 85 degrees in another cadaveric study.(16) The left renal artery arises dorsally at an angle of 7°±13° from a plane orthogonal to the long axis of the spinous process of the 1st lumbar vertebrae.(17) In another study, the average angle was +8.81° ±2.0°.(18) The length of the left
RA in the present study is 2.75 ± 0.38 cm and its diameter is 0.61 ± 0.12 cm. The diameter of the right and left RAs are nearly the same. Average left RA length was 2.86 cm and the RA diameter was 0.49 cm in Colombian people.(23)The lengths of the right and left RAs as observed in the present work are in agreement with the report by Dhar and Lal.(24)
Except for the main RA, the presence of extra RAs seems to be the most common anatomic variation of these arteries(25), with an incidence ranging from 8.7% to 75.7%.(3) The presence of an extra RA or short length of the RA may exclude the donor or present a challenge for the transplanting surgeons. (26) Extra RA was found in 14% of all cases in the present study. The RA diameter in kidneys with extra renal artery in the present study was significantly lower than those without an extra RA. The presence of extra RAs is very probable when the main RA has a diameter of less than 0.42 cm. Kidneys presenting a main RA with diameter greater than 0.55 cm most probably do not present extra RA.(27)
The mean distance between the celiac trunk and the left RA is 3.4 ± 0.72 cm in the present study comparing to 3.3 cm in Ozan and others study.(6) The mean distance between the celiac trunk and the aortic bifurcation is 12.7 ±1.31cm in the present study. Yahel and Arensburg reported the distance as 12.5 cm. The length of the abdominal aorta in the present study correlates with body height and gender. Yahel and Arensburg did not find any correlation between aortic length and height or gender.(11) It is interesting also to mention that the
45
Mohamed Atif A Said Ahmed, etc. Scince and Nature, April 2013 2(2): 41-45.
segments between celiac trunk and the RAs were significantly correlated with the aortic length and this finding is in agreement with those of Pennington and Soames.(12)
5 Conclusion
This study, was performed using 3-D MDCT angiography of 100 Saudi patients from Aseer central hospital, showed that the renal arteries present a broad spectrum of variability in their morphological expression respecting their emergence, originating angle, and length. There was no difference between the diameters of the main renal arteries. The renal artery diameter had a direct correlation with the origination angle. The renal artery diameter in kidneys with extra renal artery was significantly lower than those without an extra renal artery. Renal arteries associated with extra renal artery showed greater length. The segments between celiac trunk and the renal arteries were significantly correlated with the length of the abdominal aorta. Such aspects are important when considering a surgical approach, trauma, interpreting diagnostic images and teaching renal vascularization. To the best of our knowledge there is no similar study in the available literature, including data about the level and angle of origin, length, diameter and the metric relationships of renal arteries or correlations between them in the human body using 3-D MDCT angiography. The present study adds to the significance and knowledge of surgical anatomy. Understanding the position, calibre, the range of lengths, and the metric relations and included angle of the RAs, were advantageous to make use of selective arteriography, renal transplant, arterial embolism therapy and plan stent grafts.
References
1. Rubin GD, Alfrey EJ, Dake MD, Semba CP, Sommer FG, Kuo PC, et al. Assessment of living renal donors with spiral CT. Radiology 1995; 195(2):457-62.
2. El Fettouh HA, Herts BR, Nimeh T, Wirth SL, Caplin A, Sands M, Ramani AP,
Kaouk J, Goldfarb DA, Gill IS. Prospective comparisson of 3-dimensional volume rendered computerized tomography and conventional renal arteriography for surgical planning in patients undergoing laparoscopic donor nephrectomy. J Urol 2003; 170(1):57-60.
3. Tarzamni MK, Nezami N, Rashid RJ, Argani H, Hajealioghli P, Ghorashi S. Anatomical differences in the right and left renal arterial patterns. Folia Morphol 2008; 67(2):104-10.
4. Beregi JP, Prat A, Willoteaux S, Vasseur MA, Boularand V, Desmoucelle F. Covered stents in the treatment of peripheral arterial aneurysms: procedural results and midterm follow-up. Cardiovasc. Intervent. Radiol 1999; 22(1):13-9.
5. Turba UC, Uflacker R, Bozlar U, Hagspiel KD. Normal renal arterial anatomy assessed by multidetector CT angiography: are there differences between men and women?. Clin Anat 2009; 22(2):236-42.
6. Ozan H, Alemdaroglu A, Sinav A, Gümüsalan Y. Location of the ostia of the renal arteries in the aorta. Surg Radiol Anat 1997; 19(4):245-7.
7. Garti I, Nissenkorn I, Lerner M. Common origin of inferior mesenteric and main renal artery. Eur. Urol 1986; 12:215-6.
8. Ajmani, ML and Ajmani K. To study the intrarenal vascular segments of human kidney by corrosion cast technique. Anat Anz 1983; 154(4):293-303.
9. Keen EN. Origin of renal arteries from the aorta. Acta Anat (Basel) 1981; 110(4):285-6.
10. Kosinski H. Variability of places of origin of the human renal arteries. Folia Morphol 1994; 53(2):111-6.
11. Yahel J and Arensburg B. The topographic relationships of the unpaired visceral branches of the aorta. Clin Anat 1998; 11(5):304-9.
12. Pennington N and Soames RW. The anterior visceral branches of the abdominal aorta and their relationship to the renal arteries. Surg Radiol Anat 2005; 27(5):395-403.
13. Ozkan U, Oguzkurt L, Tercan F, Kizilkilic O, Koc Z, Koca N. Renal artery origins and variations: angiographic evaluation of 855 consecutive patients. Diagn Interv Radiol 2006; 12(4):183-6.
14. Lee CH, Seo BK, Choi YC, Shin HJ, Park JH, Jeon HJ, et al. Using MRI to evaluate anatomic significance of aortic bifurcation, right renal artery, and conus medullaris when locating lumbar vertebral segments. AJR Am J Roentgenol 2004; 182(5) :1295-300.
15. Panagouli E, Lolis E, Venieratos D. A morphometric study concerning the branching points of the main arteries in
humans: relationships and correlations. Ann Anat 201; 193(2):86-9.
16. Wozniak WT. Origin of the renal arteries from sides of aorta. Folia Morphol (Warsz) 2000; 58(4):259-61.
17. Kim PA, Khilnani NM, Trost DW, Sos TA, Lee L. Fluoroscopic Landmarks for Optimal Visualization of the Proximal Renal Arteries .J Vascular and Interventional Radiology.1999; 10(1): 37–9.
18. Bates MC, Crotty B, Kavasmaneck C, Campbell JR. Renal artery angiography: "the right ipsilateral oblique" myth. Catheter Cardiovasc Interv. 2006; 67(2):283-7.
19. Palmieri BJ, Petroianu A, Silva LC, Andrade LM, Alberti LR. Study of arterial pattern of 200 renal pedicle through angiotomography. Rev Col Bras Cir 2011; 38(2):116-21.
20. Janschek EC, Rothe AU, Holzenbein TJ, Langer F, Brugger PC, Pokorny H. Anatomic basis of right renal vein extension for cadaveric kidney transplantation. Urology 2004; 63: 660-4.
21. Ramadan SU, Yigit H, Gokharman D, Tuncbilek I, Dolgun NA, Kosar P, Kosar U. Can renal dimensions and the main renal artery diameter indicate the presence of an accessory renal artery? A 64-slice CT study. Diagn Interv Radiol 2011; 17(3):266-71.
22. Ciçekcibaº i AE, Ziylan T, Salbacak A, Seker M, Büyükmumcu M, Tuncer I. An investigation of the origin, location and variations of the renal arteries in human fetuses and their clinical relevance. Ann Anat 2005; 187(4):421-7.
23. Saldarriaga B, Pinto SA, Ballesteros LE. Morphological Expression of the Renal Artery. A Direct Anatomical Study in a Colombian Half-caste Population Int. J. Morphol 2008; 26(1):31-8.
24. Dhar P and Lal K. Main and accessory renal arteries-a morphological study. Ital. J. Anat. Embryol 2005; 110(2):101- 10.
25. Satyapal KS, Haffejee AA, Singh B, Ramsaroop L, Robbs JV, Kalideen JM. Additional renal arteries: incidence and morphometry. Surg Radiol Anat 2001; 23(1):33-8.
26. Flechner SM. Renal transplantation. In Tanagho EA, McAninch JW (eds): Smith’s General Urology. New York: McGraw-Hill 2007 :546.
27. Aytac SK, Yigit H, Sancak T. Correlation between the diameter of the main renal artery and the presence of an accessory renal artery. J. Ultrasound Med 2003; 22:433-9.
Science and Nature © ZolCat Academic House
46
Mohamed A Eid, etc. Science and Nature, April 2013 2(2): 46-50.
Combined Effect of Electromagnetic Field and Therapeutic Exercises on Muscle Mass in Juvenile Rheumatoid Arthritis
Mohamed A Eid1, *, Mostafa S Ali1
1Department of physical therapy, College of Applied Medical Sciences, Najran University, Najran, Saudi Arabia.
ABSTRACTBackground/Purpose: The aim
of the study was to investigate the combined effect of electromagnetic field and therapeutic exercises on lean muscle mass in children with juvenile rheumatoid arthritis (JRA). Methods: Thirty children with polyarticular JRA were included in this study. Fifteen children represent study group and treated with electromagnetic field and therapeutic exercises and fifteen children represent control group and treated ith therapeutic exercises only. Lean muscle mass was determined before and after six months of treatment. Results: Pre-treatment results of both groups indicate that mean lean muscle mass was 23975.2± 8152.21 gm. (mean ± SD) in control group and 24016.26 ± 7864.39 gm.in study group. There was no significant difference between both groups which indicate they were homogenous (p = 0.98). But post-treatment results showed that mean lean muscle mass was 24143.26 ± 8416.94 gm. in control group while that of study group was 27488.8 ± 7543.39 gm. which was significantly higher than the control group (p = 0.26). Conclusion: We conclude that treatment with electromagnetic field together with therapeutic exercises are effective in increasing lean muscle mass in children with polyarticular JRA than therapeutic exercises alone.
Key WordsLean muscle mass,
Juvenile rheumatoid arthritis, Electromagnetic field.
Correspondence to:
Mohamed A EidDepartment of physical therapy,
College of Applied Medical Sciences, Najran University,
Najran, Saudi Arabia.
E-mail: [email protected]
Mohamed A Eid, Mostafa S Ali. Combined effect of electromagnetic field and therapeutic exercises on muscle mass in juvenile rheumatoid arthritis. Sciene and Nature (2013) 2(2): 46-50. (ISSN 2324-7290) © ZolCat Academic House. www.zolcat.com
1 Introduction
Juvenile rheumatoid arthritis ( JRA) is one of the most common pediatric rheumatic diseases, with peak age at 4 and 10 years.[1] It is a heterogeneous group of unknown etiology, each of which has specific clinical features and prognostic implications.[2] It is one of the major causes of short and long-term morbidity, and growth impairment is one of the complications, especially in polyarticular and systemic JRA. [3] Clinically pain, inflammation, morning stiffness and functional inactivity are seen to be the major moderating factors in the ability to cope with the disease. Growth retardation and decreased final height can be the product of the disease itself or a side effect of treatment, most commonly corticosteroids.[4] Children with JRA usually suffer from pain, tiredness, and stiffness. So they are less active than their peers. Reduced mobility may lead to systemic muscle weakness, decreased flexibility, cardiovascular reserves and exercise capacity.[5] Muscle weakness and atrophy are most severe near inflamed joints, but may also occur in distant areas and persist long after remission of the arthritis. Contributing factors include alterations in anabolic hormones, production of inflammatory cytokines and high resting energy metabolism, abnormal protein metabolism, motor unit inhibition from pain and swelling and disuse. Common patterns include weakness in hip extension and abduction, knee extension, planter flexion, shoulder abduction and flexion, elbow flexion and extension, wrist extension, and hand
47
Mohamed A Eid, etc. Science and Nature, April 2013 2(2): 46-50.
grip. Muscle weakness may contribute to activity restrictions that may result in decreased endurance.[6] Dual energy x-ray absorptiometry (DEXA) is the most common method for assessing bone mineral density(BMD) and muscle mass in children and must take into consideration age, height, weight and sexual maturity rating[7]. Since the magnetic field generated can penetrate through high resistance structures such as bone, fat, skin, clothes, or even plaster cast, it has been shown that, electromagnetic fields provide a practical exogenous method for inducing cell and tissue modification and correcting selected pathological states.[8] Magnetic fields were applied to promote bone healing, treat osteoarthritis and inflammatory diseases of the musculoskeletal system, alleviate pain and enhance healing of ulcers. This demonstrates how much magnetic field is beneficial for the field of physical therapy.[9]
2 Materials and Methods
Patients
Thirty children with polyarticular JRA ranged in age from 12 to 16 years were enrolled in this study. They were selected from Rheumatology clinic of King Khalid Hospital and Pediatric Hospital in Najran, KSA. The diagnosis and classification of JRA were based on the 1977 American College of Rheumatology (ACR) criteria.10 Inclusion criteria for the study were presence of arthritis in five or more joints during first 6 months of disease, symmetry of arthritis however, degree of involvement was varied, cardinal hallmark signs and symptoms of joints involvement in JRA that generally were marked by pain, swelling and morning stiffness and children who are free from severe tightness or any skeletal abnormality. Exclusion criteria were patients with systemic or oligoarthritis onset, patients who have congenital or acquired skeletal deformities, patients who have any cardiopulmonary dysfunctions, patients with advanced
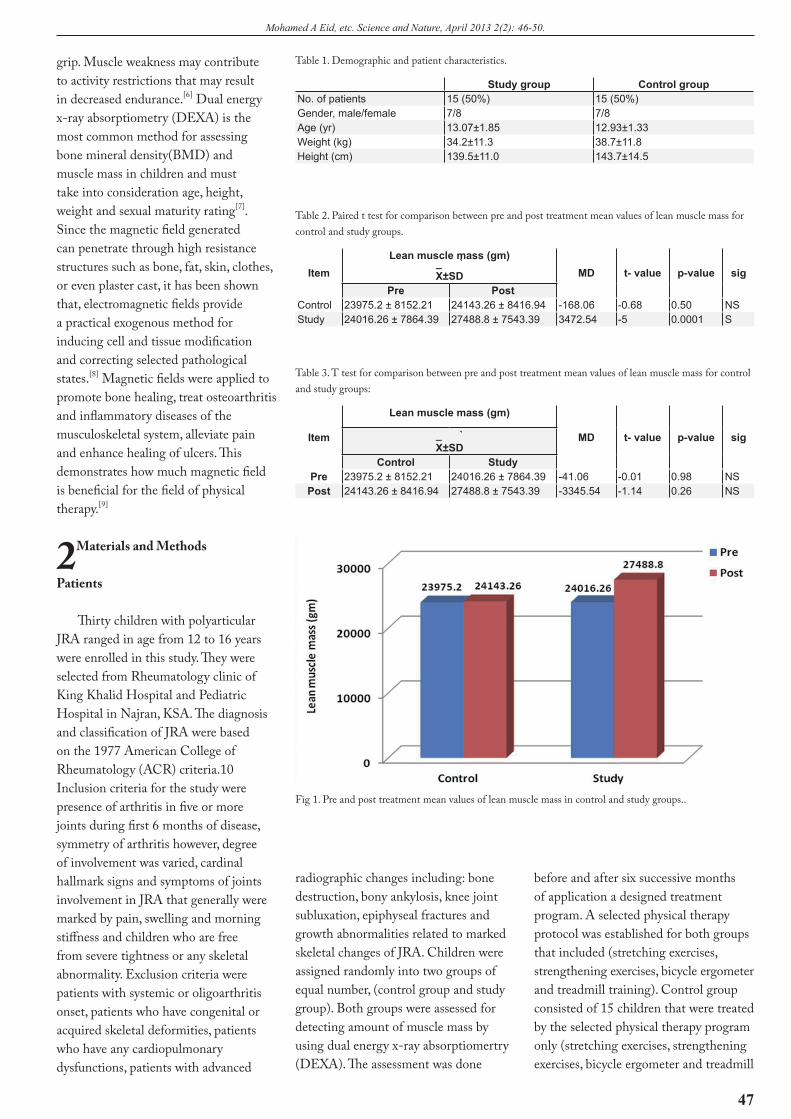
Table 1. Demographic and patient characteristics.
Study group Control groupNo. of patients 15 (50%) 15 (50%)Gender, male/female 7/8 7/8Age (yr) 13.07±1.85 12.93±1.33Weight (kg) 34.2±11.3 38.7±11.8Height (cm) 139.5±11.0 143.7±14.5
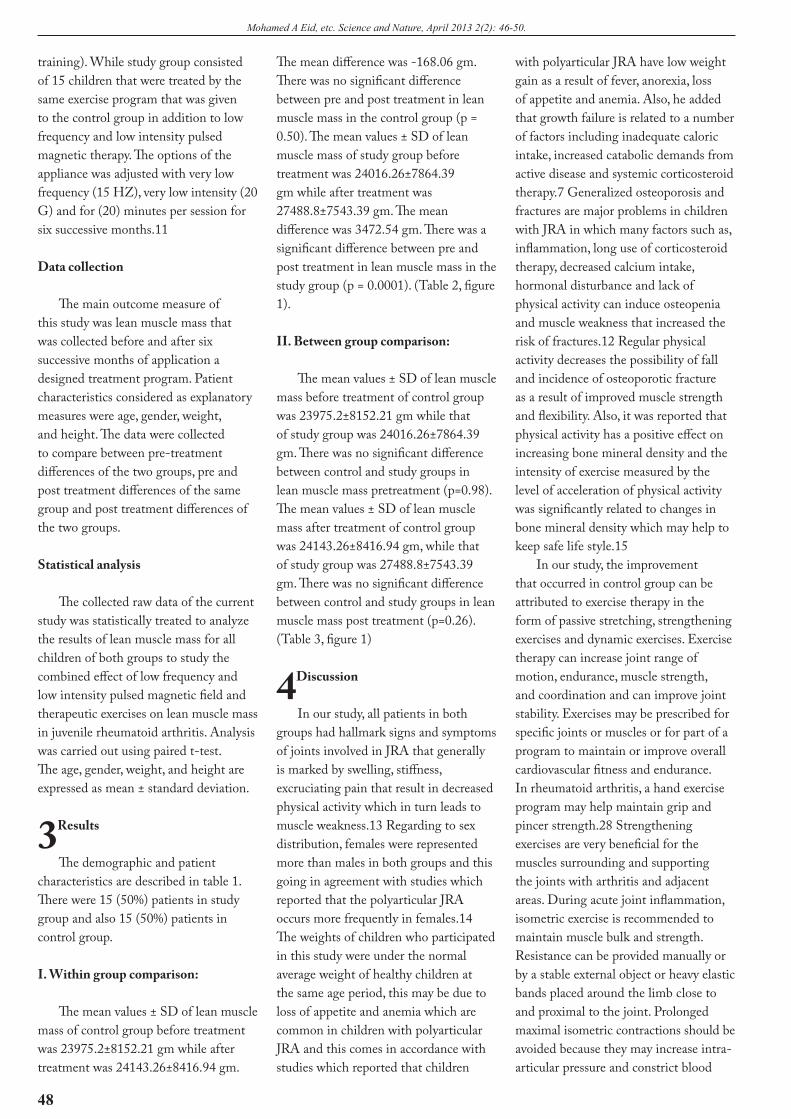
Table 2. Paired t test for comparison between pre and post treatment mean values of lean muscle mass for control and study groups.
ItemLean muscle mass (gm)
_ `X±SD MD t- value p-value sig
Pre PostControl 23975.2 ± 8152.21 24143.26 ± 8416.94 -168.06 -0.68 0.50 NSStudy 24016.26 ± 7864.39 27488.8 ± 7543.39 3472.54 -5 0.0001 S
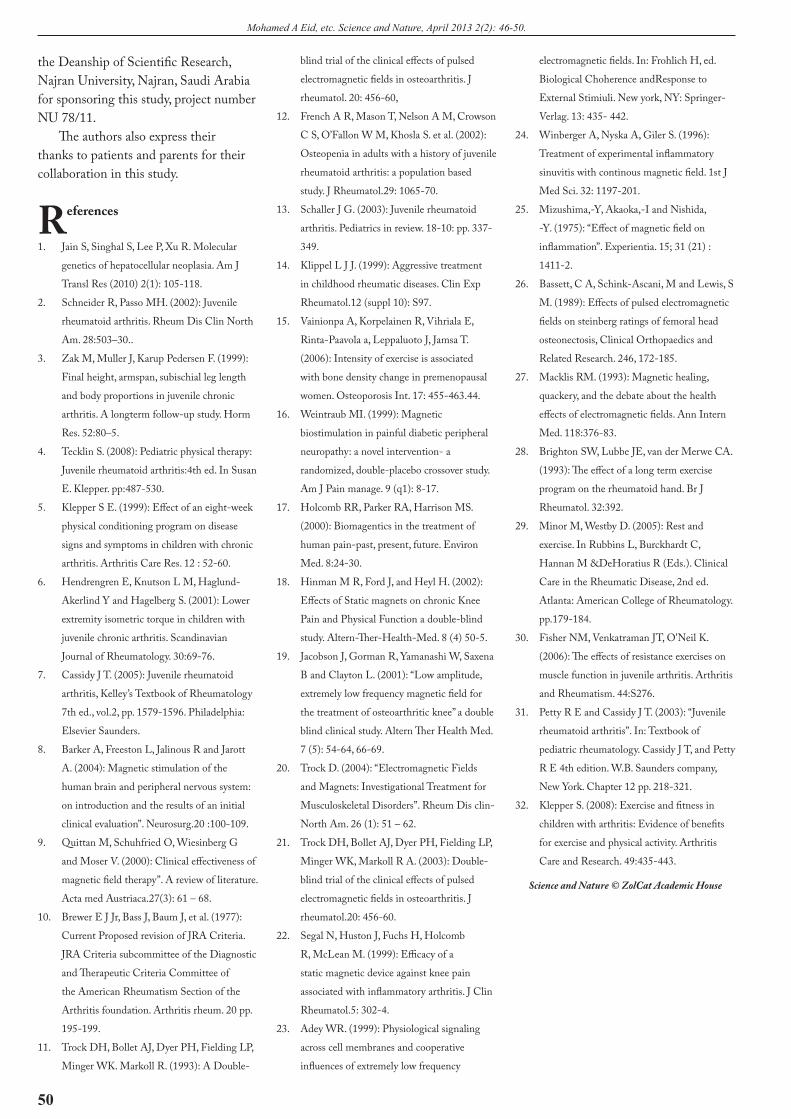
Fig 1. Pre and post treatment mean values of lean muscle mass in control and study groups..
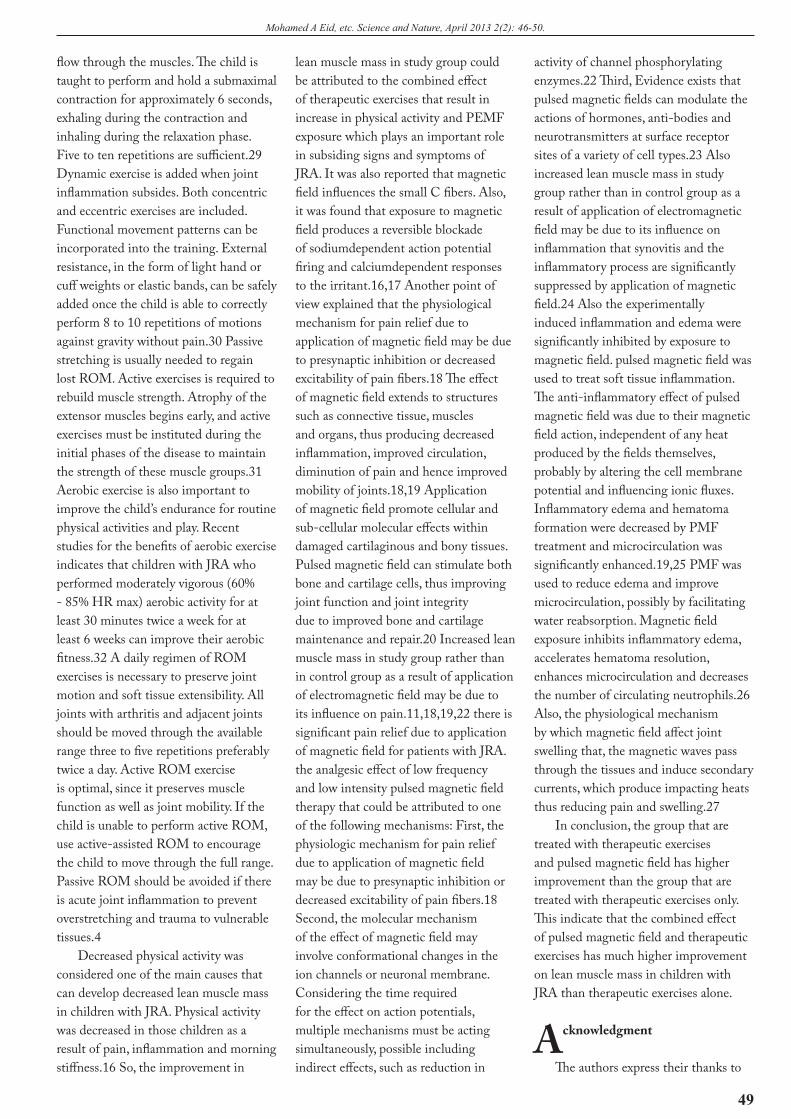
Table 3. T test for comparison between pre and post treatment mean values of lean muscle mass for control and study groups:
Item
Lean muscle mass (gm)
MD t- value p-value sig_ `X±SD
Control StudyPre 23975.2 ± 8152.21 24016.26 ± 7864.39 -41.06 -0.01 0.98 NS
Post 24143.26 ± 8416.94 27488.8 ± 7543.39 -3345.54 -1.14 0.26 NS
radiographic changes including: bone destruction, bony ankylosis, knee joint subluxation, epiphyseal fractures and growth abnormalities related to marked skeletal changes of JRA. Children were assigned randomly into two groups of equal number, (control group and study group). Both groups were assessed for detecting amount of muscle mass by using dual energy x-ray absorptiomertry (DEXA). The assessment was done
before and after six successive months of application a designed treatment program. A selected physical therapy protocol was established for both groups that included (stretching exercises, strengthening exercises, bicycle ergometer and treadmill training). Control group consisted of 15 children that were treated by the selected physical therapy program only (stretching exercises, strengthening exercises, bicycle ergometer and treadmill
48
Mohamed A Eid, etc. Science and Nature, April 2013 2(2): 46-50.
training). While study group consisted of 15 children that were treated by the same exercise program that was given to the control group in addition to low frequency and low intensity pulsed magnetic therapy. The options of the appliance was adjusted with very low frequency (15 HZ), very low intensity (20 G) and for (20) minutes per session for six successive months.11
Data collection
The main outcome measure of this study was lean muscle mass that was collected before and after six successive months of application a designed treatment program. Patient characteristics considered as explanatory measures were age, gender, weight, and height. The data were collected to compare between pre-treatment differences of the two groups, pre and post treatment differences of the same group and post treatment differences of the two groups.
Statistical analysis
The collected raw data of the current study was statistically treated to analyze the results of lean muscle mass for all children of both groups to study the combined effect of low frequency and low intensity pulsed magnetic field and therapeutic exercises on lean muscle mass in juvenile rheumatoid arthritis. Analysis was carried out using paired t-test. The age, gender, weight, and height are expressed as mean ± standard deviation.
3 Results
The demographic and patient characteristics are described in table 1. There were 15 (50%) patients in study group and also 15 (50%) patients in control group.
I. Within group comparison:
The mean values ± SD of lean muscle mass of control group before treatment was 23975.2±8152.21 gm while after treatment was 24143.26±8416.94 gm.
The mean difference was -168.06 gm. There was no significant difference between pre and post treatment in lean muscle mass in the control group (p = 0.50). The mean values ± SD of lean muscle mass of study group before treatment was 24016.26±7864.39 gm while after treatment was 27488.8±7543.39 gm. The mean difference was 3472.54 gm. There was a significant difference between pre and post treatment in lean muscle mass in the study group (p = 0.0001). (Table 2, figure 1).
II. Between group comparison:
The mean values ± SD of lean muscle mass before treatment of control group was 23975.2±8152.21 gm while that of study group was 24016.26±7864.39 gm. There was no significant difference between control and study groups in lean muscle mass pretreatment (p=0.98). The mean values ± SD of lean muscle mass after treatment of control group was 24143.26±8416.94 gm, while that of study group was 27488.8±7543.39 gm. There was no significant difference between control and study groups in lean muscle mass post treatment (p=0.26). (Table 3, figure 1)
4 Discussion
In our study, all patients in both groups had hallmark signs and symptoms of joints involved in JRA that generally is marked by swelling, stiffness, excruciating pain that result in decreased physical activity which in turn leads to muscle weakness.13 Regarding to sex distribution, females were represented more than males in both groups and this going in agreement with studies which reported that the polyarticular JRA occurs more frequently in females.14 The weights of children who participated in this study were under the normal average weight of healthy children at the same age period, this may be due to loss of appetite and anemia which are common in children with polyarticular JRA and this comes in accordance with studies which reported that children
with polyarticular JRA have low weight gain as a result of fever, anorexia, loss of appetite and anemia. Also, he added that growth failure is related to a number of factors including inadequate caloric intake, increased catabolic demands from active disease and systemic corticosteroid therapy.7 Generalized osteoporosis and fractures are major problems in children with JRA in which many factors such as, inflammation, long use of corticosteroid therapy, decreased calcium intake, hormonal disturbance and lack of physical activity can induce osteopenia and muscle weakness that increased the risk of fractures.12 Regular physical activity decreases the possibility of fall and incidence of osteoporotic fracture as a result of improved muscle strength and flexibility. Also, it was reported that physical activity has a positive effect on increasing bone mineral density and the intensity of exercise measured by the level of acceleration of physical activity was significantly related to changes in bone mineral density which may help to keep safe life style.15
In our study, the improvement that occurred in control group can be attributed to exercise therapy in the form of passive stretching, strengthening exercises and dynamic exercises. Exercise therapy can increase joint range of motion, endurance, muscle strength, and coordination and can improve joint stability. Exercises may be prescribed for specific joints or muscles or for part of a program to maintain or improve overall cardiovascular fitness and endurance. In rheumatoid arthritis, a hand exercise program may help maintain grip and pincer strength.28 Strengthening exercises are very beneficial for the muscles surrounding and supporting the joints with arthritis and adjacent areas. During acute joint inflammation, isometric exercise is recommended to maintain muscle bulk and strength. Resistance can be provided manually or by a stable external object or heavy elastic bands placed around the limb close to and proximal to the joint. Prolonged maximal isometric contractions should be avoided because they may increase intra-articular pressure and constrict blood
49
Mohamed A Eid, etc. Science and Nature, April 2013 2(2): 46-50.
flow through the muscles. The child is taught to perform and hold a submaximal contraction for approximately 6 seconds, exhaling during the contraction and inhaling during the relaxation phase. Five to ten repetitions are sufficient.29 Dynamic exercise is added when joint inflammation subsides. Both concentric and eccentric exercises are included. Functional movement patterns can be incorporated into the training. External resistance, in the form of light hand or cuff weights or elastic bands, can be safely added once the child is able to correctly perform 8 to 10 repetitions of motions against gravity without pain.30 Passive stretching is usually needed to regain lost ROM. Active exercises is required to rebuild muscle strength. Atrophy of the extensor muscles begins early, and active exercises must be instituted during the initial phases of the disease to maintain the strength of these muscle groups.31 Aerobic exercise is also important to improve the child’s endurance for routine physical activities and play. Recent studies for the benefits of aerobic exercise indicates that children with JRA who performed moderately vigorous (60% - 85% HR max) aerobic activity for at least 30 minutes twice a week for at least 6 weeks can improve their aerobic fitness.32 A daily regimen of ROM exercises is necessary to preserve joint motion and soft tissue extensibility. All joints with arthritis and adjacent joints should be moved through the available range three to five repetitions preferably twice a day. Active ROM exercise is optimal, since it preserves muscle function as well as joint mobility. If the child is unable to perform active ROM, use active-assisted ROM to encourage the child to move through the full range. Passive ROM should be avoided if there is acute joint inflammation to prevent overstretching and trauma to vulnerable tissues.4
Decreased physical activity was considered one of the main causes that can develop decreased lean muscle mass in children with JRA. Physical activity was decreased in those children as a result of pain, inflammation and morning stiffness.16 So, the improvement in
lean muscle mass in study group could be attributed to the combined effect of therapeutic exercises that result in increase in physical activity and PEMF exposure which plays an important role in subsiding signs and symptoms of JRA. It was also reported that magnetic field influences the small C fibers. Also, it was found that exposure to magnetic field produces a reversible blockade of sodiumdependent action potential firing and calciumdependent responses to the irritant.16,17 Another point of view explained that the physiological mechanism for pain relief due to application of magnetic field may be due to presynaptic inhibition or decreased excitability of pain fibers.18 The effect of magnetic field extends to structures such as connective tissue, muscles and organs, thus producing decreased inflammation, improved circulation, diminution of pain and hence improved mobility of joints.18,19 Application of magnetic field promote cellular and sub-cellular molecular effects within damaged cartilaginous and bony tissues. Pulsed magnetic field can stimulate both bone and cartilage cells, thus improving joint function and joint integrity due to improved bone and cartilage maintenance and repair.20 Increased lean muscle mass in study group rather than in control group as a result of application of electromagnetic field may be due to its influence on pain.11,18,19,22 there is significant pain relief due to application of magnetic field for patients with JRA. the analgesic effect of low frequency and low intensity pulsed magnetic field therapy that could be attributed to one of the following mechanisms: First, the physiologic mechanism for pain relief due to application of magnetic field may be due to presynaptic inhibition or decreased excitability of pain fibers.18 Second, the molecular mechanism of the effect of magnetic field may involve conformational changes in the ion channels or neuronal membrane. Considering the time required for the effect on action potentials, multiple mechanisms must be acting simultaneously, possible including indirect effects, such as reduction in
activity of channel phosphorylating enzymes.22 Third, Evidence exists that pulsed magnetic fields can modulate the actions of hormones, anti-bodies and neurotransmitters at surface receptor sites of a variety of cell types.23 Also increased lean muscle mass in study group rather than in control group as a result of application of electromagnetic field may be due to its influence on inflammation that synovitis and the inflammatory process are significantly suppressed by application of magnetic field.24 Also the experimentally induced inflammation and edema were significantly inhibited by exposure to magnetic field. pulsed magnetic field was used to treat soft tissue inflammation. The anti-inflammatory effect of pulsed magnetic field was due to their magnetic field action, independent of any heat produced by the fields themselves, probably by altering the cell membrane potential and influencing ionic fluxes. Inflammatory edema and hematoma formation were decreased by PMF treatment and microcirculation was significantly enhanced.19,25 PMF was used to reduce edema and improve microcirculation, possibly by facilitating water reabsorption. Magnetic field exposure inhibits inflammatory edema, accelerates hematoma resolution, enhances microcirculation and decreases the number of circulating neutrophils.26 Also, the physiological mechanism by which magnetic field affect joint swelling that, the magnetic waves pass through the tissues and induce secondary currents, which produce impacting heats thus reducing pain and swelling.27
In conclusion, the group that are treated with therapeutic exercises and pulsed magnetic field has higher improvement than the group that are treated with therapeutic exercises only. This indicate that the combined effect of pulsed magnetic field and therapeutic exercises has much higher improvement on lean muscle mass in children with JRA than therapeutic exercises alone.
Acknowledgment
The authors express their thanks to
50
Mohamed A Eid, etc. Science and Nature, April 2013 2(2): 46-50.
the Deanship of Scientific Research, Najran University, Najran, Saudi Arabia for sponsoring this study, project number NU 78/11.
The authors also express their thanks to patients and parents for their collaboration in this study.
References
1. Jain S, Singhal S, Lee P, Xu R. Molecular
genetics of hepatocellular neoplasia. Am J
Transl Res (2010) 2(1): 105-118.
2. Schneider R, Passo MH. (2002): Juvenile
rheumatoid arthritis. Rheum Dis Clin North
Am. 28:503–30..
3. Zak M, Muller J, Karup Pedersen F. (1999):
Final height, armspan, subischial leg length
and body proportions in juvenile chronic
arthritis. A longterm follow-up study. Horm
Res. 52:80–5.
4. Tecklin S. (2008): Pediatric physical therapy:
Juvenile rheumatoid arthritis:4th ed. In Susan
E. Klepper. pp:487-530.
5. Klepper S E. (1999): Effect of an eight-week
physical conditioning program on disease
signs and symptoms in children with chronic
arthritis. Arthritis Care Res. 12 : 52-60.
6. Hendrengren E, Knutson L M, Haglund-
Akerlind Y and Hagelberg S. (2001): Lower
extremity isometric torque in children with
juvenile chronic arthritis. Scandinavian
Journal of Rheumatology. 30:69-76.
7. Cassidy J T. (2005): Juvenile rheumatoid
arthritis, Kelley’s Textbook of Rheumatology
7th ed., vol.2, pp. 1579-1596. Philadelphia:
Elsevier Saunders.
8. Barker A, Freeston L, Jalinous R and Jarott
A. (2004): Magnetic stimulation of the
human brain and peripheral nervous system:
on introduction and the results of an initial
clinical evaluation”. Neurosurg.20 :100-109.
9. Quittan M, Schuhfried O, Wiesinberg G
and Moser V. (2000): Clinical effectiveness of
magnetic field therapy”. A review of literature.
Acta med Austriaca.27(3): 61 – 68.
10. Brewer E J Jr, Bass J, Baum J, et al. (1977):
Current Proposed revision of JRA Criteria.
JRA Criteria subcommittee of the Diagnostic
and Therapeutic Criteria Committee of
the American Rheumatism Section of the
Arthritis foundation. Arthritis rheum. 20 pp.
195-199.
11. Trock DH, Bollet AJ, Dyer PH, Fielding LP,
Minger WK. Markoll R. (1993): A Double-
blind trial of the clinical effects of pulsed
electromagnetic fields in osteoarthritis. J
rheumatol. 20: 456-60,
12. French A R, Mason T, Nelson A M, Crowson
C S, O’Fallon W M, Khosla S. et al. (2002):
Osteopenia in adults with a history of juvenile
rheumatoid arthritis: a population based
study. J Rheumatol.29: 1065-70.
13. Schaller J G. (2003): Juvenile rheumatoid
arthritis. Pediatrics in review. 18-10: pp. 337-
349.
14. Klippel L J J. (1999): Aggressive treatment
in childhood rheumatic diseases. Clin Exp
Rheumatol.12 (suppl 10): S97.
15. Vainionpa A, Korpelainen R, Vihriala E,
Rinta-Paavola a, Leppaluoto J, Jamsa T.
(2006): Intensity of exercise is associated
with bone density change in premenopausal
women. Osteoporosis Int. 17: 455-463.44.
16. Weintraub MI. (1999): Magnetic
biostimulation in painful diabetic peripheral
neuropathy: a novel intervention- a
randomized, double-placebo crossover study.
Am J Pain manage. 9 (q1): 8-17.
17. Holcomb RR, Parker RA, Harrison MS.
(2000): Biomagentics in the treatment of
human pain-past, present, future. Environ
Med. 8:24-30.
18. Hinman M R, Ford J, and Heyl H. (2002):
Effects of Static magnets on chronic Knee
Pain and Physical Function a double-blind
study. Altern-Ther-Health-Med. 8 (4) 50-5.
19. Jacobson J, Gorman R, Yamanashi W, Saxena
B and Clayton L. (2001): “Low amplitude,
extremely low frequency magnetic field for
the treatment of osteoarthritic knee” a double
blind clinical study. Altern Ther Health Med.
7 (5): 54-64, 66-69.
20. Trock D. (2004): “Electromagnetic Fields
and Magnets: Investigational Treatment for
Musculoskeletal Disorders”. Rheum Dis clin-
North Am. 26 (1): 51 – 62.
21. Trock DH, Bollet AJ, Dyer PH, Fielding LP,
Minger WK, Markoll R A. (2003): Double-
blind trial of the clinical effects of pulsed
electromagnetic fields in osteoarthritis. J
rheumatol.20: 456-60.
22. Segal N, Huston J, Fuchs H, Holcomb
R, McLean M. (1999): Efficacy of a
static magnetic device against knee pain
associated with inflammatory arthritis. J Clin
Rheumatol.5: 302-4.
23. Adey WR. (1999): Physiological signaling
across cell membranes and cooperative
influences of extremely low frequency
electromagnetic fields. In: Frohlich H, ed.
Biological Choherence andResponse to
External Stimiuli. New york, NY: Springer-
Verlag. 13: 435- 442.
24. Winberger A, Nyska A, Giler S. (1996):
Treatment of experimental inflammatory
sinuvitis with continous magnetic field. 1st J
Med Sci. 32: 1197-201.
25. Mizushima,-Y, Akaoka,-I and Nishida,
-Y. (1975): “Effect of magnetic field on
inflammation”. Experientia. 15; 31 (21) :
1411-2.
26. Bassett, C A, Schink-Ascani, M and Lewis, S
M. (1989): Effects of pulsed electromagnetic
fields on steinberg ratings of femoral head
osteonectosis, Clinical Orthopaedics and
Related Research. 246, 172-185.
27. Macklis RM. (1993): Magnetic healing,
quackery, and the debate about the health
effects of electromagnetic fields. Ann Intern
Med. 118:376-83.
28. Brighton SW, Lubbe JE, van der Merwe CA.
(1993): The effect of a long term exercise
program on the rheumatoid hand. Br J
Rheumatol. 32:392.
29. Minor M, Westby D. (2005): Rest and
exercise. In Rubbins L, Burckhardt C,
Hannan M &DeHoratius R (Eds.). Clinical
Care in the Rheumatic Disease, 2nd ed.
Atlanta: American College of Rheumatology.
pp.179-184.
30. Fisher NM, Venkatraman JT, O'Neil K.
(2006): The effects of resistance exercises on
muscle function in juvenile arthritis. Arthritis
and Rheumatism. 44:S276.
31. Petty R E and Cassidy J T. (2003): “Juvenile
rheumatoid arthritis”. In: Textbook of
pediatric rheumatology. Cassidy J T, and Petty
R E 4th edition. W.B. Saunders company,
New York. Chapter 12 pp. 218-321.
32. Klepper S. (2008): Exercise and fitness in
children with arthritis: Evidence of benefits
for exercise and physical activity. Arthritis
Care and Research. 49:435-443.
Science and Nature © ZolCat Academic House
51
ZHAO Wen-yong, etc. Science and Nature, April 2013 2(2): 51-56.
Delay of Skeletal Muscle Atrophy after Transplantation of Mesenchymal Progenitor Cells into Transected Position
ZHAO Wen-yong 1, WAN Li-hua 1, *, SHU Yong-ping 2, RAN Xin-ze 2
1 Department of forensic medicine, Basic Medical College of Chongqing Medical University, Chongqing, 400016, China2 State Key Laboratory of Trauma, Burns and Combined Injury; Institute of Combined Injury, College of Military Preventive Medicine, Third Military Medical University, Chongqing, 400038, China
ZHAO Wen-yong, WAN Li-hua, SHU Yong-ping, RAN Xin-ze. Delay of skeletal muscle atrophy after transplantation of mesenchymal progenitor cell into transected position. Sciene and Nature (2013) 2(2): 51-56. (ISSN 2324-7290) © ZolCat Academic House. www.zolcat.com
ABSTRACTObjective To study the delay of
denervated skeletal muscle atrophy after transplantation of mesenchymal progenitor cells (MPC) into the transected position and the muscle. Methods MPC were taken from bones of hind limbs of GFP transgenic C57 mice for cultivation and identification. 48 C57 mice were divided into 4 groups evenly in random, group A (control group), group B (sham operated group), group C (MPC transplantation into transected position) and group D (MPC transplantation into muscle). 5μL MPC suspension were injected into the transected position of sciatic nerve and the gastrocnemius in group C and D, and 5μL Sodium Chloride was injected into the gastrocnemius in group B, while nothing was injected in group A. The locomotor ability of mice hind limbs was observed. The wet weight of gastrocnemius and the retain ratio of cross section area (CSA) of muscle fibers were measured and the ultrastructural structure was observed at 2 weeks and 4 weeks after the operation. The expressions of α-actin and myoglobulin (MHC) were detected with Western blot, and Myogenin and MyoD with RT-PCR. Results The wet weight of gastrocnemius and the retain ratio of muscle fibers CSA of group C and D were obviously higher than those of group B at 2 weeks and 4 weeks after the operation (P < 0.01); The degeneration level of muscle cell nucleus, mitochondria and endocytoplasmic reticulum and the
degree of muscle fibrosis of group C and D were obviously lower than those of group B at 4 weeks after the operation (P < 0.05), while the expression level of α-actin, MHC, Myogenin and MyoD was obviously higher than that of group B (P < 0.05). Conclusion The transplantation of allogenic MPC in vivo is effective for the delay of denervated muscle atrophy.
Key WordsMesenchymal progenitor cells, Muscle atrophy, Denervation,
Peripheral nerve.
Correspondence to:
Prof. WAN Li-huaBasic Medical College of
Chongqing Medical University,Chongqing,
ChinaTel: +86-023-68485994
E-mail: [email protected]
AcknowledgementThis paper is supported by the
National Key Basic Research and Development Plan of China (973 Program) (NO.2012CB518100).
It is found that neural stem cell can differentiate into neurons
in vitro and can effectively delay the denervated skeletal muscle atrophy after transplanting it into impaired nerves or target muscle(1-2), while the way of obtaining sufficient neural stem cell is relatively limited and the amplification is also difficult, therefore, it is very important to find a new kind of transplanted cell(3). The new research has found that MPC can be induced to differentiate into neuron-like cell in vitro(4), and it is expected to become the seed cell instead of neural stem cell with the characteristics of easy access and growth, and strong reproductive activity, etc. (5). MPC can be induced to differentiate into neuron-like cell in vitro, whether it can delay the denervated muscle atrophy after transplanting it into transected position of nerves or target muscle or not? There are rare reports on it at present, and some related researches has done in this study on the basis of it.
1 Materials and Methods
1.1 Experimental animals
6 GFP transgenic C57 mice [Female, 3 years old, (10±1)g weight)]; 48 C57 mice [Male, 12 years old, (20±1)g weight)]; These animals are provided by the animal center of Third Military Medical University, Chinese People's Liberation Army. Animal use certificate: SCXK (Chongqing) 2007-0004; Environmental permit certificate: XYXK
52
ZHAO Wen-yong, etc. Science and Nature, April 2013 2(2): 51-56.
(Yu) 2007-0004.
1.2 Main reagents
Rabbit antimouse α-actin, MHC, GAPDH antibody and the second antibody of goat anti-rabbit IgG/TRITC (Sigma Company, America); Protein extract (Pierce Company, America); RNAiso Reagent, RNA PCR Kit(AMV) ver.3.0 (TaKaRa Company, Japan); Myogenin amplification primers are 5′-TGGAGCTGTATGAGACATCCC-3′ and 5′-TGGACAATGCTCAGGGGTCCC-3′, GAPDH amplification primers are 5′-ACCACAGTCCATGCCATCAC-3′ and 5′-TCCACCACCCTGTTGCTGTA-3′, MyoD amplification primers are 5′-GCCCGCGCTCCAACTGCTCTGAT-3′, 5′-TCTTTTGGGCGTGAAGAACCAG-3′, and the primer is composed by Shanghai Sheng Gong biological engineering co., LTD.
1.3 Abstraction, cultivation and identification of MPC
Long bones of hind limbs in GFP transgenic C57 mice were obtained, and the mothods of abstraction, cultivation and identification of MPC could be seen in the literature(4).
1.4 Model preparation of the denervated gastrocnemius in mice
48 C57 mice were divided into 4 groups evenly in random, group A (control group), group B (sham operated group), group C (MPC transplantation into transected position) and group D (MPC transplantation into muscle). The model preparation ways of the denervated gastrocnemius in mice can be found in the literatures(6); Nothing was done in group A. 6 mice in each group were taken out and broken to death at 2 weeks and 4 weeks after operation, and the gastrocnemius extracted from bilateral legs was observed in the experiment, meanwhile, the muscle tissue of nerve transected position in group C was extracted.
1.5 MPC transplantation in vivo
The third generation of MPC was selected and adjusted its cell concentra-tion to 5×10⁵/μL with physiological saline. 5μL MPC suspension was slowly injected into the nerve transected position and gastrocnemius of group C and D respectively, and 5μL physiological saline was injected with the same method in group B; nothing was done in group A.
1.6 Observation of index
1.6.1 General conditionThe locomotor activity of hind limbs
in mice was observed.1.6.2 Survival condition of MPC
transplantationThe muscle surrounding the MPC
injection site was cut to make tissue frozen section, and the survival condition of transplanted cells could be observed under fluorescence microscope with the spontaneous green fluorescence of body cells in GFP transgenic mice.
1.6.3 Measurement of wet weight retain ratio in gastrocnemius
The gastrocnemius at two sides was completely taken out and weighed, and its wet weight retain ratio could be calculated with the weight of right side divided by that of left side.
1.6.4 Measurement of retain ratio of muscle fibers CSA.
The tissue of middle muscle belly in two-side hind limbs was chipped to make frozen section and done HE stain, the muscle fibers CSA could be measured by VDSIII semi-automatic image analyzer (A.M.S Company, British), and the retain ratio could be calculated with the area of right side divided by that of left side.
1.6.5 Observation of ultramicro-structure
A small amount of tissue of the middle muscle belly in right hind limbs was chipped to make ultrathin section, and JEM-12OOEX transmission electron microscope was used to observe the degenerated myocyte nucleus, mitochondria, endoplasmic reticulum, shape of myofilament and myocomma, and the changes of collagen fibers.
1.6.6 Expression of α-actain and
MHC was detected by Western blotThe total protein of muscle could
be extracted following instruction, rabbit antimouse α-actin/MHC and goat anti-rabbit IgG with membrane were incubated under 37°C respectively after electrophoresis, semi-dry transfer membrane and blockage, and the membrane was discontinuously washed in this process. Chemiluminescence kit was used for visualization, fixing and photographs in the end, the results were analyzed with the gel imaging system, and the semiquantitative analysis was done with gray scanning.
1.7 Genetic expression of Myogenin and MyoD was detected by RT-PCR
The total RNA in muscle was extracted following the description and done reverse transcription, PCR and gel electrophoresis were done with conventional methods, and the image was scanned under ultraviolet transilluminator in the end, then the semiquantitative analysis was done with the Quantity one image analysis software.
1.8 Statistical treatment
Analysis was done with SPSS10.0 statistical package. The data was recorded as average ± standard deviation, and the comparison among groups was tested by pairing t.
2 Results
2.1 General condition
The locomotor activity of mice right hind limbs in group C and D was gradually recovered to the normal status along with the extension of treatment.
2.2 Survival condition of MPC transplantation in vivo
The cells with spontaneous green fluorescence of the muscles surrounding MPC injection site in group C and D were uniformly distributed into myocyte gap (Figure 1a and c); The same cells

53
ZHAO Wen-yong, etc. Science and Nature, April 2013 2(2): 51-56.
Fig 1. Survival condition of MPC in the muscle (×200). a. Group of MPC transplantation into transected position; b and d. Sham operated group; c. Group of MPC transplantation into muscle
a b
c d
Fig 2. Changes of retain ratio of weight of muscle and cross section area of muscle fibers
P < 0.05, P < 0.01 compared with B group
a b
54
ZHAO Wen-yong, etc. Science and Nature, April 2013 2(2): 51-56.
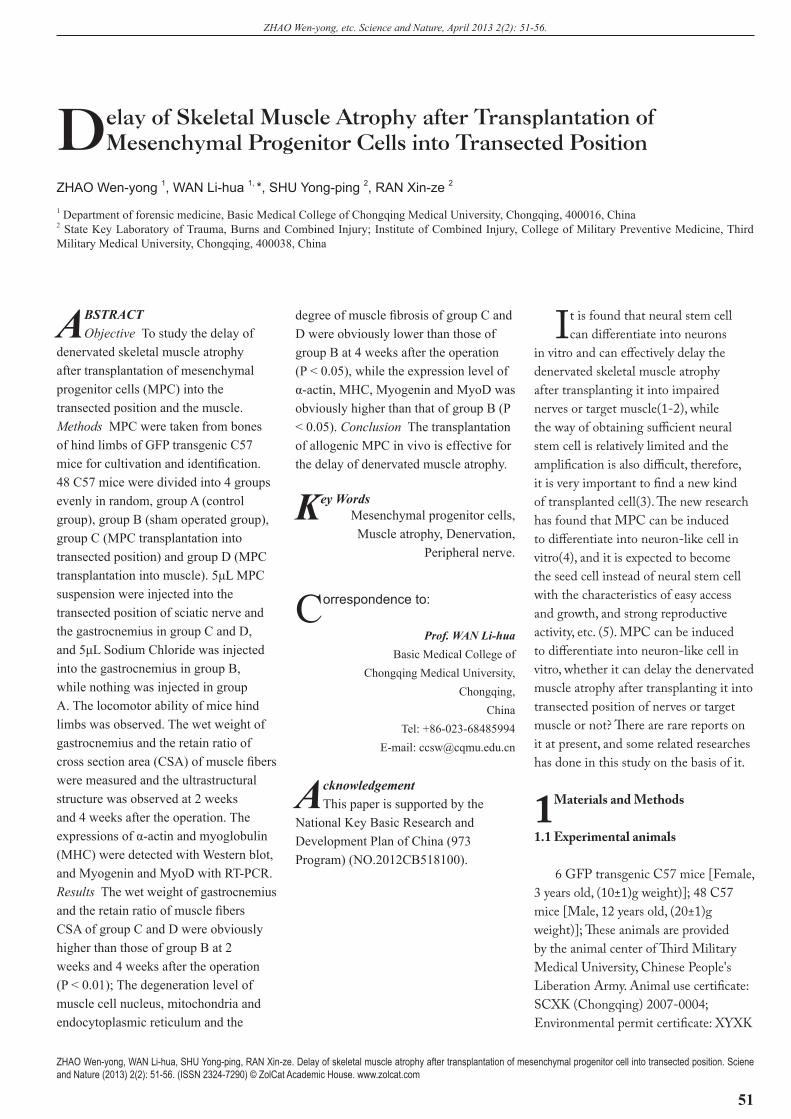
Fig 3. Changes of morphology of gastrocnemius. A, B, C and D represented respectivly A group, B group, C group and D group (×3700). a. Group of MPC transplantation into transected position; b and d. Sham operated group; c. Group of MPC transplantation into muscle
a b
c d
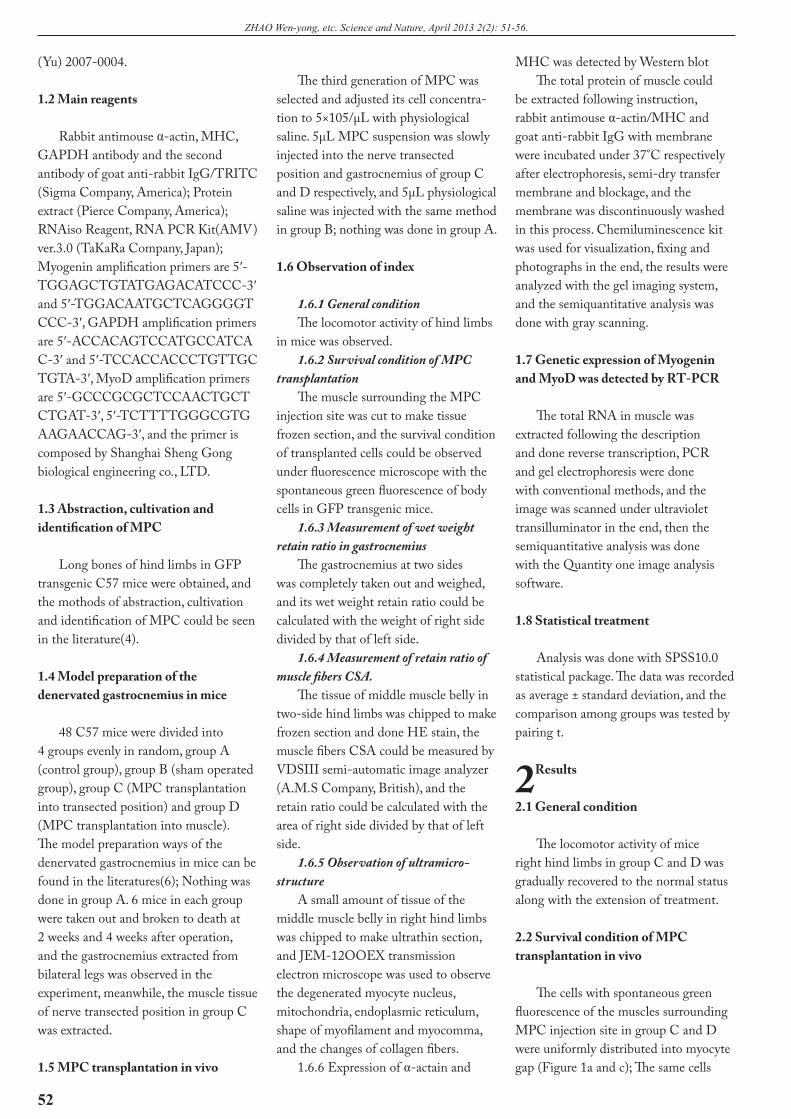
Fig 4. Expression of α-actin, MHC of gastrocnemius. a. represented the results of detection by western blot. b. represented the results of quantization.
P < 0.05, P < 0.01 compared with the A group.
a b
55
ZHAO Wen-yong, etc. Science and Nature, April 2013 2(2): 51-56.
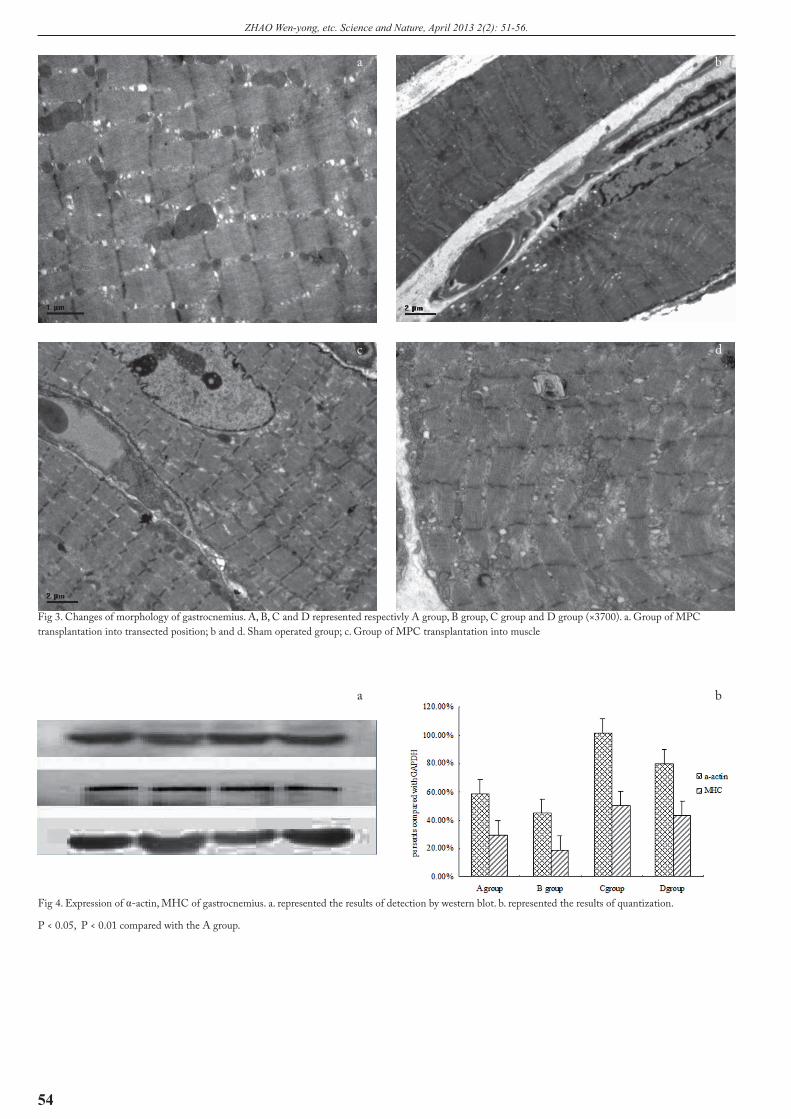
Fig 5. Expression of Myogenin and MHC of gastrocnemius. a. represented the results of detection by RT-PCR.1-4 represented respectivly A group、B group 、C group and D group. b. represented the results of quantization.
P < 0.05, P < 0.01 compared with A group; P < 0.05 compared with the transected group.
a b
were not found in group B (Figure 1b and d).
2.3 Changes of retain ratio of muscle wet weight and CSA
The wet weight of mice gastrocnemius and retain ratio of muscle fibers CSA were obviously higher than those of group B at 2 weeks and 4 weeks after operation (n=6) (Figure 2).
2.4 Observation of ultramicrostructure
The cytoblast increased obviously, Feulgen’s stain was uniform and heterochromatin was developed at 4 weeks after operation in group C and D compared with group B; Mitochondrial quantity increased with unobvious swelling, mitochondria ridge was more and its shape was relatively normal; Endoplasmic reticulum expanded less; Myofilament and myocomma were laid in order, without obvious confluens; Interstitial collagen of muscle fibers was less (Figure 3).
2.5 Expression of actin and myoglobulin
The expression degree of actin and myoglobulin in group C and D was obviously higher than that of group A and B at 4 weeks after operation (n=6) (Figure 4).
2.6 Genetic expression of Myogenin and MyoD was detected by RT-PCR
The genetic expression degree of MyoD in group C and D was obviously higher than that of group A and B at 4 weeks after operation, and the genetic expression degree of Myogenin was obviously higher than that of group B; The genetic expression of Myogenin was not obviously found in group A (n=6) (Figure 5).
3 Discussion
It is very important to find a new kind of transplanted cells because the way of obtaining neural stem cells is relatively limited and the amplification is also difficult. Although the bone mesenchymal stem cells(BMSCs) have the characteristics of multi-directional differentiation potency, sufficient resource, convenient materials, low danger, no immunological rejection and directional differentiation into neuron-like cells in vitro(7-9), yet the proliferation may not be ideal because the culture of mice MPC in vitro is easy to be polluted by hematopoietic stem cells(10), therefore, the transplantation treatment in vivo of denervated skeletal muscle atrophy can be affected by hematopoietic stem cells. In recent years, the research has found that MPC has the same characteristics of BMSCs, and
it can be the seed cells instead of neural stem cell because it comes from compact bone, and the pollution of hematopoietic stem cells can be avoided when culturing in vitro(11). Will the MPC transplantation in vivo survive and delay denervated skeletal muscle atrophy?
It is found that the locomotor activity of mice right hind limbs in group C and D is gradually recovered to the normal status along with the extension of treatment, transplanted cells can survive and evenly distribute into myocyte gap, and myofilament and myocomma are laid in order. Degeneration of myocyte nucleus, mitochondria and endoplasmic reticulum, and the muscle fibrotic degree are better than those of group B, and the descendent range of muscle wet weight and retain ratio of muscle fibers CSA, and the degradation speed of α-actin and MHC are obviously lower than those of group B, therefore, it shows that the MPC transplantation into nerve transected position or gastrocnemius can delay the denervated skeletal muscle atrophy. Muscle is still in a state of denervation because of nerve injury, and atrophy will be the last status of this kind of muscle without sufficient neurotrophy, but the transplantation of compact bone derived MPC will get more time for nerve regeneration, and can provide a better skeletal structure basis for the function recovery of muscle dominated by nerves.
56
ZHAO Wen-yong, etc. Science and Nature, April 2013 2(2): 51-56.
In addition, the expression of myogenic regulating factors (MRFs) such as MyoD and myogenin, etc. after MPC transplantation in vivo has been researched in this study. Rodrigues, etc.(12-13) have found that the quantity of muscle satellite cells in denervated post-skeletal muscle decreases rapidly along with the time extension of denervation, therefore, the maintenance of normal morphology and structure of muscle cells, and the regeneration of damaged and atrophic muscle cells depend on the content of muscle satellite cells, while the MRFs play a decisive role in the proliferation of muscle satellite cells, and only with the role of those factors, can the regeneration of muscle satellite cells grow towards the desired goal. MyoD as the determinative factor for myogenic differentiation exists in the satellite cells of neonatal and regenerated skeletal muscle. The muscle satellite cells activate the early MyoD when skeletal muscle regenerates, and then the MyoD is expressed in all the proliferous muscle satellite cells, therefore, MyoD is regarded as the marked protein for activated muscle satellite cells(14).
A large number of animal studies have found that the expression level of Myogenin rises with the denervation in mature skeletal muscle, then the synthesis of specific embryonal receptors in a series of skeletal muscle and spectrin is launched, and the expression of embryonal protein is the prerequisite for the reinnervation of denervated skeletal muscle(15). Ekmark, etc.(16) have detected the expression of myogenin genes and MyoD protein through immunoblotting, and found those two things have different changing processes after denervation. The expression of the former increases quickly in 24h after denervation, while decreases quickly after 5d and reaches to the lower on the 7d; however, the expression of the latter starts to decrease gradually after denervation. Russo, etc.(17) have found that the expression of MyoD mRNA decreases obviously after denervation, and the expression of myogenin genes amplified with RT-PCR in skeletal muscle cells decreases obviously after denervation.
The expression of myogenin genes and MyoD protein decreases obviously at the 8th week after denervation, and with obvious muscle atrophy, therefore, it indicates that the atrophic mechanism of skeletal muscle caused by the denervation is related to the decrease of myogenin genes and MyoD protein expression. It is found in this study that the expression level of MyoD in group C and D is obviously higher than that of group A and B, and the Myogenin genic expression is stronger than that of group B at the 4 weeks after operation. Therefore, the delay mechanism of skeletal muscle atrophy might be that the survival MPC secretes some neurotrophic factors, and they are brought to the gastrocnemius through axonal transport(MPC transplantation into nerve transected position) or diffusion(MPC transplantation into muscle), then they cause a large number of activated muscle satellite cells to differentiate and produce massive new muscle fibers or directly delay the atrophy of muscle cells, therefore, the wet weight, muscle protein level and muscle fibers CSA can be maintained, but its certain working mechanism needs a further study.
References
1. Shen YD, Xu JG, Xu WD, et al. Experimental study on neural stem cell transplantation delaying denervated muscle atrophy. Chinese Journal of Reparative and Reconstructive Surgery (2008) 22(90): 1051-1055.
2. Huang X, Jiang CQ, Xiao YF, et al. Experimental Studies of Induction of Neural Stem Cells in Vitro and Transplanted to Prevent Denervation Muscular Atrophy in Vivo. Shenzhen Journal of Integrated Traditional Chinese and Western Medicine (2009) 19:(2): 73-76.
3. Belegu V, Oudega M, Gary DS, et al.Restoring function after spinal cord injury: promoting sponatneous regneration with stem cells and activity based therapies. Neurosurg Clin NAm (2007) 18(1): 143- 168.
4. Yang L,Wan LH,Shu YP, et a1. Study on directed differentiation of mesenchymal progenitor cells into neuron- like cells in mice. Journal of ChongQing Medical University, (2010) 35(06): 801-804.
5. Tropel P, Platet N, Platel JC, et al. Functional neuronal differentiation of bone marrow- derived mesenchymal stem cells. Stem Cells
(2006) 24(12): 2868- 2876.6. Zhao WY, Wang T, Wang JP, et al. Effects of
denervation on expressions of muscle specific microRNAs in skeletal muscle of mice. Journal of Third Military Medical University (Di-San Junyi Daxue Xuebao) (2008) 30(21): 2034-2036.
7. Guan Rang-xian, Yan Xiao-hua, Chen Qi-wen. Baicalin induces the differentiation of human umbilical cord blood-derived mesenchymal stem cells towards neurons-like cells in vitro. Journal of Clinical Rehabilitative Tissue Engineering Research (2009) 13(14): 2787-2792.
8. Zhang XM, Shun HM, Yang H, et al. Human amniotic epithelial cells - secreted neurotrophic factors induces the differentiation of human umbilical cord blood mesenchymal stem cells into neuron-like cells: Possibility verification. Journal of Clinical Rehabilitative Tissue Engineering Research (2010) 14(6): 973-978.
9. Jin J, Huang J, Wang J, et al. Isolation, culture and differentiation of amnion mesenchymal stem cells into neuron-like cells in vitro. Journal of Clinical Rehabilitative Tissue Engineering Research (2010) 14(32): 5939-5943.
10. Phinney DG, Kopen G, Isaacson RL, et al. Plastic adherent stromal cells from the bone marrow of commonly used strains of inbred mice: Variations in yield, growth and differentiation. CellBiochem (1999) 72(4): 570- 585.
11. Guo ZK, Li H, Li XS, et al. Invitro characteristics and in vivo immunosuppressive activity of compact bone - derived murine mesenchymal progenitor cells. StemCells (2006) 24(5): 992- 1000.
12. Rodrigues AD, Schmalbruch H. Satellite cells and myonuclei in long-term denervated rat muscles. (1995) (4).
13. Carlson BM, Billington L, Faulkner JA. Studies on the regenerative recovery of long-term denervated muscle in rats (1996).
14. Cooper RN, Taybukhsh S, Mouly G, et al. In vivo satellite cell activation via Myf-5 and MyoD in regenerating mouse skeletal muscle.J Cell Sci (1999) 112: 2895.
15. Adams L, Carlson BM, Henderson L. Adaption of nicotinic acetylcholine receptor, Myogenin,and MRF4 gene expression to long-term muscle denervation. J Cell Biol (1995) 131: 1341-1349.
16. Ekmark M, Rana ZA, Stewart G, et a1. De-phosphorylation of MyoD is linking nerve-evoked activity to fast myosin heavy chain expression in rodent adult skeletal muscle. Physiol (2007) 584(Pt 2): 637-650.
17. Russo TL, Peviani SM, Freria CM, et a1. Electrical stimulation based on chronaxie reduces atrogin-l and myoD gene expressions in denervated rat musde. Muscle Nerve (2007) 35(1): 87-97..
Science and Nature © ZolCat Academic House
57
Imtiyaz A Raja, etc. Science and Nature, April 2013 2(2): 57-58.
Assessment of Some Metals in the Drinking Water of Dal Lake Kashmir
Imtiyaz A Raja 1, *, M Y Khan 1, N A Khan 3, M R Wani 3, A A Bhat 2
1 Introduction
Adequate water resources for future generations are not only a regional issue but also a global concern. Our country’s fresh water wealth is under threat due to variety of natural and human influences. Arsenic, fluoride and heavy metals occur as minor constituents of ground minor constituents including iron and nitrate is of concern as large amount of ground water is abstracted by drilling water-wells both in rural and urban areas for drinking and irrigation purposes. Sixteen states in India - Andhra Pradesh, Bihar, Delhi, Gujarat, Haryana, Jammu &Kashmir, Karnataka, Kerala, Madhya Pradesh, Maharashtra, Manipur, Orissa, Punjab, Rajasthan, Tamil Nadu and Uttar Pradesh have already been identified endemic to fluorosis (Mariappan etal., 2000). Arsenic contamination of ground water in eight districts of West Bengal is well documented and more cases are also reported from eastern part of Bihar, Gorakhpur, Balia, Western part of Uttar Pradesh and Chhattisgarh (Singh, 2006). The intensive farming belt of Western U.P., Haryana, Punjab, and parts of Rajasthan, Delhi and West Bengal have been reported to contain high NO3 in groundwater (Malve and Dhage, 1996).The main health risks due to arsenic are considered to be severe poisoning, and carcinogenic, specially, cancer of respiratory system and gastrointestinal tract whereas from fluoride it is fluorosis
1 Department of Chemistry, S.P. College, Srinagar, J&K, India2 Department of Zoology University of Kashmir, J&K, India3 Department of Chemistry, Degree College, Bemina, J&K, India
Imtiyaz A Raja, M Y Khan, N A Khan, M R Wani, A A Bhat. Assessment of some metals in the drinking water of Dal Lake Kashmir. Sciene and Nature (2013) 2(2):57-58. (ISSN 2324-7290) © ZolCat Academic House. www.zolcat.com
or bone disease. Similarly, the health effects due to high nitrates and heavy metals in water as well as food uptake of animals and humans are equally significant.
2 Materials and Methods
The water samples were drawn during monsoon ( July-Sept) and non-monsoon (Nov-Jan) in the year 2009 and 2010 from 1520 locations of Dal Lake Kashmir. The Sampling points were confined to springs, streams, rivers, bore wells, PHE (Public Health Engineering) supply and dug wells (groundwater and surface water resources)used for drinking purposes. While sampling for groundwater, samples were collected in plastic containers (PVC 250ml) after flushing out the tube wells (minimum 10 minutes) to get the fresh groundwater. Preservative (1:1 HNO3 solution to pH <2, about 3ml L-1 sample) were added to each water samples at the time of sampling and the containers were sealed. These samples were tested for 18physico-chemical parameters like pH, dissolved oxygen (DO), total dissolved solids (TDS),turbidity, fluoride, sulphate, calcium, magnesium, nitrate, bicarbonate and heavy metals like iron, copper, zinc, manganese, cadmium, lead, nickel and arsenic. The samples without preservatives were also collected for analysis of fluoride, nitrate and sulphate.
The physical parameters like pH,
ABSTRACTThe present study was carried in
the famous Dal Lake Kashmir. The Dal Lake is a eutrophic water body and is contaminated due to various inflows directly as well as indirectly. Main source of pollution comes from Dal dwellers and surrounding areas. During present study the metal contamination has been assessed in the drinking water of Dal dwellers. The study showed that there is an increasing trend in the metal contamination in the lake, no doubt still out of danger.
Key WordsDal Lake, Metal contamination.
Correspondence to:
Imtiyaz A RajaDepartment of Chemistry, S.P. College,
Srinagar, J&K, India.E-mail: [email protected]
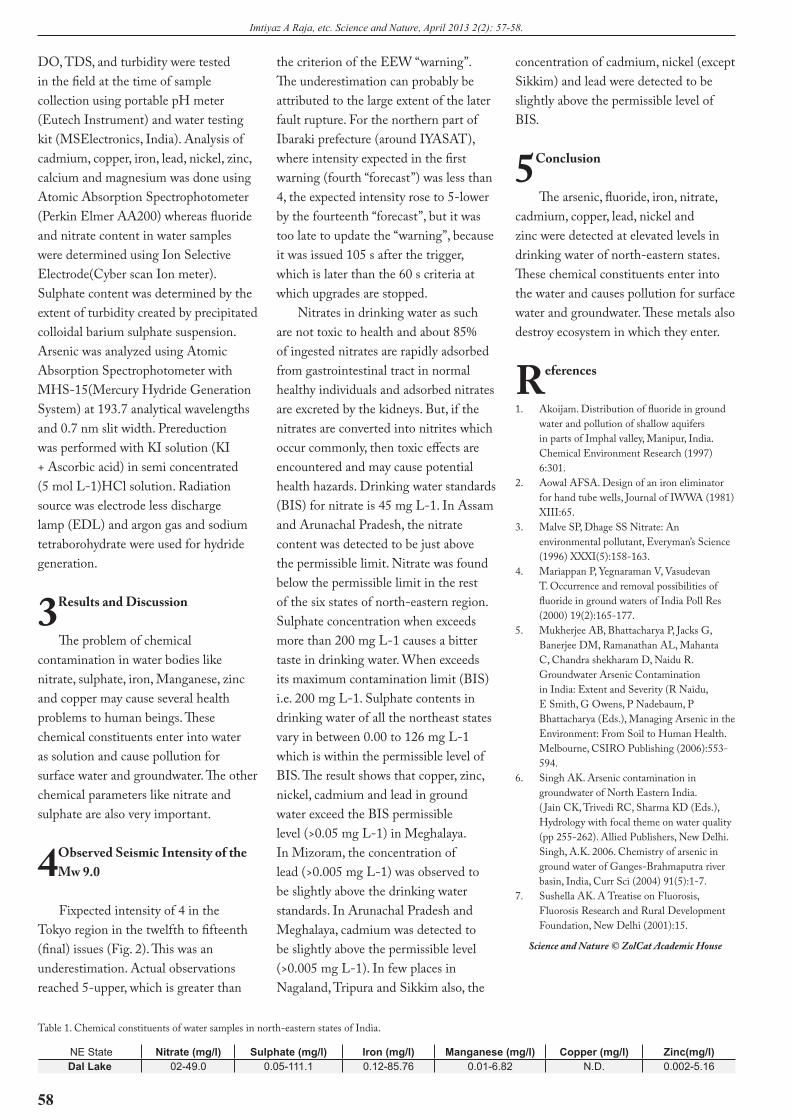
58
Imtiyaz A Raja, etc. Science and Nature, April 2013 2(2): 57-58.
DO, TDS, and turbidity were tested in the field at the time of sample collection using portable pH meter (Eutech Instrument) and water testing kit (MSElectronics, India). Analysis of cadmium, copper, iron, lead, nickel, zinc, calcium and magnesium was done using Atomic Absorption Spectrophotometer (Perkin Elmer AA200) whereas fluoride and nitrate content in water samples were determined using Ion Selective Electrode(Cyber scan Ion meter). Sulphate content was determined by the extent of turbidity created by precipitated colloidal barium sulphate suspension. Arsenic was analyzed using Atomic Absorption Spectrophotometer with MHS-15(Mercury Hydride Generation System) at 193.7 analytical wavelengths and 0.7 nm slit width. Prereduction was performed with KI solution (KI + Ascorbic acid) in semi concentrated (5 mol L-1)HCl solution. Radiation source was electrode less discharge lamp (EDL) and argon gas and sodium tetraborohydrate were used for hydride generation.
3 Results and Discussion
The problem of chemical contamination in water bodies like nitrate, sulphate, iron, Manganese, zinc and copper may cause several health problems to human beings. These chemical constituents enter into water as solution and cause pollution for surface water and groundwater. The other chemical parameters like nitrate and sulphate are also very important.
4 Observed Seismic Intensity of the Mw 9.0
Fixpected intensity of 4 in the Tokyo region in the twelfth to fifteenth (final) issues (Fig. 2). This was an underestimation. Actual observations reached 5-upper, which is greater than
the criterion of the EEW “warning”. The underestimation can probably be attributed to the large extent of the later fault rupture. For the northern part of Ibaraki prefecture (around IYASAT), where intensity expected in the first warning (fourth “forecast”) was less than 4, the expected intensity rose to 5-lower by the fourteenth “forecast”, but it was too late to update the “warning”, because it was issued 105 s after the trigger, which is later than the 60 s criteria at which upgrades are stopped.
Nitrates in drinking water as such are not toxic to health and about 85% of ingested nitrates are rapidly adsorbed from gastrointestinal tract in normal healthy individuals and adsorbed nitrates are excreted by the kidneys. But, if the nitrates are converted into nitrites which occur commonly, then toxic effects are encountered and may cause potential health hazards. Drinking water standards (BIS) for nitrate is 45 mg L-1. In Assam and Arunachal Pradesh, the nitrate content was detected to be just above the permissible limit. Nitrate was found below the permissible limit in the rest of the six states of north-eastern region. Sulphate concentration when exceeds more than 200 mg L-1 causes a bitter taste in drinking water. When exceeds its maximum contamination limit (BIS) i.e. 200 mg L-1. Sulphate contents in drinking water of all the northeast states vary in between 0.00 to 126 mg L-1 which is within the permissible level of BIS. The result shows that copper, zinc, nickel, cadmium and lead in ground water exceed the BIS permissible level (>0.05 mg L-1) in Meghalaya. In Mizoram, the concentration of lead (>0.005 mg L-1) was observed to be slightly above the drinking water standards. In Arunachal Pradesh and Meghalaya, cadmium was detected to be slightly above the permissible level (>0.005 mg L-1). In few places in Nagaland, Tripura and Sikkim also, the
concentration of cadmium, nickel (except Sikkim) and lead were detected to be slightly above the permissible level of BIS.
5 Conclusion
The arsenic, fluoride, iron, nitrate, cadmium, copper, lead, nickel and zinc were detected at elevated levels in drinking water of north-eastern states. These chemical constituents enter into the water and causes pollution for surface water and groundwater. These metals also destroy ecosystem in which they enter.
References
1. Akoijam. Distribution of fluoride in ground water and pollution of shallow aquifers in parts of Imphal valley, Manipur, India. Chemical Environment Research (1997) 6:301.
2. Aowal AFSA. Design of an iron eliminator for hand tube wells, Journal of IWWA (1981) XIII:65.
3. Malve SP, Dhage SS Nitrate: An environmental pollutant, Everyman’s Science (1996) XXXI(5):158-163.
4. Mariappan P, Yegnaraman V, Vasudevan T. Occurrence and removal possibilities of fluoride in ground waters of India Poll Res (2000) 19(2):165-177.
5. Mukherjee AB, Bhattacharya P, Jacks G, Banerjee DM, Ramanathan AL, Mahanta C, Chandra shekharam D, Naidu R. Groundwater Arsenic Contamination in India: Extent and Severity (R Naidu, E Smith, G Owens, P Nadebaum, P Bhattacharya (Eds.), Managing Arsenic in the Environment: From Soil to Human Health. Melbourne, CSIRO Publishing (2006):553-594.
6. Singh AK. Arsenic contamination in groundwater of North Eastern India. ( Jain CK, Trivedi RC, Sharma KD (Eds.), Hydrology with focal theme on water quality (pp 255-262). Allied Publishers, New Delhi. Singh, A.K. 2006. Chemistry of arsenic in ground water of Ganges-Brahmaputra river basin, India, Curr Sci (2004) 91(5):1-7.
7. Sushella AK. A Treatise on Fluorosis, Fluorosis Research and Rural Development Foundation, New Delhi (2001):15.
Science and Nature © ZolCat Academic House
Table 1. Chemical constituents of water samples in north-eastern states of India.
NE State Nitrate (mg/l) Sulphate (mg/l) Iron (mg/l) Manganese (mg/l) Copper (mg/l) Zinc(mg/l)Dal Lake 02-49.0 0.05-111.1 0.12-85.76 0.01-6.82 N.D. 0.002-5.16
59
B M Golrang, etc. Science and Nature, April 2013 2(2): 59-64.
Assessment of Watershed Management Implemented on Springal Peak Flood Discharge and Flood Volume, Using HEC-HMS Model (Case study: Kushk Abad sub-basin in Iran)
B M Golrang1, *, F S Lai2, S H R Sadeghi3, Khamurudin M N4, Kamziah Abd Kudus5, M Mashayekhi6, R Bagherian7
1 Department of Forest Management (ph.D Candidate), Faculty of Forestry, University Putra Malaysia, 43400 UPM, Malaysia2, 4, 5 Department of Forest Management, Faculty of Forestry, University Putra Malaysia, 43400 UPM, Malaysia3 Department of Mathematic (PhD Candidate), Faculty of Science, University Putra Malaysia, 43400, Malaysia3 Department of Watershed Management Engineering (Assoc. Professor), Faculty of Natural Resources, Tarbiat Modares University (TMU), Noor 46417-76489,Mazandaran,Iran.6 Department of English Language (PhD Candidate), Faculty of Modern Language, University Putra Malaysia, 43400, Malaysia7 Department of Watershed Management (Assistant Professor), Khorasan Razavi Agricultural and Natural Resources Research Center, Iran
B M Golrang, F S Lai, S H R Sadeghi, Khamurudin M N, Kamziah Abd Kudus, M Mashayekhi, R Bagherian. Assessment of watershed management implemented on springal peak flood discharge and flood volume, using HEC-HMS model. (Case study: Kushk Abad sub-basin in Iran). Sciene and Nature (2013) 2(2):59-64. (ISSN 2324-7290) © ZolCat Academic House. www.zolcat.com
1 Introduction
Evaluation of watershed management activities is one of the main subjects for future planning of practical projects and natural resources management. Due to the lack of any tool for assessment of watershed processes in many cases, distributed hydrological models can be useful. The purpose of this study was evaluation of watershed management activities in Kushk-Abad Watershed by HEC-HMS (Hydrologic Modelling System). HEC-HMS is one of the computer models for simulation of its ability in simulation of short time events; ease to use and use of common methods it became very popular in Iran. Selection of a rainfall-runoff model is a compromise between model complexity and available input data. For this purpose, first by considering observed events, HEC-HMS model was optimized and calibrated (Coonrad. J and Bui.C, 2011; Boucher. M, 2011; Emerson., et al. 2003; Karmirmizad,2009; Kathol, et al.2003; Khalighi,2004; Mirmehdi 2009; Sorinezahad, 2001; USACE, 2000; Zinatishoaa, 2007; Arekhi., et al. 2011, Abbassi, 2009; Alizadeh,2001; Kim.,et al, 2001; Radmanesh., et al, 2006). Then, for evaluating the effects of check dams on time of concentration, it was calculated
ABSTRACTAssessment of watershed
management operation is one of the main subjects for future planning of practical projects and natural resources management. Flood Damage is one of the most important problems in countries same Iran, which is mostly, affected most parts of the country and caused hazards. Therefore, identification of the area with high potential risk of flood occurrence is the main purpose in order to the flood control and reducing its damages. Due to the lack of any tool for assessment of watershed processes in many cases, distributed hydrological models can be useful. The indicator watershed of Kushk-Abad Basin as the study area in Khorasan province of Iran divided to 6 sub-basins which was processed geometrically using GIS and HEC-HMS extension. With using HEC-HMS model and emission of individual repetition of the sub-basins, the homogenous flood hydrographs have gained in relation to the recorded precipitation calculated for different sub-basins. For this purpose, first by considering observed events, HEC-HMS model was optimized and calibrated. Then, for evaluating the effects of check dams on time of concentration, it was optimized and calibrated. Then, for evaluating the effects of check dams on time of
concentration, it was calculated before and after of check dam’s construction by use of field observations and vegetation cover improvement was also estimated after the project. These parameters were imported to HEC-HMS to find out the effects of watershed practices and then flooding condition was simulated. For assessment purposes, peak discharche and flood volume were calculated for before and after construction conditions. Results showed that check dams as mechanical measures had low effect on time of concentration while biological practices lead to decease in curve number with an average value of 4.5. This result in decrease of peak flow and flood volume meanly 19% and 14%, respectively.
Key WordsHEC-HMS Model- SCS method,
GIS, Rainfall-Runoff, Kushk-Abad Basin, Iran.
Correspondence to:
Bahram Mohammadi GolrangDepartment of Forestry Management
University Putra Malaysia (UPM)43400 Malaysia.
E-mail: [email protected]
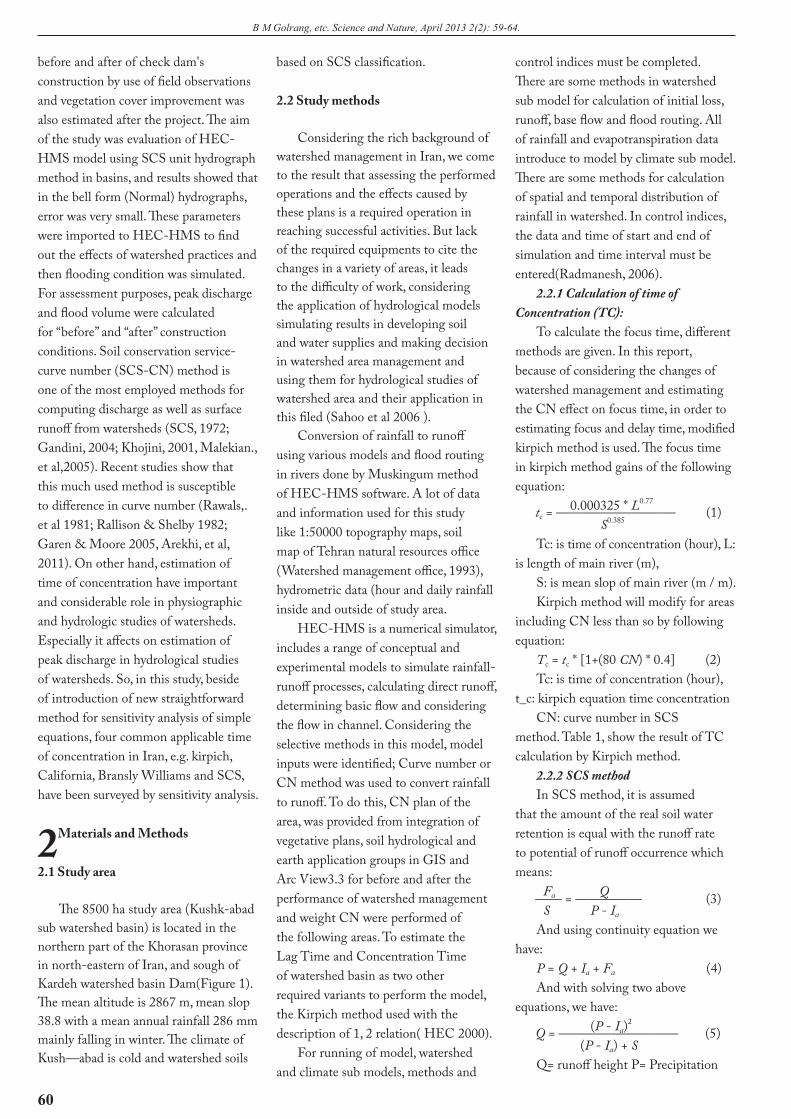
control indices must be completed. There are some methods in watershed sub model for calculation of initial loss, runoff, base flow and flood routing. All of rainfall and evapotranspiration data introduce to model by climate sub model. There are some methods for calculation of spatial and temporal distribution of rainfall in watershed. In control indices, the data and time of start and end of simulation and time interval must be entered(Radmanesh, 2006).
2.2.1 Calculation of time of Concentration (TC):
To calculate the focus time, different methods are given. In this report, because of considering the changes of watershed management and estimating the CN effect on focus time, in order to estimating focus and delay time, modified kirpich method is used. The focus time in kirpich method gains of the following equation:
0.000325 * L0.77 S0.385
Tc: is time of concentration (hour), L: is length of main river (m),
S: is mean slop of main river (m / m).Kirpich method will modify for areas
including CN less than so by following equation:
Tc = tc * [1+(80 CN) * 0.4] (2)Tc: is time of concentration (hour),
t_c: kirpich equation time concentrationCN: curve number in SCS
method. Table 1, show the result of TC calculation by Kirpich method.
2.2.2 SCS methodIn SCS method, it is assumed
that the amount of the real soil water retention is equal with the runoff rate to potential of runoff occurrence which means:
Fa Q S P - Ia
And using continuity equation we have:
P = Q + Ia + Fa (4)And with solving two above
equations, we have: (P - Ia)2
(P - Ia) + SQ= runoff height P= Precipitation
60
B M Golrang, etc. Science and Nature, April 2013 2(2): 59-64.
before and after of check dam's construction by use of field observations and vegetation cover improvement was also estimated after the project. The aim of the study was evaluation of HEC-HMS model using SCS unit hydrograph method in basins, and results showed that in the bell form (Normal) hydrographs, error was very small. These parameters were imported to HEC-HMS to find out the effects of watershed practices and then flooding condition was simulated. For assessment purposes, peak discharge and flood volume were calculated for “before” and “after” construction conditions. Soil conservation service-curve number (SCS-CN) method is one of the most employed methods for computing discharge as well as surface runoff from watersheds (SCS, 1972; Gandini, 2004; Khojini, 2001, Malekian., et al,2005). Recent studies show that this much used method is susceptible to difference in curve number (Rawals,.et al 1981; Rallison & Shelby 1982; Garen & Moore 2005, Arekhi, et al, 2011). On other hand, estimation of time of concentration have important and considerable role in physiographic and hydrologic studies of watersheds. Especially it affects on estimation of peak discharge in hydrological studies of watersheds. So, in this study, beside of introduction of new straightforward method for sensitivity analysis of simple equations, four common applicable time of concentration in Iran, e.g. kirpich, California, Bransly Williams and SCS, have been surveyed by sensitivity analysis.
2 Materials and Methods
2.1 Study area
The 8500 ha study area (Kushk-abad sub watershed basin) is located in the northern part of the Khorasan province in north-eastern of Iran, and sough of Kardeh watershed basin Dam(Figure 1). The mean altitude is 2867 m, mean slop 38.8 with a mean annual rainfall 286 mm mainly falling in winter. The climate of Kush—abad is cold and watershed soils
based on SCS classification.
2.2 Study methods
Considering the rich background of watershed management in Iran, we come to the result that assessing the performed operations and the effects caused by these plans is a required operation in reaching successful activities. But lack of the required equipments to cite the changes in a variety of areas, it leads to the difficulty of work, considering the application of hydrological models simulating results in developing soil and water supplies and making decision in watershed area management and using them for hydrological studies of watershed area and their application in this filed (Sahoo et al 2006 ).
Conversion of rainfall to runoff using various models and flood routing in rivers done by Muskingum method of HEC-HMS software. A lot of data and information used for this study like 1:50000 topography maps, soil map of Tehran natural resources office (Watershed management office, 1993), hydrometric data (hour and daily rainfall inside and outside of study area.
HEC-HMS is a numerical simulator, includes a range of conceptual and experimental models to simulate rainfall-runoff processes, calculating direct runoff, determining basic flow and considering the flow in channel. Considering the selective methods in this model, model inputs were identified; Curve number or CN method was used to convert rainfall to runoff. To do this, CN plan of the area, was provided from integration of vegetative plans, soil hydrological and earth application groups in GIS and Arc View3.3 for before and after the performance of watershed management and weight CN were performed of the following areas. To estimate the Lag Time and Concentration Time of watershed basin as two other required variants to perform the model, the Kirpich method used with the description of 1, 2 relation( HEC 2000).
For running of model, watershed and climate sub models, methods and
tc = ————————— (1)
—— = ————— (3)
Q = ————————— (5)
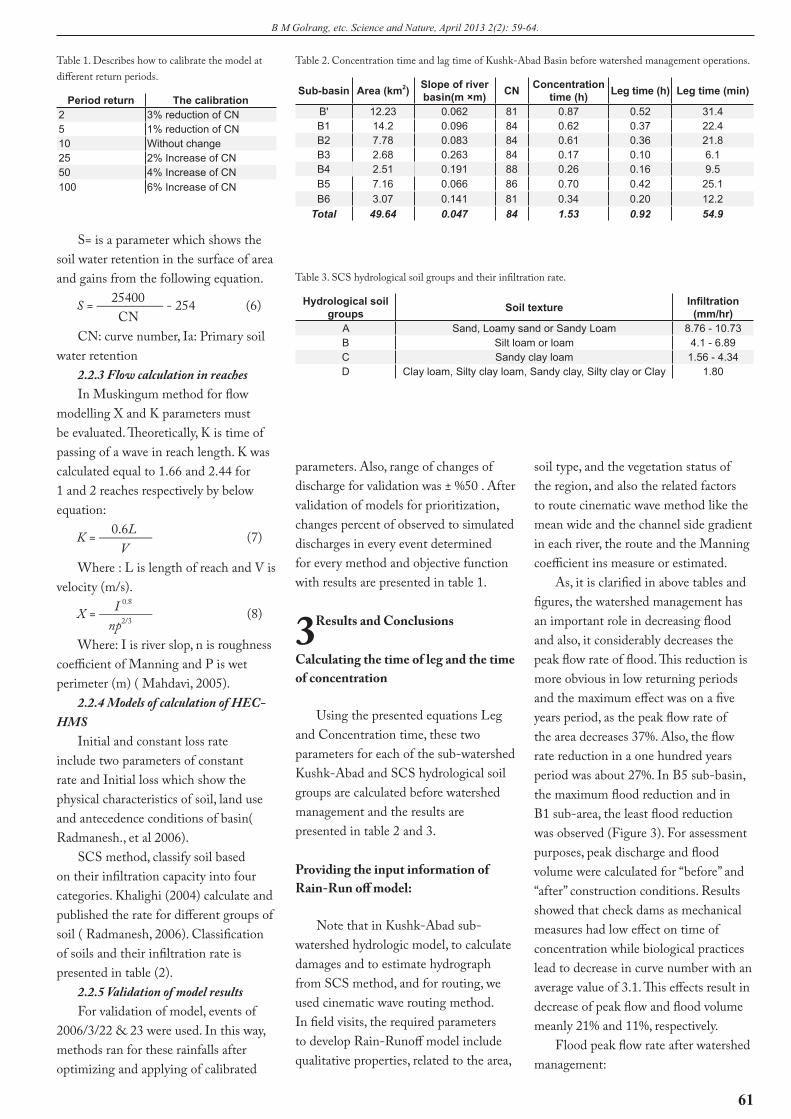
61
B M Golrang, etc. Science and Nature, April 2013 2(2): 59-64.
S= is a parameter which shows the soil water retention in the surface of area and gains from the following equation.
25400 CNCN: curve number, Ia: Primary soil
water retention2.2.3 Flow calculation in reachesIn Muskingum method for flow
modelling X and K parameters must be evaluated. Theoretically, K is time of passing of a wave in reach length. K was calculated equal to 1.66 and 2.44 for 1 and 2 reaches respectively by below equation:
0.6L VWhere : L is length of reach and V is
velocity (m/s). I 0.8
np2/3
Where: I is river slop, n is roughness coefficient of Manning and P is wet perimeter (m) ( Mahdavi, 2005).
2.2.4 Models of calculation of HEC-HMS
Initial and constant loss rate include two parameters of constant rate and Initial loss which show the physical characteristics of soil, land use and antecedence conditions of basin( Radmanesh., et al 2006).
SCS method, classify soil based on their infiltration capacity into four categories. Khalighi (2004) calculate and published the rate for different groups of soil ( Radmanesh, 2006). Classification of soils and their infiltration rate is presented in table (2).
2.2.5 Validation of model resultsFor validation of model, events of
2006/3/22 & 23 were used. In this way, methods ran for these rainfalls after optimizing and applying of calibrated
S = ————— - 254 (6)
K = ———— (7)
X = ———— (8)
parameters. Also, range of changes of discharge for validation was ± %50 . After validation of models for prioritization, changes percent of observed to simulated discharges in every event determined for every method and objective function with results are presented in table 1.
3 Results and Conclusions
Calculating the time of leg and the time of concentration
Using the presented equations Leg and Concentration time, these two parameters for each of the sub-watershed Kushk-Abad and SCS hydrological soil groups are calculated before watershed management and the results are presented in table 2 and 3.
Providing the input information of Rain-Run off model:
Note that in Kushk-Abad sub-watershed hydrologic model, to calculate damages and to estimate hydrograph from SCS method, and for routing, we used cinematic wave routing method. In field visits, the required parameters to develop Rain-Runoff model include qualitative properties, related to the area,
soil type, and the vegetation status of the region, and also the related factors to route cinematic wave method like the mean wide and the channel side gradient in each river, the route and the Manning coefficient ins measure or estimated.
As, it is clarified in above tables and figures, the watershed management has an important role in decreasing flood and also, it considerably decreases the peak flow rate of flood. This reduction is more obvious in low returning periods and the maximum effect was on a five years period, as the peak flow rate of the area decreases 37%. Also, the flow rate reduction in a one hundred years period was about 27%. In B5 sub-basin, the maximum flood reduction and in B1 sub-area, the least flood reduction was observed (Figure 3). For assessment purposes, peak discharge and flood volume were calculated for “before” and “after” construction conditions. Results showed that check dams as mechanical measures had low effect on time of concentration while biological practices lead to decrease in curve number with an average value of 3.1. This effects result in decrease of peak flow and flood volume meanly 21% and 11%, respectively.
Flood peak flow rate after watershed management:
Table 1. Describes how to calibrate the model at different return periods.
Period return The calibration2 3% reduction of CN5 1% reduction of CN10 Without change25 2% Increase of CN50 4% Increase of CN100 6% Increase of CN
Table 2. Concentration time and lag time of Kushk-Abad Basin before watershed management operations.
Sub-basin Area (km2) Slope of river basin(m ×m) CN Concentration
time (h) Leg time (h) Leg time (min)
B' 12.23 0.062 81 0.87 0.52 31.4B1 14.2 0.096 84 0.62 0.37 22.4B2 7.78 0.083 84 0.61 0.36 21.8B3 2.68 0.263 84 0.17 0.10 6.1B4 2.51 0.191 88 0.26 0.16 9.5B5 7.16 0.066 86 0.70 0.42 25.1B6 3.07 0.141 81 0.34 0.20 12.2
Total 49.64 0.047 84 1.53 0.92 54.9
Table 3. SCS hydrological soil groups and their infiltration rate.
Hydrological soil groups Soil texture Infiltration
(mm/hr)A Sand, Loamy sand or Sandy Loam 8.76 - 10.73B Silt loam or loam 4.1 - 6.89C Sandy clay loam 1.56 - 4.34D Clay loam, Silty clay loam, Sandy clay, Silty clay or Clay 1.80
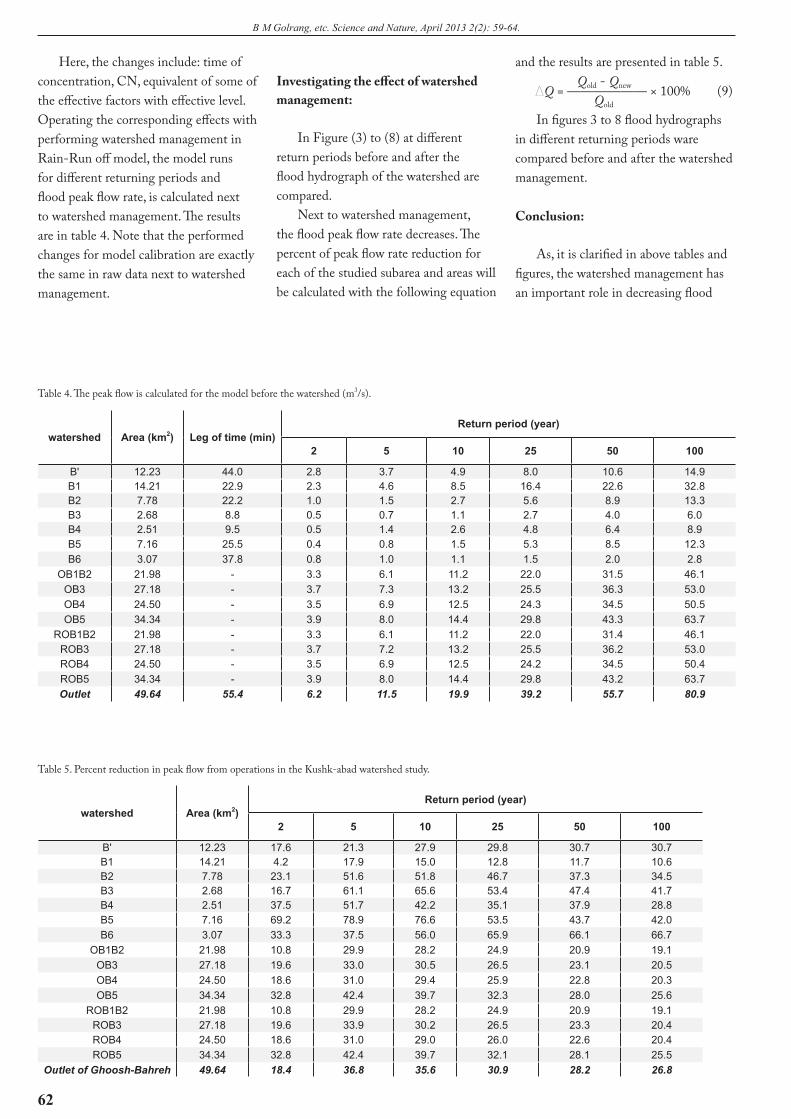
62
B M Golrang, etc. Science and Nature, April 2013 2(2): 59-64.
Here, the changes include: time of concentration, CN, equivalent of some of the effective factors with effective level. Operating the corresponding effects with performing watershed management in Rain-Run off model, the model runs for different returning periods and flood peak flow rate, is calculated next to watershed management. The results are in table 4. Note that the performed changes for model calibration are exactly the same in raw data next to watershed management.
Table 4. The peak flow is calculated for the model before the watershed (m3/s).
watershed Area (km2) Leg of time (min)Return period (year)
2 5 10 25 50 100
B' 12.23 44.0 2.8 3.7 4.9 8.0 10.6 14.9B1 14.21 22.9 2.3 4.6 8.5 16.4 22.6 32.8B2 7.78 22.2 1.0 1.5 2.7 5.6 8.9 13.3B3 2.68 8.8 0.5 0.7 1.1 2.7 4.0 6.0B4 2.51 9.5 0.5 1.4 2.6 4.8 6.4 8.9B5 7.16 25.5 0.4 0.8 1.5 5.3 8.5 12.3B6 3.07 37.8 0.8 1.0 1.1 1.5 2.0 2.8
OB1B2 21.98 - 3.3 6.1 11.2 22.0 31.5 46.1OB3 27.18 - 3.7 7.3 13.2 25.5 36.3 53.0OB4 24.50 - 3.5 6.9 12.5 24.3 34.5 50.5OB5 34.34 - 3.9 8.0 14.4 29.8 43.3 63.7
ROB1B2 21.98 - 3.3 6.1 11.2 22.0 31.4 46.1ROB3 27.18 - 3.7 7.2 13.2 25.5 36.2 53.0ROB4 24.50 - 3.5 6.9 12.5 24.2 34.5 50.4ROB5 34.34 - 3.9 8.0 14.4 29.8 43.2 63.7Outlet 49.64 55.4 6.2 11.5 19.9 39.2 55.7 80.9
Investigating the effect of watershed management:
In Figure (3) to (8) at different return periods before and after the flood hydrograph of the watershed are compared.
Next to watershed management, the flood peak flow rate decreases. The percent of peak flow rate reduction for each of the studied subarea and areas will be calculated with the following equation
Table 5. Percent reduction in peak flow from operations in the Kushk-abad watershed study.
watershed Area (km2)Return period (year)
2 5 10 25 50 100
B' 12.23 17.6 21.3 27.9 29.8 30.7 30.7B1 14.21 4.2 17.9 15.0 12.8 11.7 10.6B2 7.78 23.1 51.6 51.8 46.7 37.3 34.5B3 2.68 16.7 61.1 65.6 53.4 47.4 41.7B4 2.51 37.5 51.7 42.2 35.1 37.9 28.8B5 7.16 69.2 78.9 76.6 53.5 43.7 42.0B6 3.07 33.3 37.5 56.0 65.9 66.1 66.7
OB1B2 21.98 10.8 29.9 28.2 24.9 20.9 19.1OB3 27.18 19.6 33.0 30.5 26.5 23.1 20.5OB4 24.50 18.6 31.0 29.4 25.9 22.8 20.3OB5 34.34 32.8 42.4 39.7 32.3 28.0 25.6
ROB1B2 21.98 10.8 29.9 28.2 24.9 20.9 19.1ROB3 27.18 19.6 33.9 30.2 26.5 23.3 20.4ROB4 24.50 18.6 31.0 29.0 26.0 22.6 20.4ROB5 34.34 32.8 42.4 39.7 32.1 28.1 25.5
Outlet of Ghoosh-Bahreh 49.64 18.4 36.8 35.6 30.9 28.2 26.8
DQ = —————— × 100% (9)
and the results are presented in table 5. Qold - Qnew
Qold
In figures 3 to 8 flood hydrographs in different returning periods ware compared before and after the watershed management.
Conclusion:
As, it is clarified in above tables and figures, the watershed management has an important role in decreasing flood
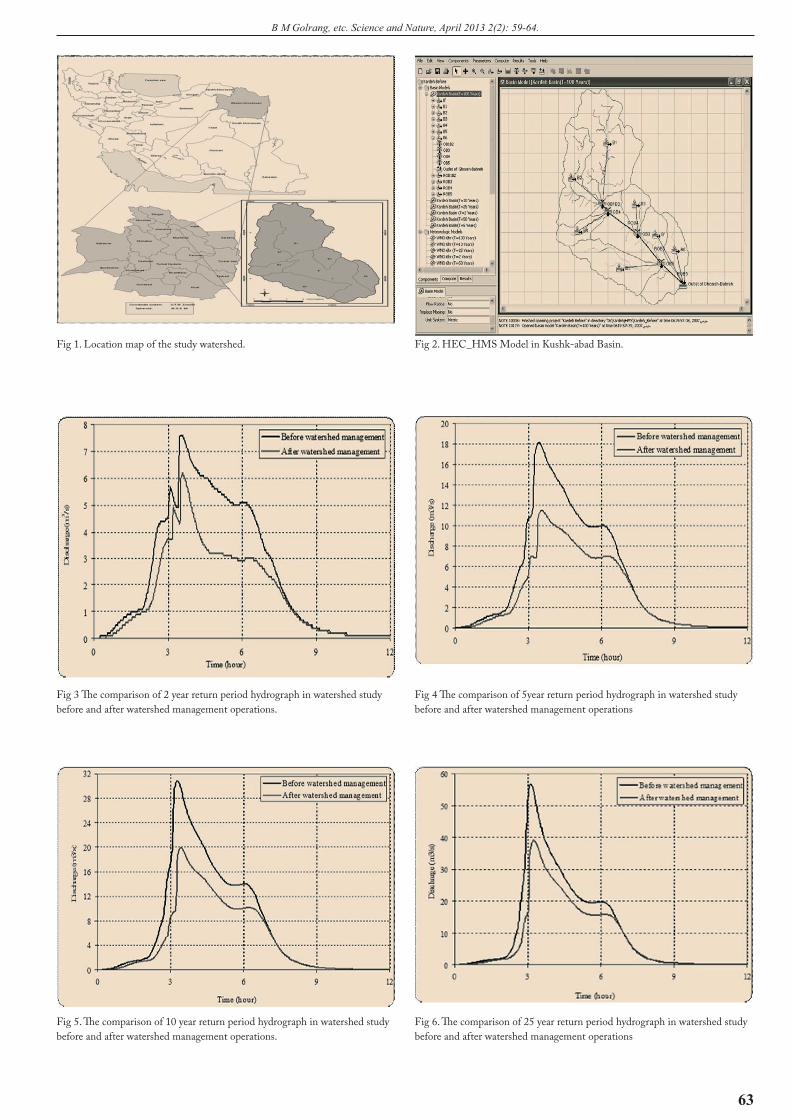
63
B M Golrang, etc. Science and Nature, April 2013 2(2): 59-64.
Fig 1. Location map of the study watershed. Fig 2. HEC_HMS Model in Kushk-abad Basin.
Fig 3 The comparison of 2 year return period hydrograph in watershed study before and after watershed management operations.
Fig 4 The comparison of 5year return period hydrograph in watershed study before and after watershed management operations
Fig 5. The comparison of 10 year return period hydrograph in watershed study before and after watershed management operations.
Fig 6. The comparison of 25 year return period hydrograph in watershed study before and after watershed management operations
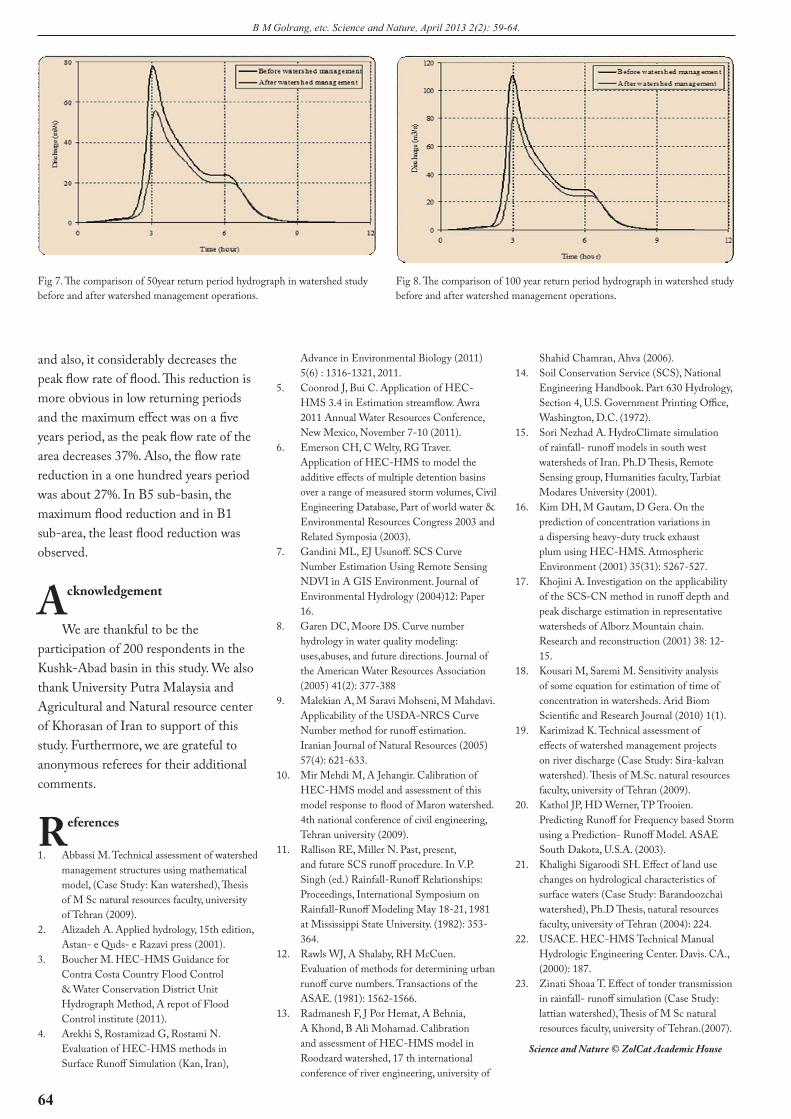
64
B M Golrang, etc. Science and Nature, April 2013 2(2): 59-64.
and also, it considerably decreases the peak flow rate of flood. This reduction is more obvious in low returning periods and the maximum effect was on a five years period, as the peak flow rate of the area decreases 37%. Also, the flow rate reduction in a one hundred years period was about 27%. In B5 sub-basin, the maximum flood reduction and in B1 sub-area, the least flood reduction was observed.
Acknowledgement
We are thankful to be the participation of 200 respondents in the Kushk-Abad basin in this study. We also thank University Putra Malaysia and Agricultural and Natural resource center of Khorasan of Iran to support of this study. Furthermore, we are grateful to anonymous referees for their additional comments.
References
1. Abbassi M. Technical assessment of watershed management structures using mathematical model, (Case Study: Kan watershed), Thesis of M Sc natural resources faculty, university of Tehran (2009).
2. Alizadeh A. Applied hydrology, 15th edition, Astan- e Quds- e Razavi press (2001).
3. Boucher M. HEC-HMS Guidance for Contra Costa Country Flood Control & Water Conservation District Unit Hydrograph Method, A repot of Flood Control institute (2011).
4. Arekhi S, Rostamizad G, Rostami N. Evaluation of HEC-HMS methods in Surface Runoff Simulation (Kan, Iran),
Advance in Environmental Biology (2011) 5(6) : 1316-1321, 2011.
5. Coonrod J, Bui C. Application of HEC-HMS 3.4 in Estimation streamflow. Awra 2011 Annual Water Resources Conference, New Mexico, November 7-10 (2011).
6. Emerson CH, C Welty, RG Traver. Application of HEC-HMS to model the additive effects of multiple detention basins over a range of measured storm volumes, Civil Engineering Database, Part of world water & Environmental Resources Congress 2003 and Related Symposia (2003).
7. Gandini ML, EJ Usunoff. SCS Curve Number Estimation Using Remote Sensing NDVI in A GIS Environment. Journal of Environmental Hydrology (2004)12: Paper 16.
8. Garen DC, Moore DS. Curve number hydrology in water quality modeling: uses,abuses, and future directions. Journal of the American Water Resources Association (2005) 41(2): 377-388
9. Malekian A, M Saravi Mohseni, M Mahdavi. Applicability of the USDA-NRCS Curve Number method for runoff estimation. Iranian Journal of Natural Resources (2005) 57(4): 621-633.
10. Mir Mehdi M, A Jehangir. Calibration of HEC-HMS model and assessment of this model response to flood of Maron watershed. 4th national conference of civil engineering, Tehran university (2009).
11. Rallison RE, Miller N. Past, present, and future SCS runoff procedure. In V.P. Singh (ed.) Rainfall-Runoff Relationships: Proceedings, International Symposium on Rainfall-Runoff Modeling May 18-21, 1981 at Mississippi State University. (1982): 353-364.
12. Rawls WJ, A Shalaby, RH McCuen. Evaluation of methods for determining urban runoff curve numbers. Transactions of the ASAE. (1981): 1562-1566.
13. Radmanesh F, J Por Hemat, A Behnia, A Khond, B Ali Mohamad. Calibration and assessment of HEC-HMS model in Roodzard watershed, 17 th international conference of river engineering, university of
Shahid Chamran, Ahva (2006).14. Soil Conservation Service (SCS), National
Engineering Handbook. Part 630 Hydrology, Section 4, U.S. Government Printing Office, Washington, D.C. (1972).
15. Sori Nezhad A. HydroClimate simulation of rainfall- runoff models in south west watersheds of Iran. Ph.D Thesis, Remote Sensing group, Humanities faculty, Tarbiat Modares University (2001).
16. Kim DH, M Gautam, D Gera. On the prediction of concentration variations in a dispersing heavy-duty truck exhaust plum using HEC-HMS. Atmospheric Environment (2001) 35(31): 5267-527.
17. Khojini A. Investigation on the applicability of the SCS-CN method in runoff depth and peak discharge estimation in representative watersheds of Alborz Mountain chain. Research and reconstruction (2001) 38: 12-15.
18. Kousari M, Saremi M. Sensitivity analysis of some equation for estimation of time of concentration in watersheds. Arid Biom Scientific and Research Journal (2010) 1(1).
19. Karimizad K. Technical assessment of effects of watershed management projects on river discharge (Case Study: Sira-kalvan watershed). Thesis of M.Sc. natural resources faculty, university of Tehran (2009).
20. Kathol JP, HD Werner, TP Trooien. Predicting Runoff for Frequency based Storm using a Prediction- Runoff Model. ASAE South Dakota, U.S.A. (2003).
21. Khalighi Sigaroodi SH. Effect of land use changes on hydrological characteristics of surface waters (Case Study: Barandoozchai watershed), Ph.D Thesis, natural resources faculty, university of Tehran (2004): 224.
22. USACE. HEC-HMS Technical Manual Hydrologic Engineering Center. Davis. CA., (2000): 187.
23. Zinati Shoaa T. Effect of tonder transmission in rainfall- runoff simulation (Case Study: lattian watershed), Thesis of M Sc natural resources faculty, university of Tehran.(2007).
Science and Nature © ZolCat Academic House
Fig 7. The comparison of 50year return period hydrograph in watershed study before and after watershed management operations.
Fig 8. The comparison of 100 year return period hydrograph in watershed study before and after watershed management operations.
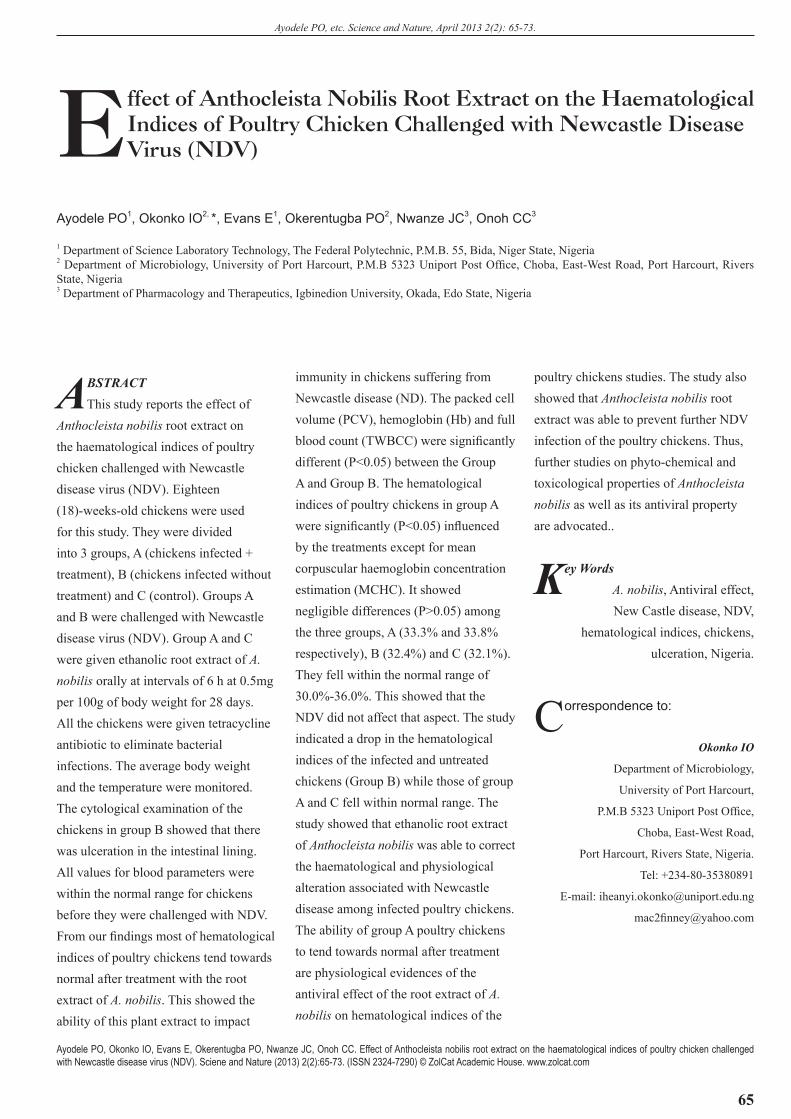
65
Ayodele PO, etc. Science and Nature, April 2013 2(2): 65-73.
Effect of Anthocleista Nobilis Root Extract on the Haematological Indices of Poultry Chicken Challenged with Newcastle Disease Virus (NDV)
Ayodele PO1, Okonko IO2, *, Evans E1, Okerentugba PO2, Nwanze JC3, Onoh CC3
1 Department of Science Laboratory Technology, The Federal Polytechnic, P.M.B. 55, Bida, Niger State, Nigeria2 Department of Microbiology, University of Port Harcourt, P.M.B 5323 Uniport Post Office, Choba, East-West Road, Port Harcourt, Rivers State, Nigeria3 Department of Pharmacology and Therapeutics, Igbinedion University, Okada, Edo State, Nigeria
Ayodele PO, Okonko IO, Evans E, Okerentugba PO, Nwanze JC, Onoh CC. Effect of Anthocleista nobilis root extract on the haematological indices of poultry chicken challenged with Newcastle disease virus (NDV). Sciene and Nature (2013) 2(2):65-73. (ISSN 2324-7290) © ZolCat Academic House. www.zolcat.com
ABSTRACTThis study reports the effect of
Anthocleista nobilis root extract on the haematological indices of poultry chicken challenged with Newcastle disease virus (NDV). Eighteen (18)-weeks-old chickens were used for this study. They were divided into 3 groups, A (chickens infected + treatment), B (chickens infected without treatment) and C (control). Groups A and B were challenged with Newcastle disease virus (NDV). Group A and C were given ethanolic root extract of A. nobilis orally at intervals of 6 h at 0.5mg per 100g of body weight for 28 days. All the chickens were given tetracycline antibiotic to eliminate bacterial infections. The average body weight and the temperature were monitored. The cytological examination of the chickens in group B showed that there was ulceration in the intestinal lining. All values for blood parameters were within the normal range for chickens before they were challenged with NDV. From our findings most of hematological indices of poultry chickens tend towards normal after treatment with the root extract of A. nobilis. This showed the ability of this plant extract to impact
immunity in chickens suffering from Newcastle disease (ND). The packed cell volume (PCV), hemoglobin (Hb) and full blood count (TWBCC) were significantly different (P<0.05) between the Group A and Group B. The hematological indices of poultry chickens in group A were significantly (P<0.05) influenced by the treatments except for mean corpuscular haemoglobin concentration estimation (MCHC). It showed negligible differences (P>0.05) among the three groups, A (33.3% and 33.8% respectively), B (32.4%) and C (32.1%). They fell within the normal range of 30.0%-36.0%. This showed that the NDV did not affect that aspect. The study indicated a drop in the hematological indices of the infected and untreated chickens (Group B) while those of group A and C fell within normal range. The study showed that ethanolic root extract of Anthocleista nobilis was able to correct the haematological and physiological alteration associated with Newcastle disease among infected poultry chickens. The ability of group A poultry chickens to tend towards normal after treatment are physiological evidences of the antiviral effect of the root extract of A. nobilis on hematological indices of the
poultry chickens studies. The study also showed that Anthocleista nobilis root extract was able to prevent further NDV infection of the poultry chickens. Thus, further studies on phyto-chemical and toxicological properties of Anthocleista nobilis as well as its antiviral property are advocated..
Key WordsA. nobilis, Antiviral effect, New Castle disease, NDV,
hematological indices, chickens, ulceration, Nigeria.
Correspondence to:
Okonko IO
Department of Microbiology,
University of Port Harcourt,
P.M.B 5323 Uniport Post Office,
Choba, East-West Road,
Port Harcourt, Rivers State, Nigeria.
Tel: +234-80-35380891
E-mail: [email protected]
66
Ayodele PO, etc. Science and Nature, April 2013 2(2): 65-73.
1 Introduction
Rural poultry are the dominant form of poultry kept in the developing world. They are a natural resource whose potential is not fully exploited for the welfare of rural populations (Awan et al., 1994). Some research has been carried out during the past few years and it now appears that rural poultry are receiving increasing support for research and development from many government and international funding agencies throughout the world (Awan et al., 1994). Diseases seriously affect family poultry and constitute one of its major threats (Ndahi et al., 2011). The most devastating disease of rural poultry is New Castle disease (NCD). Newcastle disease is a major constraint to poultry production in Africa, in both commercial and village rearing systems (Nwanta et al., 2008). Moreki et al. (2010) ascribed losses in family poultry to diseases, diseases and parasites, predation, a combination of diseases, parasites and predation. In order of prevalence, the common diseases of poultry are coccidiosis, infectious coryza, fowl pox, infectious bursal disease (IBD) and Newcastle disease (Moreki et al., 2011; Moreki, 2012). NCD is the most widespread infectious disease in Africa (Moreki, 2012). Similarly, Moreki (2010) identified NCD to be a major constraint in family poultry, causing up to 100% mortality in unprotected flocks.
Newcastle Disease is a viral disease if birds caused by a filterable virus Newcastle Disease Virus (NDV) which belongs to the family Paramyxoviridae (Okwor and Eze, 2010). ND is considered among the most important disease of poultry and outbreaks with mortality up to 100% are common (Saidu and Abdu, 2008). Paramyxovirus 1 (PMV-1) or Newcastle Disease (ND) is a highly contagious zoonotic viral disease affecting poultry of all ages (McMullin, 2004)
Although the first outbreaks recognized as Newcastle disease occurred in Indonesia in 1926, it has been suggested that a large outbreak in Scotland in 1896 was due to Newcastle Disease Virus (NDV) (Sadiq et al.,
2011). The first documented outbreak of Newcastle disease in Nigeria occurred between December, 1952 and February 1953 in and around Ibadan (Okwor and Eze, 2010). The disease has since this time remained a notable problem in the country (Oladele et al., 2002) and has become endemic in Nigeria in both, local and commercial poultry with annual epidemics recorded in highly susceptible flocks with pockets of outbreaks occurring in between the annual epidemic periods (Saidu and Abdu, 2008; Okwor and Eze, 2010).
Outbreaks of Newcastle disease in Nigeria were reported to be more likely in farms that kept exotic birds together with local chickens and other poultry species like ducks and turkeys (Abdu et al., 2005a). The outbreaks of Newcastle disease were more common in layers than in broilers (Abdu et al., 2005a). Newcastle Disease (ND) is the most important disease and it causes very high mortality (Sonaiya, 2009). The disease was also reported to be more common during the dry harmattan (November-March) (Abdu et al., 2005b; Sonaiya, 2009; Sadiq et al., 2011). ND in Nigeria has age and species differences (Abdu et al., 2005b). In rural Nigeria, it is common to find a combination of different poultry species and breeds being kept in the same compound, including chickens, turkeys, Muscovy ducks and pigeons. At present, it is customary to find ostriches, peacocks, geese and mallard ducks in the same compound in cities and in some poultry farms (Adene and Oguntade, 2006; Friend, 2006; Sadiq et al., 2011).
New Castle Disease (NCD) is the most important disease that affects these chickens resulting in very high morbidity, mortality and case fatality rates. Based on this study which indicates that this disease usually starts at the onset of the cold dry season that is around November, NCD vaccine (Lasota) could be administered just before the onset of this period and during the period in order to curtail this disease. Also, fowl pox vaccination could be carried out to prevent further occurrence of the disease. Antihelminthics could be given before the onset of raining season and during
raining season to guard against syngamus trachea infection which is said to occur from the month of June to October.
All strains of Newcastle disease virus (NDV) occur in rural poultry, but velogenic strains are reported to be more common. Serological surveys in conjunction with isolation studies have shown that velogenic NDV strains are endemic in rural poultry populations even in isolated villages and possibly in isolated flocks (Awan et al., 1994). Although NDV is endemic in village poultry, the clinical disease usually follows an epidemic pattern. ND outbreaks often occur once or twice a year at regular intervals affirming the endemicity of the virus, however, 'mini' outbreaks in individual flocks and sporadic cases in individual birds may occur. Epidemics usually occur at times of climatic stress, leading to seasonal occurrence (Awan et al., 1994). The spread of NDV within and between village poultry populations is relatively slow due to a low contact rate (Awan et al., 1994). The major mode of transmission appears to be by the faecal-oral route. The respiratory route may also play a role in flocks where close bird-to-bird associations exist. Other poultry species, wild and feral birds, wild animals, communal water reservoirs and domestic animals may play a role in transmission; however, their role has not been properly investigated (Awan et al., 1994).N
There is currently a large and ever-expanding global population base that prefers the use of natural products in treating and preventing medical problems. This has influenced many pharmaceutical companies to produce new antimicrobial formulations extracted from plants or herbs. At present, plant and herb resources are unlimited, have provided mankind remedies for many infectious diseases and continue to play a major role in primary health care as therapeutic remedies in developing countries. The search for biological active extracts based traditionally used plants is still relevant due to induction of resistance of pathogens to chemical drugs and the prevalence of the fatal different infections. Medicinal plants are used in pharmaceuticals, neutraceuticals,
Ayodele PO, etc. Science and Nature, April 2013 2(2): 65-73.
67
cosmetics, and food supplements and even as traditional source of medicines because of their antitumer, antiarthritic and antithrombotic functions (Sajjad et al, 2011). The consumption and demand for medicinal plants have been adopted in many countries because of low cost, easy availability, affordability for a common farmer, good antimicrobial natured, reduced diseases associated risks, lowering blood cholesterol level and diversified functions in improving performance, growth rate, feed conversion rate and weight gain in birds (Sajjad et al, 2011).
The use of ethnoveterinary medicine in the management of animal healthcare is as old as the domestication of various livestock species (Ndahi et al., 2011). Compared to Western modern medicine, EVM is widely utilized by the family poultry rearers across the country (Ndahi et al., 2011). Anthocleista nobilis which is commonly called the candelabrum or cabbage tree in English language, Duwa Kuchi in Nupe language, Kwari in Hausa language and Apa Ora in Yoruba language belongs to the family Loganiaceae. The plant is used with boiled root of Combretum smeathmanni (combretaceae) pepper and ash taken as a drink for chest pain, the liquid resulting from boiling dry falling leaves is drunk is Sierra Leone to treat Jaundice, the leaf sap is reputed to be haemostatic. The bark is used in Nigeria for its antipyretic, tonic purgative properties. In Congo, its pulped back is applied as antiseptic and Cistercian on sores, swollen buboes and abscesses and to treat yaws (Lewington, 1990). The root is the most active pharmacologically and is the most used as a purgative and dietary, a poison antidote, an emmenagogne, abortifacient to treat leprosy, edemas and elephantiasis of the scrotum. A root decoction is taken in Serra Leone for constipation and gonorrhea. In Congo the root decoction is given to women as a purgative to cleanse the abdomen and to ensure that the urinogenital parts return to its proper place (Burkill, 1995).
Furthermore, scientists and researchers are trying to combat against fatal diseases in poultry through the use
of medicinal plants, containing the most active ingredients to promote growth, weight gain, and immunostimulant (Sajjad et al, 2011). Aloe spp. and N. tabacum were also used against internal parasites while wood ashes, especially those from Peltophorum africanum and Combretum imberbe were used against external parasites (Ndahi et al., 2011). Because of its unpleasant and strong smell, Thamnosma rhodesica leaves were placed in chicken shelters in order to repel external parasites (Ndahi et al., 2011).
In Nigeria, Musa et al. (2008) noted that these remedies that are used by rural farmers may or may not have direct effect on NCD virus but could affect protozoan and helminths parasites of rural poultry by reducing the parasites burden, and boosting the immunity of birds against infection. Deeba (2009) in Pakistan reported the use of Nicotiana tabacum in treatment of NCD. Mwale et al. (2005) reported that A.vera and Aloe spicata were the predominantly used plant species for chicken health management in Zimbabwe. In agreement with Moreki et al. (2010), Mwale et al. (2005) mentioned that A.vera acts like a broadspectrum antibiotic remedy. Moreeng (2008) reported that feeding chickens a concoction of Moringa (Moringa oleifera) tree leaves is an effective deworming practice. The study of Ogbe and Affiku (2011) in Nigeria showed that M. oleifera leaves contained appreciable amounts of carbohydrate, protein and minerals, which are nutritional requirements for poultry. The authors also mentioned that M. oleifera could be useful as feed supplement and as medicine in poultry to improve health and growth performance (Moreki, 2012).
Masimba et al. (2011) pointed out that ethnoveterinary knowledge was mostly in the custody of older men and women who passed it orally to younger gerenations by word of mouth. According to Sri Balaji and Vikrama Chakravarthi (2010), ethnoveterinary practices concern to animal health care is as old as the domestication of various livestock species. They comprise beliefs, knowledge, practices and skills pertaining
to health care and management of livestock (Ndahi et al., 2011).
In Kenya, Lagu and Kayanja(2010) reported that traditional healers play limited roles in treating local chickens as many farmers collect, concoct and administer the local herbs themselves. Many of the plants used to prepare indigenous medicine contain valuable active ingredients (Ndahi et al., 2011). Previous study by Moreki et al. (2010) showed that 86.7% of family poultry rearers used EVM, whereas the remainder used modern medicines (vaccines and drugs). The most common forms of EVM preparations are powders, poultice, ointment, decoction, infusion, cold ware extract, tincture and fumigation (Toyang et al., 2007; Sri Balaji and Vikrama Chakravarthi, 2010; Ndahi et al., 2011).
In contrast to vaccines, therapeutic remedies are village traditions. Rural poultry producers use many local natural products to treat or prevent diseases in their livestock. Their chickens also receive treatment. Workers with village chickens have become interested in ethnoveterinary medicine and lists of traditional remedies are becoming available. This study was carried out to ascertain in greater details the relationship between the active ingredient in the ethanol root extracts of Anthocleista nobilis and the haematological evidence that can be obtained during the treatment of poultry chickens against Newcastle disease virus. The haematological indices were examined before, during and after the administration of the A. nobilis root extracts.
2 Material And Methods / Experimental Details /
Methodology
2.1 Source of Newcastle disease virus (NDV)
The Newcastle disease virus used in this study was obtained from National Veterinary Research Institute (NVRI) Vom, Jos. The Newcastle disease virus was in a freeze dried form, prepared and stored in amples. It was kept in the
68
Ayodele PO, etc. Science and Nature, April 2013 2(2): 65-73.
refrigerator at 4oC to avoid deterioration of the viral pathogen which was a velogenic strain.
2.2 Collection and identification of plant
The plant material was collected from a neighboring village called Kusogi very close to the Federal Polytechnic, Bada, Niger State. The plant was identified based on the criteria stipulated by International Committee for Botanical Nomenclatures (ICBN), as Anthocleista nobilis.
2.3 Collection blood samples
At week 7 and 28 of the experiment, blood samples were collected randomly from two (2) poultry chickens per treatment for the determination of the haematological indices. Samples were collected from the wing (brachial) vein of the chickens by venipunture in commercial vacutainer® EDTA K2+ which served as an anticoagulant for haematology. The poultry chickens were fasted overnight (12hrs) and normally bled in the morning (7.00–8.00am) to avoid excessive bleeding.
2.4 Determination of the effectiveness of the Anthocleista nobilis root extract on haematological indices of poultry chickens challenged with Newcastle disease virus
Eighteen poultry chickens of 4 weeks old were gotten and were allowed to grow for another 4 weeks more, this was to enable the birds to develop their own Immunity, since the birds (chickens) were vaccinated immediately after hatch. The chickens were randomly distributed into 3 different groups namely A, B, and C and each group was kept in different apartments. Groups A, B and C contained 6 chickens each, group C serve as the control. The chickens in groups A and B were injected intraocularly route with 0.2ml (105.0-6.0 LD50) of the viral pathogen concentration under a biocontainment condition. Treatment commenced immediately
after challenging these poultry chickens with the viral pathogens. Group A was treated while group B was left without treatment. Only groups A and C were given the plant extract at a dose of 0.5mg orally per 100g body weight the treatment was done at interval of 6 hours. In order to eliminate bacterial and other infections, all the chickens were given an oxytetracycline treatment was administered at 4 weeks of age via the birds' water supply at a dose of 25 mg/lb for 5 days. The blood samples of the chickens were also collected to determine hematological indices which include using standard methods as described by other workers (Spencer and Price, 1997; Ajagbonna et al., 1999; Uko et al., 2000; Cheesbrough, 2006; Mohammed et al., 2008, 2011; AL-Eissa and Alkahtani, 2011). The hematological indices include the pack cell volume (PCV), %; hemoglobin (Hb), g/l; full blood count (TWBCC) cells/mm-3; and mean corpuscular haemoglobin concentration (MCHC), %.
2.5 Data Analysis
Data were analyzed using the general linear model procedure, ANOVA and independent t-test to compare the level of significant difference between the treated groups and the controls. Indicator of statistical significance is P ≤ 0.05.
3 Results Analysis
The study was conducted to investigate the effect of Anthocleista nobilis root extract on the haematological indices of poultry chickens challenged with Newcastle disease virus (NDV). The results of the haematological indices of the test chickens challenged with New Castle Disease are shown in Tables 1, 2 and 3. The haematological indices obtained before challenging the chickens with NDV indicated that all the chickens were healthy and no physiological abnormalities were traced in them. The packed cell volume; PCV (%), haemoglobin; Hb (g/l), mean corpuscular haemoglobin concentration (MCHC) (g/l) and total white blood
count concentration; TWBCC (g/l) of all the groups tends towards normal. It ranged from 0.35% – 0.43%, 120.0g/l – 140.0g/l, 302.3g/l – 357.1g/l and 4.0 x 103mm-3–4.6 x 103mm-3 respectively (Table 1). In the same vein, the mean PCV (%), Hb (g/l), MCHC (%) and TWBCC (g/l) ranged from 37.0– 42.0%, 127.5–130.0g/l, 32.6–34.5% and 4.15 x 10³– 4.4 x 103mm-3 respectively (Table 1) and these values are normal.
Means PCV level is also presented in Table 1. Group C receiving no NDV and ethanolic extract showed higher PCV (42.0%) level. This was closely followed by Group B (39.0%) receiving only NDV and no ethanolic extract of A. nobilis. While Group A (37.0%) receiving both NDV and ethanolic extract of A. nobilis. Means Hemoglobin estimation (Hb) level is presented in Table 1. Group C receiving no NDV and ethanolic extract and Group B receiving only NDV and no ethanolic extract of A. nobilis showed higher Hb level (13.00 g/l) as compared to Group A receiving both NDV and ethanolic extract of A. nobilis having Hb level of 127.5 g/l. There was no significant difference between the Hb level of the treatments and the control (130.0g/l vs. 135.0g/l, P>0.05). Means corpuscular haemoglobin concentration estimation (MCHC) level is also presented in Table 1. Group A receiving both NDV and ethanolic extract of A. nobilis showed higher (P>0.05) MCHC level (34.5%). This was followed by Group C receiving no NDV and ethanolic extract with MCHC level of 33.7% and Group B receiving only NDV and no ethanolic extract of A. nobilis showed lower (P>0.05) MCHC level (32.6%) as compared to other groups. There was no significant difference between the MCHC level of the treatments and the control (33.7g/l vs. 32.6g/l, P>0.05). Means total white blood count concentration (TWBCC) level is also presented in Table 1. Group B receiving only NDV and no ethanolic extract of A. nobilis showed higher MCHC level (4.4 x 10³ Cellsmm-3). This was followed by Group A receiving both NDV and ethanolic extract of A. nobilis and Group C receiving no NDV and

Ayodele PO, etc. Science and Nature, April 2013 2(2): 65-73.
69
Table 1. Haematological indices obtained before challenging the poultry chickens with NDV.
Group PCV (%) Mean PCV (%) Hb (g/l) Mean Hb (g/l) MCHC (%) Mean MCHC (%) TWBCC (Cellsmm-3) Mean TWBCC (Cellsmm-3)
A1 35.0 125.0 35.7 4.0 x 10³
A2 39.0 37.0b 130.0 127.5b 33.3 34.5b 4.3 x 10³ 4.2 x 10³b
B1 37.0 120.0 32.4 4.6 x 10³
B2 40.0 39.0b 140.0 130.0b 35.0 33.7b 4.2 x 10³ 4.4 x 10³b
C1 43.0 130.0 30.2 4.4 x 10³
C2 40.0 42.0b 140.0 135.0b 35.0 32.6b 4.0 x 10³ 4.2 x 10³b
Keys: PCV – Packed Cell Volume %; Hb – Hemoglobin g/l; MCHC – mean corpuscular haemoglobin concentration g/l; TWBCC – Full blood count (cellsmm-3); A = Chickens that were challenged and treated; B = Chickens that were challenged and without treatment; C = Chickens that were not challenged and were given treatment (control); b = Not Significant (P>0.05)
Table 2. Hematological indices results obtained 7 days after the administration of Newcastle disease virus and A. nobilis root extract.
Group PCV (%) Mean PCV (%) Hb (g/l) Mean Hb (g/l) MCHC (%) Mean MCHC (%) TWBCC (Cellsmm-3) Mean TWBCC (Cellsmm-3)
A1 31.0 100.0 32.3 7.2 x 10³
A2 32.0 32.0a 110.0 105.0a 34.4 33.3b 8.0 x 10³ 7.6 x 10³a
B1 16.0 54.0 31.3 8.8 x 10³
B2 14.0 15.0a 47.0 50.5a 33.6 32.4b 1.0 x 10⁴ 9.4 x 10³a
C1 43.0 130.0 31.7 4.2 x 10³
C2 41.0 42.0a 140.0 135.0a 32.6 32.2b 4.0 x 10³ 4.1 x 10³a
Keys: PCV–Packed Cell Volume %; Hb-Haemologolbin g/l; MCHC–mean corpuscular haemoglobin concentration %; TWBCC–Full blood count (cellsmm-3); A = Chickens that were challenged and treated; B = Chickens that were challenged and without treatment; C = Chickens that were not challenged and were given treatment (control); a = Significant (P<0.05); b = Not Significant (P>0.05)
ethanolic extract with mean TWBCC level of 4.2 x 10³ Cellsmm-3 as compared to Group B. However, this differences were not statistically different (4.4 x 10³ Cellsmm-3 vs. 4.2 x 10³ Cellsmm-3, P>0.05) in the haematological indices obtained before challenging the poultry chicken with NDV.
The hematological indices obtained following the challenging with NDV and no administration of the Anthocleista nobilis root extract (after 7 days of treatment) showed decrease in the PCV (%) and Hb (g/l) levels in the blood of chickens in group B. While those of groups A and C maintained the normal ranges. The mean TWBCC cell mm-3 values of groups A and B increased ranging from 4.2x10³ -7.6 x 103mm-3 and 4.4x10³ – 9.4x103mm-3 respectively. The MCHC (%) of all the groups showed negligible differences (Table 2). Means PCV level after challenging with NDV and after 7 days of administration or no administration of ethanolic root extract of A. nobilis is presented in Table 2. The mean PCV level of Group C
receiving no NDV and Anthocleista nobilis root extract remained the same after 7 days (42.0%). A slightly decrease in mean PCV level of the chickens in Group A from 37.0% (Table 1) to 32.0% (Table 2) was observed. However, there was drastic decrease (P<0.05) in mean PCV level from 39.0% (Table 1) to 15.0% (Table 2) among chickens in group B which received only NDV and no treatment with ethanolic extract of A. nobilis. There was significant differences in mean PCV level between treatments and control (32.0% vs. 15.0%; 32.0% vs. 42.0%; 42.0% vs. 15.0%, P<0.05).
Means Hemoglobin estimation (Hb) level is also presented in Table 2. Group C receiving no NDV and no treatment with the extract showed no increase or decrease (P>0.05) in Hb level (135.0g/l) as shown in Tables 1, 2, and 3. Group A receiving both NDV and ethanolic extract of A. nobilis showed a decrease in Hb level from 127.5g/l (Table 1) to 105.0g/l (Table 2). However, these differences were statistically different (105.0g/l vs. 50.5g/l; 135.0g/l vs. 105.0g/
l; 50.0g/l vs. 135g/l, P<0.05). When compared to Group B chickens which received only NDV and no treatment with the Anthocleista nobilis root extract, there was a drastic decrease (P<0.05) in Hb level from 130g/l (Table 1) to 50.5g/l (Table 2). Means corpuscular haemoglobin concentration estimation (MCHC) level of all the groups showed negligible differences (P>0.05).
Mean total white blood count concentration (TWBCC) level is also presented in Table 2. Group B receiving only NDV and no treatment with the extract showed higher (P<0.05) TWBCC level (9.4 x 10³ Cellsmm-3). This was followed by Group A receiving both NDV and treatment with the extract (7.6 x 10³ Cellsmm-3). The mean TWBCC level of Group C chickens receiving no NDV and no treatment showed negligible difference from day 1 (4.1 x 10³ Cellsmm-3). However, these differences in mean total white blood count concentration (TWBCC) level were statistically different (7.6x10³ Cellsmm-3 vs. 9.4x10³ Cellsmm-3; 7.6x10³
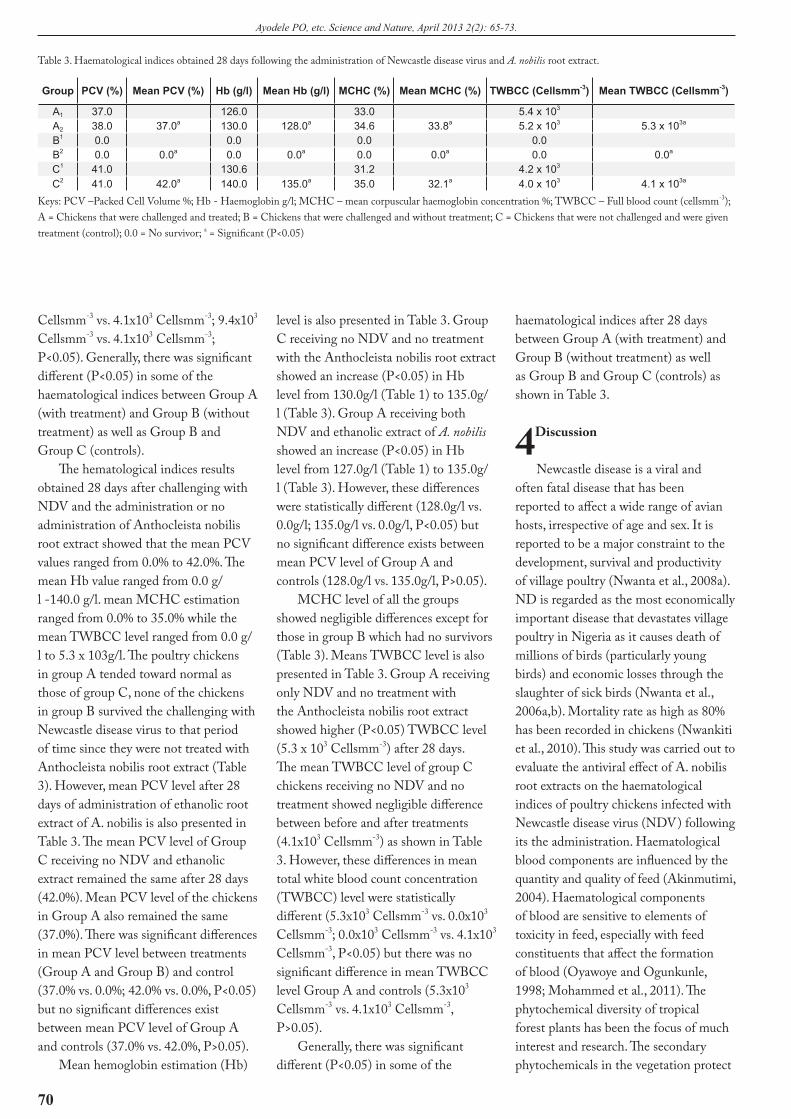
70
Ayodele PO, etc. Science and Nature, April 2013 2(2): 65-73.
Cellsmm-3 vs. 4.1x10³ Cellsmm-3; 9.4x10³
Cellsmm-3 vs. 4.1x10³ Cellsmm-3; P<0.05). Generally, there was significant different (P<0.05) in some of the haematological indices between Group A (with treatment) and Group B (without treatment) as well as Group B and Group C (controls).
The hematological indices results obtained 28 days after challenging with NDV and the administration or no administration of Anthocleista nobilis root extract showed that the mean PCV values ranged from 0.0% to 42.0%. The mean Hb value ranged from 0.0 g/l -140.0 g/l. mean MCHC estimation ranged from 0.0% to 35.0% while the mean TWBCC level ranged from 0.0 g/l to 5.3 x 10³g/l. The poultry chickens in group A tended toward normal as those of group C, none of the chickens in group B survived the challenging with Newcastle disease virus to that period of time since they were not treated with Anthocleista nobilis root extract (Table 3). However, mean PCV level after 28 days of administration of ethanolic root extract of A. nobilis is also presented in Table 3. The mean PCV level of Group C receiving no NDV and ethanolic extract remained the same after 28 days (42.0%). Mean PCV level of the chickens in Group A also remained the same (37.0%). There was significant differences in mean PCV level between treatments (Group A and Group B) and control (37.0% vs. 0.0%; 42.0% vs. 0.0%, P<0.05) but no significant differences exist between mean PCV level of Group A and controls (37.0% vs. 42.0%, P>0.05).
Mean hemoglobin estimation (Hb)
level is also presented in Table 3. Group C receiving no NDV and no treatment with the Anthocleista nobilis root extract showed an increase (P<0.05) in Hb level from 130.0g/l (Table 1) to 135.0g/l (Table 3). Group A receiving both NDV and ethanolic extract of A. nobilis showed an increase (P<0.05) in Hb level from 127.0g/l (Table 1) to 135.0g/l (Table 3). However, these differences were statistically different (128.0g/l vs. 0.0g/l; 135.0g/l vs. 0.0g/l, P<0.05) but no significant difference exists between mean PCV level of Group A and controls (128.0g/l vs. 135.0g/l, P>0.05).
MCHC level of all the groups showed negligible differences except for those in group B which had no survivors (Table 3). Means TWBCC level is also presented in Table 3. Group A receiving only NDV and no treatment with the Anthocleista nobilis root extract showed higher (P<0.05) TWBCC level (5.3 x 10³ Cellsmm-3) after 28 days. The mean TWBCC level of group C chickens receiving no NDV and no treatment showed negligible difference between before and after treatments (4.1x10³ Cellsmm-3) as shown in Table 3. However, these differences in mean total white blood count concentration (TWBCC) level were statistically different (5.3x10³ Cellsmm-3 vs. 0.0x10³ Cellsmm-3; 0.0x10³ Cellsmm-3 vs. 4.1x10³ Cellsmm-3, P<0.05) but there was no significant difference in mean TWBCC level Group A and controls (5.3x10³ Cellsmm-3 vs. 4.1x10³ Cellsmm-3, P>0.05).
Generally, there was significant different (P<0.05) in some of the
haematological indices after 28 days between Group A (with treatment) and Group B (without treatment) as well as Group B and Group C (controls) as shown in Table 3.
4 Discussion
Newcastle disease is a viral and often fatal disease that has been reported to affect a wide range of avian hosts, irrespective of age and sex. It is reported to be a major constraint to the development, survival and productivity of village poultry (Nwanta et al., 2008a). ND is regarded as the most economically important disease that devastates village poultry in Nigeria as it causes death of millions of birds (particularly young birds) and economic losses through the slaughter of sick birds (Nwanta et al., 2006a,b). Mortality rate as high as 80% has been recorded in chickens (Nwankiti et al., 2010). This study was carried out to evaluate the antiviral effect of A. nobilis root extracts on the haematological indices of poultry chickens infected with Newcastle disease virus (NDV) following its the administration. Haematological blood components are influenced by the quantity and quality of feed (Akinmutimi, 2004). Haematological components of blood are sensitive to elements of toxicity in feed, especially with feed constituents that affect the formation of blood (Oyawoye and Ogunkunle, 1998; Mohammed et al., 2011). The phytochemical diversity of tropical forest plants has been the focus of much interest and research. The secondary phytochemicals in the vegetation protect
Table 3. Haematological indices obtained 28 days following the administration of Newcastle disease virus and A. nobilis root extract.
Group PCV (%) Mean PCV (%) Hb (g/l) Mean Hb (g/l) MCHC (%) Mean MCHC (%) TWBCC (Cellsmm-3) Mean TWBCC (Cellsmm-3)
A1 37.0 126.0 33.0 5.4 x 10³
A2 38.0 37.0a 130.0 128.0a 34.6 33.8a 5.2 x 10³ 5.3 x 10³a
B1 0.0 0.0 0.0 0.0B2 0.0 0.0a 0.0 0.0a 0.0 0.0a 0.0 0.0a
C1 41.0 130.6 31.2 4.2 x 10³
C2 41.0 42.0a 140.0 135.0a 35.0 32.1a 4.0 x 10³ 4.1 x 10³a
Keys: PCV –Packed Cell Volume %; Hb - Haemoglobin g/l; MCHC – mean corpuscular haemoglobin concentration %; TWBCC – Full blood count (cellsmm-3); A = Chickens that were challenged and treated; B = Chickens that were challenged and without treatment; C = Chickens that were not challenged and were given treatment (control); 0.0 = No survivor; a = Significant (P<0.05)

Ayodele PO, etc. Science and Nature, April 2013 2(2): 65-73.
71
the plants against herbivores. The chemicals are often biologically active and may have antibiotic properties. For these reasons, many chemicals used in drug manufacture are or were originally derived from tropical forest plants, and it is likely that more will be discovered since much of the flora has not yet been researched. The people who inhabit these forests make extensive use of the phytochemicals in their traditional medicine, a factor which is gaining importance in forest management and rural development (Thomas et al., 1989).
Interest in the use of NDV as an anticancer agent has arisen from the ability of NDV to selectively kill human tumor cells with limited toxicity to normal cells (McMullin, 2004). No treatment for NDV exists, but the use of prophylactic vaccines and sanitary measures reduces the likelihood of outbreaks (McMullin, 2004). The cytological examination of the test chickens in group B showed that there was ulceration of the intestinal lining of the chickens. However, ulceration of the intestinal lining was not observed in those of groups A and C, and no visible damage was inflicted on the kidneys and livers of the chickens in all the groups. The occurrence of ulceration has been reported by Jordan et al. (1990) is an indicator of Newcastle disease that ulceration was not observed in the treated group A suggested that the root extract of Anthocleista nobilis is able to either prevent the multiplication of the virus or ameliorate the toxic effect leading to ulceration. Newcastle disease (ND) is reported as the most important viral disease of poultry in the world including developing countries. It has a devastating effect on commercial as well as village poultry industries (Nwanta et al., 2006). The resource derivable from the chickens cannot be fully utilized unless the disease is controlled particularly in the village poultry flocks that are believed to keep the virus in circulation and act as reservoirs and carriers to themselves and the more susceptible exotic breeds in commercial farms (Nwanta et al., 2006).
The hematological indices of the examination carried out showed a drop
in the mean packed cell volume of the chickens in group B (infected but not treated) from 39.0% at day 1 to 15.0% at day 7 and 0.0% at day 28. Those of group A (challenged with NDV and treated) though tended toward normal dropped from 39.0% before administration of the NDV and extract at day 1 to 31.0%, 7 days after treatment with the extract. This finding was similar with that of Sajjad et al. (2011), who reported significant decrease in PCV level of broilers chicks administered with medicinal plants infusion of aloe vera gel, barbery, garlic and ginger. Also, from those of group A (infected and treated) though tended toward normal dropped from increased 31.0% at day 7 after treatment to 37.0% at day 28 after treatment with the extract. This finding agrees with Esonu et al. (2006), who reported significant increase in PCV level, in layers fed herbal plant neem. In differential count, an abnormally higher monocytes level is synonymous with bacterial infection (Akinmutimi, 2004). Dairo (2005) and Mohammed et al. (2005, 2011) reported that the inclusion levels of camel blood-rumen content mixture did not affect PCV, RBC, and MCHC values of growing rabbits.
From the hematological indices of the examination carried out, it showed a drop in the mean haemoglobin levels from 130.0g/l at day 1 before the administration of NDV to 0.50g/l at day 7 and 0.0g/l at day 28 after the administration of the NDV to the chickens in group B. In the same vein, it also showed a drop (P<0.05) in the mean Hb levels from 127.5g/l at day 1 before the administration of NDV and the A. nobilis extract to the chickens in group A to 105.0g/l after 7 days of treatment. The findings of this study were similar with the findings of Sajjad et al. (2011), who reported that water based infusion of Aloe vera gel, Barbery, Garlic and Ginger had significant effect on hemoglobin concentration. However, haemoglobin levels of chickens in group A also increased slightly from 127.0g/l at day 1 before the administration of NDV and the extract and from 105.0g/l at day 7 following its administration to 138.0g/
l at day 28 following the administration of both NDV and the extract. Also, Group C (serving as control) with no NDV and ethanolic extract of A. nobilis showed higher Hb level (135.0g/l) as compared to Group A receiving both NDV and ethanolic extract of A. nobilis with a lower Hb level (128.0g/l). The findings of this study were similar with the findings of Esonu et al. (2006), who observed significant increase in Hb level while feeding herbal plant (neem) to the laying hen. Results of our findings is also in contrast with the findings of Gautam et al. (2004), who noticed that no significant effect on Hb level was observed, in animals fed Withania somnifera. However, it is also in agreement with the result of Sham et al. (2003), who reported significant effect on hemoglobin and red cell count, while feeding Withania somnifera to animals. Mohammed et al. (2011) reported that the values for HB differed significantly (P<0.05) among the treatment groups (growing rabbits) fed with camel blood-rumen content mixture.
This study showed that 7 and 28 days following administration of NDV and the ethanolic root extract of A. nobilis, mean corpuscular haemoglobin concentration estimation (MCHC) level showed negligible differences (P>0.05) among the three groups, A (33.3% and 33.8% respectively), B (32.4%) and C (32.1%). Since, they fall within the normal range of 30.0%-36.0%. It showed perhaps that the disease does not affect that aspect. Means total white blood count concentration (TWBCC) level as presented Table 3b and 3c showed that the presence of Newcastle disease in those of group A and B gave rise to increase in the full blood count (TWBCC) cellmm-3. While those of group A and group C (controls) fell within normal ranges of 4.0x10³-5.5x10³cellsmm-3, those of group B had no survivor 28 days after the administration of the NDV and the extract. Finding of this study is in disagreement with the findings of Gautam et al. (2004), who noticed that no significant effect on lymphocyte and WBC counts was observed, while feeding Withania somnifera to animals. Our
72
Ayodele PO, etc. Science and Nature, April 2013 2(2): 65-73.
result can also be comparable with the findings of Sham et al. (2003) and who reported significant increase in white cell counts while feeding Withania somnifera to the mice and that of Sajjad et al. (2011), who reported that water based infusion of Aloe vera gel, Barbery, Garlic and Ginger had significant effect on lymphocyte and WBC counts of rabbits. Mohammed et al. (2011) reported that the values for WBC differed significantly (P<0.05) among the treatment groups (growing rabbits) fed with camel blood-rumen content mixture.
It has been reported that the outbreaks of ND are present on a yearly basis and depend on the season and factors such as age, breed, type of bird and management system of poultry play vital roles in the prevalence of ND in Nigeria (Nwanta et al., 2008b; Okwor and Eze, 2010). The physiological, nutritional and pathological conditions of animals are usually assessed, using haematological and biochemical analyses of their blood (Cetin et al., 2009, 2010; Al- Eissa et al., 2011). From our findings that most of hematological indices of poultry chickens tend towards normal after treatment with the root extract of A. nobilis showed the effect of this plant extract on poultry chickens challenged Newcastle disease virus (NDV). This is an encouraging development in that the use of this extract will be of immense help where vaccines are not readily available. Previous studies had reported vaccination as the only safeguard against endemic ND (Usman 2002; Nwanta et al., 2006). Nwanta et al. (2008b) in their study reported that single vaccination had a significant effect on reducing incidence of Newcastle disease compared to birds that were not vaccinated nor had multiple ND vaccinations. However, the frequent power outages coupled with poor information on the part of the farmers on vaccine procurement and handling makes vaccine failure a common phenomenon in Nigeria (Okwor et al., 2009).
The limitations of this present study were firstly, we did not screen for phyto-chemical properties of Anthocleista nobilis and secondly, we were unable to
conduct a toxicity study to determine its LD50 and test its antiviral property as a preliminary step. However, following our initial reports on the liver enzymes and other biochemical parameters, lends credence in establishing its safety in the intended host.
5 Conclusion
Most family poultry are threatened by disease outbreak, especially NCD (Moreki, 2012). Family poultry is usually owned and managed by resource-poor farmers who are unable to buy expensive vaccines for their flocks (Moreki, 2012). These vaccines require cold chain that is lacking in the village environment. As a result, EVM is crucial in preserving the health of family poultry because it is cheap, readily available and cost effective (Moreki, 2012). The EVM preparation and administration varies from place to place and also differs depending on the diseases treated (Moreki, 2012). Medicinal plants should be conserved, cultivated and harvested strategically to preserve them for future use (Moreki, 2012). Further studies are required in order to document ethnoveterinary practices used for health management of family poultry (Moreki, 2012).
Conclusively, the mean packed cell volume (PCV), mean haemoglobin (Hb), mean corpuscular haemoglobin concentration (MCHC) and full blood count (TWBCC), were significantly different (P<0.05) among the treated (group A) and the untreated group (group B). Group A were significantly (P<0.05) influenced by the treatments after 7 days and 28 days following the administration of the A. nobilis ethanolic root extract. However, since the chickens in groups A and B were injected intravenously with the same dose of New Castle Virus (NDV) and the confirmatory symptoms observed in group B which was initially mild in group A and later was not noticeable, coupled with the ability of group A poultry chickens to tend towards normal after treatment are physiological evidences of the antiviral effect of the root extract of Anthocleisia nobilis on hematological indices of the
poultry chickens studies. It also showed that the extract was able to impact immunity in chickens suffering from Newcastle disease. There is therefore, the need for the ethanolic extract of Anthocleisia nobilis to be publicized so as to create awareness to farmers for the treatment of Newcastle disease.
Acknowledgement
The authors acknowledge the assistance of the members of staff of Department of Science Laboratory Technology, School of Applied Arts and Science, The Federal Polytechnic, Bida, Niger State, Nigeria for instrumentation and The National Veterinary Research Institute (NVRI) Vom, Jos, Nigeria for the provision of the viral isolates and materials during the course of this study. We also recognize the contribution and supports of Dr. A. Banso and Miss VI Michael in the Department of Science Laboratory Technology, School of Applied Arts and Science, The Federal Polytechnic, Bida, Niger State, Nigeria for their contributions to this study.
References
1. Abdu PA, Sa’idu L, Bawa EK, Umoh JU. Factors that Contribute to Newcastle Disease, Infectious Bursal Disease and Chicken Pox Outbreaks in Chickens. Proceedings of 42nd NVMA Congress (Maiduguri 2005), El-kanemi Hall University of Maiduguri, Borno State (2005a): 66-68.
2. Abdu PA, Bawa EK, Umoh JU, Sa’idu L. Factors that Contribute to Newcastle Disease, Infectious Bursal Disease and Chicken Pox Outbreaks in Vaccinated Chickens. Proceedings of 42nd NVMA Congress (Maiduguri 2005), El-kanemi Hall University of Maiduguri, Borno State (2005b): 68-70.
3. Adene DF, Oguntade AE. The Structure and Importance of the Commercial and Village Based Poultry Industry in Nigeria. Food and Agricultural organization (FAO) Poultry Production Systems; ECTAD/AGAP (2006): 1-102.
4. Akinmutimi AH. Evaluation of sword bean (Canavalia gladiate) as an alternative feed resource for broiler chickens. A Ph.D Thesis, Michael Okpara University of Agriculture, Umudike, Nigeria (2004).
5. AL-Eissa MS, Alkahtani S. Seasonal influence on some blood and biochemical
Ayodele PO, etc. Science and Nature, April 2013 2(2): 65-73.
73
parameters of Jerboa ( Jaculus jaculus) in Saudi Arabia. Research Opinions in Animal & Veterinary Sciences (ROAVS) (2011) 1(1), 51-54.
6. Alexander DJ. Newcastle disease and other avian Paramyxoviridae infections. In: Disease of Poultry, Ed. Saif, Y.M; Barnes, H.J; Glisson, J.R. Fadly, A.M; McDougald, L.R. and Swayne, D.E. 11th Edn., Iowa State University Press, Ames, IA (2003): 63-87.
7. Awan MA, Otte MJ, James AD. The epidemiology of Newcastle disease in rural poultry: A review. Avian Pathology (1994) 23 (3): 405-423.
8. Beard CW. Vetogenic Newcastle Disease. In: Foreign Animal Disease: The Gray Book. Richmond VA, US Animal Health Association, USA (1998).
9. Bell JG, Spradbrow PB (ed). Newcastle disease in village chickens in North, West and Central Africa.. Proceedings, International Workshop held in Kuala Lumpur, Malaysia Canberra Centre for International Agricultural Research (ACIAR). Centre for International Agricultural Research (ACIAR) (1992): 142-143.
10. Burkill HM. The Useful Parts of West Tropical Africa (2nd ed.) Royal Botanic Gardens KVU (1995): 145-150.
11. Cetin N, Bekyurek T, Cetin E. Effects of sex, pregnancy and season on some haematological and biochemical blood parameters in angora rabbits. Scandinavian J Lab Animal Sci (2009) 36: 155-162.
12. Cetin E, Kanbur M, Silici S, Eraslan G. Propetamphos-induced changes in haematological and biochemical parameters of female rats: Protective role of propolis. Food and Chemical Toxicology (2010) 48: 1806-1810.
13. Cheesbrough M. District Laboratory Practice in Tropical Countries. Cambridge University Press (2006): 434.
14. Dairo FAS. Assessment of rumen content on the haematological parameters of growing rabbits: Proc. of 10th Annual Conference of Animal Science Association of Nigeria (ASAN), Sept. 12-15. University of Ado Ekiti, Nigeria (2005): 301–302.
15. Esonu BO, Opara MN, Okoli IC, Obikaonu HO, Udedibie C, Iheshiulor OOM. Physiological Response of Laying Birds to Neem (Azadirachta Indica) Leaf Meal-Based Diets: Body Weight Organ Characteristics and Haematology. Journal of OJHAS (2006) 5: 972-997.
16. Friend M. Evolving changes in diseases of waterbirds. In Waterbirds around the world. G.C. Boere, C.A. Galbraith and D.A. Stroud (Eds). The Stationery Office, Edinburgh, UK (2006): 412-417.
17. Gautam M, Diwanay SS, Gairolac S,
Shinde YS, Jadhav SS, Patwardhan BK. Immune response modulation to DPT vaccine by aqueous extract of Withania somnifera in experimental system. Journal of Ethnopharmalogy (2004) 4: 841-849.
18. Jordan FTW. Poultry Disease (3rd edn). Cambridge University Press, Great Britain (1990): 121 –136.
19. Lewington A. Plants for People. The Natural History Museum London (1990): 136 – 144.
20. Lewis MR, Rose SP, Mac Kenzie AM, Tucker LA. Effect of dietary inclusion of plant extract on the growth performance of male broiler chicken. Journal of British Poultry Science (2003) 20: 78-82.
21. McMullin P. A Pocket Guide to Poultry Health and Disease. 5M Enterprises Ltd., Poultry Health Services, Sheffield, UK. (2004).
22. Mohammed G, Igwelbuke JU, Kwari ID. Performance of growing rabbits fed graded levels of goat rumen content. Global Journal of Pure and Applied Sciences (2005) 11 (1):39–43.
23. Mohammed G, Igwebuike JU, Ubosi CO, Alade NK. Comparative study of the nutrient composition, Amino acid profile and microbial assay of fresh and dried cattle, camel, sheep and goat rumen content. Proceeding of the 13th Annual Conference of Animal Science Association of Nigeria. (ASAN), ABU, Zaria (2008) Sept. 15th -19th: 518–520.
24. Mohammed G, Igwebuike JU, Alade NK, Adamu SB, Raji AO. Haematological and serum biochemical indices of growing rabbits fed camel blood-rumen content mixture. Research Opinions in Animal & Veterinary Sciences (2011) 1(1): 44-47
25. Nwanta JA, Umoh JU, Abdu PA, Ajogi I, Alli–Balogun JK. Management of losses and Newcastle disease in rural poultry in Kaduna State, Nigeria. Nigerian Journal of Animal Production (2006a) 3(2): 274–285.
26. Nwanta JA, Umoh JU, Abdu PA, Ajogi I, Adeiza AA. Field trial of Malaysian thermostable Newcastle disease vaccine in village chickens in Kaduna State, Nigeria. . Livestock Research for Rural Development. (2006b) Volume 18(5), Article #60.Retrieved April 2, from http://www.lrrd.org/lrrd18/5/nwan18060.htm
27. Nwanta JA, Abdu PA, Ezema WS. Epidemiology, challenges and prospects for control of Newcastle disease in village poultry in Nigeria. World's Poultry Science Journal (2008a) 64: 119-127
28. Nwanta JA, Egege SC, Alli-Balogun JK, Ezema WS. Evaluation of prevalence and seasonality of Newcastle disease in chicken in Kaduna, Nigeria. World's Poultry Science Journal (2008b) 64 : 416-423
29. Okwor EC, Eze DC. The Annual Prevalence
of Newcastle Disease in Commercial Chickens Reared in South Eastern Savannah Zone of Nigeria. Research Journal of Poultry Sciences (2010) 3(2): 23-26
30. Okwor EC, Eze DC, Uzuegbu MO. Effect of storage conditions on the potency of Newcastle disease vaccine la sota. Int. J. Poult. Sci (2009) 8: 999-1002.
31. Oladele, BS, Abdu PA, Nok AJ, Esievo KAN, Useh NM. Effect of some inhibitors on neurammidase of Newcastle disease virus Kudu 113 strain. Veterinarsiarlir (2002) 72: 185-194.
32. Oyawoye EO, Ogunkunle M. Physiological and biochemical effects of raw jack beans on broiler. Proceeding of Nigerian Society of Animal Production (1998) 23:141–142.
33. Sadiq MA, Nwanta JA, Okolocha EC, Tijjani AN. Retrospective Study of Newcastle Disease (ND) Cases in Avian Species in Maiduguri, Borno State, North Eastern Nigeria. International Journal of Poultry Science (2011) 10 (1): 76-81,
34. Saidu L, Abdu PA. Outbreak of viscerotrogic velogenic form of Newcastle disease in vaccinated six weeks old pullets. Sokoto J Vet Sci (2008) 7: 37-40.
35. Sajid ur R, Durrani FR, Chand N, Khan RU, ur Rehman F. Comparative efficacy of different schedules of administration of medicinal plants infusion on hematology and serum biochemistry of broiler chicks. Research Opinions in Animal & Veterinary Sciences (ROAVS) (2011) 1(1): 8-14
36. Sham D, Chitreb D, Patwardhan B. Immunoprotection by botanical drugs in cancer chemotherapy. Journal of Ethnopharmacology (2003) 90: 49-55.
37. Thomas DW, Thomas JM, Bromley WA, Mbenkum FT. Korup Ethnobotany Survey. Final Report to the World Wide Fund For Nature. Panda House, Weyside Park, Godalming, Surrey, U.K. (1989).
38. Thomson M, Al-Qattan KK, Al-Sawan SS, Alnaqeeb MA, Khan I, Ali M. The use of ginger (Zingiber officinale Rosc.) as a potential anti-inflammatory and antithrombotic agent. Journal of Prostaglandins Leukotriens and Essential Fatty Acids (2003) 67: 475-478.
39. Usman M. Effects of vaccination of chickens against Newcastle disease with thermostable V4 and Lasota vaccines using different grains and their brans as vehicle. M.Sc Thesis, Department of Veterinary Surgery and Medicine, Ahmadu Bello University, Zaria, Nigeria.(2002) .
Science and Nature © ZolCat Academic House
Science and NatureISSN 2324-7290
The Science and Nature is an international journal with a purpose to enhance our natural and scientific knowledge dissemination in the world under the valuable academic communication principle. Papers submitted could be reviews, objective descriptions ,research reports, opinions/debates, news, letters, and other types of writtings that are science and nature related.All manucript submitted will and should be peer reviewed and the valuable papers will be considered for the publication after the peer review. The Authors are responsible to the contents of their articles.
Editor-in-chief: Julia YOUNCH, Ph.D. (U.S.)Editors: Abu CRIBB (U.S.), Sophia MONGIE (U.S.), Tilla Arabella THERESIA, Ph.D. (Germany)Staff: LI Hao (China), Yuanyuan WU (U.S.), WANG Yongkang ( Japan)Reviewers: Various in each issue.
Introduction to Authors
1. General Information
1) Goals: As an international journal published both print and online, Science and Nature is dedicated to the dissemination of fundamental knowledge in all areas of science and nature. The main purpose of Science and Nature is to enhance our knowledge spreading in the world under the valuable academic communication principle. It publishes full-length papers (original contributions), reviews, rapid communications, and any debates and opinions in all the fields of science and nature.2) What to do: Science and Nature provides a place for discussion of scientific news, research, theory, philosophy profession and technology - that will drive scientific progress. Research reports and regular manuscripts that contain new and significant information of general interest are welcome.3) W ho: All People are welcome to submit manuscripts in any fields of science and nature.4) Distributions: Web version of the journal is freely opened to the world, withour any payment or registration. The online journal will be distributed to the selected libraries and institutions for free. For the subscription of other readers please contact
Indexed by: Google Scholar;
OCLC (810943143) (WorldCat).
2012 Impact Factor: 0
www.zolcat.com www.zolcat.org
with [email protected], [email protected]) Advertisements: The price will be calculated as US$800/page, i.e., US$400/a half page, US$200/a quarter page, etc. Any size of the advertisement is welcome.
2. Manuscript Submission
1) S ubmission Methods: Only e lectronic submission through e-mail is accepted.2) Software: The Microsoft Word file will be preferred.3) Font: Normal, Times New Roman, 10pt, single space.4) Manuscript: Don't use "footnote" or "Header and Footer".5) Cover Page: Put detail information of authors and a short title in the cover page.6) Title: Use Title Case in the title and subtitles, e.g. "Debt and Agency Costs".7) Figures and Tables: Use full word of figure and table, e.g. "Figure 1. Annual Income of Different Groups", Table 1. Annual Increase of Investment".8) References: Cite references by "last name, year", e.g. "(Smith, 2003)". References should include all the authors' last names and initials, title, journal, year, volume, issue, and pages, etc.Reference Examples:Journal Article: Julia Y, Abu C, Sophia M, Tilla AT. This is the article title. Science and Nature, 2012; 1(1): 33-39.Book: Berkowitz BA, Katzung BG. Basic and clinical pharmacology. ZolCat Academic House. Brooklyn, New York, USA. 2012: 320-338.9) Submission Address: [email protected]. 10) Reviewers: Authors are encouraged to suggest 2-8 competent reviewers with their name and e-mail.
3. Manuscript Preparation
Each manuscript is suggested include the following components but authorscan do their own ways.1) Title page: Including the complete article title; each author's full name, institution(s) with which each author is affiliated, with city, state/province, zip code, and country; and the name, complete mailing address, telephone number, fascimile number (if available), and e-mail address for all
correspondence;2) Absctract: Including backgroung, materials and methods, results, and conclusions; normally 150-250 words;3) Keywords: Four to Eight keywords;4) Introduction;5) Materials and Methods;6) Results;7) Discussions;8) Conclusions;9) Acknowledgements: Including the funding details.10) References.
4. Copyright and Responsibility of Authors
When the manuscript(s) is submitted to the journal, the authors agree the following: All the authors have participated sufficiently in this work; The article is not published elsewhere; Authors are responsibility on the contents of the article; The journal has the total copyright of the article at the beginning of submission no matter whether the copyright form is signatured or not; The auhtor(s) should not use it by anyway without the permission from the journal.
5. About Withdrawal and charges
When the manuscript(s) has entered the publishing process, if the author(s) asked for withdrawal of the manuscript, there would generate a renewed invoice because of the additional fee for withdrawal as $50USD. At the same time, the old invoice and the copyright should be abolished since the renewed condition of the manuscript.Publishing fee: $300USD/6,000 words
Journal Editorial DepartmentAddress: 157 East ELM Street, Unit A, Greenwich,
CT 06830-6614, USAE-mail: [email protected]
Publisher and Printer:ZolCat Academic House604 61st St, Brooklyn, New York, NY 11220, USA
E-mail: [email protected]: ZolCat Academic House: www.zolcat.com
ZolCat Academic Forum: www.zolcat.orgZolCat Academic Net: www.zolat.net
www.zolcat.net
April 2013 Volume 2 Number 2 Science and Nature. ISSN 2324-7290
© 2012-2013 ZolCat Academic House
Single Issue Price $150USD


![Hobas GRP pipe systems PN 1 - Amiblu · 2020. 6. 10. · Jacking Pipe PN 1 de [mm] SN SN SN SN SN SN SN SN SN SN SN SN Coupling Type 32000 40000 50000 64000 80000 100000 128000 160000](https://img.pdfslide.net/doc/110x75/61236c822e9bd427c4013216/hobas-grp-pipe-systems-pn-1-amiblu-2020-6-10-jacking-pipe-pn-1-de-mm-sn.jpg)