Embed Size (px)
Citation preview
Science and Technology
Indicators 2000
Summary
NETHERLANDS OBSERVATORY OF SCIENCE AND TECHNOLOGY
� &:76� Centre for Science and Maastricht Economic Research Institute Technology Studies (CWTS) on Innovation and Technology (MERIT) Leiden University Maastricht University
Science and Technology Indicators Report 2000 Netherlands Observatory of Science and Technology Complementary copies of this report can be ordered free of charge:
Ministry of Education, Culture and Science Department of Research and Science Policy PO Box 25000 2700 LZ Zoetermeer The Netherlands Tel: +31(0)79 3233650 Fax: +31(0)79 3232080
Copies of the Dutch version of this report (ISBN 90 346 3906 1) can be ordered at SDU-service centrum for Dfl 32,50 (euro 14,75):
SDU-servicecentrum PO Box 20014 2500 EA Den Haag The Netherlands Tel: +31(0)70 3789830 Fax: +31(0)70 3789783
The electronic version of the report can be viewed and downloaded at the CWTS, MERIT and OCenW web sites:
http://www.cwts.leidenuniv.nl http://meritbbs.unimaas.nl/nowt http://www.minocw.nl/wetenschap
For more detailed information about NOWT or the 2000 S&T Indicators Report please contact:
Dr. Robert Tijssen Centre for Science and Technology Studies (CWTS) Leiden University PO Box 9555 2300 RB Leiden, The Netherlands Tel +31(0)71 5273960 Fax +31(0)71 5273911 E-mail [email protected] Hugo Hollanders Maastricht Economic Research Institute on Innovation and Technology (MERIT) Maastricht University PO Box 616 6200 MD Maastricht, The Netherlands Tel +31(0)43 3883873 Fax +31(0)43 3884905 E-mail [email protected]
© 2001 CWTS, Leiden University; MERIT, Maastricht University All rights reserved.
Science and Technology
Indicators 2000
Summary
NETHERLANDS OBSERVATORY OF SCIENCE AND TECHNOLOGY
Robert Tijssen (CWTS)
Hugo Hollanders (MERIT)
Thed van Leeuwen (CWTS)
Bart Verspagen (MERIT)
Table of Contents
Foreword i Science policy commentary by the Ministry of Education, Culture and Science ii
1 Introduction 1
2 R&D infrastructure 2
Funding structure of Dutch R&D
The increasing importance of the business enterprise sector
Decreasing government funding of university research
Government sector research
Strongly increased foreign funding
The Netherlands is lagging behind in international R&D-expenditure
3 Scientific output and impact 11
Dutch science is world-class level
Differences in performance between scientific disciplines
The Dutch university sector as a supplier of knowledge
Top research at universities
More scientific co-operation with European partners
Dutch research networks
4 Industrial research and technological development 18
Research in the private sector
Patent output and productivity
Research as knowledge base for inventions and innovations
List of abbreviations 23
NOWT Science and Technology Indicators 2000
i
Foreword
Science and technology are generally recognized as important strategic factors that will shape and
drive the socio-economic future of highly developed nations. The profound influence of scientific
knowledge and technological development can be found across the entire societal spectrum, ranging
from industry, transportation and logistics, health care, educational services, sports and entertainment,
to the arts. New technologies and (science-based) technical innovations are now considered one of the
major driving forces in modern market-oriented industrialized societies. The growing economic and
societal importance of science and technology has spurred the need for more and better information on
inputs, processes, outputs and impacts related to research and development (R&D) activities.
Science and technology policy-making by the Dutch government has a long tradition of using
quantitative data and statistics to assess and compare the state of the S&T ‘system’ in the Netherlands.
The Netherlands Observatory of Science and Technology (denoted by its Dutch acronym NOWT) is
one of the main government sources of factual information. This Observatory is a semi-independent
network organization comprising of researchers based at two Dutch universities: the Centre for
Science and Technology Studies (CWTS), a research department of Leiden University, and the
Maastricht Economic Research Institute on Innovation and Technology (MERIT) of Maastricht
University. NOWT was founded in 1992 by the Ministry of Education, Culture and Science. The
Observatory’s chief objective is to provide an overall analysis of general characteristics of the Dutch
S&T system in an international comparative perspective. NOWT analysts engage in collection of
empirical data and quantitative analyses of the system’s structural features, R&D capabilities and S&T
performance aimed at monitoring and evaluating its current state and trends.
The findings are disseminated externally to a wide readership through a series of NOWT’s bi-annual
Science and Technology Indicators Reports. This 2000 issue is the forth in this series and the first to
be published as a report by the Ministry of Education, Culture and Science and includes a policy
commentary by the Minister. This summary version provides a translation of the Dutch summary with
accompanying tables and graphs preceded by the unabridged version of the Minister’s commentary.
CWTS/MERIT, Leiden/Maastricht March 2001
NOWT Science and Technology Indicators 2000
ii
Science policy commentary by the Ministry of Education, Culture and Science This fourth report from the Netherlands Observatory of Science and Technology (NOWT), drafted on request from the Ministry of Education, Culture and Science, provides the reader with large amounts of quantitative information about the Dutch science and technology system. The report sets out a broad overview of the international position of Dutch R&D, of scientific production and its impact, of scientific networks and of the importance of science for technological developments. It should be pointed out here that the report certainly does not include all the information, which is available about science and technology. Other information can be found elsewhere, for example in the publication “Kennis en economie” by Statistics Netherlands, in assessments of university research quality and in other specific research reports. The report provides readers with the opportunity to make use of the information for their own purposes and in their own situation and, on that basis, to make observations and draw conclusions. My frame of reference is the 2000 Science Budget, in which I describe my responsibility as follows: “the minister is responsible for the sound and efficient operation of the research system as a whole: the size, quality and innovative capacity of research must be up to standard, resources must be deployed effectively and efficiently”. In what follows here, I will provide a summary of a number of results of the report which I consider to be important from the point of view of the role I play. At the same time, I will state number of relevant considerations. The position of the public research system Dutch research has a good international position in terms of the volume of scientific production and impact. Dutch research is more productive than research in many other countries: the number of scientific publications per researcher is well above the European average. The NOWT report confirms the picture from other sources such as the European indicators report of 1997 or articles in Science that Dutch scientific research is a match for research performance across the spectrum elsewhere in the world. The NOWT report provides further details in this respect in the form of quantitative data. The resulting picture is consistent with, for example, the qualitative results of assessments of university research quality. The NOWT report shows that the Netherlands is one of the ten leading scientific nations and that it belongs to the world leaders in various disciplines. Research volume in the public sector in the Netherlands,1 which consists of the higher education sector and state or semi-state institutes which conduct research, is relatively large in international terms but is decreasing in size in the higher education sector. By contrast, elsewhere in the public sector, the volume of research is increasing. In the higher education sector, research funded by the first flow of funds (direct government funding) dropped in absolute terms from 1994 onwards. The increase in the volume funded by the second and third flow of funds (government agency funding and contract research funding respectively) compensated for this fall.
1 The latest Statistics Netherlands figures in this respect relate to research expenditure for 1998.
NOWT Science and Technology Indicators 2000
iii
The Dutch public research system still has a strong position internationally, even though the current position is primarily the result of activities that were carried out in the early nineties. It does not provide any guarantees for the future. Since the number, diversity and quality of the current and future research staff are the main determinants of the potential efficacy of knowledge production and knowledge interaction, there are dangers in waiting. The recent report produced by Mrs. van Vucht Tijssen with recommendations for scientific personnel policy2 includes a Central Planning Bureau analysis of the labour market for scientific researchers. This analysis showed that, in the years to come, numbers of university researchers will fall. There will also be a drain of young researchers with limited career prospects in the short term in the Netherlands and an increase in the average age of scientific staff. All in all, if there are no changes in current trends, this will result in a threat of shortages in scientific staff at higher levels in the medium term and a substantial reduction in research capacity at Dutch universities. In order to maintain the position that has been established, continuing efforts are needed from all those involved, not only from the government but also from the knowledge institutions. Since 1998, the government has been developing a new policy that focuses not only on individual-oriented but also on thematic investments. An example of individual-oriented investments is the ‘Innovation Incentive Scheme’ of the Ministries of Education, Culture and Science and of Agriculture, Nature Management and Fisheries on the one hand and the Netherlands Organisation for Scientific Research (NWO) and the universities on the other. This scheme is intended to encourage the inflow of new young researchers who will carry out innovative research. The budget involved will increase in the years to come to NLG 157 million. Examples of thematic investments are the ICES/KIS3 funds, the incentives from the Ministry of Economic Affairs for demand-driven and innovation-oriented fundamental strategic research and specific government investments focused on the further development of fields such as ‘genomics’ and information and communications technology. The amount, the quality and the innovative capacity of the research in these fields will, however, only become manifest in a few years' time. The position of the private sector The levels of research expenditure at most large knowledge-intensive and multinational businesses in the Netherlands are reasonably in line with those found among foreign competitors. However, the rest of the Dutch business sector still invests relatively little in research, even taking variations in sectoral structure into account4. Levels of R&D are relatively high in the Netherlands in the chemicals, electrical machinery, oil and food sectors. In the area of technological development, the Netherlands has the highest number of patents per researcher in the private sector after Switzerland. The Netherlands has a relatively large number of patents in two sectors, namely electronics (the R&D activities of Philips) and food, and relatively low
2 B.E. van Vucht Tijssen, Talent voor de Toekomst, Toekomst voor Talent, Plan van aanpak voor het wetenschapspersoneelsbeleid, Utrecht, 2000. 3 ICES = Interdepartementale Commissie voor Economische Structuurversterking (Interdepartmental Committee for Economic Structure). KIS = Kennisinfrastructuur (Knowledge Infrastructure). 4 H.Hollanders and B. Verspagen, De invloed van de sectorstructuur op de R&D-uitgaven van en het aantal toegekende patenten aan het Nederlandse bedrijfsleven, MERIT study commissioned by the Dutch Ministry of Economic Affairs, Maastricht, 1999.
NOWT Science and Technology Indicators 2000
iv
numbers in technological sectors such as computers and office machinery, aviation construction, automobile industry, other transport sectors and instruments. Despite a revival in corporate R&D expenditure in the nineties, there is a danger that the situation with respect to R&D investment in the private sector may become a problem for Dutch industrial innovative capacity. The changes in the nature of corporate research efforts are contributing to the problem. Since 1986, the share of corporate investment in risk-bearing fundamental research has been dropping, as can be seen from the relevant Statistics Netherlands figures5. One of the reasons for this is the shortening of the time horizon for research projects in the private sector because of the increase in the rate of market developments. This has consequences for the position of university research, because it results in universities being expected to invest more in fundamental research in those fields which are important for the private sector. In addition, the universities are also put under greater pressure to concentrate more on applied research for companies and other social actors. These developments reinforce each other and can have negative consequences for the viability and scientific quality of fundamental university research in the long term. More than ever, the universities are becoming the only party in the research infrastructure for housing long-term fundamental research in the Netherlands. A high-quality infrastructure of this kind is important if the Netherlands is to maintain its ability in the future to respond quickly and effectively to global scientific developments and external demands for knowledge. National and international involvement and network formation The NOWT report shows that the level of privately financed research at universities and state or semi-state institutions is one of the highest compared to other countries. This applies primarily to non-university institutions such as the Netherlands Organization for Applied Scientific Research (TNO) and the Large Technological Institutes (GTIs). Furthermore, in recent years, the proportion of Dutch public-private co-publications has increased again. The two network maps in the NOWT report, which are based on co-publications and patent citations, showed that there are close-knit networks of public and private institutions in the Netherlands. On the international level, the NOWT report notes a strong increase in the level of financing for Dutch R&D by foreign companies and the EU. The share of the Netherlands in the initial expenditure of the 5th Framework Programme is relative high compared to the Dutch contribution to the EU. In the last (4th) Framework Programme, the share in expenditure and the contribution were virtually equal. Collaboration between researchers takes place increasingly in an international context. The NOWT report notes an increase in the number of scientific publications in international magazines in which Dutch researchers publish in collaboration with foreign researchers. This is happening increasingly among researchers from EU countries at the expense of collaboration with researchers from the United States, a logical result of increasing EU funding. The previous NOWT report already showed that international co-publications have greater impact and visibility (in terms of citation scores) than publications which do not involve collaboration or which involve only national collaboration.
5 The sources here are the annual Statistics Netherlands publications “Speur- and ontwikkelingswerk in Nederland” (prior to 1996) and, from 1996 onwards, “Kennis en economie”.
NOWT Science and Technology Indicators 2000
v
Parties involved in research, both in the Netherlands and elsewhere, have more and more contacts and their work is becoming increasingly intermingled. Within the global trend, there is also a strong tendency towards Europeanisation and this links up to the developments relating to a European Research Area. The impact of science on technology and innovation The NOWT report indicates that the Dutch research system is, broadly speaking, reasonably integrated in the national innovation system. Dutch university research is also well represented in scientific disciplines which serve as a source of knowledge for important Dutch industrial sectors. In addition, there are more and more public-private scientific collaborations and a proportion of Dutch patented inventions depend on Dutch research in the public sector. Dutch companies are also starting to provide more and more financing for research at Dutch state and semi-state knowledge institutions. On the international level, Dutch scientific research is also clearly resulting in economic applications: the number of citations of Dutch research publications in patents granted in the United States has increased sharply. However, there are also figures which show that innovative companies use public knowledge institutions relatively little as sources of information6. Supplementary analyses from the University of Amsterdam7 show that only 15% of the innovative companies in the Netherlands have relationships in the knowledge domain with public institutions. These analyses also show that innovative companies with relationships in the knowledge domain have a significantly higher gross added value per employee than innovative companies without relationships in the knowledge domain. There is increasing awareness that a major part of the competitive strength of the Netherlands is located in technological developments and the application of advanced knowledge in innovative products and services based on high-quality infrastructure facilities and continuous innovation. The activities of many companies are based in part on new scientific insights and techniques. They can be seen in part as spin-offs of scientific infrastructure. In order to maintain the competitive strength of the Netherlands, considerable investments are needed in all areas of the “knowledge economy”, including the public research system. Their importance is obvious in terms of a healthy physical climate for business location and of a stronger competitive position for the Netherlands, not only in industrial sectors but also in commercial services. In conclusion The importance of knowledge in our society is widely recognised and has resulted in a shift in the trend in terms of the levels of public investment in scientific research. National investments in scientific research are no longer seen as luxuries but as expenditure that is necessary to improve the national knowledge infrastructure. Expenditure of this kind serves not only to generate new scientific and technical knowledge but also to make the timely absorption and exploitation of knowledge and skills possible. The government therefore decided in 2000 to make more long-term investments in innovations in fundamental scientific research. Education and research activities ensure that there is enough highly-educated human capital and create a positive 'knowledge balance' for the purposes of
6 Statistics Netherlands, Kennis en Economie 1998, Voorburg/Heerlen, 1998. 7 A.P. Poot and E. Brouwer, Samen Innoveren, een onderzoek naar publiek-private en private kennis-relaties in Nederland, The Hague, 2000 .
NOWT Science and Technology Indicators 2000
vi
possible applications of knowledge in the longer term. Furthermore, these activities have an intrinsic value: every civilised country needs a healthy scientific knowledge infrastructure. Although fundamental research does not, in the short term, generate any immediate economic returns or predictable benefits, its returns are considerable in the long-term, as is shown by, for example, an SPRU report from 19968. The additional investments made by the government in raising knowledge levels may result in numerous positive long-term effects on our society, varying from an adequate foundation for vital applied corporate research to an improvement of the image of science and scientific knowledge, and adequately trained people. From the point of view of the emerging “knowledge economy”, the 2000 NOWT report provides a particularly clear picture of the scientific basis and, in that respect, it more or less complements the Statistics Netherlands report “Kennis en economie” which focuses on technology and innovation. Together, the two reports provide an overview of the role which knowledge creation, knowledge transfer and knowledge exploitation play within an economic framework. This overview represents only a part of society's demand for scientific and technical knowledge and the assessment of the practical value of that knowledge. The demand for reliable and comparable information about the science and technology system requires a greater focus on gathering the right information in response to pressing questions. Government-wide developments such as VBTB (“From Policy Budgeting to Policy Accountability”) in which the emphasis is placed on making policy activities and the results of those activities more transparent, as well as the recent activities in the area of R&D benchmarking from the European Commission, also require deeper, more specifically targeted and more structured information facilities. The next NOWT report will pay more attention to these factors, in terms of data acquisition and data analysis, in the light of the current situation of Dutch scientific research. The Minister of Education, Culture and Science (L.M.L.H.A. Hermans)
8 SPRU, The Relationship between publicly funded basic research and economic performance, Brighton, 1996.
NOWT Science and Technology Indicators 2000
1
1 Introduction For purposes of public accountability, policy design and assessment, governments need to be able to monitor, as accurately as possible, structural shifts and recent trends pertaining to R&D-investments and scientific and technological performance, not only in their own country, but also in comparison to other nations. However because of their intangible nature, scientific knowledge and technical advances are difficult to identify and measure. Obtaining reliable facts and figures and science and technology requires a series of interrelated indicators to provide a composite picture. The scoreboard presented in this summary of the 2000 edition of the Science and Technology Indicators Report of the Netherlands Science and Technology Observatory (NOWT) provides a range of statistics and indicators focusing mainly on institutional characteristics of the Dutch S&T system and its concrete R&D outcomes in the 1990s. This fourth report in the series pays special attention to the relation between parts of this system in terms of funding, co-operation networks, and interaction between scientific research and technological development. In accordance with quantitative analyses of R&D systems applied by, among others, the European Commission (EC) and the Organisation for Economic Co-operation and Development (OECD), this NOWT study uses the internationally prevailing statistics and information sources on R&D expenditure. The output performance metrics are based on counts of research articles and patents, which constitute verifiable and quantifiable data on outputs and impacts of scientific and engineering research and technical development. Further information is derived from NOWT surveys within the Dutch research community. Clearly such a vast, complex and open science and technology system can only partly be described in terms of these selected characteristics. As a consequence, the data and statistical material described in this report are at best partial indicators of R&D capacity and outcomes. Given these inevitable limitations, the tables, graphical representations and indicators in this report provide a general overview of a number of important quantifiable aspects of that system within an internationally comparative framework. The findings and associated conclusions drawn on the basis of this material concerning the comparative strengths and weaknesses of the Dutch R&D system should therefore be viewed in this context. Both the English language summary report and the full Dutch version of the report are electronically available on the NOWT pages at the websites of CWTS and MERIT: www.cwts.leidenuniv.nl and meritbbs.unimaas.nl/nowt.
NOWT Science and Technology Indicators 2000
2
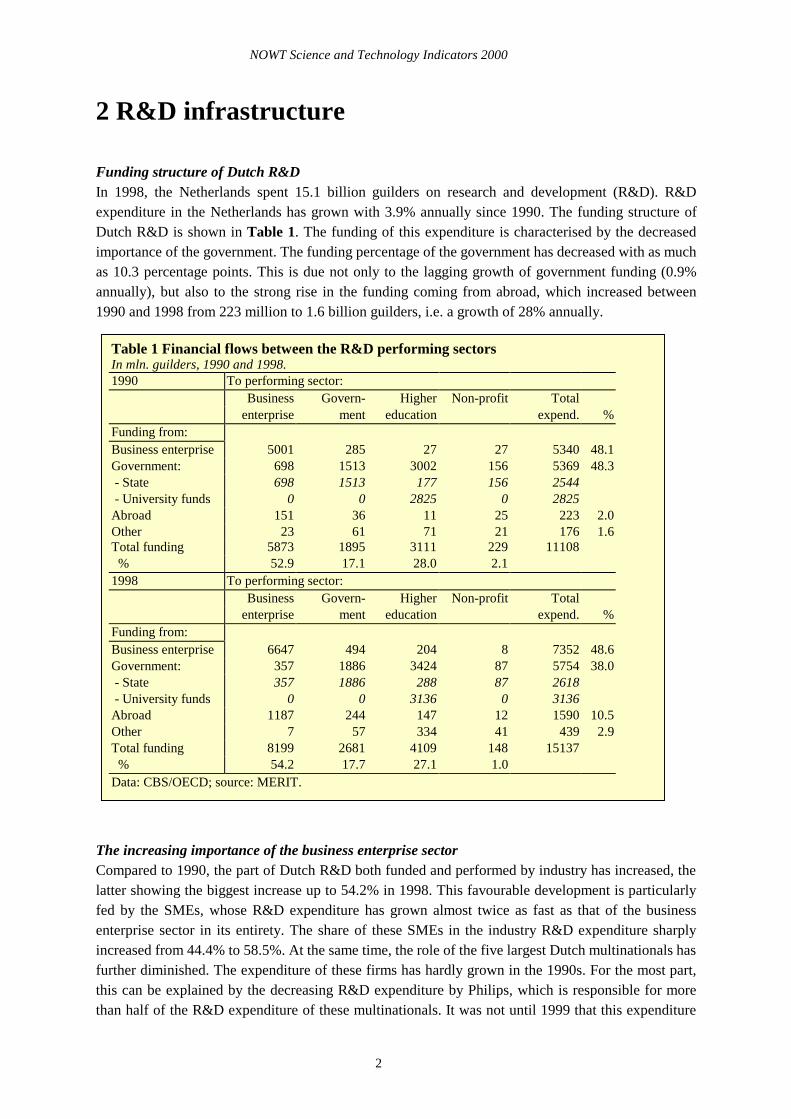
2 R&D infrastructure Funding structure of Dutch R&D In 1998, the Netherlands spent 15.1 billion guilders on research and development (R&D). R&D expenditure in the Netherlands has grown with 3.9% annually since 1990. The funding structure of Dutch R&D is shown in Table 1. The funding of this expenditure is characterised by the decreased importance of the government. The funding percentage of the government has decreased with as much as 10.3 percentage points. This is due not only to the lagging growth of government funding (0.9% annually), but also to the strong rise in the funding coming from abroad, which increased between 1990 and 1998 from 223 million to 1.6 billion guilders, i.e. a growth of 28% annually.
The increasing importance of the business enterprise sector Compared to 1990, the part of Dutch R&D both funded and performed by industry has increased, the latter showing the biggest increase up to 54.2% in 1998. This favourable development is particularly fed by the SMEs, whose R&D expenditure has grown almost twice as fast as that of the business enterprise sector in its entirety. The share of these SMEs in the industry R&D expenditure sharply increased from 44.4% to 58.5%. At the same time, the role of the five largest Dutch multinationals has further diminished. The expenditure of these firms has hardly grown in the 1990s. For the most part, this can be explained by the decreasing R&D expenditure by Philips, which is responsible for more than half of the R&D expenditure of these multinationals. It was not until 1999 that this expenditure
Table 1 Financial flows between the R&D performing sectors In mln. guilders, 1990 and 1998. 1990 To performing sector:
Business Govern- Higher Non-profit Total enterprise ment education expend. %
Funding from: Business enterprise 5001 285 27 27 5340 48.1 Government: 698 1513 3002 156 5369 48.3 - State 698 1513 177 156 2544 - University funds 0 0 2825 0 2825 Abroad 151 36 11 25 223 2.0 Other 23 61 71 21 176 1.6 Total funding 5873 1895 3111 229 11108 % 52.9 17.1 28.0 2.1 1998 To performing sector:
Business Govern- Higher Non-profit Total enterprise ment education expend. %
Funding from: Business enterprise 6647 494 204 8 7352 48.6 Government: 357 1886 3424 87 5754 38.0 - State 357 1886 288 87 2618 - University funds 0 0 3136 0 3136 Abroad 1187 244 147 12 1590 10.5 Other 7 57 334 41 439 2.9 Total funding 8199 2681 4109 148 15137 % 54.2 17.7 27.1 1.0 Data: CBS/OECD; source: MERIT.
NOWT Science and Technology Indicators 2000
3
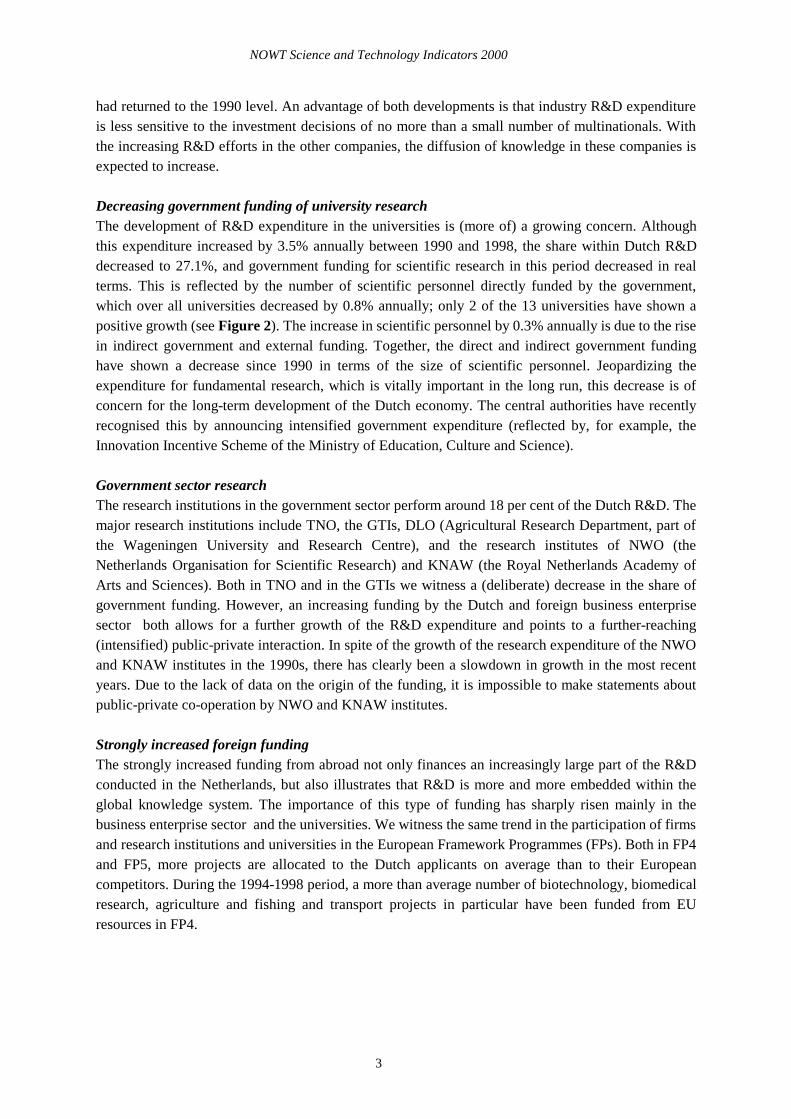
had returned to the 1990 level. An advantage of both developments is that industry R&D expenditure is less sensitive to the investment decisions of no more than a small number of multinationals. With the increasing R&D efforts in the other companies, the diffusion of knowledge in these companies is expected to increase. Decreasing government funding of university research The development of R&D expenditure in the universities is (more of) a growing concern. Although this expenditure increased by 3.5% annually between 1990 and 1998, the share within Dutch R&D decreased to 27.1%, and government funding for scientific research in this period decreased in real terms. This is reflected by the number of scientific personnel directly funded by the government, which over all universities decreased by 0.8% annually; only 2 of the 13 universities have shown a positive growth (see Figure 2). The increase in scientific personnel by 0.3% annually is due to the rise in indirect government and external funding. Together, the direct and indirect government funding have shown a decrease since 1990 in terms of the size of scientific personnel. Jeopardizing the expenditure for fundamental research, which is vitally important in the long run, this decrease is of concern for the long-term development of the Dutch economy. The central authorities have recently recognised this by announcing intensified government expenditure (reflected by, for example, the Innovation Incentive Scheme of the Ministry of Education, Culture and Science). Government sector research The research institutions in the government sector perform around 18 per cent of the Dutch R&D. The major research institutions include TNO, the GTIs, DLO (Agricultural Research Department, part of the Wageningen University and Research Centre), and the research institutes of NWO (the Netherlands Organisation for Scientific Research) and KNAW (the Royal Netherlands Academy of Arts and Sciences). Both in TNO and in the GTIs we witness a (deliberate) decrease in the share of government funding. However, an increasing funding by the Dutch and foreign business enterprise sector both allows for a further growth of the R&D expenditure and points to a further-reaching (intensified) public-private interaction. In spite of the growth of the research expenditure of the NWO and KNAW institutes in the 1990s, there has clearly been a slowdown in growth in the most recent years. Due to the lack of data on the origin of the funding, it is impossible to make statements about public-private co-operation by NWO and KNAW institutes. Strongly increased foreign funding The strongly increased funding from abroad not only finances an increasingly large part of the R&D conducted in the Netherlands, but also illustrates that R&D is more and more embedded within the global knowledge system. The importance of this type of funding has sharply risen mainly in the business enterprise sector and the universities. We witness the same trend in the participation of firms and research institutions and universities in the European Framework Programmes (FPs). Both in FP4 and FP5, more projects are allocated to the Dutch applicants on average than to their European competitors. During the 1994-1998 period, a more than average number of biotechnology, biomedical research, agriculture and fishing and transport projects in particular have been funded from EU resources in FP4.
NOWT Science and Technology Indicators 2000
4
Figure 2 Relative growth university researchers Relative to the growth of all funding flows of all universities, 1990-1998 (WP = research personnel,WP1 = financed by direct government funding, WP2 = financed by indirect government funding,WP3 = financed by external funding).
Direct government funding
-4
-3
-2
-1
0
1
2
3
4
UU LEI UvA RUG KUN VU EUR KUB UM WUR TUD TUE UT TOT
WP1 WP
Indirect government funding
-3-2-10123456789
1011
UU LEI UvA RUG KUN VU EUR KUB UM WUR TUD TUE UT TOT
WP2 WP
External funding
-5-4-3-2-1012345678
UU LEI UvA RUG KUN VU EUR KUB UM WUR TUD TUE UT TOT
WP3 WP
Data: VSNU; source: MERIT.
NOWT Science and Technology Indicators 2000
5
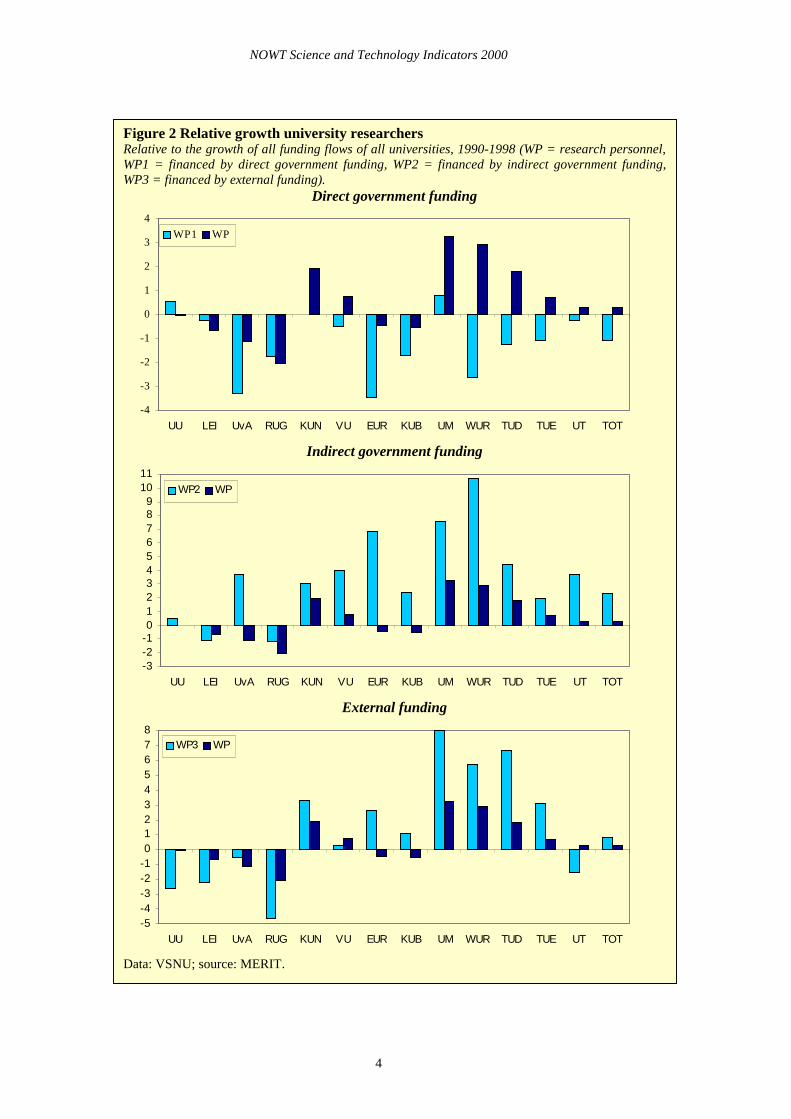
Figure 3 R&D-expenditure in international perspective Total R&D-expenditure (logs) and intensity, 1998.
BELAUT
NOR
DEN FRA
DEU
IRL
PRT
GRC
ESP
VK
ITA
NLD
CHE
FIN
SWE
JPN
US
0.0
0.5
1.0
1.5
2.0
2.5
3.0
3.5
4.0
6.0 7.0 8.0 9.0 10.0 11.0 12.0 13.0
R&D-expenditures (log)
R&
D-in
tens
ity
The vertical axis shows the R&D-intensity, measured as the ratio of R&D-expenditure to GDP. Thehorizontal axis shows the natural logarithm of the R&D-expenditure, measured in 1990 US dollars. Thedotted lines show the average R&D-intensity resp. log of average R&D-expenditure. For Belgium 1995data were used, for Switzerland 1996 data and for Greece, Ireland, Norway, Portugal and Sweden 1997data. Data: OECD; source: MERIT.
The Netherlands is lagging behind in international R&D-expenditure Measured in terms of R&D intensity, defined as the percentage of R&D expenditure of Gross Domestic Product (GDP), the Netherlands ranks sixth within the group of European countries studied, similar to 1990. However, where the Dutch R&D intensity in this period fell from 2.15% to 1.95%, that of this other group of European countries has increased on average from 1.69% to 1.80%, while the group of OECD countries studies has grown from 1.84% to 1.94%. Although the Netherlands still score above average, it is increasingly losing its lead relative to this average. The growth of R&D expenditure is lagging behind that of the Dutch economy itself and R&D expenditures of other countries in the OECD.
The various OECD countries have been divided into three groups. Together with Japan and the United States, the large European countries (Germany, France and the United Kingdom) have been classified in the “PanEurope group”. As shown in Figure 3, not only do these countries have an above-average R&D intensity, they also spend so much on R&D in absolute terms that possible economies of scale in the R&D process are to be expected.
NOWT Science and Technology Indicators 2000
6
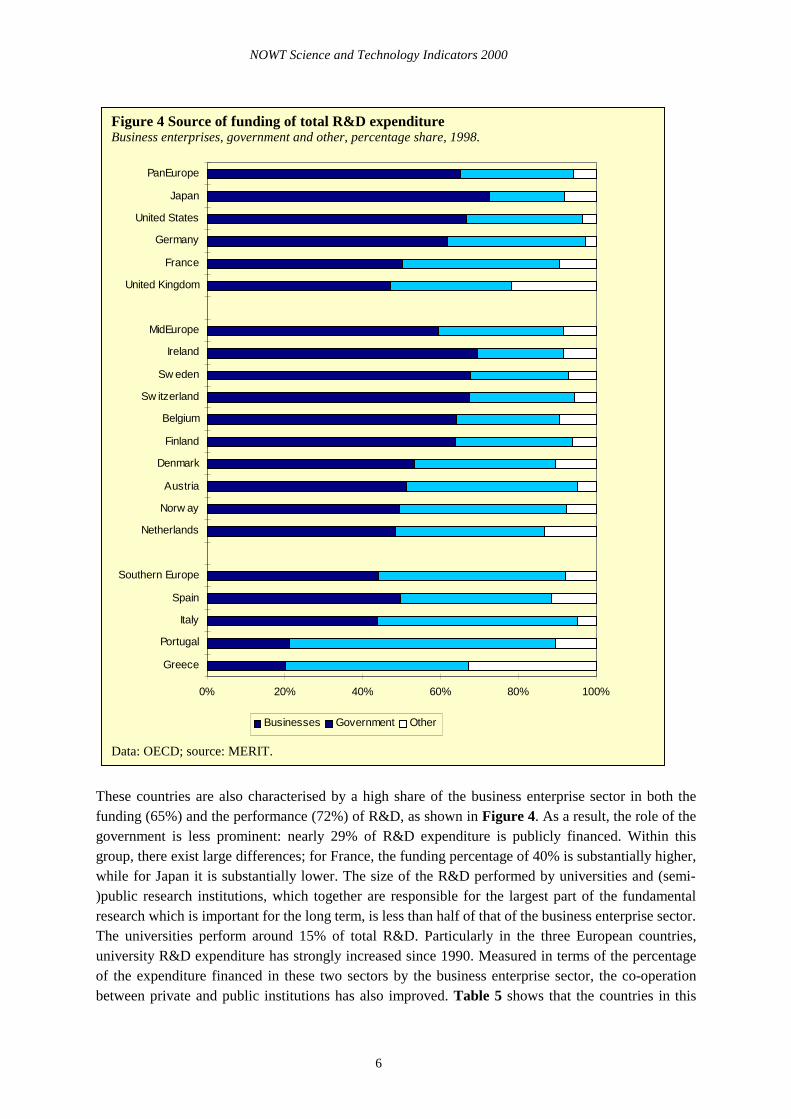
These countries are also characterised by a high share of the business enterprise sector in both the funding (65%) and the performance (72%) of R&D, as shown in Figure 4. As a result, the role of the government is less prominent: nearly 29% of R&D expenditure is publicly financed. Within this group, there exist large differences; for France, the funding percentage of 40% is substantially higher, while for Japan it is substantially lower. The size of the R&D performed by universities and (semi-)public research institutions, which together are responsible for the largest part of the fundamental research which is important for the long term, is less than half of that of the business enterprise sector. The universities perform around 15% of total R&D. Particularly in the three European countries, university R&D expenditure has strongly increased since 1990. Measured in terms of the percentage of the expenditure financed in these two sectors by the business enterprise sector, the co-operation between private and public institutions has also improved. Table 5 shows that the countries in this
Figure 4 Source of funding of total R&D expenditure Business enterprises, government and other, percentage share, 1998.
0% 20% 40% 60% 80% 100%
Greece
Portugal
Italy
Spain
Southern Europe
Netherlands
Norw ay
Austria
Denmark
Finland
Belgium
Sw itzerland
Sw eden
Ireland
MidEurope
United Kingdom
France
Germany
United States
Japan
PanEurope
Businesses Government Other
Data: OECD; source: MERIT.
NOWT Science and Technology Indicators 2000
7
group, with the exception of the research institutes in Japan, have shown a below average development, as compared to the average of all countries studied in this report, between 1990 and 1998.
Together with a number of smaller and medium-sized European countries, the Netherlands was assigned to the “MidEurope group”. Although in absolute terms, these countries spend less on R&D than the countries in the PanEurope group, the average R&D intensities are far above the European and OECD average, and the lost ground relative to the PanEurope group substantially diminished between 1990 and 1998. The role of the business enterprise sector is a little less central in this group: approximately 66% of the R&D in these countries is performed by the business enterprise sector, while 59% is financed by the same sector. There are, however, large differences among the countries in this group. The Swedish industry performs almost 75% of the R&D, a percentage even exceeding that of the United States. Ireland has the highest funding percentage of over 69%. The Dutch industry is lagging (far) behind: although it increased with 0.5 percentage points compared to 1990, the funding percentage of 48.6% is far below the MidEurope average. The R&D expenditure of the business enterprise sector shows a more positive
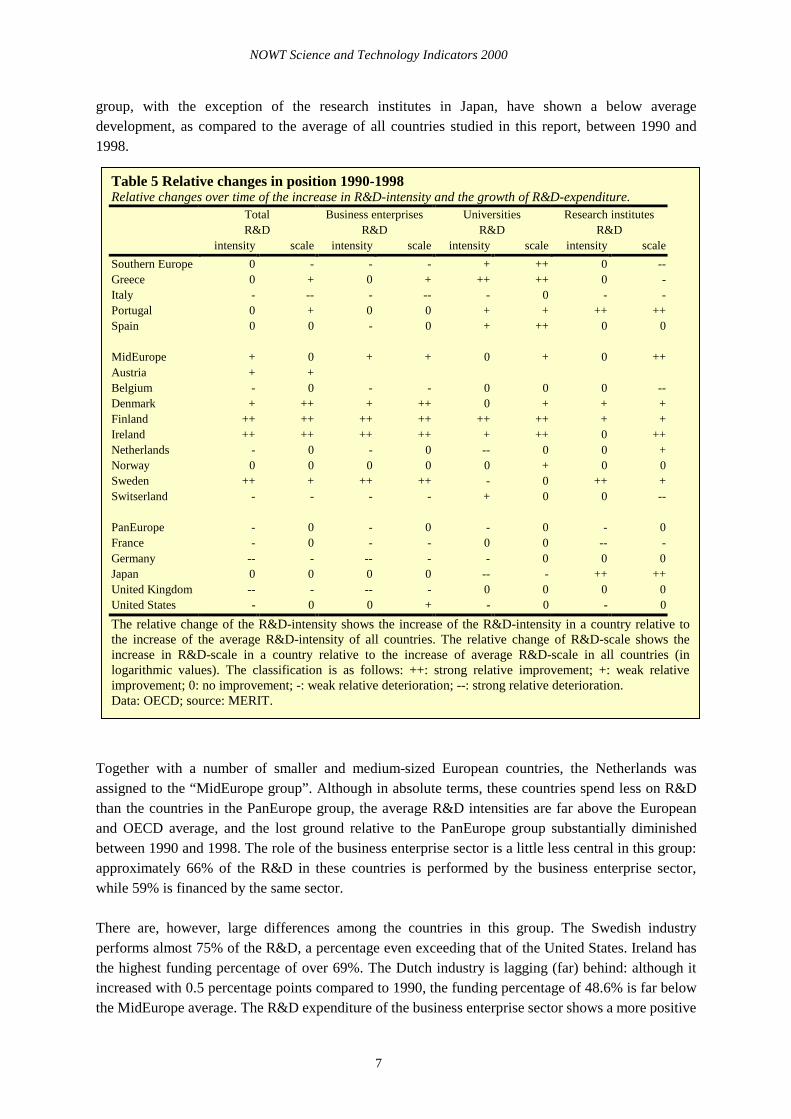
Table 5 Relative changes in position 1990-1998 Relative changes over time of the increase in R&D-intensity and the growth of R&D-expenditure.
Total Business enterprises Universities Research institutes R&D R&D R&D R&D intensity scale intensity scale intensity scale intensity scale
Southern Europe 0 - - - + ++ 0 -- Greece 0 + 0 + ++ ++ 0 - Italy - -- - -- - 0 - - Portugal 0 + 0 0 + + ++ ++ Spain 0 0 - 0 + ++ 0 0 MidEurope + 0 + + 0 + 0 ++ Austria + + Belgium - 0 - - 0 0 0 -- Denmark + ++ + ++ 0 + + + Finland ++ ++ ++ ++ ++ ++ + + Ireland ++ ++ ++ ++ + ++ 0 ++ Netherlands - 0 - 0 -- 0 0 + Norway 0 0 0 0 0 + 0 0 Sweden ++ + ++ ++ - 0 ++ + Switserland - - - - + 0 0 -- PanEurope - 0 - 0 - 0 - 0 France - 0 - - 0 0 -- - Germany -- - -- - - 0 0 0 Japan 0 0 0 0 -- - ++ ++ United Kingdom -- - -- - 0 0 0 0 United States - 0 0 + - 0 - 0
The relative change of the R&D-intensity shows the increase of the R&D-intensity in a country relative to the increase of the average R&D-intensity of all countries. The relative change of R&D-scale shows the increase in R&D-scale in a country relative to the increase of average R&D-scale in all countries (in logarithmic values). The classification is as follows: ++: strong relative improvement; +: weak relative improvement; 0: no improvement; -: weak relative deterioration; --: strong relative deterioration. Data: OECD; source: MERIT.
NOWT Science and Technology Indicators 2000
8
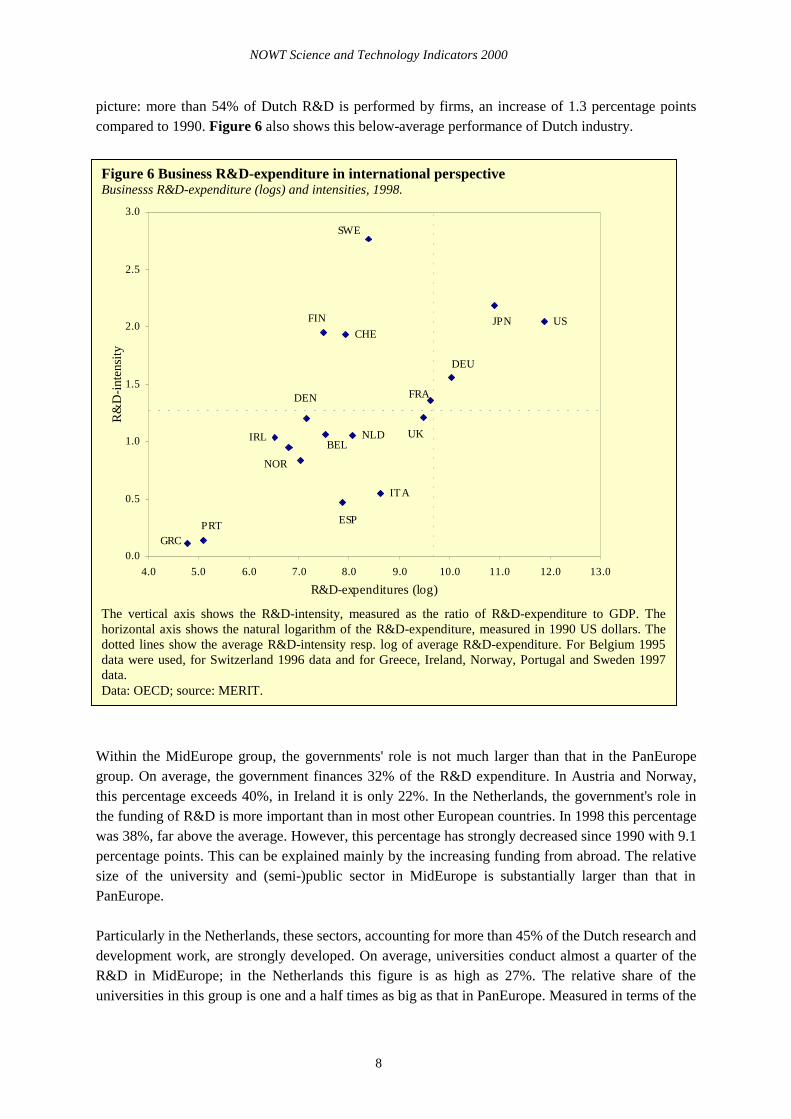
Figure 6 Business R&D-expenditure in international perspective Businesss R&D-expenditure (logs) and intensities, 1998.
BEL
NOR
DEN FRA
DEU
IRL
PRTGRC
ESP
UK
ITA
NLD
CHE
FIN
SWE
JPN US
0.0
0.5
1.0
1.5
2.0
2.5
3.0
4.0 5.0 6.0 7.0 8.0 9.0 10.0 11.0 12.0 13.0
R&D-expenditures (log)
R&
D-in
tens
ity
The vertical axis shows the R&D-intensity, measured as the ratio of R&D-expenditure to GDP. Thehorizontal axis shows the natural logarithm of the R&D-expenditure, measured in 1990 US dollars. Thedotted lines show the average R&D-intensity resp. log of average R&D-expenditure. For Belgium 1995data were used, for Switzerland 1996 data and for Greece, Ireland, Norway, Portugal and Sweden 1997data. Data: OECD; source: MERIT.
picture: more than 54% of Dutch R&D is performed by firms, an increase of 1.3 percentage points compared to 1990. Figure 6 also shows this below-average performance of Dutch industry.
Within the MidEurope group, the governments' role is not much larger than that in the PanEurope group. On average, the government finances 32% of the R&D expenditure. In Austria and Norway, this percentage exceeds 40%, in Ireland it is only 22%. In the Netherlands, the government's role in the funding of R&D is more important than in most other European countries. In 1998 this percentage was 38%, far above the average. However, this percentage has strongly decreased since 1990 with 9.1 percentage points. This can be explained mainly by the increasing funding from abroad. The relative size of the university and (semi-)public sector in MidEurope is substantially larger than that in PanEurope. Particularly in the Netherlands, these sectors, accounting for more than 45% of the Dutch research and development work, are strongly developed. On average, universities conduct almost a quarter of the R&D in MidEurope; in the Netherlands this figure is as high as 27%. The relative share of the universities in this group is one and a half times as big as that in PanEurope. Measured in terms of the
NOWT Science and Technology Indicators 2000
9
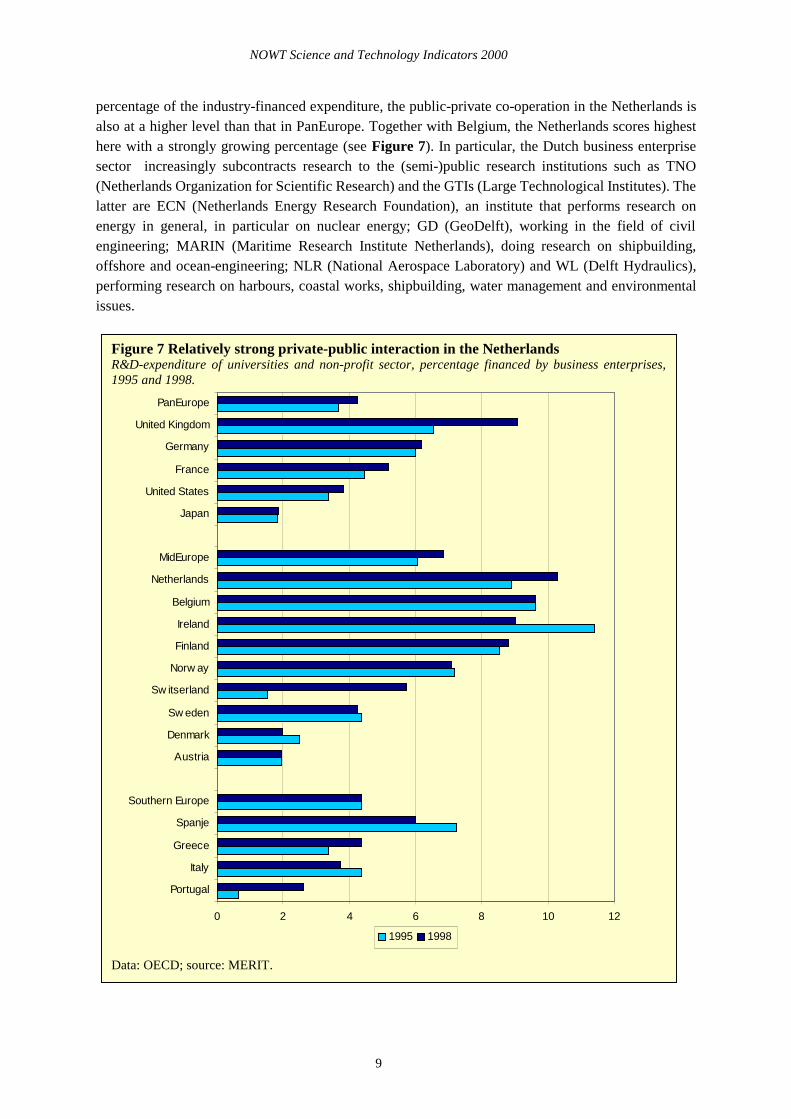
percentage of the industry-financed expenditure, the public-private co-operation in the Netherlands is also at a higher level than that in PanEurope. Together with Belgium, the Netherlands scores highest here with a strongly growing percentage (see Figure 7). In particular, the Dutch business enterprise sector increasingly subcontracts research to the (semi-)public research institutions such as TNO (Netherlands Organization for Scientific Research) and the GTIs (Large Technological Institutes). The latter are ECN (Netherlands Energy Research Foundation), an institute that performs research on energy in general, in particular on nuclear energy; GD (GeoDelft), working in the field of civil engineering; MARIN (Maritime Research Institute Netherlands), doing research on shipbuilding, offshore and ocean-engineering; NLR (National Aerospace Laboratory) and WL (Delft Hydraulics), performing research on harbours, coastal works, shipbuilding, water management and environmental issues.
Figure 7 Relatively strong private-public interaction in the Netherlands R&D-expenditure of universities and non-profit sector, percentage financed by business enterprises,1995 and 1998.
0 2 4 6 8 10 12
Portugal
Italy
Greece
Spanje
Southern Europe
Austria
Denmark
Sw eden
Sw itserland
Norw ay
Finland
Ireland
Belgium
Netherlands
MidEurope
Japan
United States
France
Germany
United Kingdom
PanEurope
1995 1998
Data: OECD; source: MERIT.
NOWT Science and Technology Indicators 2000
10
The third group, “Southern Europe”, consists of the European countries located around the Mediterranean: Portugal, Spain, Italy and Greece. This group of countries has an R&D intensity far below the European and OECD average and has lost further ground relative to the other European countries since 1990. Italy is the only country with a large R&D expenditure in absolute terms, but the level of funding lags far behind that of the other large European countries. With about half of the R&D expenditure, the business enterprise sector in this group plays a far less important role compared to the percentage of nearly 42% in 1990. The funding percentage is 44%. There are striking differences in this group between Portugal and Greece on the one hand and Spain and Italy on the other. For the latter two, both percentages are considerably higher and they even approach the level of the Netherlands. The business enterprise sector is remarkably absent in the R&D infrastructure in Portugal and Greece. While in the other two groups, the business enterprise sector finances the largest part of the R&D expenditure, the government is the major funder in this group. In Portugal, this percentage is as high as 68%, and its public sector is therefore responsible for almost half of the R&D conducted in this country. In particular, the university R&D expenditure has risen sharply since 1990. In Greece, for instance, more than 50% of total R&D is performed by the universities. The public-private co-operation is at a level between that of both other groups of countries.
NOWT Science and Technology Indicators 2000
11
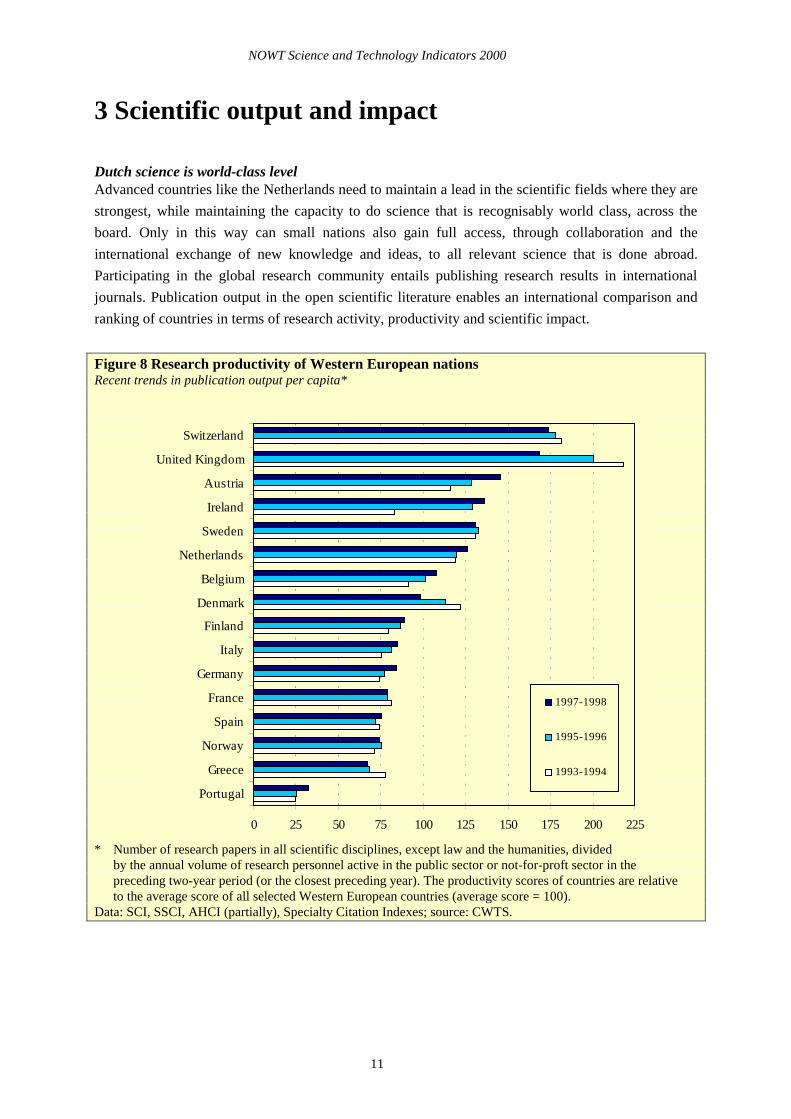
3 Scientific output and impact Dutch science is world-class level Advanced countries like the Netherlands need to maintain a lead in the scientific fields where they are
strongest, while maintaining the capacity to do science that is recognisably world class, across the
board. Only in this way can small nations also gain full access, through collaboration and the
international exchange of new knowledge and ideas, to all relevant science that is done abroad.
Participating in the global research community entails publishing research results in international
journals. Publication output in the open scientific literature enables an international comparison and
ranking of countries in terms of research activity, productivity and scientific impact.
Figure 8 Research productivity of Western European nations Recent trends in publication output per capita* * Number of research papers in all scientific disciplines, except law and the humanities, divided by the annual volume of research personnel active in the public sector or not-for-proft sector in the preceding two-year period (or the closest preceding year). The productivity scores of countries are relative to the average score of all selected Western European countries (average score = 100). Data: SCI, SSCI, AHCI (partially), Specialty Citation Indexes; source: CWTS.
0 25 50 75 100 125 150 175 200 225
Portugal
Greece
Norway
Spain
France
Germany
Italy
Finland
Denmark
Belgium
Netherlands
Sweden
Ireland
Austria
United Kingdom
Switzerland
1997-1998
1995-1996
1993-1994
NOWT Science and Technology Indicators 2000
12
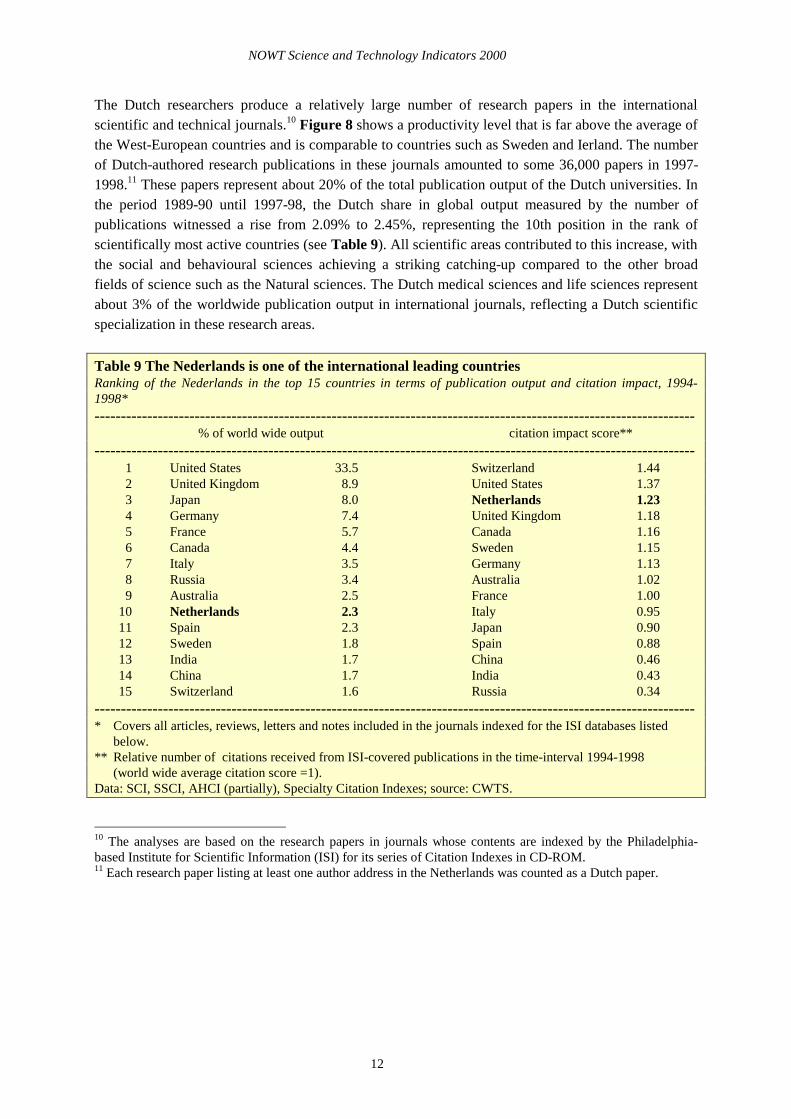
The Dutch researchers produce a relatively large number of research papers in the international scientific and technical journals.10 Figure 8 shows a productivity level that is far above the average of the West-European countries and is comparable to countries such as Sweden and Ierland. The number of Dutch-authored research publications in these journals amounted to some 36,000 papers in 1997-1998.11 These papers represent about 20% of the total publication output of the Dutch universities. In the period 1989-90 until 1997-98, the Dutch share in global output measured by the number of publications witnessed a rise from 2.09% to 2.45%, representing the 10th position in the rank of scientifically most active countries (see Table 9). All scientific areas contributed to this increase, with the social and behavioural sciences achieving a striking catching-up compared to the other broad fields of science such as the Natural sciences. The Dutch medical sciences and life sciences represent about 3% of the worldwide publication output in international journals, reflecting a Dutch scientific specialization in these research areas.
Table 9 The Nederlands is one of the international leading countries Ranking of the Nederlands in the top 15 countries in terms of publication output and citation impact, 1994-1998* ------------------------------------------------------------------------------------------------------------------ % of world wide output citation impact score** ------------------------------------------------------------------------------------------------------------------ 1 United States 33.5 Switzerland 1.44 2 United Kingdom 8.9 United States 1.37 3 Japan 8.0 Netherlands 1.23 4 Germany 7.4 United Kingdom 1.18 5 France 5.7 Canada 1.16 6 Canada 4.4 Sweden 1.15 7 Italy 3.5 Germany 1.13 8 Russia 3.4 Australia 1.02 9 Australia 2.5 France 1.00 10 Netherlands 2.3 Italy 0.95 11 Spain 2.3 Japan 0.90 12 Sweden 1.8 Spain 0.88 13 India 1.7 China 0.46 14 China 1.7 India 0.43 15 Switzerland 1.6 Russia 0.34 ------------------------------------------------------------------------------------------------------------------ * Covers all articles, reviews, letters and notes included in the journals indexed for the ISI databases listed below. ** Relative number of citations received from ISI-covered publications in the time-interval 1994-1998 (world wide average citation score =1). Data: SCI, SSCI, AHCI (partially), Specialty Citation Indexes; source: CWTS.
10 The analyses are based on the research papers in journals whose contents are indexed by the Philadelphia-based Institute for Scientific Information (ISI) for its series of Citation Indexes in CD-ROM. 11 Each research paper listing at least one author address in the Netherlands was counted as a Dutch paper.
NOWT Science and Technology Indicators 2000
13
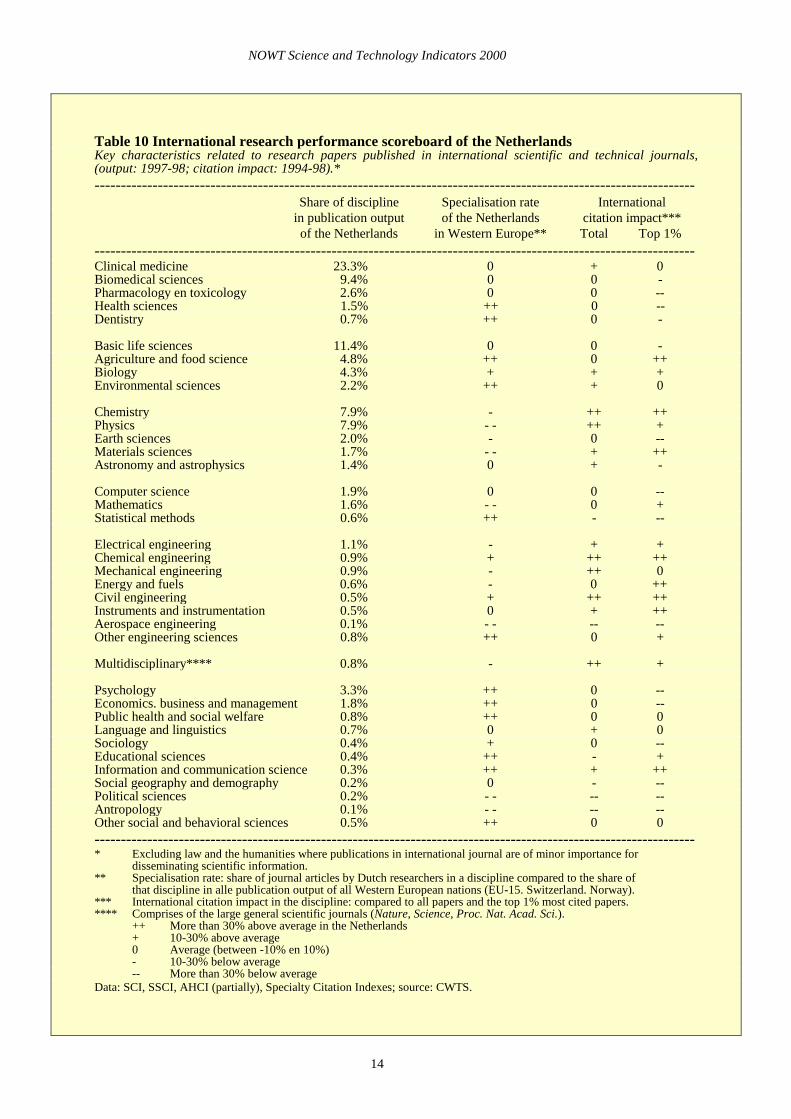
Research papers in international journals are often cited in the reference list of subsequent papers. Usually such ‘citations’ indicate the use of those papers, and the research they represent. Highly cited papers are generally considered to be very relevant for scientific progress and of high scientific quality. Looking at the international scientific visibility and status in terms of this ‘citation impact’ the Netherlands ranks third within the group of the 15 most active scientific countries. The impact of Dutch publications reaches a level of 1.23, that is 23% above the worldwide citation average.12 Only Switzerland and the United States achieve higher scores. Hence, due to its relatively large output and high scientific impact, the Netherlands can justly be referred to as a scientifically pre-eminent country. Differences in performance between scientific disciplines Only five disciplines account for 60% of the Dutch scientific output in international journals: Clinical medicine, Fundamental life sciences, Biomedical sciences, Chemistry and Physics.13 When looking at the relative size and scientific impact rather than the absolute size, another picture emerges (see Table 10). The strong Dutch disciplines relative to other West-European countries are the following: Agriculture and Food Sciences, Biology, Environmental Sciences, Chemical Engineering, Civil Engineering, and Information and Communication Sciences. Each of these areas can boast on a relatively large Dutch publication output together with a relatively large citation impact. A further measure of scientific excellence is the share of Dutch-authored papers in the top 1% most highly cited papers worldwide. No less than eight disciplines show an overrepresentation of Dutch papers (i.e. more than 2-2.5%) amongst this elite of research papers. In addition to some of the above-mentioned scientific strengths, we find high scores for Chemistry, Materials science, Energy and fuels, and Instruments and instrumentation. The Dutch university sector as a supplier of knowledge A strong and broad-based university research sector is one of the main pillars in an effective domestic R&D system. Not only in terms of leading-edge research and new knowledge relevant to the scientific community and society at large, but also as a source of high-quality human resources that are well-educated and trained. A pool of talent in science and technology, a sophisticated workforce and effective transfer of knowledge are seen as keys to sustainable successful and competitive innovation culture. The Dutch university sector is the largest supplier of new knowledge in terms of scientific publications. Three-quarters of the Dutch research articles in international journals originate from the academic sector (including university hospitals), whereas 20% comes from other (semi-)public research institutes and other knowledge institutions, and 5% is produced by firms and private R&D laboratories. Yet the differences per discipline are huge. For example, the publication share of the universities is 96% in the case of Education Sciences, whereas the business enterprise sector accounts for no less than 25% of the electrical engineering output (chiefly the Dutch electronics firm Philips). Overall, the Dutch universities conduct high-quality research in disciplines directly related to its R&D-intensive industrial sectors of high economic importance to the country (chemistry, electronics, agriculture and the food industry). 12 The citation impact of a paper is compared to the average impact of all papers in the same journal. 13 Note that the relative size of these five disciplines is not a typical Dutch research profile but occurs in many countries partially due to the disciplinary coverage of the ISI citation indexes.
NOWT Science and Technology Indicators 2000
14
Table 10 International research performance scoreboard of the Netherlands Key characteristics related to research papers published in international scientific and technical journals, (output: 1997-98; citation impact: 1994-98).* ------------------------------------------------------------------------------------------------------------------ Share of discipline Specialisation rate International in publication output of the Netherlands citation impact*** of the Netherlands in Western Europe** Total Top 1% ------------------------------------------------------------------------------------------------------------------ Clinical medicine 23.3% 0 + 0 Biomedical sciences 9.4% 0 0 - Pharmacology en toxicology 2.6% 0 0 -- Health sciences 1.5% ++ 0 -- Dentistry 0.7% ++ 0 - Basic life sciences 11.4% 0 0 - Agriculture and food science 4.8% ++ 0 ++ Biology 4.3% + + + Environmental sciences 2.2% ++ + 0 Chemistry 7.9% - ++ ++ Physics 7.9% - - ++ + Earth sciences 2.0% - 0 -- Materials sciences 1.7% - - + ++ Astronomy and astrophysics 1.4% 0 + - Computer science 1.9% 0 0 -- Mathematics 1.6% - - 0 + Statistical methods 0.6% ++ - -- Electrical engineering 1.1% - + + Chemical engineering 0.9% + ++ ++ Mechanical engineering 0.9% - ++ 0 Energy and fuels 0.6% - 0 ++ Civil engineering 0.5% + ++ ++ Instruments and instrumentation 0.5% 0 + ++ Aerospace engineering 0.1% - - -- -- Other engineering sciences 0.8% ++ 0 + Multidisciplinary**** 0.8% - ++ + Psychology 3.3% ++ 0 -- Economics. business and management 1.8% ++ 0 -- Public health and social welfare 0.8% ++ 0 0 Language and linguistics 0.7% 0 + 0 Sociology 0.4% + 0 -- Educational sciences 0.4% ++ - + Information and communication science 0.3% ++ + ++ Social geography and demography 0.2% 0 - -- Political sciences 0.2% - - -- -- Antropology 0.1% - - -- -- Other social and behavioral sciences 0.5% ++ 0 0 ------------------------------------------------------------------------------------------------------------------ * Excluding law and the humanities where publications in international journal are of minor importance for
disseminating scientific information. ** Specialisation rate: share of journal articles by Dutch researchers in a discipline compared to the share of that discipline in alle publication output of all Western European nations (EU-15. Switzerland. Norway). *** International citation impact in the discipline: compared to all papers and the top 1% most cited papers. **** Comprises of the large general scientific journals (Nature, Science, Proc. Nat. Acad. Sci.). ++ More than 30% above average in the Netherlands + 10-30% above average 0 Average (between -10% en 10%) - 10-30% below average -- More than 30% below average Data: SCI, SSCI, AHCI (partially), Specialty Citation Indexes; source: CWTS.
NOWT Science and Technology Indicators 2000
15
The university output in these international journals has increased by 40% during the past ten years. The largest general universities (Utrecht, Leiden, Groningen, Amsterdam and Nijmegen) are traditionally the largest suppliers. However, the smaller universities and the technical universities in particular have significantly increased their output; the University of Brabant, Erasmus University Rotterdam and the Technical University of Delft all show a striking growth rate.
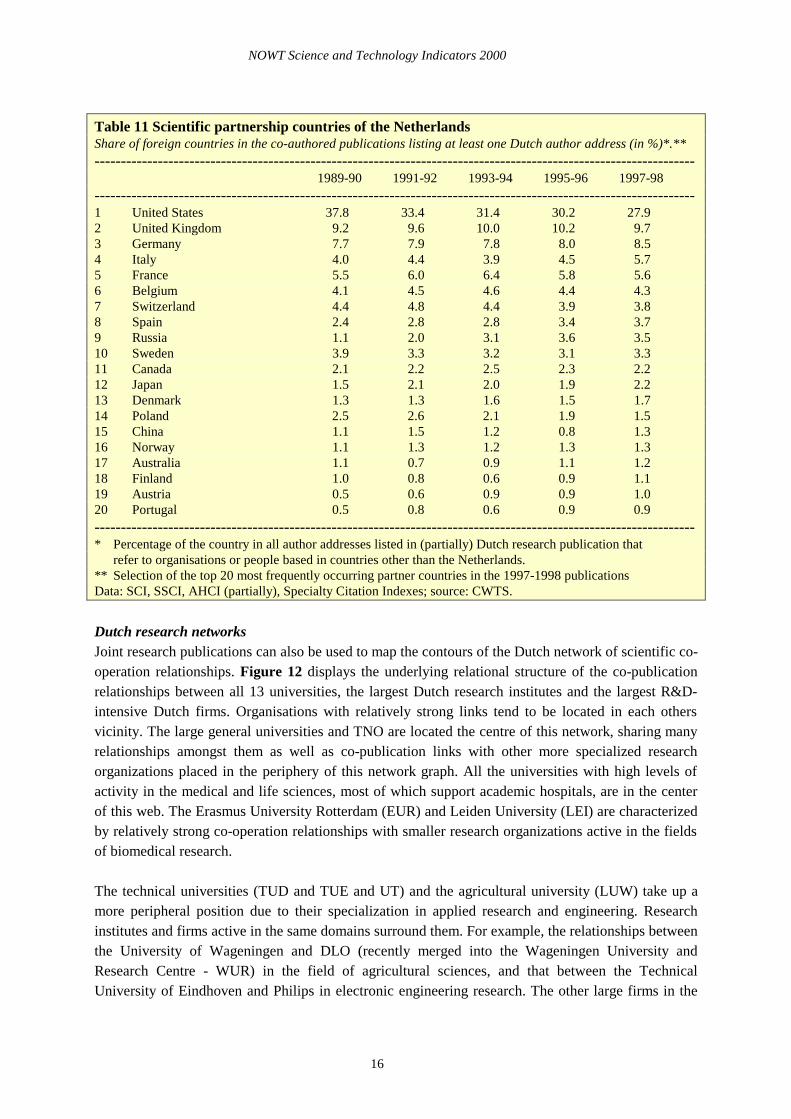
High-quality research at universities Each of the Dutch universities is characterised by its own specific research profile - both in terms of the distribution of research articles over the various scientific disciplines as well as the associated international citation impact of those publications. Each university can boast on one or more ‘top ranking disciplines’ with a relatively large publication output and relatively high impact scores of these publications. More specifically, the numbers of research publications of Dutch scientists in most renowned scientific journals, such as Nature and Science, illustrate the extent to which Dutch universities succeed in participating at the international scientific frontiers. Due to the emphasis of these high-cited top-ranking journals on the medical, life and natural sciences, the large general universities (equipped with a medical faculty) in particular are well represented in these journals: the universities of Leiden, Utrecht and Amsterdam boast a relatively large number of publications. In addition, we find a relatively strong presence of Technical University of Delft and the Wageningen University and Research Centre. These Dutch research articles are often highly cited in comparison to other articles in these journals. More scientific co-operation with European partners The nature and intensity of scientific co-operation can partly be measured from the joint scientific articles of researchers.14 Back in 1981-82, 65% of the scientific co-operation relationships in journal publications was concerned with in-house institutional co-operation between researchers employed in different sections or departments within the same main institution. In 1997-98, this share almost halved to a mere 36%. Meanwhile, 40% of Dutch scientific publications in the natural, life and medical sciences now include at least one foreign research partner; in the social and behavioural sciences this share has increased to 21%. These percentages are comparable to the situation in the other medium-sized West-European countries. Although the United States continue to be the Netherlands' major scientific partner, the US share in Ditch internationally co-authored papers has gradually diminished in favour of the West-European countries, which now contribute to 17% of all Dutch publications. In 1989-90, this share was only 10%. The United Kingdom, Germany, France and Italy are the largest partners in terms of co-publications, closely followed by Belgium. Table 11 displays the breakdown of those international collaboration patterns at the level of partner countries, showing the marked decline of the US and noticeable growth in co-publication outputs with Germany and Russia. 14 The headings of the co-publications list all the working addresses supplied by the authors, and the associated countries, which enables and analysis of levels and types of scientific co-operation.
NOWT Science and Technology Indicators 2000
16
Table 11 Scientific partnership countries of the Netherlands Share of foreign countries in the co-authored publications listing at least one Dutch author address (in %)*.** ------------------------------------------------------------------------------------------------------------------ 1989-90 1991-92 1993-94 1995-96 1997-98 ------------------------------------------------------------------------------------------------------------------ 1 United States 37.8 33.4 31.4 30.2 27.9 2 United Kingdom 9.2 9.6 10.0 10.2 9.7 3 Germany 7.7 7.9 7.8 8.0 8.5 4 Italy 4.0 4.4 3.9 4.5 5.7 5 France 5.5 6.0 6.4 5.8 5.6 6 Belgium 4.1 4.5 4.6 4.4 4.3 7 Switzerland 4.4 4.8 4.4 3.9 3.8 8 Spain 2.4 2.8 2.8 3.4 3.7 9 Russia 1.1 2.0 3.1 3.6 3.5 10 Sweden 3.9 3.3 3.2 3.1 3.3 11 Canada 2.1 2.2 2.5 2.3 2.2 12 Japan 1.5 2.1 2.0 1.9 2.2 13 Denmark 1.3 1.3 1.6 1.5 1.7 14 Poland 2.5 2.6 2.1 1.9 1.5 15 China 1.1 1.5 1.2 0.8 1.3 16 Norway 1.1 1.3 1.2 1.3 1.3 17 Australia 1.1 0.7 0.9 1.1 1.2 18 Finland 1.0 0.8 0.6 0.9 1.1 19 Austria 0.5 0.6 0.9 0.9 1.0 20 Portugal 0.5 0.8 0.6 0.9 0.9 ------------------------------------------------------------------------------------------------------------------ * Percentage of the country in all author addresses listed in (partially) Dutch research publication that refer to organisations or people based in countries other than the Netherlands. ** Selection of the top 20 most frequently occurring partner countries in the 1997-1998 publications Data: SCI, SSCI, AHCI (partially), Specialty Citation Indexes; source: CWTS.
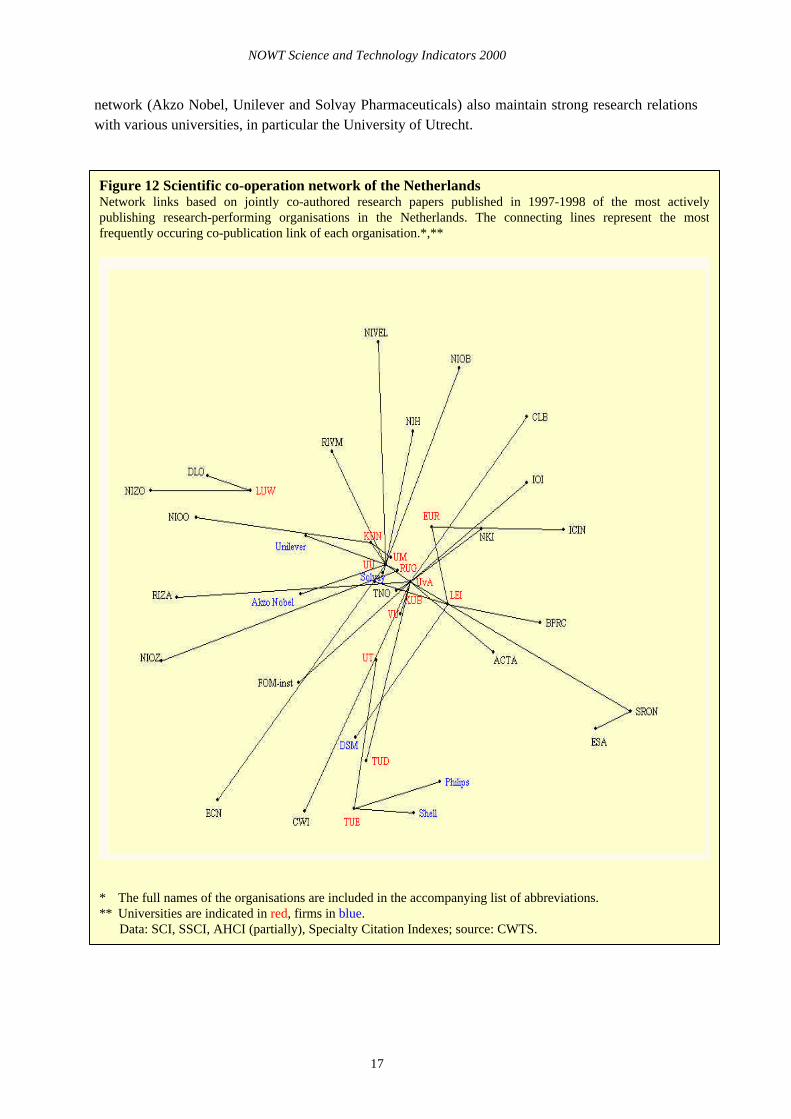
Dutch research networks Joint research publications can also be used to map the contours of the Dutch network of scientific co-operation relationships. Figure 12 displays the underlying relational structure of the co-publication relationships between all 13 universities, the largest Dutch research institutes and the largest R&D-intensive Dutch firms. Organisations with relatively strong links tend to be located in each others vicinity. The large general universities and TNO are located the centre of this network, sharing many relationships amongst them as well as co-publication links with other more specialized research organizations placed in the periphery of this network graph. All the universities with high levels of activity in the medical and life sciences, most of which support academic hospitals, are in the center of this web. The Erasmus University Rotterdam (EUR) and Leiden University (LEI) are characterized by relatively strong co-operation relationships with smaller research organizations active in the fields of biomedical research. The technical universities (TUD and TUE and UT) and the agricultural university (LUW) take up a more peripheral position due to their specialization in applied research and engineering. Research institutes and firms active in the same domains surround them. For example, the relationships between the University of Wageningen and DLO (recently merged into the Wageningen University and Research Centre - WUR) in the field of agricultural sciences, and that between the Technical University of Eindhoven and Philips in electronic engineering research. The other large firms in the
NOWT Science and Technology Indicators 2000
17
network (Akzo Nobel, Unilever and Solvay Pharmaceuticals) also maintain strong research relations with various universities, in particular the University of Utrecht.
Figure 12 Scientific co-operation network of the Netherlands Network links based on jointly co-authored research papers published in 1997-1998 of the most actively publishing research-performing organisations in the Netherlands. The connecting lines represent the most frequently occuring co-publication link of each organisation.*,**
* The full names of the organisations are included in the accompanying list of abbreviations. ** Universities are indicated in red, firms in blue. Data: SCI, SSCI, AHCI (partially), Specialty Citation Indexes; source: CWTS.
NOWT Science and Technology Indicators 2000
18
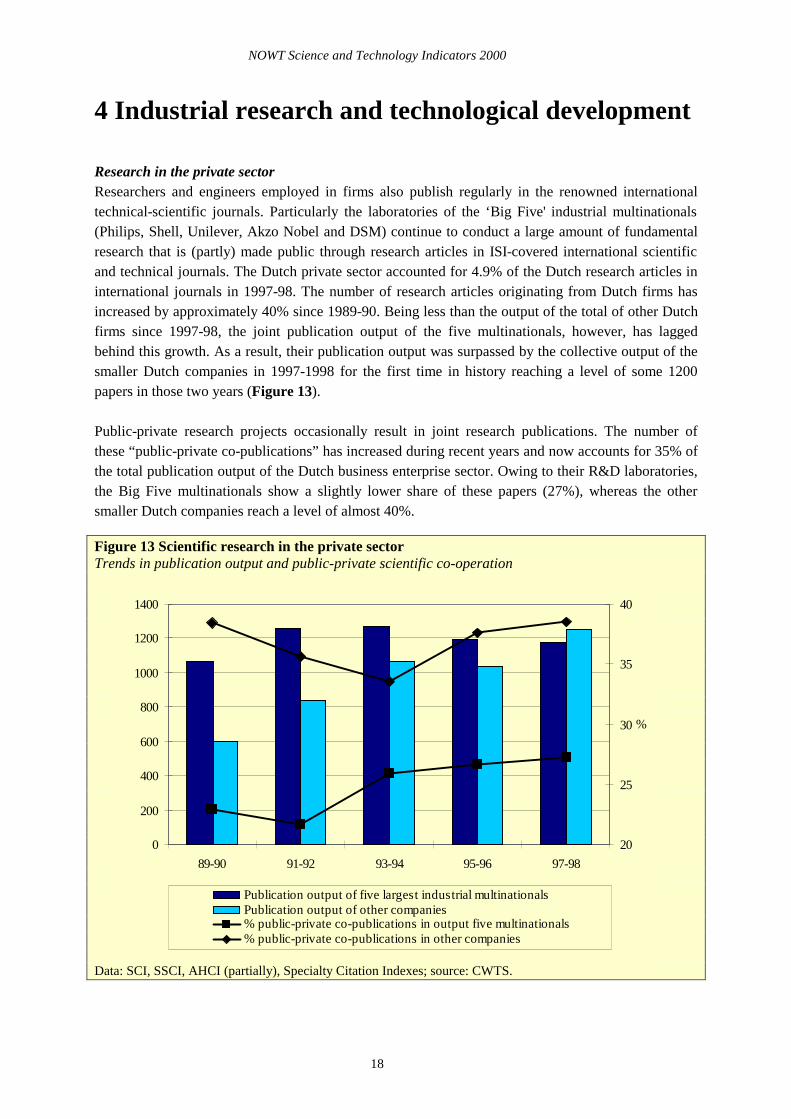
4 Industrial research and technological development Research in the private sector Researchers and engineers employed in firms also publish regularly in the renowned international technical-scientific journals. Particularly the laboratories of the ‘Big Five' industrial multinationals (Philips, Shell, Unilever, Akzo Nobel and DSM) continue to conduct a large amount of fundamental research that is (partly) made public through research articles in ISI-covered international scientific and technical journals. The Dutch private sector accounted for 4.9% of the Dutch research articles in international journals in 1997-98. The number of research articles originating from Dutch firms has increased by approximately 40% since 1989-90. Being less than the output of the total of other Dutch firms since 1997-98, the joint publication output of the five multinationals, however, has lagged behind this growth. As a result, their publication output was surpassed by the collective output of the smaller Dutch companies in 1997-1998 for the first time in history reaching a level of some 1200 papers in those two years (Figure 13). Public-private research projects occasionally result in joint research publications. The number of these “public-private co-publications” has increased during recent years and now accounts for 35% of the total publication output of the Dutch business enterprise sector. Owing to their R&D laboratories, the Big Five multinationals show a slightly lower share of these papers (27%), whereas the other smaller Dutch companies reach a level of almost 40%.
Figure 13 Scientific research in the private sector Trends in publication output and public-private scientific co-operation Data: SCI, SSCI, AHCI (partially), Specialty Citation Indexes; source: CWTS.
0
200
400
600
800
1000
1200
1400
89-90 91-92 93-94 95-96 97-98
20
25
30
35
40
%
Publication output of five largest industrial multinationalsPublication output of other companies% public-private co-publications in output five multinationals% public-private co-publications in other companies
NOWT Science and Technology Indicators 2000
19
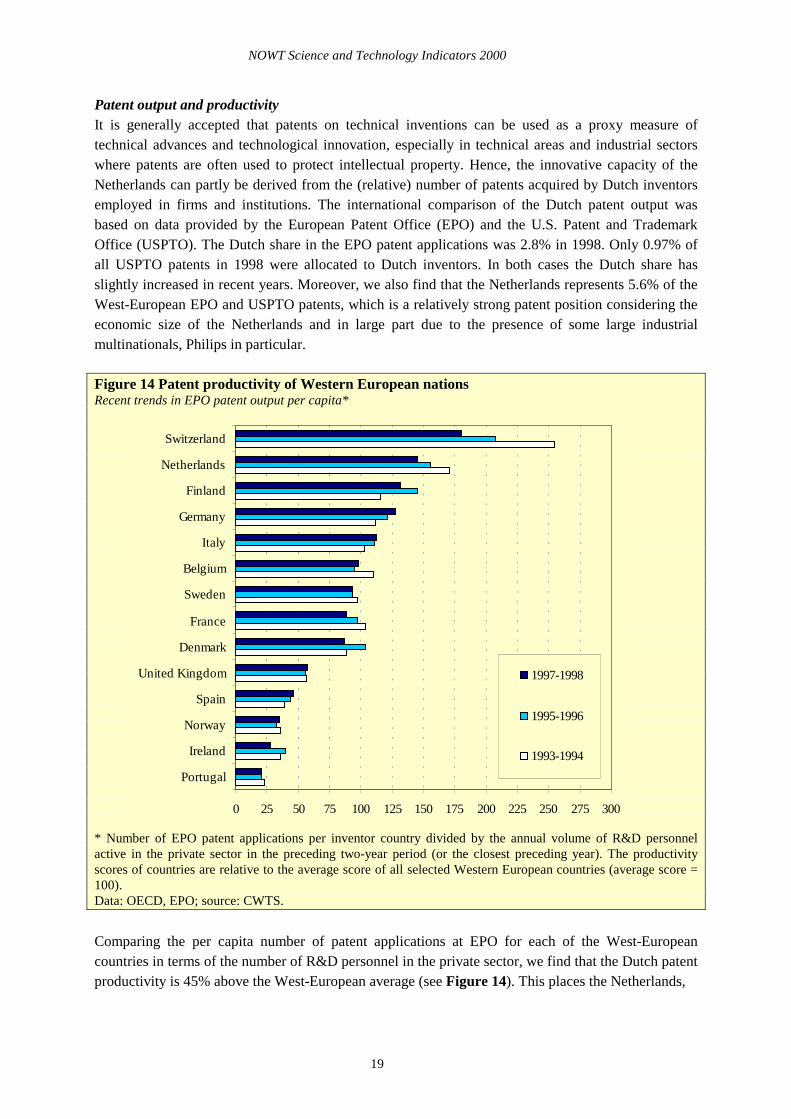
Patent output and productivity It is generally accepted that patents on technical inventions can be used as a proxy measure of technical advances and technological innovation, especially in technical areas and industrial sectors where patents are often used to protect intellectual property. Hence, the innovative capacity of the Netherlands can partly be derived from the (relative) number of patents acquired by Dutch inventors employed in firms and institutions. The international comparison of the Dutch patent output was based on data provided by the European Patent Office (EPO) and the U.S. Patent and Trademark Office (USPTO). The Dutch share in the EPO patent applications was 2.8% in 1998. Only 0.97% of all USPTO patents in 1998 were allocated to Dutch inventors. In both cases the Dutch share has slightly increased in recent years. Moreover, we also find that the Netherlands represents 5.6% of the West-European EPO and USPTO patents, which is a relatively strong patent position considering the economic size of the Netherlands and in large part due to the presence of some large industrial multinationals, Philips in particular. Figure 14 Patent productivity of Western European nations Recent trends in EPO patent output per capita* * Number of EPO patent applications per inventor country divided by the annual volume of R&D personnel active in the private sector in the preceding two-year period (or the closest preceding year). The productivity scores of countries are relative to the average score of all selected Western European countries (average score = 100). Data: OECD, EPO; source: CWTS.
Comparing the per capita number of patent applications at EPO for each of the West-European countries in terms of the number of R&D personnel in the private sector, we find that the Dutch patent productivity is 45% above the West-European average (see Figure 14). This places the Netherlands,
0 25 50 75 100 125 150 175 200 225 250 275 300
Portugal
Ireland
Norway
Spain
United Kingdom
Denmark
France
Sweden
Belgium
Italy
Germany
Finland
Netherlands
Switzerland
1997-1998
1995-1996
1993-1994
N
OW
T S
cien
ce a
nd
Te
chn
olo
gy In
dica
tors 2
00
0
2
0
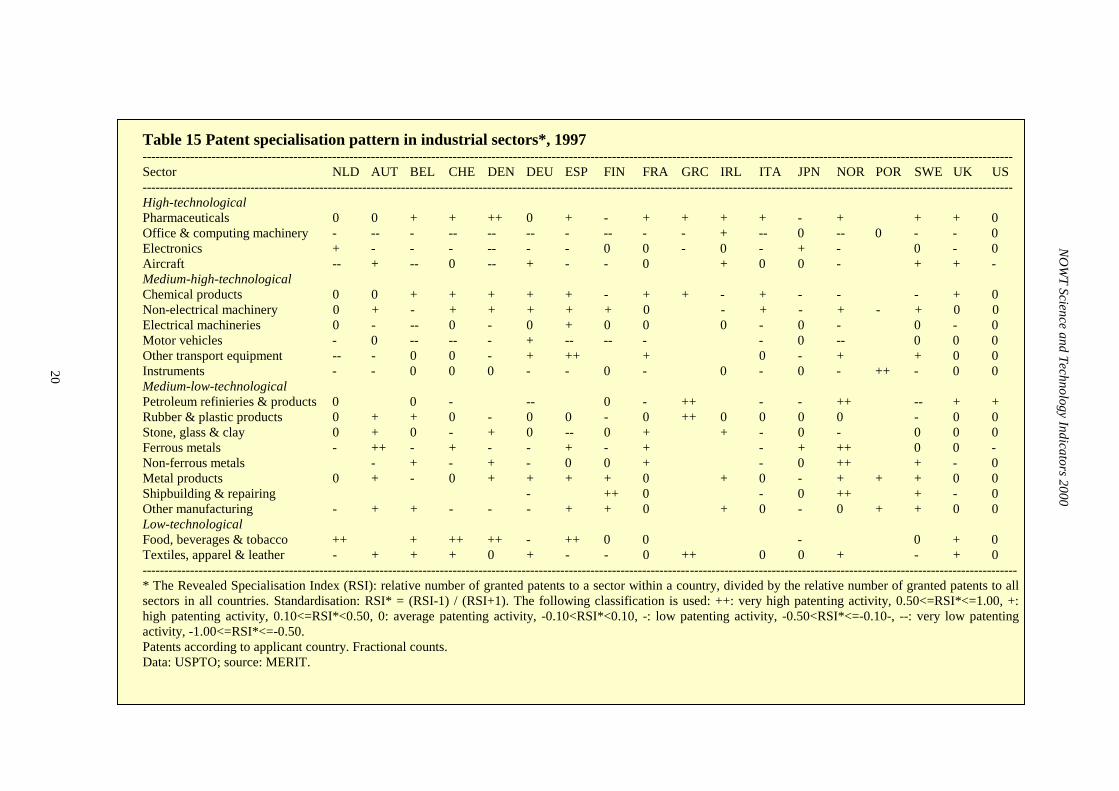
Table 15 Patent specialisation pattern in industrial sectors*, 1997 ---------------------------------------------------------------------------------------------------------------------------------------------------------------------------------------------------------- Sector NLD AUT BEL CHE DEN DEU ESP FIN FRA GRC IRL ITA JPN NOR POR SWE UK US ---------------------------------------------------------------------------------------------------------------------------------------------------------------------------------------------------------- High-technological Pharmaceuticals 0 0 + + ++ 0 + - + + + + - + + + 0 Office & computing machinery - -- - -- -- -- - -- - - + -- 0 -- 0 - - 0 Electronics + - - - -- - - 0 0 - 0 - + - 0 - 0 Aircraft -- + -- 0 -- + - - 0 + 0 0 - + + - Medium-high-technological Chemical products 0 0 + + + + + - + + - + - - - + 0 Non-electrical machinery 0 + - + + + + + 0 - + - + - + 0 0 Electrical machineries 0 - -- 0 - 0 + 0 0 0 - 0 - 0 - 0 Motor vehicles - 0 -- -- - + -- -- - - 0 -- 0 0 0 Other transport equipment -- - 0 0 - + ++ + 0 - + + 0 0 Instruments - - 0 0 0 - - 0 - 0 - 0 - ++ - 0 0 Medium-low-technological Petroleum refinieries & products 0 0 - -- 0 - ++ - - ++ -- + + Rubber & plastic products 0 + + 0 - 0 0 - 0 ++ 0 0 0 0 - 0 0 Stone, glass & clay 0 + 0 - + 0 -- 0 + + - 0 - 0 0 0 Ferrous metals - ++ - + - - + - + - + ++ 0 0 - Non-ferrous metals - + - + - 0 0 + - 0 ++ + - 0 Metal products 0 + - 0 + + + + 0 + 0 - + + + 0 0 Shipbuilding & repairing - ++ 0 - 0 ++ + - 0 Other manufacturing - + + - - - + + 0 + 0 - 0 + + 0 0 Low-technological Food, beverages & tobacco ++ + ++ ++ - ++ 0 0 - 0 + 0 Textiles, apparel & leather - + + + 0 + - - 0 ++ 0 0 + - + 0 ----------------------------------------------------------------------------------------------------------------------------------------------------------------------------------------------------------- * The Revealed Specialisation Index (RSI): relative number of granted patents to a sector within a country, divided by the relative number of granted patents to allsectors in all countries. Standardisation: RSI* = (RSI-1) / (RSI+1). The following classification is used: ++: very high patenting activity, 0.50<=RSI*<=1.00, +:high patenting activity, 0.10<=RSI*<0.50, 0: average patenting activity, -0.10<RSI*<0.10, -: low patenting activity, -0.50<RSI*<=-0.10-, --: very low patentingactivity, -1.00<=RSI*<=-0.50. Patents according to applicant country. Fractional counts. Data: USPTO; source: MERIT.
NOWT Science and Technology Indicators 2000
21
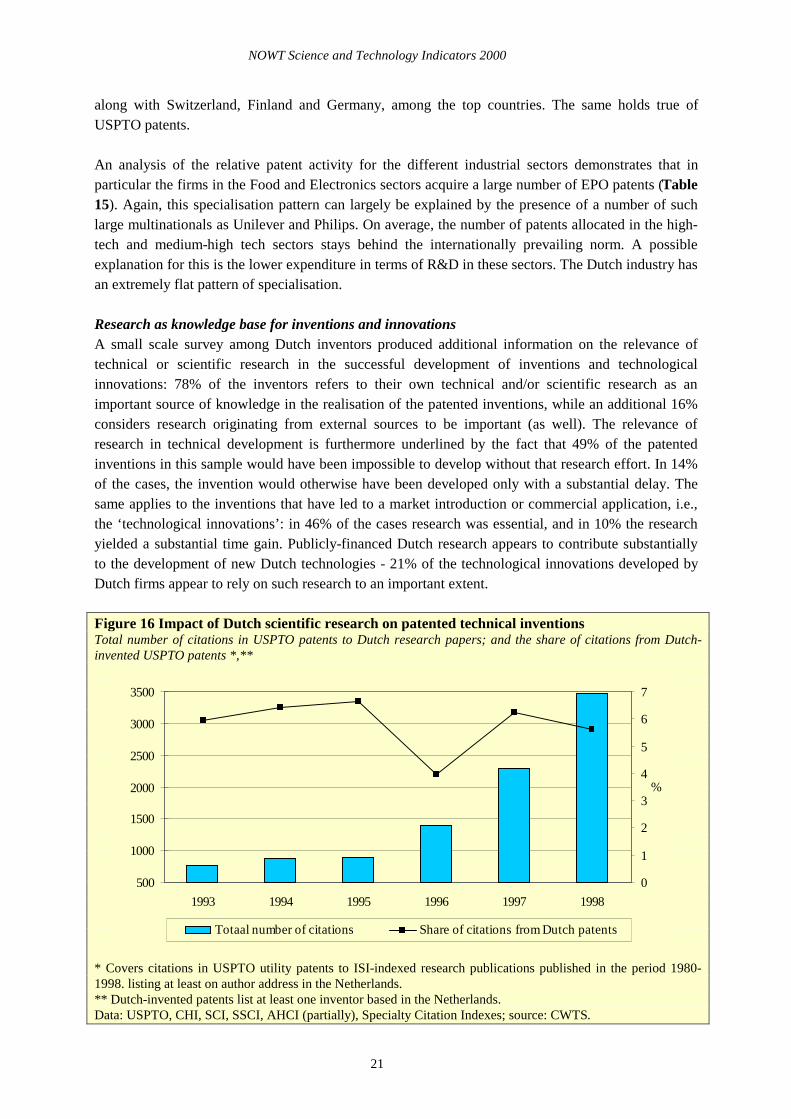
along with Switzerland, Finland and Germany, among the top countries. The same holds true of USPTO patents. An analysis of the relative patent activity for the different industrial sectors demonstrates that in particular the firms in the Food and Electronics sectors acquire a large number of EPO patents (Table 15). Again, this specialisation pattern can largely be explained by the presence of a number of such large multinationals as Unilever and Philips. On average, the number of patents allocated in the high-tech and medium-high tech sectors stays behind the internationally prevailing norm. A possible explanation for this is the lower expenditure in terms of R&D in these sectors. The Dutch industry has an extremely flat pattern of specialisation. Research as knowledge base for inventions and innovations A small scale survey among Dutch inventors produced additional information on the relevance of technical or scientific research in the successful development of inventions and technological innovations: 78% of the inventors refers to their own technical and/or scientific research as an important source of knowledge in the realisation of the patented inventions, while an additional 16% considers research originating from external sources to be important (as well). The relevance of research in technical development is furthermore underlined by the fact that 49% of the patented inventions in this sample would have been impossible to develop without that research effort. In 14% of the cases, the invention would otherwise have been developed only with a substantial delay. The same applies to the inventions that have led to a market introduction or commercial application, i.e., the ‘technological innovations’: in 46% of the cases research was essential, and in 10% the research yielded a substantial time gain. Publicly-financed Dutch research appears to contribute substantially to the development of new Dutch technologies - 21% of the technological innovations developed by Dutch firms appear to rely on such research to an important extent. Figure 16 Impact of Dutch scientific research on patented technical inventions Total number of citations in USPTO patents to Dutch research papers; and the share of citations from Dutch-invented USPTO patents *,** * Covers citations in USPTO utility patents to ISI-indexed research publications published in the period 1980-1998. listing at least on author address in the Netherlands. ** Dutch-invented patents list at least one inventor based in the Netherlands. Data: USPTO, CHI, SCI, SSCI, AHCI (partially), Specialty Citation Indexes; source: CWTS.
500
1000
1500
2000
2500
3000
3500
1993 1994 1995 1996 1997 1998
0
1
2
3
4
5
6
7
%
Totaal number of citations Share of citations from Dutch patents
NOWT Science and Technology Indicators 2000
22
Patents contain explicit references to technical-scientific source documents describing inputs and
background material relevant to the development of the inventions and the claims made in the patent.
A quantitative analysis of all technical inventions patented in the United States shows that the number
of such “patent citations” to Dutch research publications has increased by a factor 4.5 during a 6-year
time interval reaching a level of 3500 citations in 1998 (Figure 16). About 7% of these citations
originate from the mere 2% of citing patents allocated to Dutch firms or institutions indicating a
relatively strong domestic knowledge transfer effect. Dutch research appears to plays a considerable
role in both the national and international exploitation of scientific knowledge.
A large fraction of the patents citing Dutch research papers deal with inventions with medical and/or
pharmaceutical applications. In fact, the share of these patents has increased from 31% to 44%
between 1993-98. As a result, the majority of the citations refer to Dutch research in the biomedical
and life sciences.
NOWT Science and Technology Indicators 2000
23
List of abbreviations ACTA Academic Centre of Dentistry Amsterdam AHCI Arts & Humanities Citation Index AUT Austria BEL Belgium BPRC Biomedical Primate Research Centre CBS Statistics Netherlands CHE Switzerland CHI CHI Research CLB Central Lab Blood Research - Sanguin CWI National Research Institute for Mathematics and Computer Science CWTS Centre for Science and Technology Studies DEU Germany DLO Agricultural Research Department DNK Denmark EC European Commission ECN Netherlands Energy Research Foundation EPO European Patent Office ESA European Space Agency-Estec ESP Spain EU European Union EUR Erasmus University Rotterdam FIN Finland FOM Research Institutes of Foundation of Fundamental Research on Matter FP Framework Programme FRA France GD GeoDelft GDP Gross Domestic Product GRC Greece GTIs Large Technological Institutes ICIN Interuniversity Cardiology Research Institute Netherlands IOI Netherlands Ophthalmology Research Institute IRL Ireland ISI Institute for Scientific Information ITA Italy JPN Japan KNAW Royal Netherlands Academy of Arts and Sciences KNMI Royal Netherlands Meteorology Institute KUB Tilburg University KUN University of Nijmegen LEI Leiden University LUW Agricultural University Wageningen MARIN Maritime Research Institute Netherlands MERIT Maastricht Economic Research Institute on Innovation and Technology NIH Netherlands Institute Brain Research NIOB Netherlands Institute for Developmental Biology NIOO Netherlands Institute Ecological Research NIOZ Netherlands Institute of Sea Research NIVEL Netherlands Institute Primary Health Care NIZO Netherlands Institute for Dairy Research NKI Netherlands Cancer Institute NLD The Netherlands NLR National Aerospace Laboratory NOR Norway NOWT Netherlands Observatory on Science and Technology NSE Natural Sciences and Engineering NWO Netherlands Organization for Scientific Research OECD Organisation for Economic Co-operation and Development PRT Portugal RIZA Institute Inland Water Management & Waste Water Treatment RIVM National Institute of Public Health & Environmental Research RUG University of Groningen R&D Research and Development S&T Science and Technology SCI Science Citation Index SME Small or medium-sized enterprise Solvay Solvay Pharmaceuticals
NOWT Science and Technology Indicators 2000
24
SRON Space Research Organisation Netherlands SSH Social Sciences and Humanities SSCI Social Sciences Citation Index SWE Sweden TNO Netherlands Organization for Applied Scientific Research TUD Delft University of Technology TUE Eindhoven University of Technology VSNU Association of Universities in the Netherlands UK United Kingdom UM Maastricht University US United States USPTO United States Patent and Trademark Office UT University of Twente UU Utrecht University UvA Universiteit van Amsterdam VU Vrije Universiteit Amsterdam WL Delft Hydraulics WUR Wageningen University and Research Centre