Embed Size (px)
Citation preview

Science of the Total Environment 693 (2019) 133642
Contents lists available at ScienceDirect
Science of the Total Environment
j ourna l homepage: www.e lsev ie r .com/ locate /sc i totenv
Review
Environmental footprint family to address local to planetarysustainability and deliver on the SDGs
Davy Vanham a,⁎, Adrian Leip a, Alessandro Galli b, Thomas Kastner c, Martin Bruckner d, Aimable Uwizeye e,f,g,Kimo van Dijk h, Ertug Ercin q, Carole Dalin i, Miguel Brandão j, Simone Bastianoni k, Kai Fang l, Allison Leach m,Ashok Chapagain n, Marijn Van der Velde a, Serenella Sala a, Rana Pant a, Lucia Mancini a,Fabio Monforti-Ferrario a, Gema Carmona-Garcia a, Alexandra Marques a, Franz Weiss a, Arjen Y. Hoekstra o,p
a European Commission, Joint Research Centre (JRC), Ispra, Italyb Global Footprint Network, 18 Avenue Louis-Casai, 1219 Geneva, Switzerlandc Senckenberg Biodiversity and Climate Research Centre (SBiK-F), Senckenberganlage 25, 60325 Frankfurt am Main, Germanyd Vienna University of Economics and Business (WU), Institute for Ecological Economics, Welthandelsplatz 1, 1020 Vienna, Austriae Food and Agriculture Organization of the United Nations, Animal Production and Health Division, Viale delle Terme di Caracalla, 00153 Rome, Italyf Animal Production Systems group, Wageningen University & Research, PO Box 338, 6700 AH Wageningen, the Netherlandsg Teagasc – Crops, Environment and Land Use Programme, Johnstown Castle, Wexford, Irelandh European Sustainable Phosphorus Platform (ESSP), Avenue du Dirigeable 8, 1170 Brussels, Belgiumi Institute for Sustainable Resources, Bartlett School of Environment, Energy and Resources, University College London, WC1H 0NN London, UKj KTH – Royal Institute of Technology, Department of Sustainable Development, Environmental Science and Engineering, Stockholm SE-100 44, Swedenk Ecodynamics Group – Department of Earth, Environmental and Physical Sciences, University of Siena, Pian dei Mantellini 44, 53100 Siena, Italyl School of Public Affairs, Zhejiang University, 310058 Hangzhou, Chinam Department of Natural Resources, The Environment and The Sustainability Institute, University of New Hampshire, Durham, NH, USAn University of Free State, 205 Nelson Mandela Dr, Park West, Bloemfontein 9301, South Africao Twente Water Centre, University of Twente, P.O. Box 217, Enschede, Netherlandsp Institute of Water Policy, Lee Kuan Yew School of Public Policy, National University of Singapore, Singaporeq R2Water Research and Consultancy, Amsterdam, Netherlands
H I G H L I G H T S G R A P H I C A L A B S T R A C T
• We define a family of environmentalfootprints.
• We identify overlaps between differentfootprints.
• We analyse how they relate to the nineplanetary boundaries.
• We discuss the relation with SDGs,WEFE nexus and ecosystem services.
• We argue that the footprint family is aflexible framework.
⁎ Corresponding author.E-mail addresses: [email protected], davy.va
https://doi.org/10.1016/j.scitotenv.2019.1336420048-9697/© 2019 The Authors. Published by Elsevier B.V
a b s t r a c t
a r t i c l e i n f oArticle history:Received 26 June 2019
[email protected] (D. Vanham).
. This is an open access article under the CC BY-NC-ND license (http://creativecommons.org/licenses/by-nc-nd/4.0/).

2 D. Vanham et al. / Science of the Total Environment 693 (2019) 133642
Received in revised form 26 July 2019Accepted 26 July 2019Available online 29 July 2019
Editor: Damia Barcelo
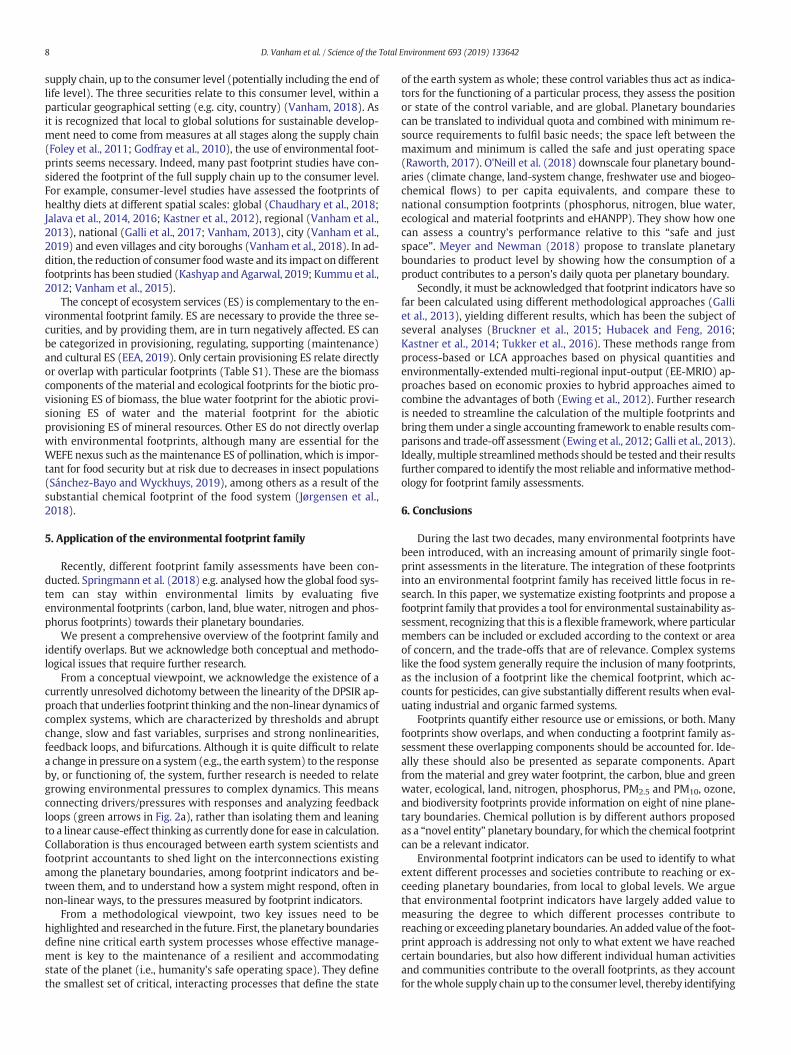
Fig. 1.Number of documents published (Y-axis) on enviroIndex (SSCI). Footprints are depicted in different panels dupublications and (c) umbrella terms “environmental footpomitted.
The number of publications on environmental footprint indicators has been growing rapidly, but with limited ef-forts to integrate different footprints into a coherent framework. Such integration is important for comprehensiveunderstanding of environmental issues, policy formulation and assessment of trade-offs between different envi-ronmental concerns. Here, we systematize published footprint studies and define a family of footprints that canbe used for the assessment of environmental sustainability. We identify overlaps between different footprintsand analyse how they relate to the nine planetary boundaries and visualize the crucial information they providefor local and planetary sustainability. In addition, we assess how the footprint family delivers onmeasuring prog-ress towards Sustainable Development Goals (SDGs), considering its ability to quantify environmental pressuresalong the supply chain and relating them to thewater-energy-food-ecosystem (WEFE) nexus and ecosystem ser-vices. We argue that the footprint family is a flexible framework where particular members can be included orexcluded according to the context or area of concern. Our paper is based upon a recent workshop bringing to-gether global leading experts on existing environmental footprint indicators.© 2019 The Authors. Published by Elsevier B.V. This is an open access article under the CC BY-NC-ND license (http://
creativecommons.org/licenses/by-nc-nd/4.0/).
Keywords:FootprintEnvironmental footprintEnvironmental footprint assessmentFamilyFootprint familyPlanetary boundaries
Contents
1. Introduction . . . . . . . . . . . . . . . . . . . . . . . . . . . . . . . . . . . . . . . . . . . . . . . . . . . . . . . . . . . . . . . 22. Systematization of footprints in the context of environmental concerns and local to planetary boundaries . . . . . . . . . . . . . . . . . . . . . 3
2.1. Environmental footprints . . . . . . . . . . . . . . . . . . . . . . . . . . . . . . . . . . . . . . . . . . . . . . . . . . . . . . 32.2. Planetary boundaries . . . . . . . . . . . . . . . . . . . . . . . . . . . . . . . . . . . . . . . . . . . . . . . . . . . . . . . . 32.3. Systematization and relationship with planetary boundaries . . . . . . . . . . . . . . . . . . . . . . . . . . . . . . . . . . . . . . 42.4. Footprint terminology in other indicators . . . . . . . . . . . . . . . . . . . . . . . . . . . . . . . . . . . . . . . . . . . . . . . 7
3. Environmental footprints and Sustainable Development Goals (SDGs) . . . . . . . . . . . . . . . . . . . . . . . . . . . . . . . . . . . . . 74. Environmental footprints and the water-energy-food-ecosystem (WEFE) nexus . . . . . . . . . . . . . . . . . . . . . . . . . . . . . . . . . 75. Application of the environmental footprint family . . . . . . . . . . . . . . . . . . . . . . . . . . . . . . . . . . . . . . . . . . . . . . 86. Conclusions. . . . . . . . . . . . . . . . . . . . . . . . . . . . . . . . . . . . . . . . . . . . . . . . . . . . . . . . . . . . . . . . 8Conflict of interest . . . . . . . . . . . . . . . . . . . . . . . . . . . . . . . . . . . . . . . . . . . . . . . . . . . . . . . . . . . . . . . 10References. . . . . . . . . . . . . . . . . . . . . . . . . . . . . . . . . . . . . . . . . . . . . . . . . . . . . . . . . . . . . . . . . . . 10
1. Introduction
Since the introduction of the first footprint metric, the ecologicalfootprint in 1996 (Wackernagel and Rees, 1996), many other footprintshave emerged in the literature (Galli, 2015a) and the number of paperswith the topic “footprint” has been growing steadily (Fig. 1). Most ofthose papers have focussed on carbon (Wiedmann and Minx, 2008),
nmental footprints from 1996 to 201e to the differentmagnitude of the nurint” and “footprint family”. Publicati
water (Hoekstra and Mekonnen, 2012) and ecological (Wackernagelet al., 2002) footprints. Other footprints, with less publications untiltoday, include the land (Kastner et al., 2012; O'Brien et al., 2015;Weinzettel et al., 2013), nitrogen (Galloway et al., 2014; Leach et al.,2012; Oita et al., 2016), phosphorus (Wang et al., 2011), material(Giljum et al., 2015, 2016; Wiedmann et al., 2015), biodiversity(Lenzen et al., 2012), chemical (Hitchcock et al., 2012; Sala and
8 (X-axis) in Science Citation Index Expanded (SCI-EXPANDED) or Social Sciences Citationmber of documents: (a) the threemost published footprints; (b) other footprints with lessons using terms close to “footprint”, such as “embedded resource” or “virtual resource”, are

Table 1Acronyms with definition.
Acronym Definition
EC European CommissionEE-MRIO Environmentally-extended multi-regional input-outputEFA Environmental footprint assessmentES Ecosystem servicesFP Footprintgha Global hectaresGHG Greenhouse gasesHANPP Human appropriation of net primary productionIEAG-SDGs Inter-Agency Expert Group on SDG indicatorsLCA Life cycle assessmentLCI Life cycle inventoryLCIA Life cycle impact assessmentN NitrogenOEF Organisation environmental footprintP PhosphorusPEF Product environmental footprintPM Particulate matterSDG Sustainable Development GoalUN United NationsWEF nexus Water-energy-food nexusWEFE nexus Water-energy-food-ecosystem nexus
3D. Vanham et al. / Science of the Total Environment 693 (2019) 133642
Goralczyk, 2013) PM2.5 (Yang et al., 2018), PM10 (Moran et al., 2013),ozone (Meyer and Newman, 2018) and energy (Onat et al., 2015;Wiedmann, 2009) footprints.
The term “environmental footprint” is an umbrella term for the dif-ferent footprint concepts that have been developed during the past twodecades (Fang et al., 2016; Hoekstra and Wiedmann, 2014). The termi-nology is also used in the Life Cycle Assessment (LCA)-based productand organisation environmental footprint of the European Commission(EC, 2013).
Despite the growing interest around footprint indicators, relativelylittle research has focussed on integrating multiple footprints, whichcan together be referred to as the “footprint family” (Fang et al., 2014,2016; Galli et al., 2012; Leach et al., 2016). Only 28 papers were pub-lished on this topic by the end of 2018, dwarfed by the 6735 studiespublished on primarily individual footprints (Fig. 1).
For integrated environmental assessments, scientific analyses, policyformulation, integrated policy decisions, and understanding trade-offs,different environmental footprints need to be studied simultaneously(Dalin and Rodríguez-Iturbe, 2016; Galli et al., 2012; Wiedmann andLenzen, 2018). For example, replacing fossil by bio-energymight reducea carbon footprint but will inevitably increase land andwater footprints(Mekonnen et al., 2016). Footprint-family analyses are particularlysuited to account for such trade-offs. Here, we aim to define the envi-ronmental footprint family. We limit our discussion to environmentalfootprints, thus excluding footprints related to the two other pillars ofsustainability, as few footprints addressing social and economic issuesexist and, inmost cases, they have unclear definitions and limited appli-cations (Galli, 2015a).
The aim of our paper is to systematize the existing environmentalfootprints, and in doing so, to bring clarity into the crowdedfield of foot-print studies. We identify overlaps between different footprint indica-tors, analyse how they relate to planetary boundaries (Rockstromet al., 2009; Steffen et al., 2015), and identify whether they canmeasureprogress towards achieving the Sustainable Development Goals (SDGs)and address the water-energy-food-ecosystem (WEFE) nexus.
A limited amount of papers on the footprint family have been pub-lished. Hoekstra and Wiedmann (2014) and Čuček et al. (2015)reviewed current environmental footprints and reviewed global esti-mates of footprint scores relative to planetary boundaries, without theconsideration of local sustainability that requires specific environmentalfootprints to remain within local boundaries. Čuček et al. (2012) andFang et al. (2016) focused on the typology of environmental, socialand economic footprints, but did not relate them tomonitoring progresstowards the SDGs or the WEFE nexus. Galli et al. (2012) and Fang et al.(2014) constituted different sets of a footprint family and called for ashift of focus from assessing single footprints in isolation to integratingdiverse footprints from a systemic perspective, but both of them in-cluded only few footprints. The main added value of this paper is thesystematization of the environmental footprint family and the discus-sion of its role in addressing local to planetary sustainability, measuringprogress towards the SDGs and analyzing theWEFE nexus. Our paper isbased upon a recently organized workshop at the Joint Research Centrein Ispra, Italy, which brought together, for the very first time, 23 globalleading experts on existing footprint indicators, from 17 differentinstitutions.
For clarity, Table 1 shows a list of the acronyms we use.
2. Systematization of footprints in the context of environmentalconcerns and local to planetary boundaries
2.1. Environmental footprints
Footprints are indicators of pressure of human activities on the envi-ronment. Footprint quantification is based on life cycle thinking alongthe whole supply chain (from producer to consumer, and sometimesto waste management) and aims to give a comprehensive picture of
the quantified pressure. Each footprint focuses on a particular environ-mental concern, and measures either resource appropriation or pollu-tion/waste generation, or both (Hoekstra and Wiedmann, 2014).
Footprints quantify pressure along the supply chain, with as basisunit footprints (Hoekstra and Wiedmann, 2014). A “unit footprint” isthe footprint of a single process or activity and forms the basic buildingblock for the footprint of a product, consumer, or producer or for thefootprint within a certain geographical area. As such, footprints can bequantified for products at any stage of the supply chain, for companiesor economic sectors. They can also be used for individuals or communi-ties (as end consumers) or from the smallest geographical areas (suchas streets or villages) up to the global level. This provides communica-tion with a broad variety of stakeholders, from civil society individualsto industrial stakeholders and decision makers, up to policy makers(Hoekstra and Wiedmann, 2014).
Environmental Footprint Assessment (EFA) and Life Cycle Assess-ment (LCA) are both based upon life cycle thinking but differ in aimand approach. Environmental footprints are resource use and emissionsoriented, combined referred to as pressure oriented, whereas LCA is im-pact oriented. Pressure indicators are different from impact indicators,as they inform users on the pressure human activities place on ecosys-tems (e.g., the land used to produce a crop) rather than on the potentialconsequences (impact) due to such pressure (Fig. 2a). Some footprints,such as the water footprint, however, can include an impact phase intheir full assessment (Hoekstra et al., 2011). Here, we focus on environ-mental footprints as employed in EFA, not their uptake and use in LCA.
2.2. Planetary boundaries
Rockstrom et al. (2009) and Steffen et al. (2015) identified nine crit-ical processes that regulate the Earth system functioning. For each ofthese critical processes, they proposed a main control variable and de-fined boundaries that should not be exceeded to keep the Earth systemin a safe operating space, recognizing though the complexity of theEarth Systemand the interaction between critical processes. In a prelim-inary assessment, Steffen et al. (2015) found that, due to human activi-ties, four of these boundaries are violated: climate change, biosphereintegrity, biogeochemical flows (nitrogen and phosphorus), and landsystem change, whereby the perturbations of biogeochemical flowsand genetic diversity are even beyond the zone of uncertainty. Researchon planetary boundaries is in its infancy, so considerable progress is tobe expected in this field in the near future.

Fig. 2. a) Linear representation of the DPSIR framework (drivers, pressure, state, impact and response) (OECD, 2003) and its theoretical relationship with environmental footprints andimpact indicators. Since recently, some authors (Verones et al., 2017) also use the terminology “impact footprints” as relating to impact indicators, in addition to the pressure-relatedfootprints we describe here. b) Correspondence of existing footprint indicators with the nine planetary boundaries, with visualization of overlap between different footprints. Fanget al. (2015) already included chemical pollution as planetary boundary (novel entity) with related chemical footprint. The material and grey water footprints do not corresponddirectly to a planetary boundary. FP=Footprint.
4 D. Vanham et al. / Science of the Total Environment 693 (2019) 133642
Environmental footprint indicators measure natural resources useand emissions while the planetary boundaries provide levels of pertur-bation that are believed to ensure that the Earth System is kept inHolocene-like conditions that are favourable for humanity. It is possibleto reconcile the two and show how the existing footprint indicatorscould be used to measure the extent to which Earth System processesare being disturbed by human activities and thus planetary boundariesapproached.
2.3. Systematization and relationship with planetary boundaries
Environmental footprints measure either resource use or emissions,or both (Table 2). In the first case, they account for the amount of re-sources used to produce the goods and services human societies con-sume; in the second case, they account for the amount of pollutantsemitted to the environment due to humanproduction and consumptionactivities (Fang et al., 2016).
Fang et al. (2015) presented a preliminary thematic matching ofsome environmental footprints and planetary boundaries, and con-cluded multiple matchings. This is due to overlaps between differentfootprints, a matter we analyse in detail here as listed in Table 2 and vi-sually presented in Fig. 2b.
Earth system processes operate across scales, from local catchmentsor biomes up to the level of the earth system as awhole. The focus of en-vironmental footprints on resources use and emissions caused byhuman activitiesmakes them relevant also for assessing local processes.While the estimation of planetary boundaries by Rockstrom et al.(2009) was based on global analyses, the authors recognized that thecontrol variables for many processes are spatially heterogeneous.Steffen et al. (2015) therefore refined the methodology and developedglobal planetary boundaries taking into account also regional-levelboundaries. Planetary boundaries, which are based on regional assess-ment, are biodiversity integrity, freshwater use, earth surface change(land use change), biogeochemical flows and atmospheric aerosol load-ing (Fig. 2b and Table 2). The planetary boundaries for stratosphericozone depletion, ocean acidification and climate change are only rele-vant at a global scale, although the related impacts can be locally verydifferent.
The carbon footprint (or greenhouse gas footprint (Čuček et al.,2015)) is an emission footprint, whichmeasures the emission of green-house gases (GHG) such as carbon dioxide (CO2), methane (CH4) andnitrous oxide (N2O) to the atmosphere. Conceptually the carbon foot-print also includes GHG emissions from land-use change, although inpractice this is not always the case.

Table 2Framework for the systematization of footprints, based on their environmental concern and scope (measuring resource use/emissions) (first four columns), identification of overlaps (col-umn 5) and descriptive relationships between existing environmental footprints and the nine planetary boundaries (columns 6 and 7). A distinction is made between planetary bound-aries and local thresholds. The footprints can show which human activities contribute to what degree to reaching or transgressing the global planetary boundary or local thresholds.FP=Footprint.
Environmental concern Pressures Impacts Overlaps Planetary boundary Local thresholds
Resource use Emissions
Climate change and oceanacidification
Carboncomponent of theecological FP
Carbon FP (anthropogenicgreenhouse gasemissions)
The N2O emissionscomponent isincluded in both thecarbon and nitrogenFP.Land for CO2
sequestration isincluded in ecologicalFP
In Steffen et al. (2015), theglobal boundary is set at350 ppm CO2 in theatmosphere, which relates to amaximum acceptable level ofglobal warming, and can betranslated back to a maximumacceptable carbon FP.
Not applicable
Maximum level of oceanacidification (resulting fromCO2), to be translated back to amaximum acceptable carbonfootprint
Not applicable
Water scarcity and waterpollution
Green and bluewater FP
Grey water FP Blue waterstress andwaterpollution, thesecond stagein water FPassessment
The nitrogen andphosphorus relatedgrey water FPs arealso represented inthe nitrogen andphosphorus FPs,respectively.The chemical FPaccounts for aquaticpollution
Blue water FP: Limitedaggregate global accessible bluewater availabilityGreen water FP: Limitedaggregate global green wateravailability, as proposed bySchyns et al. (2019)
Limited monthly blueand green wateravailability percatchment; limitedassimilation capacityfor grey water FP
Landappropriation/availability
Land FP biomasscomponents ofthe ecological FP
Land FP is part ofecological FPGreen water FP isbound to land use,but accounts fordifferent resource
In Steffen et al. (2015), theglobal threshold is defined at75% of original forest coverremaining for three biomes(tropical, temperate, boreal),calculated as a weightedaverage of the boundaries perbiome.
Limited bioproductivearea per biome orecoregion
Nitrogen use and pollution Nitrogen inputFP, used by someauthors (Vanhamet al., 2015)
Nitrogen FP (total lossesof N to the environment,including reactivenitrogen compounds(NH3, NOx, N2O, nitrates,and organic nitrogen) andN2).
Nitrogen waterpollution isrepresented in thegrey water FP.The component N2Ois included in boththe carbon andnitrogen FPs.Nitrogen andchemical FPs accountfor aquatic Npollution as well asatmosphericpollution of NOx andNH3
Nitrogen and ozoneFP arecomplementary, asthey account fordifferent ozonedepleting gases
Limited aggregated assimilationcapacity
Limited assimilationcapacity of theenvironment forreactive N losses towater bodies percatchment and to theatmosphere
Maximum level of acceptablestratospheric ozone depletion,to be translated back tomaximum N2O emission
Not applicable
Phosphorus use andpollution
Phosphorus inputFP
Phosphorus to waterbodies FP
Phosphorus waterpollution isrepresented in thegrey water FP.Phosphorus andchemical FPs accountfor aquatic P pollution
Limited aggregated assimilationcapacity
Limited assimilationcapacity of theenvironment for Ppollution percatchment
Biodiversity loss Indicator“biodiversityloss”, oftenreferred to asbiodiversityfootprint
Biodiversity loss is aresult of differentpressures (FPs)
Global biosphere integrity(genetic, functional diversity)
Local biosphereintegrity (genetic,functional diversity)
Chemical pollution Chemical FP (emission ofchemical substances intowater, air or soil)
Certainapproachesquantifyimpact (Zijp
Water relatedpollution is alsorepresented in thegrey water FP.
Limited aggregated assimilationcapacityWould fit under “novel entities”
Limited assimilationcapacity of theenvironment forchemical pollution
(continued on next page)
5D. Vanham et al. / Science of the Total Environment 693 (2019) 133642

Table 2 (continued)
Environmental concern Pressures Impacts Overlaps Planetary boundary Local thresholds
Resource use Emissions
et al., 2014) Nitrogen andchemical FPs accountfor aquatic Npollution as well asatmosphericpollution of NOx andNH3
Chemical FP includesPM2.5 and PM10
pollution
per catchment, to thesoil and theatmosphereWould fit under“novel entities”
Particulate concentration ofaerosols in theatmosphere
PM2.5 and PM10 FPs PM2.5 and PM10
pollution are includedin chemical FP
Atmospheric aerosol loading Atmospheric aerosolloading
Ozone depletion Ozone FP (Meyer andNewman, 2018)
Ozone and nitrogenFP arecomplementary, asthey account fordifferent ozonedepleting gases
Maximum level of acceptablestratospheric ozone depletion,to be translated back tomaximum ozone-depleting gasemissions
Not applicable
Material extraction Material FP(EUROSTAT,2018) (use ofmaterials: fossilfuels, metal ores,minerals, bioticresources)
Material FP accountsfor P and N fertilizeruse (resource usecomponent of P and NFPs)Material FP includesbiomass, also part ofecological FPMaterial FP includesfossil fuels asresource use, not aspollution. So nooverlap with carbonFP.
Currently no planetaryboundary identified, butproposed by some scholars forbiomass
6 D. Vanham et al. / Science of the Total Environment 693 (2019) 133642
The water footprint measures both the consumption of fresh wateras a resource and the use of fresh water to assimilate waste, where thelatter component is referred to as grey water footprint (Hoekstra andMekonnen, 2012). Water resources include both blue and green water(Rockström et al., 2009).
The ecological footprint measures the appropriation of land to bothproduce renewable biomass resource and uptakewaste via CO2 seques-tration (Borucke et al., 2013). These demands are expressed inbioproductive land-equivalent units (expressed in global hectares orgha) (Galli, 2015b) and compared with the bioproductive hectare-equivalents available within a given territory to provide insights on agiven country's over or under use of its ecological assets' regenerativecapacity (Wackernagel et al., 2002).
The land footprint measures the amount of land required for thesupply of food, materials, energy and infrastructure, expressed in phys-ical hectares (MacDonald et al., 2015; Thomas et al., 2014) (or km2) orequivalent land units (i.e. global hectares) (Wackernagel et al., 2002;Weinzettel et al., 2013).
Nitrogen and phosphorus are essential nutrients for all living organ-isms, but their abundant utilization for human prosperity contributes toseveral environmental impacts such as climate change, eutrophication,acidification and biodiversity loss (Erisman et al., 2008; Leip et al.,2015; Sutton et al., 2011). The nitrogen footprint measures the emis-sions of reactive N to the atmosphere and to water bodies. In severalstudies, the nitrogen footprint also includes emissions of N2, whichdoes not contribute to any environmental pressure and does not dependon a scarce resource (Peñuelas et al., 2013), but gives a measure for theanthropogenic mobilization of nitrogen (Pelletier and Leip, 2014). Thephosphorus footprint measures both the use of P as a resource and Plosses to water bodies. The former is very relevant as exploitable Pstocks (rock phosphate) are limited (Obersteiner et al., 2013; van Dijket al., 2016). The release of P from soils to the hydrosphere dependson several factors, in particular the soil type, which might be able to
bind a large share of P input and make it unavailable for both plant up-take and environmental losses (Zhang et al., 2017).
The chemical footprint (Hitchcock et al., 2012; Sala and Goralczyk,2013) accounts for all chemical substances released into the environ-ment which may ultimately lead to ecotoxicity and human toxicity im-pacts. A list of chemical substances is exhaustive, including pesticides orheavy metals.
The PM2.5 (Yang et al., 2018) and PM10 (Moran et al., 2013) foot-prints measure particulate matter pollution to the atmosphere. Theseare also included in the chemical footprint.
The ozone footprint (Meyer andNewman, 2018) proposed byMeyerand Newman measures emission of gases controlled or due to be con-trolled under the Montreal Protocol in terms of ozone depleting poten-tial weighted kilograms. As N2O, a major ozone-depleting gas, is notincluded in this protocol, this component of the nitrogen footprint iscomplementary to the ozone footprint in addressing the planetaryboundary stratospheric ozone depletion.
The material footprint (Wiedmann et al., 2015) measures the use ofmaterials from a consumption perspective, allocating all globally ex-tracted and used raw materials to domestic final demand (Giljumet al., 2015). It encompasses four material categories: metal ores, non-metallic minerals, fossil fuels and biomass (crops, crop residues, wood,wild fish catch, etc.). Material Footprint and other Material Flow-basedindicators have been widely used to support and monitor resource effi-ciency policy internationally. This is the case, for instance, of the EU Re-source Efficiency Initiative (Demurtas et al., 2015; EC, 2011).
Biodiversity loss measures impact as a result of different pressures,such as land andwater use or chemical pollution.Work on the biodiver-sity footprint is relatively young (e.g. Kitzes et al. (2017), Lenzen et al.(2012)) and no common unit of measure exists. Given the multiple di-mensions and complexities of biodiversity, a range of units will beneeded for a comprehensive picture of how consumption drives biodi-versity loss (Marques et al., 2017).

7D. Vanham et al. / Science of the Total Environment 693 (2019) 133642
Only in few cases, the currently proposed control variables of Steffenet al. (2015) are identical to environmental footprints. Regarding theplanetary boundary freshwater use, the global control variable “maxi-mum amount of consumptive blue water use” is identical to the bluewater footprint. The basin control variable, “blue water withdrawal aspercentage of mean monthly river flow”, is identical to the water foot-print, apart from the fact that the water footprint quantifies consump-tive water use and not water withdrawal. An unresolved issue infootprint studies so far is that of groundwater abstraction and use, andthe associated groundwater depletion, although recent work has quan-tified groundwater depletion associated with agricultural productsglobally (Dalin et al., 2017).
For some footprints, thresholds for local environmental problemsseem to be an equally relevant application as are planetary boundaries.For freshwater use, for example, Mekonnen and Hoekstra (2016) quan-tified local maximum blue water footprints based upon blue waterstress for grid cells of 30 × 30 arc min.
While the planetary boundaries framework does not explicitly in-clude materials, the definition of a safe operating space for material re-source use has been widely discussed in the literature. For instance,targets for biotic and abiotic resource consumption are proposed inBringezu (2015), Dittrich et al. (2012) and Mudgal et al. (2012) usingthe concept of human appropriation of net primary production(HANPP). Haberl et al. (2014) discuss upper limits of yearly biomassflows, which could support the planetary boundaries assessment.
In the interpretation of results related to the various planetaryboundaries (for example like in Fig. 2b), it is important to keep inmind that the planetary boundaries have not been designed to beused directly in a comparative context. Caution is appropriate whenassessing the relevance and urgency to tackle boundary issues basedon simply quantitatively comparing the results. For example, a 20%overshoot for one boundary does not necessarily mean it has to beless relevant than a 40% overshoot related to another boundary.Steffen et al. (2015) argue that two planetary boundaries – namely cli-mate change and biosphere integrity – have each the potential to pushthe Earth system out of the safe operating space alone. However, dueto the complex Earth system dynamics with feedbacks and interactionsacross all critical processes, only the safeguarding of all planetaryboundaries can ensure that the Earth system remains in the Holocenestate.
2.4. Footprint terminology in other indicators
Other indicators use the terminology footprint and are by their au-thors generally regarded as such, including the energy (Onat et al.,2015; Wiedmann, 2009) and emergy (Bastianoni et al., 2008; Odum,1988) footprints. The energy footprint is both expressed as the carboncomponent of the ecological footprint (Mancini et al., 2016;Wiedmann, 2009) or the amount of energy consumed along the supplychain (Onat et al., 2015). The emergy footprint relates to the latter anddeals with embedded primary solar energy equivalents, also referredto as “solar energy footprint”. Other related terminologies include thecumulative energy demand and embodied energy. The energy footprintin its variant ofmeasuring use of energy (Onat et al., 2015) aswell as theemergy footprint, do not correspond to a planetary boundary, becauseenergy availability in itself has not been considered thus far as a plane-tary boundary given the large amount of solar energy that the earth isreceiving, which can potentially be converted.
The terminology is also used in the Life Cycle Assessment (LCA)-based product and organisation environmental footprint of theEuropean Commission (EC, 2013). More particularly, the terminologiesProduct Environmental Footprint (PEF) and Organisation Environmen-tal Footprint (OEF) are used. Their overarching purpose is seeking to re-duce the environmental impacts of goods and services (PEF) andorganisations (OEF), respectively, taking into account the whole supplychain, as multi-criteria measures. As LCA measures, they include a life
cycle inventory (LCI) and life cycle impact assessment (LCIA) phase.As such, they can be regarded as complementary indicators to the foot-print family we describe here. In the LCIA phase, the PEF and OEF usemore than 15 different impact categories, including (aquatic freshwater) ecotoxicity and human toxicity (cancer and non-cancer effects)(EC, 2013; Sala et al., 2019). Each impact category is using specific indi-cators of impact. For example for ecotoxicity, the indicator could beexpressed in cumulative toxic units, namely the result of themultiplica-tion of themass -resulting froma fatemodelling of the chemical emittedin a certain compartment- by the exposure potential and the toxicityexerted by the chemical. This allows highlighting which chemicalshave the potential to contribute the most to the overall impact.
As environmental footprints quantify pressure (resource use and/orpollution), they do not quantify human and ecotoxicity. In a further im-pact assessment phase, environmental footprints can contribute to ad-dress human and ecotoxicity.
3. Environmental footprints and Sustainable Development Goals(SDGs)
In September 2015, heads of United Nations member states fromaround the world adopted the 2030 Agenda for Sustainable Develop-ment, consisting of 17 SDGs and 169 targets, monitored by means of230 individual indicators. These indicators, identified and proposed bythe Inter-Agency Expert Group on SDG indicators (IEAG-SDGs), wereagreed upon by the 47th Session of the UN Statistical Commission inMarch 2016. Of the different environmental footprints, the materialfootprint is the only one included as an official SDG indicator (number8.4.1 as well as 12.2.1 and 12.2.2), although a few other SDG indicatorsrelate directly to other environmental footprint indicators (Table 3). In-dicator 11.6.2 for example accounts for annual mean levels of fine par-ticulate matter (e.g. PM2.5 and PM10) in cities (population weighted)and thereby directly relates to the PM2.5 and PM10 footprints. How-ever, these footprints measure particulatematter pollution to the atmo-sphere (Table 2), and are therefore not identical to indicator 11.6.2.Many SDG indicators relate indirectly to the environmental footprint in-dicators, but these are not discussed as the list would be too elaborate.As an example, all footprint indicators deal/relate with SDG 12 on sus-tainable consumption and production due to their producers and con-sumer approach, but among SDG12 indicators, apart from 12.2.1 and12.2.2, none relate directly to particular footprints. In addition, all foot-print indicators relate to target 8.4 on the improvement to global re-source efficiency in consumption and production.
4. Environmental footprints and the water-energy-food-ecosystem(WEFE) nexus
The WEFE nexus (Fig. 3) is being recognized as a conceptual frame-work for achieving sustainable development (Biggs et al., 2015), includ-ing by international institutions like the UN (FAO, 2019) and theEuropean Commission. It has become central to discussions regardingthe development and subsequent monitoring of the SDGs. The WEFEnexus is a cross-sectoral perspective, which requires that response op-tions go beyond traditional sectoral approaches. It means that thethree sectors or securities—water security, energy security and food se-curity (SDGs 6, 7 and 2)— are inextricably linked and that actions in onearea more often than not have impacts in one or both of the others(Hoff, 2011; Vanham, 2016). Ecosystems are central in providing thesethree securities through the services (and resources) they provide. Onthe other hand, they are heavily affected by the process of providingthese three basic human securities. Indeed, to achieve the SDGs, the im-portant trade-offs and synergies of the WEFE nexus need to beaccounted for.
Environmental footprints are indicators or tools that provide essen-tial information for an analysis of the WEFE nexus (Fig. 3). A particularstrength in their use is that they quantify pressure along the whole
8 D. Vanham et al. / Science of the Total Environment 693 (2019) 133642
supply chain, up to the consumer level (potentially including the end oflife level). The three securities relate to this consumer level, within aparticular geographical setting (e.g. city, country) (Vanham, 2018). Asit is recognized that local to global solutions for sustainable develop-ment need to come from measures at all stages along the supply chain(Foley et al., 2011; Godfray et al., 2010), the use of environmental foot-prints seems necessary. Indeed, many past footprint studies have con-sidered the footprint of the full supply chain up to the consumer level.For example, consumer-level studies have assessed the footprints ofhealthy diets at different spatial scales: global (Chaudhary et al., 2018;Jalava et al., 2014, 2016; Kastner et al., 2012), regional (Vanham et al.,2013), national (Galli et al., 2017; Vanham, 2013), city (Vanham et al.,2019) and even villages and city boroughs (Vanham et al., 2018). In ad-dition, the reduction of consumer foodwaste and its impact on differentfootprints has been studied (Kashyap and Agarwal, 2019; Kummu et al.,2012; Vanham et al., 2015).
The concept of ecosystem services (ES) is complementary to the en-vironmental footprint family. ES are necessary to provide the three se-curities, and by providing them, are in turn negatively affected. ES canbe categorized in provisioning, regulating, supporting (maintenance)and cultural ES (EEA, 2019). Only certain provisioning ES relate directlyor overlap with particular footprints (Table S1). These are the biomasscomponents of the material and ecological footprints for the biotic pro-visioning ES of biomass, the blue water footprint for the abiotic provi-sioning ES of water and the material footprint for the abioticprovisioning ES of mineral resources. Other ES do not directly overlapwith environmental footprints, although many are essential for theWEFE nexus such as the maintenance ES of pollination, which is impor-tant for food security but at risk due to decreases in insect populations(Sánchez-Bayo and Wyckhuys, 2019), among others as a result of thesubstantial chemical footprint of the food system (Jørgensen et al.,2018).
5. Application of the environmental footprint family
Recently, different footprint family assessments have been con-ducted. Springmann et al. (2018) e.g. analysed how the global food sys-tem can stay within environmental limits by evaluating fiveenvironmental footprints (carbon, land, blue water, nitrogen and phos-phorus footprints) towards their planetary boundaries.
We present a comprehensive overview of the footprint family andidentify overlaps. But we acknowledge both conceptual and methodo-logical issues that require further research.
From a conceptual viewpoint, we acknowledge the existence of acurrently unresolved dichotomy between the linearity of the DPSIR ap-proach that underlies footprint thinking and the non-linear dynamics ofcomplex systems, which are characterized by thresholds and abruptchange, slow and fast variables, surprises and strong nonlinearities,feedback loops, and bifurcations. Although it is quite difficult to relatea change in pressure on a system (e.g., the earth system) to the responseby, or functioning of, the system, further research is needed to relategrowing environmental pressures to complex dynamics. This meansconnecting drivers/pressures with responses and analyzing feedbackloops (green arrows in Fig. 2a), rather than isolating them and leaningto a linear cause-effect thinking as currently done for ease in calculation.Collaboration is thus encouraged between earth system scientists andfootprint accountants to shed light on the interconnections existingamong the planetary boundaries, among footprint indicators and be-tween them, and to understand how a system might respond, often innon-linear ways, to the pressures measured by footprint indicators.
From a methodological viewpoint, two key issues need to behighlighted and researched in the future. First, the planetary boundariesdefine nine critical earth system processes whose effective manage-ment is key to the maintenance of a resilient and accommodatingstate of the planet (i.e., humanity's safe operating space). They definethe smallest set of critical, interacting processes that define the state
of the earth system as whole; these control variables thus act as indica-tors for the functioning of a particular process, they assess the positionor state of the control variable, and are global. Planetary boundariescan be translated to individual quota and combined with minimum re-source requirements to fulfil basic needs; the space left between themaximum and minimum is called the safe and just operating space(Raworth, 2017). O'Neill et al. (2018) downscale four planetary bound-aries (climate change, land-system change, freshwater use and biogeo-chemical flows) to per capita equivalents, and compare these tonational consumption footprints (phosphorus, nitrogen, blue water,ecological and material footprints and eHANPP). They show how onecan assess a country's performance relative to this “safe and justspace”. Meyer and Newman (2018) propose to translate planetaryboundaries to product level by showing how the consumption of aproduct contributes to a person's daily quota per planetary boundary.
Secondly, it must be acknowledged that footprint indicators have sofar been calculated using different methodological approaches (Galliet al., 2013), yielding different results, which has been the subject ofseveral analyses (Bruckner et al., 2015; Hubacek and Feng, 2016;Kastner et al., 2014; Tukker et al., 2016). These methods range fromprocess-based or LCA approaches based on physical quantities andenvironmentally-extended multi-regional input-output (EE-MRIO) ap-proaches based on economic proxies to hybrid approaches aimed tocombine the advantages of both (Ewing et al., 2012). Further researchis needed to streamline the calculation of the multiple footprints andbring them under a single accounting framework to enable results com-parisons and trade-off assessment (Ewing et al., 2012; Galli et al., 2013).Ideally, multiple streamlinedmethods should be tested and their resultsfurther compared to identify themost reliable and informativemethod-ology for footprint family assessments.
6. Conclusions
During the last two decades, many environmental footprints havebeen introduced, with an increasing amount of primarily single foot-print assessments in the literature. The integration of these footprintsinto an environmental footprint family has received little focus in re-search. In this paper, we systematize existing footprints and propose afootprint family that provides a tool for environmental sustainability as-sessment, recognizing that this is a flexible framework,where particularmembers can be included or excluded according to the context or areaof concern, and the trade-offs that are of relevance. Complex systemslike the food system generally require the inclusion of many footprints,as the inclusion of a footprint like the chemical footprint, which ac-counts for pesticides, can give substantially different results when eval-uating industrial and organic farmed systems.
Footprints quantify either resource use or emissions, or both. Manyfootprints show overlaps, and when conducting a footprint family as-sessment these overlapping components should be accounted for. Ide-ally these should also be presented as separate components. Apartfrom the material and grey water footprint, the carbon, blue and greenwater, ecological, land, nitrogen, phosphorus, PM2.5 and PM10, ozone,and biodiversity footprints provide information on eight of nine plane-tary boundaries. Chemical pollution is by different authors proposedas a “novel entity” planetary boundary, for which the chemical footprintcan be a relevant indicator.
Environmental footprint indicators can be used to identify to whatextent different processes and societies contribute to reaching or ex-ceeding planetary boundaries, from local to global levels. We arguethat environmental footprint indicators have largely added value tomeasuring the degree to which different processes contribute toreaching or exceeding planetary boundaries. An added value of the foot-print approach is addressing not only to what extent we have reachedcertain boundaries, but also how different individual human activitiesand communities contribute to the overall footprints, as they accountfor thewhole supply chain up to the consumer level, thereby identifying

Table 3Representation of environmental footprints in SDGs, SDG targets and SDG indicators.
Footprint SDG SDGtarget
Official SDG indicator Relates to SDG indicator Comments
Carbonfootprint
SDG 9“industry,innovation andinfrastructure”
9.4 9.4.1 CO2 emission per unit of valueadded
The carbon footprint can be measured from avalue-added perspective (Fang and Heijungs,2014)
SDG 13“climate action”
The indicators of this SDG do not relate to GHGemissions (thus carbon footprint) directly
Waterfootprint
SDG 6 “cleanwater andsanitation”
6.36.4
6.4.1 Water productivity6.4.2 Level of water stress
The grey WF measures progress regarding target6.3 (Hoekstra et al., 2017);The blue WF measures progress towards target6.4. In a WF assessment, blue water stress isquantified along the supply chain. In order to be inline with the SDGs, indicator 6.4.2 should be used.(Vanham et al., 2018c). A WF quantifies net waterwithdrawal, not gross
Ecologicalfootprint,landfootprint
SDG 15 “life onland”
15.1 15.1.1 Forest area as a proportion oftotal land area
15.3 15.3.1 Proportion of land that isdegraded over total land area
SDG 11“sustainablecities andcommunities”
11.3 11.3.1 Ratio of land consumption rateto population growth rate
The target aims to limit land expansion of growingcities, recognizing that land is needed foragriculture and ecosystem services
Nitrogenfootprint,phosphorusfootprint
SDG 6 “cleanwater andsanitation”
6.3 6.3.1 Proportion of wastewater safelytreated6.3.2 Proportion of bodies of waterwith good ambient water quality
SDG 14 “lifebelow water”
14.1 14.4.1 Index of costal eutrophicationand floating plastic debris density
Target 14.1: by 2025, prevent and significantlyreduce marine pollution of all kinds, in particularfrom land-based activities, including marinedebris and nutrient pollution
Materialfootprint
SDG 8 “decentwork andeconomicgrowth”
8.4 8.4.1 Material footprint, materialfootprint per capita, and materialfootprint per GDP
Indicator to reach target 8.4: Improveprogressively, through 2030, global resourceefficiency in consumption and production andendeavour to decouple economic growth fromenvironmental degradation.All footprint indicators relate to target 8.4 on theimprovement to global resource efficiency inconsumption and production.
SDG 12“responsibleproduction andconsumption”
12.2 12.2.1 Material footprint, materialfootprint per capita, and materialfootprint per GDP
Material footprint is also a key indicator inachieving responsible production andconsumption.All footprint indicators deal/relate with SDG 12 onsustainable consumption and production due totheir producers and consumer approach.
12.2.2 Domestic material consumption,domestic material consumption percapita, and domestic materialconsumption per GDP
Biodiversityfootprint
SDG 14 “lifebelow water”
14.4 14.4.1: Proportion of fish stockswithin biologically sustainable levels
14.5 14.5.1 - Coverage of protected areasin relation to marine areas
SDG 15 “life onland”
15.1 15.1.2: Proportion of important sitesfor terrestrial and freshwaterbiodiversity that are covered byprotected areas, by ecosystem type
15.4 15.4.1: Coverage by protected areas ofimportant sites for mountainbiodiversity
15.5 15.5.1 Red list indexPM2.5 andPM10
footprint
SDG 11“sustainablecities andcommunities”
11.6 11.6.2 Annual mean levels of fineparticulate matter (PM2.5 and PM10)in towns and cities (populationweighted)
Ozonefootprint
Ozone is not accounted for in the SDG framework
Energyfootprint;emergyfootprint
SDG 7“affordable andclean energy”
7.3 7.3.1 Energy intensity measured interms of primary energy and GDP
9D. Vanham et al. / Science of the Total Environment 693 (2019) 133642
potential measures (diet shift, food waste reduction, changing the com-position of the energy mix) how to reduce them. Since footprints aretypically estimated as the sum of the footprints of different human ac-tivities and regions, they provide a basis for priority setting when foot-prints have to be reduced given that boundaries are exceeded.
Of all environmental footprints, only the material footprint is an of-ficial SDG indicator. The other footprints have direct or indirect linksto different other SDG indicators, spread over different SDG targets.Ozone and thereby the ozone footprint is not represented in the SDGframework. To achieve SDG 2 (food security), SDG 6 (water security)

Fig. 3. Graphical representation of the Water-Energy-Food-Ecosystem (WEFE) nexus, with representation of different environmental footprints of the footprint family. The green arrowsrepresent resources and ecosystem services (ES) (where certain provisioning ES also relate to resources) required to provide the securities. The red arrows represent pollution and impactson the ecosystem due to the provision of the securities. (For interpretation of the references to colour in this figure legend, the reader is referred to the web version of this article.)
10 D. Vanham et al. / Science of the Total Environment 693 (2019) 133642
and SDG 7 (energy security) in an environmentally sustainableway, theWEFE nexus framework is essential to assess trade-offs and synergiesbetween these closely interlinked sectors. Ecosystem services are alsoessential to provide the WEF securities, and are in turn negatively af-fected. Certain provisioning ES relate directly or overlap with the mate-rial, ecological and blue water footprints. Other ES do not directlyoverlap with environmental footprints.
Demand for water, energy and food is increasing, driven by a risingglobal population, rapid urbanization, changing diets and economicgrowth. We argue that the footprint family is a valuable tool to analysethe nexus, considering pressures along the entire supply chain. Indeed,as adaptation measures on the consumer side of the supply chain arealso necessary to achieve the three primal human securities, footprintsprovide an important added value in their ability to quantify and com-municate such consumer changes.
Supplementary data to this article can be found online at https://doi.org/10.1016/j.scitotenv.2019.133642.
Conflict of interest
The authors declare no conflict of interest.
References
Bastianoni, S., Pulselli, F.M., Focardi, S., Tiezzi, E.B.P., Gramatica, P., 2008. Correlations andcomplementarities in data and methods through Principal Components Analysis(PCA) applied to the results of the SPIn-Eco Project. J. Environ. Manag. 86, 419–426.
Biggs, E.M., Bruce, E., Boruff, B., Duncan, J.M.A., Horsley, J., Pauli, N., et al., 2015. Sustainabledevelopment and the water–energy–food nexus: a perspective on livelihoods. Envi-ron. Sci. Pol. 54, 389–397.
Borucke, M., Moore, D., Cranston, G., Gracey, K., Iha, K., Larson, J., et al., 2013. Accountingfor demand and supply of the biosphere's regenerative capacity: the National Foot-print Accounts' underlying methodology and framework. Ecol. Indic. 24, 518–533.
Bringezu, S., 2015. Possible target corridor for sustainable use of global material resources.Resources 4, 25.
Bruckner, M., Fischer, G., Tramberend, S., Giljum, S., 2015. Measuring telecouplings in theglobal land system: a review and comparative evaluation of land footprint accountingmethods. Ecol. Econ. 114, 11–21.
Chaudhary, A., Gustafson, D., Mathys, A., 2018. Multi-indicator sustainability assessmentof global food systems. Nat. Commun. 9, 848.
Čuček, L., Klemeš, J.J., Kravanja, Z., 2012. A review of footprint analysis tools for monitor-ing impacts on sustainability. J. Clean. Prod. 34, 9–20.
Čuček, L., Klemeš, J.J., Varbanov, P.S., Kravanja, Z., 2015. Significance of environmentalfootprints for evaluating sustainability and security of development. Clean Techn. En-viron. Policy 17, 2125–2141.
Dalin, C., Rodríguez-Iturbe, I., 2016. Environmental impacts of food trade via resource useand greenhouse gas emissions. Environ. Res. Lett. 11, 035012.
Dalin, C., Wada, Y., Kastner, T., Puma, M.J., 2017. Groundwater depletion embedded in in-ternational food trade. Nature 543, 700.
Demurtas, A., Sousanoglou, A., Morton, G., Humphris-Bach, A., Essig, C., Harding, L., et al.,2015. EU Resource Efficiency Scoreboard 2014. European Commission, Brussels,Belgium, pp. 1–68.
Dittrich, M., Giljum, S., Lutter, S., Polzin, C., 2012. Green Economies Around the World?Implications of Resource Use for Development and the Environment. SustainableEurope Research Institute (SERI), Vienna.
EC, 2011. A Resource-Efficient Europe – Flagship Initiative Under the Europe 2020 Strat-egy COM/2011/21 Final. European Commission.
EC, 2013. European Commission. Recommendation on the Use of Common Methods toMeasure and Communicate the Life Cycle Environmental Performance of Productsand Organisations, Recommendation 2013/179/EU of 9 April 2013.
EEA, 2019. Website CICES. Towards a Common International Classification of EcosystemServices (CICES) for Integrated Environmental and Economic Accounting. hosted bythe. European Environmental Agency (EEA).
Erisman, J.W., Sutton, M.A., Galloway, J.N., Klimont, Z., Winiwarter, W., 2008. How a cen-tury of ammonia synthesis changed the world. Nat. Geosci. 1, 636–639.
EUROSTAT, 2018. Economy-wide Material Flow Accounts HANDBOOK 2018 Edition.Ewing, B.R., Hawkins, T.R., Wiedmann, T.O., Galli, A., Ertug Ercin, A., Weinzettel, J., et al.,
2012. Integrating ecological and water footprint accounting in a multi-regionalinput–output framework. Ecol. Indic. 23, 1–8.
Fang, K., Heijungs, R., 2014. There is still room for a footprint family without a life cycleapproach—comment on "towards an integrated family of footprint indicators".J. Ind. Ecol. 18, 71–72.
Fang, K., Heijungs, R., de Snoo, G.R., 2014. Theoretical exploration for the combination ofthe ecological, energy, carbon, and water footprints: overview of a footprint family.Ecol. Indic. 36, 508–518.
Fang, K., Heijungs, R., De Snoo, G.R., 2015. Understanding the complementary link-ages between environmental footprints and planetary boundaries in afootprint–boundary environmental sustainability assessment framework. Ecol.Econ. 114, 218–226.
11D. Vanham et al. / Science of the Total Environment 693 (2019) 133642
Fang, K., Song, S., Heijungs, R., de Groot, S., Dong, L., Song, J., et al., 2016. The footprint'sfingerprint: on the classification of the footprint family. Curr. Opin. Environ. Sustain.23, 54–62.
FAO, 2019. Water-energy-food-nexus.Foley, J.A., Ramankutty, N., Brauman, K.A., Cassidy, E.S., Gerber, J.S., Johnston, M., et al.,
2011. Solutions for a cultivated planet. Nature 478, 337–342.Galli, A., 2015a. Footprints. In: Wohl, E. (Ed.), Oxford Bibliographies in Environmental Sci-
ence. Oxford University Press, New York.Galli, A., 2015b. On the rationale and policy usefulness of ecological footprint accounting:
the case of Morocco. Environ. Sci. Pol. 48, 210–224.Galli, A., Wiedmann, T., Ercin, E., Knoblauch, D., Ewing, B., Giljum, S., 2012. Integrating
ecological, carbon and water footprint into a “footprint family” of indicators: defini-tion and role in tracking human pressure on the planet. Ecol. Indic. 16, 100–112.
Galli, A., Weinzettel, J., Cranston, G., Ercin, E., 2013. A footprint family extended MRIOmodel to support Europe's transition to a one planet economy. Sci. Total Environ.461-462, 813–818.
Galli, A., Iha, K., Halle, M., El Bilali, H., Grunewald, N., Eaton, D., et al., 2017. Mediterraneancountries' food consumption and sourcing patterns:an ecological footprint viewpoint.Sci. Total Environ. 578, 383–391.
Galloway, J.N., Winiwarter, W., Leip, A., Leach, A.M., Bleeker, A., Erisman, J.W., 2014. Nitro-gen footprints: past, present and future. Environ. Res. Lett. 9.
Giljum, S., Bruckner, M., Martinez, A., 2015. Material footprint assessment in a globalinput-output framework. J. Ind. Ecol. 19, 792–804.
Giljum, S., Wieland, H., Lutter, S., Bruckner, M., Wood, R., Tukker, A., et al., 2016. Identify-ing priority areas for European resource policies: a MRIO-based material footprint as-sessment. J. Econ. Struct. 5, 17.
Godfray, H.C.J., Beddington, J.R., Crute, I.R., Haddad, L., Lawrence, D., Muir, J.F., et al., 2010.Food security: the challenge of feeding 9 billion people. Science 327, 812–818.
Haberl, H., Erb, K.-H., Krausmann, F., 2014. Human appropriation of net primary produc-tion: patterns, trends, and planetary boundaries. Annu. Rev. Environ. Resour. 39,363–391.
Hitchcock, K., Panko, J., Scott, P., 2012. Incorporating chemical footprint reporting into so-cial responsibility reporting. Integr. Environ. Assess. Manag. 8, 386–388.
Hoekstra, A., Chapagain, A., van Oel, P., 2017. Advancing water footprint assessment re-search: challenges in monitoring progress towards Sustainable Development Goal6. Water 9, 438.
Hoekstra, A.Y., Mekonnen, M.M., 2012. The water footprint of humanity. Proc. Natl. Acad.Sci. U. S. A. 109, 3232–3237.
Hoekstra, A.Y., Wiedmann, T.O., 2014. Humanity's unsustainable environmental footprint.Science 344, 1114–1117.
Hoekstra, A.Y., Chapagain, A.K., Aldaya, M.M., Mekonnen,M.M., 2011. TheWater FootprintAssessment Manual: Setting the Global Standard. Earthscan, London, UK.
Hoff, H., 2011. Understanding the Nexus. Background Paper for the Bonn2011 Confer-ence: The Water, Energy and Food Security Nexus. Stockholm Environment Institute,Stockholm.
Hubacek, K., Feng, K., 2016. Comparing apples and oranges: some confusion about usingand interpreting physical tradematrices versus multi-regional input–output analysis.Land Use Policy 50, 194–201.
Jalava, M., Kummu, M., Porkka, M., Siebert, S., Varis, O., 2014. Diet change—a solution toreduce water use? Environ. Res. Lett. 9, 074016.
Jalava, M., Guillaume, J.H.A., Kummu, M., Porkka, M., Siebert, S., Varis, O., 2016. Dietchange and food loss reduction: what is their combined impact on global water useand scarcity? Earth's Future 4, 62–78.
Jørgensen, P.S., Aktipis, A., Brown, Z., Carrière, Y., Downes, S., Dunn, R.R., et al., 2018. An-tibiotic and pesticide susceptibility and the Anthropocene operating space. Nat. Sus-tain. 1, 632–641.
Kashyap, D., Agarwal, T., 2019. Food loss in India: water footprint, land footprint and GHGemissions. Environ. Dev. Sustain. https://doi.org/10.1007/s10668-019-00325-4.
Kastner, T., Rivas, M.J.I., Koch, W., Nonhebel, S., 2012. Global changes in diets and theconsequences for land requirements for food. Proc. Natl. Acad. Sci. 109,6868–6872.
Kastner, T., Schaffartzik, A., Eisenmenger, N., Erb, K.-H., Haberl, H., Krausmann, F., 2014.Cropland area embodied in international trade: contradictory results from differentapproaches. Ecol. Econ. 104, 140–144.
Kitzes, J., Berlow, E., Conlisk, E., Erb, K., Iha, K., Martinez, N., et al., 2017. Consumption-based conservation targeting: linking biodiversity loss to upstream demand througha global wildlife footprint. Conserv. Lett. 10, 531–538.
Kummu, M., de Moel, H., Porkka, M., Siebert, S., Varis, O., Ward, P.J., 2012. Lost food,wasted resources: global food supply chain losses and their impacts on freshwater,cropland, and fertiliser use. Sci. Total Environ. 438, 477–489.
Leach, A.M., Galloway, J.N., Bleeker, A., Erisman, J.W., Kohn, R., Kitzes, J., 2012. A nitrogenfootprint model to help consumers understand their role in nitrogen losses to the en-vironment. Environ. Dev. 1, 40–66.
Leach, A.M., Emery, K.A., Gephart, J., Davis, K.F., Erisman, J.W., Leip, A., et al., 2016. Envi-ronmental impact food labels combining carbon, nitrogen, and water footprints.Food Policy 61, 213–223.
Leip, A., Billen, G., Garnier, J., Grizzetti, B., Lassaletta, L., Reis, S., et al., 2015. Impacts ofEuropean livestock production: nitrogen, sulphur, phosphorus and greenhouse gasemissions, land-use, water eutrophication and biodiversity. Environ. Res. Lett. 10,115004.
Lenzen, M., Moran, D., Kanemoto, K., Foran, B., Lobefaro, L., Geschke, A., 2012. Interna-tional trade drives biodiversity threats in developing nations. Nature 486, 109–112.
MacDonald, G.K., Brauman, K.A., Sun, S., Carlson, K.M., Cassidy, E.S., Gerber, J.S., et al., 2015.Rethinking agricultural trade relationships in an era of globalization. BioScience 65,275–289.
Mancini, M.S., Galli, A., Niccolucci, V., Lin, D., Bastianoni, S., Wackernagel, M., et al., 2016.Ecological footprint: refining the carbon footprint calculation. Ecol. Indic. 61,390–403.
Marques, A., Verones, F., Kok, M.T.J., Huijbregts, M.A.J., Pereira, H.M., 2017. How to quan-tify biodiversity footprints of consumption? A review of multi-regional input–outputanalysis and life cycle assessment. Curr. Opin. Environ. Sustain. 29, 75–81.
Mekonnen, M.M., Hoekstra, A.Y., 2016. Four billion people facing severe water scarcity.Sci. Adv. 2.
Mekonnen, M.M., Gerbens-Leenes, P.W., Hoekstra, A.Y., 2016. Future electricity: the chal-lenge of reducing both carbon and water footprint. Sci. Total Environ. 569-570,1282–1288.
Meyer, K., Newman, P., 2018. The planetary accounting framework: a novel, quota-basedapproach to understanding the impacts of any scale of human activity in the contextof the planetary boundaries. Sustain. Earth 1, 4.
Moran, D.D., Lenzen, M., Kanemoto, K., Geschke, A., 2013. Does ecologically unequal ex-change occur? Ecol. Econ. 89, 177–186.
Mudgal, S., Tan, A., Lockwood, S., Eisenmenger, N., Fischer-Kowalski, M., Giljum, S., et al.,2012. Assessment of Resource Efficiency Indicators and Targets. BIO Intelligence Ser-vice (BIO), Institute for Social Ecology (SEC) and Sustainable Europe Research Insti-tute (SERI).
Obersteiner, M., Peñuelas, J., Ciais, P., van der Velde, M., Janssens, I.A., 2013. The phospho-rus trilemma. Nat. Geosci. 6, 897.
O'Brien, M., Schütz, H., Bringezu, S., 2015. The land footprint of the EU bioeconomy: mon-itoring tools, gaps and needs. Land Use Policy 47, 235–246.
Odum, H.T., 1988. Self-organization, transformity, and information. Science 242,1132–1139.
OECD, 2003. Environmental Indicators – Development, Measurement and Use. Report.Organisation of Economic Co-operation and Development.
Oita, A., Malik, A., Kanemoto, K., Geschke, A., Nishijima, S., Lenzen, M., 2016. Substantialnitrogen pollution embedded in international trade. Nat. Geosci. 9, 111.
Onat, N.C., Kucukvar, M., Tatari, O., 2015. Conventional, hybrid, plug-in hybrid or electricvehicles? State-based comparative carbon and energy footprint analysis in the UnitedStates. Appl. Energy 150, 36–49.
O'Neill, D.W., Fanning, A.L., Lamb, W.F., Steinberger, J.K., 2018. A good life for all withinplanetary boundaries. Nat. Sustain. 1, 88–95.
Pelletier, N., Leip, A., 2014. Quantifying anthropogenic mobilization, flows (in product sys-tems) and emissions of fixed nitrogen in process-based environmental life cycle as-sessment: rationale, methods and application to a life cycle inventory. Int. J. LifeCycle Assess. 19, 166–173.
Peñuelas, J., Poulter, B., Sardans, J., Ciais, P., van der Velde, M., Bopp, L., et al., 2013.Human-induced nitrogen–phosphorus imbalances alter natural and managed eco-systems across the globe. Nat. Commun. 4, 2934.
Raworth, K., 2017. Doughnut Economics: Seven Ways to Think Like a 21st-century Econ-omist. Random House Business Books, London, UK.
Rockström, J., Falkenmark, M., Karlberg, L., Hoff, H., Rost, S., Gerten, D., 2009. Future wateravailability for global food production: the potential of green water for increasing re-silience to global change. Water Resour. Res. 45, W00A12.
Rockstrom, J., Steffen, W., Noone, K., Persson, A., Chapin, F.S., Lambin, E.F., et al., 2009. Asafe operating space for humanity. Nature 461, 472–475.
Sala, S., Goralczyk, M., 2013. Chemical footprint: a methodological framework for bridginglife cycle assessment and planetary boundaries for chemical pollution. Integr. Envi-ron. Assess. Manag. 9, 623–632.
Sala, S., Benini, L., Beylot, A., Castellani, V., Cerutti, A., Corrado, S., et al., 2019. Consumptionand Consumer Footprint: Methodology and Results. Indicators and Assessment of theEnvironmental Impact of European Consumption. Luxembourg. .
Sánchez-Bayo, F., Wyckhuys, K.A.G., 2019. Worldwide decline of the entomofauna: a re-view of its drivers. Biol. Conserv. 232, 8–27.
Schyns, J.F., Hoekstra, A.Y., Booij, M.J., H, H.J., Mekonnen, M.M., 2019. Limits to the world'sgreen water resources for food, feed, fibre, timber and bio-energy. Proc. Natl. Acad.Sci. 116 (11), 4893–4898. https://doi.org/10.1073/pnas.1817380116 (In Press).
Springmann, M., Clark, M., Mason-D'Croz, D., Wiebe, K., Bodirsky, B.L., Lassaletta, L., et al.,2018. Options for keeping the food system within environmental limits. Nature 562,519–525.
Steffen, W., Richardson, K., Rockström, J., Cornell, S.E., Fetzer, I., Bennett, E.M., et al., 2015.Planetary boundaries: guiding human development on a changing planet. Science347.
Sutton, M.A., Oenema, O., Erisman, J.W., Leip, A., van Grinsven, H., Winiwarter, W., 2011.Too much of a good thing. Nature 472, 159.
Thomas, K., Karl-Heinz, E., Helmut, H., 2014. Rapid growth in agricultural trade: effects onglobal area efficiency and the role of management. Environ. Res. Lett. 9, 034015.
Tukker, A., Bulavskaya, T., Giljum, S., de Koning, A., Lutter, S., Simas, M., et al., 2016. Envi-ronmental and resource footprints in a global context: Europe's structural deficit inresource endowments. Glob. Environ. Chang. 40, 171–181.
van Dijk, K.C., Lesschen, J.P., Oenema, O., 2016. Phosphorus flows and balances of theEuropean Union Member States. Sci. Total Environ. 542, 1078–1093.
Vanham, D., 2013. The water footprint of Austria for different diets. Water Sci. Technol.67, 824–830.
Vanham, D., 2016. Does the water footprint concept provide relevant information to ad-dress the water–food–energy–ecosystem nexus? Ecosyst. Serv. 17, 298–307.
Vanham, D., 2018. The water footprint of the EU: quantification, sustainability and rele-vance. Water Int. 43, 731–745.
Vanham, D., Mekonnen, M.M., Hoekstra, A.Y., 2013. The water footprint of the EU for dif-ferent diets. Ecol. Indic. 32, 1–8.
Vanham, D., Bouraoui, F., Leip, A., Grizzetti, B., Bidoglio, G., 2015. Lost water and nitrogenresources due to EU consumer food waste. Environ. Res. Lett. 10, 084008.

12 D. Vanham et al. / Science of the Total Environment 693 (2019) 133642
Vanham, D., Comero, S., Gawlik, B.M., Bidoglio, G., 2018. The water footprint of differentdiets within European sub-national geographical entities. Nat. Sustain. 1, 518–525.
Vanham, D., Hoekstra, A.Y., Wada, Y., Bouraoui, F., de Roo, A., Mekonnen, M.M., et al.,2018c. Physical water scarcity metrics for monitoring progress towards SDG target6.4: an evaluation of indicator 6.4.2 “level of water stress”. Sci. Total Environ. 613,218–232.
Vanham, D., Gawlik, B.M., Bidoglio, G., 2019. Cities as hotspots of indirect water consump-tion: the case study of Hong Kong. J. Hydrol. 573, 1075–1086. https://doi.org/10.1016/j.jhydrol.2017.12.004.
Verones, F., Moran, D., Stadler, K., Kanemoto, K., Wood, R., 2017. Resource footprints andtheir ecosystem consequences. Sci. Rep. 7, 40743.
Wackernagel, M., Rees, W.E., 1996. Our Ecological Footprint: Reducing Human Impact onthe Earth. New Society Publishers, Philadelphia, Pa.
Wackernagel, M., Schulz, N.B., Deumling, D., Linares, A.C., Jenkins, M., Kapos, V., et al.,2002. Tracking the ecological overshoot of the human economy. Proc. Natl. Acad.Sci. 99, 9266–9271.
Wang, F., Sims, J.T., Ma, L., Ma, W., Dou, Z., Zhang, F., 2011. The phosphorus footprint ofChina's food chain: implications for food security, natural resource management,and environmental quality. J. Environ. Qual. 40, 1081–1089.
Weinzettel, J., Hertwich, E.G., Peters, G.P., Steen-Olsen, K., Galli, A., 2013. Affluence drivesthe global displacement of land use. Glob. Environ. Chang. 23, 433–438.
Wiedmann, T., 2009. A first empirical comparison of energy footprints embodied in trade- MRIO versus PLUM. Ecol. Econ. 68, 1975–1990.
Wiedmann, T., Lenzen, M., 2018. Environmental and social footprints of internationaltrade. Nat. Geosci. 11, 314–321.
Wiedmann, T., Minx, J., 2008. A definition of ‘carbon footprint’. Ecological Economics Re-search Trends. Edited by Hauppauge Pertsova Crsv. vol. 2008. Nova Science Pub-lishers, New York.
Wiedmann, T.O., Schandl, H., Lenzen, M., Moran, D., Suh, S., West, J., et al., 2015. The ma-terial footprint of nations. Proc. Natl. Acad. Sci. 112, 6271–6276.
Yang, S., Chen, B., Wakeel, M., Hayat, T., Alsaedi, A., Ahmad, B., 2018. PM2.5 footprint ofhousehold energy consumption. Appl. Energy 227, 375–383.
Zhang, J., Beusen, A.H.W., Van Apeldoorn, D.F., Mogollón, J.M., Yu, C., Bouwman, A.F., 2017.Spatiotemporal dynamics of soil phosphorus and crop uptake in global cropland dur-ing the 20th century. Biogeosciences 14, 2055–2068.
Zijp, M.C., Posthuma, L., van de Meent, D., 2014. Definition and applications of a ver-satile chemical pollution footprint methodology. Environ. Sci. Technol. 48,10588–10597.


![Perusopetus arjen kansainvälisyyttä1[1]](https://img.pdfslide.net/doc/110x75/5584340fd8b42a0b6d8b5337/perusopetus-arjen-kansainvaelisyyttae11.jpg)