Embed Size (px)
Citation preview
Science of the Total Environment 576 (2017) 858–867
Contents lists available at ScienceDirect
Science of the Total Environment
j ourna l homepage: www.e lsev ie r .com/ locate /sc i totenv
The molecular properties of biochar carbon released in dilute acidicsolution and its effects on maize seed germination
Jingling Sun †,§, Marios Drosos §,⁎, Pierluigi Mazzei §, Davide Savy §, Daniele Todisco §, Giovanni Vinci §,Genxing Pan †,⁎, Alessandro Piccolo §
§ Centro Interdipartimentale di Ricerca sulla RisonanzaMagnetica Nucleare per l'Ambiente, l'Agroalimentare ed i Nuovi Materiali (CERMANU), Università di Napoli Federico II, Via Università 100,80055 Portici, Italy† Institute of Resource, Ecosystem and Environment of Agriculture, Center of Agricultural and Climate Change, Nanjing Agricultural University, 1 Weigang, Nanjing 210095, PR China
H I G H L I G H T S G R A P H I C A L A B S T R A C T
• Acidic aqueous biochar extract (AQU)used to simulate soil rhizosperic condi-tions.
• Wheat biochar AQU inhibited maizeseeds germination test.
• Maize biochar AQU promoted shootelongation of maize seeds germination.
• Advanced characterization of AQUs re-vealed heterocyclic nitrogen molecules(HN).
• Difference in germination is related tothe C/N ratio or the HN molecules inAQU.
⁎ Corresponding authors.E-mail addresses: [email protected] (J. Sun), dros
[email protected] (D. Todisco), giovanni.vinci@unin
http://dx.doi.org/10.1016/j.scitotenv.2016.10.0950048-9697/© 2016 Elsevier B.V. All rights reserved.
a b s t r a c t
a r t i c l e i n f oArticle history:Received 2 September 2016Received in revised form 12 October 2016Accepted 13 October 2016Available online xxxx
Editor: Jay Gan
It is not yet clearwhether the carbon released frombiochar in the soil solution stimulates biological activities. Sol-uble fractions (AQU) fromwheat andmaize biochars, whosemolecular content was thoroughly characterized byFTIR, 13C and 1H NMR, and high-resolution ESI-IT-TOF-MS, were separated in dilute acidic solution to simulatesoil rhizospheric conditions and their effects evaluated on maize seeds germination activity. Elongation ofmaize-seeds coleoptilewas significantly promotedbymaize biochar AQU,whereas itwas inhibited bywheat bio-char AQU. Both AQU fractions contained relatively small heterocyclic nitrogen compounds, whose structureswere accounted by their spectroscopic properties. Point-of-Zero-Charge (PZC) values and van Krevelen plots ofidentified masses of soluble components suggested that the dissolved carbon from maize biochar behaved ashumic-like supramolecular material capable to adhere to seedlings and deliver bioactive molecules. These find-ings contribute to understand the biostimulation potential of biochars from crop biomasses when applied in ag-ricultural production.
© 2016 Elsevier B.V. All rights reserved.
Keywords:BiocharSupramolecularOrganic carbonGerminationMaizeWheat
[email protected] (M. Drosos), [email protected] (P. Mazzei), [email protected] (D. Savy),a.it (G. Vinci), [email protected] (G. Pan), [email protected] (A. Piccolo).
859J. Sun et al. / Science of the Total Environment 576 (2017) 858–867
1. Introduction
The production of biochar by controlled pyrolysis of biomass wasteshas become of interest to numerous sectors of Agriculture: 1. the stor-age of stabilized carbon in soil presumed to contribute to climate changemitigation (Spokas et al., 2012), 2. the possible improvement of soilphysical properties by favoring soil aggregation (Dong et al., 2016), aer-ation (Case et al., 2012), and water retention (Sun and Lu, 2014), 3. thepotential enhancement of crop productivity by facilitating the growth ofsoil microbial populations and their activity (Chen et al., 2013, 2015;Domene et al., 2014), and releasing possibly bioactive hormone-likecompounds (Spokas et al., 2010), and 4. the presumed capacity to assistsoil remediation (Bereket et al., 1997; Biederman and Harpole, 2013;Kuppusamy et al., 2016; Mohan et al., 2016; Sohi et al., 2010).
The increasing tendency to largely dispose biochars into agriculturalsoils calls for an improved specification of their long-term persistenceandbioavailability, aswell as for an assessment of the potential beneficialor hazardous behavior of biochar components when released in the soilsolution (Dutta et al., 2016; Sohi et al., 2010). It has been reported thatbiochars may increase plant growth (Rogovska et al., 2012; Zhanget al., 2012; Zhang et al., 2016) by providing nutrients (Glaser et al.,2002; Wu et al., 2016), or influencing soil pH, electrical conductivity(EC) and cation exchange capacity (CEC) (Atkinson et al., 2010). Howev-er, some types of biochar may have adverse effects due to the possiblepresence of heavy metals (Freddo et al., 2012; Van Wesenbeeck et al.,2014; Wu et al., 2016), polycyclic aromatic hydrocarbons (Freddo et al.,2012; Liao et al., 2014) and other phytotoxic compounds (Dutta et al.,2016; Rogovska et al., 2012). In order to understand the effects of bulkbiochar materials, a large body of literature works has already covereda wide range of analytical and spectroscopical techniques, such as SEM(Lin et al., 2012), thermal desorption (TDS) GC–MS (Rogovska et al.,2012), FTIR (Lou et al., 2016), and solid state NMR (Ngunen et al., 2010).
The effects of biochar on plant growth seem to be more complexthan simple nutrients source (Güereña et al., 2013; Mukherjee andZimmerman, 2013; Sohi et al., 2010), but they are not yet clarified(Biederman andHarpole, 2013; Shackley et al., 2011), due to thehetero-geneity of biochar materials and their nutrient supplying capacity(Alburquerque et al., 2014). The readily bioavailable water-solublecomponents are regarded as indicators of biochars' effects on plantgrowth (Lou et al., 2016; Zhang et al., 2012), and were shown to poten-tially either inhibit or stimulate seed germination and seedling growth(Solaiman et al., 2012). Phenolic compounds holding a carboxyl groupare believed to be the most likely inhibiting species (Smith et al.,2013a, 2013b), possibly because their free radicalsmay induce hydroxylradicals in solution, which become toxic to both roots and bacterial cells(Liao et al., 2014). Previous research on biochar water extractsemployed ICP-MS, total organic carbon detection (TOC), and liquidchromatography coupled with organic carbon detector (LC-OCD),while FTIR was used on freeze-dried biochar water extracts to identifyfunctional groups (Lou et al., 2016). More detailed characterizationwas conducted at molecular level by high resolution MS techniques,such as ESI-Orbitrap-MS (Cole et al., 2012), and FTICR-MS (Podgorskiet al., 2012; Smith et al., 2013a).
Seed germination tests have been recommended as simple, rapidand reliable tests to identify biochars potential toxicity or bio-stimulation prior to soil application (Solaiman et al., 2012; Free et al.,2010), and differentiate their bioactivity (Rogovska et al., 2012;Solaiman et al., 2012). For example, growth of maize (Zea maysL) seedlings was inhibited by amending soil with miscanthus biocharformed at 400 °C for 10 min, whereas biostimulation was observedwhen pyrolysis of the same biomass waste was conducted at 600 °Cfor 60 min (Kwapinski et al., 2010).
Most seed germination tests were conducted using untreated bulkbiochar (Liao et al., 2014; Solaiman et al., 2012), or bulk biocharwashedwith distilled or deionized water (Rogovska et al., 2012). However, it isprecisely the water-soluble fractions of biochar that should be more
effective on plant stimulation, due to a larger availability of bioactivecompounds than for the bulk biochar. Nevertheless, these types of stud-ies are still limited and mainly restricted to application of materials sol-ubilized frombiochar by alkaline extractions or pressurized hotwater atneutral pH (Lin et al., 2011, 2012; Lou et al., 2016), despite the evidencethat these conditions are hardly representative of the biochars' releasingpotential in the acidic rhizospheric environment (Neumann andRomheld, 2002).
The objective of this study was to assess the potential bioavailabilityor toxicity of carbonmaterials released by wheat andmaize biochars inacidic aqueous conditions, which better model the soil rhizosphericconditions than alkalinewater extracts. The stimulating or inhibiting ef-fects on maize seeds germination were then related to a number ofchemical functionalities and molecular properties of the carbon com-pounds present in the acidic aqueous extracts from biochars. With thisaim the Point of Zero Charge (PZC) and proton binding were calculatedto reveal the potential humic-like character of the solubilized fractions,and liquid state 1H NMR was applied for the first time to characterizethe structure of the functional groups in the dissolved materials,whose molecular composition was reached by high resolution ESI-IT-TOF-MS. The relation between soluble biochar components and their bi-ological activity may provide preliminary rigorous information onwhich type of biochar should produce the most useful plant response.
2. Experimental
2.1. Biochar and extracts
The two biochars of this study weremade of wheat andmaize strawunder the pyrolytic temperature of ~450 °C. Wheat straw biochar wasproduced by Sanli New Energy Company, Henan, China. The generalproperties of this bulk biochar were reported earlier (Liu et al., 2012;Lou et al., 2016; Zhang et al., 2010). Maize straw biochar was producedby Qinfeng Straw Technology Co., Ltd., Jiangsu, China. The bulk biocharswere homogenized by grinding and sieving at 1-mm sieve.
The extraction of water-soluble fraction (AQU) from bothmaize andwheat biochars were conducted at room temperature (22 ± 2 °C) byweighing 5 g of biochar and shaking the suspension overnight in75ml of a 0.1MHCl solution in a rotatory shaker at 120 rpm. The super-natant was separated from biochar by centrifugation at 10,000 rpm andfiltered twice through a double 41 grade Whatman filter paper. Finally,the extracts were freeze-dried and stored for further analyses. Extrac-tion in dilute HCl solution to solubilize bioavailable cations from soil isa common and most efficient technique applied in nutritional studies(Meers et al., 2007; Chang et al., 2014).
Elemental composition (C, H, N) of AQU samples was determinedwith a Fisons Instruments EA 1108 Elemental Analyzer. An aliquot(50 mg) of the freeze-dried biochar aqueous extracts was dissolved in1 ml of HCl (37%) overnight and brought to volume with 49 ml ofMilli-Q water. The solution was filtered through a 41 Whatman filterand its content of Fe, Zn, Mg, Ca, K, Na, Cd, Co, Cu, Cr, Ni, Pb, was mea-sured by a Perkin Elmer AA700 graphite furnace atomic adsorptionspectrophotometer (AAS).
2.2. Proton binding and Point of Zero Charge
Proton uptake by AQU extracts was measured by potentiometric ti-tration, as previously reported for humics byDrosos et al. (2009). In par-ticular, 25 mg of AQU were suspended in a titration cell containing25 ml of Milli-Q water to reach a concentration of 1 g l−1, and keptunder constant purge by N2 gas (99.999% purity). The pH was set to 3using traces of HNO3 and set to equilibrate for 60min under continuousstirring prior to titration. Each AQU solution was titrated with a 0.05 MNaOH solution (Drosos et al., 2009; Schulthess and Sparks, 1986) frompH 3.0 to 10.5, at an ionic strength of either 0.001 M or 1 M KNO3.
860 J. Sun et al. / Science of the Total Environment 576 (2017) 858–867
The PZCwas estimated bymass titration. 25ml of Milli-Q water wasstirred under N2 gas until a stable pH at about 7. Then, progressive ali-quots of 10mg of AQUwere added to the solution until the pHwas sta-bilized near the PZC. To reach this point, an overall 150 mg of AQU wasused for each titration. The same mass titration was performed againbut with the Milli-Q solution stabilized at a pH lower than the PZC byusing traces of HNO3 prior to titration (Kosma et al., 2009; Žalac andKalley, 1992). Potentiometric titrationswere conductedwith a Radiom-eter Analytical TitraLab TIM840 titrationmanager, and the pHwasmea-sured with a Radiometer combined-pH electrode (Type PHC2051-8).
2.3. TGA analysis
Thermogravimetric analysis (TGA) and differential scanning calo-rimetry (DSC) curves were obtained by air combustion of approximate-ly 20 mg of each bulk biochar sample in a simultaneous thermalanalyzer (STA 6000-Perkin Elmer). The initial and final temperatureswere 303 K and 973 K, respectively, with an increasing temperaturerate of 283 K min−1.
2.4. Nuclear magnetic resonance (NMR) spectroscopy
ABruker AVANCE 300magnet (Bruker, Billerica,MA, USA), equippedwith a 4 mm wide-bore MAS probe operating at the 13C frequency of75.5MHz, was obtain solid-state NMR spectra of biochar bulkmaterials.Samples (60–80 mg) were packed into 4 mm zirconia rotors coupledwith Kel-F caps and spun at a rate of 10,000 ± 2 Hz. 13C NMR spectrawere acquired by using a Cross-Polarization Magic Angle Spinning(CPMAS) technique, with 1814 acquisition points, 4000 scans, a recycledelay of 2 s and a spectralwidth of 300ppm(22,650Hz). The carbon nu-cleiwere decoupled by applying a high-power proton-decoupling basedon a 30-ms long TPPM15 composite pulse (0.5 dB power attenuation).The free induction decays (FIDs) were not zero-filled but apodized bymultiplying by a 150-Hz exponential factor. All carbon spectra werebaseline corrected and processed with Bruker Topspin Software (v.2.1).
A 400-MHz Bruker Avance spectrometer (Bruker, Billerica, MA,USA), equipped with a 5-mm Bruker BBI (Broad Band inverse) probeand working at the 1H frequency of 400.13 MHz, was used to evaluatebiochar AQU extracts by liquid-state NMR techniques. Each sample(3.5 mg) was dissolved in 700 μl of D2O and placed into 5.0-mm quartztube. 1H NMR spectra were acquired with 5 s of recycle delay, a 90°pulse length ranging within 9.5 and 10 μs (−2-dB power attenuation),8192 time domain points and 128 transients. 2D 1H\\1H correlationspectroscopy (COSY) spectra were acquired with 2048 points in F2 do-main, 256 experiments in F1 dimension, 96 scans, 2 s of recycle delayand 16 dummy scans. 1H diffusion-ordered spectroscopy (DOSY) NMRspectrawere obtained by a stimulated echo pulse sequencewith bipolargradients, combinedwith two spoil gradients and an eddy current delaybefore signal acquisition. This sequence was selected to reduce signalloss due to short spin-spin relaxation times. The acquisition (8196points) consisted of 40 scans and was executed by selecting a 200-msdelay (Δ) between the encoding and the decoding gradients and usinga 1.4-ms long sine-shaped gradients (δ) that linearly ranged from0.674 to 32.030 G cm−1 in 32 increments. In all cases, the 1H spectralwidth was set at 13 ppm (5201.7 Hz). In order to suppress the residualwater signal, the on-resonancepresaturation techniquewas adopted for1H and COSY spectra, whereas a Watergate 3-9-19 pulsed train se-quence was preferred for DOSY experiments. The free induction decays(FIDs) resulting from 1D 1H and 2DDOSY spectra underwent a two-foldzero-filling andwere apodized bymultiplying by 1- and 3-Hz exponen-tial factors, respectively. Then, the distorted signal in 1D spectraresulting from water suppression was removed by applying an on-resonance Q fil algorithmic function during Fourier Transform. All pro-ton spectra were baseline corrected and processed with Bruker TopspinSoftware (v.2.1).
2.5. ATR-FTIR spectroscopy
Solid bulk biochars and their AQU extracts were measured using aPerkin Elmer Frontier ATR-FTIR, in MIR mode from 4000 to 650 cm−1,8 scans per sample using resolution of 4 cm−1 and the spectrawere pre-sented in absorbance mode.
2.6. Aqueous salt equivalent (ASE) solutions
The cations content measured by AAS in the biochar aqueous diluteHCl extracts allowed formulation of control solutions with the samechloride salt concentration as AQU solutions, but without carbon com-pounds. KNO3 was used (Merck, CAS No. 7757-79-1) to match the per-cent N contained in AQU solutions, while no S and P salts were addedsince these elements were not found in the extracts. The appropriateconcentration of the following chloride salts were used to build upsalt-equivalent control solutions: KCl (VWR, Analar NORMAPUR, Ref.No. 26764.298), NaCl (Ashland, Lot. No. 8314), FeCl2*4H2O (BDH, Prod-uct No. 28394), CaCl2*2H2O (Merck, Art. No. 2383), MgCl2*6H2O(Applichem, Lot. No. 8Y009463), and ZnCl2 (Merck, Lot. No. B986916640).
2.7. Germination test
Maize (Zea mays L. cv 3321 Limagrain) seeds were soaked in tapwater overnight and twelve (12) seeds were deposited for each repli-cate on round filter paper placed in a petri dish. The experiment wasrun in six replicates for the biochar AQU tests and in five replicates forthe salt equivalent tests. The filters were first moistened with 5 ml ofMilli-Q water and, then, with 15 ml of aqueous AQU solutions at theconcentration of: 0 (control), 1, 10, and 50mg C l−1. Seeds were germi-nated in the dark at 25 °C for 96 h and, thereafter, length of coleoptile,radicle and lateral seminal roots was measured for each replicate,using an Epson perfection V700modified flatbed scanner andWinRhizosoftware version 2012b (Regent Instruments, Inc.). Only seeds with aradicle longer than 1mmwere considered for the evaluation of percentgermination. The pH of solutions added to seeds was set to 6.5 byadjusting with 0.1 M KOH or HCl.
2.8. Statistical analysis
The methodology used is like reported by Savy et al. (2016). Briefly,percent germination was evaluated by the chi-square test, and all datafrom growth experiment were found to be normally distributed. TheOne-Way ANOVA and Tukey's range tests were used to comparemeans among treatments. All statistical elaboration was conducted byusing SPSS, version 21 (IBM SPPS Statistics), and significant differencewas set at a 95% confidence.
2.9. ESI-MS IT-TOF
2.9.1. Samples preparation1 mg of dry AQU sample was solubilized in 1 ml of LC-MS grade
water (Sigma Aldrich) and loaded onto 0.5 g of Amberlite XAD4 resin(Sigma-Aldrich) packed in an empty SPE column previously washedwith 2 ml of water. The material was subsequently eluted by 2 ml ofeach of the following three solvent systems: 1. LC-MS grade water, 2.LC-MS grade acetonitrile/methanol (1:1), 3. ammonia solution 0.1 Min LC-MS water, to yield three fractions in total.
The collected fractions were firstly dried by a flow of nitrogen gas inthe case of organic solvents, and freeze-dried in the case of aqueous so-lution, and, subsequently, dissolved in 200 μl of 5 mM Acetic Acid –5 mM ammonium acetate Buffer (pH 4.5). The solutions were filteredthrough a 0.45 μm polypropylene syringe filters (OlimPeak byTeknokroma), and injected (1 μl) in duplicates in the LC-MS system.

861J. Sun et al. / Science of the Total Environment 576 (2017) 858–867
2.9.2. Chromatographic separationBefore entering themass spectrometry, the AQU solutionwere chro-
matographically separated by an Ultra High Performance Liquid Chro-matography (UHPLC) system from Shimadzu (Kyoto, Japan),constituted by two LC-20ADXRUHPLCpumps, a DGU-20A 5R degassingunit, a SIL-20A XR autosampling unit and a SPD-N20AUVDAD detector.Molecular separation occurred by size-exclusion chromatographythrough a Phenomenex PolySep-GFC-P, 35 × 7.80 mm column, elutedisocratically with a solution made of water/acetonitrile 1:1 in a 5 mMacetic acid – 5 mM ammonium acetate buffer (pH 4.5). The mobilephasewas applied for 20min at a rate of 0.3mlmin−1. The column tem-perature was maintained at 30 °C.
2.9.3. Mass spectrometryMass spectra were acquired by an ESI-IT-TOF-MS system equipped
with an ESI source and a hybrid ion-trap time-of flight mass spectrom-eter (Shimadzu, Kyoto, Japan) and the resolution set at 10 ppm. Inter-face voltage was set at 4.50 kV and −3.50 kV for positive and negativemode, respectively. The nebulizing gas rate was set at 1.5 l min−1 andthe drying gas (N2) pressure was set at 0.2 MPa. Curved DesorptionLine (CDL) and heat block temperaturewere both set at 200 °C. Detectorvoltage of TOF analyzer was 1.60 kV.
Ultra-high purity argonwas used as the collision gas and ion coolinggas pressure was 96 KPa. The flight tube temperature used was 40 °C,ion trap pressure was 1.7 × 10⁻² Pa and ion accumulation time was20 ms. A range of 80 to 1000 m/z was set for both scans, resulting in aloop cycle of 1.80 s. Each chromatographic run time was in total20 min and data were collected using a LC-MS solution software(Shimadzu, Kyoto, Japan).
3. Results and discussion
3.1. Elemental composition (analysis & metal content)
The AQU extracts solubilized 0.51 and 0.40 g from 5 g of bulk maizeand wheat biochar materials, respectively, which contained 1.38%(40 mg) and 0.13% (3mg) of the C present in the original bulk samples.Both bulk and AQU extract of maize biochar showed larger carbon, ni-trogen and hydrogen content than the bulk and AQU extract fromwheat biochar. In particular, the carbon content was 11 times greaterin AQU from maize biochar than from wheat biochar (SupplementaryTable 1). The C/N ratio for bulk wheat biochar was 46.7, while it wasonly 2.3 for its AQU fraction. For bulk maize biochar the C/N ratio was36.1, and moved down to 15.4 in its AQU extract. Thus C/N ratio formaize AQU was N6 times greater than for wheat AQU. Toxic heavymetals were not detected in these two biochar AQU extracts, whichhowever contained several essential micronutrients for plant growth,e.g. zinc (Zn), manganese (Mg), calcium (Ca), potassium (K), and iron(Fe).
3.2. Bioassay
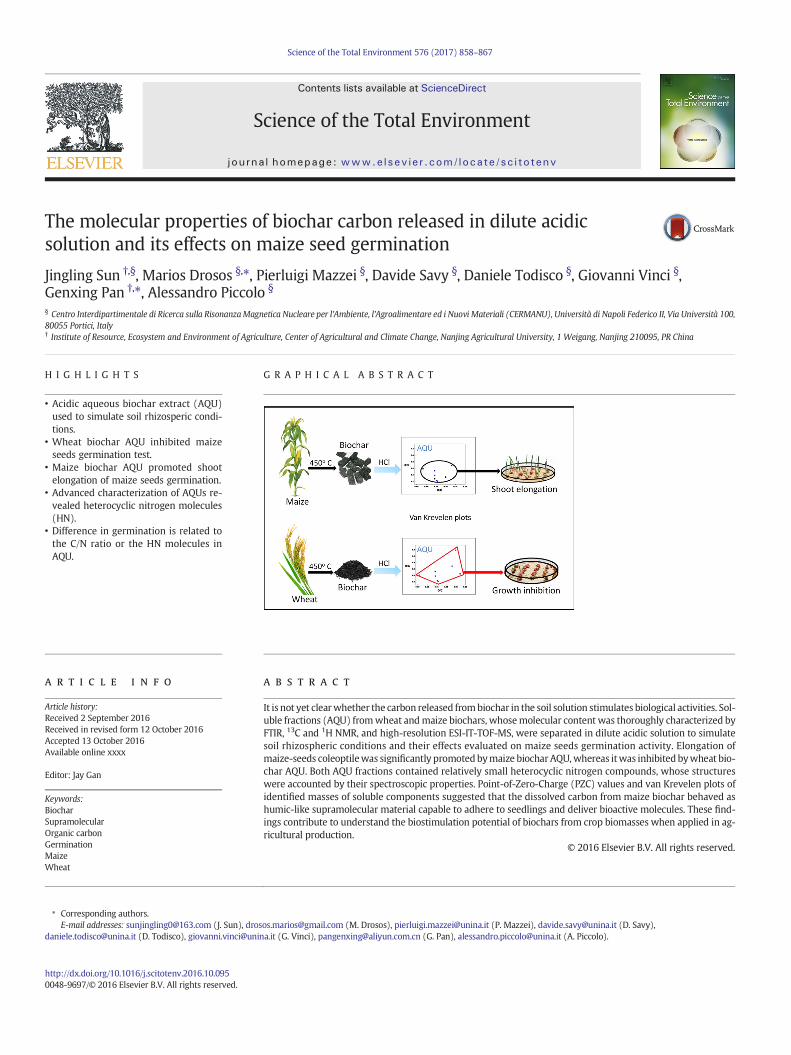
The biological activity of aqueous fractions separated from bothmaize and wheat biochars was evaluated on germination of maizeseeds.While seeds germinationwasnot improved by the two substratesat any assayed concentration, the early development of maize seedlingswas differently affected by the AQU separates (Fig. 1 & SupplementaryTable 2). The aqueous extracts from maize biochar did not enhanceelongation of the radicle (Rad),while it significantly inhibited the lateralseminal roots (LSR) length, leading to about 25% of growth reduction, ascompared to control (Fig. 1 & Supplementary Table 2). Conversely, thecoleoptile (Col) development was positively enhanced by the additionof AQU frommaize biochar at each assayed concentration,with the larg-est effect produced at 50 mg C l−1 that determined a 34% coleoptileelongation, compared to the control (Fig. 1 & Supplementary Table 2).
The AQU fromwheat biochar did not result in any statistically signif-icant biological effect on the length of both radicle root and coleoptile,whereas a marked decreasing trend was even noticed for these param-eters in respect to control (Fig. 1 & Supplementary Table 2). A similarprogressive decrease was also detected for the LSR elongation thatshowed a 28% significant reduction in comparison to the control(Fig. 1 & Supplementary Table 2). A large salt concentration may deter-mine a salinity stress to seeds and seedlings, leading to ion toxicity(Gupta and Huang, 2014). Moreover, a salinity stress determines a nu-trient imbalance and/or a reduced capacity to detoxify the reactive oxy-gen species (Munns and Tester, 2008). It may then be plausible thatcarbon compounds released from maize biochar were in sufficientamount and possessed the required bioactivity to counteract the nega-tive effects of the co-extracted salts, thus favoring coleoptile growth inmaize seeds.
The chloride salt solutions containing concentrations equivalent tothose found in each AQU (ASE) were used to verify the effect on seedgermination of only the salts co-extracted from biochar. The length ofradicle and lateral seminal roots in ASE solutions were not significantlydifferent from control, although coleoptiles lengthwas progressively re-duced by increasing salt concentrations (Fig. 1 & SupplementaryTable 2). This result showed that the inhibition effect from wheat bio-char AQU and the coleoptile stimulation from maize biochar AQU hadto be accounted to carbon compounds released by biochar rather thanto the co-extracted inorganicmaterials. These organicmolecules solubi-lized in dilute acidic aqueous solution (Meers et al., 2007; Chang et al.,2014), may better represent the biochar's bioactivity in the acidicrhizospheric environment (McNear, 2013) than the organic compoundsartificially released from biochar in neutral and basic solutions (Linet al., 2012; Lou et al., 2016; Luo et al., 2015; Rogovska et al., 2012;Smith et al., 2013a, 2013b). In real conditions, Güereña et al. (2013) re-ported that maize biochar applied in a maize cropping system did notaffect maize yields, whereas Zhang et al. (2012, 2016) showed insteadthat wheat biochar amendments to soil significantly increased maizegrowth. Although these reports were not in line with our findings ongermination, they indicate the necessity to clarify the chemical bioactivemechanisms before attempting to control the numerous soil factors thatdetermine biochars' activities on plant.
3.3. Point of Zero Charge (PZC)
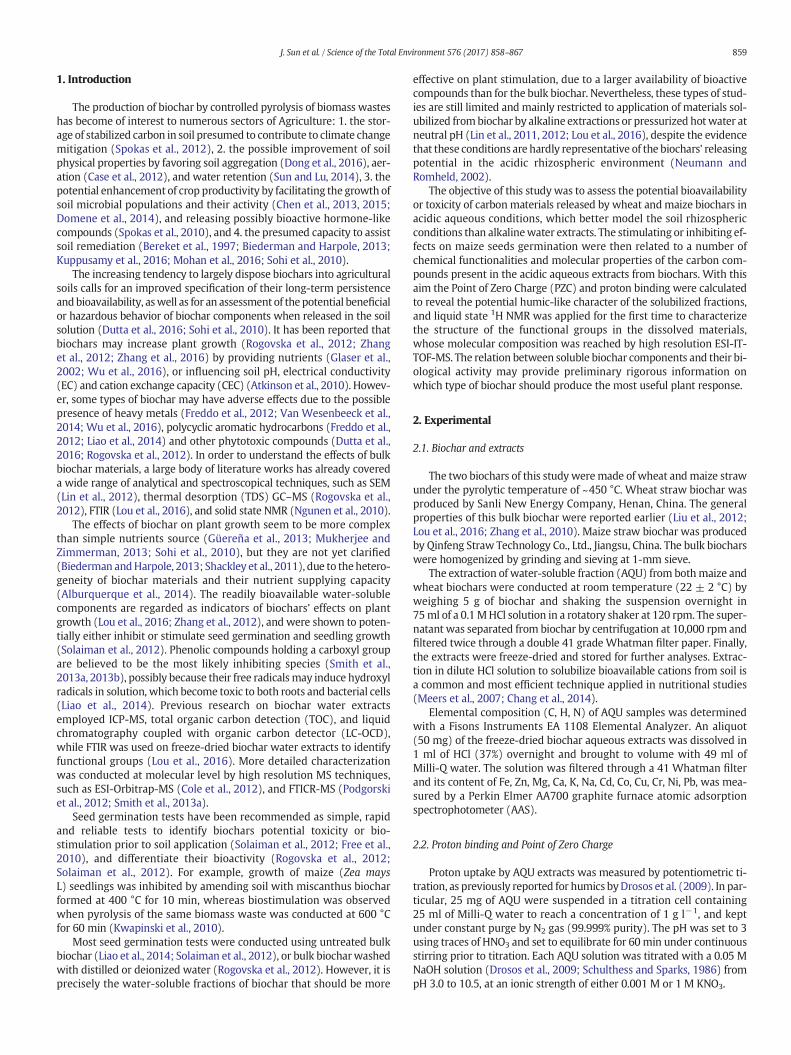
A characterization of the electrolytic properties of AQU fractionswasachieved by pH-titrations at different ionic strengths. The difference inionic strength did not alter the charge of AQU from wheat biochar(Fig. 2A) and placed the Point of Zero Charge at about 5 (Fig. 2C), sug-gesting a main phenolic character without a Donnan Volume depen-dence. Conversely, the Point of Zero Charge of AQU from maizebiocharwas found at only 3.2 (Fig. 2D), and the pH-titrations of thisma-terial revealed an increasing Donnan affinity with ionic strength in bothphenolic and carboxyl pKa ranges (Fig. 2B). While both biochars com-prised a large amount of inorganic components responsible for PZCvalues, the lower PZC value for the maize biochar AQU, as well as itsDonnan behavior, suggested an abundance of organic compoundswith humic-like character. In fact, a charge at pH 4 that is smaller than1 equiv kg−1 and rises up to 3 equiv kg−1 at pH 10 in 1 M of KNO3, ischaracteristic of soil humic acids (Drosos et al., 2009). This indicationis in line with results by elemental analysis that showed an organic car-bon (OC) content in AQU from maize biochar 11 times greater than forwheat biochar AQU.
3.4. FTIR-ATR
The IR spectra revealed a different composition between the twobulk biochars (Supplementary Fig. 1). In particular, maize biochar ap-peared to contain a low amount of OH groups in the 3500–3000 cm−1
interval, while revealing prominent bands for aliphatic CH stretching
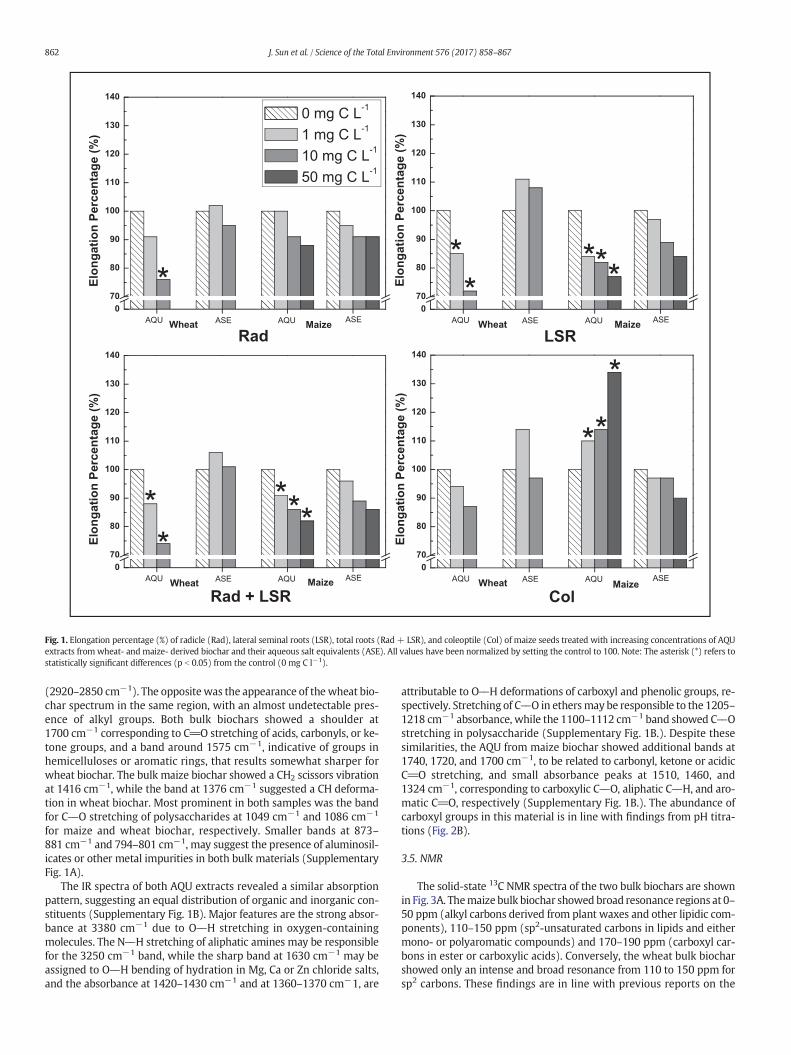
Fig. 1. Elongation percentage (%) of radicle (Rad), lateral seminal roots (LSR), total roots (Rad + LSR), and coleoptile (Col) of maize seeds treated with increasing concentrations of AQUextracts from wheat- and maize- derived biochar and their aqueous salt equivalents (ASE). All values have been normalized by setting the control to 100. Note: The asterisk (*) refers tostatistically significant differences (p b 0.05) from the control (0 mg C l−1).
862 J. Sun et al. / Science of the Total Environment 576 (2017) 858–867
(2920–2850 cm−1). The opposite was the appearance of the wheat bio-char spectrum in the same region, with an almost undetectable pres-ence of alkyl groups. Both bulk biochars showed a shoulder at1700 cm−1 corresponding to C_O stretching of acids, carbonyls, or ke-tone groups, and a band around 1575 cm−1, indicative of groups inhemicelluloses or aromatic rings, that results somewhat sharper forwheat biochar. The bulk maize biochar showed a CH2 scissors vibrationat 1416 cm−1, while the band at 1376 cm−1 suggested a CH deforma-tion in wheat biochar. Most prominent in both samples was the bandfor C\\O stretching of polysaccharides at 1049 cm−1 and 1086 cm−1
for maize and wheat biochar, respectively. Smaller bands at 873–881 cm−1 and 794–801 cm−1, may suggest the presence of aluminosil-icates or other metal impurities in both bulk materials (SupplementaryFig. 1A).
The IR spectra of both AQU extracts revealed a similar absorptionpattern, suggesting an equal distribution of organic and inorganic con-stituents (Supplementary Fig. 1B). Major features are the strong absor-bance at 3380 cm−1 due to O\\H stretching in oxygen-containingmolecules. The N\\H stretching of aliphatic amines may be responsiblefor the 3250 cm−1 band, while the sharp band at 1630 cm−1 may beassigned to O\\H bending of hydration in Mg, Ca or Zn chloride salts,and the absorbance at 1420–1430 cm−1 and at 1360–1370 cm−1, are
attributable to O\\H deformations of carboxyl and phenolic groups, re-spectively. Stretching of C\\O in ethersmay be responsible to the 1205–1218 cm−1 absorbance, while the 1100–1112 cm−1 band showed C\\Ostretching in polysaccharide (Supplementary Fig. 1B.). Despite thesesimilarities, the AQU from maize biochar showed additional bands at1740, 1720, and 1700 cm−1, to be related to carbonyl, ketone or acidicC_O stretching, and small absorbance peaks at 1510, 1460, and1324 cm−1, corresponding to carboxylic C\\O, aliphatic C\\H, and aro-matic C_O, respectively (Supplementary Fig. 1B.). The abundance ofcarboxyl groups in this material is in line with findings from pH titra-tions (Fig. 2B).
3.5. NMR
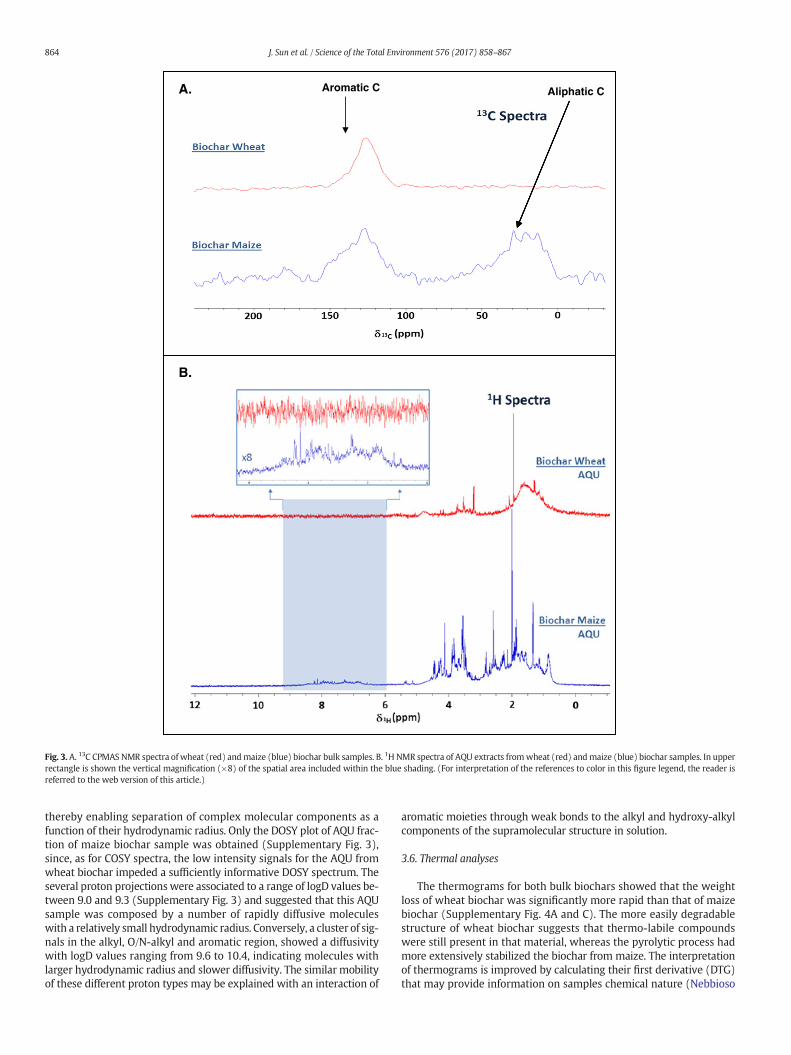
The solid-state 13C NMR spectra of the two bulk biochars are shownin Fig. 3A. Themaize bulk biochar showed broad resonance regions at 0–50 ppm (alkyl carbons derived from plant waxes and other lipidic com-ponents), 110–150 ppm (sp2-unsaturated carbons in lipids and eithermono- or polyaromatic compounds) and 170–190 ppm (carboxyl car-bons in ester or carboxylic acids). Conversely, the wheat bulk biocharshowed only an intense and broad resonance from 110 to 150 ppm forsp2 carbons. These findings are in line with previous reports on the
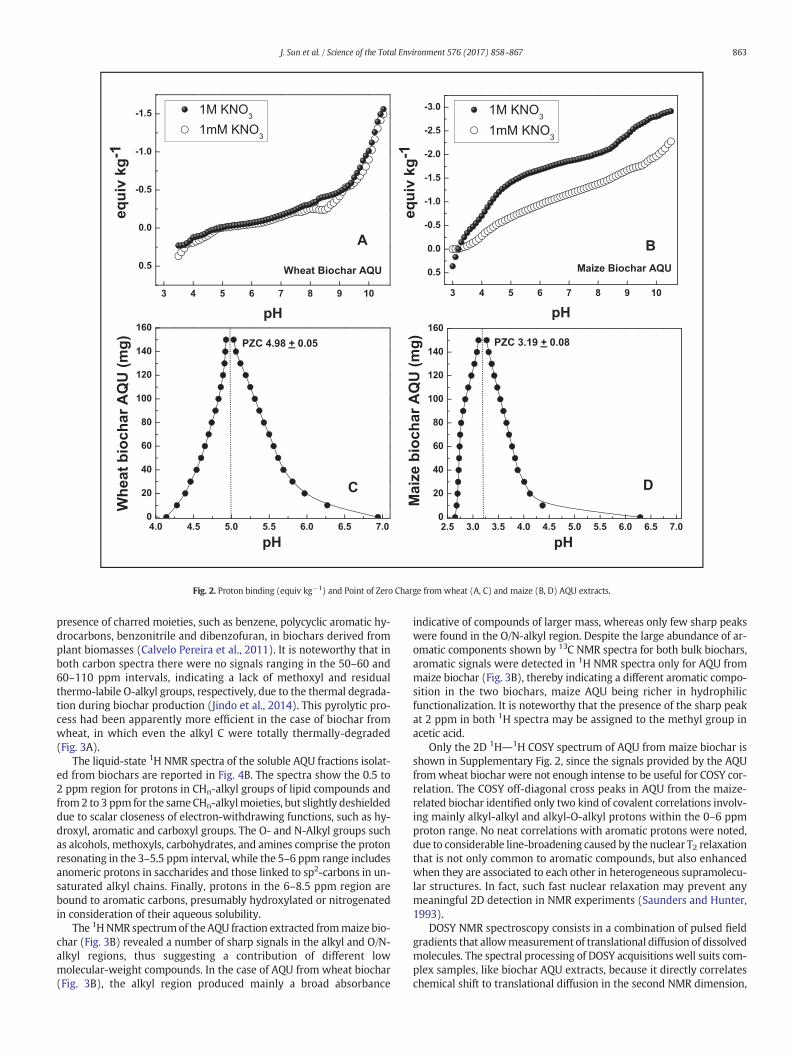
Fig. 2. Proton binding (equiv kg−1) and Point of Zero Charge from wheat (A, C) and maize (B, D) AQU extracts.
863J. Sun et al. / Science of the Total Environment 576 (2017) 858–867
presence of charred moieties, such as benzene, polycyclic aromatic hy-drocarbons, benzonitrile and dibenzofuran, in biochars derived fromplant biomasses (Calvelo Pereira et al., 2011). It is noteworthy that inboth carbon spectra there were no signals ranging in the 50–60 and60–110 ppm intervals, indicating a lack of methoxyl and residualthermo-labile O-alkyl groups, respectively, due to the thermal degrada-tion during biochar production (Jindo et al., 2014). This pyrolytic pro-cess had been apparently more efficient in the case of biochar fromwheat, in which even the alkyl C were totally thermally-degraded(Fig. 3A).
The liquid-state 1H NMR spectra of the soluble AQU fractions isolat-ed from biochars are reported in Fig. 4B. The spectra show the 0.5 to2 ppm region for protons in CHn-alkyl groups of lipid compounds andfrom2 to 3 ppm for the sameCHn-alkylmoieties, but slightly deshieldeddue to scalar closeness of electron-withdrawing functions, such as hy-droxyl, aromatic and carboxyl groups. The O- and N-Alkyl groups suchas alcohols, methoxyls, carbohydrates, and amines comprise the protonresonating in the 3–5.5 ppm interval, while the 5–6 ppm range includesanomeric protons in saccharides and those linked to sp2-carbons in un-saturated alkyl chains. Finally, protons in the 6–8.5 ppm region arebound to aromatic carbons, presumably hydroxylated or nitrogenatedin consideration of their aqueous solubility.
The 1HNMR spectrumof the AQU fraction extracted frommaize bio-char (Fig. 3B) revealed a number of sharp signals in the alkyl and O/N-alkyl regions, thus suggesting a contribution of different lowmolecular-weight compounds. In the case of AQU from wheat biochar(Fig. 3B), the alkyl region produced mainly a broad absorbance
indicative of compounds of larger mass, whereas only few sharp peakswere found in the O/N-alkyl region. Despite the large abundance of ar-omatic components shown by 13C NMR spectra for both bulk biochars,aromatic signals were detected in 1H NMR spectra only for AQU frommaize biochar (Fig. 3B), thereby indicating a different aromatic compo-sition in the two biochars, maize AQU being richer in hydrophilicfunctionalization. It is noteworthy that the presence of the sharp peakat 2 ppm in both 1H spectra may be assigned to the methyl group inacetic acid.
Only the 2D 1H\\1H COSY spectrum of AQU from maize biochar isshown in Supplementary Fig. 2, since the signals provided by the AQUfromwheat biochar were not enough intense to be useful for COSY cor-relation. The COSY off-diagonal cross peaks in AQU from the maize-related biochar identified only two kind of covalent correlations involv-ing mainly alkyl-alkyl and alkyl-O-alkyl protons within the 0–6 ppmproton range. No neat correlations with aromatic protons were noted,due to considerable line-broadening caused by the nuclear T2 relaxationthat is not only common to aromatic compounds, but also enhancedwhen they are associated to each other in heterogeneous supramolecu-lar structures. In fact, such fast nuclear relaxation may prevent anymeaningful 2D detection in NMR experiments (Saunders and Hunter,1993).
DOSY NMR spectroscopy consists in a combination of pulsed fieldgradients that allowmeasurement of translational diffusion of dissolvedmolecules. The spectral processing of DOSY acquisitions well suits com-plex samples, like biochar AQU extracts, because it directly correlateschemical shift to translational diffusion in the second NMR dimension,
A.
B.
Aromatic C Aliphatic C
Fig. 3. A. 13C CPMAS NMR spectra of wheat (red) andmaize (blue) biochar bulk samples. B. 1H NMR spectra of AQU extracts fromwheat (red) andmaize (blue) biochar samples. In upperrectangle is shown the vertical magnification (×8) of the spatial area included within the blue shading. (For interpretation of the references to color in this figure legend, the reader isreferred to the web version of this article.)
864 J. Sun et al. / Science of the Total Environment 576 (2017) 858–867
thereby enabling separation of complex molecular components as afunction of their hydrodynamic radius. Only the DOSY plot of AQU frac-tion of maize biochar sample was obtained (Supplementary Fig. 3),since, as for COSY spectra, the low intensity signals for the AQU fromwheat biochar impeded a sufficiently informative DOSY spectrum. Theseveral proton projections were associated to a range of logD values be-tween 9.0 and 9.3 (Supplementary Fig. 3) and suggested that this AQUsample was composed by a number of rapidly diffusive moleculeswith a relatively small hydrodynamic radius. Conversely, a cluster of sig-nals in the alkyl, O/N-alkyl and aromatic region, showed a diffusivitywith logD values ranging from 9.6 to 10.4, indicating molecules withlarger hydrodynamic radius and slower diffusivity. The similar mobilityof these different proton types may be explained with an interaction of
aromatic moieties through weak bonds to the alkyl and hydroxy-alkylcomponents of the supramolecular structure in solution.
3.6. Thermal analyses
The thermograms for both bulk biochars showed that the weightloss of wheat biochar was significantly more rapid than that of maizebiochar (Supplementary Fig. 4A and C). The more easily degradablestructure of wheat biochar suggests that thermo-labile compoundswere still present in that material, whereas the pyrolytic process hadmore extensively stabilized the biochar from maize. The interpretationof thermograms is improved by calculating their first derivative (DTG)that may provide information on samples chemical nature (Nebbioso

0.05 0.10 0.15 0.20 0.25 0.30
1.2
1.4
1.6
1.8
2.0
2.2 Molecules Common in Both AQU Molecules only in Wheat AQU Molecules only in Maize AQU
Ato
mic
H/C
rat
io
Atomic O/C ratio
A.
B.
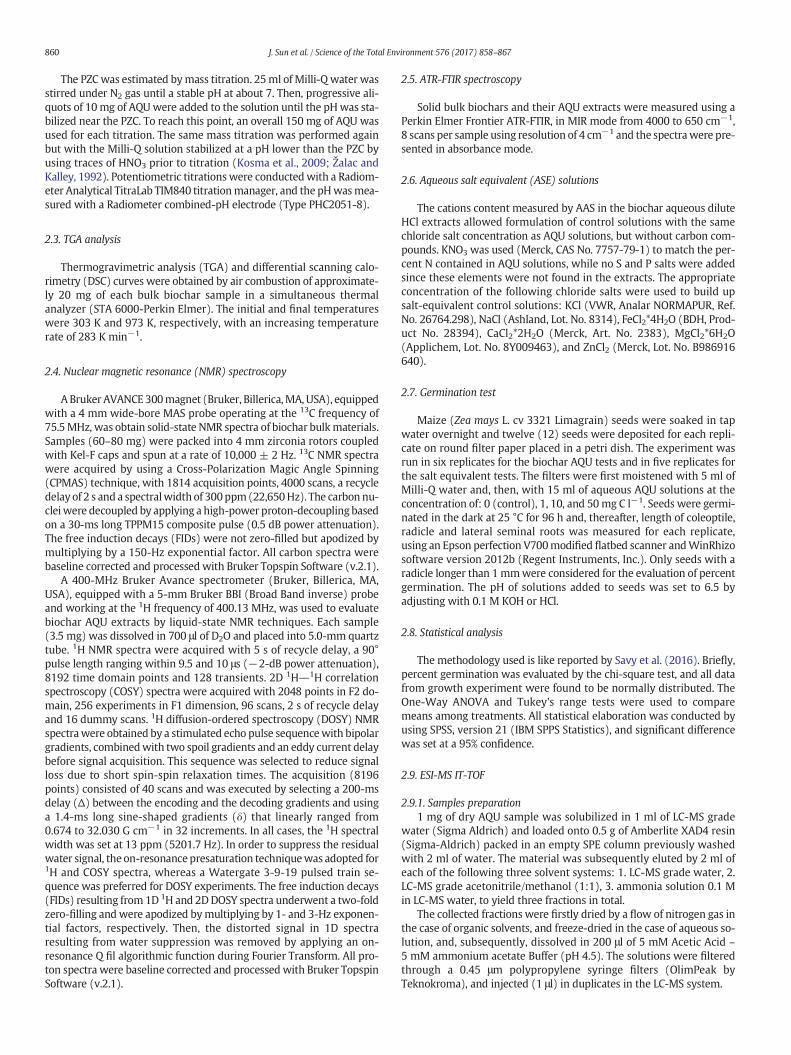
Fig. 4. A. Most characteristic heterocyclic nitrogen molecule identified in ESI-IT-TOF massspectra of AQU extracts. B. Van Krevelen plot of wheat and maize biochar AQU moleculesidentified by ESI-IT-TOF.
Table 1Empirical formulae ofmost abundantmolecules in both AQU extracts and specific to eithermaize or wheat AQU, as detected by ESI-IT-TOF mass spectra.
In both AQU Maize AQU Wheat AQU
C21H29NO3 C12H19N5O C16H35NO4
C13H22N4O3 C14H18N2O2 C17H24N4OC21H32N4O3 C15H20N4O3 C11H16N4O3
C13H16N4O2
C19H23NO3
865J. Sun et al. / Science of the Total Environment 576 (2017) 858–867
and Piccolo, 2011). TheDTGprofile for biochar fromwheat showed a se-ries of small peaks in the range of 473–673 K (Supplementary Fig. 4B),attributable to residual carbohydrates (Martin et al., 2010; Savy andPiccolo, 2014). Moreover, peaks within the 673–873 K range, presentin the first derivative of both bulk biochars, indicate the volatilizationof aromatics and char, as expected (Savy et al., 2015).
The indication by thermal analyses of the carbohydrate presence inbiochar from wheat is not in line with CPMAS-NMR results, which didnot reveal any carbohydrate signals (Fig. 3A), but agrees with the 1HNMR spectrum of the corresponding AQU that showed resonances forprotons in the chemical-shift range of carbohydrates (Fig. 3B). This con-firms previous findings which suggested that CPMAS-NMR spectrosco-py cannot describe the totality of molecular components in complexheterogeneousmixtures, unless this is simplified by a previous fraction-ation procedure (Nebbioso and Piccolo, 2011).
3.7. ESI-IT-TOF-MS
The identification of bioactive carbon molecules in AQU extracts re-sponsible for inhibition or promotion of seeds germination wasattempted by the high-resolution ESI-IT-TOF liquid mass spectrometry.The mass spectra of both AQUmaterials revealed a large amount of sig-nals (1419 and 858 for extracts of biochar from wheat and maize, re-spectively) corresponding to molecular ions in purified AQU solutions.However, only few signals accounted for a total abundance of N80% ofall masses appearing in the chromatographic TIC. These most abundantpeaks consisted in no N8 molecules in each AQU solution, 5 of whichwere common in both extracts and only three molecules were specificto each extract.
The empirical formulae of the detected compounds (Table 1) andtheir relative H/C and O/C atomic ratios were the basis of a van Krevelenplot that is useful to visually compare the molecular content of the twoAQUextracts (Fig. 4B). This plot indicated that themolecules detected inAQU frommaize biochar were placed in close proximities to each other,thereby defining a compact homogeneous mixture, whereas the
components found in AQU from wheat biochar were more dispersedover the plot, thus indicating a more heterogeneous assembly in solu-tion (Fig. 4B).
It is interesting to note that the majority of the identified moleculesin both AQU extracts comprised a structure with heterocyclic nitrogen,while some ethermoleculeswere detected only in AQU fromwheat bio-char and accounted only for the 4% of the total masses of this material(Supplementary Table 3). This result is for the first time reported in lit-erature for biochar extracts. In the past Podgorski et al. (2012) reportedaromatic compounds using FT-ICR-MS in pyrolized oak at 400 °C. Coleet al. (2012) found phenolic and carbohydrate compounds inorganosoluble extracts of switchgrass biochar. More recently, Smithet al. (2013a) reported CHO or CHON lignin-type compounds, aromaticspecies and carbohydrates present in pinewood, peanut shell and chick-en litter biochar water extracts in neutral pH.
The reason for the great abundance of the heterocyclic nitrogencompounds found in both AQU extracts of this study is probably dueto the specific pyrolytic process that favors the formation of such struc-tures, whose empirical formula pertains, nonetheless, to a great varietyof isomers. For example, themost probable structure for the C13H22O3N4
empirical formula (Fig. 4A), that is largely abundant in themass spectraof both AQU fractions, resulted common to 10,902 other isomers. Thesame can be said for all the empirical formulae used to build up thevan Krevelen plot of AQU extracts (Fig. 4B).
The type of small molecules (246–388Da) identified through ESI-IT-TOF mass spectrometry (Fig. 4A) seems to justify other chemical andspectroscopic characteristics of the AQU extracts from biochars. In fact,the detected molecules include C_O groups, aromatic rings, and ali-phatic chain, which are molecular characteristics that not only well ex-plain the FTIR results (Supplementary Fig. 1B), but are also in line with1. the alkyl and O/N-alkyl moieties revealed by liquid NMR spectra(Fig. 3B), 2. the alkyl groups covalently bound to aromatic rings sug-gested by 2D-COSY spectra as components of AQU from maize biocharcontained (Supplementary Fig. 2), and, 3. DOSY-NMR that suggested amixture of rather small molecular-weight components in the samemaize AQU extract (Supplementary Fig. 3).
4. Conclusion
The effects of AQU extracts from wheat and maize biochar on seedsbiological activity were generally negative for both materials, with theexception of AQU from maize biochar that significantly enhanced thecoleoptile length of maize seedlings. Parallel control experiments withsalt solutions equivalent to the concentrations found in AQU extracts in-dicated that negative effects may be well-explained by the greatamount of salts co-extracted during the dilute acidic extraction of bio-chars. Nevertheless, the salt concentration did not affect the elongationof maize seeds coleoptiles, which were significantly enhanced with in-creasing concentration of AQU from maize biochar. The difference inbioactivity between the two AQU extracts should be attributed eitherto the larger carbon content and C/N ratio in AQU from maize biochar,than for wheat biochar, or to the different arrangement of molecules re-leased in AQU extracts from both biochars.
Heterocyclic nitrogen compoundsmay be assumed to be responsiblefor some bioactivity of the carbon released in AQU from maize biochar.However, the same type of molecular structures was also identified in

866 J. Sun et al. / Science of the Total Environment 576 (2017) 858–867
AQU fromwheat biochar that showed instead toxic effect in all seed ger-mination tests. The reason for this different behavior may be first of allattributed to the significantly smaller amount of carbon released inAQU from wheat biochar that may have been insufficientlycounteracted the dominant salts toxicity. An alternative explanationmay also reside in a different mutual spatial arrangement of the mole-cules released in the AQU fractions, thus providing a diverse meta-stable conformation and consequent bioactivity to the twoAQUextracts(Piccolo, 2001; Nebbioso and Piccolo, 2012). This hypothesis may alsobe related to the difference in PZC values found between the two AQUextracts. The carbon-rich AQU from maize biochar appeared to behaveas a humic-like supramolecularmaterial, thereby implying a larger spe-cific bio-reactivity, than for the more simple arrangement that fewermolecules can establish in the highly salty AQU from wheat biochar. Infact, the humic-like supramolecular structures are recognized to en-hance biological activities in both seeds and vegetal tissues, due totheir capacity to adhere on target surfaces and slowly deliverhormone-like molecules (Canellas and Olivares, 2014; Savy et al.,2016). The high resolution ESI-IT-TOF results of this study imply atight intermolecular interaction among themost abundant carbonmol-ecules released in AQU frommaize biochar, thus envisaging a larger su-pramolecular bioactivity than for the aqueous fraction released fromwheat biochar.
Our findings indicate that the detailed characterization of organiccompounds released in dilute acidic solution from crop biochars enablesto relate the structural properties of the solubilized carbon compoundsto their capacity to stimulate seed germination and, potentially, seedlinggrowth. We believe that the information acquired here may be of im-portance when evaluating the properties of biochars that improveseed potency and biostimulation of plant growth.
Acknowledgement
Authors are thankful to Ms. Silvana Cangemi and Mr. FrancoScognamiglio for assistance in elemental and metal analyses. The firstauthor received support by the China Scholarship Council(No.201506850025) to conduct research work in Italy.
Appendix A. Supplementary data
Supplementary data to this article can be found online at doi:10.1016/j.scitotenv.2016.10.095.
References
Alburquerque, J.A., Calero, J.M., Barrón, V., Torrent, J., del Campillo, M.C., Gallardo, A.,Villar, R., 2014. Effects of biochars produced from different feedstocks on soil proper-ties and sunflower growth. J. Plant Nutr. Soil Sci. 177, 16–25.
Atkinson, C.J., Fitzgerald, J.D., Hipps, N.A., 2010. Potential mechanisms for achieving agri-cultural benefits from biochar application to temperate soils: a review. Plant Soil 337,1–18.
Bereket, G., Arog, A.Z., Özel, M.Z., 1997. Removal of Pb (II), Cd (II), Cu (II), and Zn (II) fromaqueous solutions by adsorption on bentonite. J. Colloid Interface Sci. 187, 338–343.
Biederman, L.A., Harpole, W.S., 2013. Biochar and its effects on plant productivity and nu-trient cycling: a meta-analysis. GCB Bioenergy 5, 202–214.
Calvelo Pereira, R., Kaal, J., Camps-Arbestain, M., Lorenzo, P.R., Aitkenhead, W., Hedley, M.,et al., 2011. Contribution to characterisation of biochar to estimate the labile fractionof carbon. Org. Geochem. 42, 1331–1342.
Canellas, L.P., Olivares, F.L., 2014. Physiological responses to humic substances as plantgrowth promoter. Chem. Biol. Technol. Agric. 1, 3.
Case, S.D., McNamara, N.P., Reay, D.S., Whitaker, J., 2012. The effect of biochar addition onN2O and CO2 emissions from a sandy loam soil–the role of soil aeration. Soil Biol.Biochem. 51, 125–134.
Chang, Y.-T., Hseu, Z.-Y., Zehetner, F., 2014. Evaluation of phytoavailability of heavymetals to Chinese cabbage (Brassica chinensis L.) in rural soils. Sci. World J. http://dx.doi.org/10.1155/2014309396.
Chen, J., Liu, X., Zheng, J., Zhang, B., Lu, H., Chi, Z., et al., 2013. Biochar soil amendment in-creased bacterial but decreased fungal gene abundance with shifts in communitystructure in a slightly acid rice paddy from Southwest China. Appl. Soil Ecol. 71,33–44.
Chen, J., Liu, X., Li, L., Zheng, J., Qu, J., Zheng, J., et al., 2015. Consistent increase in abun-dance and diversity but variable change in community composition of bacteria in
topsoil of rice paddy under short term biochar treatment across three sites fromSouth China. Appl. Soil Ecol. 91, 68–79.
Cole, D.P., Smith, E.A., Lee, Y.J., 2012. High-resolution mass spectrometric characterizationof molecules on biochar from pyrolysis and gasification of switchgrass. Energy Fuel26, 3803–3809.
Domene, X., Mattana, S., Hanley, K., Enders, A., Lehmann, J., 2014. Medium-term effects ofcorn biochar addition on soil biota activities and functions in a temperate soilcropped to corn. Soil Biol. Biochem. 72, 152–162.
Dong, X., Guan, T., Li, G., Lin, Q., Zhao, X., 2016. Long-term effects of biochar amount on thecontent and composition of organic matter in soil aggregates under field conditions.J. Soils Sediments 16, 1481–1497.
Drosos, M., Jerzykiewicz, M., Deligiannakis, Y., 2009. H-binding groups in lignite vs. soilhumic acids: NICA-Donnan and spectroscopic parameters. J. Colloid Interface Sci.332, 78–84.
Dutta, T., Kwon, E., Bhattacharya, S.S., Jeon, B.H., Deep, A., Minori, U., Kim, K.H., 2016. Poly-cyclic aromatic hydrocarbons (PAHs) and volatile organic compounds (VOCs) in bio-char and biochar-amended soil: a review. GCB Bioenergy http://dx.doi.org/10.1111/gcbb.12363.
Freddo, A., Cai, C., Reid, B.J., 2012. Environmental contextualisation of potential toxic ele-ments and polycyclic aromatic hydrocarbons in biochar. Environ. Pollut. 171, 18–24.
Free, H.F., McGill, C.R., Rowarth, J.S., Hedley, M.J., 2010. The effect of biochars on maize(Zea mays) germination. N. Z. J. Agric. Res. 53, 1–4.
Glaser, B., Lehmann, J., Zech, W., 2002. Ameliorating physical and chemical properties ofhighly weathered soils in the tropics with charcoal–a review. Biol. Fertil. Soils 35,219–230.
Güereña, D., Lehmann, J., Hanley, K., Enders, A., Hyland, C., Riha, S., 2013. Nitrogen dynam-ics following field application of biochar in a temperate North American maize-basedproduction system. Plant Soil 365, 239–254.
Gupta, B., Huang, B., 2014. Mechanism of salinity tolerance in plants: physiological, bio-chemical, and molecular characterization. Inter. J. Genom. 1, 701596.
Jindo, K., Mizumoto, H., Sawada, Y., Sanchez-Monedero, M.A., Sonoki, T., 2014. Physicaland chemical characterization of biochars derived from different agricultural resi-dues. Biogeosciences 11, 6613–6621.
Kosma, C., Balomenou, G., Salahas, G., Deligiannakis, Y., 2009. Electrolyte ion effects onCd2+ binding at Al2O3 surface: specific synergism versus bulk effects. J. Colloid Inter-face Sci. 331, 263–274.
Kuppusamy, S., Thavamani, P., Megharaj, M., Venkateswarlu, K., Naidu, R., 2016. Agro-nomic and remedial benefits and risks of applying biochar to soil: current knowledgeand future research directions. Environ. Int. 87, 1–12.
Kwapinski, W., Byrne, C.M., Kryachko, E., Wolfram, P., Adley, C., Leahy, J.J., et al., 2010. Bio-char from biomass and waste. Waste Biomass Valoriz. 1, 177–189.
Liao, S., Pan, B., Li, H., Zhang, D., Xing, B., 2014. Detecting free radicals in biochars and de-termining their ability to inhibit the germination and growth of corn, wheat and riceseedlings. Environ. Sci. Technol. 48, 8581–8587.
Lin, Y., Munroe, P., Joseph, S., Henderson, R., Ziolkowski, A., 2011. Water extractable or-ganic carbon in untreated and chemical treated biochars. Chemosphere 87, 151–157.
Lin, Y., Munroe, P., Joseph, S., Henderson, R., 2012. Migration of dissolved organic carbonin biochars and biochar-mineral complexes. Pesq. Agrop. Brasileira 47, 677–686.
Liu, X., Qu, J., Li, L., Zhang, A., Zheng, J., Pan, G., 2012. Can biochar amendment be an eco-logical engineering technology to depress NO2 emission in rice paddies?-a cross sitefield experiment from South China. Ecol. Eng. 42, 168–173.
Lou, Y., Joseph, S., Li, L., Graber, E.R., Liu, X., Pan, G., 2016.Water extract from straw biocharused for plant growth promotion: an initial test. Bioresources 11, 249–266.
Luo, L., Xu, C., Chen, Z., Zhang, S., 2015. Properties of biomass-derived biochars: combinedeffects of operating conditions and biomass types. Bioresour. Technol. 192, 83–89.
Martin, A.R., Martins, M.A., da Silva, O.R.R.F., Mattoso, L.H.C., 2010. Studies on the thermalproperties of sisal fiber and its constituents. Thermochim. Acta 506, 14–19.
McNear Jr., D.H., 2013. The rhizosphere - roots, soil and everything in between. NatureEduc. Knowl. 4, 1.
Meers, E., Du Laing, G., Unamuno, V., Ruttens, A., Vangronsveld, J., Tack, F.M.G., Verloo,M.G., 2007. Comparison of cadmium extractability from soils by commonly used sin-gle extraction protocols. Geoderma 141, 247–259.
Mohan, D., Kumar, A., Pittman, C.U., 2016. Sustainable biochar-a tool for climate changemitigation, soil management and water and wastewater treatment. Geostatisticaland Geospatial Approaches for the Characterization of Natural Resources in the Envi-ronment. Springer International Publishing, pp. 949–952.
Mukherjee, A., Zimmerman, A.R., 2013. Organic carbon and nutrient release from a rangeof laboratory-produced biochars and biochar–soil mixtures. Geoderma 193, 122–130.
Munns, R., Tester, M., 2008. Mechanisms of salinity tolerance. Annu. Rev. Plant Biol. 59,651–681.
Nebbioso, A., Piccolo, A., 2011. Basis of a humeomics science: chemical fractionation andmolecular characterization of humic biosuprastructures. Biomacromolecules 12,1187–1199.
Nebbioso, A., Piccolo, A., 2012. Advances in humeomic: enhanced structural identificationof humic molecules after size fractionation of a soil humic acid. Anal. Chim. Acta 720,77–90.
Neumann, G., Romheld, V., 2002. Root-induced changes in the availability of nutrients inthe rhizosphere. In: Waisel, Y., Eshram, E., Beeckman, T. (Eds.), Plant Roots: The Hid-den Half. Marcel Dekker, New York, USA, pp. 617–649.
Ngunen, B.T., Lehmann, J., Hockaday, W.C., Joseph, S., Masiello, C.A., 2010. Temperaturesensitivity of black carbon decomposition and oxidation. Environ. Sci. Technol. 44,3324–3331.
Piccolo, A., 2001. The supramolecular structure of humic substances. Soil Sci. 166,810–832.
Podgorski, D.C., Hamdan, R., McKenna, A.M., Nyadong, L., Rodgers, R.P., Marshall, A.G.,Cooper, W.T., 2012. Characterization of pyrogenic black carbon by desorption

867J. Sun et al. / Science of the Total Environment 576 (2017) 858–867
atmospheric pressure photoionization Fourier transform ion cyclotron resonancemass spectrometry. Anal. Chem. 84, 1281–1287.
Rogovska, N., Laird, D., Cruse, R.M., Trabue, S., Heaton, E., 2012. Germination tests forassessing biochar quality. J. Environ. Qual. 41, 1014–1022.
Saunders, J.K.M., Hunter, B.K., 1993. Modern NMR Spectroscopy-A Guide for Chemists.2nd Edn. Oxford University Press, Oxford.
Savy, D., Piccolo, A., 2014. Physical–chemical characteristics of lignins separated from bio-masses for second-generation ethanol. Biomass Bioenergy 62, 58–67.
Savy, D., Cozzolino, V., Vinci, G., Nebbioso, A., Piccolo, A., 2015. Water-soluble lignins fromdifferent biomasses for energy stimulate the early development of maize (Zea mays,L.). Molecules 20, 19958–19970.
Savy, D., Cozzolino, V., Nebbioso, A., Drosos, M., Nuzzo, A., Mazzei, P., Piccolo, A., 2016.Humic-like bioactivity on emergence and early growth of maize (Zea mays L.) ofwater-soluble lignins isolated from biomass for energy. Plant Soil 402, 221–233.
Schulthess, C.P., Sparks, D.L., 1986. Backtitration technique for proton isotherm modelingof oxide surfaces. Soil Sci. Soc. Am. J. 50, 1406–1411.
Shackley, S., Hammond, J., Gaunt, J., Ibarrola, R., 2011. The feasibility and costs of biochardeployment in the UK. Carbon Manage. 2, 335–356.
Smith, C.R., Sleighter, R.L., Hatcher, P.G., Lee, J.W., 2013a. Molecular characterization ofinhibiting biochar water-extractable substances using electrospray ionization Fouriertransform ion cyclotron resonance mass spectrometry. Environ. Sci. Technol. 47,13294–13302.
Smith, C.R., Buzan, E.M., Lee, J.W., 2013b. Potential impact of biochar water-extractablesubstances on environmental sustainability. ACS Sustain. Chem. Eng. 1, 118–126.
Sohi, S.P., Krull, E., Lopez-Capel, E., Bol, R., 2010. A review of biochar and its use and func-tion in soil. Adv. Agron. 105, 47–82.
Solaiman, Z.M., Murphy, D.V., Abbott, L.K., 2012. Biochars influence seed germination andearly growth of seedlings. Plant Soil 353, 273–287.
Spokas, K.A., Baker, J.M., Reicosky, D.C., 2010. Ethylene: potential key for biochar amend-ment impacts. Plant Soil 333, 443–452.
Spokas, K.A., Cantrell, K.B., Novak, J.M., Archer, D.W., Ippolito, J.A., Collins, H.P., et al., 2012.Biochar: a synthesis of its agronomic impact beyond carbon sequestration. J. Environ.Qual. 41, 973–989.
Sun, F., Lu, S., 2014. Biochars improve aggregate stability, water retention, and pore-spaceproperties of clayey soil. J. Plant Nutr. Soil Sci. 177, 26–33.
Van Wesenbeeck, S., Prins, W., Ronsse, F., Antal Jr., M.J., 2014. Sewage sludge carboniza-tion for biochar applications. Fate of heavy metals. Energy Fuel 28, 5318–5326.
Wu, H., Che, X., Ding, Z., Hu, X., Creamer, A.E., Chen, H., Gao, B., 2016. Release of solubleelements from biochars derived from various biomass feedstocks. Environ. Sci. Pollut.Res. 23, 1905–1915.
Žalac, S., Kalley, N., 1992. Application of mass titration to the point of zero charge deter-mination. J. Colloid Interface Sci. 149, 233–240.
Zhang, A., Cui, L., Pan, G., Li, L., Hussain, Q., Zhang, X., et al., 2010. Effect of biochar amend-ment on yield and methane and nitrous oxide emissions from a rice paddy from TaiLake plain. China Agric. Ecosyst. Environ. 139, 469–475.
Zhang, A., Liu, Y., Pan, G., Hussain, Q., Li, L., Zheng, J., Zhang, X., 2012. Effect of biocharamendment onmaize yield and greenhouse gas emissions from a soil organic carbonpoor calcareous loamy soil from Central China Plain. Plant Soil 351, 263–275.
Zhang, D., Pan, G., Wu, G.,Wanjiru-Kibue, G., Li, L., Zhang, X., et al., 2016. Biochar helps en-hance maize productivity and reduce greenhouse gas emissions under balanced fer-tilization in a rainfed low fertility inceptisol. Chemosphere 142, 106–113.