Embed Size (px)
Citation preview
Miami-Dade County Public Schools Curriculum and Instruction (Science)
Science Research Course Supplement
School Year 2008-09
I.
1
The School Board of Miami-Dade County Public Schools
Mr. Agustin J. Barrera, Chair Ms. Perla Tabares Hantman, Vice Chair
Mr. Renier Diaz de la Portilla Ms. Evelyn Langlieb Greer
Dr. Wilbert "Tee" Holloway Dr. Martin Karp
Ms. Ana Rivas Logan Dr. Marta Pérez
Dr. Solomon C. Stinson
Dr. Rudolph F. Crew Superintendent of Schools
Ms. Antoinette P. Dunbar, Deputy Superintendent Curriculum and Instruction
Ms. Milagros R. Fornell, Assistant Superintendent
Secondary Curriculum and Instruction
Ms. Blanca M. Valle, Assistant Superintendent Elementary Curriculum and Instruction
Ms. Colleen Del Terzo, Administrative Director
Curriculum and Instruction (Science)

2
II. Introduction to Research Derived from the Middle French word recerche, recercher = to go about seeking. Research is an
organized and systematic way of finding answers to questions. It is an investigation or experimentation aimed at the discovery and interpretation of facts, revision of accepted theories or laws in the light of new facts, or practical application of such new or revised theories or laws. The primary aim for applied research is discovering, interpreting, and the development of methods and systems for the advancement of human knowledge on a wide variety of scientific matters of our world and the universe. Research can use the scientific method, but need not do so. The Process:
• Research Problem – A problem identified or a question is developed. • Literature Search – Search of all available information regarding problem. • Research Design – Development of the procedures needed to collect data. • Analysis, Presentation, and Discussion – Analysis, results, conclusions, and presentation of
research. Types of Research:
Scientific research relies on the application of the scientific method, providing scientific information and theories for the explanation of the nature and the properties of the world around us. Because research is designed to answer any imaginable question, it is often categorized according to (a) its practical objective, (b) methodology, and (c) types of questions asked1. Some of the most common types of research are: Basic, Applied, Qualitative, Quantitative, Experimental, Non-Experimental, Ethnographic, Historical, Descriptive, Correlational, Action, Evaluation, and Causal-Comparative. (a) Practical Objective
Basic research: Basic research is carried out to satisfy a strong interest about people, practices, and the natural world; but with no practical application in mind. This type of research is done to satisfy a need to know but has no immediate social consequence.
Applied Research: Research that is usually done to find practical solutions to problems. (b) Methodology
Quantitative Research: Research that relies on numerical data. Qualitative Research: Research that relies on narrative data. Experimental Research: Research that shows cause and effect relationships. The researcher
maintains control over all the factors that may affect the results of the experiment. Non-Experimental Research: Research where researcher observes an event without
manipulating any variables. (c) Types of Question
Ethnographic Research: Documents and explains social behavior within groups. Historical Research: Explores conditions, situations, and events.
Descriptive Research: Describes people, events, and currently existing conditions. Correlational Research: Explores the relationship between variables.
Action Research: Performed to improve existing conditions within a specific setting. It is usually designed and conducted by practitioners who analyze the data in order to improve their own practice.
1 Charles, C. M. and Mertler, Craig. Introduction to Educational Research, fourth edition. Allyn and Bacon (2002).
3
Evaluation Research: Performed to make judgments about procedures, programs, and materials.
Causal-Comparative Research: Explores the influence of a preexisting condition and attempts to identify a causative relationship between an independent variable and a dependent variable. However, this relationship is more suggestive than proven since the researcher does not have complete control over the independent variable. If the researcher had control over the independent variable, then the research would be classified as true experimental research. III. Inquiry and the Scientific Method
Teaching science as inquiry provides the opportunity to develop abilities and to enrich understanding of science. As students focus on the processes of doing investigations, they develop the ability to ask questions, investigate aspects of the world around them and use their observations to construct reasonable explanations for the questions posed2. Basic Skills of Scientific Inquiry:
• Observing • Classifying and sequencing • Communicating • Measuring • Predicting • Hypothesizing • Inferring • Defining, controlling, and manipulating variables in experimentation • Designing, constructing and interpreting models • Interpreting, analyzing and evaluating data
Uses of Scientific Inquiry: • Make connections with world situations • To encourage more active problem solving approach to learning and thinking • To apply math skills • Review what is already known in light of experimental evidence • Propose answers, explanations and predictions • Use tools to gather, analyze and interpret data
Simplest Form of the Inquiry Process3:
There is no simple recipe for doing science. The general method of scientific inquiry usually begins with a question which is raised while observing some natural phenomenon or event. If there is no known answer to the question posed, then one or more plausible hypotheses or explanations can be tested by means of a scientific experiment designed to answer the question. Therefore the process of doing science generally begins with a question for which there is no known answer. Scientists judge the success of a scientific law, theory or model by its accuracy in predicting natural phenomena. As experiments are repeated and re-designed, scientists continually refine the existing scientific laws, theories and models to better match experimental results, and to better predict natural phenomena.
2 National Science Education Standards (2002). 3 Adapted from Arizona State University’s Modeling program and PHS 110. http://acept.asu.edu/courses/phs110/course_info/welcome/welcome.html

4
Scientific Inquiry
The flow chart depicts a basic scheme of reasoning and the process of scientific inquiry
In the basic approach to scientific inquiry (or "scientific method"), once a scientific question has been posed, a scientist considers plausible hypotheses or explanations that might answer the question raised. Each hypothesis must then be tested by a separate experiment. The key to designing successful experiments is the identification of all variables relevant to both the observed phenomenon and the question posed. Ideally, a scientific experiment is one in which all experimental variables are controlled by the experimenter, with the exception of one. This means that only one variable is free to change, while all others are held constant.
Scientific inquiry involves thinking of ways to explain questions raised about events or occurrences, and using experiments to test for reasonable hypotheses. In fact, the various explanations conjured up by a scientist involve a creative process based on one's own personal experiences as well as known scientific laws and theories. Thinking of the initial question to ask about the observed incident, and all conceivable explanations (or hypotheses) are among the most creative moments in the process of scientific inquiry (i.e. "doing science"). Scientists must use "common sense", but research must be based on known laws and theories of science. Scientific knowledge is built in a "boot-strap" way, by building on, refining and revising existing laws and theories. Usually laws, theories and models are first developed as simple hypotheses. After repeated experiments, a hypothesis generally evolves in complexity. Scientists usually follow Occam’s razor’s principle when deciding between two equally plausible hypotheses (i.e. choosing the simplest one). Another important aspect of scientific inquiry is the questions that are developed after performing the experiment in order to validate the results and the hypothesis. The level of these questions can range from low-level to high level questions, depending on the information available and the expected
Repeat for Consistency
Hypothesis is supportedHypothesis not supported
Conclusions
Experimental Activity: Data Collection and
Analysis
Experiment Design
Hypothesis
An Event or Phenomenon
Question
5
outcome of the experiment. See Bloom’s Taxonomy and Webb’s Depth of Knowledge: Science Levels in Appendix D. IV. Legal and Ethical Principles
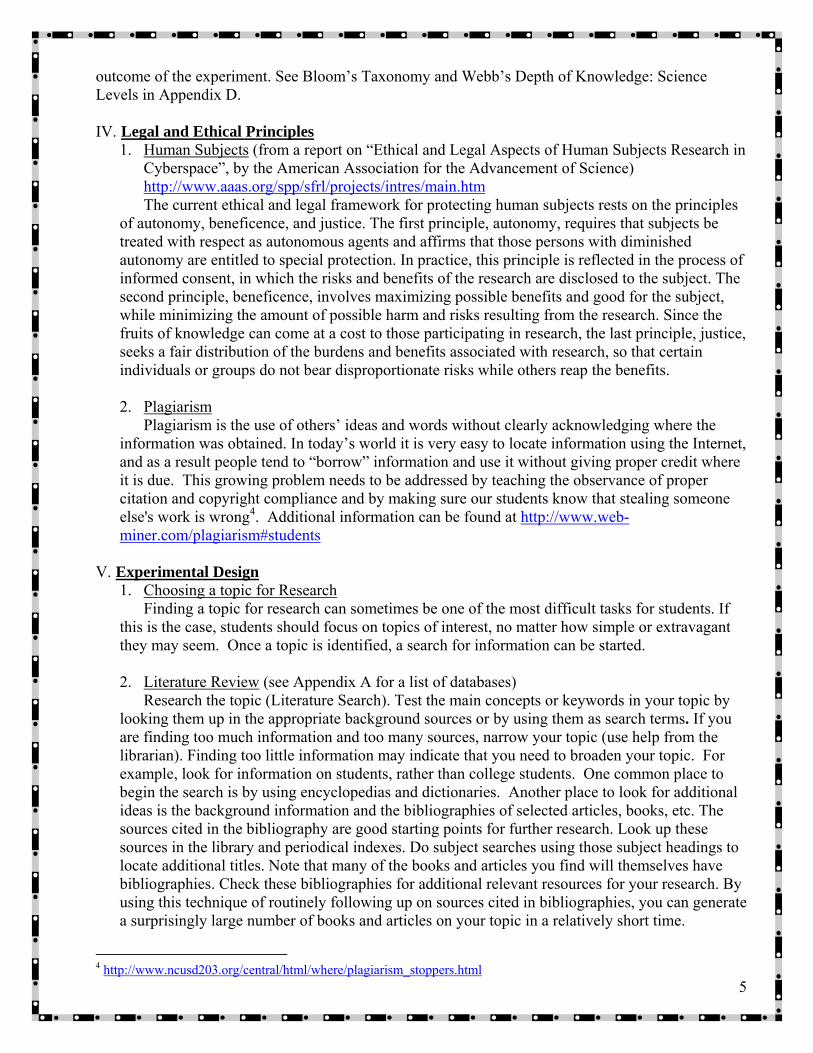
1. Human Subjects (from a report on “Ethical and Legal Aspects of Human Subjects Research in Cyberspace”, by the American Association for the Advancement of Science) http://www.aaas.org/spp/sfrl/projects/intres/main.htm The current ethical and legal framework for protecting human subjects rests on the principles
of autonomy, beneficence, and justice. The first principle, autonomy, requires that subjects be treated with respect as autonomous agents and affirms that those persons with diminished autonomy are entitled to special protection. In practice, this principle is reflected in the process of informed consent, in which the risks and benefits of the research are disclosed to the subject. The second principle, beneficence, involves maximizing possible benefits and good for the subject, while minimizing the amount of possible harm and risks resulting from the research. Since the fruits of knowledge can come at a cost to those participating in research, the last principle, justice, seeks a fair distribution of the burdens and benefits associated with research, so that certain individuals or groups do not bear disproportionate risks while others reap the benefits. 2. Plagiarism
Plagiarism is the use of others’ ideas and words without clearly acknowledging where the information was obtained. In today’s world it is very easy to locate information using the Internet, and as a result people tend to “borrow” information and use it without giving proper credit where it is due. This growing problem needs to be addressed by teaching the observance of proper citation and copyright compliance and by making sure our students know that stealing someone else's work is wrong4. Additional information can be found at http://www.web-miner.com/plagiarism#students
V. Experimental Design
1. Choosing a topic for Research Finding a topic for research can sometimes be one of the most difficult tasks for students. If
this is the case, students should focus on topics of interest, no matter how simple or extravagant they may seem. Once a topic is identified, a search for information can be started. 2. Literature Review (see Appendix A for a list of databases)
Research the topic (Literature Search). Test the main concepts or keywords in your topic by looking them up in the appropriate background sources or by using them as search terms. If you are finding too much information and too many sources, narrow your topic (use help from the librarian). Finding too little information may indicate that you need to broaden your topic. For example, look for information on students, rather than college students. One common place to begin the search is by using encyclopedias and dictionaries. Another place to look for additional ideas is the background information and the bibliographies of selected articles, books, etc. The sources cited in the bibliography are good starting points for further research. Look up these sources in the library and periodical indexes. Do subject searches using those subject headings to locate additional titles. Note that many of the books and articles you find will themselves have bibliographies. Check these bibliographies for additional relevant resources for your research. By using this technique of routinely following up on sources cited in bibliographies, you can generate a surprisingly large number of books and articles on your topic in a relatively short time.
4 http://www.ncusd203.org/central/html/where/plagiarism_stoppers.html
6
3. Designing the experiment
Once a topic is selected, the students need to develop the experiment design. The four-question strategy will help students identify variables, develop a hypothesis, and infer on the possible methods needed to obtain their responses (see chapters 3 and 4).
VI. Data Analysis
1. Collecting Data Once an experimental design has been developed students can perform their experiment and
collect data. The data then needs to be organized into a table (see chapter 5). 2. Analyzing Data
Graphing is the best method for visualizing trends in the collected data. The types of graphs used depend on the type of data collected. Bar graphs are used to visualize discrete data, any data measurements that are not quantified on an infinitely divisible numeric scale. Line graphs, on the other hand, are used to analyze continuous data. Continuous data can have almost any numeric value and can be meaningfully subdivided into finer and finer increments, depending upon the precision of the measurement system.
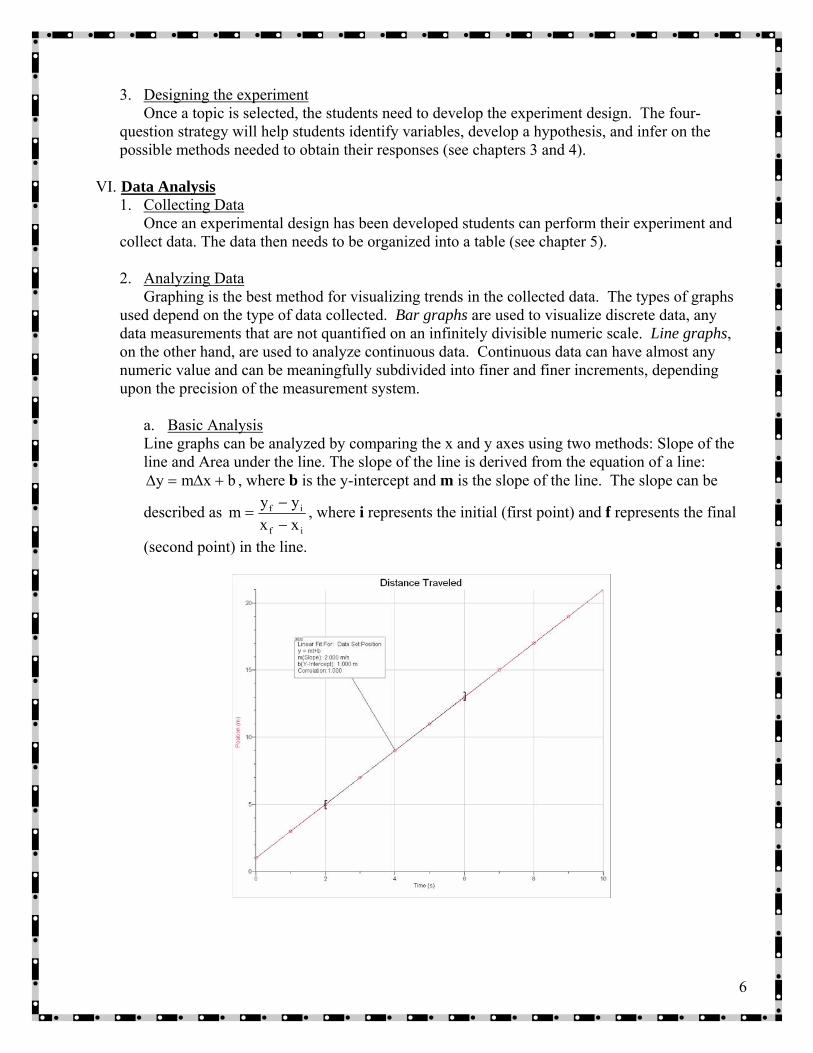
a. Basic Analysis Line graphs can be analyzed by comparing the x and y axes using two methods: Slope of the line and Area under the line. The slope of the line is derived from the equation of a line:
bxmy +Δ=Δ , where b is the y-intercept and m is the slope of the line. The slope can be
described as if
if
xxyym
−−
= , where i represents the initial (first point) and f represents the final
(second point) in the line.
7
The graph above represents data of a jogger who moved 21 meters in 10 seconds. The slope
of the graph represents sm2
s4m8
s2s6m5m13
)s(time)m(position
xy
==−−
=Δ
Δ=
ΔΔ , which can be
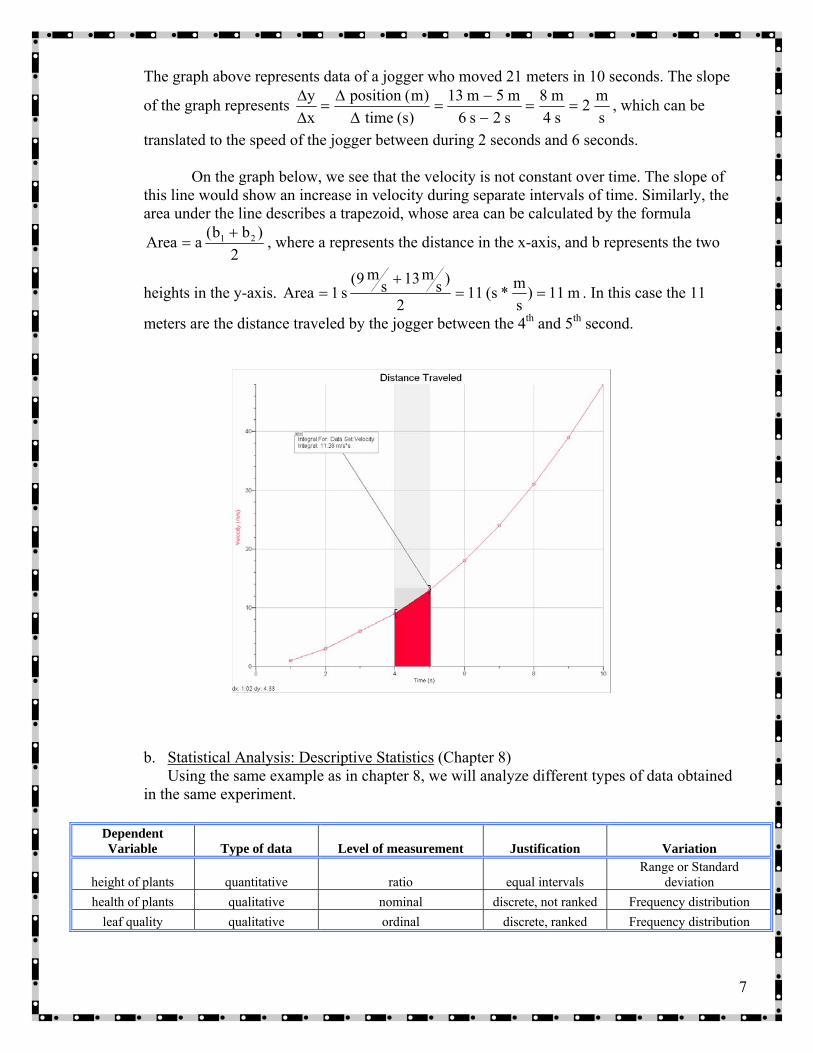
translated to the speed of the jogger between during 2 seconds and 6 seconds. On the graph below, we see that the velocity is not constant over time. The slope of
this line would show an increase in velocity during separate intervals of time. Similarly, the area under the line describes a trapezoid, whose area can be calculated by the formula
2)bb(aArea 21 +
= , where a represents the distance in the x-axis, and b represents the two
heights in the y-axis. m11)sm*s(11
2
)sm13s
m9(s1Area ==
+= . In this case the 11
meters are the distance traveled by the jogger between the 4th and 5th second.
b. Statistical Analysis: Descriptive Statistics (Chapter 8)
Using the same example as in chapter 8, we will analyze different types of data obtained in the same experiment.
Dependent Variable Type of data Level of measurement Justification Variation
height of plants quantitative ratio equal intervals Range or Standard
deviation health of plants qualitative nominal discrete, not ranked Frequency distribution
leaf quality qualitative ordinal discrete, ranked Frequency distribution

8
Height of Plants (cm) Health of Plants Leaf Quality Chemical concentration Chemical concentration Chemical concentration
0% 10% 20% 30% 0% 10% 20% 30% 0% 10% 20% 30% 12 14 8 4 H H H U 4 4 2 1 13 17 8 4 H U U U 4 3 3 1 14 18 10 5 H H H U 4 3 3 1 15 18 10 5 H H U H 4 4 2 2 15 18 10 5 H H H U 4 4 2 1 15 18 10 6 H U U U 4 2 2 1 15 19 11 7 H H U H 4 4 2 2 17 19 12 8 H H U U 4 4 3 2 18 20 12 8 H H U U 4 4 2 1 19 20 14 8 H H H U 4 3 2 1
Mean, Median, Mode, and Range
Reorganizing the data collected for the height of plants, we can easily find the mode, median, mean, and range.
Height of Plants (cm) Chemical concentration
0% 10% 20% 30% 12 14 8 4 13 17 8 4 14 18 10 5 15 18 10 5 15 18 10 5 15 18 10 6 15 19 11 7 17 19 12 8 18 20 12 8 19 20 14 8
Mode 15 18 10 5 and 8
Median 15 18 11 6
Mean 15.3 18.1 10.5 6
Range 7 6 6 4
For ratio-type data, the mean tends to provide the most meaningful analysis. When data sets contain extreme values, then the median or mode may provide more accurate tendencies. Frequency Distribution
Observing the qualitative data of the health of each plant, we can determine a simple frequency distribution.

9
Health of Plants Chemical concentration
0% 10% 20% 30% H H H U H U U U H H H U H H U H H H H U H U U U H H U H H H U U H H U U H H H U
Mode H H U U Frequency 10 H 8 H 4 H 2 H
0 U 2 U 6 U 8 U
Variance and Standard Deviation Variance is defined as the averaged squared distance from the mean, and the standard
deviation is the square root of the variance and measures how closely data is clustered about the mean.
Height of Plants (cm) Height of Plants (cm)
Chemical concentration Chemical concentration
Mean 15.3 Mean 18.1
0% Distance Squared distance 10% Distance Squared distance 12 -3.3 10.89 14 -4.1 16.8113 -2.3 5.29 17 -1.1 1.2114 -1.3 1.69 18 -0.1 0.0115 -0.3 0.09 18 -0.1 0.0115 -0.3 0.09 18 -0.1 0.0115 -0.3 0.09 18 -0.1 0.0115 -0.3 0.09 19 0.9 0.8117 1.7 2.89 19 0.9 0.8118 2.7 7.29 20 1.9 3.6119 3.7 13.69 20 1.9 3.61
Variance 4.21 Total 42.1 Variance 2.69 Total 26.9Standard deviation 2.05 Standard deviation 1.64
Distance from mean: 3.33.1512)Xx( i −=−=− Squared distance from the mean: 89.10)3.3()Xx( 22
i =−=−

10
Variance: 2.410
1.42n
)Xx((s2
i2 ==−Σ
=
Standard deviation: 05.221.4n
)Xx((s2
i ==−Σ
=
c. Statistical Analysis: Inferential Statistics (Chapter 10)
The purpose of inferential statistics is to determine the probability that experimental results are due to the actual treatment and not a chance occurrence. Two common statistical procedures are the:
• t test – used to determine significant differences between means (quantitative data). • chi-square test – used to determine significant differences between frequency
distributions (qualitative data).
Category Analysis of data Quantitative data Qualitative data central tendency measure Mean Median, Mode Descriptive
statistics variation measure
Range, Variance, Standard Deviation Frequency distribution
Inferential statistics Test t test Chi-square
t - Test Two basic formulas when measurements between two groups are compared: (1)
uncorrelated t test with equal sample size and (2) uncorrelated t test with unequal sample size. (1) Uncorrelated t test with n1 = n2
.sampleeachinitemsofnumbern;2groupofiancevars;1groupofiancevars;2groupofmeanX,1groupofmeanXwhere
;
nss
XXt
22
2121
22
21
21
==
+
−=
(2) Uncorrelated t test with n1 ≠ n2
.2sampleinitemsofnumbern;1sampleinitemsofnumbern;2groupofiancevars;1groupofiancevars;2groupofmeanX,1groupofmeanXwhere
;)
n1
n1.(
2nns)1n(s)1n(
XXt
2122
2121
2121
222
211
21
==
+−+
−+−
−=

11
Let’s examine the height of plants according to chemical content using the same data as before. Research hypothesis: higher concentrations of chemical X would relate to poorer growth in plants.
Height of Plants (cm) Health of Plants Leaf Quality
Chemical concentration Chemical concentration Chemical concentration
0% 10% 20% 30% 0% 10% 20% 30% 0% 10% 20% 30% 12 14 8 4 H H H U 4 4 2 1 13 17 8 4 H U U U 4 3 3 1 14 18 10 5 H H H U 4 3 3 1 15 18 10 5 H H U H 4 4 2 2 15 18 10 5 H H H U 4 4 2 1 15 18 10 6 H U U U 4 2 2 1 15 19 11 7 H H U H 4 4 2 2 17 19 12 8 H H U U 4 4 3 2 18 20 12 8 H H U U 4 4 2 1 19 20 14 8 H H H U 4 3 2 1
Two Treatment Groups (0% and 10%) Step1: State the null hypothesis.
The mean height of plants containing 10% of chemical X is not significantly different from the mean height of plants containing 0% of chemical X. Ho: μ10% = μ0%
Step 2: Establish level of significance.
α = 0.05 (5 in 100) Step 3: Calculate the means.
3.15nXX
1.18nXX
i%0
i%10
=Σ
=
=Σ
=
Step 4: Calculate the variance.
2.410
1.42n
)Xx((s
69.210
9.26n
)Xx((s
2i2
%0
2i2
%10
==−Σ
=
==−Σ
=
Step 5: Calculate t.
37.383.08.2
102.469.23.151.18
nss
)xx(t2%0
2%10
%0%10 ==+
−=
+
−=
12
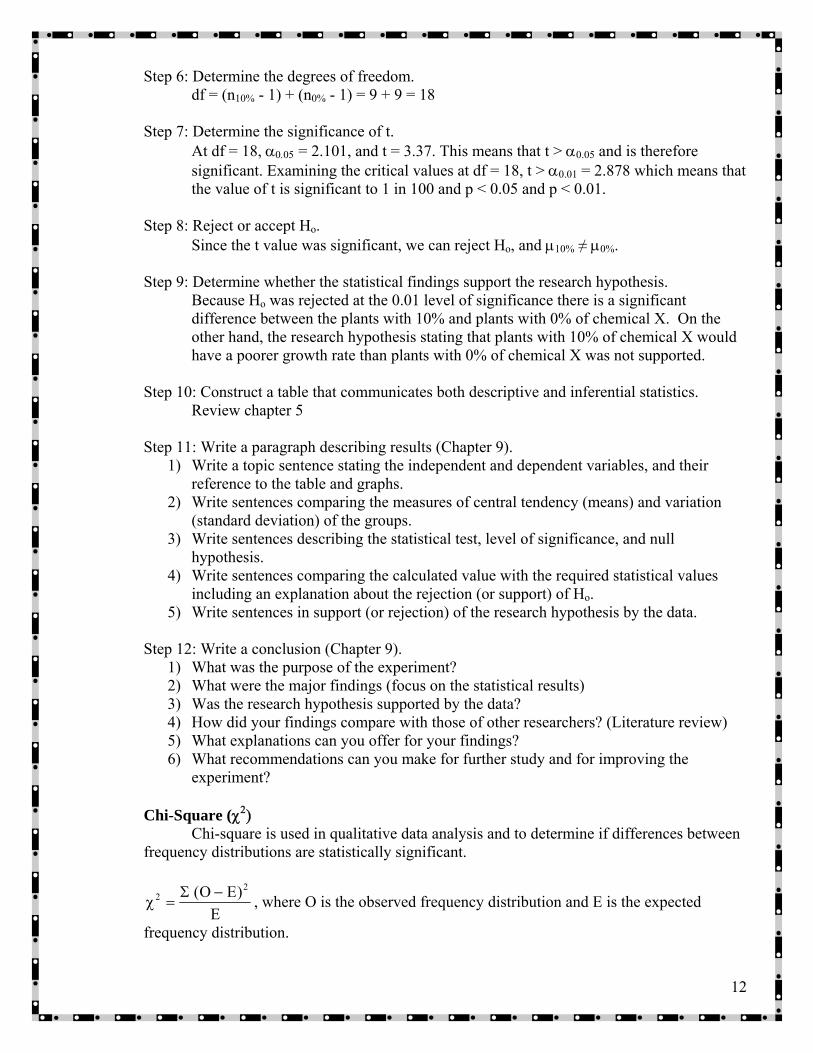
Step 6: Determine the degrees of freedom. df = (n10% - 1) + (n0% - 1) = 9 + 9 = 18
Step 7: Determine the significance of t.
At df = 18, α0.05 = 2.101, and t = 3.37. This means that t > α0.05 and is therefore significant. Examining the critical values at df = 18, t > α0.01 = 2.878 which means that the value of t is significant to 1 in 100 and p < 0.05 and p < 0.01.
Step 8: Reject or accept Ho.
Since the t value was significant, we can reject Ho, and μ10% ≠ μ0%. Step 9: Determine whether the statistical findings support the research hypothesis.
Because Ho was rejected at the 0.01 level of significance there is a significant difference between the plants with 10% and plants with 0% of chemical X. On the other hand, the research hypothesis stating that plants with 10% of chemical X would have a poorer growth rate than plants with 0% of chemical X was not supported.
Step 10: Construct a table that communicates both descriptive and inferential statistics.
Review chapter 5 Step 11: Write a paragraph describing results (Chapter 9).
1) Write a topic sentence stating the independent and dependent variables, and their reference to the table and graphs.
2) Write sentences comparing the measures of central tendency (means) and variation (standard deviation) of the groups.
3) Write sentences describing the statistical test, level of significance, and null hypothesis.
4) Write sentences comparing the calculated value with the required statistical values including an explanation about the rejection (or support) of Ho.
5) Write sentences in support (or rejection) of the research hypothesis by the data.
Step 12: Write a conclusion (Chapter 9). 1) What was the purpose of the experiment? 2) What were the major findings (focus on the statistical results) 3) Was the research hypothesis supported by the data? 4) How did your findings compare with those of other researchers? (Literature review) 5) What explanations can you offer for your findings? 6) What recommendations can you make for further study and for improving the
experiment?
Chi-Square (χ2) Chi-square is used in qualitative data analysis and to determine if differences between
frequency distributions are statistically significant.
E)EO( 2
2 −Σ=χ , where O is the observed frequency distribution and E is the expected
frequency distribution.

13
Let’s examine the health of plants according to chemical content using the same data as before. Research hypothesis: higher concentrations of chemical X would relate to poorer health in plants.
Height of Plants (cm) Health of Plants Leaf Quality Chemical concentration Chemical concentration Chemical concentration
0% 10% 20% 30% 0% 10% 20% 30% 0% 10% 20% 30% 12 14 8 4 H H H U 4 4 2 1 13 17 8 4 H U U U 4 3 3 1 14 18 10 5 H H H U 4 3 3 1 15 18 10 5 H H U H 4 4 2 2 15 18 10 5 H H H U 4 4 2 1 15 18 10 6 H U U U 4 2 2 1 15 19 11 7 H H U H 4 4 2 2 17 19 12 8 H H U U 4 4 3 2 18 20 12 8 H H U U 4 4 2 1 19 20 14 8 H H H U 4 3 2 1
Concentration 0% 10% 20% 30%
Mode H H U U Frequency 10 H 8 H 4 H 2 H
distribution 0 U 2 U 6 U 8 U Step 1: State the null-hypothesis
The frequency distribution of healthy plants without chemical X is not significantly different from the frequency distribution of plants with chemical X.
Step 2: Establish the level of significance.
α = 0.05
Step 3: Determine the observed frequency distribution.
10 H 8 H 4 H 2 H Frequency distribution 0 U 2 U 6 U 8 U
Step 4: Determine the expected theoretical frequency distribution.
10 H 10 H 10 H 10 HFrequency distribution 0 U 0 U 0 U 0 U
Step 5: Calculate χ2. (Note we did not include the data with 0% chemical X)
4.1010
1041064
1036
104
10)102(
10)104(
10)108(
E)EO( 2222
2 ==++=−
+−
+−
=−Σ
=χ
Step 6: Determine df.
df = (number of categories – 1) = 3 – 1 = 2
14
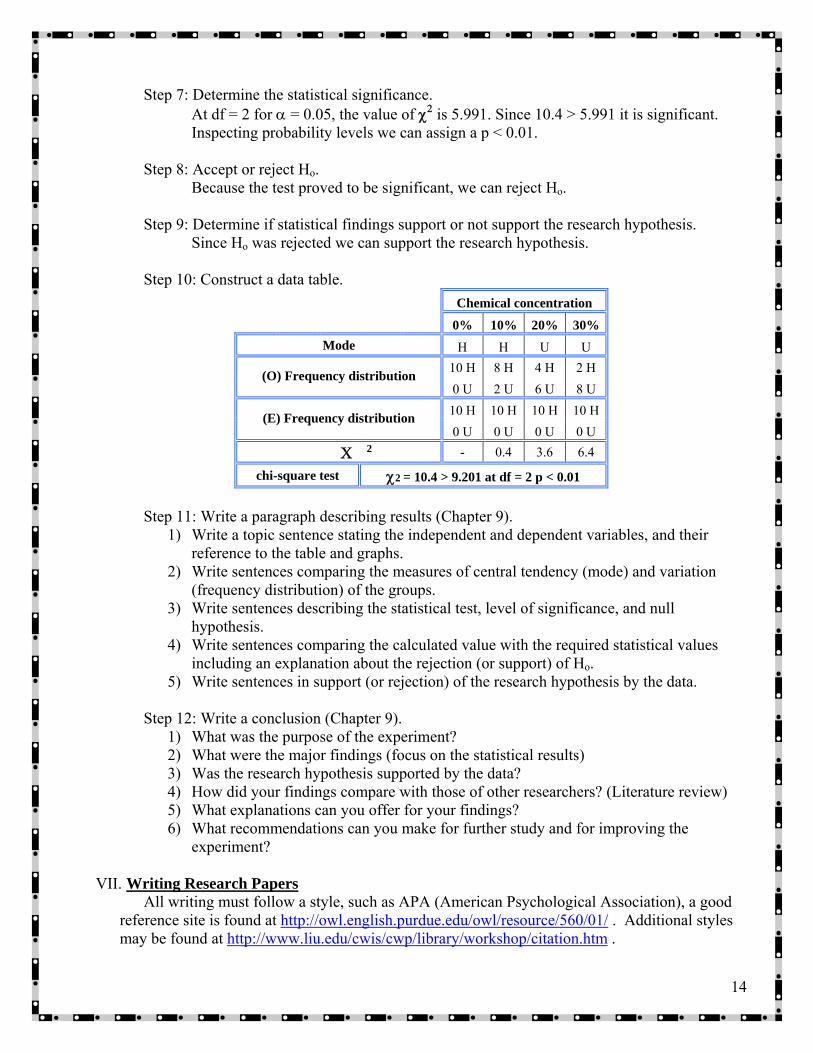
Step 7: Determine the statistical significance.
At df = 2 for α = 0.05, the value of χ2 is 5.991. Since 10.4 > 5.991 it is significant. Inspecting probability levels we can assign a p < 0.01.
Step 8: Accept or reject Ho. Because the test proved to be significant, we can reject Ho.
Step 9: Determine if statistical findings support or not support the research hypothesis. Since Ho was rejected we can support the research hypothesis.
Step 10: Construct a data table. Chemical concentration
0% 10% 20% 30% Mode H H U U
10 H 8 H 4 H 2 H (O) Frequency distribution 0 U 2 U 6 U 8 U
10 H 10 H 10 H 10 H (E) Frequency distribution 0 U 0 U 0 U 0 U
Χ 2 - 0.4 3.6 6.4
chi-square test χ2 = 10.4 > 9.201 at df = 2 p < 0.01 Step 11: Write a paragraph describing results (Chapter 9).
1) Write a topic sentence stating the independent and dependent variables, and their reference to the table and graphs.
2) Write sentences comparing the measures of central tendency (mode) and variation (frequency distribution) of the groups.
3) Write sentences describing the statistical test, level of significance, and null hypothesis.
4) Write sentences comparing the calculated value with the required statistical values including an explanation about the rejection (or support) of Ho.
5) Write sentences in support (or rejection) of the research hypothesis by the data.
Step 12: Write a conclusion (Chapter 9). 1) What was the purpose of the experiment? 2) What were the major findings (focus on the statistical results) 3) Was the research hypothesis supported by the data? 4) How did your findings compare with those of other researchers? (Literature review) 5) What explanations can you offer for your findings? 6) What recommendations can you make for further study and for improving the
experiment? VII. Writing Research Papers
All writing must follow a style, such as APA (American Psychological Association), a good reference site is found at http://owl.english.purdue.edu/owl/resource/560/01/ . Additional styles may be found at http://www.liu.edu/cwis/cwp/library/workshop/citation.htm .

15
When writing a report, it must contain the following: 1) Title: Write a sentence relating the independent and dependent variables that are
investigated. 2) Introduction (Background information): Describe the rationale, purpose, and
hypothesis for the investigation: a. Why did you conduct the experiment? b. What did you learn? c. What did you think would happen?
3) Experimental design diagram: a. Make a table with the independent variable (IV) on the first row. b. Make columns representing the different levels of the IV. c. Describe the number of trials under each level. d. List the dependent variable (DV) and constants below the table.
4) Procedures: List the steps necessary to complete the exploration. 5) Data and data analysis:
a. Construct a table depicting all the collected (measured) data (IV, DV); include any derived (calculated) figures.
b. Graph the measured data (DV on the y-axis, and IV on the x-axis if appropriate).
c. If graphical analysis is possible construct another graph to show analysis and the results.
d. Perform additional statistical tests, as needed. 6) Results: Follow the guidelines in chapter 9 for describing quantitative and/or
qualitative results. 7) Conclusion: Follow the guidelines in chapter 9 for describing the purpose, the
findings, and recommendations.
Additional instructions for formal scientific papers can be found in chapter 13. VIII. Presenting research papers or experiments
The two most common ways of presenting the results of an experiment are (1) oral presentation and (2) poster presentation. The oral presentation is usually done with a visual aide, such as a power point or overhead projector. The poster presentation can range in size from 22” x 30” to large foldables. Most competitions will require at least one of these types of presentations to be done; therefore, it will be advantageous for students to practice their public speaking skills and their ability to defend their work under rigorous questioning.
IX. Competitions
Science Competitions are an integral part of science instruction in Miami-Dade County Public Schools. They provide opportunities and experiences for students to solve problems in their environment and advocate for change through science-based projects. The main competition is the Science Fair, however, students have the opportunity to compete in other competitions:

16
Contest Name Grade Contest Information
Toshiba-ExploraVision Entry Due: January
K-3 4-6 7-9 10-12
• Designed to encourage students (1) to combine their imagination with their knowledge of science and technology in order to explore visions of the future and (2) to learn how to work in collaborative groups on an interdisciplinary project, which is not limited to high achievers alone.
• Students are required to (1) attend a public, private, or home school in the U.S., Canada, or U.S. Territories; (2) work in groups of 2-4, simulating research and development teams, together with a team coach and an optional mentor; (3) select a technology, researching how it works and why it was invented, and then projecting how that technology may change in the future; and (4) write a document and draw a series of web-page graphics to describe their idea.
• Regional winners make a Web site and a prototype of their future vision. • First Prize (4 teams): U.S. EE Savings Bond for each student worth $10,000 at maturity; Second Prize (4 teams): U.S. EE
Savings Bond for each student worth $5,000 at maturity; Regional Prize (24 teams): A laptop computer for each regional winning school and a special gift for each student, teacher, and mentor; Honorable Mention Recognition also included.
• Additional information may be found at: http://www.exploravision.org/
The Internet Science and Technology Fair (ISTF) Enrollment: September-November Deadline: February Winning Teams Announced: May Contact: TBA
3-5 6-8 9-12
• (1) Challenges students to use information-technology tools to discover and explore the future of science and engineering; (2) provides science, math, and computer teachers with a means to integrate the Internet and research methods into their curricula; and (3) offers scientists and engineers working within corporations, federal/state agencies, and academic research centers an opportunity to invest their time online as technical advisors who become "digital mentors."
• From October through February of each year, student teams apply technology to real-world problems when they participate in the ISTF and create a web page; they will employ technical applications from one of seven categories to solve a problem their team has identified or as the focus of their research.
• Team sizes of 3 to 7 students work best. NOTE: There must be at least three students on a team. However, there is not a maximum limit on the number of students per team.
Christopher Columbus Awards Entry Due: February Semifinalists Announced: March Finalist Competition: May Location: Orlando, FL Contact: TBA
6-8
• Provides students with a cutting-edge competition that combines science and technology with community problem solving in a real-world setting.
• With the help of an adult coach, students work in teams of 4 to identify an issue they care about and use science and technology to develop an innovative solution; they work with experts, conduct research, and put their ideas to the test just like adult scientists.
• The top thirty entries are chosen as semifinalists. Eight finalist teams attend National Championship Week. Every finalist team and its coach win an all-expense-paid trip to Walt Disney World® plus a $200 grant to further develop their ideas.
• Two Gold Medal winning teams receive a $2,000 U.S. Savings Bond and a plaque for each team member along with a plaque for their school.
• One team will receive the $25,000 grant as seed money to help bring its idea to life in the community. • Additional information may be found at: http://www.christophercolumbusawards.com

17
Contest Name Grade Contest Information
Discovery Youth Science Challenge (DYSC) Entry Due: June Semifinalists Announced: August Finalist Competition: October Location: Washington, D.C. Contact: Richard Lawrence 305-995-1976
6-8
• The competition is a middle-school version of the Intel Science Talent Search. • Students are nominated by affiliated fairs (M-DCPS selects nominees as a Special Area Award at the annual South Florida
Science and Engineering Fair). • Students send in completed packets and receive pins and t-shirts. Superior written communication is essential for rounds 1-3.
Round 4 is based on teamwork as well as individual oral communication. • Round 1 is scored according to a rubric; Round 2 selects the top 400 competitors based on the “rubric scoring”; and Round 3
selects the top 40 competitors. • Round 4 takes place at the Smithsonian Institute. The top 40 competitors receive an expense-paid trip to Washington, D.C.,
for the student and a parent to compete for place awards. • The Round 4 First-place award is $15,000; the Second-place award is $7,500; the Third-place award is $3,750; and students
in places 4-40 receive a $500 scholarship. Junior Solar Sprint Florida Solar Energy Center (FSEC) Entry Due: May Location: Cocoa, Fl National Competition Entry due: June Location: Denver, Colorado Contact: Richard Lawrence 305-995-1976
6-8
• Junior Solar Sprint challenges students to use scientific know-how, creative thinking, experimentation and teamwork to design and build high-performance solar electric vehicles.
• Middle school students, 6 - 8th grade are invited to design, build and race Junior Solar Sprint (JSS) cars. • The small model cars — powered entirely by solar energy and steered by wires — are built as team efforts guided by
teachers. • At each event cars are judged on technology, craftsmanship and appearance. • Each car then competes in the track portion of the event. • Vehicles race until three winning teams in each category are determined. • Online registration: http://www.fsec.ucf.edu/en/education/k-12/events/ewhiz_olympics.htm
South East Regional Middle School Science Bowl Florida Solar Energy Center (FSEC) Entry due: April Location: Cocoa, Fl National Competition Entry due: June Location: Denver, Colorado Contact: Richard Lawrence 305-995-1976
6-8
• Each competing team must consist of four student members. • There will be two separate parts to the Science Bowl competition at the Florida Regional – an elimination round and a double
elimination contest. • Multiple Choice Questions will be used in the elimination round. • Toss-up and bonus questions will be used in the double elimination round. • Online registration: http://www.fsec.ucf.edu/en/education/k-12/events/mssb/index.htm

18
Contest Name Grade Contest Information District Bridge Building Contest Entry due: January Location: Southland Mall Contact: Richard Lawrence 305-995-1976
6-8 9-12
• Students in grades 6-8 build balsa wood bridges according to Dade County specifications, which remain the same from year to year.
• Students in grades 9-12 build bass wood bridges according to International Rules. These rules change from year to year in various ways.
• First- to third-place winners (by efficiency) in grades 6-12 receive medals. • The builders of the two most efficient bridges in grades 9-12 receive a trip to the international contest where they will
represent Miami-Dade County. District Research Paper Contest Entry due: February Location: TBA Contact: Richard Lawrence 305-995-1976
6-8 9-12
• Students in grades 6-12 may write individual Experimental Research Papers according to the Intel format. • Papers are submitted to a committee, and it is determined if an oral presentation will be made. • Oral presentations are 10 minutes for students in grades 6-8 and 12 minutes for students in grades 9-12. Presenters may use
overhead transparencies, slides, or computers. (Students must provide their own computers.) • Judges are allowed 3 minutes for questions.
National Science Decathlon East Coast Conference: March/April Location: TBA National Tournament: April/May Location: TBA Contact: Richard Lawrence 305-995-1976
6-8 9-12
• Dedicated to promoting science education by organizing competitive, hands-on, science-based tournaments throughout the United States, each one made up of ten team events and up to four pilot events with sports names such as Bridge Building.
• Each team consists of a maximum of five students and two alternates. At any given tournament, these teams are then broken up into smaller groups, usually pairs, who represent their team while competing in various events.
• Additional information can be found at: http://www.sciencedecathlon.com/newsletters.htm
Florida Science Olympiad Regional Competition: January Location: TBA State Competition: March Location: TBA National Competition: May Location: TBA Contact: Richard Lawrence 305-995-1976
6-8 9-12
• To create a passion for learning science by supporting elementary and secondary Science Olympiad tournaments at building, district, county, state and national levels with an emphasis on teamwork and a commitment to excellence.
• To celebrate and recognize the outstanding achievement of both students and teachers in the areas of science and technology by awarding thousand of certificates, medals, trophies and scholarships.
• To promote partnerships among communities, businesses, industries, government and education. • To make science education more exciting so more students will enroll in science courses and engage in other science
activities like science reading, fairs, meetings and field trips. • To promote high levels of achievement and a commitment to excellence to demonstrate that American students can perform
at levels that surpass expectations of even practicing scientists and engineers. • To attract more students, particularly females and minorities, to professional and technical careers in science and technology,
including the teaching of those subject areas. • Each team is composed of 15 members who compete in one of five different scientific categories. • The top three middle and senior high schools attend the state competition which involves a total of 30 schools. • Additional information may be found at: http://www.floridascienceolympiad.org/

19
Contest Name Grade Contest Information Florida Junior Academy of Science (FJAS) Entry due: March Location: TBA Contact: Richard Lawrence 305-995-1976
6-12 • Schools may form their own FJAS Chapter. • Individual Experimental Research Papers are sent to FJAS evaluators. Individual Literary Research Papers can also be
submitted, evaluated, and selected for presentation. • Papers evaluated as superior are selected for presentation before peers and judges. Presentations can be oral and/or visual,
the latter involving computers, slides, and/or overhead transparencies. • Winners are presented with plaques, cash and travel awards, i.e. National Youth Science Camp
NASA Space Settlement Contest Entry due: March Contact: Richard Lawrence 305-995-1976
6-12
• An international contest at which all participants receive a certificate. • Students develop space settlement designs and related materials. • The Grand Prize winner will have his/her space colony design placed on the NASA Ames website. • Additional information can be obtained at: http://lifesci3.arc.nasa.gov/SpaceSettlement/Contest
South Florida Science and Engineering Fair Entry due: January Location: Southland Mall Contact: Richard Lawrence 305-995-1976
6-12
• There are 13 categories in which projects may compete, ranging from behavioral science, biochemistry, botany, chemistry, microbiology, and medicine to environmental science, earth science, computers, engineering, mathematics, physics, and zoology.
• Schools are given specific allocations, and the best projects are selected to represent specific schools. • The Fair is supported by Bell South Mobility; Icon, Inc.; Cutler Ridge Mall; Friends of the Science Fair; the Barry University
Biology Department; Showboard Inc.; and U-Haul. • In 2006, 43 different organizations gave over $10,000 worth of prizes and awards to student participants.
State Science and Engineering Fair of Florida Entry due: April Location: TBA Contact: Richard Lawrence 305-995-1976
6-12
• Representatives are selected from regional contests (Miami-Dade County selects 30 representatives). • They receive travel and room expenses. • Individual or team experimental research from 13 categories is presented on student-created boards and is orally presented to
judges. • Over $100,000 worth of scholarships, trips, work experiences, plaques, and other awards are presented to student
participants.
District and State Envirothon Entry due: February / March Location: TBA Contact: Mrs. Kirsten Daye 305-361-6767 # 118
9-12
• Schools receive information concerning a particular theme. In the past, topics such as fire and pollutants have been covered. • A team of 5 students compete together as a group. • The team competition involves hands-on activities in the “Great Outdoors.” • The winner represents Miami-Dade at the State Envirothon.
20
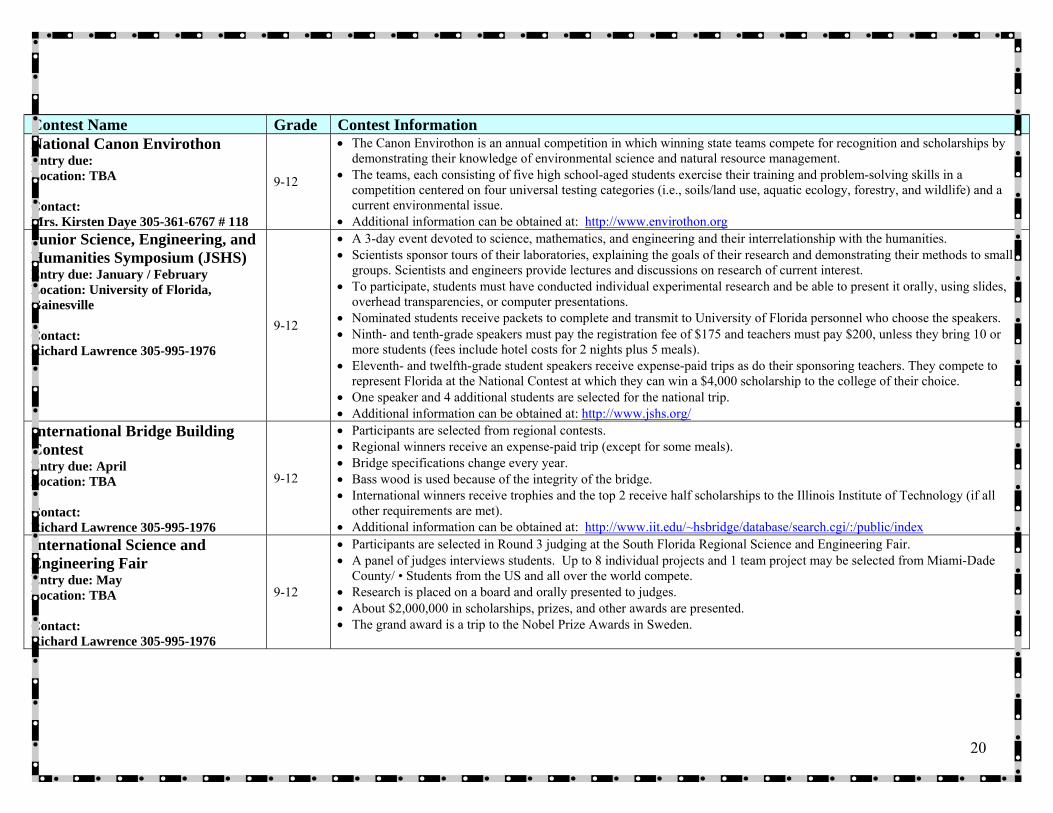
Contest Name Grade Contest Information National Canon Envirothon Entry due: Location: TBA Contact: Mrs. Kirsten Daye 305-361-6767 # 118
9-12
• The Canon Envirothon is an annual competition in which winning state teams compete for recognition and scholarships by demonstrating their knowledge of environmental science and natural resource management.
• The teams, each consisting of five high school-aged students exercise their training and problem-solving skills in a competition centered on four universal testing categories (i.e., soils/land use, aquatic ecology, forestry, and wildlife) and a current environmental issue.
• Additional information can be obtained at: http://www.envirothon.org Junior Science, Engineering, and Humanities Symposium (JSHS) Entry due: January / February Location: University of Florida, Gainesville Contact: Richard Lawrence 305-995-1976
9-12
• A 3-day event devoted to science, mathematics, and engineering and their interrelationship with the humanities. • Scientists sponsor tours of their laboratories, explaining the goals of their research and demonstrating their methods to small
groups. Scientists and engineers provide lectures and discussions on research of current interest. • To participate, students must have conducted individual experimental research and be able to present it orally, using slides,
overhead transparencies, or computer presentations. • Nominated students receive packets to complete and transmit to University of Florida personnel who choose the speakers. • Ninth- and tenth-grade speakers must pay the registration fee of $175 and teachers must pay $200, unless they bring 10 or
more students (fees include hotel costs for 2 nights plus 5 meals). • Eleventh- and twelfth-grade student speakers receive expense-paid trips as do their sponsoring teachers. They compete to
represent Florida at the National Contest at which they can win a $4,000 scholarship to the college of their choice. • One speaker and 4 additional students are selected for the national trip. • Additional information can be obtained at: http://www.jshs.org/
International Bridge Building Contest Entry due: April Location: TBA Contact: Richard Lawrence 305-995-1976
9-12
• Participants are selected from regional contests. • Regional winners receive an expense-paid trip (except for some meals). • Bridge specifications change every year. • Bass wood is used because of the integrity of the bridge. • International winners receive trophies and the top 2 receive half scholarships to the Illinois Institute of Technology (if all
other requirements are met). • Additional information can be obtained at: http://www.iit.edu/~hsbridge/database/search.cgi/:/public/index
International Science and Engineering Fair Entry due: May Location: TBA Contact: Richard Lawrence 305-995-1976
9-12
• Participants are selected in Round 3 judging at the South Florida Regional Science and Engineering Fair. • A panel of judges interviews students. Up to 8 individual projects and 1 team project may be selected from Miami-Dade
County/ • Students from the US and all over the world compete. • Research is placed on a board and orally presented to judges. • About $2,000,000 in scholarships, prizes, and other awards are presented. • The grand award is a trip to the Nobel Prize Awards in Sweden.
21
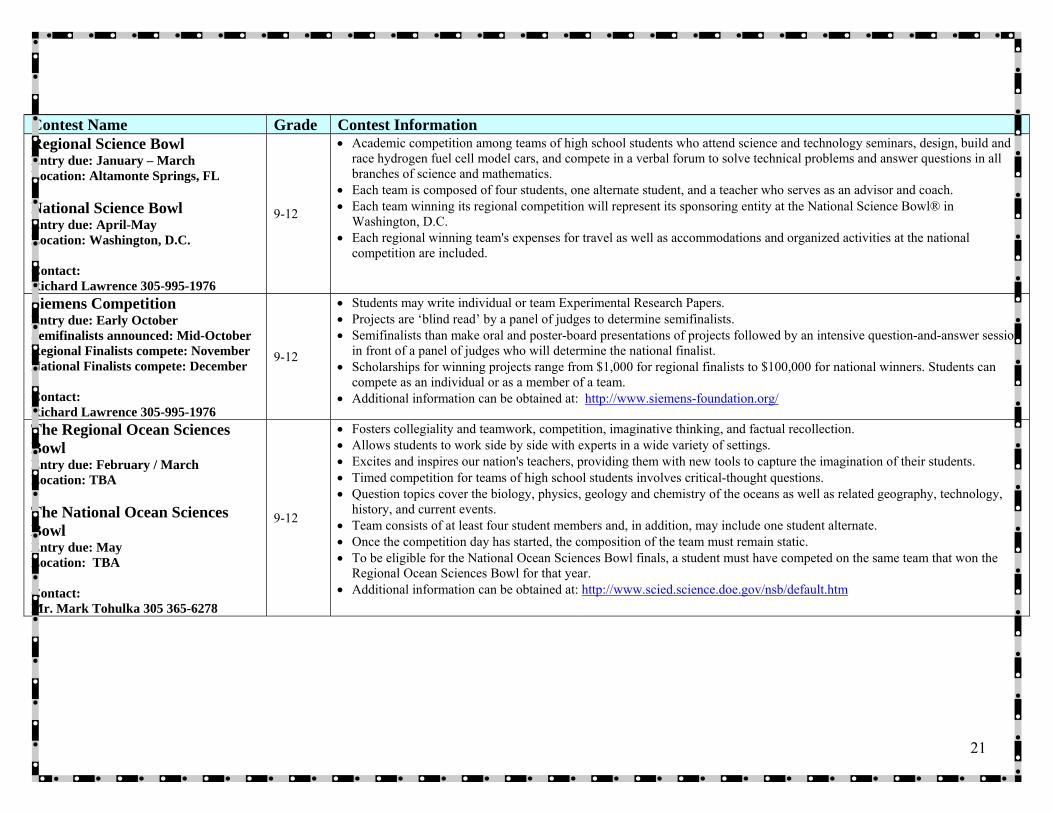
Contest Name Grade Contest Information Regional Science Bowl Entry due: January – March Location: Altamonte Springs, FL National Science Bowl Entry due: April-May Location: Washington, D.C. Contact: Richard Lawrence 305-995-1976
9-12
• Academic competition among teams of high school students who attend science and technology seminars, design, build and race hydrogen fuel cell model cars, and compete in a verbal forum to solve technical problems and answer questions in all branches of science and mathematics.
• Each team is composed of four students, one alternate student, and a teacher who serves as an advisor and coach. • Each team winning its regional competition will represent its sponsoring entity at the National Science Bowl® in
Washington, D.C. • Each regional winning team's expenses for travel as well as accommodations and organized activities at the national
competition are included.
Siemens Competition Entry due: Early October Semifinalists announced: Mid-October Regional Finalists compete: November National Finalists compete: December Contact: Richard Lawrence 305-995-1976
9-12
• Students may write individual or team Experimental Research Papers. • Projects are ‘blind read’ by a panel of judges to determine semifinalists. • Semifinalists than make oral and poster-board presentations of projects followed by an intensive question-and-answer session
in front of a panel of judges who will determine the national finalist. • Scholarships for winning projects range from $1,000 for regional finalists to $100,000 for national winners. Students can
compete as an individual or as a member of a team. • Additional information can be obtained at: http://www.siemens-foundation.org/
The Regional Ocean Sciences Bowl Entry due: February / March Location: TBA The National Ocean Sciences Bowl Entry due: May Location: TBA Contact: Mr. Mark Tohulka 305 365-6278
9-12
• Fosters collegiality and teamwork, competition, imaginative thinking, and factual recollection. • Allows students to work side by side with experts in a wide variety of settings. • Excites and inspires our nation's teachers, providing them with new tools to capture the imagination of their students. • Timed competition for teams of high school students involves critical-thought questions. • Question topics cover the biology, physics, geology and chemistry of the oceans as well as related geography, technology,
history, and current events. • Team consists of at least four student members and, in addition, may include one student alternate. • Once the competition day has started, the composition of the team must remain static. • To be eligible for the National Ocean Sciences Bowl finals, a student must have competed on the same team that won the
Regional Ocean Sciences Bowl for that year. • Additional information can be obtained at: http://www.scied.science.doe.gov/nsb/default.htm
22
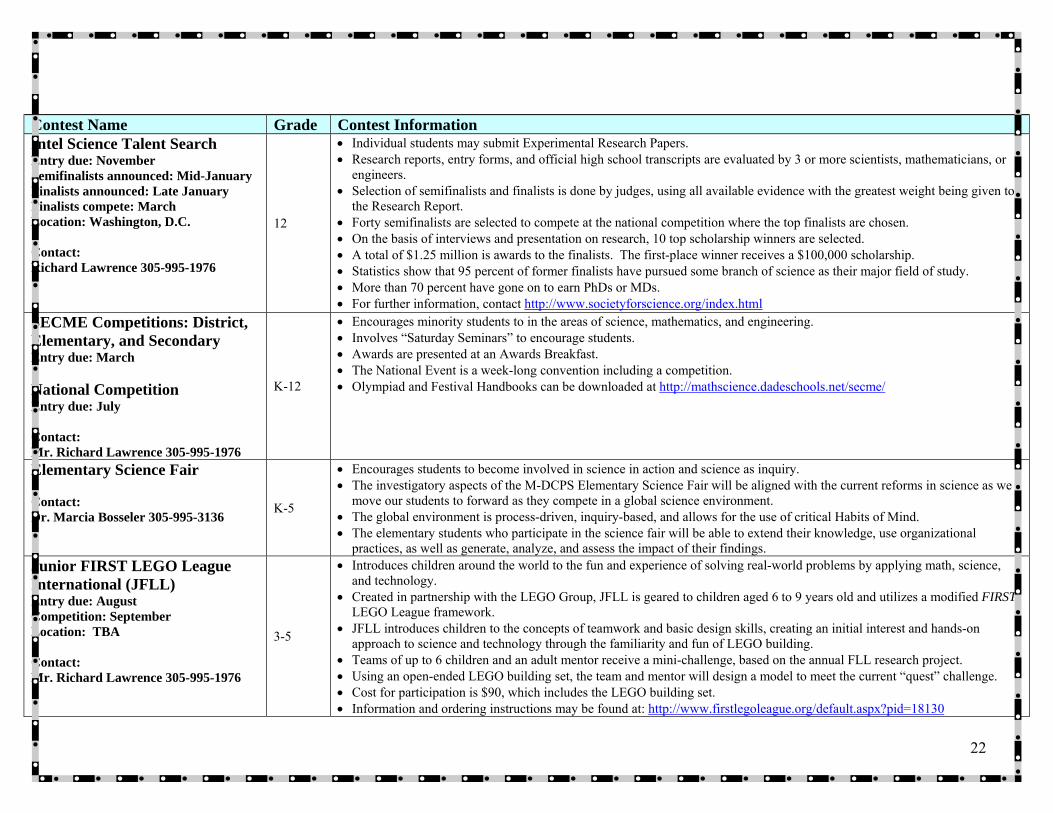
Contest Name Grade Contest Information Intel Science Talent Search Entry due: November Semifinalists announced: Mid-January Finalists announced: Late January Finalists compete: March Location: Washington, D.C. Contact: Richard Lawrence 305-995-1976
12
• Individual students may submit Experimental Research Papers. • Research reports, entry forms, and official high school transcripts are evaluated by 3 or more scientists, mathematicians, or
engineers. • Selection of semifinalists and finalists is done by judges, using all available evidence with the greatest weight being given to
the Research Report. • Forty semifinalists are selected to compete at the national competition where the top finalists are chosen. • On the basis of interviews and presentation on research, 10 top scholarship winners are selected. • A total of $1.25 million is awards to the finalists. The first-place winner receives a $100,000 scholarship. • Statistics show that 95 percent of former finalists have pursued some branch of science as their major field of study. • More than 70 percent have gone on to earn PhDs or MDs. • For further information, contact http://www.societyforscience.org/index.html
SECME Competitions: District, Elementary, and Secondary Entry due: March National Competition Entry due: July Contact: Mr. Richard Lawrence 305-995-1976
K-12
• Encourages minority students to in the areas of science, mathematics, and engineering. • Involves “Saturday Seminars” to encourage students. • Awards are presented at an Awards Breakfast. • The National Event is a week-long convention including a competition. • Olympiad and Festival Handbooks can be downloaded at http://mathscience.dadeschools.net/secme/
Elementary Science Fair Contact: Dr. Marcia Bosseler 305-995-3136
K-5
• Encourages students to become involved in science in action and science as inquiry. • The investigatory aspects of the M-DCPS Elementary Science Fair will be aligned with the current reforms in science as we
move our students to forward as they compete in a global science environment. • The global environment is process-driven, inquiry-based, and allows for the use of critical Habits of Mind. • The elementary students who participate in the science fair will be able to extend their knowledge, use organizational
practices, as well as generate, analyze, and assess the impact of their findings. Junior FIRST LEGO League International (JFLL) Entry due: August Competition: September Location: TBA Contact: Mr. Richard Lawrence 305-995-1976
3-5
• Introduces children around the world to the fun and experience of solving real-world problems by applying math, science, and technology.
• Created in partnership with the LEGO Group, JFLL is geared to children aged 6 to 9 years old and utilizes a modified FIRST LEGO League framework.
• JFLL introduces children to the concepts of teamwork and basic design skills, creating an initial interest and hands-on approach to science and technology through the familiarity and fun of LEGO building.
• Teams of up to 6 children and an adult mentor receive a mini-challenge, based on the annual FLL research project. • Using an open-ended LEGO building set, the team and mentor will design a model to meet the current “quest” challenge. • Cost for participation is $90, which includes the LEGO building set. • Information and ordering instructions may be found at: http://www.firstlegoleague.org/default.aspx?pid=18130
23
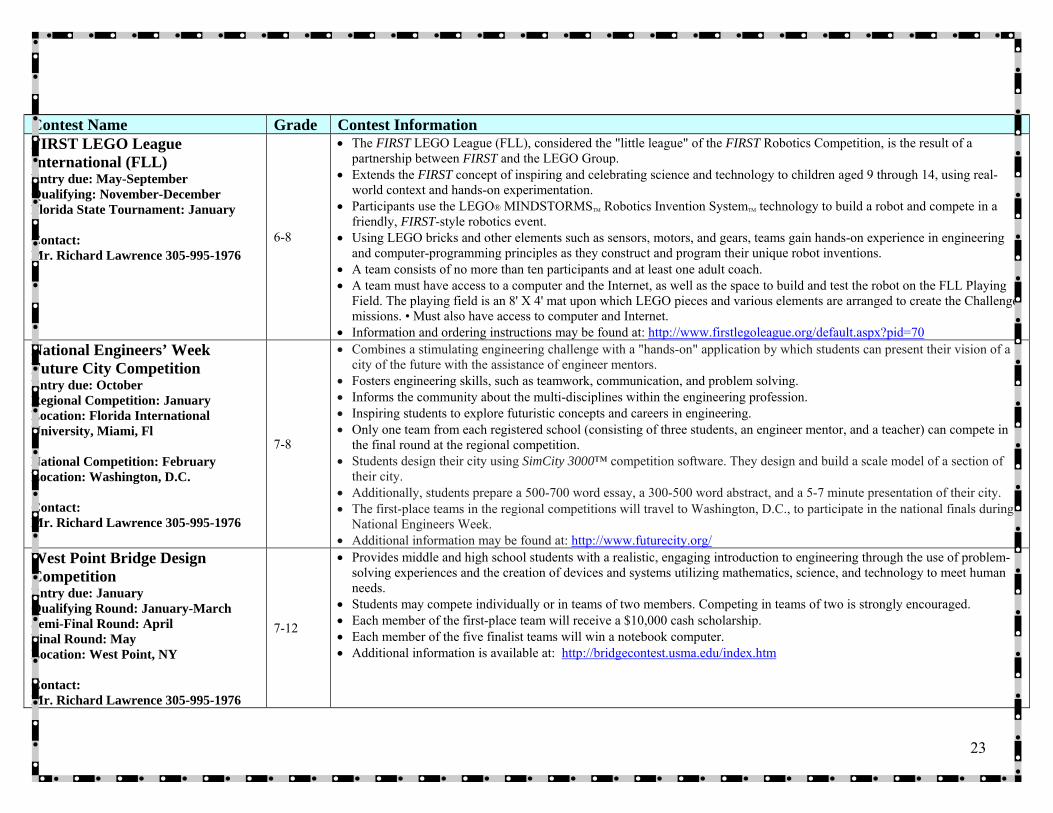
Contest Name Grade Contest Information FIRST LEGO League International (FLL) Entry due: May-September Qualifying: November-December Florida State Tournament: January Contact: Mr. Richard Lawrence 305-995-1976
6-8
• The FIRST LEGO League (FLL), considered the "little league" of the FIRST Robotics Competition, is the result of a partnership between FIRST and the LEGO Group.
• Extends the FIRST concept of inspiring and celebrating science and technology to children aged 9 through 14, using real-world context and hands-on experimentation.
• Participants use the LEGO® MINDSTORMSTM Robotics Invention SystemTM technology to build a robot and compete in a friendly, FIRST-style robotics event.
• Using LEGO bricks and other elements such as sensors, motors, and gears, teams gain hands-on experience in engineering and computer-programming principles as they construct and program their unique robot inventions.
• A team consists of no more than ten participants and at least one adult coach. • A team must have access to a computer and the Internet, as well as the space to build and test the robot on the FLL Playing
Field. The playing field is an 8' X 4' mat upon which LEGO pieces and various elements are arranged to create the Challenge missions. • Must also have access to computer and Internet.
• Information and ordering instructions may be found at: http://www.firstlegoleague.org/default.aspx?pid=70 National Engineers’ Week Future City Competition Entry due: October Regional Competition: January Location: Florida International University, Miami, Fl National Competition: February Location: Washington, D.C. Contact: Mr. Richard Lawrence 305-995-1976
7-8
• Combines a stimulating engineering challenge with a "hands-on" application by which students can present their vision of a city of the future with the assistance of engineer mentors.
• Fosters engineering skills, such as teamwork, communication, and problem solving. • Informs the community about the multi-disciplines within the engineering profession. • Inspiring students to explore futuristic concepts and careers in engineering. • Only one team from each registered school (consisting of three students, an engineer mentor, and a teacher) can compete in
the final round at the regional competition. • Students design their city using SimCity 3000™ competition software. They design and build a scale model of a section of
their city. • Additionally, students prepare a 500-700 word essay, a 300-500 word abstract, and a 5-7 minute presentation of their city. • The first-place teams in the regional competitions will travel to Washington, D.C., to participate in the national finals during
National Engineers Week. • Additional information may be found at: http://www.futurecity.org/
West Point Bridge Design Competition Entry due: January Qualifying Round: January-March Semi-Final Round: April Final Round: May Location: West Point, NY Contact: Mr. Richard Lawrence 305-995-1976
7-12
• Provides middle and high school students with a realistic, engaging introduction to engineering through the use of problem-solving experiences and the creation of devices and systems utilizing mathematics, science, and technology to meet human needs.
• Students may compete individually or in teams of two members. Competing in teams of two is strongly encouraged. • Each member of the first-place team will receive a $10,000 cash scholarship. • Each member of the five finalist teams will win a notebook computer. • Additional information is available at: http://bridgecontest.usma.edu/index.htm

24
Contest Name Grade Contest Information FIRST Robotics Competition (FRC) Regional: March Championship: April Location: Atlanta, GA Contact: Mr. Richard Lawrence 305-995-1976
9-12
• An exciting, multinational competition that teams professionals and young people to solve an engineering design problem in an intense and competitive way.
• Combines the excitement of sports with science and technology to create a unique varsity sport for the mind. Helps high-school young people discover the rewarding and engaging world of innovation and engineering.
• Teams comprised of 15-25 high-school-aged students. • Colleges, universities, corporations, businesses, and individuals provide scholarships to the participants worth $8 million. • Corporate sponsorship is required as the cost of the championship is approximately $15,000. • Information and ordering instructions may be found at: http://www.floridafirstregional.com/
JETS Contact: Mr. Richard Lawrence 305-995-1976 9-12
• Providing real-world engineering insight and challenges for high school students. • Students can take advantage of: student competitions, assessment tools, career guidance resources, an e-newsletter, and
more. • Provides resource materials for parents and counselors. • The TEAMS competition is a one-day event that requires students to think critically. • The questions posed represent college freshman-level engineering coursework and team members should have knowledge of
math, chemistry, physics, biology, and computer applications, but being an 'expert' is not required. NAACP ACT-SO Contact: Mr. Richard Lawrence 305-995-1976 9-12
• ACT-SO means “Afro-Academic, Cultural, Technological and Scientific Olympics. • A year-long enrichment program designed to recruit, stimulate, improve, and encourage high-academic and cultural
achievement among African-American high school students. • 25 categories of competitions involving the sciences humanities, and performing and visual arts. • African-American high school students who participate must be citizens of the United States, be enrolled in grades 9-12, and
be amateurs in the categories of competition. • Awards at the national level include cash scholarships up to $1,000 and medals.
Fairchild Challenge Contact: Mr. Richard Lawrence 305-995-1976
6-12
• Sponsored by Fairchild Tropical Botanic Garden. • This series of year-long competitions encourage environmental awareness in students through a variety of multi-disciplinary
competitions such as song-writing, poetry, art, habitat restoration, etc. • Challenges are designed to improve problem solving and critical thinking skills in order to develop responsible citizens. • Contest rules and registration can be found at: http://fairchildgarden.org
25
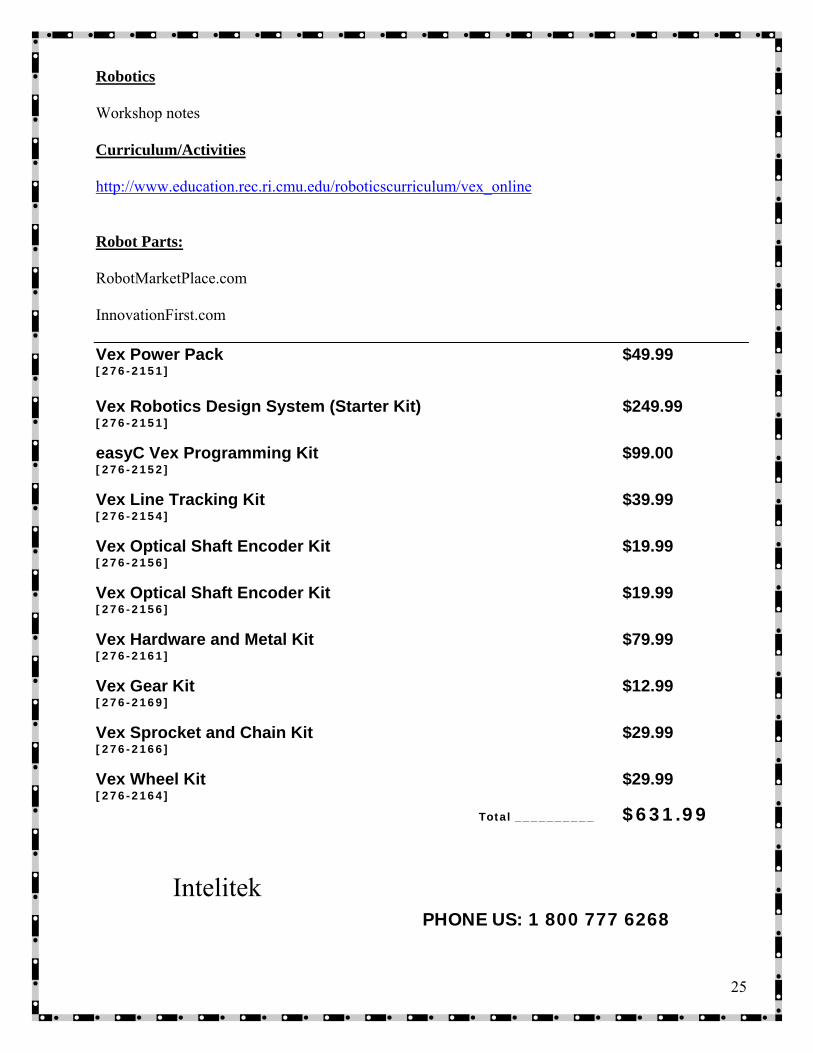
Robotics Workshop notes Curriculum/Activities http://www.education.rec.ri.cmu.edu/roboticscurriculum/vex_online Robot Parts: RobotMarketPlace.com InnovationFirst.com Vex Power Pack $49.99 [276-2151]
Vex Robotics Design System (Starter Kit) $249.99 [276-2151]
easyC Vex Programming Kit $99.00 [276-2152]
Vex Line Tracking Kit $39.99 [276-2154]
Vex Optical Shaft Encoder Kit $19.99 [276-2156]
Vex Optical Shaft Encoder Kit $19.99 [276-2156]
Vex Hardware and Metal Kit $79.99 [276-2161]
Vex Gear Kit $12.99 [276-2169]
Vex Sprocket and Chain Kit $29.99 [276-2166]
Vex Wheel Kit $29.99 [276-2164]
Total __________ $631.99
Intelitek PHONE US: 1 800 777 6268

26
Engineering Design Programs: Rhino (Rhino3D.com) or get site license (~30 computers) _____________ $1,000.00 Auto-CAD (license for 1 computer, industry) _______________________ $11,000.00 Key Words: (Web searches) Mechanism
27
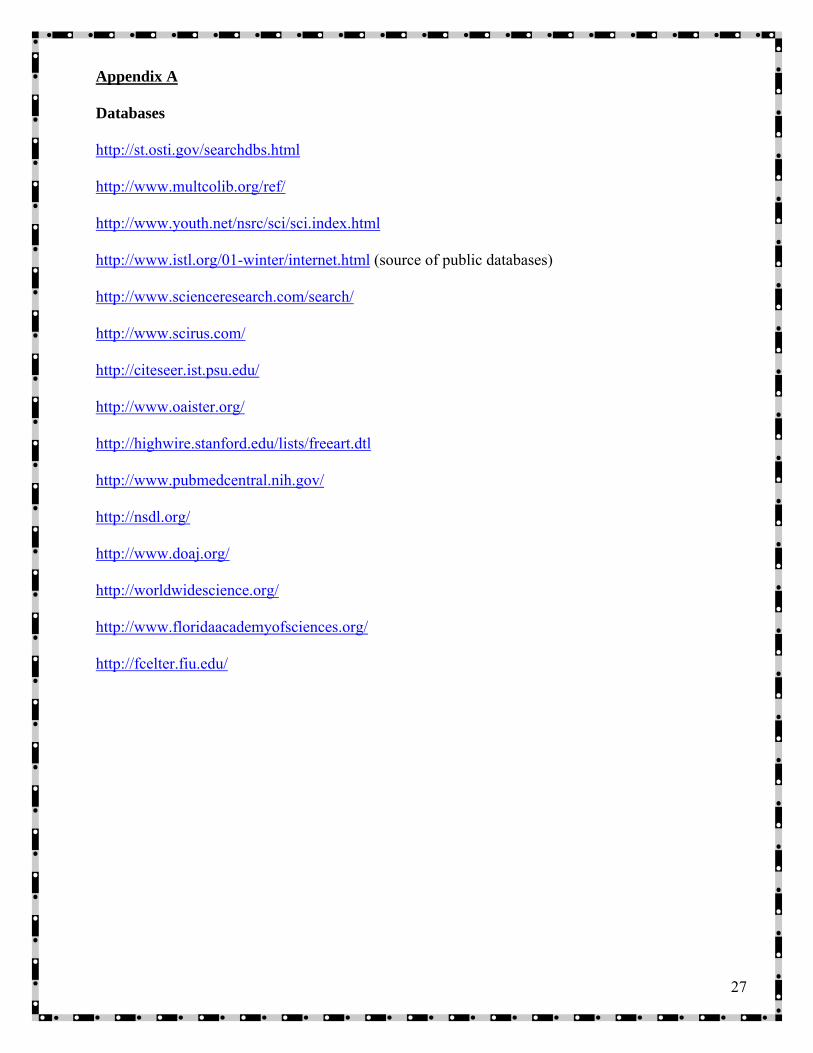
Appendix A Databases http://st.osti.gov/searchdbs.html http://www.multcolib.org/ref/ http://www.youth.net/nsrc/sci/sci.index.html http://www.istl.org/01-winter/internet.html (source of public databases) http://www.scienceresearch.com/search/ http://www.scirus.com/ http://citeseer.ist.psu.edu/ http://www.oaister.org/ http://highwire.stanford.edu/lists/freeart.dtl http://www.pubmedcentral.nih.gov/ http://nsdl.org/ http://www.doaj.org/ http://worldwidescience.org/ http://www.floridaacademyofsciences.org/ http://fcelter.fiu.edu/
28
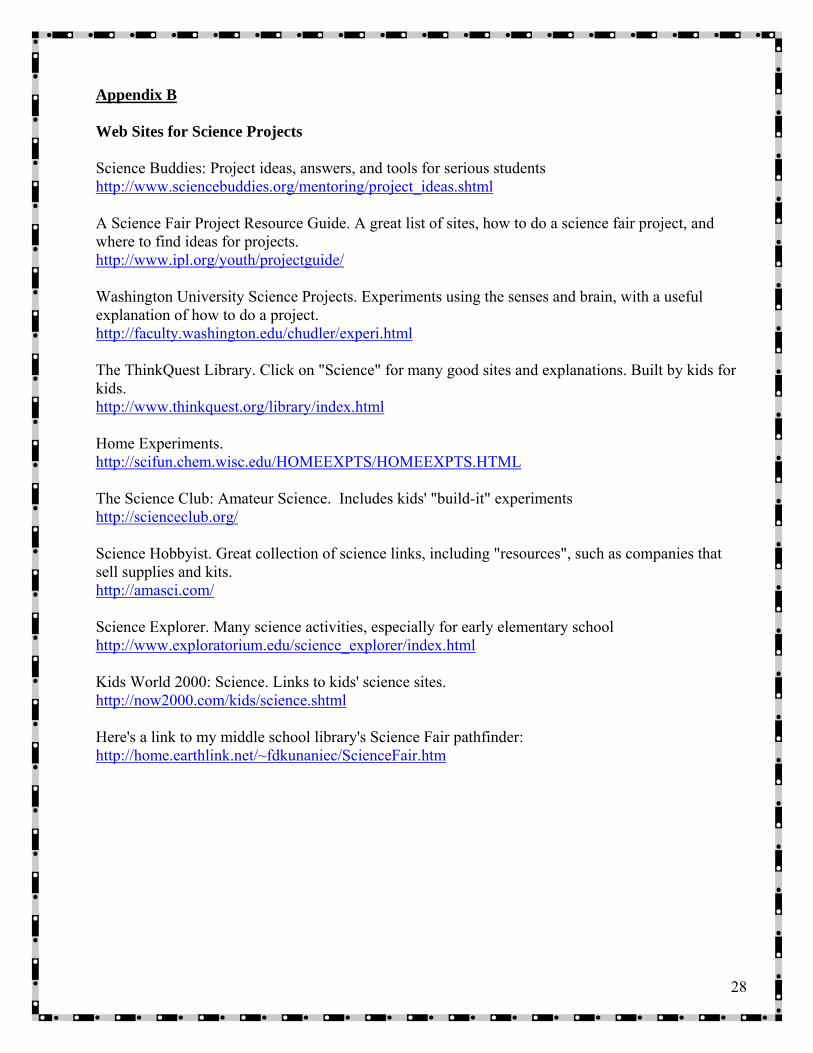
Appendix B Web Sites for Science Projects Science Buddies: Project ideas, answers, and tools for serious students http://www.sciencebuddies.org/mentoring/project_ideas.shtml A Science Fair Project Resource Guide. A great list of sites, how to do a science fair project, and where to find ideas for projects. http://www.ipl.org/youth/projectguide/ Washington University Science Projects. Experiments using the senses and brain, with a useful explanation of how to do a project. http://faculty.washington.edu/chudler/experi.html The ThinkQuest Library. Click on "Science" for many good sites and explanations. Built by kids for kids. http://www.thinkquest.org/library/index.html Home Experiments. http://scifun.chem.wisc.edu/HOMEEXPTS/HOMEEXPTS.HTML The Science Club: Amateur Science. Includes kids' "build-it" experiments http://scienceclub.org/ Science Hobbyist. Great collection of science links, including "resources", such as companies that sell supplies and kits. http://amasci.com/ Science Explorer. Many science activities, especially for early elementary school http://www.exploratorium.edu/science_explorer/index.html Kids World 2000: Science. Links to kids' science sites. http://now2000.com/kids/science.shtml Here's a link to my middle school library's Science Fair pathfinder: http://home.earthlink.net/~fdkunaniec/ScienceFair.htm
29
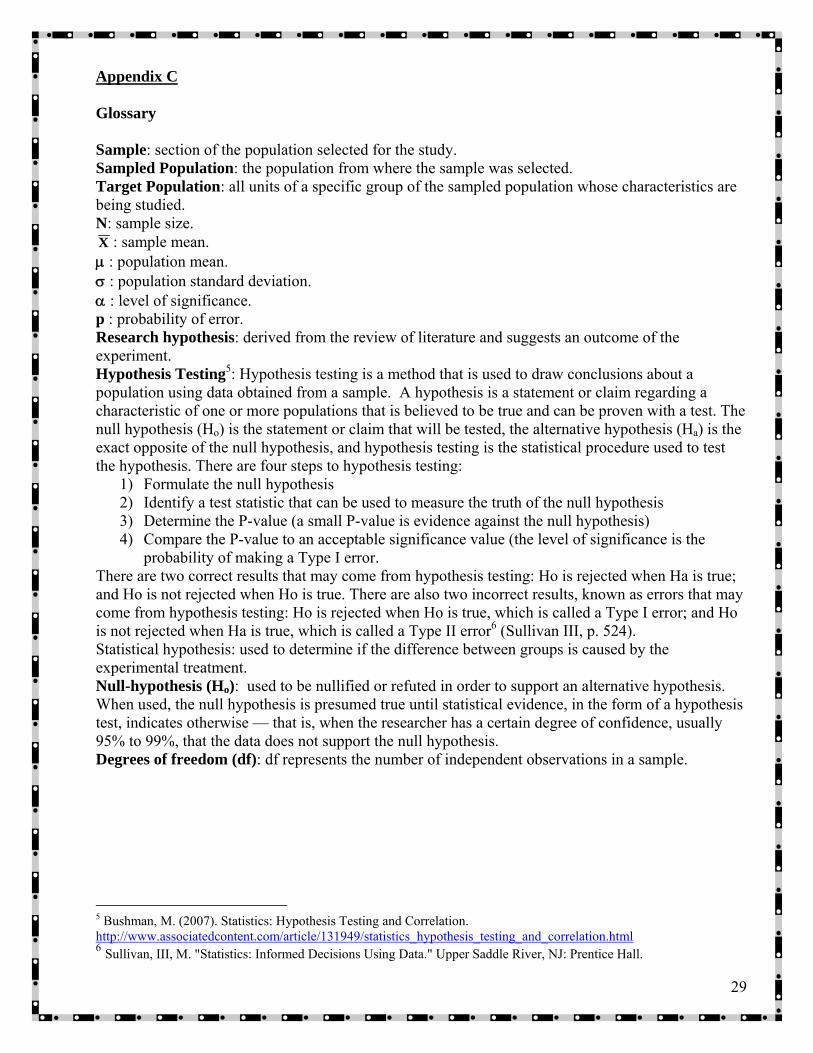
Appendix C Glossary Sample: section of the population selected for the study. Sampled Population: the population from where the sample was selected. Target Population: all units of a specific group of the sampled population whose characteristics are being studied. N: sample size. X : sample mean. μ : population mean. σ : population standard deviation. α : level of significance. p : probability of error. Research hypothesis: derived from the review of literature and suggests an outcome of the experiment. Hypothesis Testing5: Hypothesis testing is a method that is used to draw conclusions about a population using data obtained from a sample. A hypothesis is a statement or claim regarding a characteristic of one or more populations that is believed to be true and can be proven with a test. The null hypothesis (Ho) is the statement or claim that will be tested, the alternative hypothesis (Ha) is the exact opposite of the null hypothesis, and hypothesis testing is the statistical procedure used to test the hypothesis. There are four steps to hypothesis testing:
1) Formulate the null hypothesis 2) Identify a test statistic that can be used to measure the truth of the null hypothesis 3) Determine the P-value (a small P-value is evidence against the null hypothesis) 4) Compare the P-value to an acceptable significance value (the level of significance is the
probability of making a Type I error. There are two correct results that may come from hypothesis testing: Ho is rejected when Ha is true; and Ho is not rejected when Ho is true. There are also two incorrect results, known as errors that may come from hypothesis testing: Ho is rejected when Ho is true, which is called a Type I error; and Ho is not rejected when Ha is true, which is called a Type II error6 (Sullivan III, p. 524). Statistical hypothesis: used to determine if the difference between groups is caused by the experimental treatment. Null-hypothesis (Ho): used to be nullified or refuted in order to support an alternative hypothesis. When used, the null hypothesis is presumed true until statistical evidence, in the form of a hypothesis test, indicates otherwise — that is, when the researcher has a certain degree of confidence, usually 95% to 99%, that the data does not support the null hypothesis. Degrees of freedom (df): df represents the number of independent observations in a sample.
5 Bushman, M. (2007). Statistics: Hypothesis Testing and Correlation. http://www.associatedcontent.com/article/131949/statistics_hypothesis_testing_and_correlation.html 6 Sullivan, III, M. "Statistics: Informed Decisions Using Data." Upper Saddle River, NJ: Prentice Hall.
30
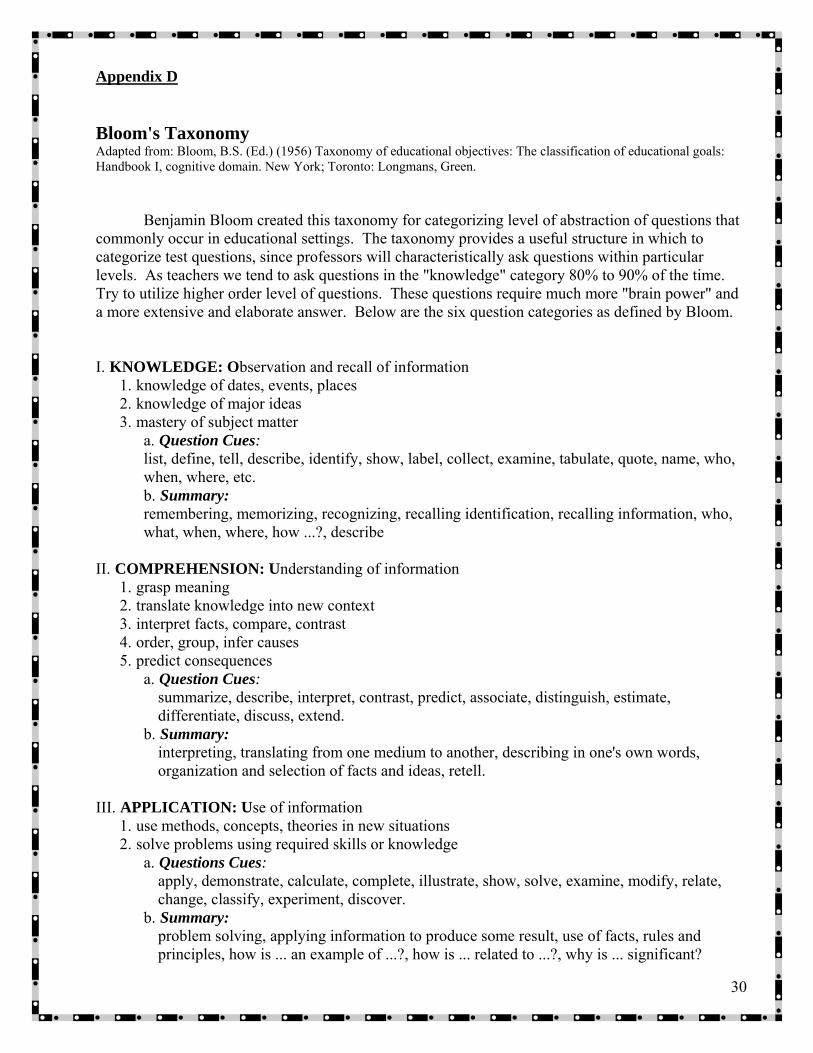
Appendix D Bloom's Taxonomy Adapted from: Bloom, B.S. (Ed.) (1956) Taxonomy of educational objectives: The classification of educational goals: Handbook I, cognitive domain. New York; Toronto: Longmans, Green. Benjamin Bloom created this taxonomy for categorizing level of abstraction of questions that commonly occur in educational settings. The taxonomy provides a useful structure in which to categorize test questions, since professors will characteristically ask questions within particular levels. As teachers we tend to ask questions in the "knowledge" category 80% to 90% of the time. Try to utilize higher order level of questions. These questions require much more "brain power" and a more extensive and elaborate answer. Below are the six question categories as defined by Bloom. I. KNOWLEDGE: Observation and recall of information
1. knowledge of dates, events, places 2. knowledge of major ideas 3. mastery of subject matter
a. Question Cues: list, define, tell, describe, identify, show, label, collect, examine, tabulate, quote, name, who, when, where, etc. b. Summary: remembering, memorizing, recognizing, recalling identification, recalling information, who, what, when, where, how ...?, describe
II. COMPREHENSION: Understanding of information
1. grasp meaning 2. translate knowledge into new context 3. interpret facts, compare, contrast 4. order, group, infer causes 5. predict consequences
a. Question Cues: summarize, describe, interpret, contrast, predict, associate, distinguish, estimate, differentiate, discuss, extend.
b. Summary: interpreting, translating from one medium to another, describing in one's own words, organization and selection of facts and ideas, retell.
III. APPLICATION: Use of information
1. use methods, concepts, theories in new situations 2. solve problems using required skills or knowledge
a. Questions Cues: apply, demonstrate, calculate, complete, illustrate, show, solve, examine, modify, relate, change, classify, experiment, discover.
b. Summary: problem solving, applying information to produce some result, use of facts, rules and principles, how is ... an example of ...?, how is ... related to ...?, why is ... significant?
31
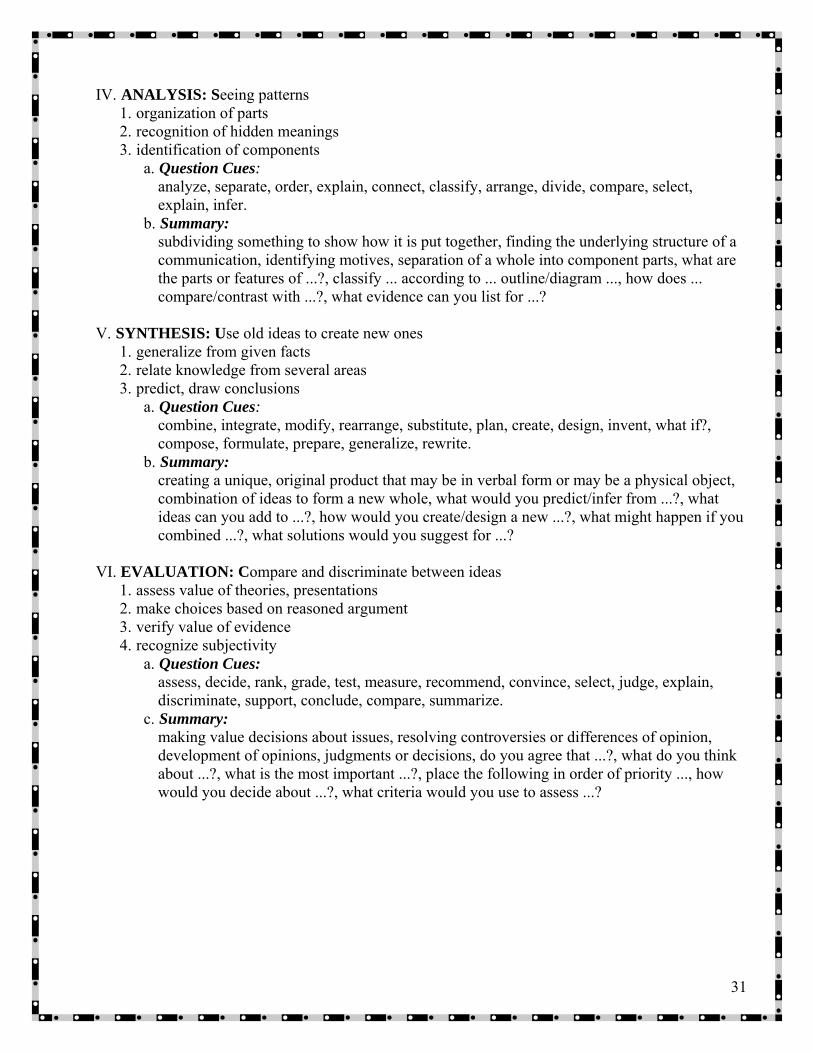
IV. ANALYSIS: Seeing patterns
1. organization of parts 2. recognition of hidden meanings 3. identification of components
a. Question Cues: analyze, separate, order, explain, connect, classify, arrange, divide, compare, select, explain, infer.
b. Summary: subdividing something to show how it is put together, finding the underlying structure of a communication, identifying motives, separation of a whole into component parts, what are the parts or features of ...?, classify ... according to ... outline/diagram ..., how does ... compare/contrast with ...?, what evidence can you list for ...?
V. SYNTHESIS: Use old ideas to create new ones
1. generalize from given facts 2. relate knowledge from several areas 3. predict, draw conclusions
a. Question Cues: combine, integrate, modify, rearrange, substitute, plan, create, design, invent, what if?, compose, formulate, prepare, generalize, rewrite.
b. Summary: creating a unique, original product that may be in verbal form or may be a physical object, combination of ideas to form a new whole, what would you predict/infer from ...?, what ideas can you add to ...?, how would you create/design a new ...?, what might happen if you combined ...?, what solutions would you suggest for ...?
VI. EVALUATION: Compare and discriminate between ideas
1. assess value of theories, presentations 2. make choices based on reasoned argument 3. verify value of evidence 4. recognize subjectivity
a. Question Cues: assess, decide, rank, grade, test, measure, recommend, convince, select, judge, explain, discriminate, support, conclude, compare, summarize.
c. Summary: making value decisions about issues, resolving controversies or differences of opinion, development of opinions, judgments or decisions, do you agree that ...?, what do you think about ...?, what is the most important ...?, place the following in order of priority ..., how would you decide about ...?, what criteria would you use to assess ...?
32
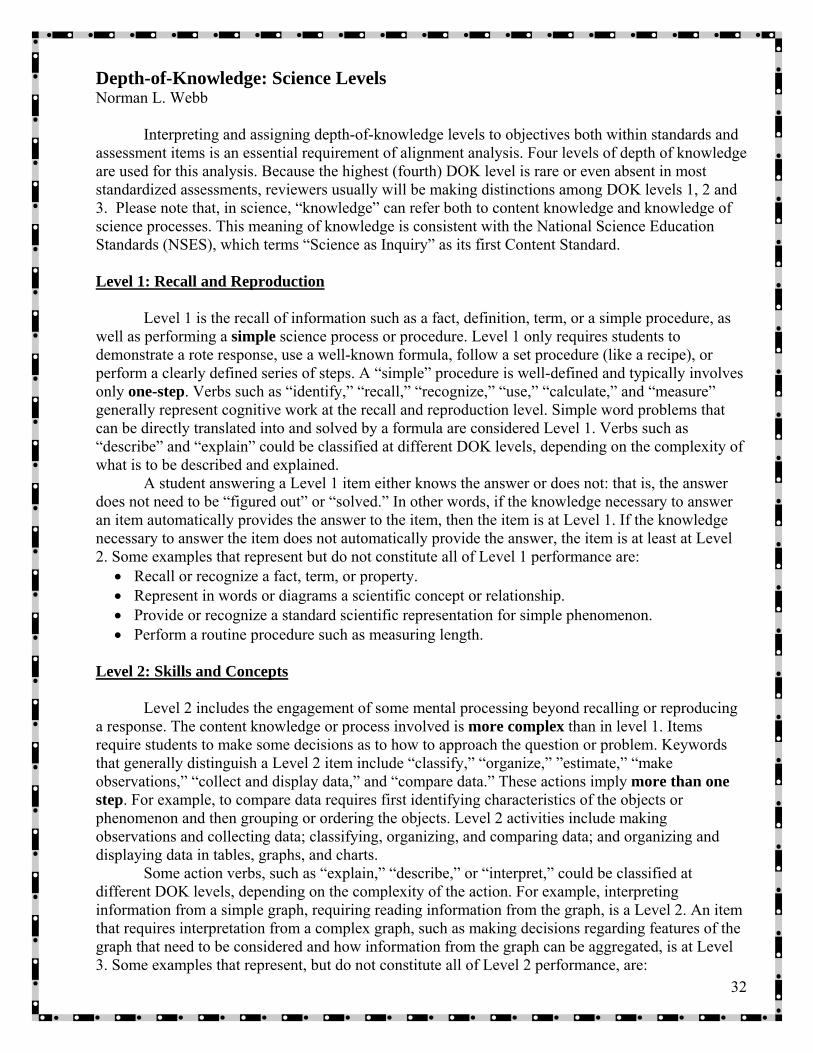
Depth-of-Knowledge: Science Levels Norman L. Webb Interpreting and assigning depth-of-knowledge levels to objectives both within standards and assessment items is an essential requirement of alignment analysis. Four levels of depth of knowledge are used for this analysis. Because the highest (fourth) DOK level is rare or even absent in most standardized assessments, reviewers usually will be making distinctions among DOK levels 1, 2 and 3. Please note that, in science, “knowledge” can refer both to content knowledge and knowledge of science processes. This meaning of knowledge is consistent with the National Science Education Standards (NSES), which terms “Science as Inquiry” as its first Content Standard. Level 1: Recall and Reproduction Level 1 is the recall of information such as a fact, definition, term, or a simple procedure, as well as performing a simple science process or procedure. Level 1 only requires students to demonstrate a rote response, use a well-known formula, follow a set procedure (like a recipe), or perform a clearly defined series of steps. A “simple” procedure is well-defined and typically involves only one-step. Verbs such as “identify,” “recall,” “recognize,” “use,” “calculate,” and “measure” generally represent cognitive work at the recall and reproduction level. Simple word problems that can be directly translated into and solved by a formula are considered Level 1. Verbs such as “describe” and “explain” could be classified at different DOK levels, depending on the complexity of what is to be described and explained. A student answering a Level 1 item either knows the answer or does not: that is, the answer does not need to be “figured out” or “solved.” In other words, if the knowledge necessary to answer an item automatically provides the answer to the item, then the item is at Level 1. If the knowledge necessary to answer the item does not automatically provide the answer, the item is at least at Level 2. Some examples that represent but do not constitute all of Level 1 performance are:
• Recall or recognize a fact, term, or property. • Represent in words or diagrams a scientific concept or relationship. • Provide or recognize a standard scientific representation for simple phenomenon. • Perform a routine procedure such as measuring length.
Level 2: Skills and Concepts Level 2 includes the engagement of some mental processing beyond recalling or reproducing a response. The content knowledge or process involved is more complex than in level 1. Items require students to make some decisions as to how to approach the question or problem. Keywords that generally distinguish a Level 2 item include “classify,” “organize,” ”estimate,” “make observations,” “collect and display data,” and “compare data.” These actions imply more than one step. For example, to compare data requires first identifying characteristics of the objects or phenomenon and then grouping or ordering the objects. Level 2 activities include making observations and collecting data; classifying, organizing, and comparing data; and organizing and displaying data in tables, graphs, and charts. Some action verbs, such as “explain,” “describe,” or “interpret,” could be classified at different DOK levels, depending on the complexity of the action. For example, interpreting information from a simple graph, requiring reading information from the graph, is a Level 2. An item that requires interpretation from a complex graph, such as making decisions regarding features of the graph that need to be considered and how information from the graph can be aggregated, is at Level 3. Some examples that represent, but do not constitute all of Level 2 performance, are:
33
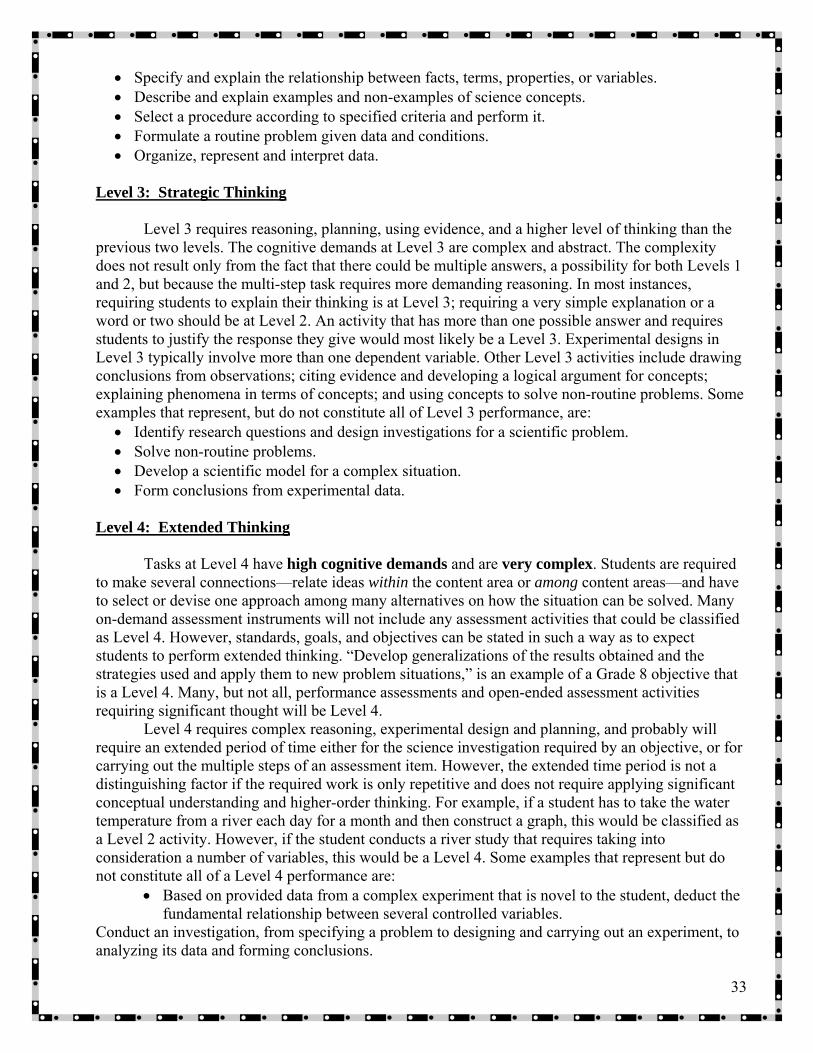
• Specify and explain the relationship between facts, terms, properties, or variables. • Describe and explain examples and non-examples of science concepts. • Select a procedure according to specified criteria and perform it. • Formulate a routine problem given data and conditions. • Organize, represent and interpret data.
Level 3: Strategic Thinking Level 3 requires reasoning, planning, using evidence, and a higher level of thinking than the previous two levels. The cognitive demands at Level 3 are complex and abstract. The complexity does not result only from the fact that there could be multiple answers, a possibility for both Levels 1 and 2, but because the multi-step task requires more demanding reasoning. In most instances, requiring students to explain their thinking is at Level 3; requiring a very simple explanation or a word or two should be at Level 2. An activity that has more than one possible answer and requires students to justify the response they give would most likely be a Level 3. Experimental designs in Level 3 typically involve more than one dependent variable. Other Level 3 activities include drawing conclusions from observations; citing evidence and developing a logical argument for concepts; explaining phenomena in terms of concepts; and using concepts to solve non-routine problems. Some examples that represent, but do not constitute all of Level 3 performance, are:
• Identify research questions and design investigations for a scientific problem. • Solve non-routine problems. • Develop a scientific model for a complex situation. • Form conclusions from experimental data.
Level 4: Extended Thinking Tasks at Level 4 have high cognitive demands and are very complex. Students are required to make several connections—relate ideas within the content area or among content areas—and have to select or devise one approach among many alternatives on how the situation can be solved. Many on-demand assessment instruments will not include any assessment activities that could be classified as Level 4. However, standards, goals, and objectives can be stated in such a way as to expect students to perform extended thinking. “Develop generalizations of the results obtained and the strategies used and apply them to new problem situations,” is an example of a Grade 8 objective that is a Level 4. Many, but not all, performance assessments and open-ended assessment activities requiring significant thought will be Level 4. Level 4 requires complex reasoning, experimental design and planning, and probably will require an extended period of time either for the science investigation required by an objective, or for carrying out the multiple steps of an assessment item. However, the extended time period is not a distinguishing factor if the required work is only repetitive and does not require applying significant conceptual understanding and higher-order thinking. For example, if a student has to take the water temperature from a river each day for a month and then construct a graph, this would be classified as a Level 2 activity. However, if the student conducts a river study that requires taking into consideration a number of variables, this would be a Level 4. Some examples that represent but do not constitute all of a Level 4 performance are:
• Based on provided data from a complex experiment that is novel to the student, deduct the fundamental relationship between several controlled variables.
Conduct an investigation, from specifying a problem to designing and carrying out an experiment, to analyzing its data and forming conclusions.
34
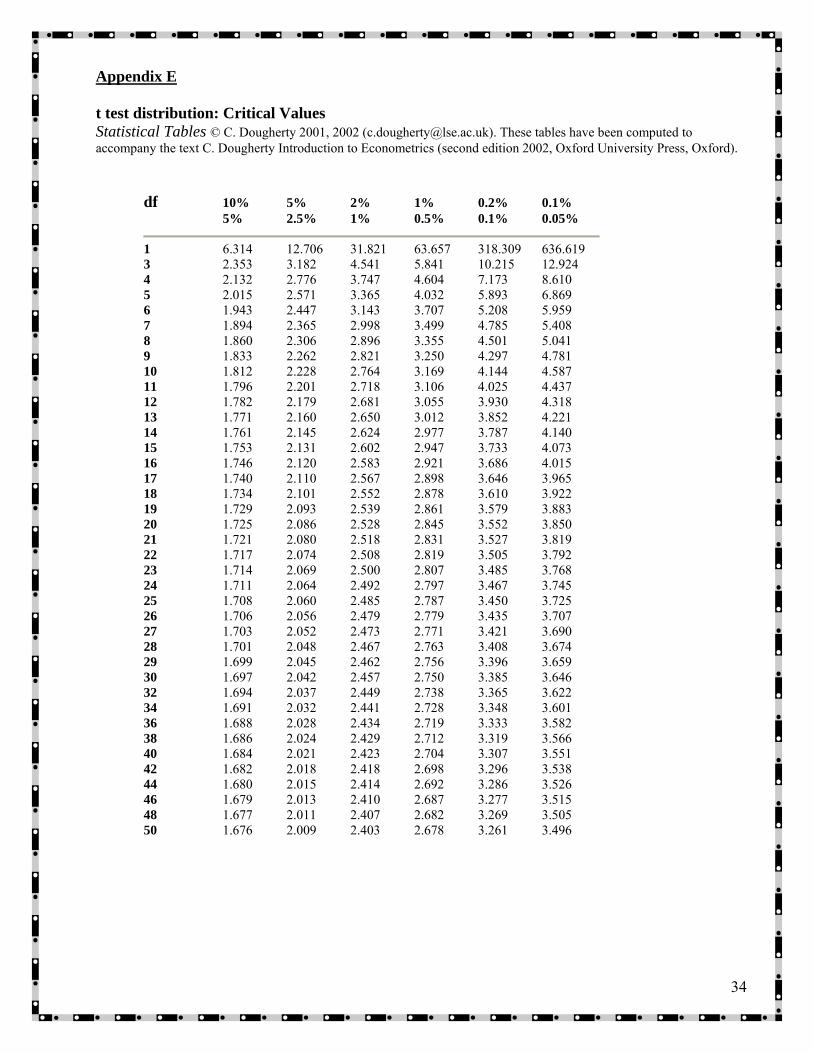
Appendix E t test distribution: Critical Values Statistical Tables © C. Dougherty 2001, 2002 ([email protected]). These tables have been computed to accompany the text C. Dougherty Introduction to Econometrics (second edition 2002, Oxford University Press, Oxford).
df 10% 5% 2% 1% 0.2% 0.1% 5% 2.5% 1% 0.5% 0.1% 0.05%
1 6.314 12.706 31.821 63.657 318.309 636.619 3 2.353 3.182 4.541 5.841 10.215 12.924 4 2.132 2.776 3.747 4.604 7.173 8.610 5 2.015 2.571 3.365 4.032 5.893 6.869 6 1.943 2.447 3.143 3.707 5.208 5.959 7 1.894 2.365 2.998 3.499 4.785 5.408 8 1.860 2.306 2.896 3.355 4.501 5.041 9 1.833 2.262 2.821 3.250 4.297 4.781 10 1.812 2.228 2.764 3.169 4.144 4.587 11 1.796 2.201 2.718 3.106 4.025 4.437 12 1.782 2.179 2.681 3.055 3.930 4.318 13 1.771 2.160 2.650 3.012 3.852 4.221 14 1.761 2.145 2.624 2.977 3.787 4.140 15 1.753 2.131 2.602 2.947 3.733 4.073 16 1.746 2.120 2.583 2.921 3.686 4.015 17 1.740 2.110 2.567 2.898 3.646 3.965 18 1.734 2.101 2.552 2.878 3.610 3.922 19 1.729 2.093 2.539 2.861 3.579 3.883 20 1.725 2.086 2.528 2.845 3.552 3.850 21 1.721 2.080 2.518 2.831 3.527 3.819 22 1.717 2.074 2.508 2.819 3.505 3.792 23 1.714 2.069 2.500 2.807 3.485 3.768 24 1.711 2.064 2.492 2.797 3.467 3.745 25 1.708 2.060 2.485 2.787 3.450 3.725 26 1.706 2.056 2.479 2.779 3.435 3.707 27 1.703 2.052 2.473 2.771 3.421 3.690 28 1.701 2.048 2.467 2.763 3.408 3.674 29 1.699 2.045 2.462 2.756 3.396 3.659 30 1.697 2.042 2.457 2.750 3.385 3.646 32 1.694 2.037 2.449 2.738 3.365 3.622 34 1.691 2.032 2.441 2.728 3.348 3.601 36 1.688 2.028 2.434 2.719 3.333 3.582 38 1.686 2.024 2.429 2.712 3.319 3.566 40 1.684 2.021 2.423 2.704 3.307 3.551 42 1.682 2.018 2.418 2.698 3.296 3.538 44 1.680 2.015 2.414 2.692 3.286 3.526 46 1.679 2.013 2.410 2.687 3.277 3.515 48 1.677 2.011 2.407 2.682 3.269 3.505 50 1.676 2.009 2.403 2.678 3.261 3.496

35
Chi-Square distribution: Critical Values NIST/SEMATECH e-Handbook of Statistical Methods, http://www.itl.nist.gov/div898/handbook/, May 18, 2008. df 0.10 0.05 0.025 0.01 0.001
1 2.706 3.841 5.024 6.635 10.828 2 4.605 5.991 7.378 9.210 13.816 3 6.251 7.815 9.348 11.345 16.266 4 7.779 9.488 11.143 13.277 18.467 5 9.236 11.070 12.833 15.086 20.515 6 10.645 12.592 14.449 16.812 22.458 7 12.017 14.067 16.013 18.475 24.322 8 13.362 15.507 17.535 20.090 26.125 9 14.684 16.919 19.023 21.666 27.877 10 15.987 18.307 20.483 23.209 29.588 11 17.275 19.675 21.920 24.725 31.264 12 18.549 21.026 23.337 26.217 32.910 13 19.812 22.362 24.736 27.688 34.528 14 21.064 23.685 26.119 29.141 36.123 15 22.307 24.996 27.488 30.578 37.697 16 23.542 26.296 28.845 32.000 39.252 17 24.769 27.587 30.191 33.409 40.790 18 25.989 28.869 31.526 34.805 42.312 19 27.204 30.144 32.852 36.191 43.820 20 28.412 31.410 34.170 37.566 45.315 21 29.615 32.671 35.479 38.932 46.797 22 30.813 33.924 36.781 40.289 48.268 23 32.007 35.172 38.076 41.638 49.728 24 33.196 36.415 39.364 42.980 51.179 25 34.382 37.652 40.646 44.314 52.620 26 35.563 38.885 41.923 45.642 54.052 27 36.741 40.113 43.195 46.963 55.476 28 37.916 41.337 44.461 48.278 56.892 29 39.087 42.557 45.722 49.588 58.301 30 40.256 43.773 46.979 50.892 59.703 31 41.422 44.985 48.232 52.191 61.098 32 42.585 46.194 49.480 53.486 62.487 33 43.745 47.400 50.725 54.776 63.870 34 44.903 48.602 51.966 56.061 65.247 35 46.059 49.802 53.203 57.342 66.619 36 47.212 50.998 54.437 58.619 67.985 37 48.363 52.192 55.668 59.893 69.347 38 49.513 53.384 56.896 61.162 70.703 39 50.660 54.572 58.120 62.428 72.055 40 51.805 55.758 59.342 63.691 73.402 41 52.949 56.942 60.561 64.950 74.745 42 54.090 58.124 61.777 66.206 76.084 43 55.230 59.304 62.990 67.459 77.419 44 56.369 60.481 64.201 68.710 78.750 45 57.505 61.656 65.410 69.957 80.077 46 58.641 62.830 66.617 71.201 81.400 47 59.774 64.001 67.821 72.443 82.720 48 60.907 65.171 69.023 73.683 84.037 49 62.038 66.339 70.222 74.919 85.351 50 63.167 67.505 71.420 76.154 86.661
36
The School Board of Miami-Dade County, Florida, adheres to a policy of nondiscrimination in employment and educational programs/activities and programs/activities receiving Federal financial assistance from the Department of Education, and strives affirmatively to provide equal opportunity for all as required by:
Title VI of the Civil Rights Act of 1964 - prohibits discrimination on the basis of race, color, religion, or national origin.
Title VII of the Civil Rights Act of 1964, as amended - prohibits discrimination in employment on the basis of race, color, religion, gender, or national origin.
Title IX of the Education Amendments of 1972 - prohibits discrimination on the basis of gender.
Age Discrimination in Employment Act of 1967 (ADEA), as amended - prohibits discrimination on the basis of age with respect to individuals who are at least 40.
The Equal Pay Act of 1963, as amended - prohibits sex discrimination in payment of wages to women and men performing substantially equal work in the same establishment.
Section 504 of the Rehabilitation Act of 1973 - prohibits discrimination against the disabled.
Americans with Disabilities Act of 1990 (ADA) - prohibits discrimination against individuals with disabilities in employment, public service, public accommodations and telecommunications.
The Family and Medical Leave Act of 1993 (FMLA) - requires covered employers to provide up to 12 weeks of unpaid, job-protected leave to "eligible" employees for certain family and medical reasons.
The Pregnancy Discrimination Act of 1978 - prohibits discrimination in employment on the basis of pregnancy, childbirth, or related medical conditions.
Florida Educational Equity Act (FEEA) - prohibits discrimination on the basis of race, gender, national origin, marital status, or handicap against a student or employee.
Florida Civil Rights Act of 1992 - secures for all individuals within the state freedom from discrimination because of race, color, religion, sex, national origin, age, handicap, or marital status.
School Board Rules 6Gx13- 4A-1.01, 6Gx13- 4A-1.32, and 6Gx13- 5D-1.10 - prohibit harassment and/or discrimination against a student or employee on the basis of gender, race, color, religion, ethnic or national origin, political beliefs, marital status, age, sexual orientation, social and family background, linguistic preference, pregnancy, or disability.
Veterans are provided re-employment rights in accordance with P.L. 93-508 (Federal Law) and Section 295.07 (Florida Statutes), which stipulate categorical preferences for employment.
Revised 5/9/03