Embed Size (px)
Citation preview

SCIENTIFIC COMMITTEETWELFTH REGULAR SESSION
Bali, Indonesia3-11 August 2016
Characteristics of tuna fisheries associated with Indonesian anchored FADs in waters of theWest Pacific and the Indonesian archipelago
WCPFC-SC12-ST-IP-06
Agustinus Anung Widodo1, Wudianto1, Craig Proctor2, Fayakun Satria3,Mahiswara3, Mohamad Natsir1, I. Gede Bayu Sedana1, Ignatius Tri Hargiyatno1
and Scott Cooper2
1 Center for Fisheries Research and Development-Indonesia2 CSIRO-Australia3 Research Institute for Marine Fisheries-Indonesia
1
Characteristics of tuna fisheries associated with Indonesian anchored FADs in waters of the West
Pacific and the Indonesian archipelago. Agustinus Anung Widodo
1, Wudianto
1, Craig Proctor
2, Fayakun Satria
3, Mahiswara
3, Mohamad Natsir
1,
I. Gede Bayu Sedana1, Ignatius Hargiyatno
1 and Scott Cooper
2
1Center for Fisheries Research and Development-Indonesia
2CSIRO-Australia
3Research Institute for Marine Fisheries-Indonesia
Abstract
With the primary aim of addressing information gaps on the scale and operations of Indonesia‟s FAD based
tuna fisheries, to aid improved fisheries management, an Indonesia - Australia research collaboration conducted
a study during Nov 2013 – Dec 2015 at four key fishing ports in eastern Indonesia and western Indonesia. The
full outputs from this study, involving an enumeration program with skipper interviews, biological sampling
and direct observations are to be published as final report and subsequent papers. Presented here are preliminary
results from research at two ports in eastern Indonesia - Kendari (SE Sulawesi) and Sorong (West Papua). All
tuna FADs in Indonesian waters are anchored and are of 3 main float types: steel pontoon (ponton), bamboo
with bungalow (rakit), and polystyrene block (gabus). Subsurface attractors are biodegradable materials and
most commonly palm branches (nipa and coconut), and do not include netting materials. Tuna fisheries based in
Kendari and Sorong include the fishing gears hand-line/troll-line (HL/TR), pole and line (PL), and purse seine
(PS) and fishing areas include the Indonesian Fishing Management Areas 713, 714, 715, 716, and 717.
Estimating the total number of FADs in these FMAs is difficult because of the current lack of effective systems
of FAD registration and monitoring, and also because of the desire of fishing companies and vessel skippers to
keep FAD position information confidential. Estimates range from several hundred to several thousand FADs.
From 484 fishing trips surveyed, the average number of fishing days in trips of PL and HL/TL vessels in
Kendari was 3 days and 7 days respectively, and 6 days for PL vessels in Sorong. Vessels visited up to 7 FADs
in a single trip and the level of success in fishing events on FADs within a fishing trip (FAD Success Rate;
FSR) varied across the fleets. In Kendari, HL/TR and PL vessels had a FSR of 64.9% and 65.9% respectively.
The FSR of PL vessels in Sorong was 84.9%. The average catch rates (per trip) of HL/TL vessels in Kendari in
2013, 2014, and 2015 were 1077 kg, 1273 kg and 980 kg respectively. PL vessels in Kendari had average trip
catch rates of 1593 kg (in 2013), 2490 kg (in 2014), and 4260 kg (in 2015). The average catch landings by PL
vessels in Sorong in 2013, 2014, and 2015 were 6515 kg, 11,633 kg, and 13,569 kg per vessel per trip
respectively. The estimated catch rate range for PS vessels based in Sorong during 14 months (Nov 2013-Dec
2014) was between 7,700 – 12,932 tonnes/set/vessel. Catch compositions included 18 species for HL/TL, 9
species for PL, and 7 species for PS. Skipjack tuna (SKJ) were the dominant species, 73% by volume, in
catches of PL in Kendari and PS vessels in Sorong - 76% and 81% of total catch respectively - but only made
up 41% of HL/TL landings and 38% of PL landings in Kendari. Yellowfin tuna (YFT) made up the largest
proportion (47%) of HL/TL catches in Kendari, compared to SKJ (41%). A large proportion of the SKJ, YFT
and bigeye tuna (BET) landed from the FAD-based fisheries at both ports were juvenile fish, below reported
Lengths at Maturity (Lm) for those species.
Introduction
Utilization of floating objects (logs, seaweed, etc.) as known attractors of fish has been a feature of artisanal,
coastal fishing in the waters of the Western and Central Pacific Ocean (WCPO) for hundreds of years (Kakuma
2000, Morales-Nin et al. 2000, Reuter, 1938; Nasution et al., 1986). The early 1980s (Tuasamu, 1985) marked
the beginnings of fishers deploying floating Fish Aggregating Devices (FADs) in deepwater in eastern
Indonesia waters to attract and catch tunas. Anchored FADs in waters as deep as 2000 – 3000 m have since
become a dominant practice for tuna fishing in Indonesia‟s archipelagic waters. Gershman et al. (2015)
estimated that the number of anchored and drifting tuna FADs in marine waters globally to be ± 120,680, and of
these, as many as 29,700 FADs in the WCPO. Western and Central Pacific Fisheries Commission (WCPFC)

2
made a similar estimate of total FAD numbers in 2014 for purse-seine vessels operating in the WCPO (Hurry
2014), but qualified with the statement that this estimate excluded the numbers of FADs in Indonesian and
Philippine waters, as these were unknown.
Indonesia‟s FAD-based tuna fishing in the WCPFC Statistical Area occurs primarily in the nation‟s Fishing
Management Areas (FMAs) 713, 714, 715, 716, and 717 (Figure 1). Since 2004, the Government of Indonesia
has issued various FAD related fisheries regulations: PER.30/MEN/2004; PER.08/MEN/2011 and PERMEN
No. 26/PERMEN-KP/2014, and the relevant plans: National FAD Management Plan for 2015-2017 (DGCF
2014) and National Tuna Management Plan (MMAF 2015).
Figure 1. Indonesian Fisheries Management Areas 713-718 (modified from Wilayah
Pengelolaan Perikanan, KOMNAS KAJISKAN 2010)
Effective fisheries regulations for management of FADs requires quality data and information on the Indonesian
fisheries including: numbers and locations of FADs, types of FAD ownership, types of fishing gears deployed
on the FADS and vessel operations, catch rates, and catch compositions for each gear type, by species and size
of fish (target tunas and bycatch species). Until now, implementation of FAD regulations has proved difficult,
largely due to the lack of such information. To address the information gaps, in 2012 Indonesia‟s Agency for
Marine and Fisheries Research and Development joined with CSIRO Australia in a four year research
collaboration1 that includes a FAD fisheries study. This paper provides preliminary results from this study
(ongoing to end of 2016), with particular reference to waters of FMAs 713-717.
1 Australian Centre for International Agricultural Research (ACIAR) Project FIS/2009/059. Principal agencies: Center for Fisheries
Research and Development (CFRD) - Indonesia, and Commonwealth Scientific and Industrial Research Organisation (CSIRO) -
Australia. Co-funded by ACIAR and CSIRO.

3
Materials and Methods
The results presented are outputs from an enumeration program at two key tuna landing ports in eastern
Indonesia - Kendari (SE Sulawesi) and Sorong (West Papua), where hand-line/troll-line (HL/TL), pole and line
(PL) and purse-seine (PS) fleets operate on FADs in FMAs 713 – 715, and FMAs 715 – 717 respectively. Data
and information were obtained through daily enumeration (2 enumerators in each port), including interviews
with skippers at earliest opportunity after their vessels unload catch, and also by direct observations,
information sourced from local port authorities, fisheries offices, fishing companies and fishing association
representatives. Biological sampling (length measurements of individual fish; tunas and bycatch species) were
done on a subsample of the catch at time of catch unloading or at point of auction/sale. Data were first recorded
onto hard-copy Landings and Biological Samplings forms and later entered into a project specific database
(Oracle/Apex), FAD Fisheries Database.
Results
1. Technical aspects of Indonesian anchored FADs
Drifting FADs are not used in the Indonesian tuna fisheries, even by purse-seine vessels; only anchored FADs
are used. Developments in Indonesian FAD construction, including region specific designs, were first detailed
by Subani and Barus (1989). Monintja (1993) described ten different types of FAD from Indonesia and more
than 20 types of FAD from around the world. Itano et al. (2004) also provided information on design of
anchored and drifting FADs in the WCPO, including anchored FADs in Indonesia. In common with anchored
tuna FADs employed by fisheries of other countries, the Indonesian FADs have four key components: the
surface float, the mainline to seafloor, a subsurface attractor, and the anchor (Figure 2).
The FAD surface floats are of three main types (Figure 3):
1. steel cylinder of 2 – 3 m length and approximately 0.8 m diameter, with generally one end is conical.
These are called pontoon type or “ponton”, and were, until recent years, the most common type of FAD
float in western and southern Indonesia
2. bamboo raft, the most sophisticated version having a bungalow (“rakit”) in which the fishers and/or
caretakers of the FAD reside, for weeks or even months. Fresh supplies of food and water, and other
Figure 2. Typical FAD
construction for (a) ponton
type FAD and (b) gabus
type FAD.

4
necessities for the persons staying at the FAD are brought by fishing vessels or carrier vessels. FADs
with rakit are found in eastern Indonesia, but to date, have not extended to western Indonesia;
3. large cylinders or blocks of styrene foam, encased in cloth and often bound by rope and used-motorcycle
tyres, and strengthened by a wooden frame. These are commonly called “gabus” type FAD. This type of
FAD has replaced ponton as the most common FAD type, due to its lower cost
In general, the FAD surface floats are not equipped with navigation aids (no radio signal emitters or radar
reflectors), but in some cases have an attached superstructure to make the FAD more visible.
Figure 3. Various types of anchored FAD floats in Indonesia (a) steel ponton, (b) styrene foam
gabus, and (c) bamboo raft with rakit (photos: Proctor)
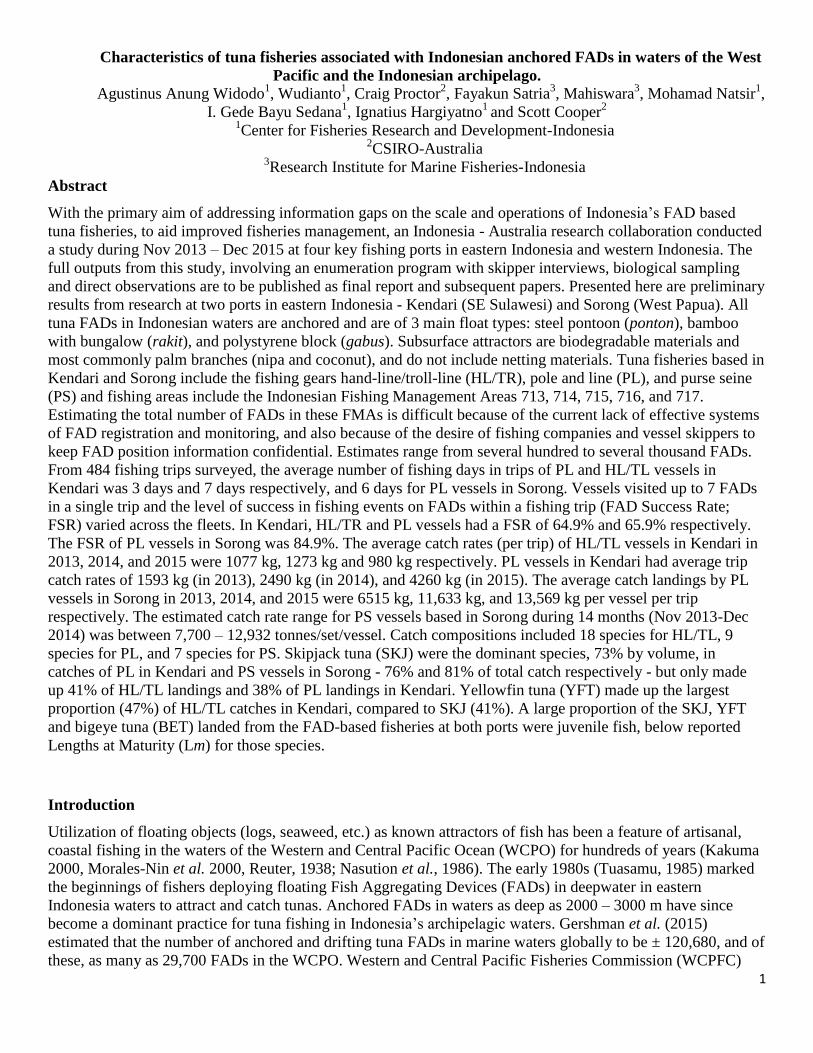
The FAD mainline, of up to 4000m in length for FAD deployment in water depth of 2000 – 3000m (but
sometimes as deep as 6000m), is most commonly a 2.5 – 4.0 cm diameter synthetic rope (Figure 4), sometimes
with wire core, but other types of synthetic rope of lesser diameter and less cost are also not uncommon,
particularly with gabus FADs. The subsurface attractors are most commonly branches of nipa palm (Nypa
fruticans) or coconut palm (Cocos nucifera), which are usually attached as a hanging cluster to the underside of
the surface float. Attractors made of plastic strips (synthetic raffia) have also been encountered on FADs during
this study, but current regulations prohibit the use of non-biodegradable materials. Nets and netting-like
materials are not used as subsurface attractors on the FADs, and therefore Indonesian tuna FADs pose minimal
risk of entanglement of turtles or other marine fauna.
FAD anchors are most commonly comprised of 60 - 80kg concrete blocks or cylinders (Figure 4), with
embedded ropes or motorcycle tyres as attachment points in each block, and 25 – 40 blocks linked together to
form an anchor of total weight 2 – 3 tonnes (Figures 2 and 4).
5
Figure 4. Examples of components for Indonesian anchored FADs: (a) coils of rope used
for FAD mainline, (b) 60-80 kg cement weights which are linked together to form the FAD
anchor, and (c) coconut palm branches attached to mainline as subsurface attractor (Photos:
Proctor).
2. Total number and positions of FADs
Achieving an estimate of the total number of anchored tuna FADs in Indonesia‟s FMAs 713 – 717 proved
difficult. Although current fisheries laws require the registration of FADs and owners of FADs to supply
positional and vessel use information for each FAD installed to Directorate General of Capture Fisheries in
Jakarta, these laws have not been effectively implemented and adhered to. In general, National, Provincial,
Regency and District offices of Department of Marine Affairs and Fisheries (DKP) were unable to provide
information of numbers and locations of FADs. Port Authorities are primarily concerned with monitoring vessel
traffic into and out of ports, and vessel activity in their ports, and do not, in general, maintain records of FAD
locations. Some fishing companies, vessel owners and skippers interviewed for this study did provide positional
information for their FADs, whereas others were reluctant to do so for want of keeping their fishing locations
confidential. The information obtained by this study‟s enumeration program, combined with that from other
sources, suggests the total number of FADs in FMAs 713 – 717 is at least in order of many hundreds and may
extend to thousands. Figure 5 and Figure 6 show the positional information for FADs in FMAs 714, 715 and
717 based on an earlier survey by CFRD in 2012 (Hargiyatno pers. comm.) and on enumeration done for this
study. An assessment of all the positional information obtained through the current study is in progress.
Among the current Indonesian fisheries regulations for FADs is the requirement that FADs be a minimum of 10
nm apart. There is strong evidence to suggest that this requirement is not being adhered to, with FADs in many
cases being significantly less than 10 nm apart. Achieving effective enforcement of this regulation is
undoubtedly one of the biggest challenges faced by Indonesia‟s management agencies, and requires improved

6
communication to fishing companies, fishing vessel owners, and fishers about the proven benefits that are likely
to come from a reduction in density of FADs in any given area (Cayré 1991; Marsac and Cayré 1998).
Figure 5. FAD positions in FMA 714 as determined from GPS coordinat es obtained in
survey in 2012 (i.e. not from enumeration in the current study). Green symbols indicate
FADs used by PS vessels and red symbols indicate FADs used by HL/TL vessels from PPS
Kendari and PPP Sodohoa (Kendari) respectively.
Figure 6. FAD positions in FMAs 715 and 717, from information collected during
enumeration in Sorong in 2013 and 2014. These FADs are used by PL and PS vessels.
3. Tuna fisheries associated with FADs
Tuna fisheries that operate in association with FADs in Indonesia include the gear types purse seine, pole and
line, hand-line, troll-line, and surface fishing using kites and lures. Two types of purse seine fleet size operate in
the waters of FMA 713 – 717: smaller vessels of <30 GT which are called “mini-purse-seine” (Figure 7a) of

7
local name “pajeko”, and larger purse seine vessels (“kapal pukat cincin”) of > 30 GT (Figure 7b). Pole and line
vessels operating around FADs are also of two main types: small size vessels of <20 GT, commonly called
'funae' (Figure 7c) and larger vessels of > 20 GT, commonly called “huhate” (Figure 7d). The numbers of funae
vessels are not increasing, but still operate in several areas in northern Sulawesi (e.g. Belang and Pulau
Gangga). Hand-line fishing, troll-line fishing and kite fishing are generally done by a single vessel type i.e.
multi-gear vessels, which switch between gears depending on season, prevailing seas conditions and catch
success. These vessels, commonly wooden-hull vessels of size 6 – 10 GT (Figure 7e), have different local
names across regions, including “penongkol” in northern and south-eastern Sulawesi, and “sekoci” in Bali and
east Java. These hand-line/troll-line vessels and their fishing methods originated from southern Sulawesi (Bugis
fishermen) and have spread to many other areas of the Indonesian archipelago.
Figure 7. Examples of Indonesian vessel types that fish on FADs: (a) Mini purse -seine (pajeko),
< 30 GT, at PPP Sodohoa; (b) larger purse-seine (pukat cincin), > 30 GT, at PPS Kendari; (c)
small pole and line (funae) in Belang, North Sulawesi; (d) pole and line, >50 GT, in Sorong; (e)
hand-line/troll-line (penongkol) at PPP Sodohoa; and (f) hand-line/troll-line „mother-ship‟
carrying several small catcher boats (sampan) in Kendari (Photos: Proctor).
Another type of tuna hand-line vessel that have operated widely in the eastern Indonesian waters, and
particularly in northern Sulawesi, are 'pump boats', which operate as a „mother-vessel‟ servicing several small
catcher boats (sampan) which are carried on board during travel. Some Indonesian HL/TL vessels, primarily in
southern Sulawesi (e.g. in Bone) and SE Sulawesi (Kendari) have adopted this style of fishing, routinely

8
carrying as many a 6 – 8 of the sampan, from which both large (up to 100 kg yellowfin tuna) and small tunas
are caught (Figure 7f).
4. Operational aspects of the fisheries using FADs
Catch success rate
The majority of the enumeration at Kendari and Sorong fishing ports focused on hand-line/troll-line (HL/TL)
and pole and line (PL) vessel activity. Table 1 summarises some of the fishing trip characteristics; results from
372 trips surveyed for HL/TL vessels and 112 trips surveyed for PL vessels. Interviews with skippers in
Kendari revealed that on average, HL/TL vessels visited 12 FADs during fishing trips of average length 7
fishing days (excludes days travelling to and from fishing grounds, and any days lost to bad weather or gear
issues etc.) and, on average, 8 of the FAD visits were successful with respect to fish catch. The success rate
(successful FAD visits expressed as a % of total number of FADs visited) of the HL/TL fleet in Kendari was
around 65%. The success rate of the Kendari PL fleet was similar at around 66%, for fishing trips of average
length 2 - 3 fishing days. The success rate PL vessels based in Sorong was significantly higher at around 85%
(Table 1), for trips of average length 6 fishing days.
Table 1. Summary of trip length (fishing days) and FAD visit success, for HL/TL and PL vessels
in Kendari and Sorong, based on information collected by this study during 2013 – 2014.
During the surveys in Kendari and Sorong, skippers of PL vessels often expressed frustration that FADs were
found to “empty of fish” after sets by PS vessels. In FMAs 713-717, the PS, PL, and HL/TL fleets have
significant overlaps in their fishing areas. Information provided by the PL skippers indicated that it normally
takes at least 1 – 2 weeks before fish numbers at the FADs „recover‟ after a PS set.
Catch rates
Results of enumeration at landing place PPP Sodohoa (on northern side of Kendari Bay), where the HL/TL
(penongkol) vessels unload catch, showed the average catch rates (based on total catch - all species) of HL/TL
vessels in 2013 (Oct – Dec only), 2014, and 2015 were 1077 kg, 1273kg, and 980 kg per vessel per trip
respectively (Table 2). Average catch rates by day per HL/TL vessel (based on total catch/no. fishing days for
fishing trips with available catch data) in 2013 (76 trips), 2014 (144 trips) and 2015 (163 trips) were 155 kg,
157 kg, and 169 kg per vessel/day. The primary fishing areas for HL/TL vessels based at PPP Sodohoa in
Kendari are on FADs in the waters around Manui Island, approximately 36 nm from Sodohoa.
Figure 8 illustrates the general operations of the PL fleet based in Kendari (at the main fishing port, PPS
Kendari), both for catcher vessels and carrier vessels. The vessels use the island group Kepulauan Umbele
(approximately 58 nm north from Kendari) as the base for fishing activity.
Location Gear Type
No. Vessel Trips
Average Number of Fishing (Days)
Average Number of FADs Visited
Average Number of FADs With Success
FADs Success Rate (%)
Kendari HL 372 7.2 12.1 7.5 64.9 Kendari PL 21 2.4 2.1 1 65.9 Sorong PL 91 5.8 4.5 3.9 84.9

9
Figure 8. An illustration summarising PL fleet operations out of fishing port PPS Kendari.
Port sampling activities were also conducted on carrier vessels that collect catch from one or more catcher
vessels (CV) and unload in PPS Kendari. At time of writing, analysis to delineate the catches of individual
catcher vessels collected and carried by the CV was incomplete. Determining total trip catch for many of the PL
vessels is difficult, in situations where some of the trip catch has been collected by a CV(s), and the PL vessel
returns to port with only the catch from its most recent fishing days (i.e. post CV collection). Hence, the total
landings reported in Table 3, as landings of PL vessels surveyed in PPS Kendari, may not represent the total trip
catch.

10
Table 2. Catch landings of HL/TL vessels (penongkol) surveyed at PPP Sodohoa di Kendari
during Oct 2013 - Dec2015.
Results of enumeration for PL vessels at PPS Kendari (on sothern side of Kendari Bay) showed the average
catch rates (based on total catch - all species) in 2013 (7 trips surveyed), 2014 (15 trips surveyed), and 2015 (3
trips surveyed) were 1593 kg, 2490 kg, and 4260 kg per vessel per trip respectively (Table 3).
Gear Type Year Month No. of Trips Total Catch (kg)
Catch / Trip (kg)
HL/TL
2013
10 26 30,042 1,155
11 23 23,815 1,035
12 27 28,082 1,040
Average 27,313 1,077
2014
1 20 20,400 1,020
2 18 20,724 1,151
3 19 24,500 1,289
4 8 9,500 1,188
5 6 9,500 1,583
6 9 12,800 1,422
7 9 11,792 1,310
8 10 13,200 1,320
9 11 12,650 1,150
10 10 22,750 2,275
11 11 10,080 916
12 13 8,449 650
Average 14,695 1,273
2015
1 12 11,290 941
2 8 5,500 688
3 14 13,825 988
4 15 13,560 904
5 15 14,925 995
6 15 16,905 1,127
7 7 8,600 1,229
8 13 13,250 1,019
9 14 16,435 1,174
10 16 15,560 973
11 15 14,610 974
12 19 14,251 750
Average 13,226 980

11
Table 3. Catch landings of PL vessels (huhate) surveyed at PPS Kendari during Oct 2013 – Dec
2015.
Enumeration in Sorong during the same period (Oct 2013 - Dec2015) showed that, on average, the length of PL
vessel trips was 10 days (max 27 days), with an average of 6 actual fishing days . On average, 4 days were
required to travel to and from the fishing areas, searching for bait, and or for other non-fishing activity including
repairs of the vessel‟s engine. The average catch landings (based on total catch - all species) by PL vessels in
Sorong in 2013 (9 landings surveyed), 2014 (59 landings surveyed), and 2015 (24 landings surveyed) were
6515 kg, 11,633 kg, and 13,569 kg per vessel per trip respectively. (Table 4). Average catch per actual fishing
day for these vessels in 2014 and 2015 was 1,994 kg, and 2262 kg respectively.
Gear Type Year Month No. of Trips Total Catch (kg)
Catch/Trip (kg)
PL
2013
10 2 2,006 1,003
11 4 8,100 2,025
12 1 1,750 1,750
Average 3,952 1,593
2014
1 3 5,500 1,833
2 1 2,045 2,045
3 5 16,912 3,382
4 2 7,650 3,825
9 4 5,450 1,363
Average 7,511 2,490
2015
8 1 4,100 4,100
9 1 2,980 2,980
10 1 5,700 5,700
Average 4,260 4,260

12
Table 4. Catch landings of PL vessels (huhate) surveyed at Sorong during Oct 2013 – Dec 2015.
In general, purse seine (PS) vessels based in Fishing Port of Sorong operate in a group which consists of a PS
catcher vessel, 3 to 4 carrier vessels, and 3 to 4 light boats. The pattern of fishing operations of the group is as
follows: the catcher vessels have fishing trips of more than 6 months; catches are transferred directly to CVs
because the catcher vessels generally do not have fish-holds of sufficient size to hold the catch; one setting of
the net over 1 day/1 night is normal. The amount of fish that is transported to Sorong by a CV is most often the
result of 3 to 4 sets by the catcher vessel. The enumeration of CVs showed that in 2013 and 2014 the average
volume of fish landed by an individual CV in Sorong was 38,794 tonnes and 30,803 tonnes respectively, with
the highest landing being 54,597 tonnes (Table 5). If these landings result from catches from 3 - 4 sets of the PS
net, the estimates of average catch/set was 9 – 12 tonnes in 2013 and 8 – 10 tonnes in 2014.
Table 5. Landings (by volume) by carrier vessels surveyed in Sorong during Nov 2013 – Nov
2014.
Gear Type Date_Year Date_Month No_Of_Trips Total_Catch (kg)
Catch/Trip (kg)
PL
2013 11 7 44,005 6,286
12 2 13,486 6,743
Average
28,746 6,515
2014
1 6 36,289 6,048
2 7 33,283 4,755
3 7 56,233 8,033
4 9 52,574 5,842
7 1 8,712 8,712
9 7 144,651 20,664
10 9 193,058 21,451
11 10 124,358 12,436
12 3 50,264 16,755
Average 77,714 11,633
2015
1 4 70,169 17,542
2 5 79,858 15,972
3 8 97,266 12,158
4 7 60,218 8,603
Average 76,878 13,569
Gear_Type Date_Year Date_Month No_Of_Trips Total_Catch (kg)
Catch/Trip (kg)
CV
2013 11 3 116,572 38,857
12 2 77,460 38,730
Average 97,016 38,794
2014
1 4 101,502 25,376
2 3 163,792 54,597
3 1 19,389 19,389
4 3 87,644 29,215
9 4 111,983 27,996
11 1 28,242 28,242
Average 85,425 30,803

13
5. Biological aspects of the tuna fisheries operating on FADs
Catch composition
The results from enumeration in Sodohoa (Kendari) showed that, in the landings surveyed, at least 18 species of
fish were caught by the HL/TL fleet. Yellowfin tuna (YFT), Thunnus albacares, was a dominant component,
comprising 47.6% by volume of the surveyed catch over the study period. Skipjack tuna (SKJ), Katsuwonus
pelamis, were also a major component at 41.0%, with bigeye tuna (BET), T. obesus, at 5.4% (Table 6). Billfish
(marlins, sailfish, spearfish etc.) only made up 0.06%, by volume, of the catch.
Table 6 :Composition of catch by species by volume (kg) from HL/TL vessels surveyed at PPP
Sodohoa in Kendari during Oct 2013 – Dec 2015.
The catches of PL vessels landed that were surveyed in PPS Kendari were dominated by skipjack tuna
(73.2% by volume), and yellowfin tuna (26.7%) (Table 7). Bigeye tuna were recorded at overall at only
0.1% of the landings. This level of bigeye tuna occurrence is surprisingly low and is a result being
treated with caution at this stage in the data assessment. It may be partly or wholly explained by
inexperience of the enumerators in discerning YFT and BET at small size.
Table 7. Composition of catch by species by volume from PL vessels surveyed at PPS
Kendari during Oct 2013 – Dec 2015.
Indonesian Name Common Name Scientific Name 2013 2014 2015 Total (kg)
%
Madidihang Yellowfin Thunnus albacares 42,131 77,881 78,525 198,537 47.611
Cakalang Skipjack tuna Katsuwonus pelamis 31,954 74,405 64,805 171,164 41.047
Matabesar Bigeye Thunnus obesus 2,862 10,463 9,346 22,671 5.437
Tongkol banyar Frigate tuna Auxis thazard 2,221 9,080 11,301 2.710
Setuhuk Hitam Black Marlin Makaira indica 1,568 2,352 2,170 6,090 1.460
Tongkol, Kawa-kawa
Eastern little tuna, Kawa kawa
Euthynnus affinis 600 1,620 2,220 0.532
Tongkol Tongkol Auxis spp. 900 910 1,810 0.434
Lemadang Common dolphinfish Coryphaena hippurus 656 236 100 992 0.238
Hiu macan Tiger shark Galeocerdo cuvier 700 700 0.168
Cucut, Hiu Various sharks nei 120 535 655 0.157
Billfish (setuhuk dll.)
Marlins, sailfish, spearfish etc. nei
Istiophoridae 163 100 263 0.063
Setuhuk Biru Blue Marlin Makaira nigricans 233 233 0.056
Mungsing (Bali) Silky shark Carcharhinus falciformis 130 0 130 0.031
Layang Scads nei Decapterus spp 80 80 0.019
Cucut selendang Blue shark Prionace glauca 65 65 0.016
Setuhuk Loreng Striped Marlin Tetrapturus audax 65 65 0.016
Tenggiri Narrow-barred Spanish mackerel
Scomberomorus commerson
6 8 14 0.003
Alu-alu Barracuda Sphyraena spp 5 5 0.001
Total 416,995 100
Indonesian Name Common Name Scientific Name 2013 2014 2015 Total (kg) %
Cakalang Skipjack tuna Katsuwonus pelamis 8,250 27,960 9,300 45,510 73.2
Madidihang Yellowfin Thunnus albacares 3,530 9,597 3,480 16,607 26.7
Matabesar Bigeye Thunnus obesus 76 76 0.1
Total 62,193 100

14
Among the 9 species in the catches of PL vessels surveyed in Sorong, skipjack tuna made up 75.6% by volume,
yellowfin tuna 19.6%, and bigeye tuna only 3.50% (Table 8). Purse seine catches landed by CV in Sorong
included 7 species, dominated by skipjack tuna at 81.0% by volume, and yellowfin tuna 14.1% (Table 9).
Bigeye tuna were recorded at only 2.1% by volume.
Table 8. Composition of catch by species by volume from PL vessels surveyed at Sorong during
2013 – 2015.
Table 9. Composition of catch by species by volume from CV vessels surveyed at Sorong during
Oct 2013 – Dec 2015.
Overall, the proportion of sharks and billfish, as bycatch species, in the landings of HL/TL and PL vessels in
Kendari and Sorong was extremely low, with sharks and billfish aggregated being highest in HL/TL landings at
Sodohoa, but only at 1.9% by volume. No sharks or marlins were recorded in landings of PL vessels in Kendari
and in Sorong and nor in the landings of PS vessels (landed by CV) in Sorong. This latter result contrasts
markedly with the significant amounts of shark (in particular silky sharks, Carcharhinus falciformis) reported
by Nicol et al. (2009) as bycatch in the PNG purse-seine fishery. Further assessment of the surveyed landings
from carrier vessels in Sorong is in progress to determine if bycatch species were „missed‟ by the enumeration.
At present, the results of the enumeration in this study suggest that, overall, the tuna fisheries associated with
FADs in FMAs 713-717 have relatively low levels of bycatch.
Fish size
Table 10 details the length (FL) of SKJ, YFT, and BET measured from subsamples of catch landings from
HL/TL and PL vessels in Kendari and PL vessels in Sorong. At time of writing, assessment of subsampling of
Indonesian Name Common Name Scientific Name 2013 2014 2015 Total (kg) %
Cakalang Skipjack tuna Katsuwonus pelamis 38,810 481,746 284,536 805,092 75.64
Madidihang Yellowfin Thunnus albacares 11,410 173,826 22,975 208,211 19.56
Matabesar Bigeye Thunnus obesus 5,070 32,201 37,271 3.50
YFT/BET? Indistinguishable Yellowfin or Bigeye
6,227 6,227 0.59
Tongkol banyar Frigate tuna Auxis thazard 940 2,096 3,036 0.29
Tongkol, Kawa-kawa Eastern little tuna, Kawakawa
Euthynnus affinis 1,261 1,314 2,575 0.24
Sunglir Rainbow runner Elagatis bipinnulata 825 825 0.08
Kasper Ray's bream, Pomfret Brama spp 711 711 0.07
Lemadang Common dolphinfish Coryphaena hippurus 476 476 0.04
Total 1,064,424 100
Indonesian Name Common Name Scientific Name 2013 2014 2015 (kg) Total
Cakalang Skipjack tuna Katsuwonus pelamis 154,080 418,549 572,629 81.0
Madidihang Yellowfin Thunnus albacares 31,571 68,115 99,686 14.1
Matabesar Bigeye Thunnus obesus 4,881 9,962 14,843 2.1
Tongkol banyar Frigate tuna Auxis thazard 2,755 6,739 9,494 1.3
Tongkol, Kawa-kawa Eastern little tuna, Kawakawa Euthynnus affinis 311 5,700 6,011 0.9
Sunglir Rainbow runner Elagatis bipinnulata 273 1,913 2,186 0.3
Lemadang Common dolphinfish Coryphaena hippurus 161 1,574 1,735 0.2
Total 706,584 100

15
PS landings at both locations was still in progress. The average size of most of YFT and BET, caught by both
these gear types, were below the reported Lengths of Maturity (Lm); YFT - 103 cm FL (Mardlijah and Patria
2012) and BET - 102 – 105 cm FL (Schaefer et al. 2005). The majority of SKJ landed by HL/TL vessels in
Kendari were also below their reported Lm of 40 – 42 cm FL (Tandog-Edralin et al. 1990).
Table 10. Length (cm FL) of SKJ, YFT, and BET caught by HL/TL and PL vessels based in
Kendari and Sorong, surveyed during Oct 2013 – Dec 2015. n = number of fish measured.
The use of FADs, as attraction devices for tuna, have a negative effect on the environment. There has been
considerable earlier research on this matter e.g. Bromhead et al. (2000), Sokimi (2008), Ménard et al. (2000),
Freon and Dagorn (2000). Among the important outcomes from these studies was that the operation of the purse
seine fishing around FADs results in large catches of juvenile YFT and juvenile BET, and an associated high
Location Gear Type Species Year Min Length Max Length Avg Length n
Kendari HL/TL SKJ 2013 21 41 31.5 456
2014 20 48 32.3 1,235
2015 24 41 32.6 543
YFT 2013 29 41 34.0 418
2014 22 41 34.5 1,240
2015 22 45 33.7 830
BET 2013 25 42 37.8 28
2014 31 46 40.1 150
2015 32 48 39.8 93
PL SKJ 2013 30 46 37.3 65
2014 30 87 42.2 855
2015 26 73 49.9 58
YFT 2013 34 47 40.8 32
2014 30 82 41.0 514
2015 29 82 50.0 29
BET 2013 48 52 49.7 3
2014 31 57 46.2 30
2015 58 63 60.5 2
Sorong PL SKJ 2013 15 65 36.5 435
2014 15 83 38.7 2,388
2015 25 59 43.9 205
YFT 2013 15 66 42.7 151
2014 15 65 43.6 528
2015 29 59 43.1 35
BET 2013 27 65 48.0 70
2014 18 85 46.5 221
2015 25 58 44.5 15

16
risk of overfishing. The preliminary results from this study in eastern Indonesian archipelagic waters have
shown catches of HL/TL and PL also include a high percentage of immature fish in the YFT and BET caught.
The data and information presented from this study are preliminary, prior to more complete assessment and
reporting in a forthcoming project Final Report and subsequent papers. The study includes an assessment of
bio- and socio-economic aspects of the FAD-based fisheries.
Acknowledgements
The authors wish to thank the enumerators who conducted surveys for this study. We also thank the port
authorities, fisheries offices, industry associations, fishing companies, vessel owners and skippers who provided
cooperation, assistance and additional information for the FAD fisheries study. This paper is an output of
ACIAR Project FIS/2009/059, co-funded by ACIAR, CSIRO and Agency of Marine and Fisheries Research and
Development (Indonesia).
References
Alverson, D.L., Freeberg, M.H., Murawski, S.A. & Pope, J.G. (1994). A global assessment of fisheries bycatch
and discards. FAO Fisheries Technical Paper No. 339. Rome, FAO. 235pp.
Bromhead, D., Foster, J., Attard, R., Findlay, J. & Kalish, J. (2000). A review of the impact of fish aggregating
devices (FADs) on tuna fisheries. Final report to Fisheries Resources Research Fund. Canberra, Australian
Bureau of Rural Sciences.
Cayré, P. (1991) Behavior of yellowfin tuna (Thunnus albacares) and skipjack tuna (Katsuwonus pelamis)
around Fish Aggregating Devices (FADs) in the Comoros Islands as determined by ultrasonic tagging. Aquatic
Living Resources 1991;4:1-12.
DGCF (2014) National FAD Management Plan for 2015-2017.
Fréon, P., and Dagorn, L. (2000). Review of fish associative behavior: Toward a generalization of the meeting
point hypothesis. Reviews in Fish Biology and Fisheries 10:183–207.
Gershman D., A. Nickson, M. O‟Toole, (2015). Estimating the use of FADs around the world. An updated
analysis of the number of fish aggregating devices deployed in the ocean. A report from the PEW Charitable
Trusts, p24.
Hall, M. and Roman, M. (2013). By-catch and non-tuna catch in the tropical tuna purse seine fisheries of the
world. FAO Fisheries and Aquaculture Technical Paper No. 568. Rome, FAO. 249 pp.
Hurry, G. (2014) FAD marking and management discussion paper (Para 38 of CMM 2013-01), WCPFC11-
2014-13, Attachment 2, 25 November 2014.
Itano D., Fukofuka S., and Brogan D. (2004) The development, design and recent status of anchored and
drifting FADS in the WCPO. SCTB17 Working Paper, INF-FTWG-3; 2004.

17
Kakuma, S. (2000). Synthesis on moored FADs in the Northwest Pacific region, p. 63-77. In: Le Gall, J.Y., and
Taquet, M. (eds.) Pêche thonière et dispositifs de concentration de poissons. Ed. Ifremer, Actes colloquy 28.
Kelleher, K. (2005). Discards in the world‟s marine fisheries. An update. FAO Fisheries Technical Paper
No. 470. Rome, FAO. 131pp.
Marsac F. and Cayré P. (1998) Advances in Invertebrates and Fish Telemetry. Netherlands: Springer; 1998.
Telemetry applied to behaviour analysis of yellowfin tuna (Thunnus albacares, Bonnaterre, 1788) movements
in a network of fish aggregating devices; p. 155-171.
MMAF (2014) National Tuna Management Plan.
Ménard, F., Stéquert, B., Rubin, A., Herrera, M. & Marchal, E. (2000). Food consumption of tuna in the
equatorial Atlantic Ocean: FAD-associated versus unassociated schools. Aquatic Living Resources, 13(4): 233–
240.
Mardlijah, S and M.P. Patria, 2012. Biologi reproduksi ikan madidihang (Thunnus albacares Bonnatere 1788) di
teluk Tomini. BAWAL 4(1):27-34.
Monintja, D.R. (1993) Study on the development of rumpon as Fish Aggregating Devices. Mar. Technol. Bull.
ITK, 3(3), 1 – 137.
Morales-Nin, B., Cannizzaro, L., Massuti, E., Potoschi, A., and Andaloro, F. (2000). An over view of the FADs
fishery in the Mediterranean Sea, p. 184-207. In: Le Gall, J.Y., Cayre, P., and Taquet, M. (eds.) Pêchethonière
et dispositifs de concentration de poissons. Ed. Ifremer, Actes colloquy 28.
Nasution, C.H. Merta, G. S., Arifuddin, R. (1986) Study on rumpons and their aspects in Mamuju waters to
develop a tuna fishery in South Celebes (in Bahasa Indonesia). J. Mar. Fish. Res., 37, 31 – 58.
Nicol, S., Lawson, T., Briand, K., Kirby, D., Molony, B., Bromhead, D., Williams, P., Schneiter, E., Kumoru,
L., and Hampton, J. (2009) Characterisation of the tuna purse seine fishery in Papua New Guinea. ACIAR
Technical Report No. 70, 44 pp
Reuter J. (1938). Voorlopig mededeling omtrent het roempoen onderzoek. Institut voor Zeevisscherij. Batavia.
Schaefer, Kurt M.; Fuller, Daniel W.; Miyabe, Naozumi (2005). "Reproductive Biology of Bigeye Tuna
(Thunnus Obesus) in the Eastern and Central Pacific Ocean" (PDF) (Bulletin) 23 (1). La Jolla, California: Inter-
American Tropical Tuna Commission: 7–8.
Sokimi, W. (2008). Development of subsurface FADs in the Pacific Islands region, including deployment of
two subsurface FADs in New Caledonia. SPC Fisheries Newsletter, 126: 40–44.
Subani, W. and Barus, H.R. (1989) Alat penangkapan ikan dan udang laut di Indonesia (Fishing gears for
marine fish and shrimp in Indonesia). No. 50 Th 1988/1989. Special edition of J. Mar. Fish. Res. ISSN 0216 –
7727. 248pp.
Tandog-Edralin, D.D., E.C. Cortez-Zaragoza, P. Dalzell and D. Pauly. (1990) Some aspects of the biology and
population dynamics of skipjack (Katsuwonus pelamis) in Philippine waters. Asian Mar. Biol. 7:15-29.

18
Tuasamu, A.B. (1985) Effectivitas penggunaan alat bantu rumpon terhadap hasil tangkap ikan cakalang
(Katsuwonus pelamis) dengan pole and line di perairan Sorong, Irian Jaya [The effectivity of the use of payaos
for skipjack (Katsuwonus pelamis) fishing using pole and line in Sorong Waters, Irian Jaya]. University of
Brawijaya, Malang, 1985, 56 p.