Embed Size (px)
Citation preview
Scientific Inquiry &
Problem Solving
Kimberly Davis
Dothan High School
Bell-ringer Activity• Quietly pick up one of each of the
handouts from the bookcase. • Find your student # on the class roster on
the bulletin board at the front of the class. • Have a seat in the desk that has the same #
on it.• Complete the Student Information Sheet.

Agenda• Introduction• Classroom Policies and
Procedures• Safety Handout• Tiger Tip Review• Code of Conduct Review• Begin Notes

Essential Question
• Why do crime scene investigators use a specific order of steps when investigating a murder?

Discuss
• How does a CSI approach a crime scene?• How do they solve the crime?
Experiments/Problem Solving• Something as simple as changing from one
type of shampoo to another in hopes of an improved effect is a type of simple experiment.
• Can you think of another example?

Cultural DiversityShamans • Healers• Rainforest of Central & S. America• Observe & test local plants until they find
which ones work• Today scientists work with these shamans in
manufacturing prescription drugs.
Vocabulary Mixer• In your groups, try to match the
vocabulary words with the appropriate definition.
• Do not bend the slips of paper!• After I have checked your
matches, please put the papers back in the bags and give them to me.
State the Problem• Observations: the information gathered
using any of your senses • made throughout the scientific experiment,
not only at the beginning• lead you to ask a question or identify (state)
a problem
Gather Information• use reference materials such as:
– Encyclopedias– Dictionaries– Scientific magazines and journals– World wide web
• not all information is relevant or useful to a particular science topic
How do you know if it is relevant?–Is the information outdated?–Is it accurate or just someone’s opinion?
Can the information be verified elsewhere?–Is it from a reputable source?–Who is the intended audience?–Why is this the best source to use?–How can the information be used?
Form a Hypothesis• Hypothesis: a possible answer to the
question– can be tested by an experiment
Test the Hypothesis
• Experiment: tests the affect of one thing on another using controlled conditions
• Contain many variables• Variables: the factors that affect the
experiment
Variables– Independent variable: the variable that is being
tested and is intentionally changed or manipulated
– Dependent variable: the variable that might be affected as a result of that intentional change
– Constant: factor that does not change when other variables change; • may have numerous constants in an
experiment – Control: the standard by which the test results can be compared
Odds tell the Evens:
What is the difference between independent and dependent variables?

Evens tell the Odds:
What is the difference between a control and a constant?
How might NASA scientists set up an experiment to solve the problem of the damaged tiles that caused the Columbia space shuttle accident?
They might make tiles of many different materials and subject them all to the heat and other stresses encountered by the shuttle.
NASA experiment variables:Independent variable: the materials usedDependent variable: the amount of heat the
tile can withstand without being damagedConstants: the conditions to which the tiles
were subjectedControls: tiles from the first shuttles

Bird Feeder Experiment• My neighbor has a clear bird feeder
that 3 birds frequent each day. • I bought one clear, one red, and one
blue feeder to see if color will affect which feeder a bird chooses.
• I put the feeders in my yard, each with the same amount and type of food hanging in the same area for the same amount of time.
What are the variables?• Independent variable: the color
of the feeder• Dependent variable: which bird
feeder is frequented the most or that all are equally chosen, whichever result is true
• Constant: amount and type of food, amount of time
• Control: the clear feeder
Odds tell the Evens• What is the difference between
a constant and a control?

Evens tell the Odds
• What is the difference between a dependent and an independent variable?

Gather Information• Gather and record the data in a lab report
or chart during the experiment.–Quantitative: involve measurements or
numbers–Qualitative: does not involve numbers or
measurements
Quantitative Measurement
• SI (metric) system: universally accepted standard of measurement
• Standard: an exact quantity people agree to use for comparison (ex. meter, gram, liter)
Essential Question: Why have standards of measurement?• to reproduce someone else’s results• Ex. If I say the door is three arm lengths
across, what happens when you measure a table to fit through the door with your arm?

ActivityHave someone very tall and someone very short walk fifteen steps heel to toe.–Why is there a difference in the
distance that they walked?–Are human feet a good method
(standard) of measurement? Why or why not?
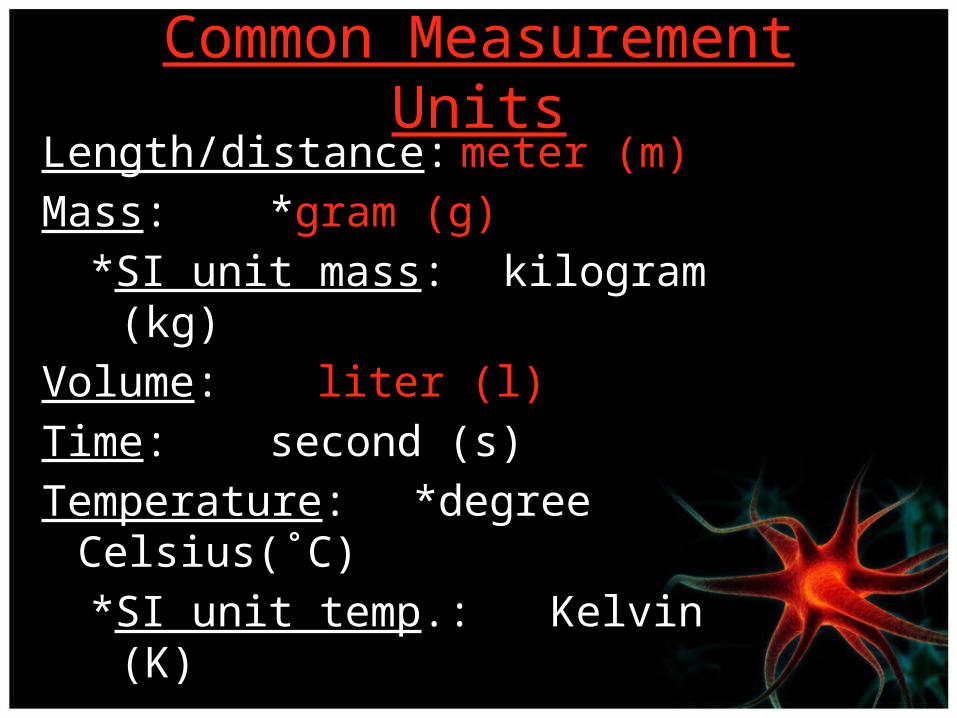
Common Measurement UnitsLength/distance: meter (m)Mass: *gram (g)
*SI unit mass: kilogram (kg)Volume: liter (l)Time: second (s)Temperature: *degree Celsius(˚C)
*SI unit temp.: Kelvin (K)
(most common base units used)
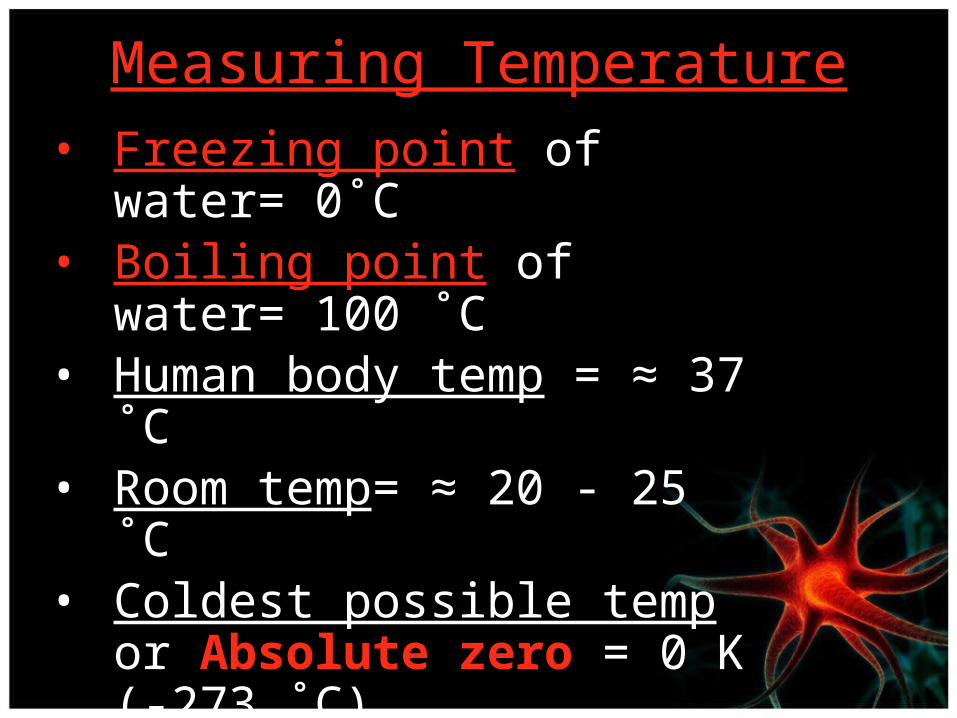
Measuring Temperature• Freezing point of water= 0˚C• Boiling point of water= 100 ˚C• Human body temp = ≈ 37 ˚C• Room temp= ≈ 20 - 25 ˚C• Coldest possible temp or
Absolute zero = 0 K (-273 ˚C)– To convert °Celsius to Kelvin,
just add 273 to the Celsius temperature.

Common Base Unit Prefixeskilo- k 1,000hecto- h 100deka- da 10deci- d 0.1centi- c 0.01milli- m 0.001micro- μ 0.000 001
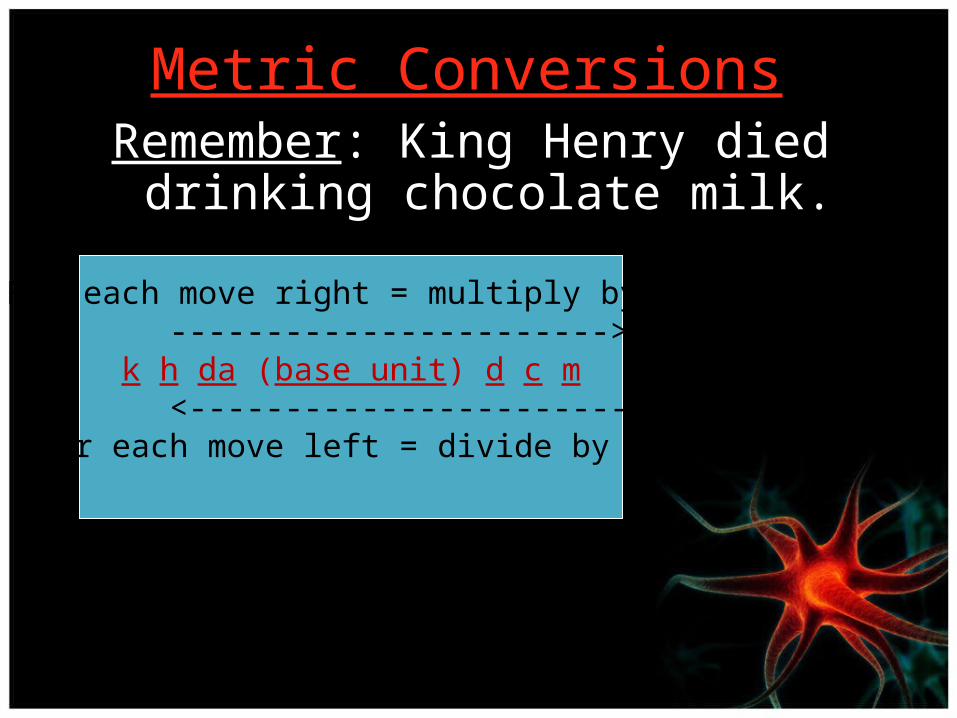
Metric ConversionsRemember: King Henry died drinking
chocolate milk.
For each move right = multiply by 10 ----------------------->
k h da (base unit) d c m <-----------------------
For each move left = divide by 10
Why is it important to know how to convert measurements?
• Data can be collected using a variety of tools. (Meter sticks, balances, stopwatches, etc.)
• You need to be able to compare your results to a standard.
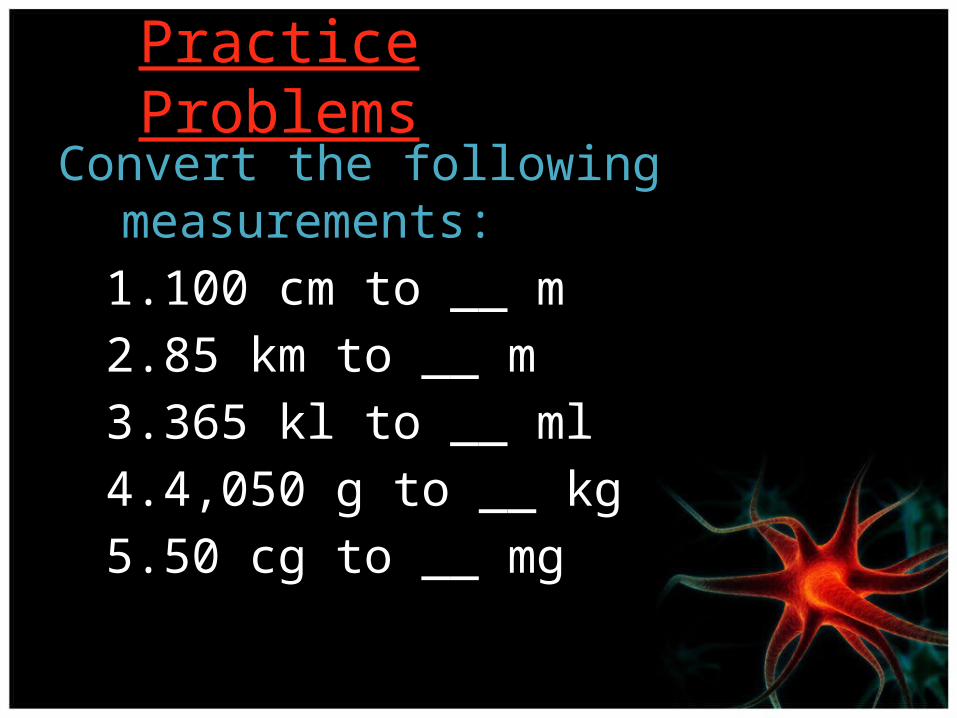
Practice ProblemsConvert the following measurements:
1. 100 cm to __ m2. 85 km to __ m3. 365 kl to __ ml4. 4,050 g to __ kg5. 50 cg to __ mg
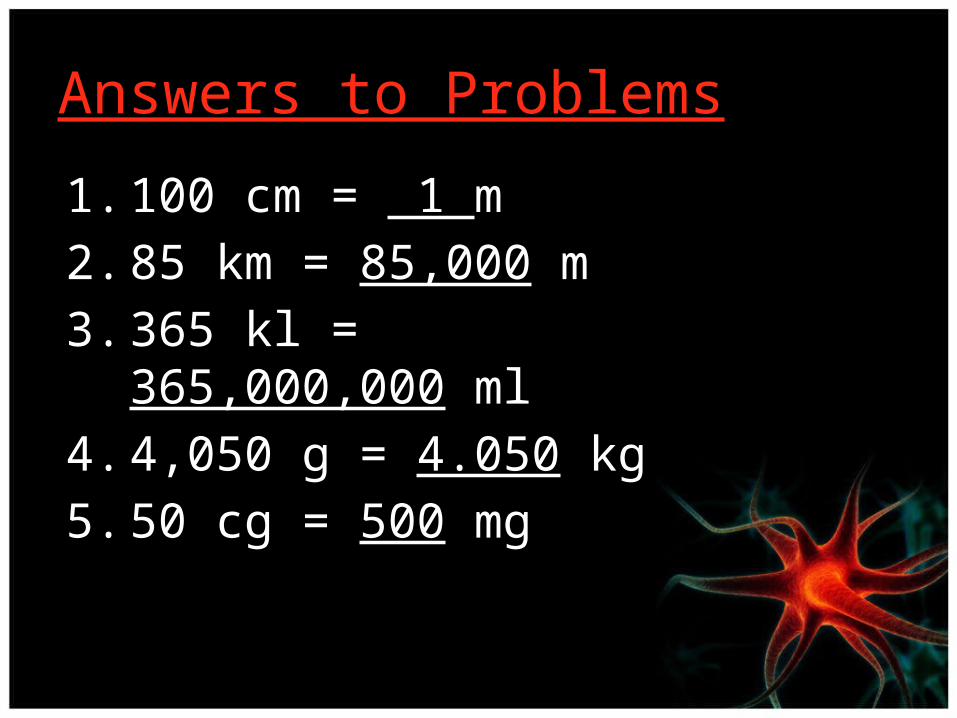
Answers to Problems
1. 100 cm = 1 m2. 85 km = 85,000 m3. 365 kl = 365,000,000 ml4. 4,050 g = 4.050 kg5. 50 cg = 500 mg

More Practice Problems
Convert the following measurements:1) 1 l to ____ dl2) 400 cm to ____ km3) 35,007 km to ____ mm4) 1992 kg to ____ cg5) 4,875,016 mm to ____ dam
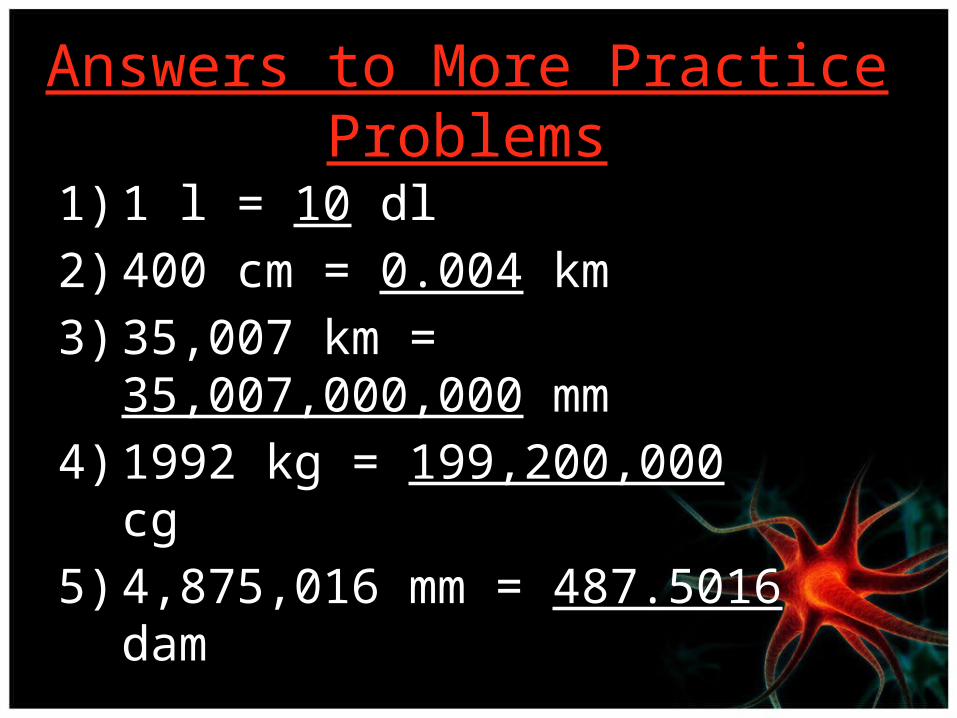
Answers to More Practice Problems
1) 1 l = 10 dl2) 400 cm = 0.004 km3) 35,007 km = 35,007,000,000 mm4) 1992 kg = 199,200,000 cg5) 4,875,016 mm = 487.5016 dam
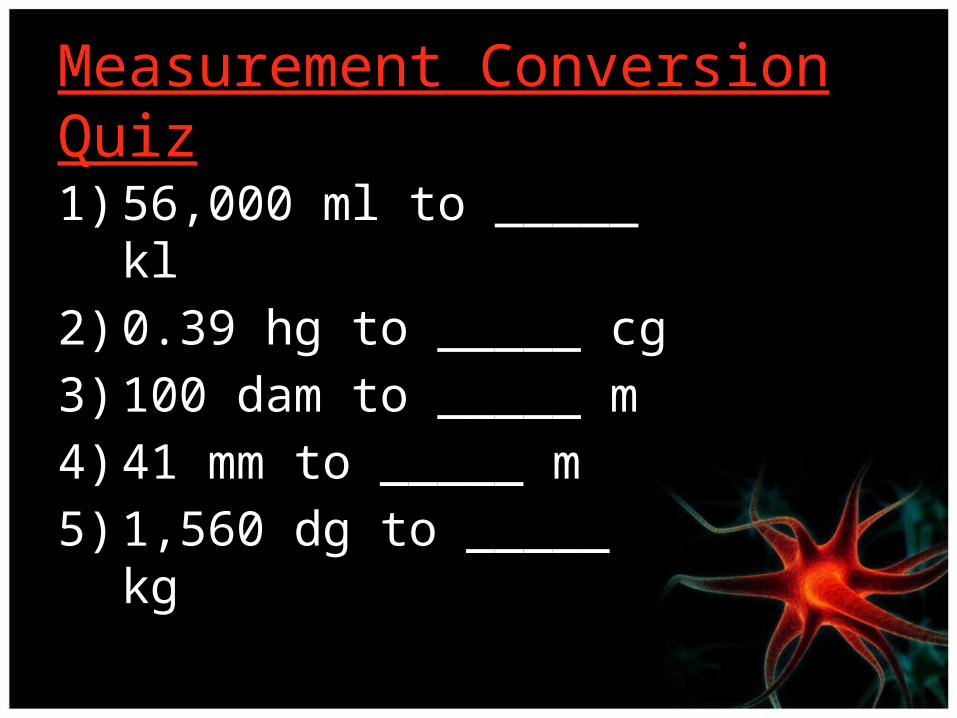
Measurement Conversion Quiz
1) 56,000 ml to _____ kl2) 0.39 hg to _____ cg3) 100 dam to _____ m4) 41 mm to _____ m5) 1,560 dg to _____ kg
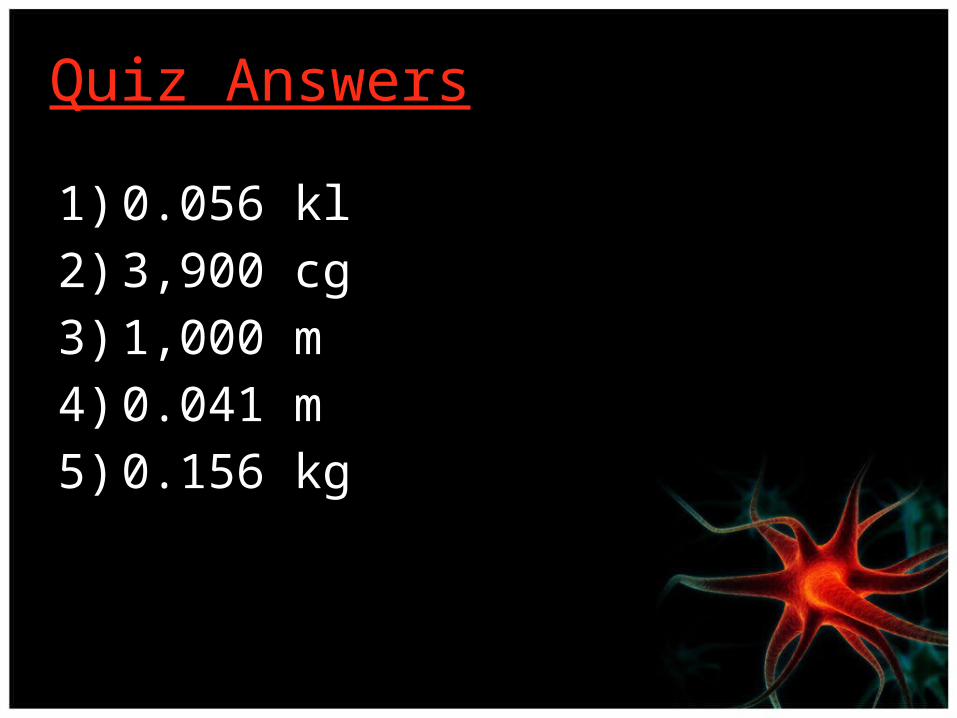
Quiz Answers
1) 0.056 kl2) 3,900 cg3) 1,000 m4) 0.041 m5) 0.156 kg
Is one measurement enough?• No, scientists make repeated
measurements to increase the validity and reliability of the results.
• This data is then organized into a data table so that others can understand it.
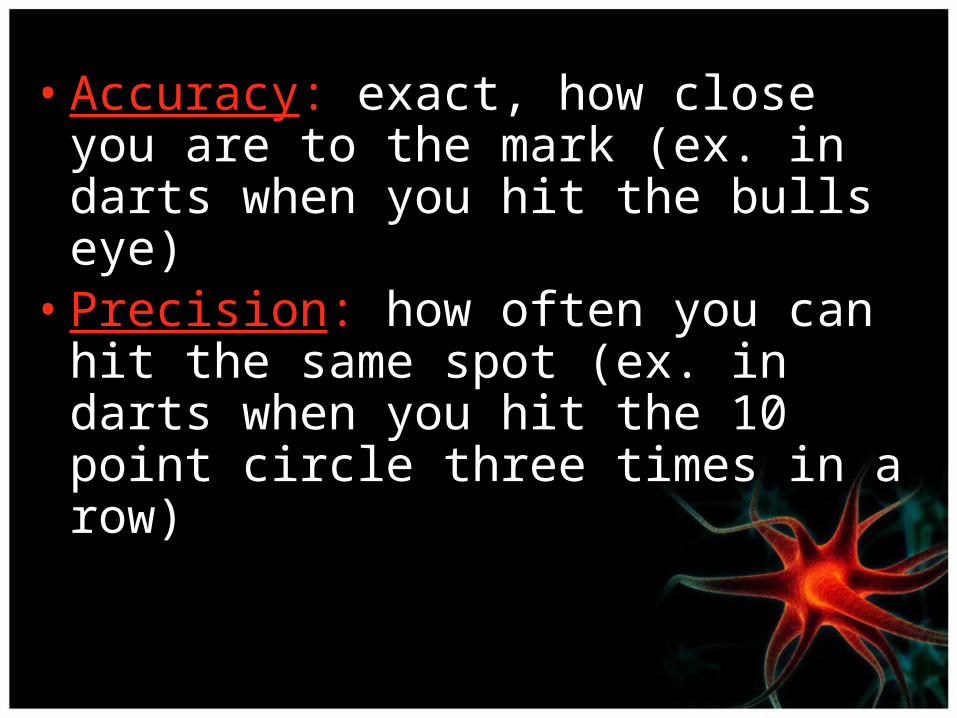
• Accuracy: exact, how close you are to the mark (ex. in darts when you hit the bulls eye)
• Precision: how often you can hit the same spot (ex. in darts when you hit the 10 point circle three times in a row)

Practice Problem• A student obtained these data after
measuring the mass of an object three different times. – 1st measurement: 6.293 g– 2nd measurement: 6.294 g– 3rd measurement: 6.295 g
• If object’s mass is actually 5.550 g, these data are best described as —– precise but not accurate

Analyze the Data• Graph: an effective method of organization
which helps to understand and communicate data
• Bar Graph: measures things that are counted
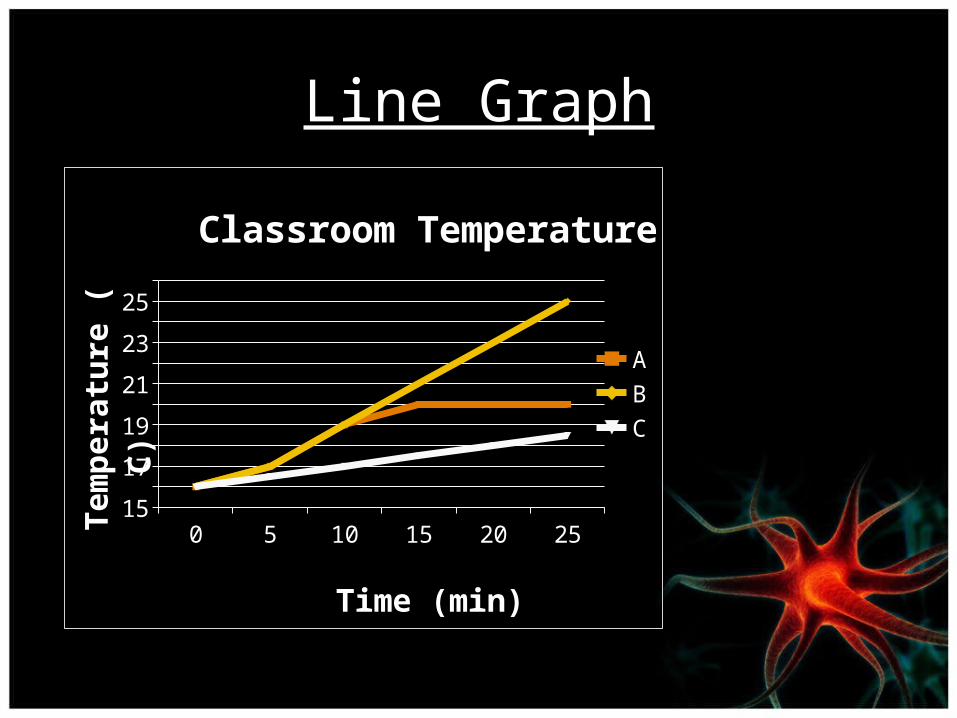
• Line Graph: compares the independent and dependent variables
• Circle Graph: measures parts of a whole or percentages
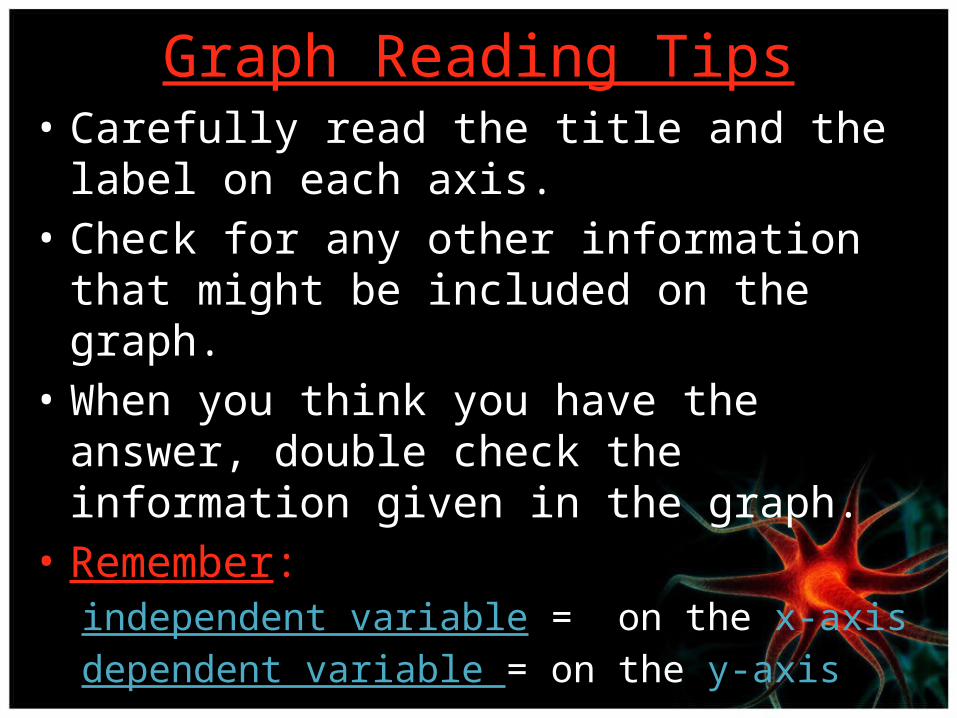
Graph Reading Tips• Carefully read the title and the label on each axis. • Check for any other information that might be
included on the graph. • When you think you have the answer, double
check the information given in the graph. • Remember:
independent variable = on the x-axisdependent variable = on the y-axis
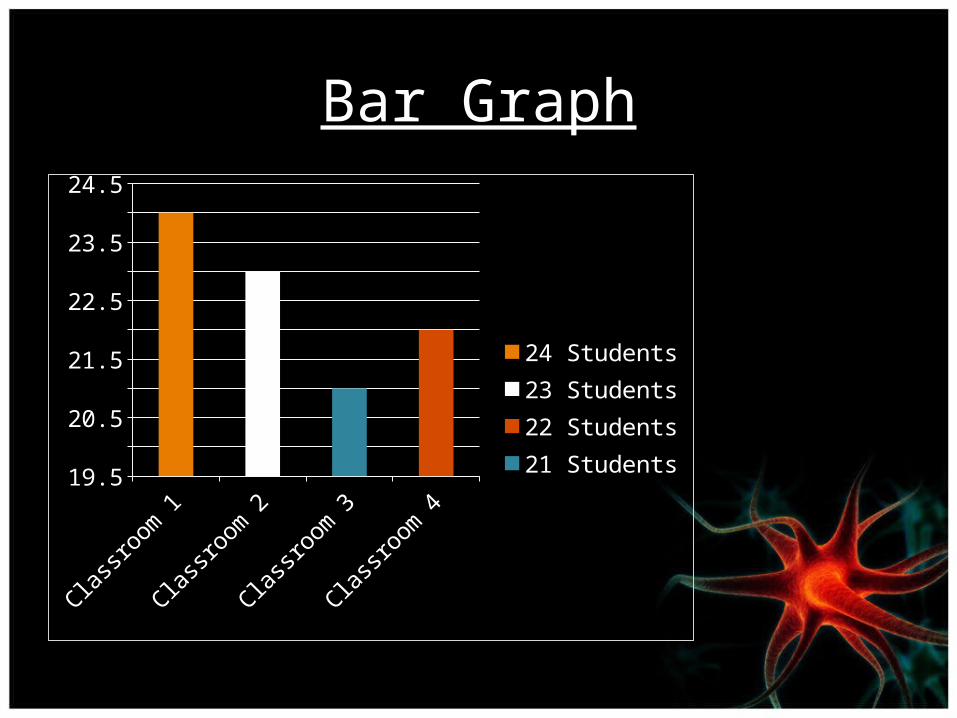
Bar Graph
Classro
om 1
Classro
om 2
Classro
om 3
Classro
om 419.5
2020.5
2121.5
2222.5
2323.5
2424.5
24 Students23 Students22 Students21 Students
Line Graph
0 5 10 15 20 2515
17
19
21
23
25
Classroom Temperature
ABC
Time (min)
T
empe
ratu
re (
C)
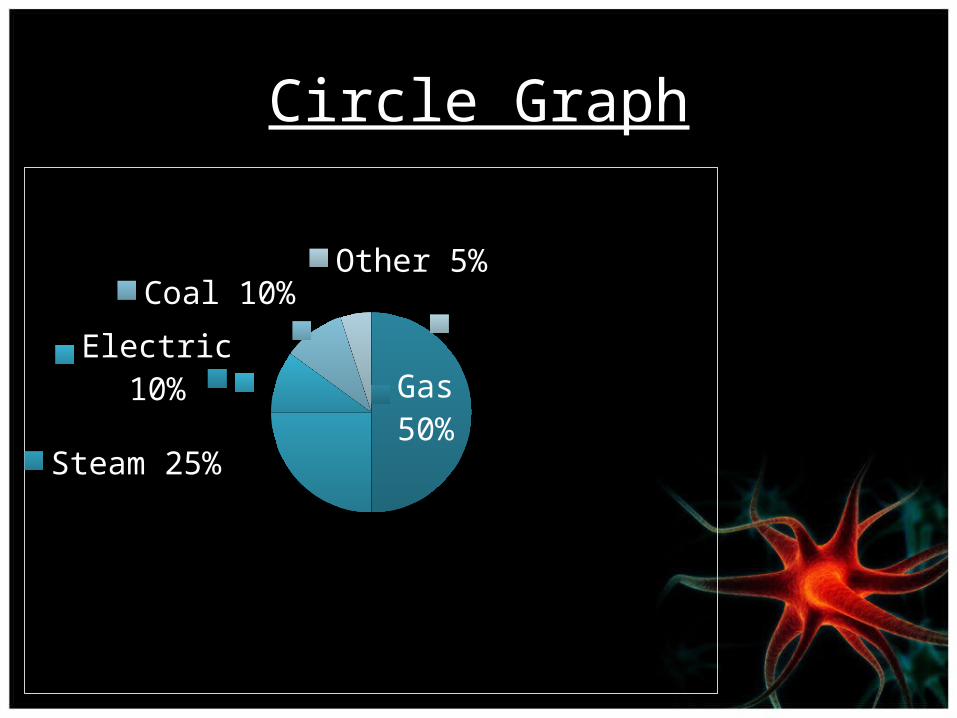
Circle Graph
Gas 50%
Steam 25%
Electric 10%
Coal 10% Other 5%
Gas Steam Electric Coal Other
• Model: a representation of an actual object or idea that explains the results or how something works or looks
• Technology: the application of science to help people – It aids scientists in developing
theories and laws.

Draw Conclusions• Conclusions: explanations based on
scientific data and observations.– answer the question as to whether or not the
data and observations support the hypothesis – may indicate that more information is needed
which creates more questions to investigate
• Inference: an explanation of the data based on facts but not on direct observation. An inference is like an assumption.– Ex. Your friend has a busted lip, so you infer
(assume) that he must have been in a fight. – An observation would be if you actually saw
the fight.
Odds tell the Evens:
What is the difference between an inference and a observation?
Why are results that do not support the hypothesis important?
• help scientists adjust and restate hypotheses
• help you to understand the world• sometimes explanations must be
modified as new information is learned– Ex. People used to think the world
was flat.
• Peer review: when scientists share their findings with others through publication or presentation– used to help others gain knowledge– Used to see if any errors were made in the
calculations, design, or interpretation of the data
– Prevents bias• Bias: occurs when what the scientist expects changes how the results are viewed
• Scientific theory: explanation of things or events based on knowledge gained from many observations and investigations
• Scientific law: statement about what happens in nature and that seems to be true all the time
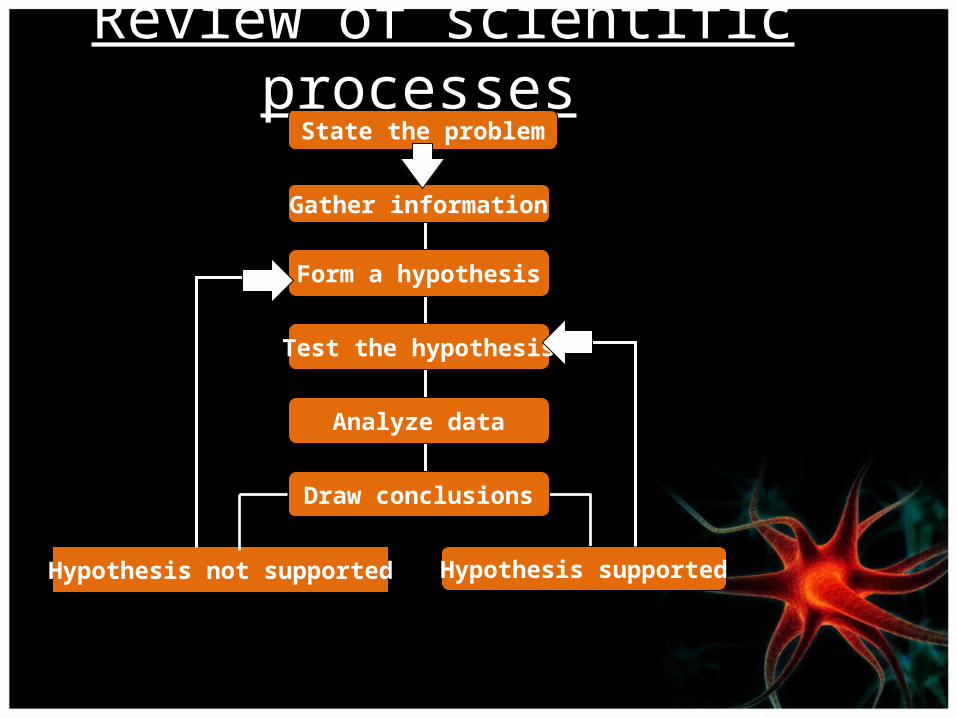
Review of scientific processesState the problem
Test the hypothesis
Hypothesis not supported Hypothesis supported
Form a hypothesis
Gather information
Analyze data
Draw conclusions

Vocabulary Mixer• In your groups, try to match the
vocabulary words with the appropriate definition.
• Do not bend the slips of paper!• After I have checked your
matches, please put the papers back in the bags and give them to me.
Classwork• Construct an experiment in your group.
(Give a brief explanation of the experiment you created.)
• Identify the variables. – (independent variable, dependent variable,
constants, and controls) • Draw a graph that shows the data
collected in this experiment. – Be sure to label each part.