Embed Size (px)
Citation preview

Prepared in cooperation with the Vermont Center for Geographic Information
A Logistic Regression Equation for Estimating the Probability of a Stream in Vermont Having Intermittent Flow
Scientific Investigations Report 2006–5217
U.S. Department of the Interior U.S. Geological Survey

A Logistic Regression Equation for Estimating the Probability of a Stream in Vermont Having Intermittent Flow
By Scott A. Olson and Michael C. Brouillette
Prepared in cooperation with the Vermont Center for Geographic Information
Scientific Investigations Report 2006–5217
U.S. Department of the Interior U.S. Geological Survey
U.S. Department of the Interior DIRK KEMPTHORNE, Secretary
U.S. Geological Survey P. Patrick Leahy, Acting Director
U.S. Geological Survey, Reston, Virginia: 2006
For product and ordering information:World Wide Web: http://www.usgs.gov/pubprodTelephone: 1-888-ASK-USGS
For more information on the USGS--the Federal source for science about the Earth, its natural and living resources, natural hazards, and the environment:World Wide Web: http://www.usgs.govTelephone: 1-888-ASK-USGS
Any use of trade, product, or firm names is for descriptive purposes only and does not imply endorsement by the U.S. Government.
Although this report is in the public domain, permission must be secured from the individual copyright owners to reproduce any copyrighted materials contained within this report.
Suggested citation:Olson, S.A., and Brouillette, M.C., 2006, A logistic regression equation for estimating the probability of a stream in Vermont having intermittent flow: U.S. Geological Survey Scientific Investigations Report 2006–5217, 15 p.
iii
Contents
Abstract ...........................................................................................................................................................1Introduction.....................................................................................................................................................1Description of Study Area ............................................................................................................................2Site Selection..................................................................................................................................................2Data Collection ...............................................................................................................................................2Basin Characteristics Database Development.........................................................................................4Logistic Regression Equation.....................................................................................................................10
Limitations of the Logistic Regression Equation............................................................................13Application of the Logistic Regression Equation...........................................................................14
Summary and Conclusions.........................................................................................................................14Selected References...................................................................................................................................15
Figures 1. Map showing location of sites observed for perennial and intermittent streamflow
in Vermont ......................................................................................................................................32–4. Graphs showing—
2. Distribution of A, drainage areas. B, elevations. C, channel slopes. D, waterbody areas. E, ratios of basin relief to basin perimeter. F, areas of well- or moderately well-drained soils for intermittent and perennial streams observed in Vermont ...........................................................................................................9
3. Observed frequency of perennial and intermittent streams by drainage area in Vermont ...........................................................................................................................10
4. Receiver operating characteristic curve for the logistic regression equation for estimating the probability of a stream having intermittent flow in Vermont......13
Tables 1. Streamgages monitored during the data collection and their median and 25th and
75th percentiles of August daily flows for ensuring field observations occurred during normal streamflow magnitudes .....................................................................................5
2. Basin characteristics developed for testing in the logistic regression analysis...............63. Diagnostics for explanatory variables used in the logistic regression equation
for estimating the probability of a stream in Vermont having intermittent flow...............114. Classification table depicting accuracy of the logistic regression equation
predicting the perennial or intermittent status of the stream sites held out of the logistic regression analysis for equation verification ..........................................................12
5. Classification table for the logistic regression equation for estimating the probability of a stream in Vermont having intermittent flow, with a probability cutpoint ranging from 0 to 1 ......................................................................................................12
6. Estimated covariance matrix for the logistic regression equation ....................................147. Ranges of the basin characteristics used in the logistic regression equation................14

iv
Conversion Factors and Datum
Multiply By To obtain
Length
inch (in.) 2.54 centimeter (cm)
foot (ft) 0.3048 meter (m)
mile (mi) 1.609 kilometer (km)
Area
square mile (mi2) 2.590 square kilometer (km2)
Flow rate
cubic foot per second (ft3/s) 0.02832 cubic meter per second (m3/s)
Temperature in degrees Fahrenheit (°F) may be converted to degrees Celsius (°C) as follows:
°C=(°F-32)/1.8
Vertical coordinate information is referenced to the North American Vertical Datum of 1988 (NAVD 88).
Horizontal coordinate information is referenced to the North American Datum of 1983 (NAD 83).
Altitude, as used in this report, refers to distance above the vertical datum.

AbstractA logistic regression equation was developed for
estimating the probability of a stream flowing intermittently at unregulated, rural stream sites in Vermont. These determinations can be used for a wide variety of regulatory and planning efforts at the Federal, State, regional, county and town levels, including such applications as assessing fish and wildlife habitats, wetlands classifications, recreational opportunities, water-supply potential, waste-assimilation capacities, and sediment transport. The equation will be used to create a derived product for the Vermont Hydrography Dataset having the streamflow characteristic of “intermittent” or “perennial.” The Vermont Hydrography Dataset is Vermont’s implementation of the National Hydrography Dataset and was created at a scale of 1:5,000 based on statewide digital orthophotos.
The equation was developed by relating field-verified perennial or intermittent status of a stream site during normal summer low-streamflow conditions in the summer of 2005 to selected basin characteristics of naturally flowing streams in Vermont. The database used to develop the equation included 682 stream sites with drainage areas ranging from 0.05 to 5.0 square miles. When the 682 sites were observed, 126 were intermittent (had no flow at the time of the observation) and 556 were perennial (had flowing water at the time of the observation).
The results of the logistic regression analysis indicate that the probability of a stream having intermittent flow in Vermont is a function of drainage area, elevation of the site, the ratio of basin relief to basin perimeter, and the areal percentage of well- and moderately well-drained soils in the basin. Using a probability cutpoint (a lower probability indicates the site has perennial flow and a higher probability indicates the site has intermittent flow) of 0.5, the logistic regression equation cor-rectly predicted the perennial or intermittent status of 116 test sites 85 percent of the time.
Introduction
The Vermont Hydrography Dataset (VHD) provides a consistent, statewide, local-resolution3 hydrography data layer. This data layer has significantly improved spatial resolution compared to other currently available datasets, as well as data characterization based on the National Hydrography Dataset (NHD) (U.S. Geological Survey and U.S. Environmental Pro-tection Agency, 2004) framework. However, the classification of the intermittent or perennial character of the streamflow, an important NHD attribute, was not conflated from the NHD data because it was based on cartographic rather than hydro-logic methods of determination.
Headwater streams with small drainage areas commonly have annually intermittent flows. In the northeastern United States, however, the probability of zero-flow occurrences generally decreases as drainage area and basin storage increase in a downstream direction. This report, prepared by the U.S. Geological Survey (USGS) in cooperation with the Vermont Center for Geographic Information (VCGI), presents a logistic regression equation for estimating the probability that an unregulated, rural stream in Vermont flows intermittently during normal summer low-streamflow conditions.
The equation can be applied to a wide variety of regulatory and planning efforts at the Federal, State, regional, county and town levels, including such applications as assessing fish and wildlife habitats, wetlands classifications, recreational opportunities, water-supply potential, waste-assimilation capacities, and sediment transport. The equation will be used to create a derived product for the Vermont Hydrography Dataset having the streamflow characteristic of “intermittent” or “perennial” and will be disseminated on the VCGI Web site (http://www.vcgi.org).
A Logistic Regression Equation for Estimating the Probability of a Stream in Vermont Having Intermittent Flow
By Scott A. Olson1 and Michael C. Brouillette2
1 U.S. Geological Survey.
2 Vermont Center for Geographic Information.
3 Local resolution VHD created at a nominal scale of 1:5,000, based on statewide digital orthophotos created by the Vermont Mapping Program.

Description of Study AreaVermont comprises 9,615 mi2 in the northeastern United
States (fig. 1). Land altitudes range from about 100 ft along Lake Champlain in the northwestern part of the State to 4,393 ft in the north-central part of the State. The higher elevations dominate the central part of the State from north to south. The climate of Vermont is humid, with average annual precipitation ranging from about 35 to 40 in. in the Lake Champlain and Connecticut River Valleys to about 50 to 70 in. in the higher elevations. Average annual temperature is about 43°F.
Site SelectionThe primary goal of the site-selection process for this
investigation was to obtain a random sampling of all naturally flowing rural stream sites draining less than 5 mi2 that covered the ranges of basin characteristics that could be observed in Vermont. To maximize the number of sites where observations could be made statewide within a limited timeframe, another goal of the site-selection process was to choose sites that were easily accessible. To satisfy the accessibility criteria, potential sites were determined by intersecting the Vermont Enhanced 9-1-1 Board’s roads coverage (State of Vermont Enhanced 9-1-1 Board, 2005a) with the Vermont Hydrography Dataset one-dimensional drain features. This was an attempt to ensure that all sites would be accessible by car. The drainage basin upstream of each potential site was delineated, and all sites having a drainage area smaller than 0.25 mi2 or larger than 5 mi2 were eliminated. For safety reasons, sites on interstate highways and other high traffic volume roads were eliminated. This resulted in 8,900 potential sites for field observation.
The target number of stream sites to be observed was 600. Simple random selection of 600 sites from the 8,900 potential sites was considered. Because the potential sites were found by intersecting streams and roads, and roads are commonly built on valley floors, there was a possibility that the mean elevation of 600 randomly selected sites would be biased low compared to typical Vermont streams. There was also a potential for a bias that most sites would be located in densely populated areas. To randomly select 600 sites from the 8,900 potential sites and reduce the biases in representation of basin characteristics that may be present in the potential sites, software for stratified random site selection (Scott, 1990) was utilized. The software, written in Arc Macro Language (AML) (Environmental Systems Research Institute, Inc., 1994), pro-vided an approach for random selection of sites that repre-sented combinations of magnitudes of basin characteristics.
Drainage area, site elevation, mean channel slope, mean basinwide annual precipitation, and areal location were the basin characteristics used in the stratified random selection process. In addition to the selected 600 sites, an alternate for
each site was also selected by the software should the primary site prove inaccessible in the field.
The selected 600 sites were examined for basin features that could prevent the stream from flowing naturally. If such a feature was found, the alternate site replaced the initially selected site. This review resulted in two sites being replaced because a dam was identified within its watershed, and five sites being replaced because of the urbanization or nonrural character of the basin. The decision to replace a site because of urbanization was subjective. Basins were identified as potentially urbanized on the basis of the number and density of emergency site locations identified within its watershed using the Emergency 9-1-1 Site Location database (State of Vermont Enhanced 9-1-1 Board, 2005b). Sites with more than 40 emergency site locations within its watershed were consid-ered potentially urbanized. Potentially urbanized basins were then reviewed using all available mapping; if any urbanization or development that could have an impact on the natural flow character of the stream was apparent within a site’s basin, the site was replaced by its alternate.
Following data collection in July and August 2005 at the 600 selected sites, about 90 percent of the sites had flow and were considered perennial for the purposes of this project. To better represent intermittent streams in the database, additional sites were selected that had drainage areas between 0.05 and 0.25 mi2. Because of the time constraints to complete the field observations, simple random selection was used to select 100 sites from a total of 9,101 available sites found intersecting GIS databases of roads and streams that had drainage areas between 0.05 and 0.25 mi2.
Data Collection An important aspect of the investigation was having the
appropriate hydrologic and climatic conditions under which to observe sites for streamflow conditions. The intent of the investigation was to provide a methodology for estimating the probability that a stream flows intermittently during normal summer low streamflows—a condition that typically occurs in August or early September. Therefore, the selected sites needed to be observed for streamflow during normal sum-mer low-streamflow conditions occurring from mid- to late summer. If hydrologic or climatic conditions were excessively wet, a site that typically goes dry and would be classified as intermittent could have streamflow at the time of observation and be classified as perennial. Conversely, if conditions were drier than normal, an observation site could be dry and would be classified as intermittent when, under normal hydrologic conditions, it is actually a site with perennial streamflow.
Sites were observed on selected dates from July 26 to August 26, 2005. Hydrologic and climatologic conditions during the data-collection period and the months leading up to the observation period were at or near normal. According to the Northeast Regional Climate Center (2006), precipitation
� A Logistic Regression Equation for Estimating the Probability of a Stream in Vermont Having Intermittent Flow
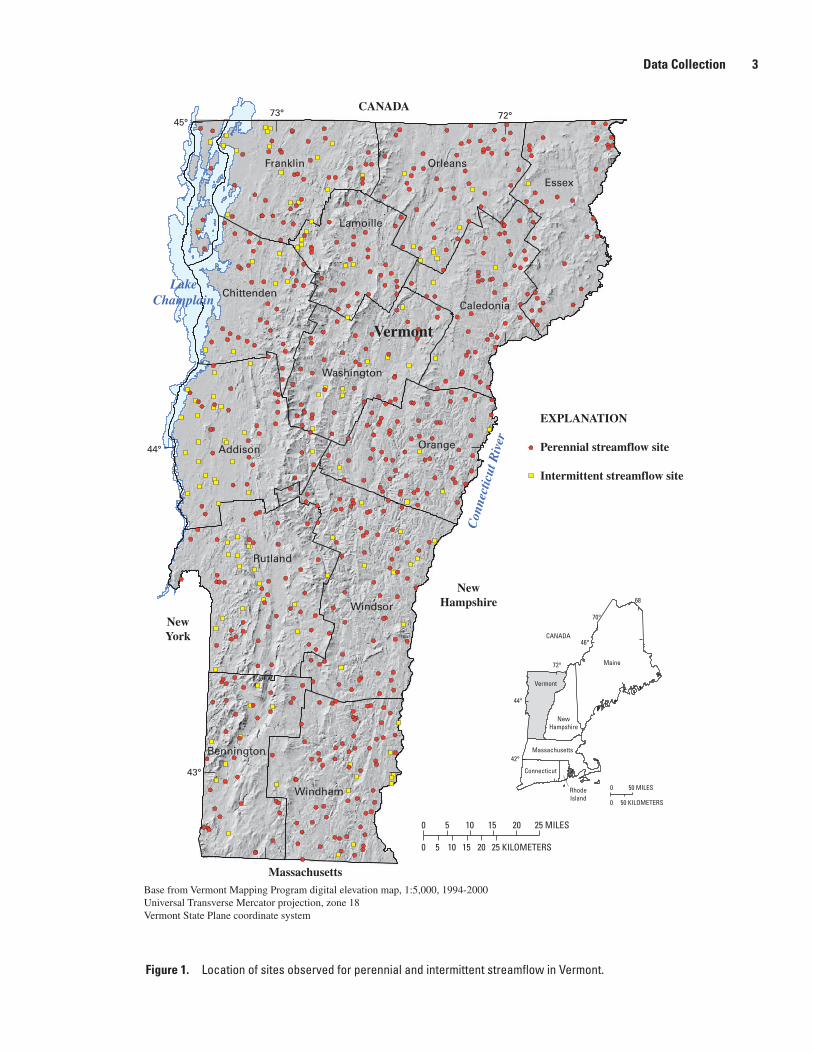
Figure 1. Location of sites observed for perennial and intermittent streamflow in Vermont.
Data Collection �
!
"
25 MILES0 10 205 15
25 KILOMETERS0 10 205 15
72°73°45°
44°
43°
Windham
Bennington
Windsor
Rutland
Addison Orange
Washington
Chittenden
Franklin
Lamoille
Orleans
Essex
Caledonia
EXPLANATION
Perennial streamflow site
Intermittent streamflow site
NewHampshire
NewYork
Massachusetts
CANADA
LakeChamplain
Con
nect
icut
Riv
er
Base from Vermont Mapping Program digital elevation map, 1:5,000, 1994-2000Universal Transverse Mercator projection, zone 18Vermont State Plane coordinate system
Vermont
0
0
50 MILES
50 KILOMETERS
68
NewHampshire
Massachusetts
Connecticut
RhodeIsland
Vermont
CANADA
Maine
70°
46°
72°
44°
42°
"
"
""
"
"
"
"""
"
"
"
"
" "
"
"
"
"
"
""
"
" "
" "
"
"
"
"
"
"""
"
"
"
"
"
"
"
"
"
" "
"
"
"
""
""
""
"
"
"
"
""
"
"
"
"
"
" ""
"
"
"
"
"
"
"
"
"
"
"
"
"
"
"
"
"
""
"
"
""
"
"
""
"
""
"
"
"
"
"
"
"
"
"
"
""
""
"
"
"
"
"
"
"
"
"
"""
!! !!
!
!
!
! !!
!
!!
!
!
!
!!
!
!!
!
!
! !
! !
!
!
!
!!
!
! !
!!
!
!!
!
!
!
!
! !
!!
! !
!!
!
!
!
!
!
!
!!!
!
!
!
!
!!
!
!
!
! ! !
!!!! !
!
!
!!
!
!
!!!
!
!
!!
!
!!
!
!
!
!
! !!
!!
!!
!!!!
!
! !
!
!
!
!
!!!
!
!
!
!!
!
!
!
!! !
!
!
!
!
!!
!!
!
!
!!
!
!!!
! !
!
!
!
!
!! !
!
!
!!
!
!
! !
!
!
!
!
!
!
!!
!
!
! !
! !
!
!
!
!!!!
!
!
!
!
!! !
!!
!!!
!
!
!
!!
!!
!
!
!
!!
!
!
!
!
!
!!
!!!
!
!
!
!
!
!!
!!
!!!
!
!
!!
!!
!!
!
!
!!
!
!
!!! !
!!
!!
!
!
!
!!
! !!
! !
!
! !
!
!!
!
!
!
!
!
!
!!!
!
!
!
!
!
!
!
!
!!
!
!
!
!!
!
!
!
!
!
!
!
!
!
!!!
!!
!!
!!!
! !
!
!!!
!!
! !
!
!
!
!
!
!!
! !
!
!
!
!
!
! !
!!
!
!
!
!!
!!
!
!!
!
! !! ! !!
!!!
!
!!!
!!!
!
!!!
!
!
!!
!!!!
!
!
!
!
! !! !
!
!
!
!
!
!!
!
!
!
!
!
!
!
!
!
!
!!
!!!
!
!!
!
!!
!!
!
!
!
!
!!
!
! !
!!
!!!
!
!
!
!
!
!
!
!
!
!
!
!!
!
!
!
!
!
!!
!
!! !
!
!
!
!
!!
!
!
!!
!!
!
!
!!! !
!!
!!
!
!!!!
!!!!
!!
!
!
!
!
!
!
!
!
!
! !!
!!
!!
!!
!! !
!!
!
!
!
!
! !
!
!!
!
!
!
!
!!
!
! !
!
!
!!
!
!
!!
!
!
!
!!
!
!!
!
!
!
!
!!
!!!
during the winter, spring, and summer in Vermont in 2005 was 111, 99, and 103 percent of normal, respectively, based on the period of record 1971 to 2000. During July 2005, precipitation was 0.18 in. above the normal July precipitation of 4.21 in. for the period of record. During August 2005, precipitation was 0.72 in. below the August normal of 4.49 in. for the period of record. The weekly Palmer Drought Severity Indices published by the National Weather Service (2006) were between -1.9 and 1.9 statewide for the entire period of data collection, an index range considered normal.
Although Vermont precipitation and drought indices were within normal ranges, streamflow conditions for June and July 2005 were reported by the USGS (2006a) as being predominantly above normal. Streamflows receded, however, and in August 2005, streamflow conditions were described as normal. Ground-water levels in June and July 2005 were predominantly in the normal range with some ground-water levels above and some below normal. By August 2005, water levels at 10 of the 13 ground-water stations in Vermont monitored by the USGS were within normal range, with the remaining 3 reported as being below normal. Normal streamflow or ground-water-levels are defined by the USGS (2006b) as being between the 25th and 75th percentile of streamflows or ground-water levels for the given month.
Overall, the statewide hydrologic and climatic conditions for the period of data collection—July 26 to August 26, 2005—can be considered at or near normal. Regardless, the climate and hydrologic conditions were monitored on a daily basis while making streamflow observations. To ensure that conditions were normal in the regions where observations were being made, additional criteria were followed when collecting data. These criteria included less than 0.4 in. of rain within 72 hours of a streamflow observation. Upon further review of precipitation data and the data-collection locations, no rain greater than 0.1 in. occurred within 24 hours of making an observation and no rain greater than 0.2 in. occurred within 48 hours of making an observation. Another criterion required that streamflows at the nearest or most hydrologically similar USGS streamgaging station to the observation site fall within the 25th and 75th percentile of August daily flows at the time of streamflow observation. Because streamflow data graphically reporting the percentiles in real time are available (U.S. Geological Survey, 2006c), this streamflow criterion was closely monitored. The median and the 25th and 75th percentile of August daily flows for gages on streams with little to no low-streamflow regulation monitored during the data collection are listed in table 1.
As stated above in this report, all observation sites were located at road crossings to expedite data collection. A global positioning system (GPS) was used to pinpoint the site. Streamflow conditions were observed at the upstream side and downstream side of the road crossing. A site was considered perennial if it had any flowing water at the time of observation. Sites that had dry channel beds or disconnected pools of water were considered intermittent. If a site had pooled water throughout the reach, it was considered to be a
perennial stream site unless a positive determination could be made that water was not flowing.
Several sites could not be reached because a roadway was either gated or impassable. Other sites were deemed inappropriate as an observation site because of the altered condition of the stream, such as a stream site within a golf course or a site where an artificial pond had been created upstream to store water. When a site was visited that was not appropriate or could not be reached, it was replaced by its alternate site. In some cases, the alternate sites had similar problems and could not be used. When this occurred, both the site and its alternate were removed from the database. At the end of the data collection effort, streamflow observations at 682 sites (fig. 1) were used to develop the logistic regression equation for estimating the probability that a stream has intermittent flow. Of the 682 sites, 126 were classified as intermittent and 556 were classified as perennial. The distribution of the observation sites is shown in figure 1.
Basin Characteristics Database Development
Regression analysis involves developing a relation between a response variable and one or more explanatory variables. In this investigation, the basin characteristics of a stream site were used as the explanatory variables. Fifty basin characteristics for the 682 stream sites were determined for use in the logistic regression analysis. The basin characteristics that were computed and the data sources used to compute the basin characteristics are listed in table 2.
Basin delineation and the subsequent characterization effort required a Digital Elevation Model (DEM) that was spatially compliant with the local resolution VHD dataset. Barring the existence of such a dataset at any scale, a statewide “hydrologically enforced” DEM tiled by subbasin and other supporting derivative raster datasets, such as flow accumulation and flow direction, were created. The “hydrologically enforced” DEM was created with the ArcInfo TOPOGRID command and the following inputs: point elevation data from the Vermont Mapping Program digital orthophoto program; and one- and two-dimensional VHD features, such as stream centerlines and lakes and ponds.
The basin characteristics used in the logistic regression analysis were generated using ArcInfo® (v.8.0.2) on a UNIX platform and AML programming (Environmental Systems Research Institute, Inc., 1994). The basic approach to comput-ing each characteristic revolved around the use of the site as a watershed outlet point, and its basin extent to control the extent of processing for computing basin characteristics.
Selected basin characteristics of the 682 streamflow observation sites were grouped by their intermittent or peren-nial classification and plotted. The plots in figures 2 and 3 display the distribution of selected basin characteristics by
� A Logistic Regression Equation for Estimating the Probability of a Stream in Vermont Having Intermittent Flow

Table 1. Streamgages monitored during the data collection and their median and 25th and 75th percentiles of August daily flows for ensuring field observations occurred during normal streamflow magnitudes.
[Streamgages located in Vermont unless otherwise noted; mi2, square miles; ft3/s, cubic feet per second]
Station number
StreamgageDrainage
area, mi�
Median of August daily flows,
ft�/s
�5th percentile of August daily flows,
ft�/s
75th percentile of August daily flows,
ft�/s
01133000 East Branch Passumpsic River near East Haven 53.8 52.8 33.9 71.9
01134500 Moose River at Victory 75.2 56.3 27 87.1
01135150 Pope Brook near North Danville 3.25 2.6 1.7 3.8
01135300 Sleepers River near St. Johnsbury 42.9 30.4 16.9 56.5
01135500 Passumpsic River at Passumpsic 436 281 211 419
01139000 Wells River at Wells River 98.4 44.6 34 78.7
01139800 East Orange Branch at East Orange 8.95 4.3 2.7 6.6
01142500 Ayers Brook at Randolph 30.5 10 6.5 18.3
01144000 White River at West Hartford 690 264 194 477
01150900 Ottauquechee River near West Bridgewater 23.4 17.8 9.3 37.5
01153550 Williams River near Rockingham 112 38.1 28 63.2
01154000 Saxtons River near Saxtons River 72.2 19.1 11 29.2
01169000 North River at Shattuckville, Massachusetts 89.0 35.1 22.6 63.3
01170100 Green River near Colrain, Massachusetts 41.4 17.6 11.6 37.6
01334000 Walloomsac River near North Bennington 111 79.7 61.9 129
04280350 Mettawee River near Pawlet 70.2 33 21.1 71.7
04282000 Otter Creek at Center Rutland 307 187 138 283
04282525 New Haven River at Brooksville 115 91.8 50.8 140
04282650 Little Otter Creek at Ferrisburg 57.1 11 6.3 25.1
04282795 Lewis Creek near North Ferrisburg 77.2 31.2 15.9 39
04282795 LaPlatte River at Shelburne Falls 44.6 7.5 2.9 16.9
04287000 Dog River at Northfield Falls 76.1 25.9 17.5 40.9
04288000 Mad River near Moretown 139 67.1 45.8 112.5
04292000 Lamoille River at Johnson 310 203 154 292
04293000 Missisquoi River near North Troy 131 82.7 54.1 162.2
04293500 Missisquoi River near East Berkshire 479 268 171 440
04294300 Pike River at East Franklin 34.5 11.5 6.2 81.4
04296000 Black River at Coventry 122 70.2 45.5 112
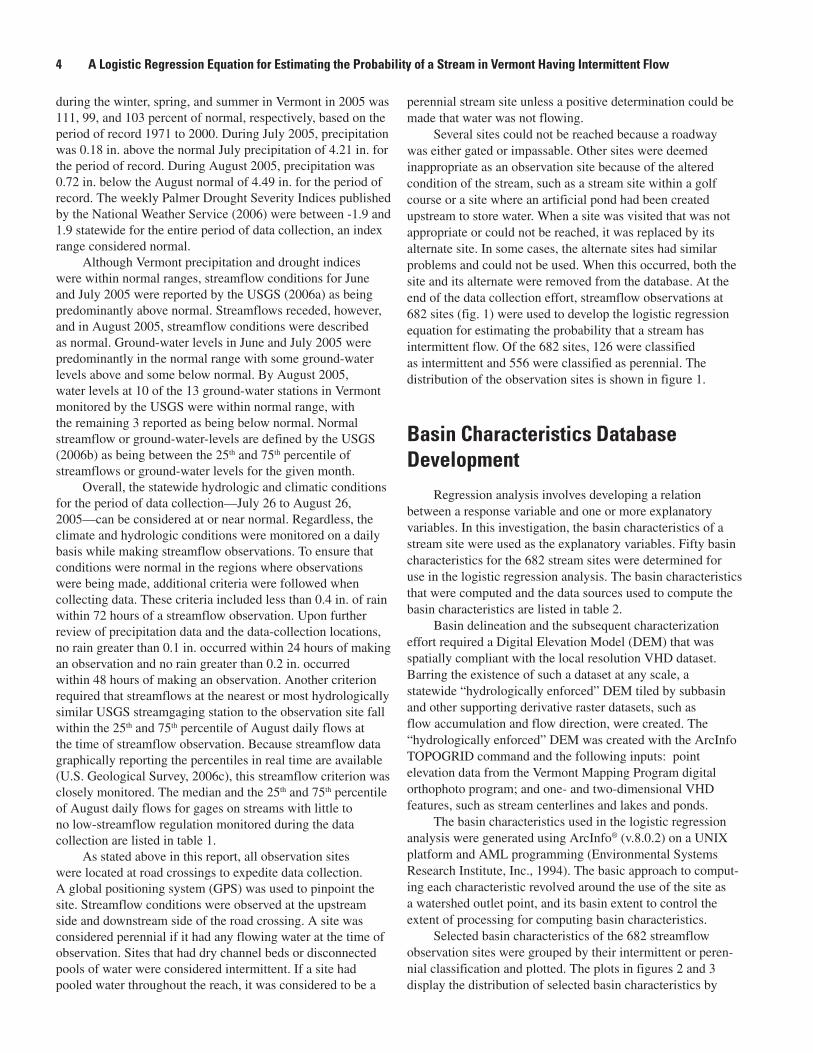
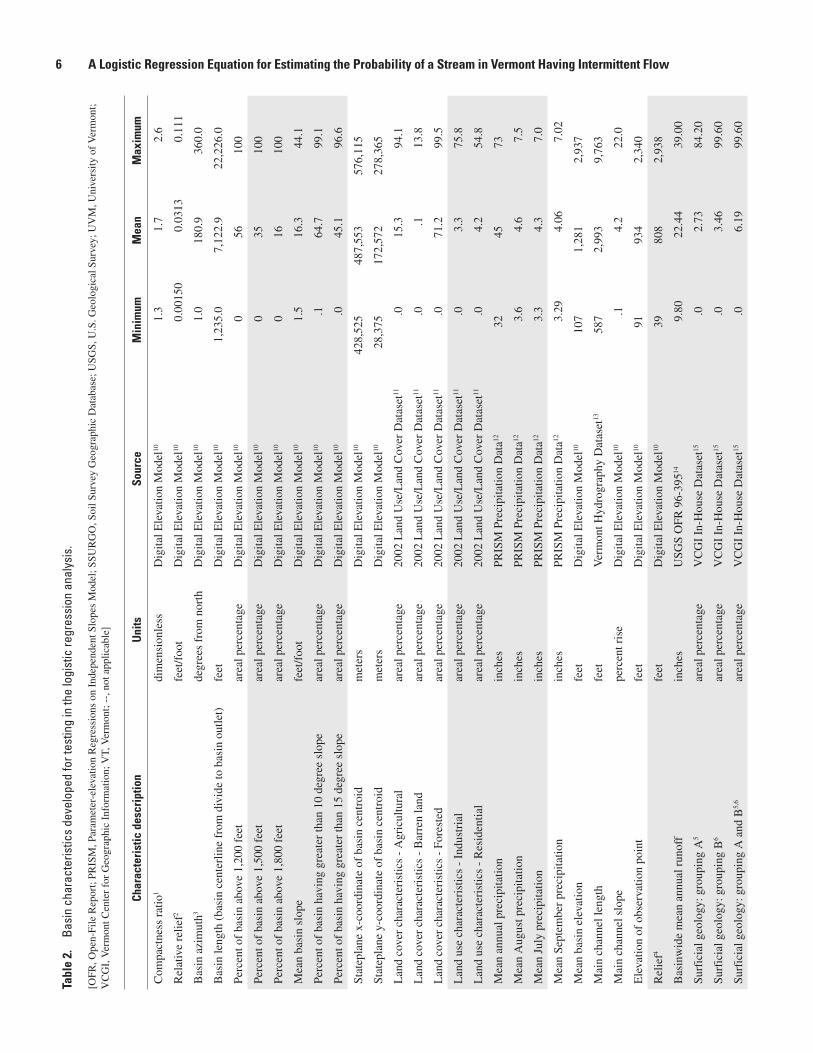
stream classification. Some interesting information can be determined from looking at the plots. For instance, figure 2 shows that the largest drainage area of an intermittent stream in this investigation is about 3.4 mi2. It also shows the median drainage area, site elevation, and area of well- or moderately well-drained soils are different between perennial and inter-mittent stream sites. In figure 3, the frequency of intermittent
sites consistently decreases from a drainage area of 0.05 mi2 (the minimum drainage area used in this investigation) to a point where there are very few intermittent sites at 1.0 mi2 and greater. Also, the number of intermittent and perennial sites with drainage areas between 0.05 and 0.25 mi2 are nearly equal—above 0.25 mi2, the number of perennial stream sites greatly outnumbers the intermittent stream sites (fig. 3).
Basin Characteristics Database Development 5
Tabl
e �.
Ba
sin
char
acte
ristic
s de
velo
ped
for t
estin
g in
the
logi
stic
regr
essi
on a
naly
sis.
[OFR
, Ope
n-Fi
le R
epor
t; PR
ISM
, Par
amet
er-e
leva
tion
Reg
ress
ions
on
Inde
pend
ent S
lope
s M
odel
; SSU
RG
O, S
oil S
urve
y G
eogr
aphi
c D
atab
ase;
USG
S, U
.S. G
eolo
gica
l Sur
vey;
UV
M, U
nive
rsity
of
Ver
mon
t; V
CG
I, V
erm
ont C
ente
r fo
r G
eogr
aphi
c In
form
atio
n; V
T, V
erm
ont;
--, n
ot a
pplic
able
]
Char
acte
rist
ic d
escr
iptio
nU
nits
Sour
ceM
inim
umM
ean
Max
imum
Com
pact
ness
rat
io1
dim
ensi
onle
ssD
igita
l Ele
vatio
n M
odel
101.
31.
72.
6
Rel
ativ
e re
lief2
feet
/foo
tD
igita
l Ele
vatio
n M
odel
100.
0015
00.
0313
0.11
1
Bas
in a
zim
uth3
degr
ees
from
nor
thD
igita
l Ele
vatio
n M
odel
101.
018
0.9
360.
0
Bas
in le
ngth
(ba
sin
cent
erlin
e fr
om d
ivid
e to
bas
in o
utle
t)fe
etD
igita
l Ele
vatio
n M
odel
101,
235.
07,
122.
922
,226
.0
Perc
ent o
f ba
sin
abov
e 1,
200
feet
area
l per
cent
age
Dig
ital E
leva
tion
Mod
el10
056
100
Perc
ent o
f ba
sin
abov
e 1,
500
feet
area
l per
cent
age
Dig
ital E
leva
tion
Mod
el10
035
100
Perc
ent o
f ba
sin
abov
e 1,
800
feet
area
l per
cent
age
Dig
ital E
leva
tion
Mod
el10
016
100
Mea
n ba
sin
slop
efe
et/f
oot
Dig
ital E
leva
tion
Mod
el10
1.5
16.3
44.1
Perc
ent o
f ba
sin
havi
ng g
reat
er th
an 1
0 de
gree
slo
pear
eal p
erce
ntag
eD
igita
l Ele
vatio
n M
odel
10.1
64.7
99.1
Perc
ent o
f ba
sin
havi
ng g
reat
er th
an 1
5 de
gree
slo
pear
eal p
erce
ntag
eD
igita
l Ele
vatio
n M
odel
10.0
45.1
96.6
Stat
epla
ne x
-coo
rdin
ate
of b
asin
cen
troi
dm
eter
sD
igita
l Ele
vatio
n M
odel
1042
8,52
548
7,55
357
6,11
5
Stat
epla
ne y
-coo
rdin
ate
of b
asin
cen
troi
dm
eter
sD
igita
l Ele
vatio
n M
odel
1028
,375
172,
572
278,
365
Lan
d co
ver
char
acte
rist
ics
- A
gric
ultu
ral
area
l per
cent
age
2002
Lan
d U
se/L
and
Cov
er D
atas
et11
.015
.394
.1
Lan
d co
ver
char
acte
rist
ics
- B
arre
n la
ndar
eal p
erce
ntag
e20
02 L
and
Use
/Lan
d C
over
Dat
aset
11.0
.113
.8
Lan
d co
ver
char
acte
rist
ics
- Fo
rest
edar
eal p
erce
ntag
e20
02 L
and
Use
/Lan
d C
over
Dat
aset
11.0
71.2
99.5
Lan
d us
e ch
arac
teri
stic
s -
Indu
stri
alar
eal p
erce
ntag
e20
02 L
and
Use
/Lan
d C
over
Dat
aset
11.0
3.3
75.8
Lan
d us
e ch
arac
teri
stic
s -
Res
iden
tial
area
l per
cent
age
2002
Lan
d U
se/L
and
Cov
er D
atas
et11
.04.
254
.8
Mea
n an
nual
pre
cipi
tatio
nin
ches
PRIS
M P
reci
pita
tion
Dat
a1232
4573
Mea
n A
ugus
t pre
cipi
tatio
nin
ches
PRIS
M P
reci
pita
tion
Dat
a123.
64.
67.
5
Mea
n Ju
ly p
reci
pita
tion
inch
esPR
ISM
Pre
cipi
tatio
n D
ata12
3.3
4.3
7.0
Mea
n Se
ptem
ber
prec
ipita
tion
inch
esPR
ISM
Pre
cipi
tatio
n D
ata12
3.29
4.06
7.02
Mea
n ba
sin
elev
atio
nfe
etD
igita
l Ele
vatio
n M
odel
1010
71,
281
2,93
7
Mai
n ch
anne
l len
gth
feet
Ver
mon
t Hyd
rogr
aphy
Dat
aset
1358
72,
993
9,76
3
Mai
n ch
anne
l slo
pepe
rcen
t ris
eD
igita
l Ele
vatio
n M
odel
10.1
4.2
22.0
Ele
vatio
n of
obs
erva
tion
poin
tfe
etD
igita
l Ele
vatio
n M
odel
1091
934
2,34
0
Rel
ief4
feet
Dig
ital E
leva
tion
Mod
el10
3980
82,
938
Bas
inw
ide
mea
n an
nual
run
off
inch
esU
SGS
OFR
96-
39514
9.80
22.4
439
.00
Surf
icia
l geo
logy
: gro
upin
g A
5ar
eal p
erce
ntag
eV
CG
I In
-Hou
se D
atas
et15
.02.
7384
.20
Surf
icia
l geo
logy
: gro
upin
g B
6ar
eal p
erce
ntag
eV
CG
I In
-Hou
se D
atas
et15
.03.
4699
.60
Surf
icia
l geo
logy
: gro
upin
g A
and
B5,
6ar
eal p
erce
ntag
eV
CG
I In
-Hou
se D
atas
et15
.06.
1999
.60
� A Logistic Regression Equation for Estimating the Probability of a Stream in Vermont Having Intermittent Flow

Tabl
e �.
Ba
sin
char
acte
ristic
s de
velo
ped
for t
estin
g in
the
logi
stic
regr
essi
on a
naly
sis.
—Co
ntin
ued
[OFR
, Ope
n-Fi
le R
epor
t; PR
ISM
, Par
amet
er-e
leva
tion
Reg
ress
ions
on
Inde
pend
ent S
lope
s M
odel
; SSU
RG
O, S
oil S
urve
y G
eogr
aphi
c; U
SGS,
Uni
ted
Stat
e G
eolo
gica
l Sur
vey;
UV
M, U
nive
rsity
of
Ver
mon
t; V
CG
I, V
erm
ont C
ente
r fo
r G
eogr
aphi
c In
form
atio
n; V
T, V
erm
ont;
--, n
ot a
pplic
able
]
Char
acte
rist
ic d
escr
iptio
nU
nits
Sour
ceM
inim
umM
ean
Max
imum
Num
ber
of f
irst
ord
er s
trea
ms
coun
tV
erm
ont H
ydro
grap
hy D
atas
et13
14.
1177
Stre
am o
rder
at o
bser
vatio
n po
int
stre
am o
rder
Ver
mon
t Hyd
rogr
aphy
Dat
aset
131
1.92
5
Tota
l len
gth
of f
irst
ord
er s
trea
ms
mile
sV
erm
ont H
ydro
grap
hy D
atas
et13
0.0
1.7
14.3
Tota
l len
gth
of s
econ
d or
der
stre
ams
mile
sV
erm
ont H
ydro
grap
hy D
atas
et13
.00.
78.
1
Tota
l len
gth
of th
ird
orde
r st
ream
sm
iles
Ver
mon
t Hyd
rogr
aphy
Dat
aset
13.0
.24.
0
Soil
char
acte
rist
ics
- dr
aina
ge; e
xces
sive
7ar
eal p
erce
ntag
eSS
UR
GO
16.0
17.3
99.3
Soil
char
acte
rist
ics
- dr
aina
ge; p
oor8
area
l per
cent
age
SSU
RG
O16
.014
.995
.5
Soil
char
acte
rist
ics
- dr
aina
ge; w
ell9
area
l per
cent
age
SSU
RG
O16
.053
.499
.9
Soil
char
acte
rist
ics
- in
filtr
atio
n -
hydr
olog
ic g
roup
Aar
eal p
erce
ntag
eSS
UR
GO
16.0
4.7
95.7
Soil
char
acte
rist
ics
- In
filtr
atio
n -
hydr
olog
ic g
roup
Bar
eal p
erce
ntag
eSS
UR
GO
16.0
12.9
85.0
Soil
char
acte
rist
ics
- In
filtr
atio
n -
hydr
olog
ic g
roup
Car
eal p
erce
ntag
eSS
UR
GO
16.0
4310
0
Soil
char
acte
rist
ics
- In
filtr
atio
n -
hydr
olog
ic g
roup
Dar
eal p
erce
ntag
eSS
UR
GO
16.0
28.2
99.3
Soil
char
acte
rist
ics
- hy
drau
lic c
ondu
ctiv
ity -
per
mea
bilit
yin
ches
/hou
rSS
UR
GO
16.0
121.
899
9.0
Tota
l len
gth
of s
trea
ms
feet
Ver
mon
t Hyd
rogr
aphy
Dat
aset
1364
14,1
6215
2,87
6
Dra
inag
e ar
easq
uare
mile
sD
igita
l Ele
vatio
n M
odel
10.0
5.9
594.
99
Geo
logi
c-bi
ophy
sica
l pro
vinc
epr
ovin
ceU
VM
-VT
Bio
dive
rsity
Pro
ject
17--
----
Wat
erbo
dy a
rea
(lak
e an
d po
nds)
area
l per
cent
age
Ver
mon
t Hyd
rogr
aphy
Dat
aset
13.0
.416
.3
Wet
land
are
a -
lacu
stri
near
eal p
erce
ntag
eN
atio
nal W
etla
nds
Inve
ntor
y18.0
.112
.0
Wet
land
are
a -
pal
ustr
ine
area
l per
cent
age
Nat
iona
l Wet
land
s In
vent
ory18
.02.
337
.4
Wet
land
are
a -
lacu
stri
ne a
nd p
alus
trin
ear
eal p
erce
ntag
eN
atio
nal W
etla
nds
Inve
ntor
y18.0
2.4
37.4
Basin Characteristics Database Development 7
Tabl
e �.
Ba
sin
char
acte
ristic
s de
velo
ped
for t
estin
g in
the
logi
stic
regr
essi
on a
naly
sis.
—Co
ntin
ued
[OFR
, Ope
n-Fi
le R
epor
t; PR
ISM
, Par
amet
er-e
leva
tion
Reg
ress
ions
on
Inde
pend
ent S
lope
s M
odel
; SSU
RG
O, S
oil S
urve
y G
eogr
aphi
c; U
SGS,
Uni
ted
Stat
e G
eolo
gica
l Sur
vey;
UV
M, U
nive
rsity
of
Ver
mon
t; V
CG
I, V
erm
ont C
ente
r fo
r G
eogr
aphi
c In
form
atio
n; V
T, V
erm
ont;
--, n
ot a
pplic
able
]
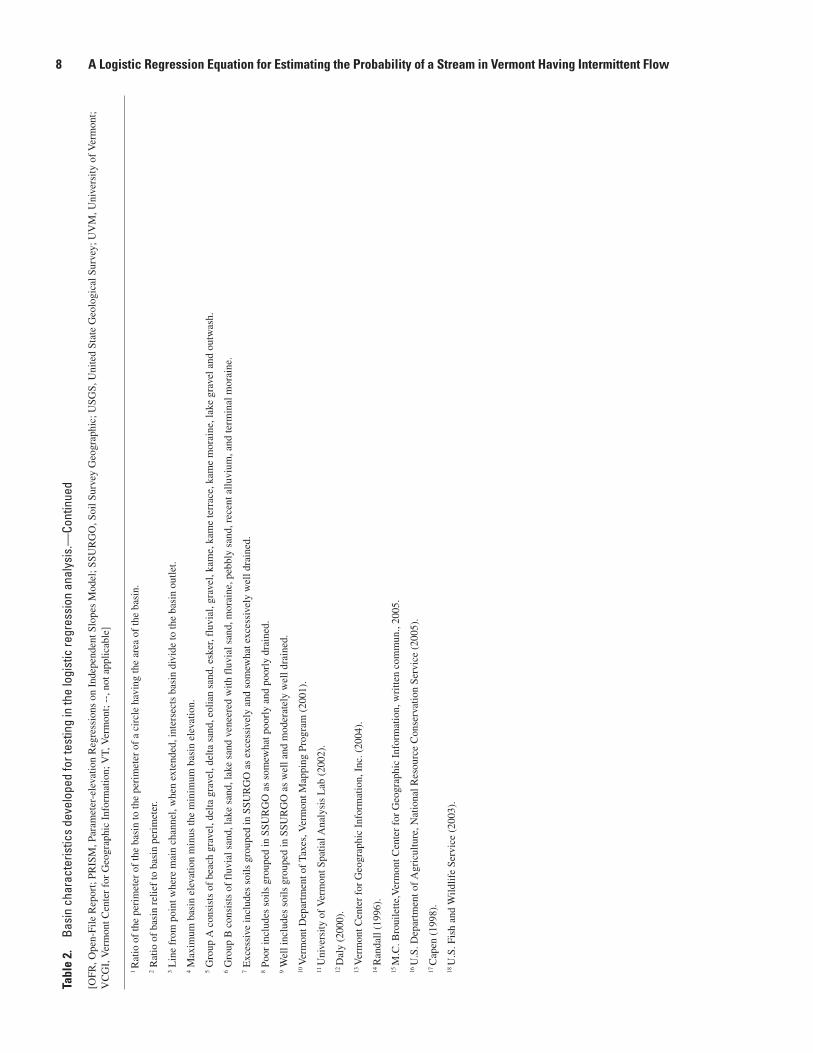
1 R
atio
of
the
peri
met
er o
f th
e ba
sin
to th
e pe
rim
eter
of
a ci
rcle
hav
ing
the
area
of
the
basi
n.
2 Rat
io o
f ba
sin
relie
f to
bas
in p
erim
eter
.
3 Lin
e fr
om p
oint
whe
re m
ain
chan
nel,
whe
n ex
tend
ed, i
nter
sect
s ba
sin
divi
de to
the
basi
n ou
tlet.
4 Max
imum
bas
in e
leva
tion
min
us th
e m
inim
um b
asin
ele
vatio
n.
5 Gro
up A
con
sist
s of
bea
ch g
rave
l, de
lta g
rave
l, de
lta s
and,
eol
ian
sand
, esk
er, f
luvi
al, g
rave
l, ka
me,
kam
e te
rrac
e, k
ame
mor
aine
, lak
e gr
avel
and
out
was
h.
6 Gro
up B
con
sist
s of
flu
vial
san
d, la
ke s
and,
lake
san
d ve
neer
ed w
ith f
luvi
al s
and,
mor
aine
, peb
bly
sand
, rec
ent a
lluvi
um, a
nd te
rmin
al m
orai
ne.
7 Exc
essi
ve in
clud
es s
oils
gro
uped
in S
SUR
GO
as
exce
ssiv
ely
and
som
ewha
t exc
essi
vely
wel
l dra
ined
.
8 Poo
r in
clud
es s
oils
gro
uped
in S
SUR
GO
as
som
ewha
t poo
rly
and
poor
ly d
rain
ed.
9 Wel
l inc
lude
s so
ils g
roup
ed in
SSU
RG
O a
s w
ell a
nd m
oder
atel
y w
ell d
rain
ed.
10 V
erm
ont D
epar
tmen
t of
Taxe
s, V
erm
ont M
appi
ng P
rogr
am (
2001
).
11 U
nive
rsity
of
Ver
mon
t Spa
tial A
naly
sis
Lab
(20
02).
12 D
aly
(200
0).
13 V
erm
ont C
ente
r fo
r G
eogr
aphi
c In
form
atio
n, I
nc. (
2004
).
14 R
anda
ll (1
996)
.
15 M
.C. B
roui
lette
,Ver
mon
t Cen
ter
for
Geo
grap
hic
Info
rmat
ion,
wri
tten
com
mun
., 20
05.
16 U
.S. D
epar
tmen
t of
Agr
icul
ture
, Nat
iona
l Res
ourc
e C
onse
rvat
ion
Serv
ice
(200
5).
17 C
apen
(19
98).
18 U
.S. F
ish
and
Wild
life
Serv
ice
(200
3).
� A Logistic Regression Equation for Estimating the Probability of a Stream in Vermont Having Intermittent Flow

Figure �. Distribution of A, drainage areas. B, elevations. C, channel slopes. D, waterbody areas. E, ratios of basin relief to basin perimeter. F, areas of well- or moderately well-drained soils for intermittent and perennial streams observed in Vermont.
Basin Characteristics Database Development �
EXPLANATION
(126) Number of observations 1.5 times the interquartile range above the 75th percentile or largest value 75th percentile Mean Median (50th percentile) 25th percentile 1.5 times the interquartile range below the 25th percentile or smallest value Outlier values between 1.5 and 3 times the interquartile range outside the quartiles Outlier values greater than 3 times the interquartile range outside the quartiles
PERENNIAL INTERMITTENTSTREAM TYPE
A
0
1
2
3
4
5
DRAI
NAG
E AR
EA, I
N S
QUAR
E M
ILES
(556) (126)
0
250
500
750
1,000
1,250
1,500
1,750
2,000
2,250
2,500
PERENNIAL INTERMITTENTSTREAM TYPE
SITE
ELE
VATI
ON, I
N F
EET
(556) (126)
B
0
2.5
5.0
7.5
10.0
12.5
15.0
17.5
20.0
22.5
25.0
PERENNIAL INTERMITTENTSTREAM TYPE
CHAN
NEL
SLO
PE, I
N P
ERCE
NT
RISE
(556) (126)
C
PERENNIAL INTERMITTENTSTREAM TYPE
F
0
20
40
60
80
100
AREA
OF
WEL
L- O
R M
ODER
ATEL
Y W
ELL-
DRAI
NED
SOIL
S, IN
PER
CEN
T OF
DRA
INAG
E AR
EA
(556) (126)
0
2
4
6
8
10
12
14
16
18
PERENNIAL INTERMITTENTSTREAM TYPE
WAT
ERBO
DY A
REA,
INPE
RCEN
T OF
DRA
INAG
E AR
EA
(556) (126)
D
0
0.02
PERENNIAL INTERMITTENTSTREAM TYPE
RATI
O OF
BAS
IN R
ELIE
F TO
BAS
IN P
ERIM
ETER (556) (126)
E
0.04
0.06
0.08
0.10
0.12

Logistic Regression EquationRegression has been used in many water-resource
investigations that examine the relation between a water-resource characteristic and one or more characteristics of its watershed or environment. The variables used to develop the regression equations are commonly continuous variables, and a least-squares or linear regression model is developed. In this investigation, the response variable being modeled is not continuous. The response variable is discrete—it is either a “1” for intermittent, or “0” for perennial. Logistic regression is the standard method of analysis when working with discrete response variables (Hosmer and Lemeshow, 2000). The logistic regression equation that is developed estimates the probability that the response variable is a “1” or that the stream is intermittent. Other investigations have used logistic regression to predict the intermittent or perennial classification of a stream site; most notable is a study by Bent and Archfield (2002) for the State of Massachusetts.
Before the logistic regression analysis began, 20 percent of the observations sites were randomly removed from the dataset and not used in the analysis for testing the predictive accuracy of the final logistic regression equation. This resulted in a database of 546 sites used to complete the regression analysis. All potential explanatory variables—including the basin characteristics (table 2), and the logarithms, squares, and square roots of the basin characteristics—for the stream obser-vations sites were tested using SAS statistical software (SAS Institute, Inc., 1989). The explanatory variables were evaluated using forward selection, backward elimination, stepwise selec-tion, and best subsets selection techniques to determine the most significant explanatory variables for intermittent flow.
The following tools and techniques were also used for selecting the final variables to use in the logistics regression equation. Logit plots and partial residual plots (SAS Institute, Inc., 2001) were created for variables. Logit plots reveal whether or not there is a linear relation between the predictor variable and the response variable and will indicate if the predictor variable needs to be treated as a discrete variable. Partial residual plots indicate whether or not there is a linear relation between the predictor variable and the response variable and show what kind of transformation the variable may need, such as a logarithmic transformation, to get the predictor variable and response variable to have a linear relation. Index plots (SAS Institute, Inc., 2001) were created to identify influential observations and outliers in the datasets, and p-values were used to select the final variables for the equation. P-values indicate the significance of predictor variables in predicting the response variable. A p-value of about 0.01 indicates a positive significance; a p-value of about 0.001 indicates a strong significance; and a p-value of 0.0001 or less indicates a very strong significance (SAS Institute, Inc., 2001) when sample sizes are similar to the sample size found in this study.
During the final explanatory variable selection process, the soil characteristics data from the Soil Survey Geographic (SSURGO) database (U.S. Department of Agriculture, 2005) were determined to be significant in predicting the probability that a stream has intermittent flow. As of the fall of 2005, how-ever, the SSURGO was not yet available in Caledonia or Essex Counties—an area covering about 14 percent of the State. Because the SSURGO data could improve the logistic regres-sion equations, stream sites without SSURGO data available were removed from the regression analysis. This left 492 stream sites available to develop the final regression equation.
The Geologic-Biophysical Regions dataset, which divides Vermont into eight subregions on the basis of bedrock geol-ogy, gross physiography, climate, and broad-scale patterns of potential natural vegetation (Capen, 1998), was used to categorize sites into regions. Tests of regionalizing the sites based on this dataset indicated that a location variable such as this does have the potential to improve the predictive accuracy of the equation. But this dataset, and others that could be used for regionalization of sites, have not been developed at a scale and level of detail that was appropriate for this investigation.
The final four basin characteristics that were found to be significant in estimating the probability that a stream has intermittent flow were (1) drainage area; (2) elevation of the site; (3) percentage of the basin with soils classified as well- or moderately well-drained soils in the SSURGO database; and (4) the relative relief, which is a measure of basin slope. A logistic regression equation was created with the final four explanatory variables using SAS statistical software as fol-lows:
p exp log A
log E log S
= + − + +
+
( )( )( )( )
1 1 5 30 1 98
2 38 0 525
10
10 10
/ . .
. .
{ [
++ −( )( ) ( )1 165 2R ]}, (1)
Figure �. Observed frequency of perennial and intermittent streams by drainage area in Vermont.
OB
SE
RV
ED
FR
EQ
UE
NC
Y
DRAINAGE AREA, IN SQUARE MILES
0
20
40
60
80
100
0 0.5 1.0 1.5 2.0 2.5 3.0 3.5 4.0
Perennial stream
Intermittent stream
10 A Logistic Regression Equation for Estimating the Probability of a Stream in Vermont Having Intermittent Flow
where p is the probability that a stream has intermittent
flow; A is the drainage area, in square miles; E is the site elevation, in feet; S is the percentage of the basin with soils
classified as well- or moderately well-drained soils in the SSURGO database;
and R is the relative relief, unitless (ratio of
maximum relief to basin perimeter).
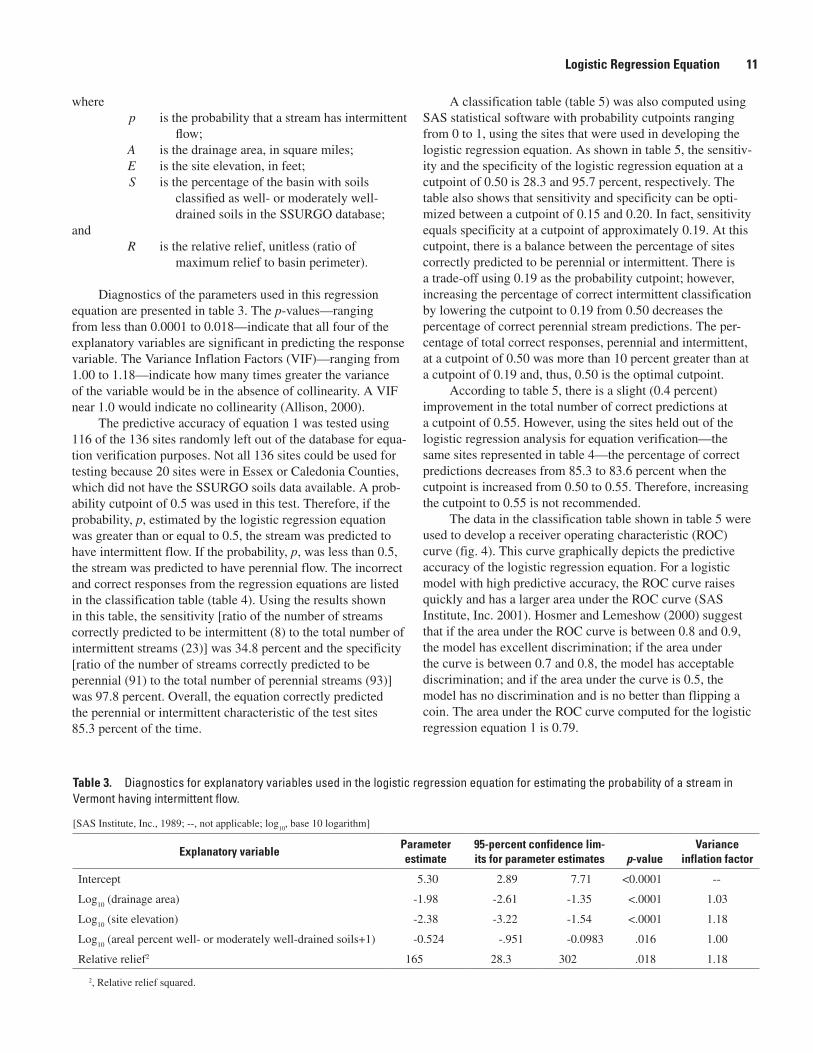
Diagnostics of the parameters used in this regression equation are presented in table 3. The p-values—ranging from less than 0.0001 to 0.018—indicate that all four of the explanatory variables are significant in predicting the response variable. The Variance Inflation Factors (VIF)—ranging from 1.00 to 1.18—indicate how many times greater the variance of the variable would be in the absence of collinearity. A VIF near 1.0 would indicate no collinearity (Allison, 2000).
The predictive accuracy of equation 1 was tested using 116 of the 136 sites randomly left out of the database for equa-tion verification purposes. Not all 136 sites could be used for testing because 20 sites were in Essex or Caledonia Counties, which did not have the SSURGO soils data available. A prob-ability cutpoint of 0.5 was used in this test. Therefore, if the probability, p, estimated by the logistic regression equation was greater than or equal to 0.5, the stream was predicted to have intermittent flow. If the probability, p, was less than 0.5, the stream was predicted to have perennial flow. The incorrect and correct responses from the regression equations are listed in the classification table (table 4). Using the results shown in this table, the sensitivity [ratio of the number of streams correctly predicted to be intermittent (8) to the total number of intermittent streams (23)] was 34.8 percent and the specificity [ratio of the number of streams correctly predicted to be perennial (91) to the total number of perennial streams (93)] was 97.8 percent. Overall, the equation correctly predicted the perennial or intermittent characteristic of the test sites 85.3 percent of the time.
A classification table (table 5) was also computed using SAS statistical software with probability cutpoints ranging from 0 to 1, using the sites that were used in developing the logistic regression equation. As shown in table 5, the sensitiv-ity and the specificity of the logistic regression equation at a cutpoint of 0.50 is 28.3 and 95.7 percent, respectively. The table also shows that sensitivity and specificity can be opti-mized between a cutpoint of 0.15 and 0.20. In fact, sensitivity equals specificity at a cutpoint of approximately 0.19. At this cutpoint, there is a balance between the percentage of sites correctly predicted to be perennial or intermittent. There is a trade-off using 0.19 as the probability cutpoint; however, increasing the percentage of correct intermittent classification by lowering the cutpoint to 0.19 from 0.50 decreases the percentage of correct perennial stream predictions. The per-centage of total correct responses, perennial and intermittent, at a cutpoint of 0.50 was more than 10 percent greater than at a cutpoint of 0.19 and, thus, 0.50 is the optimal cutpoint.
According to table 5, there is a slight (0.4 percent) improvement in the total number of correct predictions at a cutpoint of 0.55. However, using the sites held out of the logistic regression analysis for equation verification—the same sites represented in table 4—the percentage of correct predictions decreases from 85.3 to 83.6 percent when the cutpoint is increased from 0.50 to 0.55. Therefore, increasing the cutpoint to 0.55 is not recommended.
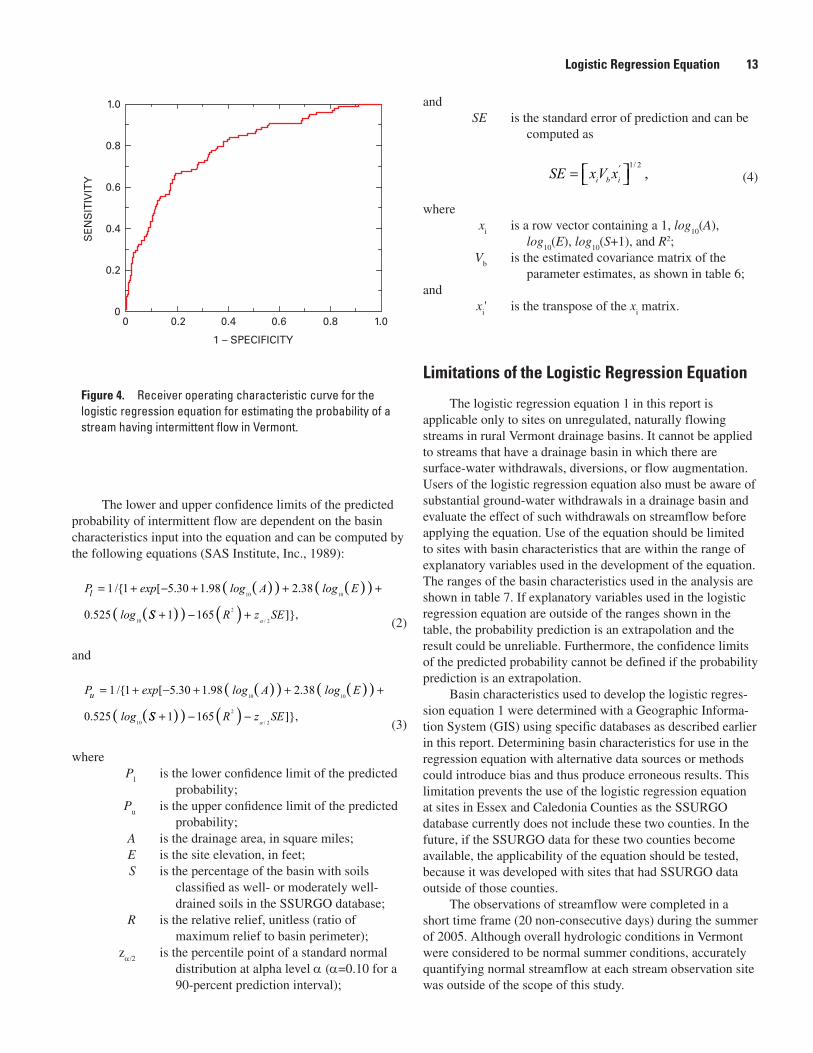
The data in the classification table shown in table 5 were used to develop a receiver operating characteristic (ROC) curve (fig. 4). This curve graphically depicts the predictive accuracy of the logistic regression equation. For a logistic model with high predictive accuracy, the ROC curve raises quickly and has a larger area under the ROC curve (SAS Institute, Inc. 2001). Hosmer and Lemeshow (2000) suggest that if the area under the ROC curve is between 0.8 and 0.9, the model has excellent discrimination; if the area under the curve is between 0.7 and 0.8, the model has acceptable discrimination; and if the area under the curve is 0.5, the model has no discrimination and is no better than flipping a coin. The area under the ROC curve computed for the logistic regression equation 1 is 0.79.
Table �. Diagnostics for explanatory variables used in the logistic regression equation for estimating the probability of a stream in Vermont having intermittent flow.
[SAS Institute, Inc., 1989; --, not applicable; log10
, base 10 logarithm]
Explanatory variableParameter estimate
�5-percent confidence lim-its for parameter estimates p-value
Variance inflation factor
Intercept 5.30 2.89 7.71 <0.0001 --
Log10
(drainage area) -1.98 -2.61 -1.35 <.0001 1.03
Log10
(site elevation) -2.38 -3.22 -1.54 <.0001 1.18
Log10
(areal percent well- or moderately well-drained soils+1) -0.524 -.951 -0.0983 .016 1.00
Relative relief2 165 28.3 302 .018 1.18
2, Relative relief squared.
Logistic Regression Equation 11

Table 5. Classification table for the logistic regression equation for estimating the probability of a stream in Vermont having intermittent flow, with a probability cutpoint ranging from 0 to 1.
[SAS Institute, Inc. (1989); Cutpoint is the probability level that could be used to classify the stream as intermittent or perennial. Sensitivity is the ratio of correctly classified intermittent streams to the observed number of intermittent streams. Specificity is the ratio of correctly classified perennial streams to the observed number of perennials streams. False positive is the ratio of sites incorrectly predicted to be intermittent to all sites predicted to be intermittent. False negative is the ratio of sites incorrectly predicted to be perennial to all sites predicted to be perennial]
CutpointTotal correct Total incorrect Percent
Intermittent Perennial Intermittent Perennial Correct Sensitivity SpecificityFalse
positiveFalse
negative
0.00 99 0 393 0 20.1 100 0.0 79.9 0.0
0.05 95 77 316 4 35.0 96.0 19.6 76.9 4.9
0.10 87 171 222 12 52.4 87.9 43.5 71.8 6.6
0.15 79 248 145 20 66.5 79.8 63.1 64.7 7.5
0.20 67 286 107 32 71.7 67.7 72.8 61.5 10.1
0.25 61 321 72 38 77.6 61.6 81.7 54.1 10.6
0.30 55 331 62 44 78.5 55.6 84.2 53.0 11.7
0.35 42 348 45 57 79.3 42.4 88.5 51.7 14.1
0.40 34 358 35 65 79.7 34.3 91.1 50.7 15.4
0.45 32 370 23 67 81.7 32.3 94.1 41.8 15.3
0.50 28 376 17 71 82.1 28.3 95.7 37.8 15.9
0.55 24 382 11 75 82.5 24.2 97.2 31.4 16.4
0.60 17 385 8 82 81.7 17.2 98.0 32.0 17.6
0.65 13 386 7 86 81.1 13.1 98.2 35.0 18.2
0.70 8 389 4 91 80.7 8.1 99.0 33.3 19.0
0.75 6 391 2 93 80.7 6.1 99.5 25.0 19.2
0.80 2 393 0 97 80.3 2.0 100 0.0 19.8
0.85 1 393 0 98 80.1 1.0 100 0.0 20
0.90 0 393 0 99 79.9 0.0 100 0.0 20.1
0.95 0 393 0 99 79.9 0.0 100 0.0 20.1
1.00 0 393 0 99 79.9 0.0 100 0.0 20.1
Table �. Classification table depicting accuracy of the logistic regression equation predicting the perennial or intermittent status of the stream sites held out of the logistic regression analysis for equation verification.
Predicted intermittent stream
Predicted perennial stream
Total
Observed intermittent stream 8 15 23
Observed perennial stream 2 91 93
Total 10 106 116
1� A Logistic Regression Equation for Estimating the Probability of a Stream in Vermont Having Intermittent Flow
The lower and upper confidence limits of the predicted probability of intermittent flow are dependent on the basin characteristics input into the equation and can be computed by the following equations (SAS Institute, Inc., 1989):
P exp log A log E
log
l = + − + + +( )( ) ( )( )1 1 5 30 1 98 2 38
0 525
10 10
10
/ . . .
.
{ [
SS R z SE+ − +( )( ) ( )1 165 2
2 /]},
(2)
and
P exp log A log E
log
u = + − + + +( )( ) ( )( )1 1 5 30 1 98 2 38
0 525
10 10
10
/ . . .
.
{ [
SS R z SE+ − −( )( ) ( )1 165 2
2 /]},
(3)
where P
l is the lower confidence limit of the predicted
probability; P
u is the upper confidence limit of the predicted
probability; A is the drainage area, in square miles; E is the site elevation, in feet; S is the percentage of the basin with soils
classified as well- or moderately well-drained soils in the SSURGO database;
R is the relative relief, unitless (ratio of maximum relief to basin perimeter);
zα/2 is the percentile point of a standard normal
distribution at alpha level α (α=0.10 for a 90-percent prediction interval);
and SE is the standard error of prediction and can be
computed as
SE xV xi b i= ′ 1 2/
, (4)
where x
i is a row vector containing a 1, log
10(A),
log10
(E), log10
(S+1), and R2; V
b is the estimated covariance matrix of the
parameter estimates, as shown in table 6; and x
i' is the transpose of the x
i matrix.
Limitations of the Logistic Regression Equation
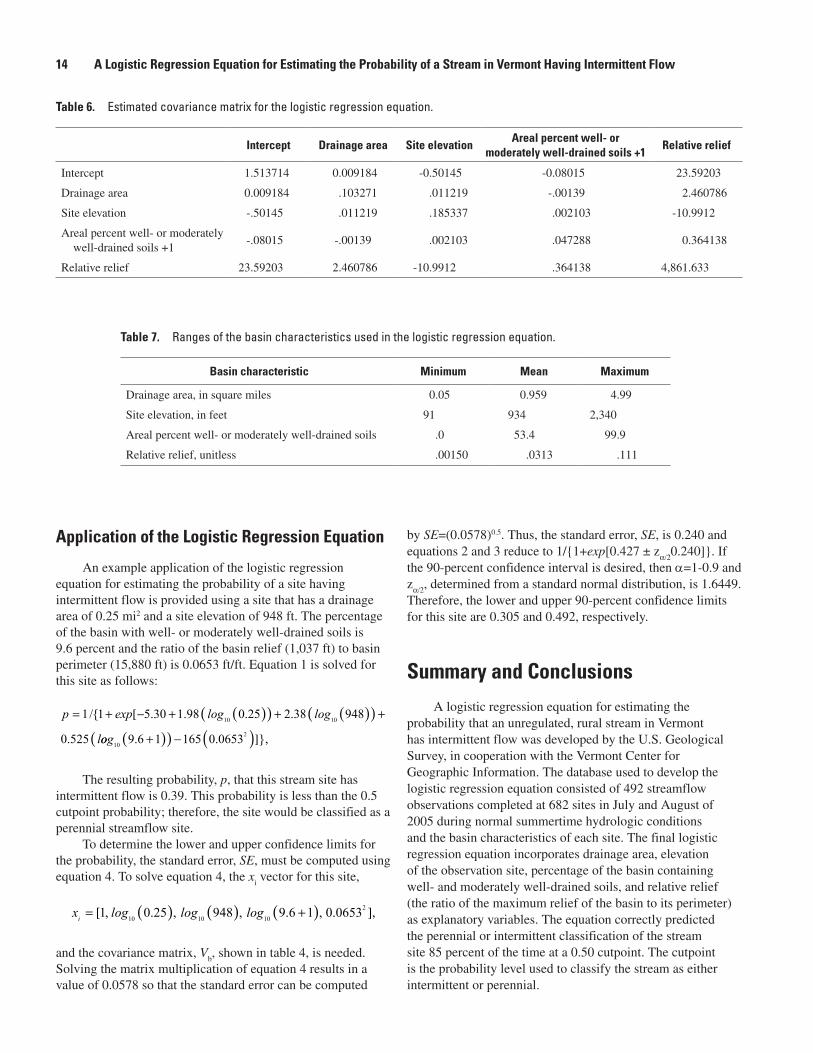
The logistic regression equation 1 in this report is applicable only to sites on unregulated, naturally flowing streams in rural Vermont drainage basins. It cannot be applied to streams that have a drainage basin in which there are surface-water withdrawals, diversions, or flow augmentation. Users of the logistic regression equation also must be aware of substantial ground-water withdrawals in a drainage basin and evaluate the effect of such withdrawals on streamflow before applying the equation. Use of the equation should be limited to sites with basin characteristics that are within the range of explanatory variables used in the development of the equation. The ranges of the basin characteristics used in the analysis are shown in table 7. If explanatory variables used in the logistic regression equation are outside of the ranges shown in the table, the probability prediction is an extrapolation and the result could be unreliable. Furthermore, the confidence limits of the predicted probability cannot be defined if the probability prediction is an extrapolation.
Basin characteristics used to develop the logistic regres-sion equation 1 were determined with a Geographic Informa-tion System (GIS) using specific databases as described earlier in this report. Determining basin characteristics for use in the regression equation with alternative data sources or methods could introduce bias and thus produce erroneous results. This limitation prevents the use of the logistic regression equation at sites in Essex and Caledonia Counties as the SSURGO database currently does not include these two counties. In the future, if the SSURGO data for these two counties become available, the applicability of the equation should be tested, because it was developed with sites that had SSURGO data outside of those counties.
The observations of streamflow were completed in a short time frame (20 non-consecutive days) during the summer of 2005. Although overall hydrologic conditions in Vermont were considered to be normal summer conditions, accurately quantifying normal streamflow at each stream observation site was outside of the scope of this study.
Figure �. Receiver operating characteristic curve for the logistic regression equation for estimating the probability of a stream having intermittent flow in Vermont.
1 – SPECIFICITY
SE
NS
ITIV
ITY
00 0.2 0.4 0.6 0.8 1.0
1.0
0.8
0.6
0.4
0.2
Logistic Regression Equation 1�
Application of the Logistic Regression Equation
An example application of the logistic regression equation for estimating the probability of a site having intermittent flow is provided using a site that has a drainage area of 0.25 mi2 and a site elevation of 948 ft. The percentage of the basin with well- or moderately well-drained soils is 9.6 percent and the ratio of the basin relief (1,037 ft) to basin perimeter (15,880 ft) is 0.0653 ft/ft. Equation 1 is solved for this site as follows:
p exp log log
l
= + − + + +( )( ) ( )( )1 1 5 30 1 98 0 25 2 38 948
0 525
10 10/ . . . .
.
{ [
oog10
29 6 1 165 0 0653. .+ −( )( ) ( )]},
The resulting probability, p, that this stream site has intermittent flow is 0.39. This probability is less than the 0.5 cutpoint probability; therefore, the site would be classified as a perennial streamflow site.
To determine the lower and upper confidence limits for the probability, the standard error, SE, must be computed using equation 4. To solve equation 4, the x
i vector for this site,
x log log logi = +( ) ( ) ( )[ ],1 0 25 948 9 6 1 0 065310 10 10
2, . , , . , .
and the covariance matrix, Vb, shown in table 4, is needed.
Solving the matrix multiplication of equation 4 results in a value of 0.0578 so that the standard error can be computed
by SE=(0.0578)0.5. Thus, the standard error, SE, is 0.240 and equations 2 and 3 reduce to 1/{1+exp[0.427 ± zα/20.240]}. If the 90-percent confidence interval is desired, then α=1-0.9 and
zα/2, determined from a standard normal distribution, is 1.6449. Therefore, the lower and upper 90-percent confidence limits for this site are 0.305 and 0.492, respectively.
Summary and ConclusionsA logistic regression equation for estimating the
probability that an unregulated, rural stream in Vermont has intermittent flow was developed by the U.S. Geological Survey, in cooperation with the Vermont Center for Geographic Information. The database used to develop the logistic regression equation consisted of 492 streamflow observations completed at 682 sites in July and August of 2005 during normal summertime hydrologic conditions and the basin characteristics of each site. The final logistic regression equation incorporates drainage area, elevation of the observation site, percentage of the basin containing well- and moderately well-drained soils, and relative relief (the ratio of the maximum relief of the basin to its perimeter) as explanatory variables. The equation correctly predicted the perennial or intermittent classification of the stream site 85 percent of the time at a 0.50 cutpoint. The cutpoint is the probability level used to classify the stream as either intermittent or perennial.
Table �. Estimated covariance matrix for the logistic regression equation.
Intercept Drainage area Site elevationAreal percent well- or
moderately well-drained soils +1Relative relief
Intercept 1.513714 0.009184 -0.50145 -0.08015 23.59203
Drainage area 0.009184 .103271 .011219 -.00139 2.460786
Site elevation -.50145 .011219 .185337 .002103 -10.9912
Areal percent well- or moderately well-drained soils +1
-.08015 -.00139 .002103 .047288 0.364138
Relative relief 23.59203 2.460786 -10.9912 .364138 4,861.633
Table 7. Ranges of the basin characteristics used in the logistic regression equation.
Basin characteristic Minimum Mean Maximum
Drainage area, in square miles 0.05 0.959 4.99
Site elevation, in feet 91 934 2,340
Areal percent well- or moderately well-drained soils .0 53.4 99.9
Relative relief, unitless .00150 .0313 .111
1� A Logistic Regression Equation for Estimating the Probability of a Stream in Vermont Having Intermittent Flow
The logistic regression equation is applicable to sites on unregulated, naturally flowing streams in rural Vermont drain-age basins. It does not apply to streams that have a drainage basin in which there are surface-water withdrawals, diversions, or flow augmentation. Users of the logistic regression equation also must be aware of ground-water withdrawals in a drainage basin and determine if the withdrawals could affect streamflow before applying the equation. Because the SSURGO soils database did not include Essex and Caledonia Counties at the time of this investigation, the applicability of the logistic regression equation in those counties will need to be evaluated as the data become available.
Selected References
Allison, P.D., 2000, Logistic regression using the SAS system, theory and application: Cary, N.C., SAS Institute, Inc., 287 p.
Bent, G.C., and Archfield, S.A., 2002, A logistic regression equation for estimating the probability of a stream flow-ing perennially in Massachusetts: U.S. Geological Survey Water-Resources Investigations Report 02–4043, 45 p.
Capen, D.E., 1998, Biophysical regions of Vermont from the VT Biodiversity Project: Waterbury, Vt., Vermont Center for Geographic Information, Inc., accessed April 4, 2006, at http://www.vcgi.org
Daly, Christopher, 2000, PRISM (Parameter-elevation regres-sions on independent slopes model), U.S. Department of Agriculture and Natural Resources Conservation Service Climate Mapping Project, United States Average Monthly or Annual Precipitation, 1971–2000: National Water and Climate Center, Oregon State University Partnership.
Environmental Systems Research Institute, Inc., 1994, ARC/INFO users guide, version 7.0: Redlands, Calif., variously paged.
Hosmer, D.W., and Lemeshow, Stanley, 2000, Applied logistic regression (2d ed.): New York, John Wiley, 375 p.
National Weather Service, 2006, Palmer Drought Severity index, accessed July 14, 2006, at http://www.cpc.ncep.noaa.gov/products/monitoring_and_data/drought.shtml.
Northeast Regional Climate Center, 2006, Monthly and sea-sonal climate summary tables, accessed June 29, 2006, at http://met-www.cit.cornell.edu/climate/Climate_summary.html.
Randall, A.D., 1996, Mean annual runoff, precipitation, and evapotranspiration in the glaciated northeastern United States, 1951–80: U.S. Geological Survey Open-File Report 96–395, 2 pls.
SAS Institute, Inc., 1989, SAS/STAT user’s guide, vers. 6, 4th ed., v. 2: Cary, N.C., SAS Institute, Inc., 846 p.
SAS Institute, Inc., 2001, Categorical data analysis using logistic regression: Cary, N.C., SAS Institute, Inc., 364 p.
Scott, J.C., 1990, Computerized stratified random site-selec-tion approaches for design of a ground-water-quality sam-pling network: U.S. Geological Survey Water-Resources Investigations Report 90–4101, 17 p.
State of Vermont Enhanced 9-1-1 Board, 2005a, Emergency E911_RDS, accessed April 25, 2006, at http://www.vcgi.org/.
State of Vermont Enhanced 9-1-1 Board, 2005b, Emergency E911_ESITE, accessed April 25, 2006, at http://www.vcgi.org/.
University of Vermont Spatial Analysis Lab, 2002, 2002 Land cover/land use dataset for Vermont, accessed April 26, 2006, at http://www.vcgi.org/.
U.S. Department of Agriculture, Natural Resources Conserva-tion Service, Soil Survey Division, 2005, Soil survey geo-graphic database (SSURGO), National SSURGO database, accessed March 22, 2006, at http://www.ncgc.nrcs.usda.gov/products/datasets/ssurgo/index.html
U.S. Fish and Wildlife Service, 2003, National wetlands inventory, accessed April 26, 2006, at http://www.vcgi.org/.
U.S. Geological Survey, 2002, National elevation dataset, accessed April 26, 2006, at http://ned.usgs.gov/.
U.S. Geological Survey and U.S. Environmental Protection Agency, 2004, National hydrography dataset, accessed May 5, 2004, at http://nhd.usgs.gov/.
U.S. Geological Survey, 2006a, Precipitation and drought data, accessed July 14, 2006, at http://water.usgs.gov/cgi-bin/waterwatch.
U.S. Geological Survey, 2006b, Streamflows and ground-water level data, accessed on July 14, 2006, at http://vt.water.usgs.gov/WaterData/all_months.htm.
U.S. Geological Survey, 2006c, Real-time streamflow data, accessed July 14, 2006, at http://waterdata.usgs.gov/vt/nwis/rt.
Vermont Center for Geographic Information, Inc., 2004, The Vermont hydrography dataset, accessed April 4, 2006, at http://www.vcgi.org/.
Vermont Department of Taxes, Vermont Mapping Program, 2001, Digital Elevation Models: Waterbury, Vt., Vermont Mapping Program.
Selected References 15

Prepared by Publications Service Center 1
For more information concerning the research in this report, contact: Keith W. Robinson, Director U.S. Geological Survey New Hampshire-Vermont Water Science Center 361 Commerce Way Pembroke, NH 03275
or visit our Web site at: http://nh.water.usgs.gov

Olson, S.A. and Brouillette, M.C.—
A Logistic Regression Equation for Estim
ating the Probability of a Stream in Verm
ont Having Interm
ittent Flow—
USGS Scientific Investigations Report 2006–5217