Embed Size (px)
Citation preview
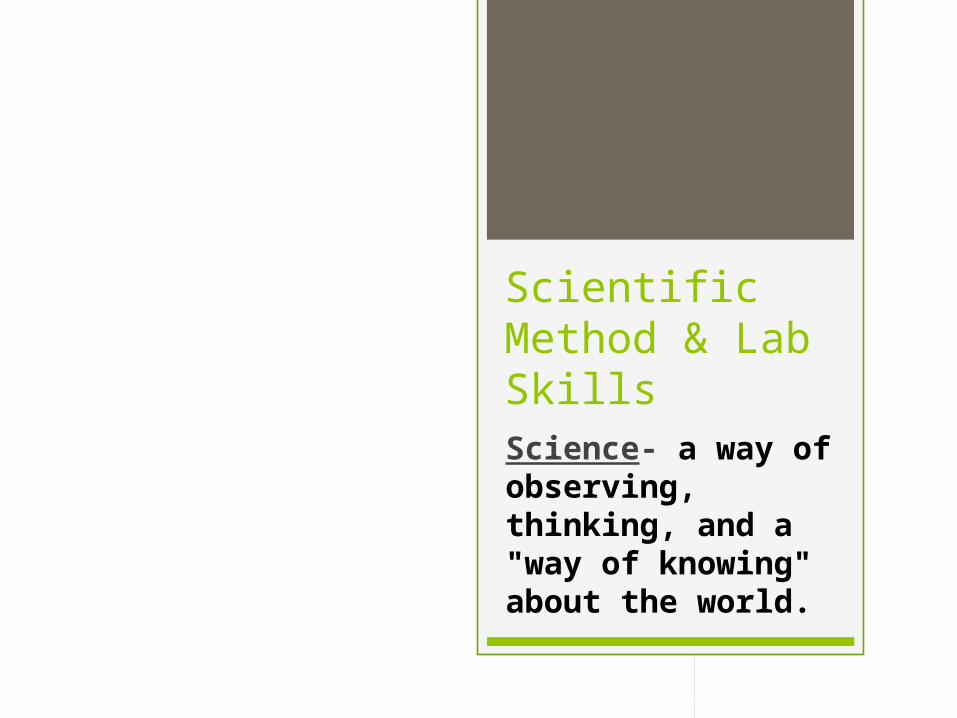
Scientific Method & Lab SkillsScience- a way of observing, thinking, and a "way of knowing" about the world.
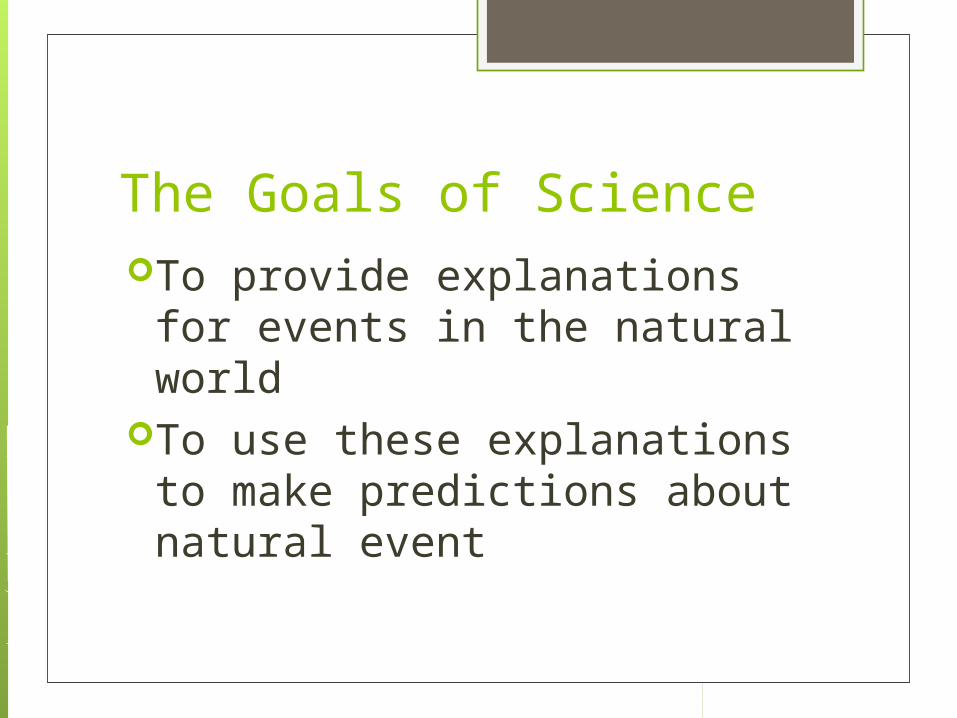
The Goals of ScienceTo provide explanations for
events in the natural worldTo use these explanations to
make predictions about natural event
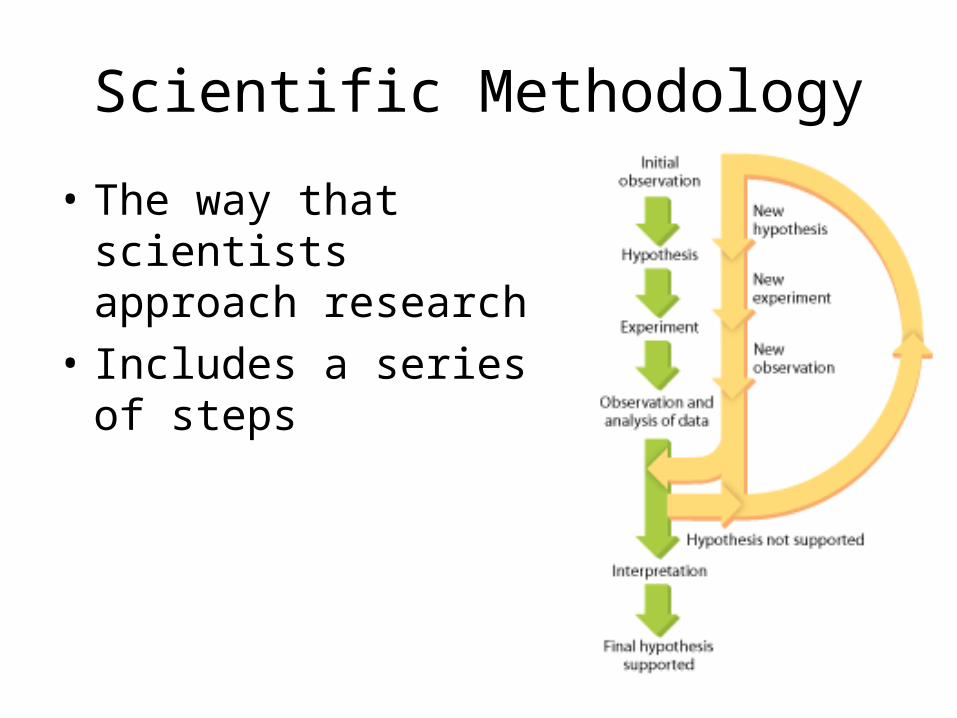
Scientific Methodology
• The way that scientists approach research
• Includes a series of steps
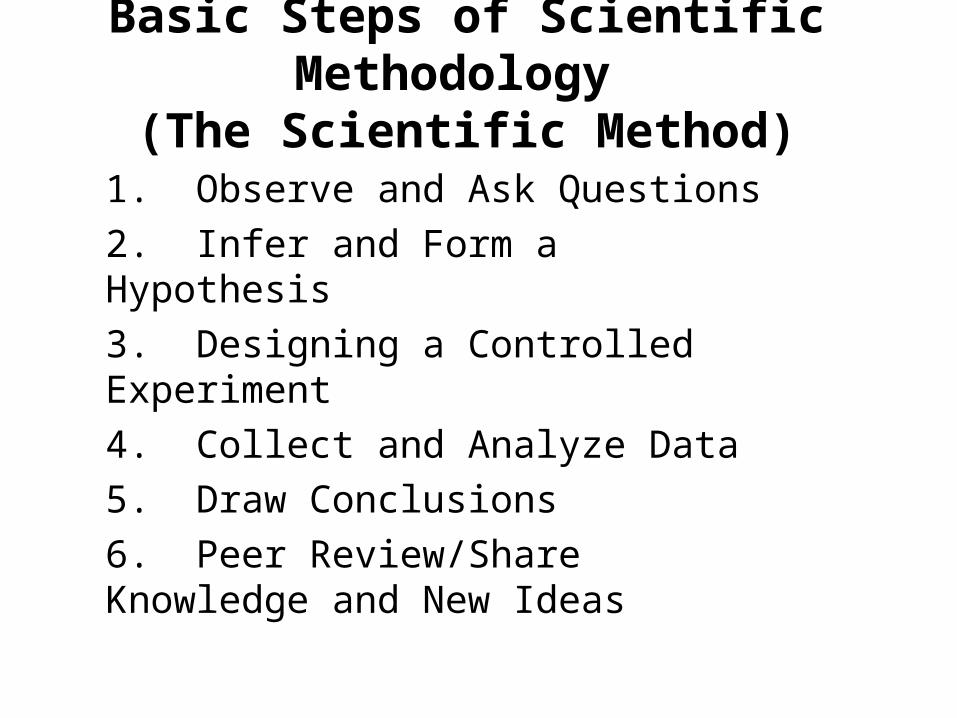
Basic Steps of Scientific Methodology (The Scientific Method)
1. Observe and Ask Questions
2. Infer and Form a Hypothesis
3. Designing a Controlled Experiment
4. Collect and Analyze Data
5. Draw Conclusions
6. Peer Review/Share Knowledge and New Ideas
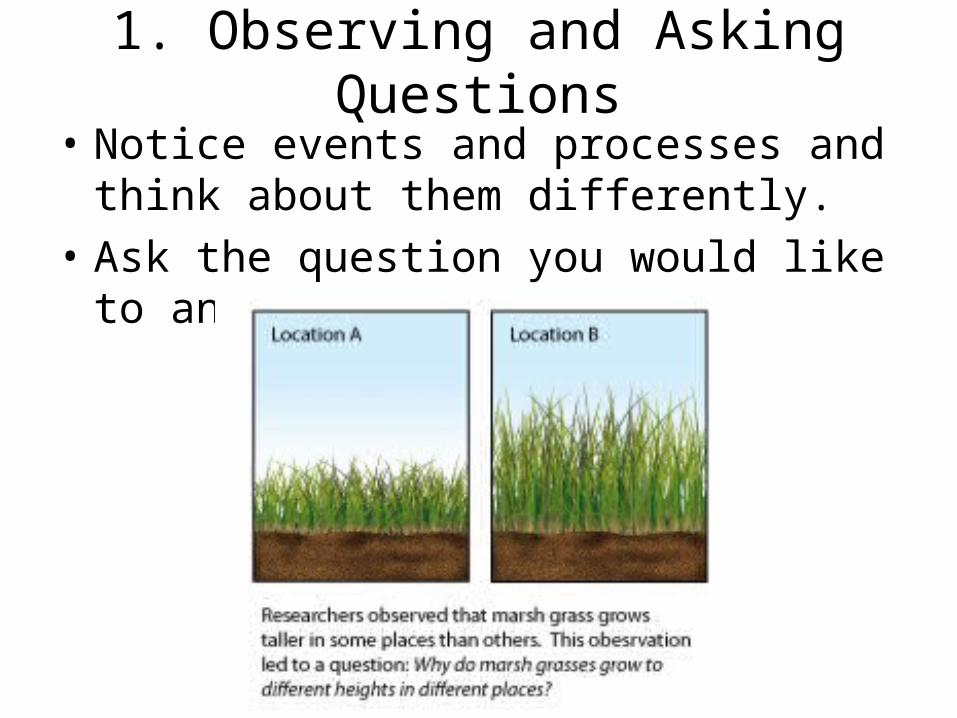
1. Observing and Asking Questions
• Notice events and processes and think about them differently.
• Ask the question you would like to answer.
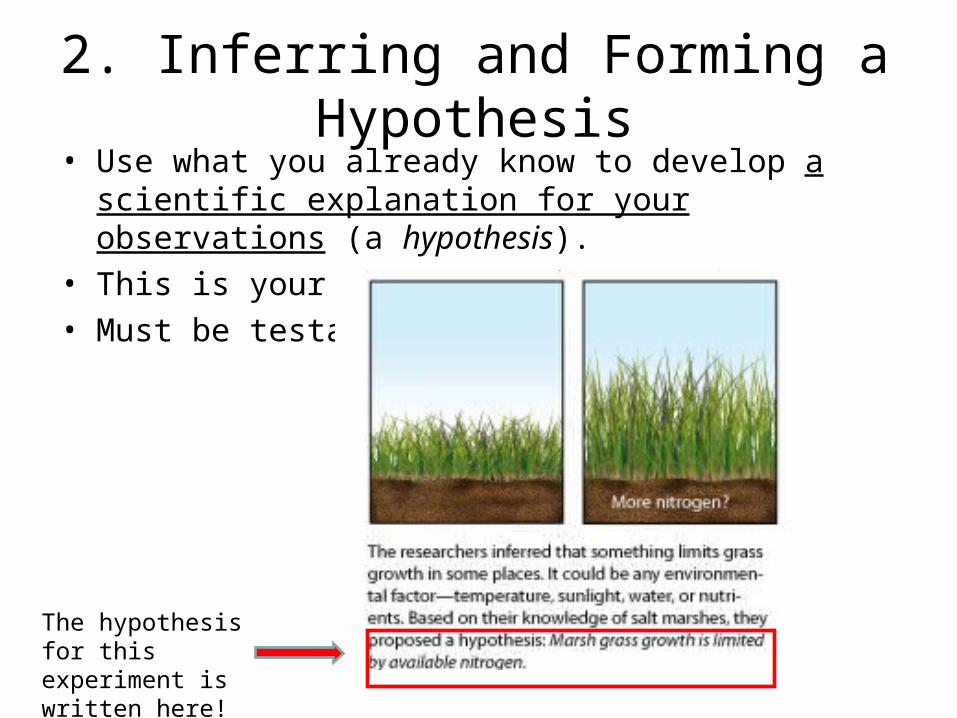
2. Inferring and Forming a Hypothesis• Use what you already know to develop a scientific
explanation for your observations (a hypothesis). • This is your answer to the question.• Must be testable!
The hypothesis for this experiment is written here!
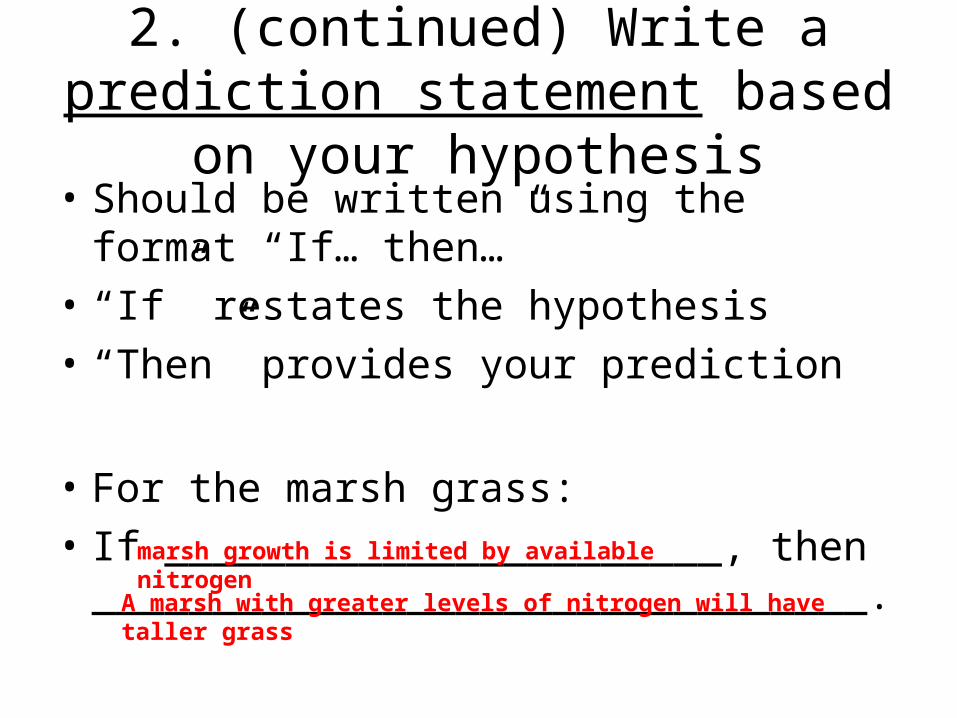
2. (continued) Write a prediction statement based on your hypothesis• Should be written using the format “If…
then…”
• “If” restates the hypothesis
• “Then” provides your prediction
• For the marsh grass:
• If _______________________, then ________________________________.
marsh growth is limited by available nitrogen
A marsh with greater levels of nitrogen will have taller grass
3. Designing Controlled Experiments
• Must keep track of all things that can change (variables).
• Only one variable should be changed during an experiment
• All other variables should be held constant (controlled variables)
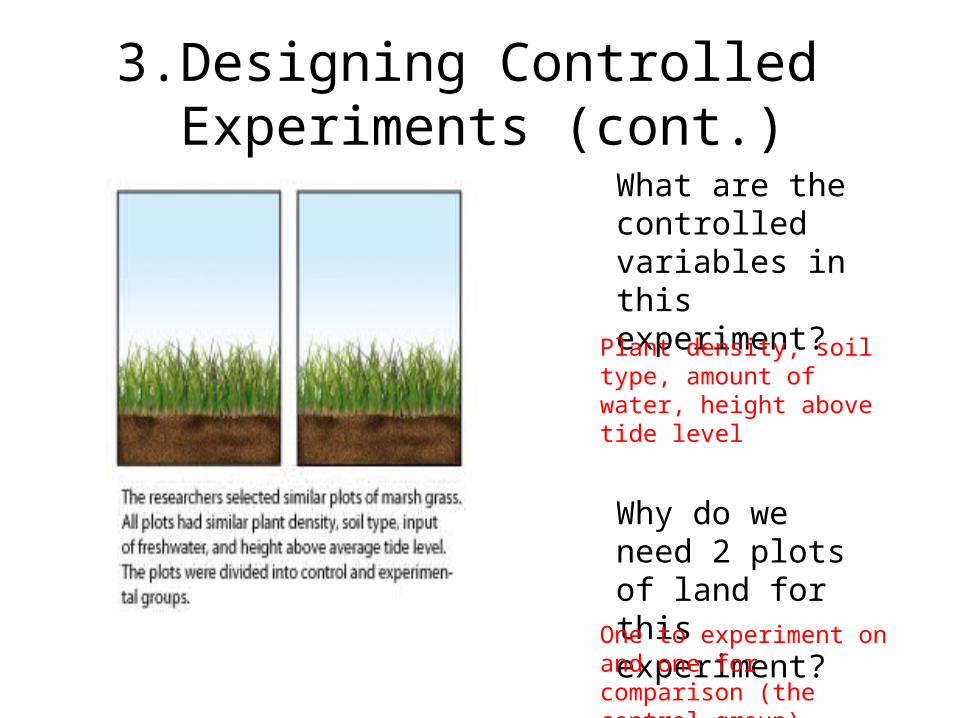
3.Designing Controlled Experiments (cont.)
What are the controlled variables in this experiment?
Why do we need 2 plots of land for this experiment?
Plant density, soil type, amount of water, height above tide level
One to experiment on and one for comparison (the control group)
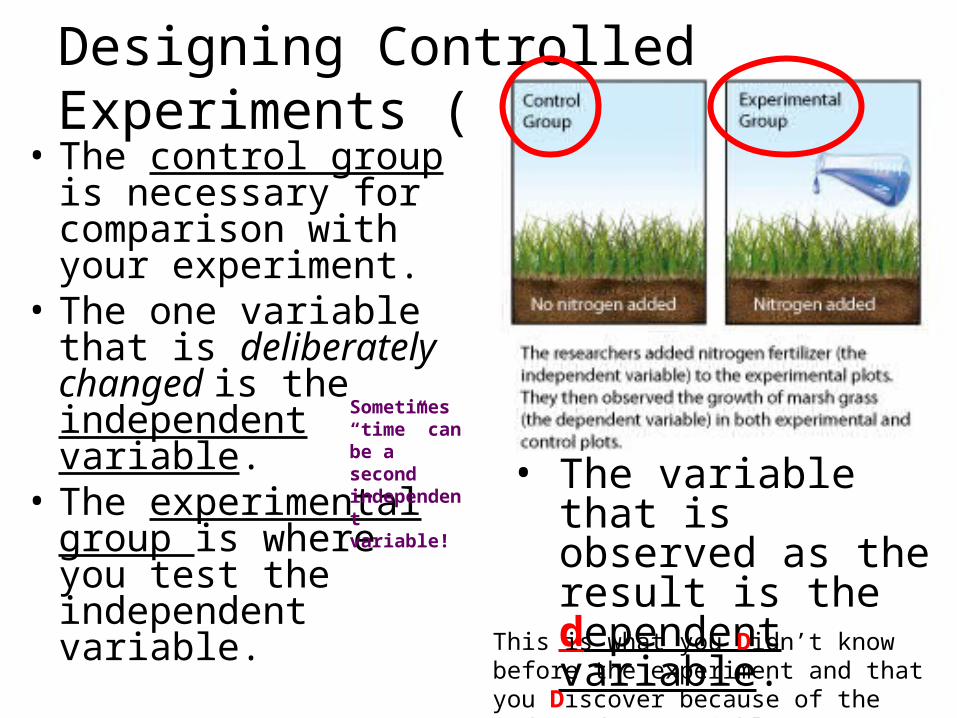
Designing Controlled Experiments (Cont.)
• The control group is necessary for comparison with your experiment.
• The one variable that is deliberately changed is the independent variable.
• The experimental group is where you test the independent variable.
• The variable that is observed as the result is the dependent variable.
This is what you Didn’t know before the experiment and that you Discover because of the independent variable you tested.
Sometimes “time” can be a second independent variable!
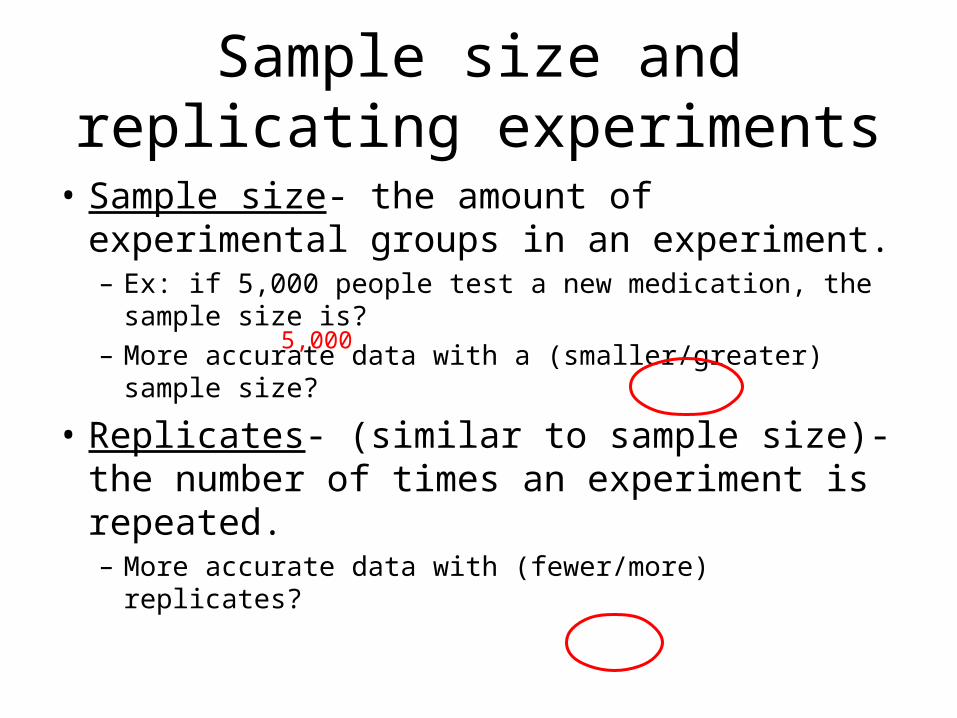
Sample size and replicating experiments
• Sample size- the amount of experimental groups in an experiment.– Ex: if 5,000 people test a new medication, the sample
size is?– More accurate data with a (smaller/greater) sample
size?
• Replicates- (similar to sample size)- the number of times an experiment is repeated. – More accurate data with (fewer/more) replicates?
5,000
Research Tools
• Choosing the right equipment is essential to successful experiments and data collection.
• Computers have become an important part of research.
• Do you recognize the lab equipment shown?
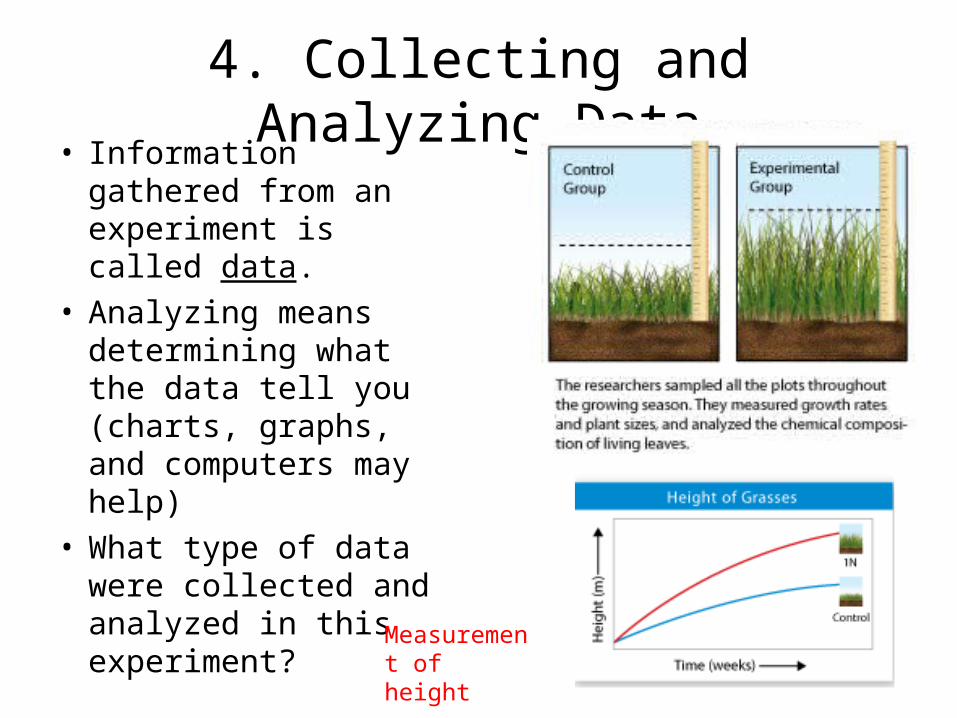
4. Collecting and Analyzing Data• Information gathered
from an experiment is called data.
• Analyzing means determining what the data tell you (charts, graphs, and computers may help)
• What type of data were collected and analyzed in this experiment?
Measurement of height
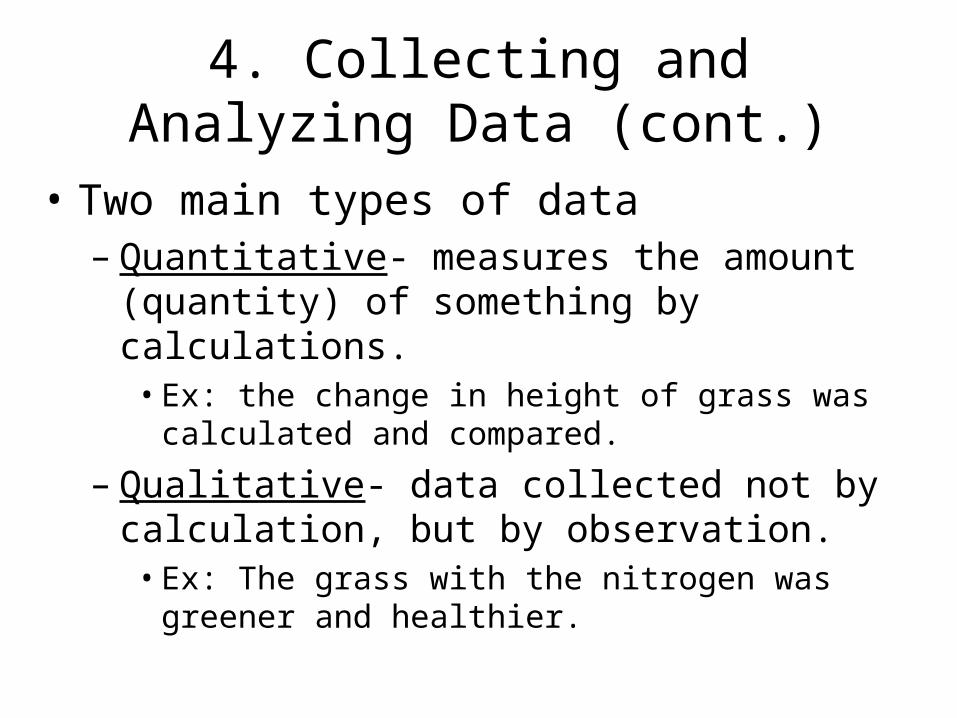
• Two main types of data– Quantitative- measures the amount (quantity) of
something by calculations. • Ex: the change in height of grass was calculated and
compared.
– Qualitative- data collected not by calculation, but by observation.
• Ex: The grass with the nitrogen was greener and healthier.
4. Collecting and Analyzing Data (cont.)
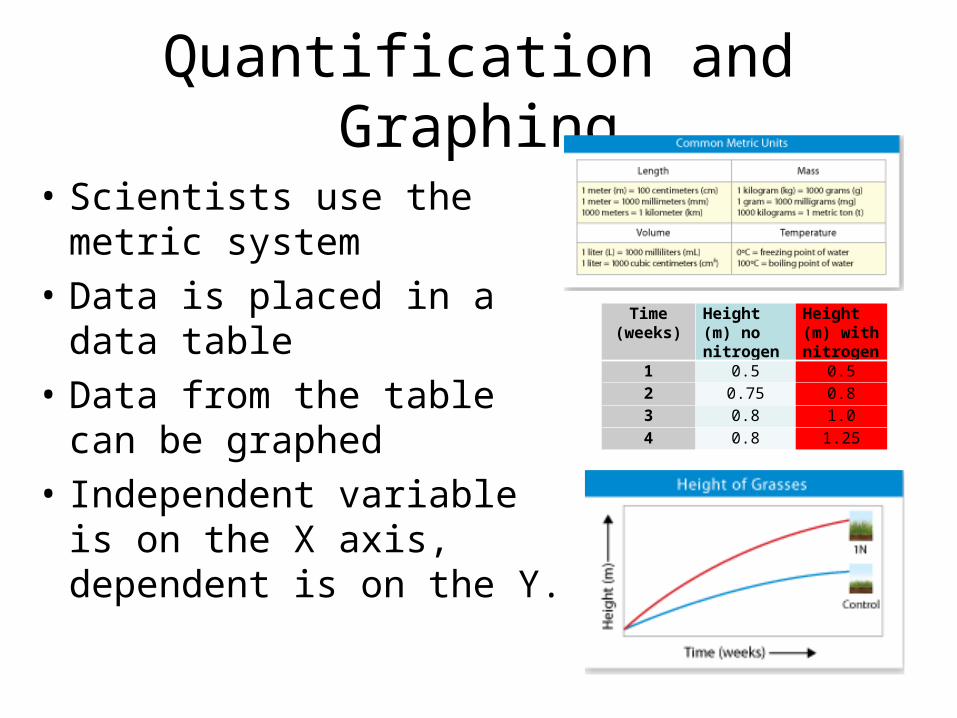
Quantification and Graphing
• Scientists use the metric system
• Data is placed in a data table
• Data from the table can be graphed
• Independent variable is on the X axis, dependent is on the Y.
Time (weeks)
Height (m) no nitrogen
Height (m) with nitrogen
1 0.5 0.5
2 0.75 0.8
3 0.8 1.0
4 0.8 1.25
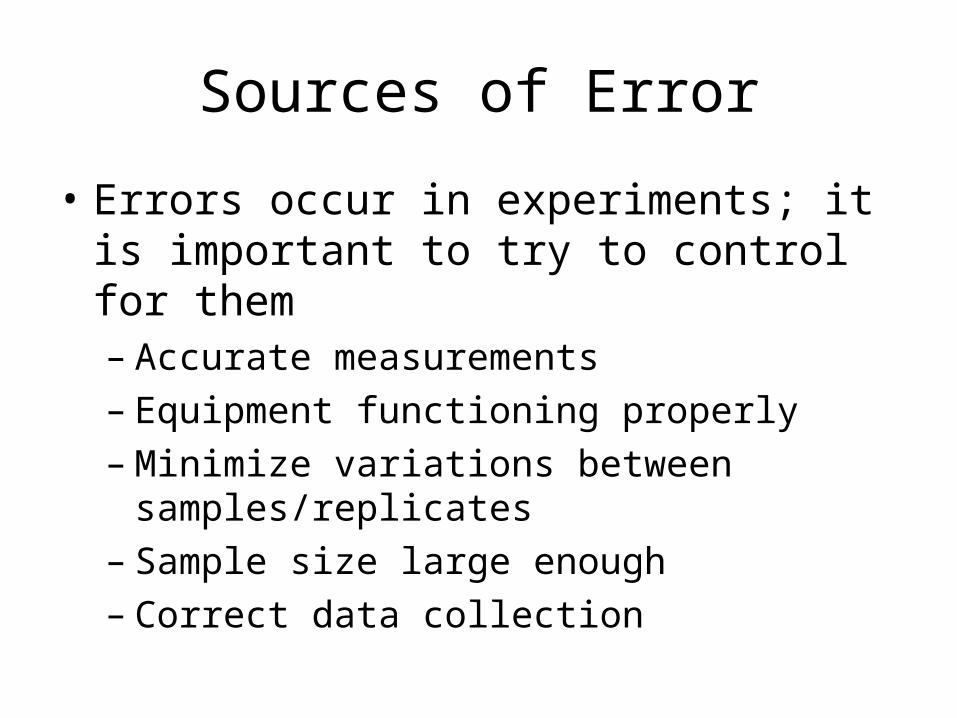
Sources of Error
• Errors occur in experiments; it is important to try to control for them– Accurate measurements– Equipment functioning properly– Minimize variations between
samples/replicates– Sample size large enough– Correct data collection
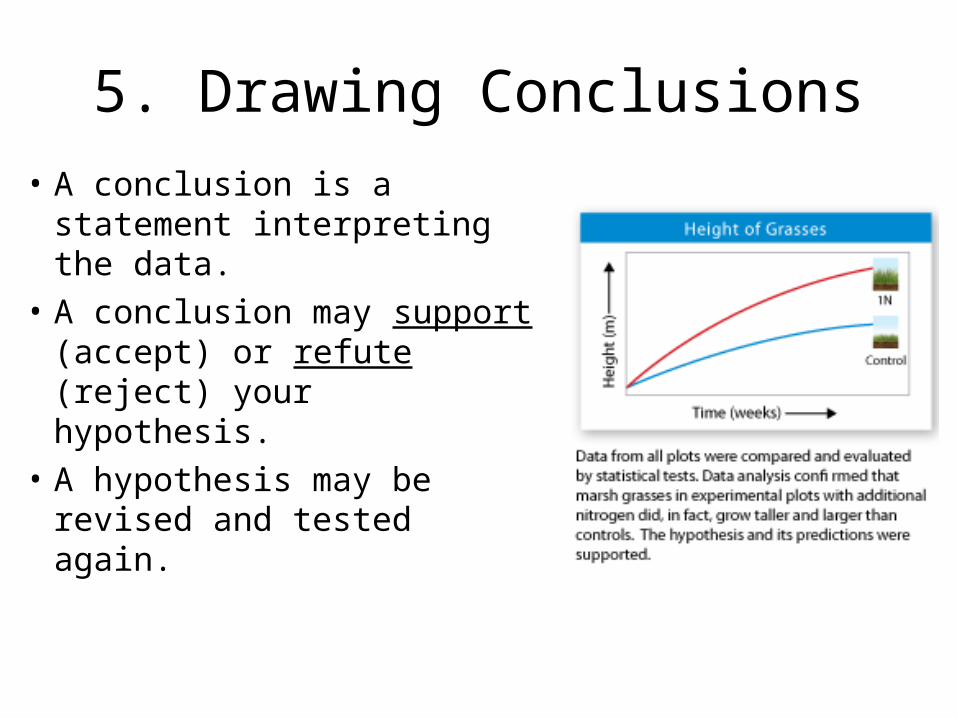
5. Drawing Conclusions
• A conclusion is a statement interpreting the data.
• A conclusion may support (accept) or refute (reject) your hypothesis.
• A hypothesis may be revised and tested again.
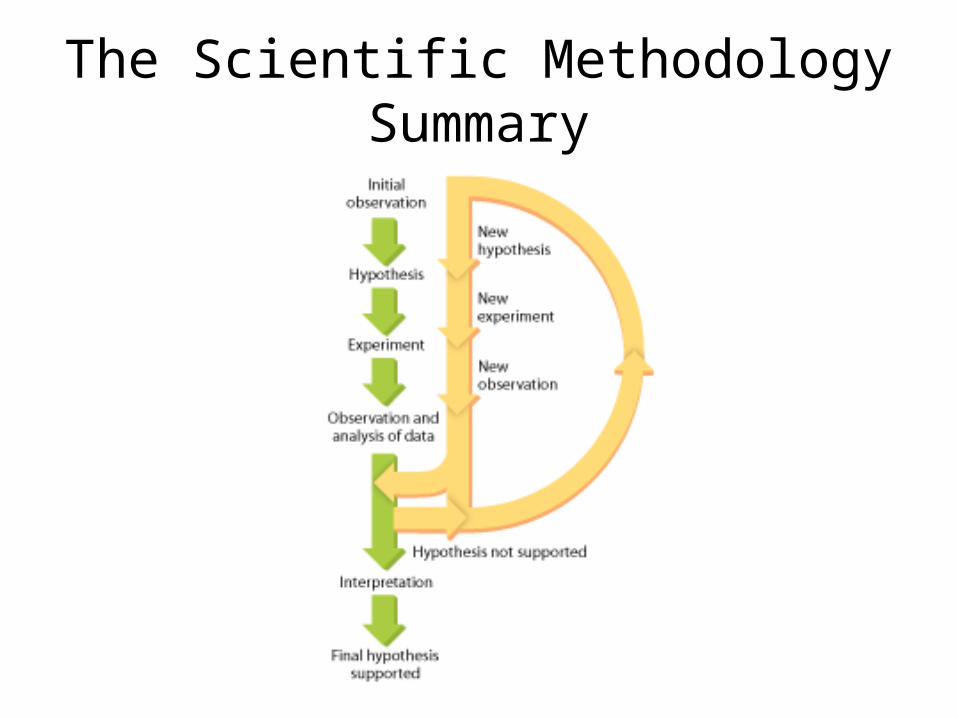
The Scientific MethodologySummary
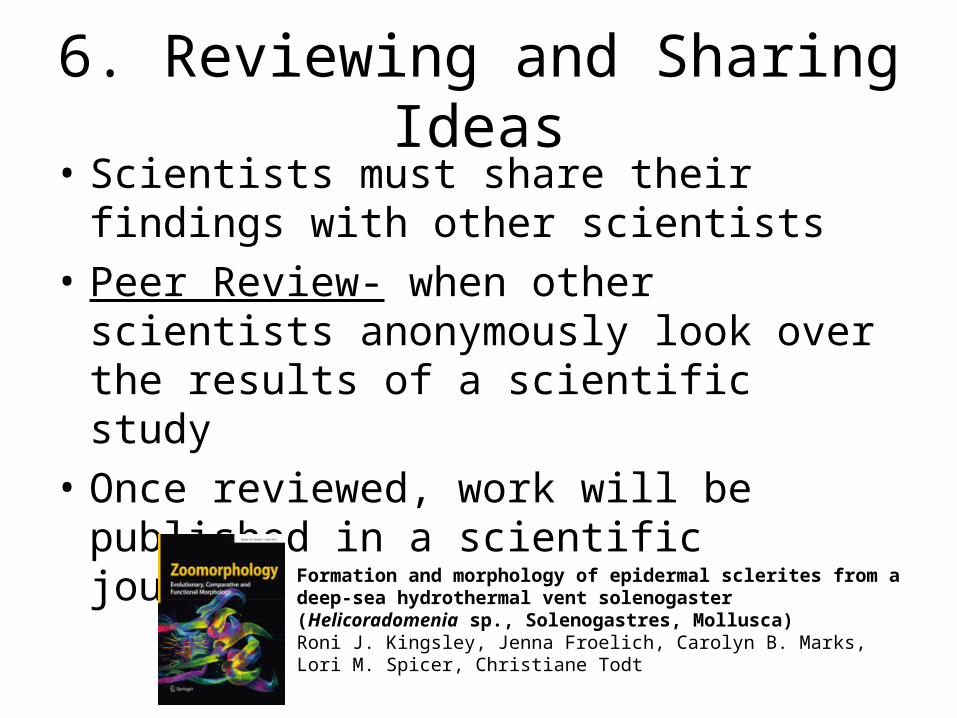
6. Reviewing and Sharing Ideas• Scientists must share their findings with
other scientists
• Peer Review- when other scientists anonymously look over the results of a scientific study
• Once reviewed, work will be published in a scientific journal
Formation and morphology of epidermal sclerites from a deep-sea hydrothermal vent solenogaster (Helicoradomenia sp., Solenogastres, Mollusca)Roni J. Kingsley, Jenna Froelich, Carolyn B. Marks, Lori M. Spicer, Christiane Todt
Scientific Theories
In science, a theory is a well tested explanation for an observation
No theory is considered absolutely true
New evidence may always prove a theory wrong
Use of the word Theory
The common public often uses this word differently.
Ex: “I have a theory about why she acts that way”.
This is NOT a well tested idea!
Examples of Scientific Theories
Cell theory- cells are the basic units if all living things.
Theory of evolution- evidence shows that living things have changed over time.
Bias-A preference or point of view that is personal, not scientific
Science aims to be objective (free of bias)
Collaboration and peer review help to keep bias out of published work.


![BOTTOM LINE: Knowing Jesus changes the way you see others ... · Line] Knowing Jesus changes the way you see others. Think of someone who you might need to see differently. Ask God](https://img.pdfslide.net/doc/110x75/5f3e5218c3039611a95faa2d/bottom-line-knowing-jesus-changes-the-way-you-see-others-line-knowing-jesus.jpg)