Embed Size (px)
Citation preview
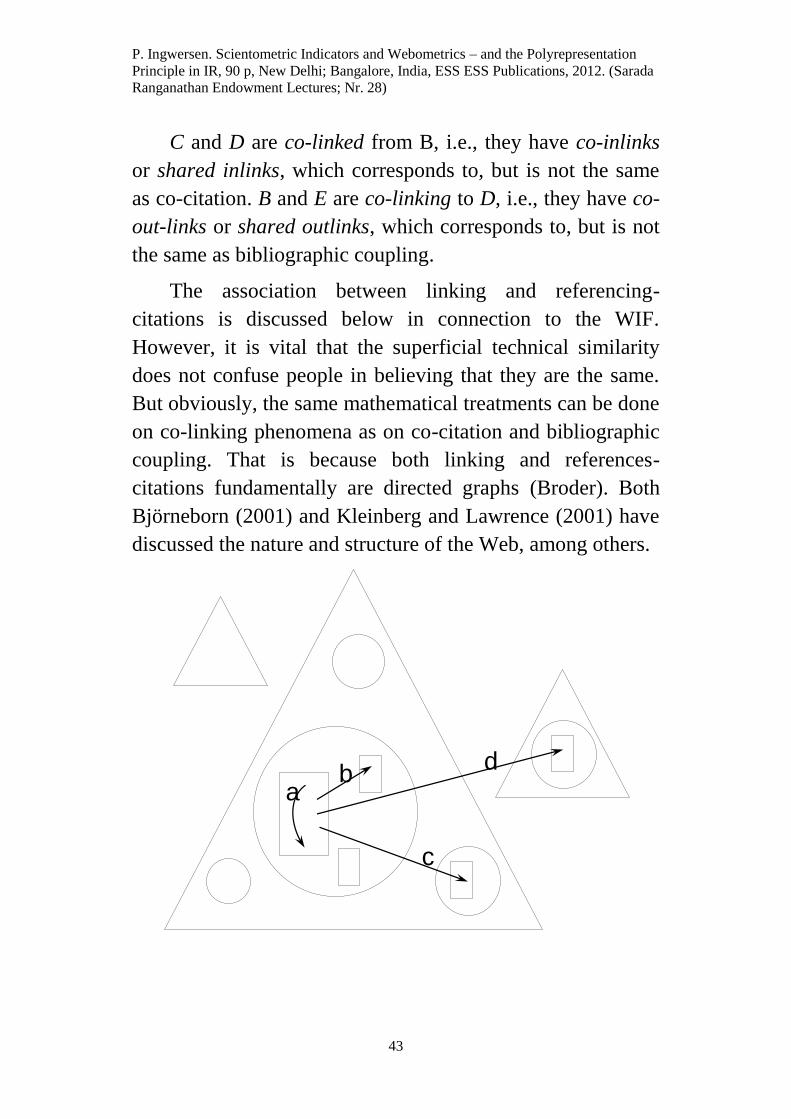
Scientometric Indicators and Webometrics –
and the Polyrepresentation Principle in Information
Retrieval
PETER INGWERSEN
Professor Emeritus, D. Ph. h. c.
Royal School of Library and Information Science
Birketinget 6, DK 2300 Copenhagen S – Denmark
and
Professor II
Department of Archive, Library and Information Science
Oslo University College
St. Olavs Plass, 0130 Oslo – Norway
Serada Ranganathan Endowment Lectures (29) (2010)

P. Ingwersen. Scientometric Indicators and Webometrics – and the Polyrepresentation
Principle in IR, 90 p, New Delhi; Bangalore, India, ESS ESS Publications, 2012. (Sarada
Ranganathan Endowment Lectures; Nr. 28)
2
Foreword

P. Ingwersen. Scientometric Indicators and Webometrics – and the Polyrepresentation
Principle in IR, 90 p, New Delhi; Bangalore, India, ESS ESS Publications, 2012. (Sarada
Ranganathan Endowment Lectures; Nr. 28)
3
P. Ingwersen. Scientometric Indicators and Webometrics – and the Polyrepresentation
Principle in IR, 90 p, New Delhi; Bangalore, India, ESS ESS Publications, 2012. (Sarada
Ranganathan Endowment Lectures; Nr. 28)
4
Acknowledgements
I am grateful to the Board of Trustees of the Serada
Ranganathan Endowment for Library Science (SRELS) for providing
me with the opportunity to deliver the Serada Ranganathan
Endowment Lectures 2010. In particular, I am grateful to Professor
I.K. Ravichandra Rao, Documentation Research and Training Centre,
Indian Statistical Institute, for his warm support prior to and during
my visit and valuable suggestions preparing this document. I also wish
to thank Professor A. Neelameghen, SRELS, and Professor K.S.
Raghavan, Documentation Research and Training Centre, Indian
Statistical Institute, for their helpful input during my lecturing. I am
also very thankful to Dr. K.N. Prasad, Executive Officer, SRELS, for
all the support he has given me. Finally, I wish to express my
appreciation to the many students for their constant eagerness and
helpfulness.
PETER INGWERSEN
Professor Emeritus, D.Ph.h.c.
Royal School of Library and Information Science
Copenhagen, Denmark
P. Ingwersen. Scientometric Indicators and Webometrics – and the Polyrepresentation
Principle in IR, 90 p, New Delhi; Bangalore, India, ESS ESS Publications, 2012. (Sarada
Ranganathan Endowment Lectures; Nr. 28)
5
About the Author
Peter Ingwersen is Professor Emeritus (2010) from the Royal
School of Library and Information Science (RSLIS), Copenhagen,
Denmark, where he served as Professor of Information Science from
2001. Currently he working as Affiliate Professor at the Oslo
University College, Norway and is also Visiting Professor at Abo
Akademi University, Turku, Finland.
Professor Ingwersen was born in 1947 and became lecturer at
RSLIS in 1973, after graduation from the School in the same year. He
obtained his Ph.D. degree 1991 from Copenhagen Business School,
Faculty of Economics, Institute of Informatics and Management with
a doctoral dissertation on Intermediary Functions in Information
Retrieval Interaction. In May 2010 he was awarded the degree D. Ph.
Honoris Causa by the Information Science Faculty of University of
Tampere, Finland.
Until 1982 he lectured on information storage and retrieval,
cataloguing and indexing theory and carried out research on cognitive
aspects of information seeking and retrieval. 1982-84 he joined the
online service staff of the Information Retrieval Service, the European
Space Agency (ESA-IRS), Frascati, Italy, as ESA Research Fellow.
His R&D activities were concerned with user-system interface
improvements, the development of a new family of online support and
retrieval tools, like the Zoom/RANK command facility, as well as
systems management.
Back at RSLIS as Associate Professor from 1984, he worked in a
new department dealing with IRM and design of specialized
information services and systems for industry and institutions. As the
driving force behind the curriculum development of the M.Sc.
program in Library and Information Science at RSLIS he was
appointed head of this program 1990-93. From July 1993 he became
Head of the Department of Information Retrieval Theory, in 1999
merged with Department of Information Studies. He was senior
P. Ingwersen. Scientometric Indicators and Webometrics – and the Polyrepresentation
Principle in IR, 90 p, New Delhi; Bangalore, India, ESS ESS Publications, 2012. (Sarada
Ranganathan Endowment Lectures; Nr. 28)
6
researcher at the Centre for Informetric Studies (CIS), RSLIS, 1996-
2000. From January 2001 he became Research Professor, and was
called as Full professor at that department, specializing in Information
Seeking, Interactive Information Retrieval, and
Informetrics/Webometrics. Retired from RSLIS in August 2010 as
Professor Emeritus.
During the Spring-term 1987 he served as Visiting Professor at
Rutgers University, NJ, USA, invited by the School of
Communication, Information and Library Studies. He has been
Visiting Scholar at Keio University, Tokyo, Japan, 1996 and at
University of Pretoria, Republic of South Africa, 1997, one month
respectively. In 1999-2002 he served as Visiting Professor at the
Department of Information Studies, Tampere University, Finland,
sponsored by the Nordic Research Academy (Norfa), now named
NORDFORSK. He was invited as Visiting Scholar by Shanghai
Library and China Academy of Science, the Documentation and
Information Center, Shanghai in August, 2003 – and once again in
2008. He is member of the Advisory Board of the International
Collaborative Academy of Library and Information Science (ICALIS),
Wuhan University, from 2008.
From January 1997 he is appointed and serves as Affiliate
Professor (Docent) at Åbo Akademi University, Department of
Information Studies, Turku, Finland and from October 2010 he is
called as Professor II at Oslo University College, Norway, with 20 %
academic duties.
Among his published works are several research monographs on
information retrieval, as well as more than 100 peer reviewed journal,
conference and book articles on information science, curriculum
development, information systems design, informetrics, including
research evaluation and Webometric analyses, and, in particular, on
integrated cognitive approaches to interactive IR theory. Together
with the late Thomas Almind he coined the notion of Webometrics,
signifying the quantitative studies of the WWW. He has contributed
articles on information science and retrieval to the Encyclopedia of
Library and Information Science, USA, 1995 and 2010. His first
P. Ingwersen. Scientometric Indicators and Webometrics – and the Polyrepresentation
Principle in IR, 90 p, New Delhi; Bangalore, India, ESS ESS Publications, 2012. (Sarada
Ranganathan Endowment Lectures; Nr. 28)
7
monograph, Information Retrieval Interaction, 1992, has sold more
than 2000 copies worldwide and is also published in Japanese
translation, 1995, as well as in Korean, 1998 and Persian, 2010. It is
available free on the web from 2002, and has been visited almost
17,000 times.
Together with Academy Professor Kalervo Järvelin, Tampere
University, Finland, he published in 2005 by Springer his most recent
monograph: The Turn: Integration of Information Seeking and
Retrieval in Context, which has been translated into Chinese by
ISTIC, Beijing, 2007 and Japanese by Maruzen Publishers, 2008.
His is currently engaged in a variety of research evaluation
studies and in the I-Search Project at RSLIS concerned with integrated
retrieval and the research developments of polyrepresentation
principle.
As expert consultant he has served in several ESPRIT projects on
the design of knowledge-based IR interfaces and systems, and
participated in the development of the information system of the
Danish Parliament. Professor Ingwersen served as EU reviewer on
ESPRIT and Basic Research (LTR) projects (SIMPR; FERMI), and he
participated in the three-year ESPRIT Long Term Research
consortium (MIRA) developing evaluation methods for interactive
multi-media retrieval, sponsored by the EU Commission.
He has been Chair or member of three international university
departmental research assessment committees, most recently as panel
member at the departmental and centre evaluation 2008 of CWTS,
Leiden University, The Netherlands. Since 1993 he has been member
of 18 professorial evaluation committees and official external
examiner at 18 doctoral examinations.
Since 2000 professor Ingwersen has supervised 7 doctoral theses
on interactive IR, Citation-based IR, Webometrics and Small World
phenomena, Thesaurus design & use, Collaborative information
seeking and Informetric methods applied to thesaurus design as well
as on Museum taxonomies for cultural heritage. He has supervised
long-term visiting Chinese, Japanese, Spanish and UK post-doctoral
P. Ingwersen. Scientometric Indicators and Webometrics – and the Polyrepresentation
Principle in IR, 90 p, New Delhi; Bangalore, India, ESS ESS Publications, 2012. (Sarada
Ranganathan Endowment Lectures; Nr. 28)
8
and doctoral researchers and visiting professors. From 1998 he has
organized several one and two-week international doctoral research
courses, on Information Seeking and Retrieval (ISR) and Informetrics,
sponsored by the Nordic Academy of Research (NORFA), and has
participated in several Nordic and EU sponsored PhD courses and
summer schools (e.g. ESSIR from 1999).
He was member of the Standing Executive Committees of the
NORFA-sponsored research network for Information Studies:
NORDISNet 1998-2002 with 1.5 Mill. NOK, the ensuing Nordic
research school, NORSLIS, 2004-2008, sponsored by NordForsk with
1 Mill NOK/year, and the South African research educational network
1998-2000 sponsored by DANIDA with 2.6 Mill. DKK.
As Conference Chairman he organized the 15th ACM-SIGIR
Conference on R&D in Information Retrieval, held in Copenhagen,
June 1992, and co-chaired the CoLIS 2-4 Conferences on Conceptions
of Library and Information Science, held in Copenhagen, 1996,
Dubrovnik, Croatia, 1999, and Seattle, USA, 2002. Since 1989 he is
member of the ACM-SIGIR international Program Committee, and
served as its EU Program Chair 1995 and 2000. He was member of
the editorial board of Journal of Documentation 1990-2001, and is
currently board member of the Journal of American Society of
Information Science and Technology (JASIST), Scientometrics,
Journal of Informetrics, Information Processing & Management,
Chinese Journal of Science & Technology Information, South African
Journal of Library and Information Science, and the electronic journal
Cybermetrics.
Professor Ingwersen has received several awards and research
medals. He received the Jason Farradane Award, 1993 from the
Institute of Information Scientists, UK. In 1994 he received the
American Society for Information Science/New Jersey Distinguished
Lectureship Award, and in 2003 the distinguished American Society
for Information Science & Technology (ASIS&T) Research Award,
for his work on the cognitive approach to Information Retrieval. In
2005 he was honored by the Thomson Award of excellence in
Denmark, being the most highly internationally cited Danish
P. Ingwersen. Scientometric Indicators and Webometrics – and the Polyrepresentation
Principle in IR, 90 p, New Delhi; Bangalore, India, ESS ESS Publications, 2012. (Sarada
Ranganathan Endowment Lectures; Nr. 28)
9
researcher in the social sciences. That same year he received the
prestigious Derek De Solla Price Award, selected by the international
peers in Scientometrics and Informetrics. In 2007 ASIS&T awarded
him the Outstanding Information Science Teacher Award. In 2009 the
Los Angeles Chapter of ASIS&T awarded him with the Contributions
to Information Science and Technology Award (CISTA). Among his
invited lectures and key-notes worldwide are the Anne V. Marinelli
Lecture Series, Texas Woman's University, 1992 as well as the
Lazarow Memorial Lecture twice: 1) The Information School,
University of Washington, Seattle, 2002, and 2) University of
Tennessee, 2009, sponsored by Thomson Reuters and the Eugene
Garfield Foundation.
P. Ingwersen. Scientometric Indicators and Webometrics – and the Polyrepresentation
Principle in IR, 90 p, New Delhi; Bangalore, India, ESS ESS Publications, 2012. (Sarada
Ranganathan Endowment Lectures; Nr. 28)
10
INTRODUCTION
Don Swanson, the former Dean of the famous Chicago School of
Library and Information Science, once told me that I was lucky to be
dealing with both interactive Information Retrieval (IR) and
Bibliometrics. Like he himself had done I might profit from the many
interesting information structures and methodologies known from the
latter when pursuing research in the former. This is one of the reasons
why I did chose to mix presentations of Scientometric indicators and
Webometric analyses, with a lecture on polyrepresentation in IR.
A mathematical bridge exists between informetric analyses and
IR: Bradford’s Law adhering to the former and Zipf’s Law, the basis
for automatic indexing in IR, are closely related regularities of
frequency rank distributions. Other central statistical models are also
in common, for instance, the vector space and cosine models applied
to author co-citation (and other kinds of) mapping in scientometrics
and as retrieval principles in IR. Most obvious is the PageRank Web
search algorithm by Brin and Page (1998). PageRank in Google and
similar retrieval models in other web search engines are partly based
on the assumption that web links are ‘like’ academic citations: the
more inlinks a webpage obtains and the ‘better’ or more ‘recognized’
it is – the higher it should be placed on the retrieval ranking. Since
PageRank is iterative a self-reinforcing mechanism assures that a page
linked to from webpages with a high PageRank also obtains a high
PageRank. This algorithm is mathematically nice and successful in
web engines for known-item and fact searching – but the underlying
assumption is false. Links are not ‘like’ academic citations (or
references) and a high PageRank does not assure a high level of
topical or situational ‘relevance’ as understood in IR. In the same way
‘many citations’ do not necessarily assure usefulness or pertinence of
documents retrieved and sorted by citations, e.g. as done in Google
Scholar or Web of Science. In fact, how to apply academic citations in
IR is not well understood.
In my lectures I will only sporadically deal with web search
engines, and then only for the purpose of Webometric analyses.
P. Ingwersen. Scientometric Indicators and Webometrics – and the Polyrepresentation
Principle in IR, 90 p, New Delhi; Bangalore, India, ESS ESS Publications, 2012. (Sarada
Ranganathan Endowment Lectures; Nr. 28)
11
However, the reasons why I connect Scientometrics (and the
informetric sub-field of Webometrics) with IR in my lectures are
three-fold:
1. Information Retrieval techniques are mandatory for carrying out
data capturing for Scientometric (and Webometric) analyses.
2. All representations of documents, their features and their
relationships, also known from informetrics, are potentially useful
in IR – including citations (to documents); references (from
documents); particular content elements and features like anchor
texts, terms, other content keys, metadata, etc. representing
documents, and vice versa; link structures;
(co-)authorships; journal (and other carrier) names; etc.
3. New social utility tools and representations, known from Web 2.0
applications and IR in social media, also provide novel and
potentially forceful indicators of use.
Common IR techniques are well known in the Scientometric
research community, whether in traditional online domain-based
searching (Christensen and Ingwersen, 1997), in Web of Science or
Scopus (Moed, 2005), Google Scholar (Jacso, 2008) or on the Web in
general (Thelwall et al., 2005).
The first two lectures do not deal with such techniques, but with
the specialized information derived from searching dedicated
Scientometric and Webometric indicator analysis and calculation. In
particular the social utility representations, such as data captured on
rating, recommendation or social tagging of information entities,
Webpage visits and downloads or topic density in blogs, etc., have
great potential as elements of novel often Web-based indicators
(Elleby and Ingwersen, 2010).
The third lecture, however, explicitly takes up the principle of
polyrepresentation (2005; 2009; 2010), which makes use of the variety
of representations of documents and document features, including
references and citations, with the purpose of improving IR
performance.
P. Ingwersen. Scientometric Indicators and Webometrics – and the Polyrepresentation
Principle in IR, 90 p, New Delhi; Bangalore, India, ESS ESS Publications, 2012. (Sarada
Ranganathan Endowment Lectures; Nr. 28)
12
Lecture 1 is titled “Scientometric Indicators – Into Open Access
and Publication Points for Research Evaluation”. It attempts first to
outline fundamental models for scientific communication, which
increasingly include open access to information but also demonstrate
higher complexity as to quality separation. This is followed by
outlining and exemplification of central publication and citation
indicators, including typical Crown Indicators. Samples are from large
developing countries like India and China as well as from small
developed countries like Denmark and Switzerland. The so-called
“publication point” indicator applied to the distribution of the
governmental financial support to R&D in Norway and Denmark is
described and compared to citation impact for a multidisciplinary
research institution.
Lecture 2, “The Range of Webometrics – Forms of Digital Social
Utility as Tools”, deals with the definition of Webometric analysis and
link terminology. It demonstrates selected analyses of search engine
performance, the Web Impact Factor and its draw backs, comparisons
between links and references (citations), and exemplifies social utility
tools by presenting new indicators for scientific (biodiversity) dataset
usage and blog analysis
Lecture 3 is named “Polyrepresentation – Bridging Laboratory
Information Retrieval and User Context”. Initially it defines the
conception and principle of polyrepresentation and describes its
underlying hypothesis. The lecture then outlines the empirical
evidence behind the principle from two perspectives. One approach
discusses evidence from experiments that are not explicitly based on
the principle, but carried out in other theoretical contexts. The second
perspective analyses the evidence from experiments and studies,
which are explicitly founded on the principle of polyrepresentation.
We distinguish between polyrepresentation of the information space,
the IR interaction process and the cognitive space, and point to
possible future research scenarios.

P. Ingwersen. Scientometric Indicators and Webometrics – and the Polyrepresentation
Principle in IR, 90 p, New Delhi; Bangalore, India, ESS ESS Publications, 2012. (Sarada
Ranganathan Endowment Lectures; Nr. 28)
13
LECTURE 1
P. Ingwersen. Scientometric Indicators and Webometrics – and the Polyrepresentation
Principle in IR, 90 p, New Delhi; Bangalore, India, ESS ESS Publications, 2012. (Sarada
Ranganathan Endowment Lectures; Nr. 28)
14
SCIENTOMETRIC INDICATORS: Into OPEN ACCESS and
PUBLICATION POINTS for RESEARCH EVALUATION
In this lecture I will first outline the two basic models of
scientific communication: the traditional pre-Internet model
and the more complex open access (OA) and Internet-based
model. This is followed by a discussion and exemplification
of selected central publication and citation-based indicators
for research evaluation, including the so-called Crown
Indicators. The lecture ends with a discussion of the recent
development of the so-called Publication (success) Point
Indicators – the Scandinavian Bibliometric Indicator – and
how it may correspond to citation impact in a real research
institution, leading to a combined point-and-citation impact
indicator. The lecture is complementary to that by I.K.
Ravichandra Rao (2008).
SCIENTIFIC COMMUNICATION
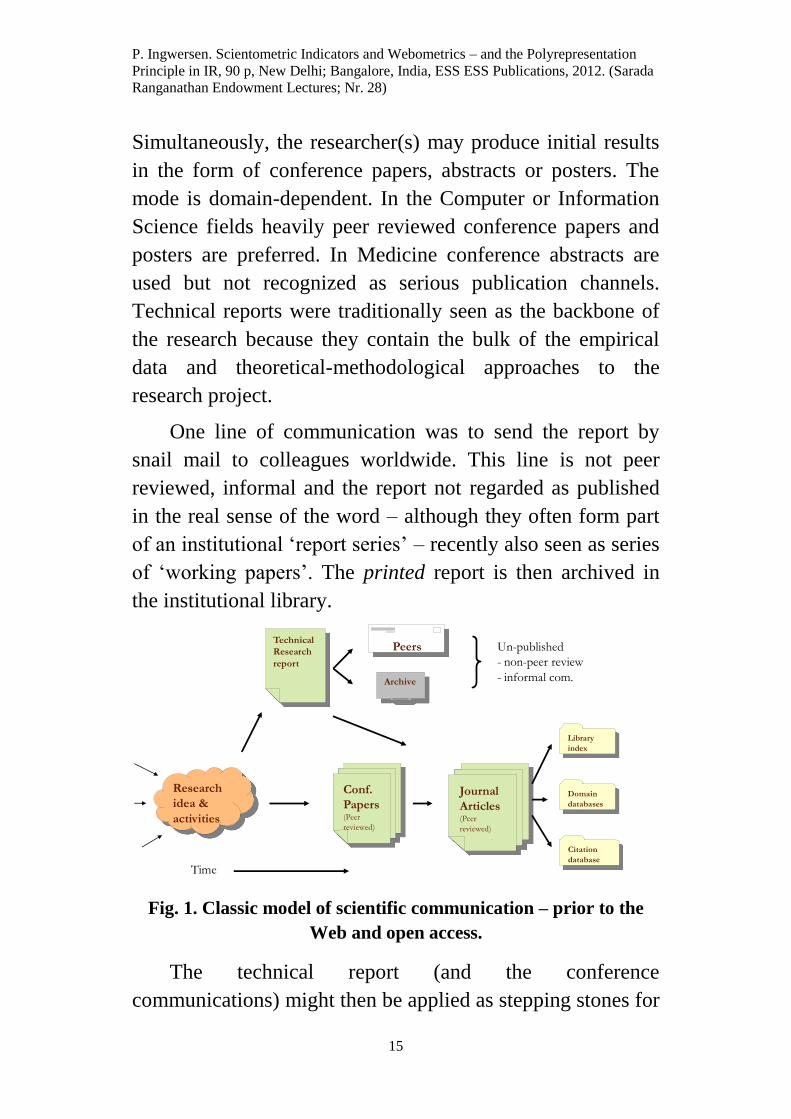
The traditional or ‘classic’ model of scientific
communication (De Solla Price) in the sciences and some
social sciences can be outlined in Fig. 1. To the left the
research idea and efforts surface, which may take years to
fulfill. During that period or at the end the classic model
commonly incorporates a technical report stage.
P. Ingwersen. Scientometric Indicators and Webometrics – and the Polyrepresentation
Principle in IR, 90 p, New Delhi; Bangalore, India, ESS ESS Publications, 2012. (Sarada
Ranganathan Endowment Lectures; Nr. 28)
15
Simultaneously, the researcher(s) may produce initial results
in the form of conference papers, abstracts or posters. The
mode is domain-dependent. In the Computer or Information
Science fields heavily peer reviewed conference papers and
posters are preferred. In Medicine conference abstracts are
used but not recognized as serious publication channels.
Technical reports were traditionally seen as the backbone of
the research because they contain the bulk of the empirical
data and theoretical-methodological approaches to the
research project.
One line of communication was to send the report by
snail mail to colleagues worldwide. This line is not peer
reviewed, informal and the report not regarded as published
in the real sense of the word – although they often form part
of an institutional ‘report series’ – recently also seen as series
of ‘working papers’. The printed report is then archived in
the institutional library.
Fig. 1. Classic model of scientific communication – prior to the
Web and open access.
The technical report (and the conference
communications) might then be applied as stepping stones for
Research
idea &
activities
Technical
Research
report
Peers
Archive
Conf.
Papers(Peer
reviewed)
Journal
Articles(Peer
reviewed)
Library
index
Domain
databases
Citation
database
Time
Un-published
- non-peer review
- informal com.
P. Ingwersen. Scientometric Indicators and Webometrics – and the Polyrepresentation
Principle in IR, 90 p, New Delhi; Bangalore, India, ESS ESS Publications, 2012. (Sarada
Ranganathan Endowment Lectures; Nr. 28)
16
journal article submissions. The time frame might easily be
1-2 years after the project ended prior to publication of the
first peer reviewed journal article from the research project.
When published the full text can be read in the journal itself.
The only access to the article would be through poor
metadata in a library index or more rich (and costly) domain
databases that include abstracts. Finally, citation databases
such as Thomson-Reuter’s ISI Science Citation Index (SCI)
or the Social Science Citation Index (SSCI) might index the
article, if the publishing journal is regarded central to a
research field by ISI. Approximately 25 % of the global peer
reviewed journals are indexed in the ISI citation databases
(Ulrich).
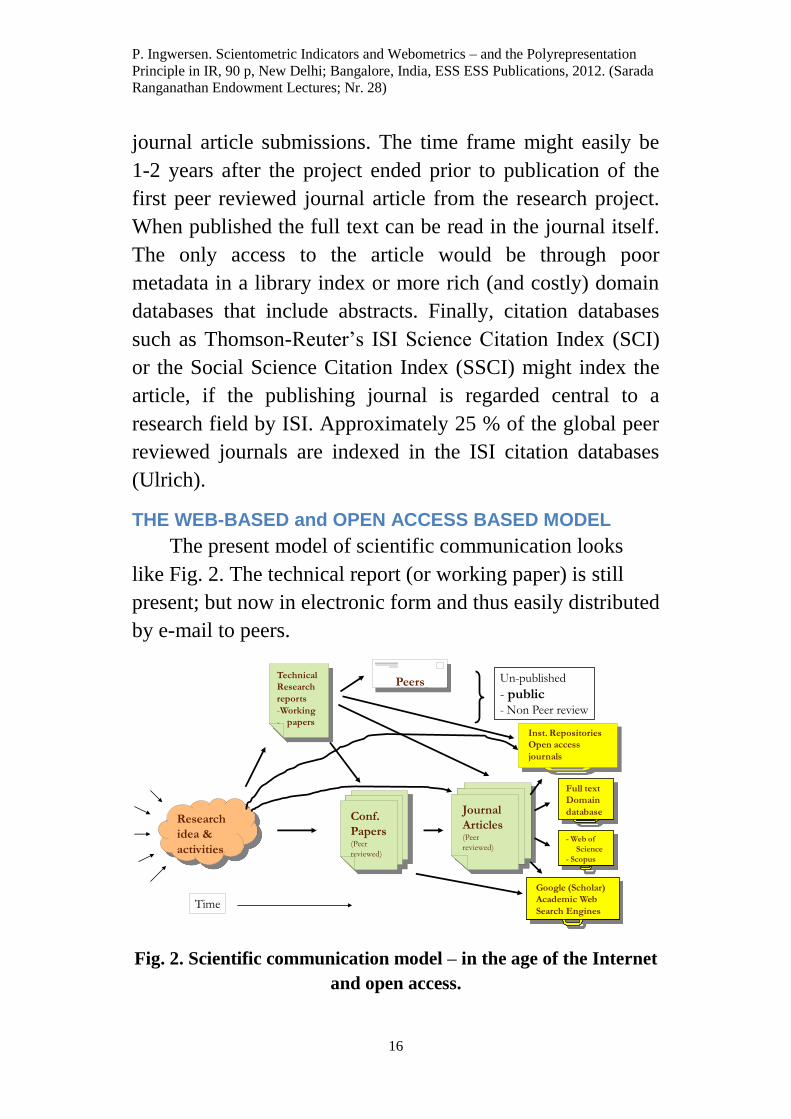
THE WEB-BASED and OPEN ACCESS BASED MODEL
The present model of scientific communication looks
like Fig. 2. The technical report (or working paper) is still
present; but now in electronic form and thus easily distributed
by e-mail to peers.
Fig. 2. Scientific communication model – in the age of the Internet
and open access.
Research
idea &
activities
Technical
Research
reports
-Working
- papers
Peers
Inst. Repositories
Open access
journals
Conf.
Papers(Peer
reviewed)
Journal
Articles(Peer
reviewed)
Time
Un-published
- public- Non Peer review
Full text
Domain
database
- Web of
Science
- Scopus
Google (Scholar)
Academic Web
Search Engines
P. Ingwersen. Scientometric Indicators and Webometrics – and the Polyrepresentation
Principle in IR, 90 p, New Delhi; Bangalore, India, ESS ESS Publications, 2012. (Sarada
Ranganathan Endowment Lectures; Nr. 28)
17
Like previously the report is not peer reviewed and
unpublished but albeit public and often accessible in full text
through an electronic institutional repository. In contrast to
the era prior to the Internet the research activities may lead to
immediate publications in peer reviewed OA journals, which
commonly have a shorter reviewing and publication period
compared to more traditional printed journals. Owing to OA
principles the full text article can be legally stored also in the
institutional repositories. The article may potentially be
accessible through several repositories, depending on the
authors’ institutional affiliations.
One may still see research reports and conference
communications used as stepping stones for journal article
submissions; but increasingly the direct line of
communication is preferred by scientists. The end product
(after acceptance and formal publication) is a full text article
or conference paper/poster available through the repositories,
the domain-related databases, such as arXiv.org (Physics;
Computer Science), Medline or PubMed (Health Sciences),
the citation databases (Web of Science and Scopus), or
through the Web search engines, like Google (Scholar or
Books), Yahoo or Bing.
In the Humanities and some Social Science fields the
traditional model of communication prevails although the
digitized possibility of publication is available. Commonly
the monograph is the preferred vehicle of communication,
replacing the conference papers and journal articles, and
technical reports do rarely exist. Blindfolded peer reviewing
is not common; if carried out reviewing is instead done by
journal or book series editors. Access to the monographic
contents is difficult because commonly still only scarce
P. Ingwersen. Scientometric Indicators and Webometrics – and the Polyrepresentation
Principle in IR, 90 p, New Delhi; Bangalore, India, ESS ESS Publications, 2012. (Sarada
Ranganathan Endowment Lectures; Nr. 28)
18
metadata through library records are used as access points.
Increasingly monographic materials can be found through
Google Books and in institutional repositories; but the
coverage is less and more uncertain compared to the other
vehicles of academic communication.
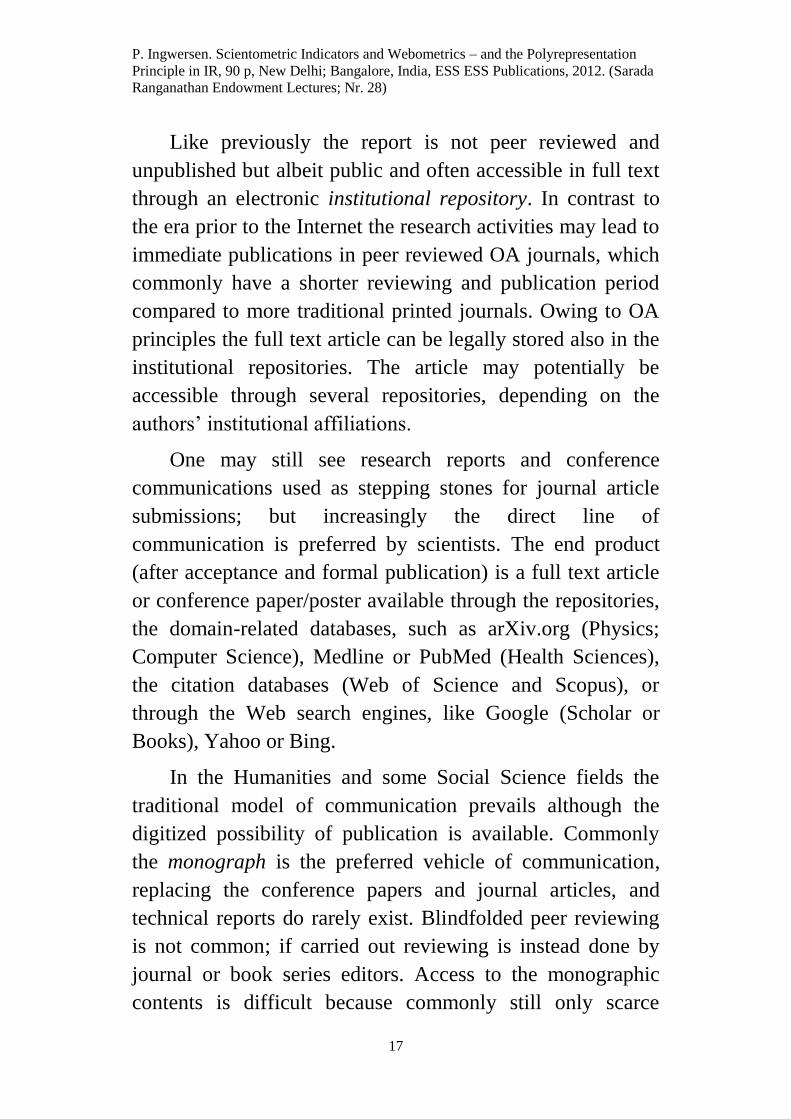
Because an increasing amount of produced information
is in digitized format, scientific and non-scientific
information become mixed together in repositories, databases
and on the Web (Allen) (Jepsen). Fig. 3 outlines a typical
selection of document types that makes future scientometric
analyses cumbersome.
The diagram separates the information into two different
kinds: Qualified knowledge sources (domain dependent) –
the right-hand side; and sources with degrees of (academic)
confidence assigned to them.
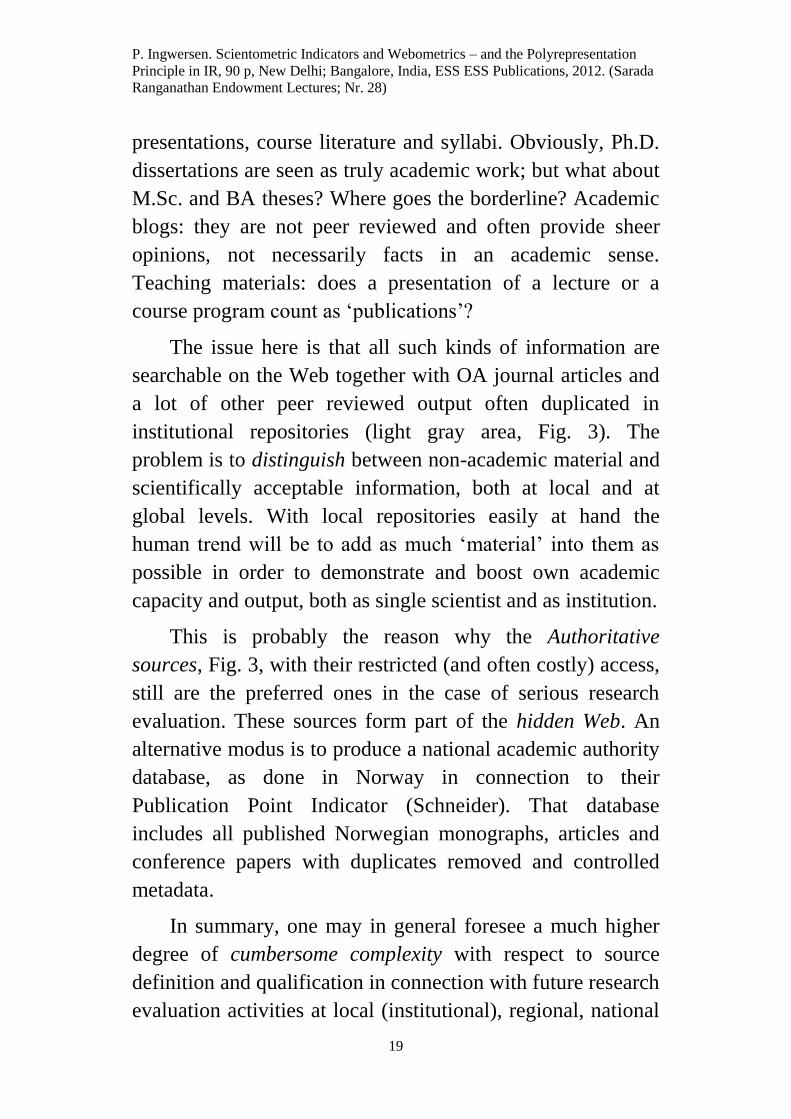
Fig. 3. The typical mixture of scientifically authoritative and
qualified knowledge sources and more dubious information from
a scientific stand.
The latter sources contain student theses at various
levels; academic blogs; non-peer reviewed working papers
and reports; teaching materials, like power point
Blogs …
Teaching material
Working papers
Research reports
Student output
Searchable on Open Web
Conference Papers
Posters, Abstracts (peer reviewed)
Collaboratory round tables
Open Access- Journals (peer reviewed)
- Inst. Repositories
(Duplicates/versions)
Partly searchable on Open Web
Confidence in information source?
Qualified knowledge source
(Domain dependent )
Restricted
Access- Journal articles
(peer reviewed)
Authoritative source
Restricted Access- Research Monographs
(peer reviewed)
P. Ingwersen. Scientometric Indicators and Webometrics – and the Polyrepresentation
Principle in IR, 90 p, New Delhi; Bangalore, India, ESS ESS Publications, 2012. (Sarada
Ranganathan Endowment Lectures; Nr. 28)
19
presentations, course literature and syllabi. Obviously, Ph.D.
dissertations are seen as truly academic work; but what about
M.Sc. and BA theses? Where goes the borderline? Academic
blogs: they are not peer reviewed and often provide sheer
opinions, not necessarily facts in an academic sense.
Teaching materials: does a presentation of a lecture or a
course program count as ‘publications’?
The issue here is that all such kinds of information are
searchable on the Web together with OA journal articles and
a lot of other peer reviewed output often duplicated in
institutional repositories (light gray area, Fig. 3). The
problem is to distinguish between non-academic material and
scientifically acceptable information, both at local and at
global levels. With local repositories easily at hand the
human trend will be to add as much ‘material’ into them as
possible in order to demonstrate and boost own academic
capacity and output, both as single scientist and as institution.
This is probably the reason why the Authoritative
sources, Fig. 3, with their restricted (and often costly) access,
still are the preferred ones in the case of serious research
evaluation. These sources form part of the hidden Web. An
alternative modus is to produce a national academic authority
database, as done in Norway in connection to their
Publication Point Indicator (Schneider). That database
includes all published Norwegian monographs, articles and
conference papers with duplicates removed and controlled
metadata.
In summary, one may in general foresee a much higher
degree of cumbersome complexity with respect to source
definition and qualification in connection with future research
evaluation activities at local (institutional), regional, national
P. Ingwersen. Scientometric Indicators and Webometrics – and the Polyrepresentation
Principle in IR, 90 p, New Delhi; Bangalore, India, ESS ESS Publications, 2012. (Sarada
Ranganathan Endowment Lectures; Nr. 28)
20
and global levels. Current and future information
professionals will have a great responsibility in association
with proper indexing of and distinction between the
increasing variety information types and carriers.
PUBLICATION ANALYSIS – EXAMPLES
This section exemplifies some central publication
indicators of the many in existence at present. A
comprehensive discussion of publication analysis and
indicators is provided by Moed (2005). In general publication
analysis serves the purpose of counting qualified scientific
publications in academic fields or disciplines (when defined),
Fig. 3; in countries, regions, universities, departments,
research groups; or over particular vehicles, like journals or
datasets, and over selected periods in the form of time series.
Other kinds of document representations may also be
analyzed, e.g. co-author density, international cooperation or
acknowledgements.
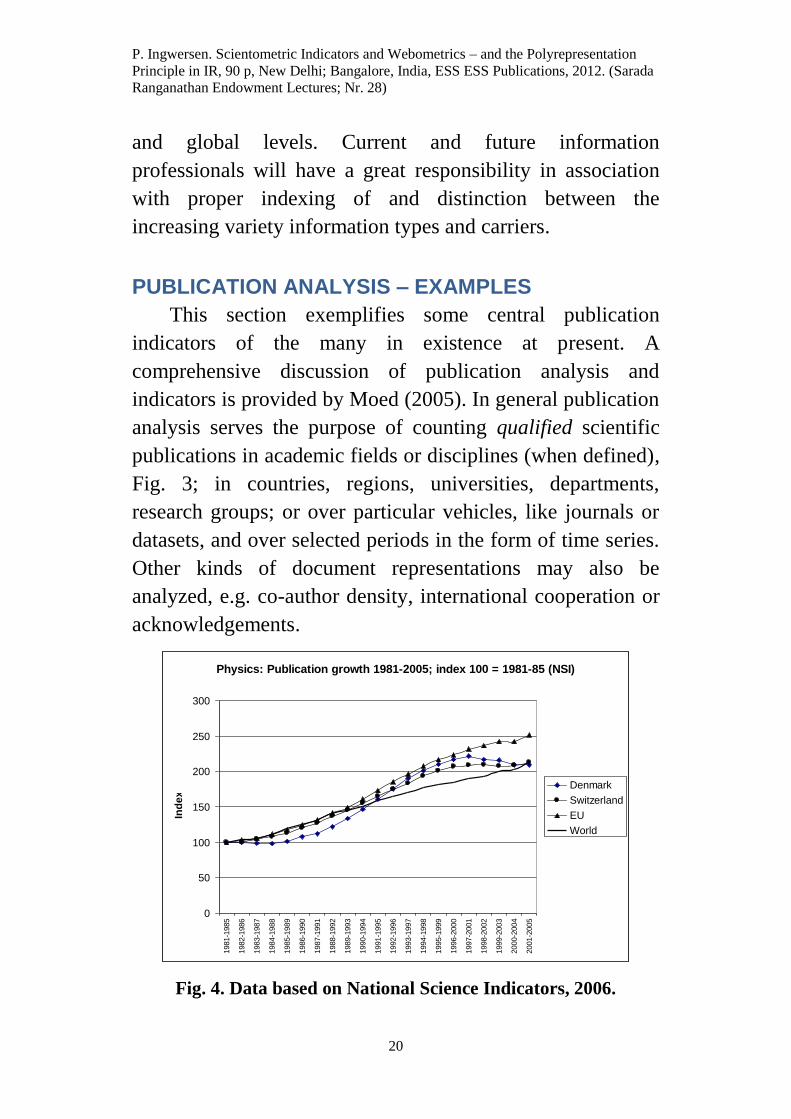
Fig. 4. Data based on National Science Indicators, 2006.
Physics: Publication growth 1981-2005; index 100 = 1981-85 (NSI)
0
50
100
150
200
250
300
1981-1
985
1982-1
986
1983-1
987
1984-1
988
1985-1
989
1986-1
990
1987-1
991
1988-1
992
1989-1
993
1990-1
994
1991-1
995
1992-1
996
1993-1
997
1994-1
998
1995-1
999
1996-2
000
1997-2
001
1998-2
002
1999-2
003
2000-2
004
2001-2
005
Ind
ex
Denmark
Switzerland
EU
World
P. Ingwersen. Scientometric Indicators and Webometrics – and the Polyrepresentation
Principle in IR, 90 p, New Delhi; Bangalore, India, ESS ESS Publications, 2012. (Sarada
Ranganathan Endowment Lectures; Nr. 28)
21
The output of publication analyses is quite descriptive in
nature. However, more analytic and informative rank
distributions are possible to create, based on the publication
data (Rao, 2008). Such distributions may cover most
productive countries, institutions, research groups or journals
in a field, resulting in Bradford-like exponential distributions
with typical ‘long tails’ (se Dataset ref). Other distributions
take the form of time series, e.g. for comparative publication
growth in Physics 1981-2005, Fig. 4.
We observe, Fig. 4, how the global (USA-dominated)
and EU productivity are steadily growing whilst the Swiss
(CERN) and Danish (Niels Bohr Institute) growth have
stagnated or is falling in the 2000-05 period. Physicists
maintain that they are awaiting the new ultra-large cyclotron
at CERN to start its activities. This demonstrates that the
analytic results often can only be explained by the domain
experts (the researchers) themselves, not by informetricians!
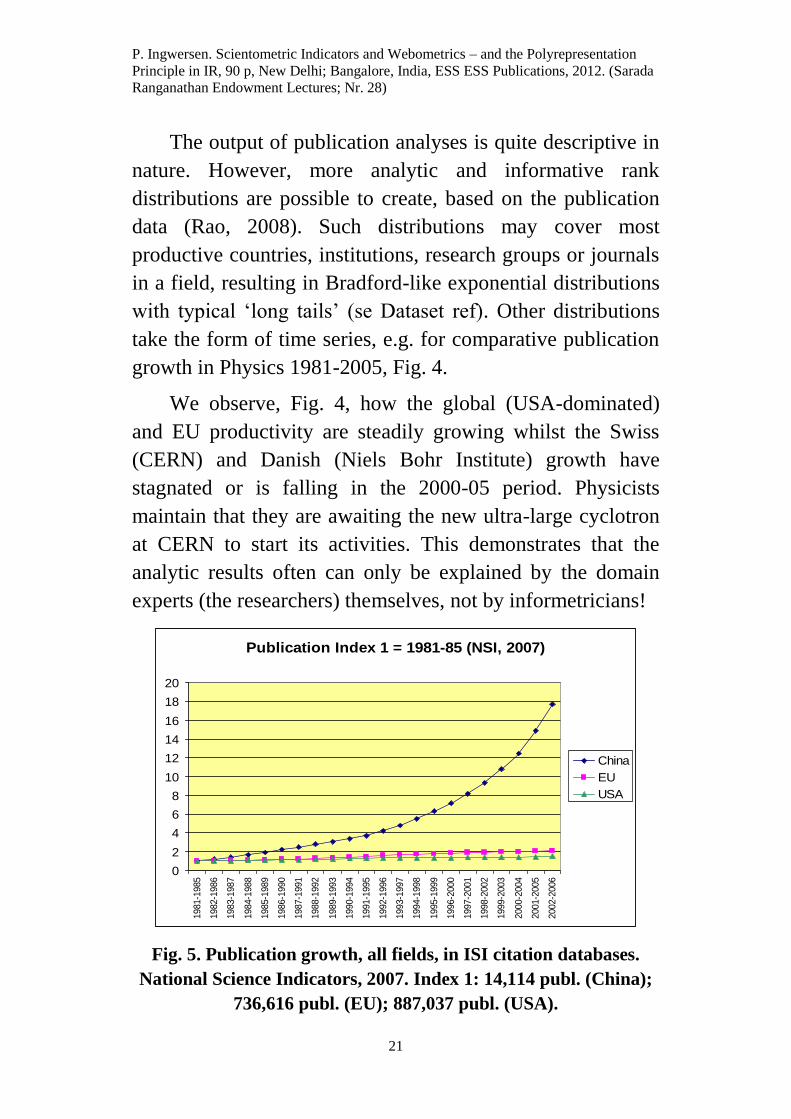
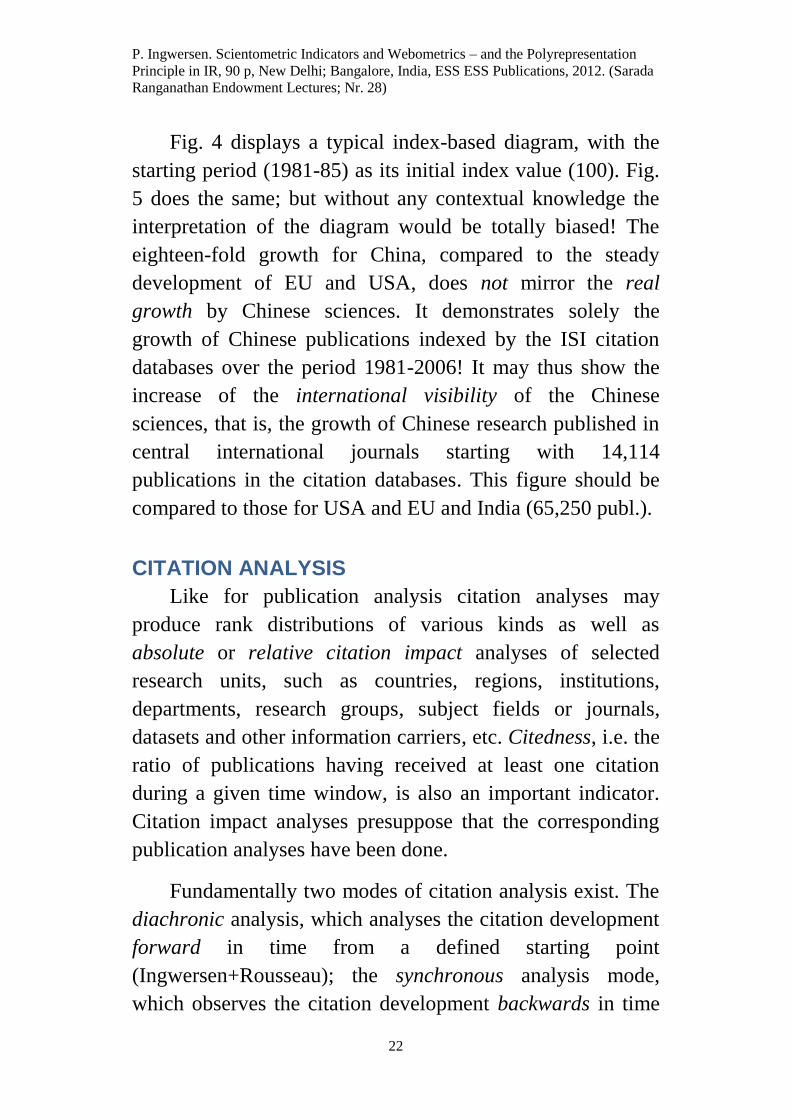
Fig. 5. Publication growth, all fields, in ISI citation databases.
National Science Indicators, 2007. Index 1: 14,114 publ. (China);
736,616 publ. (EU); 887,037 publ. (USA).
Publication Index 1 = 1981-85 (NSI, 2007)
0
2
4
6
8
10
12
14
16
18
20
1981-1
985
1982-1
986
1983-1
987
1984-1
988
1985-1
989
1986-1
990
1987-1
991
1988-1
992
1989-1
993
1990-1
994
1991-1
995
1992-1
996
1993-1
997
1994-1
998
1995-1
999
1996-2
000
1997-2
001
1998-2
002
1999-2
003
2000-2
004
2001-2
005
2002-2
006
China
EU
USA
P. Ingwersen. Scientometric Indicators and Webometrics – and the Polyrepresentation
Principle in IR, 90 p, New Delhi; Bangalore, India, ESS ESS Publications, 2012. (Sarada
Ranganathan Endowment Lectures; Nr. 28)
22
Fig. 4 displays a typical index-based diagram, with the
starting period (1981-85) as its initial index value (100). Fig.
5 does the same; but without any contextual knowledge the
interpretation of the diagram would be totally biased! The
eighteen-fold growth for China, compared to the steady
development of EU and USA, does not mirror the real
growth by Chinese sciences. It demonstrates solely the
growth of Chinese publications indexed by the ISI citation
databases over the period 1981-2006! It may thus show the
increase of the international visibility of the Chinese
sciences, that is, the growth of Chinese research published in
central international journals starting with 14,114
publications in the citation databases. This figure should be
compared to those for USA and EU and India (65,250 publ.).
CITATION ANALYSIS
Like for publication analysis citation analyses may
produce rank distributions of various kinds as well as
absolute or relative citation impact analyses of selected
research units, such as countries, regions, institutions,
departments, research groups, subject fields or journals,
datasets and other information carriers, etc. Citedness, i.e. the
ratio of publications having received at least one citation
during a given time window, is also an important indicator.
Citation impact analyses presuppose that the corresponding
publication analyses have been done.
Fundamentally two modes of citation analysis exist. The
diachronic analysis, which analyses the citation development
forward in time from a defined starting point
(Ingwersen+Rousseau); the synchronous analysis mode,
which observes the citation development backwards in time
P. Ingwersen. Scientometric Indicators and Webometrics – and the Polyrepresentation
Principle in IR, 90 p, New Delhi; Bangalore, India, ESS ESS Publications, 2012. (Sarada
Ranganathan Endowment Lectures; Nr. 28)
23
from a given starting point. Diachronic citation analysis is
applied to the Crown Indicators discussed below. The well-
known Journal Impact Factor (JIF), published annually by the
Journal Citation Report as a part of Web of Science
(Thomson-Reuters), is an example of a synchronous analysis:
the number of citations received by a journal in year Y from
all other sources to the articles, notes and review articles
published by that journal in years Y-1 plus Y-2.
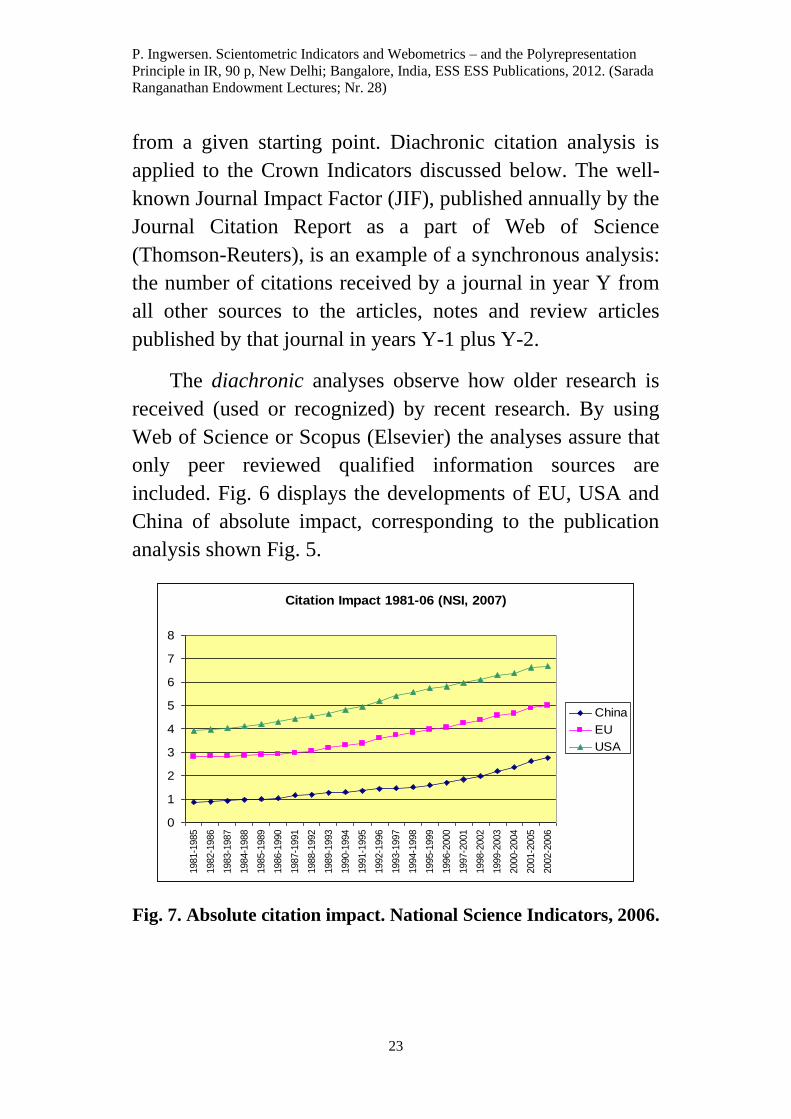
The diachronic analyses observe how older research is
received (used or recognized) by recent research. By using
Web of Science or Scopus (Elsevier) the analyses assure that
only peer reviewed qualified information sources are
included. Fig. 6 displays the developments of EU, USA and
China of absolute impact, corresponding to the publication
analysis shown Fig. 5.
Fig. 7. Absolute citation impact. National Science Indicators, 2006.
Citation Impact 1981-06 (NSI, 2007)
0
1
2
3
4
5
6
7
8
1981-1
985
1982-1
986
1983-1
987
1984-1
988
1985-1
989
1986-1
990
1987-1
991
1988-1
992
1989-1
993
1990-1
994
1991-1
995
1992-1
996
1993-1
997
1994-1
998
1995-1
999
1996-2
000
1997-2
001
1998-2
002
1999-2
003
2000-2
004
2001-2
005
2002-2
006
China
EU
USA
P. Ingwersen. Scientometric Indicators and Webometrics – and the Polyrepresentation
Principle in IR, 90 p, New Delhi; Bangalore, India, ESS ESS Publications, 2012. (Sarada
Ranganathan Endowment Lectures; Nr. 28)
24
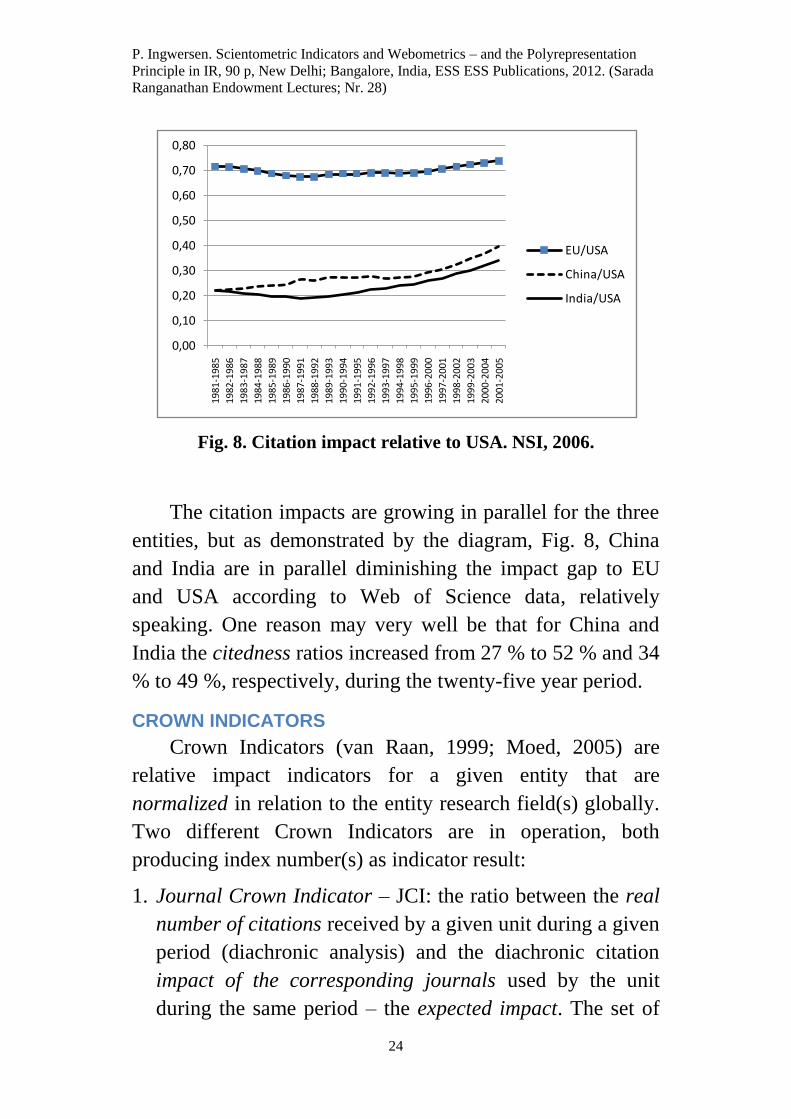
Fig. 8. Citation impact relative to USA. NSI, 2006.
The citation impacts are growing in parallel for the three
entities, but as demonstrated by the diagram, Fig. 8, China
and India are in parallel diminishing the impact gap to EU
and USA according to Web of Science data, relatively
speaking. One reason may very well be that for China and
India the citedness ratios increased from 27 % to 52 % and 34
% to 49 %, respectively, during the twenty-five year period.
CROWN INDICATORS
Crown Indicators (van Raan, 1999; Moed, 2005) are
relative impact indicators for a given entity that are
normalized in relation to the entity research field(s) globally.
Two different Crown Indicators are in operation, both
producing index number(s) as indicator result:
1. Journal Crown Indicator – JCI: the ratio between the real
number of citations received by a given unit during a given
period (diachronic analysis) and the diachronic citation
impact of the corresponding journals used by the unit
during the same period – the expected impact. The set of
0,00
0,10
0,20
0,30
0,40
0,50
0,60
0,70
0,80
1981
-198
5
1982
-198
6
1983
-198
7
1984
-198
8
1985
-198
9
1986
-199
0
1987
-199
1
1988
-199
2
1989
-199
3
1990
-199
4
1991
-199
5
1992
-199
6
1993
-199
7
1994
-199
8
1995
-199
9
1996
-200
0
1997
-200
1
1998
-200
2
1999
-200
3
2000
-200
4
2001
-200
5
EU/USA
China/USA
India/USA
P. Ingwersen. Scientometric Indicators and Webometrics – and the Polyrepresentation
Principle in IR, 90 p, New Delhi; Bangalore, India, ESS ESS Publications, 2012. (Sarada
Ranganathan Endowment Lectures; Nr. 28)
25
journals defines the exact research profile for which the
unit makes research;
2. Field Crown Indicator – FCI: the ratio between the real
number of citations received by a given unit during a given
period (diachronic analysis) and the global diachronic
citation impact weighted according to the research profile
(in terms of fields) displayed by the unit during the same
period:
Σc / Σ(C/Pfield x pfield ) – where c is the citations received
by the unit, C/Pfield signifies the global citation impact of a
research field of the unit’s research profile and pfield the
number of publications produced in that field by the unit.
In serious research evaluations one would never apply
the synchronous JIF mentioned above, mainly because it
signifies the average citation impact of the articles in a
journal for a very short period (1-2 years), and partly because
the JIF is only with difficulty comparable with other real
citation values.
Field Crown Shadow country
India, Research Profile 2001-05 India c/p Cits. Publ. Profile Global C/P Indicator Weighted Cits.
Agricultural & Plant Sc. 2001-2005 0.99 12941 13050 11.9 2.89 0.34 37763
Biology & Biochemistry 2001-2005 3.1 17469 5636 5.2 7.56 0.41 42625
Chemistry 2001-2005 2.78 70220 25228 23.2 4.28 0.65 107858
Clinical Medicine 2001-2005 2.28 23093 10123 9.3 5.40 0.42 54651
Computer Science 2001-2005 1.06 831 783 0.7 1.51 0.71 1178
Ecology/Environment 2001-2005 1.67 4400 2627 2.4 3.59 0.47 9444
Engineering 2001-2005 1.19 10405 8724 8.0 1.78 0.67 15532
Geosciences 2001-2005 1.76 5427 3081 2.8 3.40 0.51 10592
Immunology 2001-2005 3.69 2438 660 0.6 10.62 0.35 7009
Materials Science 2001-2005 1.86 14387 7724 7.1 2.54 0.73 19597
Mathematics 2001-2005 0.74 1064 1438 1.3 1.32 0.56 1905
Microbiology 2001-2005 3.26 5751 1764 1.6 6.90 0.47 12164
Molecular Biology & Genetics 2001-2005 4.73 5738 1214 1.1 12.63 0.37 15336
Multdisciplinary 2001-2005 1.36 4621 3404 3.1 4.48 0.30 15252
Neurosciences & Behavior 2001-2005 4.01 3132 782 0.7 7.88 0.51 6166
Pharmacology 2001-2005 2.51 6476 2583 2.4 5.01 0.50 12935
Physics & Space Sc. 2001-2005 3.02 57849 19132 17.6 4.12 0.73 78886
Social Sciences, general 2001-2005 0.9 846 940 0.9 1.99 0.45 1875
Ratio of Sums 2.27 247088 108893 100 4,69 0.48 450768
(Weighted) Field Crown Indicator: 247,088 / 450,767.59 = 0.55
P. Ingwersen. Scientometric Indicators and Webometrics – and the Polyrepresentation
Principle in IR, 90 p, New Delhi; Bangalore, India, ESS ESS Publications, 2012. (Sarada
Ranganathan Endowment Lectures; Nr. 28)
26
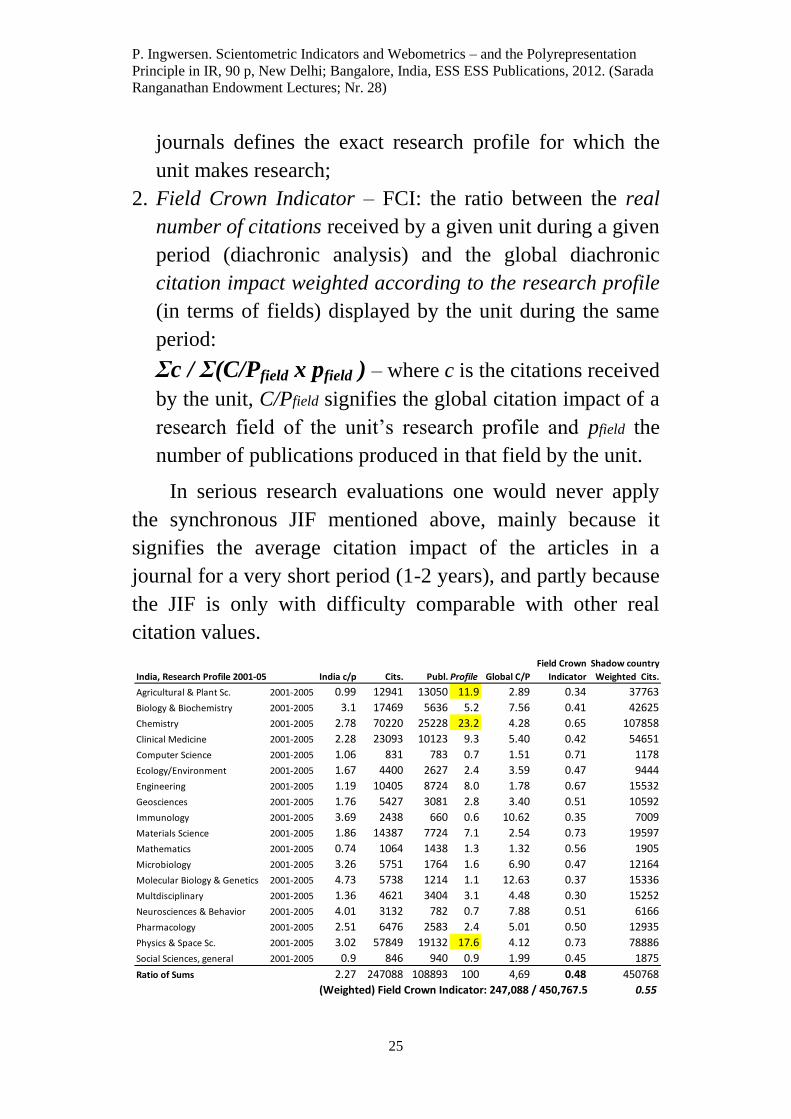
Fig. 9. Indian research profile of 18 fields with global field citation
impacts and the weighted expected Indian citations according to
number of publications. Gray areas are most research rich fields.
NSI, 2006.
Fig. 9 illustrates the comprehensive FCI calculation table
for a country. To the left the column outlines the 18 research
fields constituting the Indian profile, 2001-2005. Next are the
corresponding national field impact factors (c/p), the number
of citations and publications per field, and the research
profile given in percent of the total research output. We
observe that in India three fields stand out: Chemistry (23.2
%); Physics & Space Sciences (17.6 %); and Agriculture &
Plant Sciences (11.9 %). Also Engineering is a research rich
field (8 %).
The Global field impact (C/P per field) is followed by
the corresponding FCI per field for India, with Physics &
Space Sciences having the highest FCI (.73). The last column
named “Shadow country, weighted Cits.” demonstrates the
result of the calculation of the expected number of citations
India should have had per field, given the Indian number of
publications per field and its Global field impact. As an
example, in Agriculture & Plant Sciences the actual number
of citations received by India is 12,941, but according to the
number of publications (13,050) and the Global impact (2.89)
India should have expected to obtain (13,050 x 2.89) =
37,763 citations. All the (weighted) expected citations are
then summed up and divided into the sum of the actual
citations received across all the fields in the Indian research
profile (247,088/450,768), providing the overall FCI for
India, 2001-2005, lower right-hand corner: index value .55.
P. Ingwersen. Scientometric Indicators and Webometrics – and the Polyrepresentation
Principle in IR, 90 p, New Delhi; Bangalore, India, ESS ESS Publications, 2012. (Sarada
Ranganathan Endowment Lectures; Nr. 28)
27
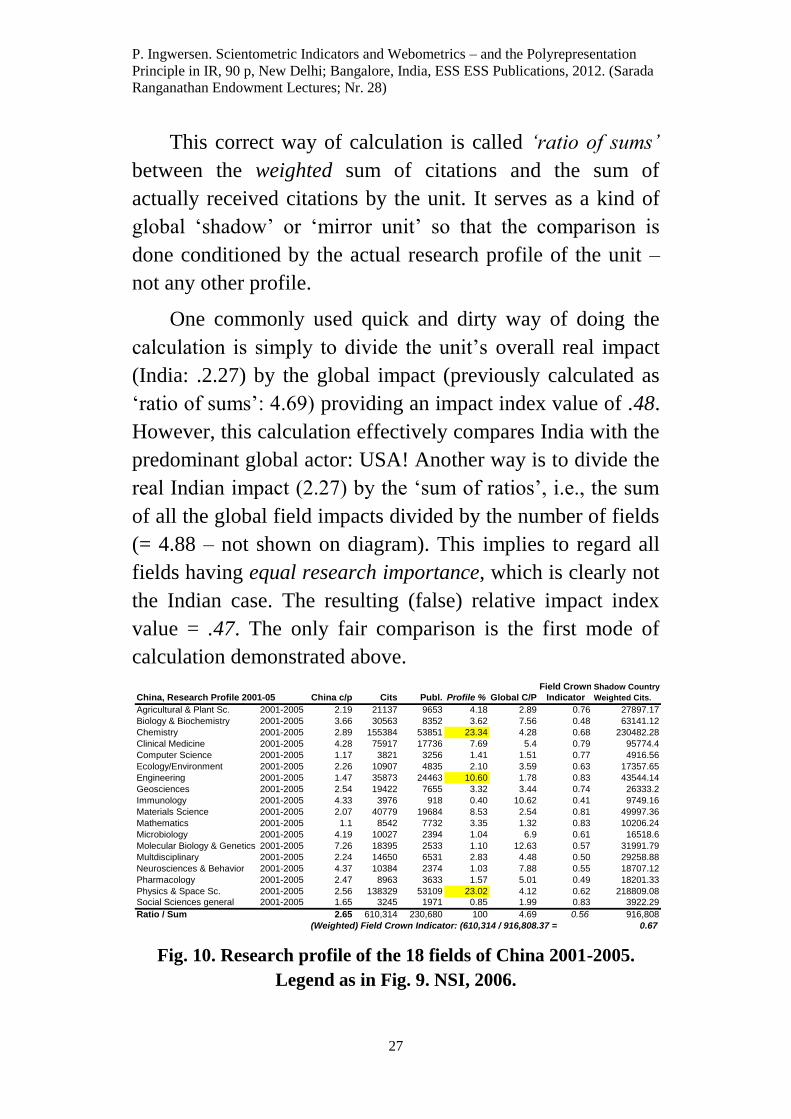
This correct way of calculation is called ‘ratio of sums’
between the weighted sum of citations and the sum of
actually received citations by the unit. It serves as a kind of
global ‘shadow’ or ‘mirror unit’ so that the comparison is
done conditioned by the actual research profile of the unit –
not any other profile.
One commonly used quick and dirty way of doing the
calculation is simply to divide the unit’s overall real impact
(India: .2.27) by the global impact (previously calculated as
‘ratio of sums’: 4.69) providing an impact index value of .48.
However, this calculation effectively compares India with the
predominant global actor: USA! Another way is to divide the
real Indian impact (2.27) by the ‘sum of ratios’, i.e., the sum
of all the global field impacts divided by the number of fields
(= 4.88 – not shown on diagram). This implies to regard all
fields having equal research importance, which is clearly not
the Indian case. The resulting (false) relative impact index
value = .47. The only fair comparison is the first mode of
calculation demonstrated above.
Fig. 10. Research profile of the 18 fields of China 2001-2005.
Legend as in Fig. 9. NSI, 2006.
Field Crown Shadow Country
China, Research Profile 2001-05 China c/p Cits Publ. Profile % Global C/P Indicator Weighted Cits.
Agricultural & Plant Sc. 2001-2005 2.19 21137 9653 4.18 2.89 0.76 27897.17
Biology & Biochemistry 2001-2005 3.66 30563 8352 3.62 7.56 0.48 63141.12
Chemistry 2001-2005 2.89 155384 53851 23.34 4.28 0.68 230482.28
Clinical Medicine 2001-2005 4.28 75917 17736 7.69 5.4 0.79 95774.4
Computer Science 2001-2005 1.17 3821 3256 1.41 1.51 0.77 4916.56
Ecology/Environment 2001-2005 2.26 10907 4835 2.10 3.59 0.63 17357.65
Engineering 2001-2005 1.47 35873 24463 10.60 1.78 0.83 43544.14
Geosciences 2001-2005 2.54 19422 7655 3.32 3.44 0.74 26333.2
Immunology 2001-2005 4.33 3976 918 0.40 10.62 0.41 9749.16
Materials Science 2001-2005 2.07 40779 19684 8.53 2.54 0.81 49997.36
Mathematics 2001-2005 1.1 8542 7732 3.35 1.32 0.83 10206.24
Microbiology 2001-2005 4.19 10027 2394 1.04 6.9 0.61 16518.6
Molecular Biology & Genetics 2001-2005 7.26 18395 2533 1.10 12.63 0.57 31991.79
Multdisciplinary 2001-2005 2.24 14650 6531 2.83 4.48 0.50 29258.88
Neurosciences & Behavior 2001-2005 4.37 10384 2374 1.03 7.88 0.55 18707.12
Pharmacology 2001-2005 2.47 8963 3633 1.57 5.01 0.49 18201.33
Physics & Space Sc. 2001-2005 2.56 138329 53109 23.02 4.12 0.62 218809.08
Social Sciences general 2001-2005 1.65 3245 1971 0.85 1.99 0.83 3922.29
Ratio / Sum 2.65 610,314 230,680 100 4.69 0.56 916,808
(Weighted) Field Crown Indicator: (610,314 / 916,808.37 = 0.67
P. Ingwersen. Scientometric Indicators and Webometrics – and the Polyrepresentation
Principle in IR, 90 p, New Delhi; Bangalore, India, ESS ESS Publications, 2012. (Sarada
Ranganathan Endowment Lectures; Nr. 28)
28
This is also demonstrated quite forcefully by Fig. 10. In
China’s case we observe that their research profile is different
from that of India (and that of Denmark, Fig. 11): Agriculture
& Plant sciences do not play an important role. Although the
Global citation impact per field is the same as for India, Fig.
9, the ‘weighted cits.’ column display quite different amounts
of expected citations for China compared to India. This is
owing to the different research profile and the different
number of publications in the fields between the two
countries. Finally, we again observe that the overall FCI for
China (.67) is higher than the crude USA-dominated
calculation (.56). This is because the Chinese research
profile, like that of India, is very different from the global
USA dominated profile. Comparing India and China we
observe that only in Physics & Space Sciences does India
display a higher FCI (.73 vs. .62).
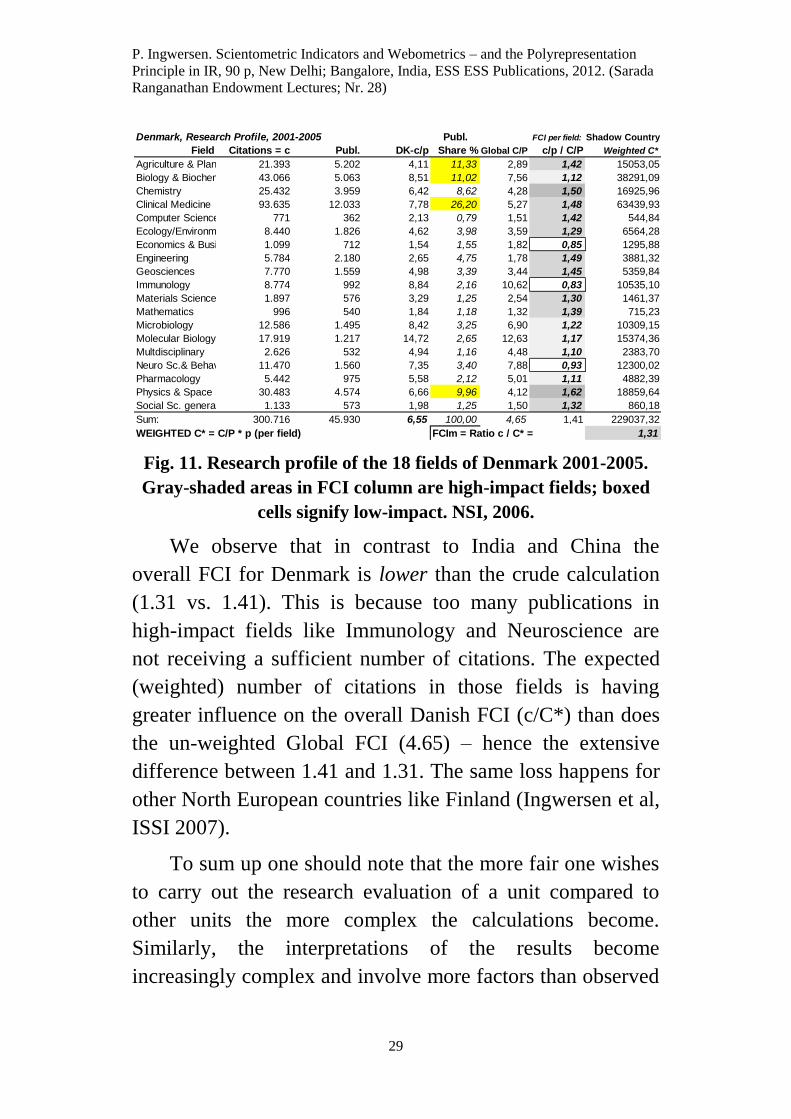
Fig. 11 show a typical case for a small West-European
country, Denmark. The research profile is very different from
those of India and China, with a very heavy focus on Clinical
Medicine (26.2 %) and less on Agriculture & Plant Sciences
(11.3 %), Biology (11 %) and Physics & Space Sciences (10
%).
P. Ingwersen. Scientometric Indicators and Webometrics – and the Polyrepresentation
Principle in IR, 90 p, New Delhi; Bangalore, India, ESS ESS Publications, 2012. (Sarada
Ranganathan Endowment Lectures; Nr. 28)
29
Fig. 11. Research profile of the 18 fields of Denmark 2001-2005.
Gray-shaded areas in FCI column are high-impact fields; boxed
cells signify low-impact. NSI, 2006.
We observe that in contrast to India and China the
overall FCI for Denmark is lower than the crude calculation
(1.31 vs. 1.41). This is because too many publications in
high-impact fields like Immunology and Neuroscience are
not receiving a sufficient number of citations. The expected
(weighted) number of citations in those fields is having
greater influence on the overall Danish FCI (c/C*) than does
the un-weighted Global FCI (4.65) – hence the extensive
difference between 1.41 and 1.31. The same loss happens for
other North European countries like Finland (Ingwersen et al,
ISSI 2007).
To sum up one should note that the more fair one wishes
to carry out the research evaluation of a unit compared to
other units the more complex the calculations become.
Similarly, the interpretations of the results become
increasingly complex and involve more factors than observed
Denmark, Research Profile, 2001-2005 Publ. FCI per field: Shadow Country
Field Citations = c Publ. DK-c/p Share % Global C/P c/p / C/P Weighted C*
Agriculture & Plant Sc. 21.393 5.202 4,11 11,33 2,89 1,42 15053,05
Biology & Biochemistry 43.066 5.063 8,51 11,02 7,56 1,12 38291,09
Chemistry 25.432 3.959 6,42 8,62 4,28 1,50 16925,96
Clinical Medicine 93.635 12.033 7,78 26,20 5,27 1,48 63439,93
Computer Science 771 362 2,13 0,79 1,51 1,42 544,84
Ecology/Environment 8.440 1.826 4,62 3,98 3,59 1,29 6564,28
Economics & Business 1.099 712 1,54 1,55 1,82 0,85 1295,88
Engineering 5.784 2.180 2,65 4,75 1,78 1,49 3881,32
Geosciences 7.770 1.559 4,98 3,39 3,44 1,45 5359,84
Immunology 8.774 992 8,84 2,16 10,62 0,83 10535,10
Materials Science 1.897 576 3,29 1,25 2,54 1,30 1461,37
Mathematics 996 540 1,84 1,18 1,32 1,39 715,23
Microbiology 12.586 1.495 8,42 3,25 6,90 1,22 10309,15
Molecular Biology & Genetics17.919 1.217 14,72 2,65 12,63 1,17 15374,36
Multdisciplinary 2.626 532 4,94 1,16 4,48 1,10 2383,70
Neuro Sc.& Behavior 11.470 1.560 7,35 3,40 7,88 0,93 12300,02
Pharmacology 5.442 975 5,58 2,12 5,01 1,11 4882,39
Physics & Space Sc. 30.483 4.574 6,66 9,96 4,12 1,62 18859,64
Social Sc. general 1.133 573 1,98 1,25 1,50 1,32 860,18
Sum: 300.716 45.930 6,55 100,00 4,65 1,41 229037,32
WEIGHTED C* = C/P * p (per field) FCIm = Ratio c / C* = 1,31
P. Ingwersen. Scientometric Indicators and Webometrics – and the Polyrepresentation
Principle in IR, 90 p, New Delhi; Bangalore, India, ESS ESS Publications, 2012. (Sarada
Ranganathan Endowment Lectures; Nr. 28)
30
on the surface. Hence the necessity to involve domain experts
in the process.
PUBLICATION POINT SYSTEMS – THE NORDIC MODEL
The citation impact calculations above demonstrate that
they are functional for the sciences and some selected social
sciences, namely the ones that are ‘science-like’, such as
Political Science, Organizational Science & Public
Administration, Economics & Business, Library and
Information Science, either because they are rather empirical
and/or international in nature or because their central
publication vehicles are journal articles and conference
papers.
However, the remaining social sciences, like Sociology,
and the fields of the humanities are difficult to handle outside
the English-dominated countries. This owes to their local or
regional scopes and their publication patterns, e.g., mainly in
the form of monographs and writing in the local language.
The observation of citations from and to monographs has
always posed problems for Informetrics. The citation indexes
are only lately increasingly incorporating German, Spanish
and French journals, conference proceedings and
monographs, like in Scopus and Google Scholar/Books. In
addition, the blind-folded peer reviewing process known
from the sciences and some social sciences is thus far
scarcely applied in the humanities.
In order to circumvent this unbalanced situation the
Norwegian government, and later the Danish one, decided to
apply ‘publication points’ as a measure for the distribution of
public research funding to their universities. For the Danish
P. Ingwersen. Scientometric Indicators and Webometrics – and the Polyrepresentation
Principle in IR, 90 p, New Delhi; Bangalore, India, ESS ESS Publications, 2012. (Sarada
Ranganathan Endowment Lectures; Nr. 28)
31
public research budget 2011 the following weighted
allocation model is used (weights in %):
Ph.D. degrees: 5 %;
Number of students: 45 %;
External funding: 35 %;
The ‘bibliometric indicator’: 15 %.
In 2012-13 the weight of the so-called ‘bibliometric
indicator’, based on the publication points, increases to 25 %,
taken from the student and external funding factors. The
indicator works in the following way for all publication types
that are peer reviewed across all academic fields, including
the humanities (Schneider 2009).
68 academic field committees were established in 2007-
08, each constituted by appointed field experts from the
various universities, thus covering the entire spectrum of
academia. Each committee selected the range of peer
reviewed journals, conferences and monographic publishers
applying peer review, pertaining to their field. A journal can
only be placed in one field according to the system. They
were supported by a dedicated journal database system with
an interface to add, delete or edit ISSN and journal titles from
the lists. Conferences and publishers were added manually by
the experts according to field. Only international and national
journals can be selected. Local institutional journals or series
are only qualified if more than half of the contents is from
outside the institution – it is then seen as a ‘national’ vehicle.
This resulted in a comprehensive list of approximately
19,000 journals. The equivalent list for Norway made a year
before was only covering 16,000 journals. This list is divided
into two levels: Level 2 journals (and monographic
P. Ingwersen. Scientometric Indicators and Webometrics – and the Polyrepresentation
Principle in IR, 90 p, New Delhi; Bangalore, India, ESS ESS Publications, 2012. (Sarada
Ranganathan Endowment Lectures; Nr. 28)
32
publishers), which are constituted by the core high-quality
journals covering maximum 1/5 of the publications
worldwide in that field. They are identified through peer
consensus in each committee. The idea is to push scientists to
publish in these Level 2 journals. The remaining journals
(publishers) constitute Level 1. An article from Level 2
obtains 3 points while a Level 1 item gets 1 point; conference
papers obtain .7 points and a Level 2 monograph receives 8
points. 5 points are given to Level 1 monographs. Editorial
work does not obtain points. (Bi)annual conferences are
regarded as journals and central high-quality conferences,
e.g. in Computer Science, will probably receive higher points
than stated here in the future. Fractional counting is applied
according to the weight of the author affiliations per item. All
fractionalized points are summed up per research institution.
The total amount of the Danish publication points based
on 2009 publications was 21,950 points allocated 19,900
publications, including patents. The Social Sciences and
Humanities took 3,850 and 3,100 points, respectively, whilst
the Sciences and Technology fields and the Health sciences
9,600 and 5,400 points, respectively.
In Norway a centralized database with all Norwegian
academic publications and their received points is made
public available. One may here observe and analyze in more
depth publication production over periods, institutions, fields
and observe behavioral patterns. In Denmark this tool has not
yet been achieved. Input is done in a more decentralized way
and only the overall point results at institutional and field
levels are publically available on the Web.
The publication points – or the ‘bibliometric indicator’ –
do not signify research quality but rather publication
P. Ingwersen. Scientometric Indicators and Webometrics – and the Polyrepresentation
Principle in IR, 90 p, New Delhi; Bangalore, India, ESS ESS Publications, 2012. (Sarada
Ranganathan Endowment Lectures; Nr. 28)
33
‘success’! The advantage is that only ‘one single’ indicator is
produced per research entity and that all academic fields are
included. The disadvantages are several: it is difficult to
compare the research output and impact directly between
universities or countries by means of the publication points,
as done with citation-based indicators, because their research
profiles are so different and normalization is cumbersome.
Obviously one may observe how many points each university
has obtained from the Level 2 journals of their research
fields, respectively, and then calculate a top-index value per
university – provided that the same point system is used for
all the entities. This leads to the publication point indicators
described below.
Another disadvantage lies on its misuse: One should not
apply the point systems at individual scientist level, since the
fractional counting makes teamwork less profitable. The
‘bibliometric indicator’ would be counterproductive if
applied within an institution. Unfortunately, one may foresee
that with a high probability, it will be used by individual
researchers against each other and by research administrators
against individual academics.
PUBLICATION POINT INDICATORS
Along the line of comparing the cumulated points
obtained by institutions in their top level journal publications,
as suggested above, Elleby and Ingwersen have proposed a
Normalized Publication Point Index – nPPI – and other
publication point indicators (2010). The contribution
“[compares] central citation-based indicators with novel
publication point indicators (PPIs) that are formalized and
exemplified. Two diachronic citation windows are applied:
2006-07 and 2006-08. Web of Science (WoS) as well as
P. Ingwersen. Scientometric Indicators and Webometrics – and the Polyrepresentation
Principle in IR, 90 p, New Delhi; Bangalore, India, ESS ESS Publications, 2012. (Sarada
Ranganathan Endowment Lectures; Nr. 28)
34
Google Scholar (GS) are applied to observe the cite delay and
citedness for the different document types published by DIIS,
the Danish Institute for International Studies, journal articles,
book chapters/conference papers and monographs.” (2010, p.
512)
Journal Crown Indicator calculations were based on
WoS. Three PPIs were proposed by Elleby and Ingwersen:
the Publication Point Ratio (PPR), which measures the sum
of obtained publication points over the sum of the ideal
points for the same set of documents; the Cumulated
Publication Point Indicator (CPPI), which graphically
illustrates the cumulated gain of actually obtained vs. ideal
points, both seen as vectors for the same publication types;
and the normalized Cumulated Publication Point Index
(nCPPI) that represents the cumulated gain of publication
success as index values, either graphically or as one overall
score for the institution under evaluation (Järvelin &
Kekäläinen, 2002; Järvelin & Persson, 2008).
As stated by Elleby and Ingwersen, (p. 512), “[the] case
study indicates that for smaller interdisciplinary research
institutions the cite delay is substantial (2-3 years to obtain a
citedness of 50 %) when applying WoS for articles. Applying
GS implies a shorter delay and much higher citedness for all
document types. Statistical significant correlations were only
found between WoS and GS and the two publication point
systems in between1, respectively. The study demonstrates
how the nCPPI can be applied to institutions as evaluation
tools supplementary to JCI in various combinations, in
particular when institutions include humanistic and social
science disciplines.” 1 Between the Norwegian/Danish system and a local DIIS publication point system.
P. Ingwersen. Scientometric Indicators and Webometrics – and the Polyrepresentation
Principle in IR, 90 p, New Delhi; Bangalore, India, ESS ESS Publications, 2012. (Sarada
Ranganathan Endowment Lectures; Nr. 28)
35
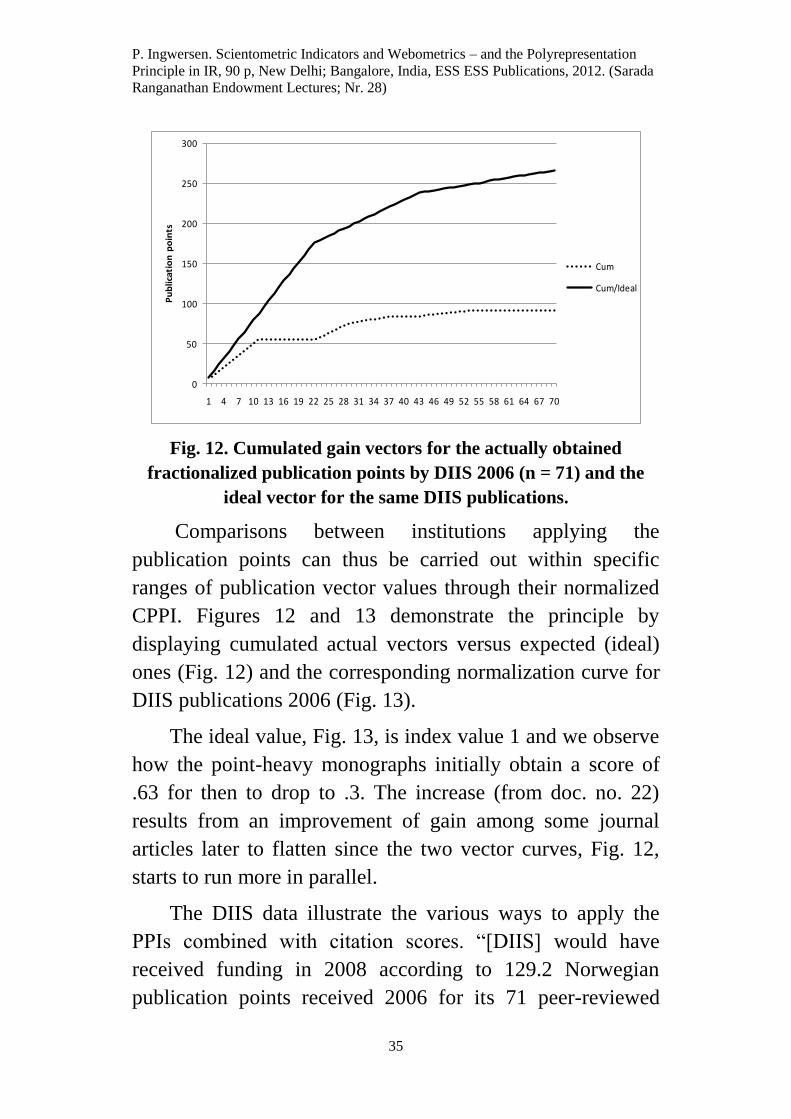
Fig. 12. Cumulated gain vectors for the actually obtained
fractionalized publication points by DIIS 2006 (n = 71) and the
ideal vector for the same DIIS publications.
Comparisons between institutions applying the
publication points can thus be carried out within specific
ranges of publication vector values through their normalized
CPPI. Figures 12 and 13 demonstrate the principle by
displaying cumulated actual vectors versus expected (ideal)
ones (Fig. 12) and the corresponding normalization curve for
DIIS publications 2006 (Fig. 13).
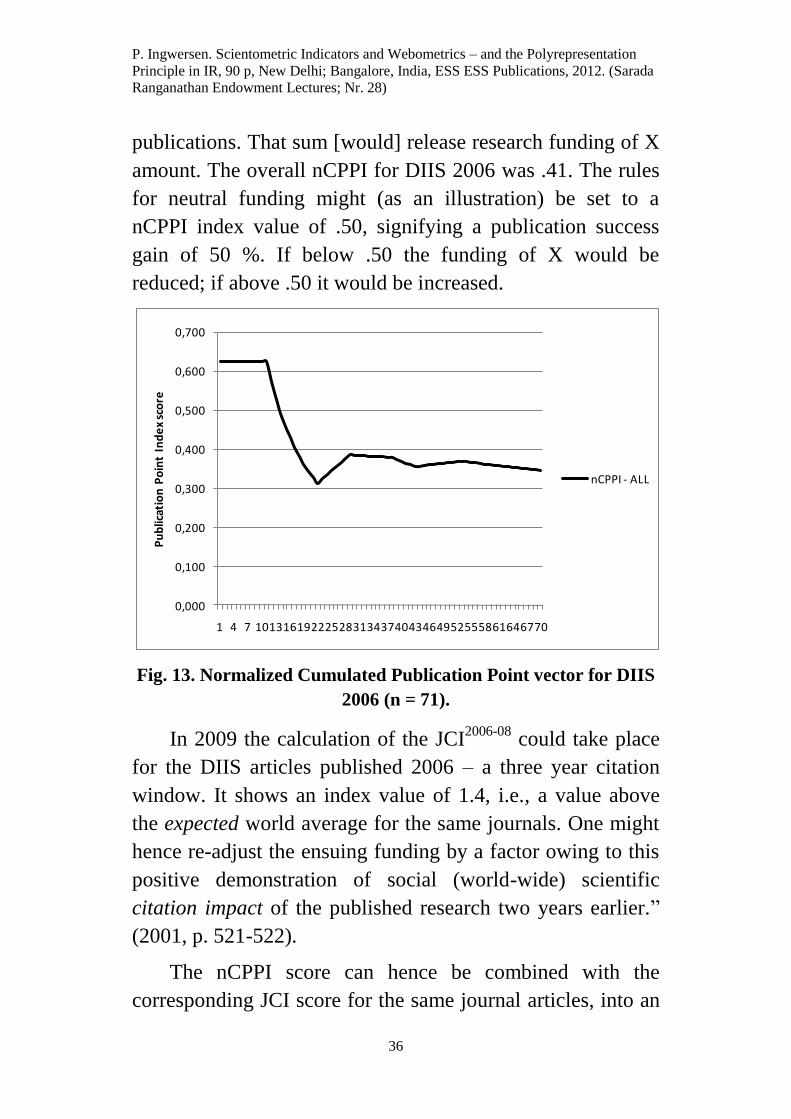
The ideal value, Fig. 13, is index value 1 and we observe
how the point-heavy monographs initially obtain a score of
.63 for then to drop to .3. The increase (from doc. no. 22)
results from an improvement of gain among some journal
articles later to flatten since the two vector curves, Fig. 12,
starts to run more in parallel.
The DIIS data illustrate the various ways to apply the
PPIs combined with citation scores. “[DIIS] would have
received funding in 2008 according to 129.2 Norwegian
publication points received 2006 for its 71 peer-reviewed
0
50
100
150
200
250
300
1 4 7 10 13 16 19 22 25 28 31 34 37 40 43 46 49 52 55 58 61 64 67 70
Pu
blic
atio
n p
oin
ts
Cum
Cum/Ideal
P. Ingwersen. Scientometric Indicators and Webometrics – and the Polyrepresentation
Principle in IR, 90 p, New Delhi; Bangalore, India, ESS ESS Publications, 2012. (Sarada
Ranganathan Endowment Lectures; Nr. 28)
36
publications. That sum [would] release research funding of X
amount. The overall nCPPI for DIIS 2006 was .41. The rules
for neutral funding might (as an illustration) be set to a
nCPPI index value of .50, signifying a publication success
gain of 50 %. If below .50 the funding of X would be
reduced; if above .50 it would be increased.
Fig. 13. Normalized Cumulated Publication Point vector for DIIS
2006 (n = 71).
In 2009 the calculation of the JCI2006-08
could take place
for the DIIS articles published 2006 – a three year citation
window. It shows an index value of 1.4, i.e., a value above
the expected world average for the same journals. One might
hence re-adjust the ensuing funding by a factor owing to this
positive demonstration of social (world-wide) scientific
citation impact of the published research two years earlier.”
(2001, p. 521-522).
The nCPPI score can hence be combined with the
corresponding JCI score for the same journal articles, into an
0,000
0,100
0,200
0,300
0,400
0,500
0,600
0,700
1 4 7 101316192225283134374043464952555861646770
Pu
blic
atio
n P
oin
t In
de
x sc
ore
nCPPI - ALL
P. Ingwersen. Scientometric Indicators and Webometrics – and the Polyrepresentation
Principle in IR, 90 p, New Delhi; Bangalore, India, ESS ESS Publications, 2012. (Sarada
Ranganathan Endowment Lectures; Nr. 28)
37
integrated score: γt = JCI
t x nCPPI
t – for t documents. If
DIIS is used as an illustration the 22 articles (n) received a
JCI index score for 2006-08 at 1.4. The same n documents
obtained a nCPPI score at .66.
As stated in Elleby and Ingwersen (2010, p.521-522),
“[the] exemplified γ-score .92 signifies that the DIIS impact
of the articles has been reduced to below 1.0 (the world
impact) because the cumulated publication gain for the same
articles was too small. Thus, there exists a trade-off between
the nCPPI score (0 – 1.0) and the JCI (≥ 0) value. A low
nCPPI score implies that too few journals applied by the unit
belonged to the higher level of the Publication Point system.
With a low nCPPI score the JCI value must be very high to
compensate if the final score should stay at world average.
With a large cumulated gain of publication success points,
e.g. a nCPPI score at .80 (signifying that 80 % of the ideal
gain has been obtained), the JCI for DIIS could be less (e.g.
1.25) to reach the integrated γ-score = 1.0. When nCPPI is
high it means that the major portion of the articles was
published in high-level journals obtaining the maximum
(ideal) amount of points available according to the
publication point system. If the γ-score in that case is below
1.0 that implies that the institution had great difficulty in
achieving the expected (high) world citation impact. Thus,
the nCPPI works similar to a Field Crown Indicator (van
Raan, 1999) which, when compared to the corresponding JCI,
shows the true impact level of the journals used.
There is indeed space for additional publication point
indicators. For instance, one may apply different document
cutoff positions (i) over long document lists from large
institutions, e.g. i100
; i200
; … in, in order to compare the
P. Ingwersen. Scientometric Indicators and Webometrics – and the Polyrepresentation
Principle in IR, 90 p, New Delhi; Bangalore, India, ESS ESS Publications, 2012. (Sarada
Ranganathan Endowment Lectures; Nr. 28)
38
cumulated publication success gain at the start of the
accumulation, where the index values supposedly are 1 or
close to one, and later across comparable institutions.
CONCLUSION
With open access we can foresee a nightmare as
concerns tracking qualified and authoritative scientific
publications, aside from the application of the citation
indexes. This situation owes to lack of bibliographic control
of what is original vs. parallel and spin-off versions and
simply opinionated documents over many institutional
repositories – and re-mixed on the web with all other
document types incl. blog entries and other Web 2.0
manifestations.
The peer reviewed publications are the central ones to
analyze – also when applying different kinds of citation-
based indicators, Crown Indicators or h-indexes. Publication
Point Indicators are indeed more current than citations,
mirroring last year’s productivity. But they solely state
something about publication success, not the quality of the
contents. However, as shown in this lecture Publication Point
Indicators can be combined with citation-based indicators,
e.g., the Journal Crown Indicator for corresponding sets of
journal articles. This integrated γ-score may be used to
compare across institutions and other entities given that the
same publication point system is used across the units. For
other document types than articles the nCPPI indicator may
work as a supplement to the γ-score.
The principle of comparing the real publication point
cumulated score with the ideal one for the same documents
derives from systems evaluation methods developed in
P. Ingwersen. Scientometric Indicators and Webometrics – and the Polyrepresentation
Principle in IR, 90 p, New Delhi; Bangalore, India, ESS ESS Publications, 2012. (Sarada
Ranganathan Endowment Lectures; Nr. 28)
39
Information Retrieval research (Järvelin & Kekäläinen, 2002;
Järvelin & Persson, 2008). With this knowledge transfer
across these two information science fields we observe once
again how they benefit from one another.
LECTURE 2
P. Ingwersen. Scientometric Indicators and Webometrics – and the Polyrepresentation
Principle in IR, 90 p, New Delhi; Bangalore, India, ESS ESS Publications, 2012. (Sarada
Ranganathan Endowment Lectures; Nr. 28)
40
The RANGE of WEBOMETRICS:
FORMS of DIGITAL SOCIAL UTILITY as TOOLS
Initially, this lecture puts Webometrics into the broader
context of Informetrics, Scientometrics, Cybermetrics and
Bibliometrics. Link structures and levels of importance for
Webometric analyses are outlined. We then proceed with an
overview of the potentials of Webometrics, ranging from
search engine and link analyses, including a discussion of the
Web Impact Factor (WIF) and the technical but false citation-
link association, over trend analysis using social utility tools
such as blogs, to a discussion of new scientific Dataset Usage
Indicators. The lecture ends with concluding remarks.
THE CONTEXT OF WEBOMETRICS
According to Björneborn and Ingwersen (2001; 2004)
Webometrics concerns the study of quantitative aspects of the
construction and use of information resources, structures and
technologies on the Web, drawing on bibliometric and
informetric methods:
Search engine performance
Link structures, e.g., Web Impact Factors, cohesiveness of
link topologies, etc.
Users’ information behaviour (searching, browsing, etc.)
Web page contents – knowledge mining – blog trends
Dataset analyses & impact
P. Ingwersen. Scientometric Indicators and Webometrics – and the Polyrepresentation
Principle in IR, 90 p, New Delhi; Bangalore, India, ESS ESS Publications, 2012. (Sarada
Ranganathan Endowment Lectures; Nr. 28)
41
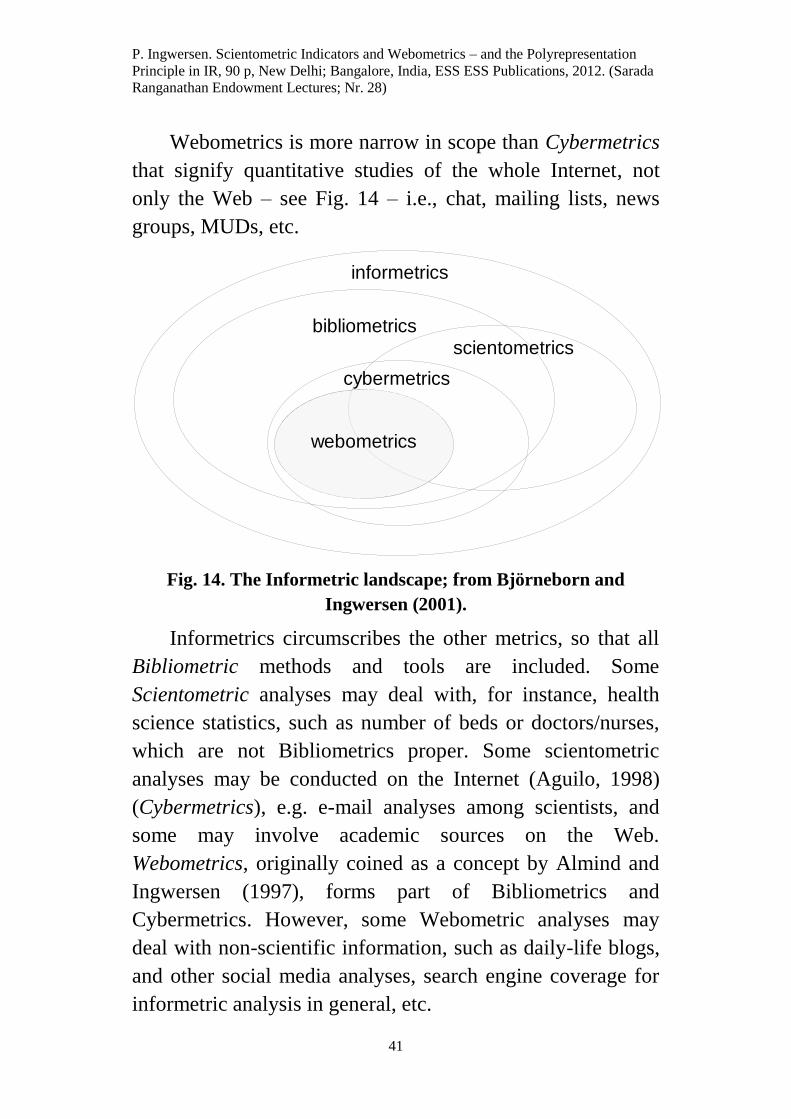
Webometrics is more narrow in scope than Cybermetrics
that signify quantitative studies of the whole Internet, not
only the Web – see Fig. 14 – i.e., chat, mailing lists, news
groups, MUDs, etc.
Fig. 14. The Informetric landscape; from Björneborn and
Ingwersen (2001).
Informetrics circumscribes the other metrics, so that all
Bibliometric methods and tools are included. Some
Scientometric analyses may deal with, for instance, health
science statistics, such as number of beds or doctors/nurses,
which are not Bibliometrics proper. Some scientometric
analyses may be conducted on the Internet (Aguilo, 1998)
(Cybermetrics), e.g. e-mail analyses among scientists, and
some may involve academic sources on the Web.
Webometrics, originally coined as a concept by Almind and
Ingwersen (1997), forms part of Bibliometrics and
Cybermetrics. However, some Webometric analyses may
deal with non-scientific information, such as daily-life blogs,
and other social media analyses, search engine coverage for
informetric analysis in general, etc.
informetrics
bibliometricsscientometrics
webometrics
cybermetrics
P. Ingwersen. Scientometric Indicators and Webometrics – and the Polyrepresentation
Principle in IR, 90 p, New Delhi; Bangalore, India, ESS ESS Publications, 2012. (Sarada
Ranganathan Endowment Lectures; Nr. 28)
42
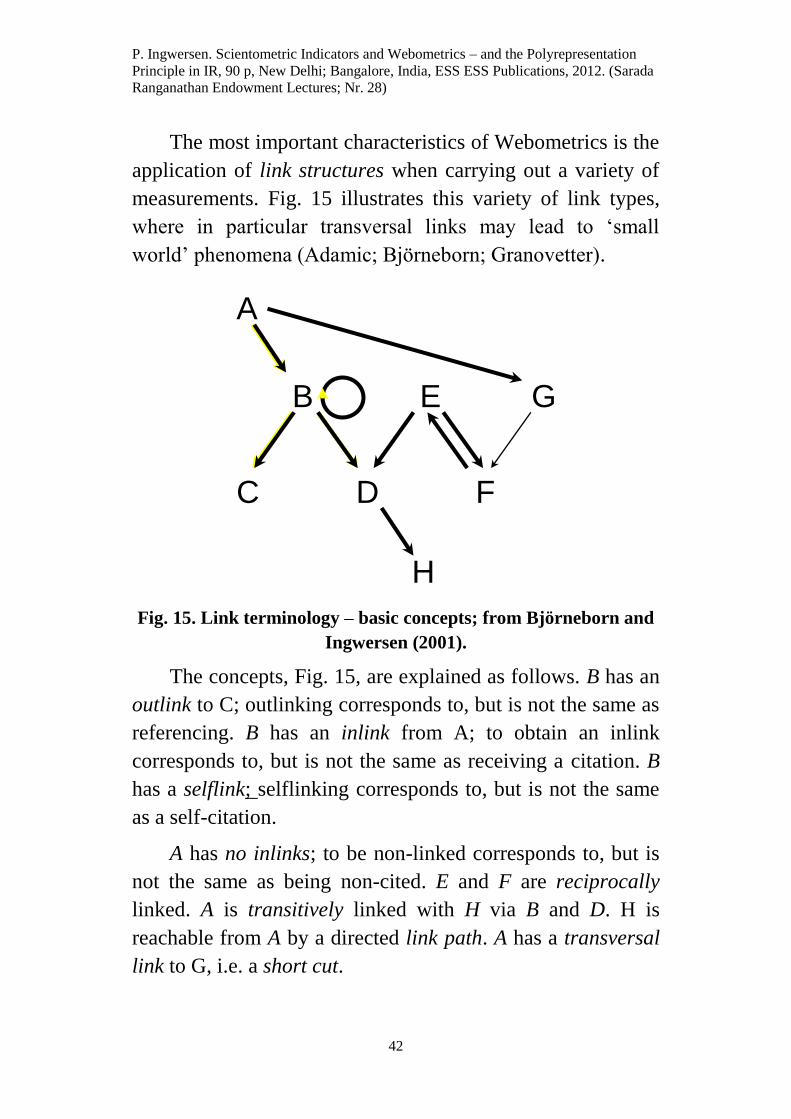
The most important characteristics of Webometrics is the
application of link structures when carrying out a variety of
measurements. Fig. 15 illustrates this variety of link types,
where in particular transversal links may lead to ‘small
world’ phenomena (Adamic; Björneborn; Granovetter).
Fig. 15. Link terminology – basic concepts; from Björneborn and
Ingwersen (2001).
The concepts, Fig. 15, are explained as follows. B has an
outlink to C; outlinking corresponds to, but is not the same as
referencing. B has an inlink from A; to obtain an inlink
corresponds to, but is not the same as receiving a citation. B
has a selflink; selflinking corresponds to, but is not the same
as a self-citation.
A has no inlinks; to be non-linked corresponds to, but is
not the same as being non-cited. E and F are reciprocally
linked. A is transitively linked with H via B and D. H is
reachable from A by a directed link path. A has a transversal
link to G, i.e. a short cut.
H
A
B
D
E G
FC
P. Ingwersen. Scientometric Indicators and Webometrics – and the Polyrepresentation
Principle in IR, 90 p, New Delhi; Bangalore, India, ESS ESS Publications, 2012. (Sarada
Ranganathan Endowment Lectures; Nr. 28)
43
C and D are co-linked from B, i.e., they have co-inlinks
or shared inlinks, which corresponds to, but is not the same
as co-citation. B and E are co-linking to D, i.e., they have co-
out-links or shared outlinks, which corresponds to, but is not
the same as bibliographic coupling.
The association between linking and referencing-
citations is discussed below in connection to the WIF.
However, it is vital that the superficial technical similarity
does not confuse people in believing that they are the same.
But obviously, the same mathematical treatments can be done
on co-linking phenomena as on co-citation and bibliographic
coupling. That is because both linking and references-
citations fundamentally are directed graphs (Broder). Both
Björneborn (2001) and Kleinberg and Lawrence (2001) have
discussed the nature and structure of the Web, among others.
ab
d
c
P. Ingwersen. Scientometric Indicators and Webometrics – and the Polyrepresentation
Principle in IR, 90 p, New Delhi; Bangalore, India, ESS ESS Publications, 2012. (Sarada
Ranganathan Endowment Lectures; Nr. 28)
44
Fig. 16. Levels of Web nodes. From Björneborn and IngwersenX
(2001). Legend: Square: web page; Circle: website; Triangle:
TLD
In the academic world we have articles or conference
papers published in journals and/or conference proceedings.
We also have individual works published in anthologies. One
might argue that a digitized institutional repository actually
contains the former levels of publication, serving as a meta-
channel of publication. We observe here a three-level
hierarchy of works and publications: repository;
journal/proceedings; work or article/paper. However, on the
Web there may indeed exist more levels – like Russian dolls.
Fundamentally however, we deal with three levels of nodes
and links, Fig. 16.
On the figure we observe three TLDs (Top level
Domains) as triangles. The large one may, for instance,
illustrate a country, like .dk. Inside the TLD four circles
illustrate four different Websites, each holding one or several
Web pages. Accordingly, a Web page may contain selflinks
(a), page outlinks also seen as site selflinks (b), site outlinks
also seen as TLD selflinks (c), and TLD outlinks (d). It is
consequently obvious that during web link analyses one must
be very careful to control the level at which the analyses are
carried out.
SEARCH ENGINE ANALYSIS
Bar-Ilan is one of the most productive researchers in
search engine analysis and methodology, including
longitudinal studies (1997; 2004). Also the Thelwall groups
have contributed many substantial analyses on the matter, see
for instance (Thelwall, 2000; Kousha & Thelwall, 2007;
P. Ingwersen. Scientometric Indicators and Webometrics – and the Polyrepresentation
Principle in IR, 90 p, New Delhi; Bangalore, India, ESS ESS Publications, 2012. (Sarada
Ranganathan Endowment Lectures; Nr. 28)
45
ARIST). One aspect of search engine analysis is their growth
in volume and the distribution of different engines, as well as
their coverage. Secondly, the overlap of Webometrics with
Scientometrics, Fig. 14, constitutes an important aspect for
analysis: how much scientific sources does the web contain,
and with which characteristics?
The first aspect, growth and coverage, is quite difficult to
assess because one cannot trust the number of ‘hits’ provided
by the search engines during searching. Secondly, local
analyses are very cumbersome to carry out since only a small
fraction of the retrieved Web sources can be viewed or
downloaded. Each engine has its limitations, e.g. Google
makes available the 800 most highly ranked units retrieved;
other engines allow less or a bit more. Fig. 17 demonstrates a
distribution of number of searches in USA, their growth and
shares per engine in August, 2009. The Website
Internetworldstats.com provides general Internet and Web
statistics, with some time delay.
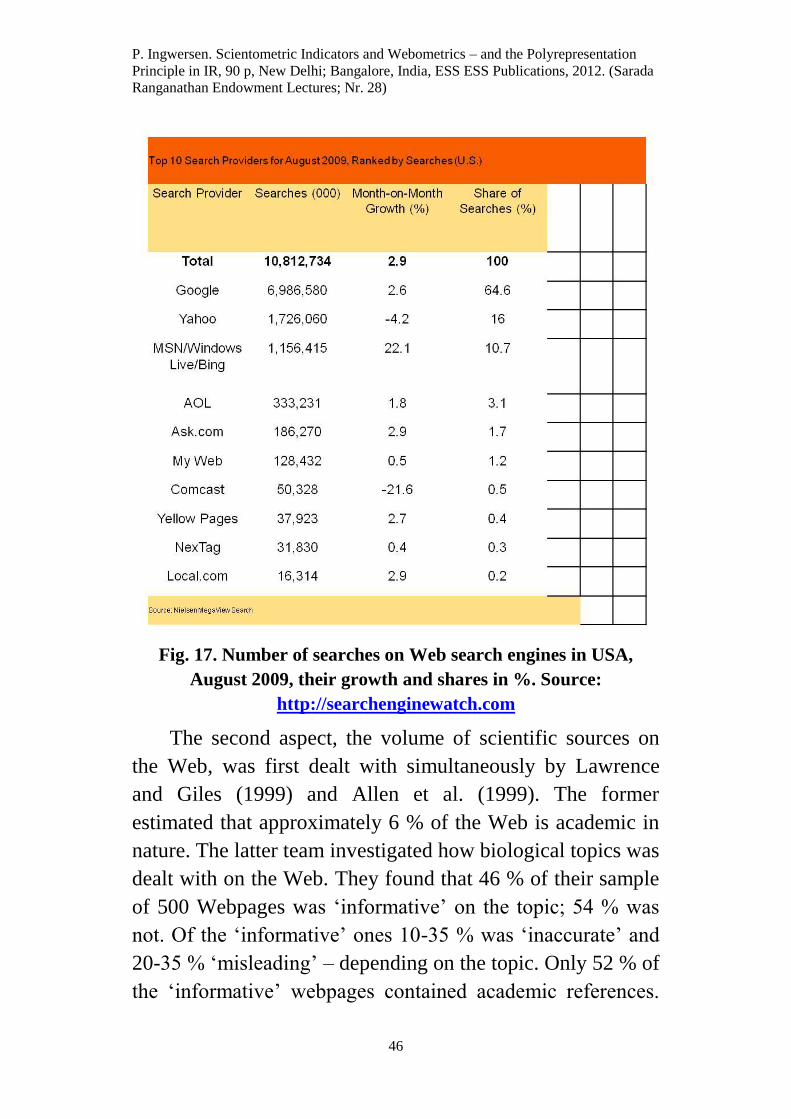
P. Ingwersen. Scientometric Indicators and Webometrics – and the Polyrepresentation
Principle in IR, 90 p, New Delhi; Bangalore, India, ESS ESS Publications, 2012. (Sarada
Ranganathan Endowment Lectures; Nr. 28)
46
Fig. 17. Number of searches on Web search engines in USA,
August 2009, their growth and shares in %. Source:
http://searchenginewatch.com
The second aspect, the volume of scientific sources on
the Web, was first dealt with simultaneously by Lawrence
and Giles (1999) and Allen et al. (1999). The former
estimated that approximately 6 % of the Web is academic in
nature. The latter team investigated how biological topics was
dealt with on the Web. They found that 46 % of their sample
of 500 Webpages was ‘informative’ on the topic; 54 % was
not. Of the ‘informative’ ones 10-35 % was ‘inaccurate’ and
20-35 % ‘misleading’ – depending on the topic. Only 52 % of
the ‘informative’ webpages contained academic references.
P. Ingwersen. Scientometric Indicators and Webometrics – and the Polyrepresentation
Principle in IR, 90 p, New Delhi; Bangalore, India, ESS ESS Publications, 2012. (Sarada
Ranganathan Endowment Lectures; Nr. 28)
47
Almost the same pattern was found in a later study by Jepsen
et al. (2004), covering several engines.
While it would seem OK to apply the web search engines
for this kind of data capture and analysis, since one operates
with sampling and not complete populations, some problems
exist that concerns all kinds of Webometric research: (1) the
dependency of each search engine’s own ranking algorithm
in terms of the output, which forms the basis for analysis; (2)
the aforementioned limitation as to download of retrieved
web items; (3) the scarcity of search engines providing link
analysis features. The latter issue is grave since at present
only the Yahoo Site Explorer (Yahoo) provides such
command features. Otherwise, analyses may only be done
through the application of a Web Crawler.
THE WEB IMPACT FACTOR
It was originally proposed by Ingwersen (1998) – at the
same time as Kleinberg (1998) suggested his hubs and
authority page-based Web retrieval algorithm, which was
close to the PageRank algorithm for Google (Brin and Page,
1998) also proposed the same year. All three ideas were
based on the pretext or assumption that links worked ‘like’
academic references (outlinks) and citations (inlinks). After a
lot of research we now know that this ‘similarity’ is only
technical and indeed superficial, and that links and
references/citations are not of the same kind – see below for a
further discussion.
There are several kinds of Web Impact Factors that may
be calculated, provided that a data caption mechanism exists:
E-journal Web-IF – calculated by
P. Ingwersen. Scientometric Indicators and Webometrics – and the Polyrepresentation
Principle in IR, 90 p, New Delhi; Bangalore, India, ESS ESS Publications, 2012. (Sarada
Ranganathan Endowment Lectures; Nr. 28)
48
o Inlinks;
o Citations (as traditional JIF);
Academic web site – IF (calculated by link analyses)
o National – regional (some URL-problems in TDL
exist)
o Institutions – single sites
o Other entities, e.g. Web domains
Other site types – WIF, e.g. commercial sites
Blog IF: no. of external inlinks to blog / blog entries
Twitter IF: no of external inlinks / twitter entries
(Holmberg, 2009)
For e-journals (and blogs or Twitter, etc.) one might
analyze the number of inlinks to articles in specific e-journals
– like one would do applying citations to the same entities.
This indicator would be quite robust because in contrast to
‘Web pages’ e-journal articles are easy to define and count.
Academic WIF and other types of Web-based impact factors
suffer from the data capture issue mentioned above. In
addition, many TLDs act across the national domains. When
collection ‘all’ .dk Websites in an engine (this is not possible
in the sense of downloading all the pages, only to observe the
number of hits) there will still be Danish Websites in other
domains, like .com or .EU or .NET. For the academic domain
some countries, like USA, UK, Australia, India and China
have introduced the notation of .ac or .edu, so that sites are
separable from the remaining web. This is not the case in
most EU countries, however.
Originally the WIF operated with external, internal and
overall WIFs. Early on it became clear to the research
community that the problem existed for the denominator: the
number of Web pages to be divided into the number of
P. Ingwersen. Scientometric Indicators and Webometrics – and the Polyrepresentation
Principle in IR, 90 p, New Delhi; Bangalore, India, ESS ESS Publications, 2012. (Sarada
Ranganathan Endowment Lectures; Nr. 28)
49
inlinks. At the time of creation (1998) the search engines
were quite erratic. However, even when engines are stable in
their output the number of pages does not indicate so much.
As stated above, the original idea was that web pages were
‘like’ journal articles and Websites like journals as carriers of
information. This analogy is false. As Holmberg (2010, p.
131) puts it recently: “[a] document on the web can be a
single web page or it can be divided into several web pages,
which means that simple web design decisions may have
great impact on counting the WIFs.” Hence the abandon of
the Web pages as denominator.
Smith (1999) argued that the external inlinks alone were
the most indicative because internal inlinks (selflinks) most
often were of navigational nature. Chu, He and Thelwall
proposed that inlinks could be regarded as indication of
visibility on the Web, whilst outlinks serve as a kind of
luminosity (2002). As a matter of fact, inlinks are better
indicators of impact on the Web alone or if divided by
number of staff in the analyzed unit, e.g. a university
(Thelwall, 2002). Alone, the number of inlinks correlates
with productivity of a university as measured by number of
academic entities (articles, notes, etc.) put on the university
website. In hindsight, the staff factor is also quite logical
since it is people that create the pages and outlinks and uses
other unit’s Web spaces often creating inlinks. Although
Thomas and Willett (2000) did not find any significant
correlations between number of inlinks (or WIF) and the UK
RAE scores for universities, Li et al. (2003) succeeded in
observing strong correlations between RAE and a WIF
version based on inlinks divided by staff number.
P. Ingwersen. Scientometric Indicators and Webometrics – and the Polyrepresentation
Principle in IR, 90 p, New Delhi; Bangalore, India, ESS ESS Publications, 2012. (Sarada
Ranganathan Endowment Lectures; Nr. 28)
50
These studies lead immediately to the design of two new
Web-based measures: Web Use Factor (WUF) and Web
Connectivity Factor (WCF) by Thelwall (2003). WUF
implies to use outlink counts divided by fulltime staff of the
analyzed unit. WUF signifies to measure the extent of
knowledge import from external Web sources. WCF means
to measure the intensity of connectivity between pairs of
units, like universities. It is calculated by dividing the number
of reciprocal links between the two units by the number of
fulltime staff. As stated by Holmberg (2010) both indicators
were found to correlate with research productivity at the
institutional level.
It is important to stress that not all WIF-like analyses are
done on the academic sectors of the Web. Holmberg, for
instance, has analyzed the link structures and interlinking
properties of municipal websites in Finland (2009). He also
tested the use of local populations as the denominator in the
calculations.
From the many Webometric analyses concerned with
aspects of the WIF and link structures we may observe some
general characteristics. Inlinks demonstrate rather recognition
of the inlinked site and navigational functionalities than
quality or relevance in an information retrieval sense. A
given page-rank algorithm mainly relying on link information
in a Web search engine may thus rank at the top the most
recognized Websites for a given topical search, not
necessarily the most topical relevant sites. To do that
common content-based retrieval ranking features must be
involved, like term weights, semantic distances, etc.
Secondly, it is vital to the research community that
retrieval engine facilities like the Yahoo Site Explorer exists
P. Ingwersen. Scientometric Indicators and Webometrics – and the Polyrepresentation
Principle in IR, 90 p, New Delhi; Bangalore, India, ESS ESS Publications, 2012. (Sarada
Ranganathan Endowment Lectures; Nr. 28)
51
and are further developed. Without such facilities at engine
level the community is limited to individual web crawlers as
tools for data capture. This makes reproducibility of analyses
very difficult and in-coherent.
Third, the reasons for making outlinks (which later can
be turned into inlinks and counted at the recipient side) have
been addressed and compared to making academic
references, whereby many differences have been observed
between the two kinds of networks. Most links are
navigational; some points to authoritative Websites and some
sites act as hubs with many outlinks (Kelinberg, 1998). But
we do more rarely observe normative reasons or conventions
for linking, as done associated with scholarly references (and
citations). We do not add negative links to a Webpage.
However, some additional reasons for linking may
overlap reasons for scholarly referencing: Emphasis of own
point of perspective, position or relationship; sharing
knowledge and information for various purposes;
acknowledgements; drawing attention of external
information. One should also note the issues of time that
often are somewhat different from those associated with
scholarly communication. As Glänzel has put it: aging of
sources are different on the Web. You can have birth,
maturity and obsolescence happening like in the academic
world, but very much faster on the Web. Decline and death of
sources and Websites may likewise occur, but marriage;
divorce; remarriage; face-lifting; death and resurrection – and
alike liberal phenomena are found on the web – rarely on the
academic publication scene.
P. Ingwersen. Scientometric Indicators and Webometrics – and the Polyrepresentation
Principle in IR, 90 p, New Delhi; Bangalore, India, ESS ESS Publications, 2012. (Sarada
Ranganathan Endowment Lectures; Nr. 28)
52
SOCIAL UTILITY INDICATORS
Social utility indicators are metrics that apply Web 2.0 log
information on users’ searching, downloading, blogging, etc.
behavior in order to measure various aspects of the use of
Web sources. In this final sub-section we exemplify two
different kinds of indicators: one dealing with the use of
scientific datasets through searches and downloads; and one
metric concerned with blogs through the Nielsen Blog Pulse.
BIODIVERSITY DATASET USAGE INDICATORS
In scientific communication scientific datasets are often vital
to the articles presenting empirical results, e.g. in physics,
bio-chemistry and biology. However, their recognition by
means of citations are only indirect, since only the article
receives citations – not the underlying datasets. The latter
may be created and maintained by researchers different from
those doing the experiments and publishing the results in
research publications. Consequently, attempts have been
made to design improved identification means to and usage
indicators for scientific datasets, in this case, in the
biodiversity science fields.
The Global Biodiversity Information Facility (GBIF),
with its main administration located in Copenhagen,
Denmark, is an open access web service that hosts a vast
proportion of the known biodiversity datasets in the World
(XX). These are search and downloadable by means of many
different entry points, such as, dataset producer, dataset
name, species, etc. Figure 18 displays the structure of the
GBIF network. In order to generate dataset usage indicators
one has to have access to the GBIF server logs. There are two
ways of obtaining that: by application of dedicated
processing software available through the GBIF main servers
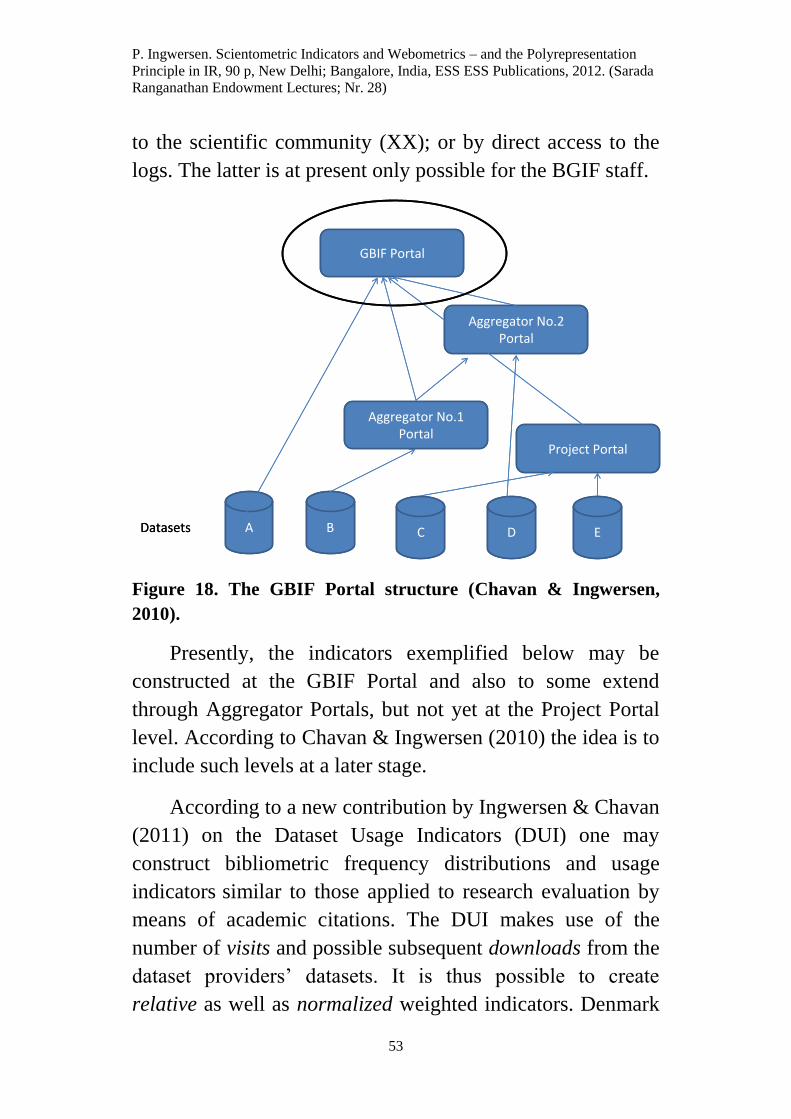
P. Ingwersen. Scientometric Indicators and Webometrics – and the Polyrepresentation
Principle in IR, 90 p, New Delhi; Bangalore, India, ESS ESS Publications, 2012. (Sarada
Ranganathan Endowment Lectures; Nr. 28)
53
to the scientific community (XX); or by direct access to the
logs. The latter is at present only possible for the BGIF staff.
Figure 18. The GBIF Portal structure (Chavan & Ingwersen,
2010).
Presently, the indicators exemplified below may be
constructed at the GBIF Portal and also to some extend
through Aggregator Portals, but not yet at the Project Portal
level. According to Chavan & Ingwersen (2010) the idea is to
include such levels at a later stage.
According to a new contribution by Ingwersen & Chavan
(2011) on the Dataset Usage Indicators (DUI) one may
construct bibliometric frequency distributions and usage
indicators similar to those applied to research evaluation by
means of academic citations. The DUI makes use of the
number of visits and possible subsequent downloads from the
dataset providers’ datasets. It is thus possible to create
relative as well as normalized weighted indicators. Denmark
A B C D EDatasets
GBIF Portal
Project Portal
Aggregator No.2 Portal
Aggregator No.1 Portal
A B C D EDatasets
GBIF Portal
Project Portal
Aggregator No.2 Portal
Aggregator No.1 Portal
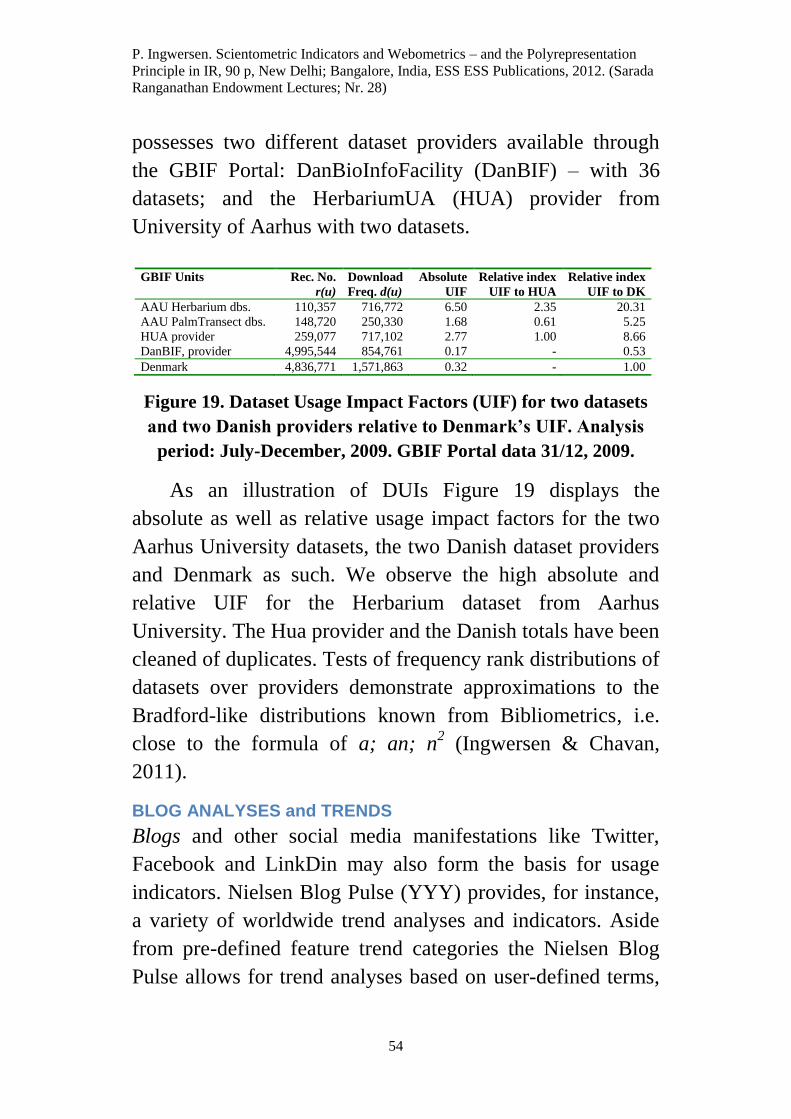
P. Ingwersen. Scientometric Indicators and Webometrics – and the Polyrepresentation
Principle in IR, 90 p, New Delhi; Bangalore, India, ESS ESS Publications, 2012. (Sarada
Ranganathan Endowment Lectures; Nr. 28)
54
possesses two different dataset providers available through
the GBIF Portal: DanBioInfoFacility (DanBIF) – with 36
datasets; and the HerbariumUA (HUA) provider from
University of Aarhus with two datasets.
Figure 19. Dataset Usage Impact Factors (UIF) for two datasets
and two Danish providers relative to Denmark’s UIF. Analysis
period: July-December, 2009. GBIF Portal data 31/12, 2009.
As an illustration of DUIs Figure 19 displays the
absolute as well as relative usage impact factors for the two
Aarhus University datasets, the two Danish dataset providers
and Denmark as such. We observe the high absolute and
relative UIF for the Herbarium dataset from Aarhus
University. The Hua provider and the Danish totals have been
cleaned of duplicates. Tests of frequency rank distributions of
datasets over providers demonstrate approximations to the
Bradford-like distributions known from Bibliometrics, i.e.
close to the formula of a; an; n2 (Ingwersen & Chavan,
2011).
BLOG ANALYSES and TRENDS
Blogs and other social media manifestations like Twitter,
Facebook and LinkDin may also form the basis for usage
indicators. Nielsen Blog Pulse (YYY) provides, for instance,
a variety of worldwide trend analyses and indicators. Aside
from pre-defined feature trend categories the Nielsen Blog
Pulse allows for trend analyses based on user-defined terms,
GBIF Units Rec. No.
r(u)
Download
Freq. d(u)
Absolute
UIF
Relative index
UIF to HUA
Relative index
UIF to DK
AAU Herbarium dbs. 110,357 716,772 6.50 2.35 20.31
AAU PalmTransect dbs. 148,720 250,330 1.68 0.61 5.25
HUA provider 259,077 717,102 2.77 1.00 8.66
DanBIF, provider 4,995,544 854,761 0.17 - 0.53
Denmark 4,836,771 1,571,863 0.32 - 1.00
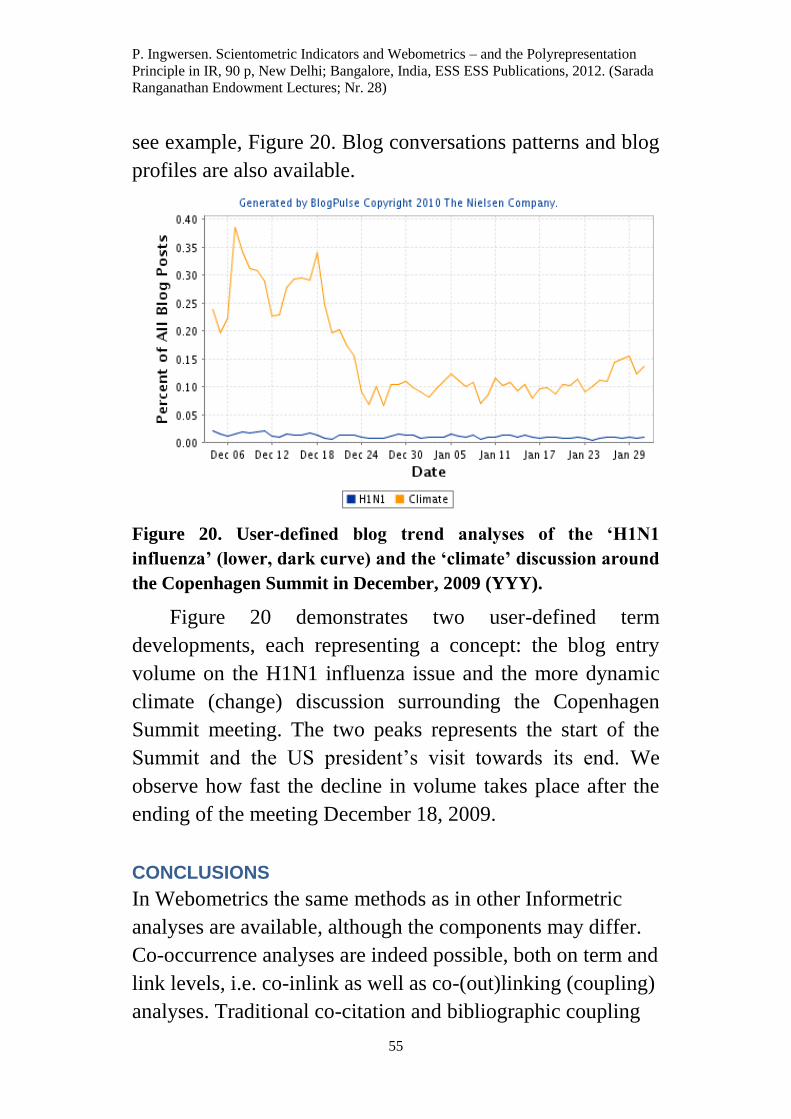
P. Ingwersen. Scientometric Indicators and Webometrics – and the Polyrepresentation
Principle in IR, 90 p, New Delhi; Bangalore, India, ESS ESS Publications, 2012. (Sarada
Ranganathan Endowment Lectures; Nr. 28)
55
see example, Figure 20. Blog conversations patterns and blog
profiles are also available.
Figure 20. User-defined blog trend analyses of the ‘H1N1
influenza’ (lower, dark curve) and the ‘climate’ discussion around
the Copenhagen Summit in December, 2009 (YYY).
Figure 20 demonstrates two user-defined term
developments, each representing a concept: the blog entry
volume on the H1N1 influenza issue and the more dynamic
climate (change) discussion surrounding the Copenhagen
Summit meeting. The two peaks represents the start of the
Summit and the US president’s visit towards its end. We
observe how fast the decline in volume takes place after the
ending of the meeting December 18, 2009.
CONCLUSIONS
In Webometrics the same methods as in other Informetric
analyses are available, although the components may differ.
Co-occurrence analyses are indeed possible, both on term and
link levels, i.e. co-inlink as well as co-(out)linking (coupling)
analyses. Traditional co-citation and bibliographic coupling
P. Ingwersen. Scientometric Indicators and Webometrics – and the Polyrepresentation
Principle in IR, 90 p, New Delhi; Bangalore, India, ESS ESS Publications, 2012. (Sarada
Ranganathan Endowment Lectures; Nr. 28)
56
analyses can be done based on academic citations provided
on the Web and compared to the former analyses of the same
space.
Bradford-like frequency rank distributions are feasible
and such distributions may be compared, e.g. in order to
observe possible strong ties between high frequency elements
or weak ties (small worlds) between low frequency elements
of the distributions. Aside from blog analyses Twitter,
Facebook and other social media may provide foundations
for trend analyses, including metrics based on number of
‘friends’ and other relationships in such networks.
Finally, it is advisable to be cautious concerning the
application of the Web Impact Factor. WIFs seem better
suited when calculated by external inlinks over functional
data, such as staff volume or similar non-web-based but
relevant features, as denominator. Web impact seems more
correlated to the publication volume on the Web of a unit
than to its peer assed quality. Citations as well as inlinks may
not necessarily signify relevance from an IR perspective.
On the other hand, information retrieval methodologies
are mandatory tools when carrying out Informetric analyses
including web mining and knowledge discovery (Swanson,
1986). Several bridges link Webometrics/Scientometrics to
IR, such as co-occurrence analyses or terms, citations or links
and mapping of units (institutions, authors) by means of
clustering methods and multi-dimensional scaling. Web
archeology (Bjorneborn & Ingwersen, 2004) constitutes a
retrospective sampling of the past Web structure, as supplied
by a range of historical Web archives. Concurrent analyses of
the Web may be better off by means of dedicated Web

P. Ingwersen. Scientometric Indicators and Webometrics – and the Polyrepresentation
Principle in IR, 90 p, New Delhi; Bangalore, India, ESS ESS Publications, 2012. (Sarada
Ranganathan Endowment Lectures; Nr. 28)
57
crawlers that carries out structured/stratified sampling of
defined Web spaces.
LECTURE 3
P. Ingwersen. Scientometric Indicators and Webometrics – and the Polyrepresentation
Principle in IR, 90 p, New Delhi; Bangalore, India, ESS ESS Publications, 2012. (Sarada
Ranganathan Endowment Lectures; Nr. 28)
58
Polyrepresentation – Bridging Laboratory Information Retrieval
and User Context
This lecture outlines the idea and assumptions underlying the
principle of Polyrepresentation, which increasingly can be
seen as a theory for Information Retrieval (IR). It points to a
variety of empirical studies that support the principle, but that
did not rely on it explicitly. This is followed by a discussion
of the empirical investigations that directly are founded on
Polyrepresentation principles, ideas and assumptions. These
investigations deal with polyrepresentation of the information
space (documents, databases), retrieval engines (data fusion),
the interaction process (relevance feedback, query
modification; contextual elements like recommendations),
and the cognitive space (user, task & request features).
ORIGIN and UNDERLYING IDEA and HYPOTHESIS
Polyrepresentation (or multi-evidence) of documents or
searchers was initially mentioned and described by Ingwersen
in his monograph “Information Retrieval Interaction” (p. 36;
194-197; 202) from 1992. A first discussion of the idea
underlying the principle was published in an ACM-SIGIR
conference paper by Ingwersen in 1994. This was taken
forward and put into a comprehensive theoretical discussion
based on the cognitive perspective in 1996 as well as on
available empirical evidence published through the 1990s.
The underlying idea was based on the cognitive
perspective (or viewpoint) of Information Retrieval, which
regards all the actors involved in IR as being represented by
P. Ingwersen. Scientometric Indicators and Webometrics – and the Polyrepresentation
Principle in IR, 90 p, New Delhi; Bangalore, India, ESS ESS Publications, 2012. (Sarada
Ranganathan Endowment Lectures; Nr. 28)
59
their interpretations of the IR phenomena (1994; 1996). The
cognitive perspective thus talks about how different
interpretations of documents (or requests or interaction
phenomena) can be made by their authors; human indexers;
designers of indexing algorithms; constructors of
thesauri/ontologies; other authors through the network of
citations; and searchers, etc. – see illustration Figure 22. Each
representation may thus imply an entry point to the item in
question, e.g. a document; and an item may be characterized
by a multitude of representations.
Polyrepresentation is therefore a direct and applied
consequence of the integrated cognitive perspective and
theory for IR (1996; 2005) by emphasizing the potential
benefits in exploiting combinations of (redundant)
representations based on their cognitive origins. The
underlying hypothesis is:
“The more cognitively or typologically different
representations (evidence; features) that point to an
information object – and the more intensively they do so – the
higher the probability that the object is relevant to the topic,
the information need, the situation at hand, or the influencing
context of the situation” (2005, p. 208).
Two types of representations are distinctive: cognitively
different and functionally different representations. The
former type of representation adheres from interpretations
made by different cognitive origins; the latter type associates
to different kinds of representations made by the same origin,
see also illustration, Figure 22, e.g. title vs. abstract vs. full
text words in an academic publication by the same author(s).
The different media are characterized by different sets of
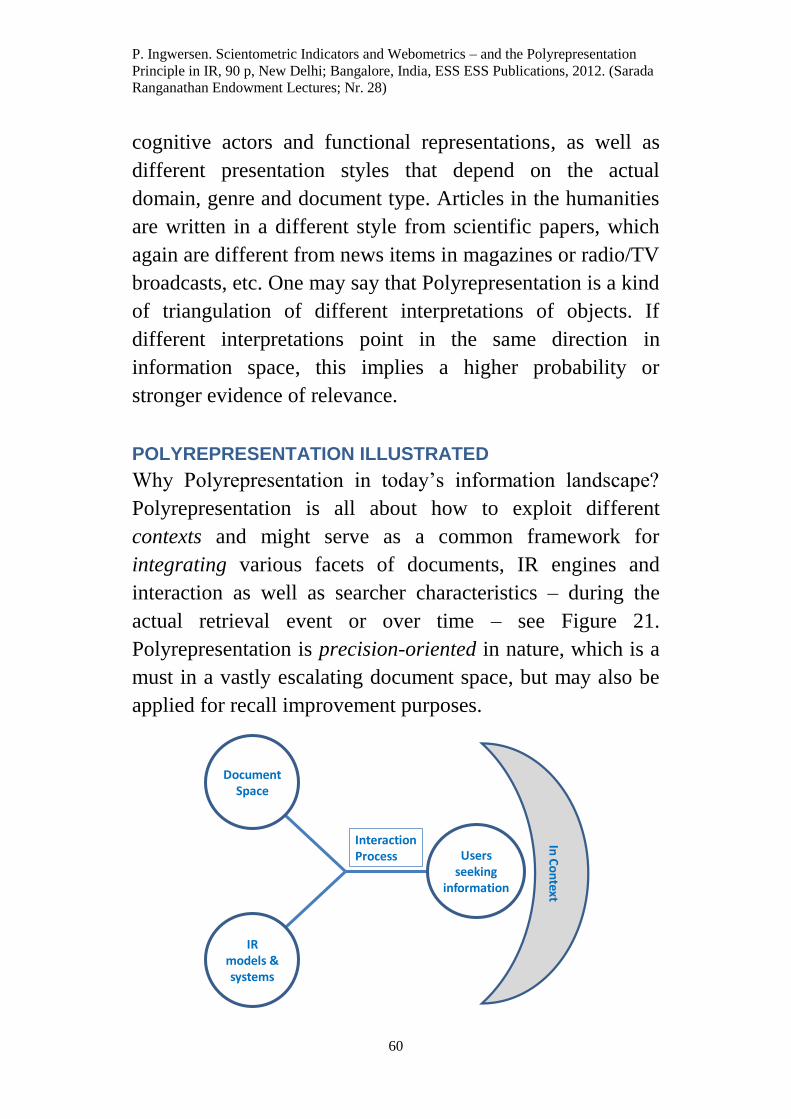
P. Ingwersen. Scientometric Indicators and Webometrics – and the Polyrepresentation
Principle in IR, 90 p, New Delhi; Bangalore, India, ESS ESS Publications, 2012. (Sarada
Ranganathan Endowment Lectures; Nr. 28)
60
cognitive actors and functional representations, as well as
different presentation styles that depend on the actual
domain, genre and document type. Articles in the humanities
are written in a different style from scientific papers, which
again are different from news items in magazines or radio/TV
broadcasts, etc. One may say that Polyrepresentation is a kind
of triangulation of different interpretations of objects. If
different interpretations point in the same direction in
information space, this implies a higher probability or
stronger evidence of relevance.
POLYREPRESENTATION ILLUSTRATED
Why Polyrepresentation in today’s information landscape?
Polyrepresentation is all about how to exploit different
contexts and might serve as a common framework for
integrating various facets of documents, IR engines and
interaction as well as searcher characteristics – during the
actual retrieval event or over time – see Figure 21.
Polyrepresentation is precision-oriented in nature, which is a
must in a vastly escalating document space, but may also be
applied for recall improvement purposes.
DocumentSpace
IR models & systems
Users seeking
information
InteractionProcess
In C
on
text
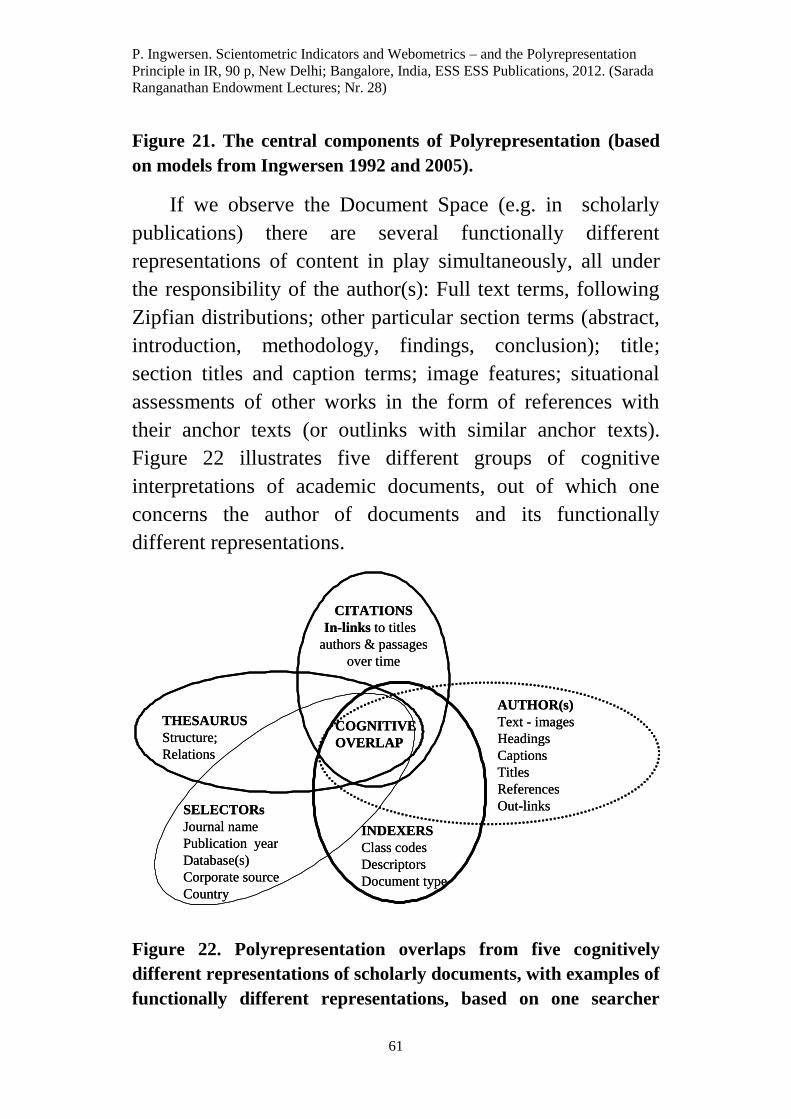
P. Ingwersen. Scientometric Indicators and Webometrics – and the Polyrepresentation
Principle in IR, 90 p, New Delhi; Bangalore, India, ESS ESS Publications, 2012. (Sarada
Ranganathan Endowment Lectures; Nr. 28)
61
Figure 21. The central components of Polyrepresentation (based
on models from Ingwersen 1992 and 2005).
If we observe the Document Space (e.g. in scholarly
publications) there are several functionally different
representations of content in play simultaneously, all under
the responsibility of the author(s): Full text terms, following
Zipfian distributions; other particular section terms (abstract,
introduction, methodology, findings, conclusion); title;
section titles and caption terms; image features; situational
assessments of other works in the form of references with
their anchor texts (or outlinks with similar anchor texts).
Figure 22 illustrates five different groups of cognitive
interpretations of academic documents, out of which one
concerns the author of documents and its functionally
different representations.
Figure 22. Polyrepresentation overlaps from five cognitively
different representations of scholarly documents, with examples of
functionally different representations, based on one searcher
COGNITIVE
OVERLAP
CITATIONS
In-links to titles
authors & passages
over time
AUTHOR(s)
Text - images
Headings
Captions
Titles
References
Out-links
THESAURUS
Structure;
Relations
INDEXERS
Class codes
Descriptors
Document type
SELECTORs
Journal name
Publication year
Database(s)
Corporate source
Country
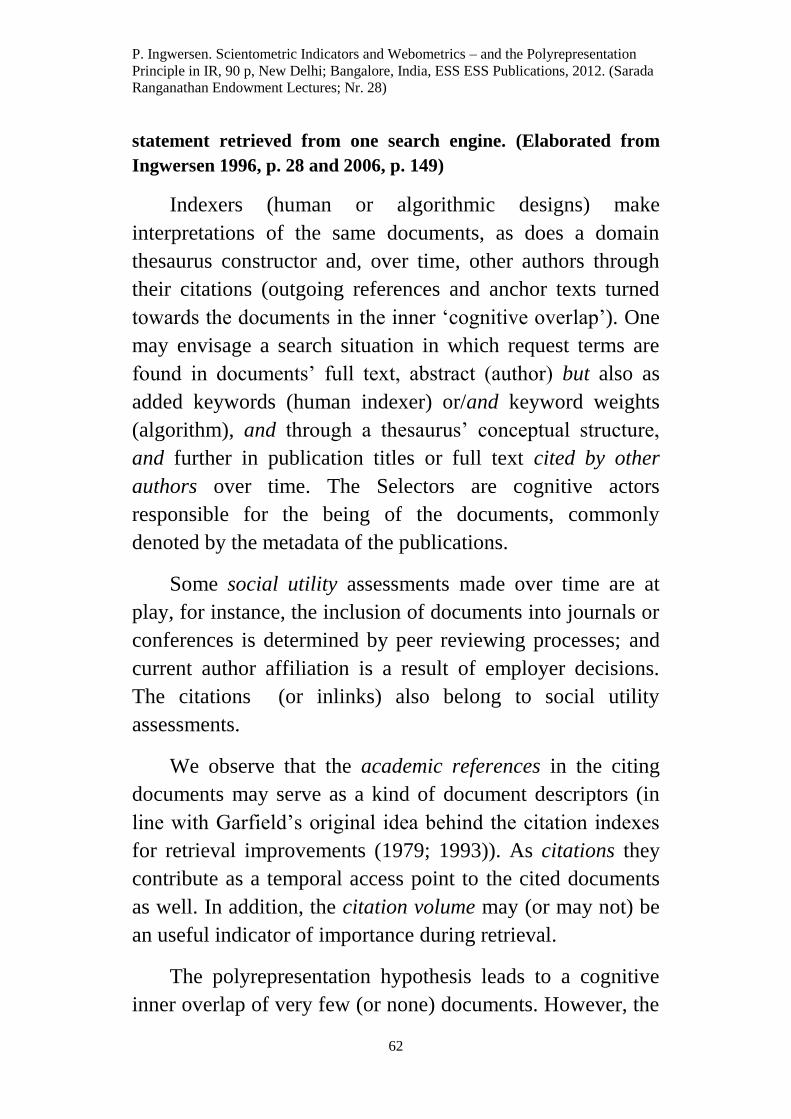
P. Ingwersen. Scientometric Indicators and Webometrics – and the Polyrepresentation
Principle in IR, 90 p, New Delhi; Bangalore, India, ESS ESS Publications, 2012. (Sarada
Ranganathan Endowment Lectures; Nr. 28)
62
statement retrieved from one search engine. (Elaborated from
Ingwersen 1996, p. 28 and 2006, p. 149)
Indexers (human or algorithmic designs) make
interpretations of the same documents, as does a domain
thesaurus constructor and, over time, other authors through
their citations (outgoing references and anchor texts turned
towards the documents in the inner ‘cognitive overlap’). One
may envisage a search situation in which request terms are
found in documents’ full text, abstract (author) but also as
added keywords (human indexer) or/and keyword weights
(algorithm), and through a thesaurus’ conceptual structure,
and further in publication titles or full text cited by other
authors over time. The Selectors are cognitive actors
responsible for the being of the documents, commonly
denoted by the metadata of the publications.
Some social utility assessments made over time are at
play, for instance, the inclusion of documents into journals or
conferences is determined by peer reviewing processes; and
current author affiliation is a result of employer decisions.
The citations (or inlinks) also belong to social utility
assessments.
We observe that the academic references in the citing
documents may serve as a kind of document descriptors (in
line with Garfield’s original idea behind the citation indexes
for retrieval improvements (1979; 1993)). As citations they
contribute as a temporal access point to the cited documents
as well. In addition, the citation volume may (or may not) be
an useful indicator of importance during retrieval.
The polyrepresentation hypothesis leads to a cognitive
inner overlap of very few (or none) documents. However, the
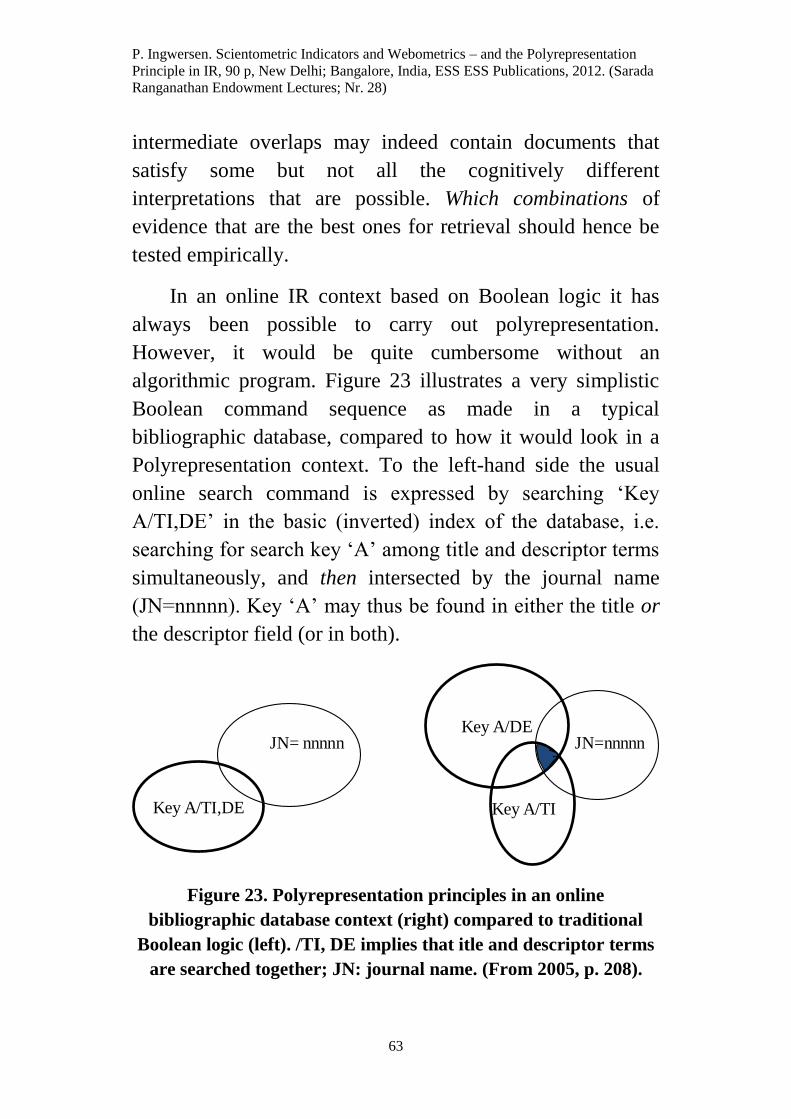
P. Ingwersen. Scientometric Indicators and Webometrics – and the Polyrepresentation
Principle in IR, 90 p, New Delhi; Bangalore, India, ESS ESS Publications, 2012. (Sarada
Ranganathan Endowment Lectures; Nr. 28)
63
intermediate overlaps may indeed contain documents that
satisfy some but not all the cognitively different
interpretations that are possible. Which combinations of
evidence that are the best ones for retrieval should hence be
tested empirically.
In an online IR context based on Boolean logic it has
always been possible to carry out polyrepresentation.
However, it would be quite cumbersome without an
algorithmic program. Figure 23 illustrates a very simplistic
Boolean command sequence as made in a typical
bibliographic database, compared to how it would look in a
Polyrepresentation context. To the left-hand side the usual
online search command is expressed by searching ‘Key
A/TI,DE’ in the basic (inverted) index of the database, i.e.
searching for search key ‘A’ among title and descriptor terms
simultaneously, and then intersected by the journal name
(JN=nnnnn). Key ‘A’ may thus be found in either the title or
the descriptor field (or in both).
Figure 23. Polyrepresentation principles in an online
bibliographic database context (right) compared to traditional
Boolean logic (left). /TI, DE implies that itle and descriptor terms
are searched together; JN: journal name. (From 2005, p. 208).
Key A/TI,DE
JN= nnnnnKey A/DE
Key A/TI
JN=nnnnn
P. Ingwersen. Scientometric Indicators and Webometrics – and the Polyrepresentation
Principle in IR, 90 p, New Delhi; Bangalore, India, ESS ESS Publications, 2012. (Sarada
Ranganathan Endowment Lectures; Nr. 28)
64
In contrast, the Polyrepresentation hypothesis suggests
that the search key ‘A’ be searched (and hopefully found) in
the title field of the inverted index of the database (author
representation) and, at the same time, be searched (and
hopefully found) among the descriptors (indexer
representation of document), and simultaneously be found in
a particular journal (JN=nnnnn). Obviously, the latter logical
sequence is more precision-oriented than the former more
traditional online (textbook) retrieval method. If a document
satisfies the author and the indexer simultaneously, by means
of identical keys, the hypothesis informs that that document
have a higher probability of relevance than documents only
satisfying one of the representations. Evidently, a domain
ontology may serve as a supporting tool for adding synonyms
and closely related keys to the original key ‘A’ at search
time, thus increasing the probability of finding documents
dealing with similar conceptual contents that may be relevant
in the situation.
“The Polyrepresentation principle may be applied to non-
textual information objects of various media types and
various genres...” (The Turn, p. 342). For instance, as some
students of mine demonstrated a couple of years ago, a
graphical object of art can be represented by, e.g. exhibition
catalogues, art history books and TV documentaries. It is also
evident that Boolean logic is not the only possible logic to
apply to Polyrepresentation. Later in the section on Future
Research we outline alternative logical approaches already
under development.
P. Ingwersen. Scientometric Indicators and Webometrics – and the Polyrepresentation
Principle in IR, 90 p, New Delhi; Bangalore, India, ESS ESS Publications, 2012. (Sarada
Ranganathan Endowment Lectures; Nr. 28)
65
EMPIRICAL EVIDENCE SUPPORTING
POLYREPRESENTATION
Early evidence of polyrepresentation-like retrieval
phenomena is found in the literature and is briefly outlined
below. Concurrent with the launch of the idea and hypothesis
in the 1990s some experiments took place that were guided
by common retrieval ideas giving support to the hypothesis,
but not directly aiming at Polyrepresentation.
EXPERIMENTS NOT BASED DIRECTLY on
POLYREPRESENTATION
Based on a relevant seed document already McCain in 1989
experimented with merging of citation databases (Science
Citation Index) and an domain database (Medline), in order
to test if documents defined by the citing publications and
also found in the domain database were more topically
relevant than each of the document sets isolated. A bit later in
1994 Miranda Pao carried out database fusion experiments of
the same kind. In all those cases the inner overlap proved to
perform better than the constituting sets of documents. The
experiments did not adhere to any explicit theory but was
carried out mainly because database fusion in commercial
online hosts was made technical possible and the idea that
academic citations may reinforce potential topical
relationships.
Slightly earlier in 1987 Croft and Thomson constructed
an experimental IR system named I3R that fused two
fundamental retrieval models: a probabilistic and a vector
space model. The idea was to intersect the two models (or
engines) for better precision and to apply their union to
improve recall. Which of the two modes to apply in a
P. Ingwersen. Scientometric Indicators and Webometrics – and the Polyrepresentation
Principle in IR, 90 p, New Delhi; Bangalore, India, ESS ESS Publications, 2012. (Sarada
Ranganathan Endowment Lectures; Nr. 28)
66
retrieval situation was determined by knowledge-based user
modeling. This approach of what was to become known as
data fusion proved well for the intersection, which essentially
is an inner overlap of documents retrieved from two different
algorithmic interpretations of their indexing features.
Searcher statements of their request were also
experimented in combinations, e.g. by Belkin et al. (1995)
who found that such combinations performed better than each
single statement. Obviously, such request statements may
only be available from the searcher in question after several
iterations, not from the initiation of the IR interaction. But
never-the-less the idea to extract information associated with
the searcher situation seemed promising. Human relevance
feedback on retrieved documents and combinations of
algorithmic indexing weights were also shown to outperform
the individual algorithms (2002; 2003).
Many other IR experiments are relevant for this
discussion, but will be omitted owing to space. One may, for
instance, point to almost all data fusion experiments done
from the mid-1990s. They are basically dealing with fusions
of different search engines/retrieval models. In most such
experiments only the final result of all the fused models are
the findings that are published and discussed. However, as
observed in some data fusion experiments based on
Polyrepresentation the results of intermediate combinations
may indeed be more powerful than the total one. This may be
caused by the fact that less-well performing retrieval models
downgrade the combined outcome. When all models are
fused the less performing ones participate – and combinations
without them may thus perform better.
P. Ingwersen. Scientometric Indicators and Webometrics – and the Polyrepresentation
Principle in IR, 90 p, New Delhi; Bangalore, India, ESS ESS Publications, 2012. (Sarada
Ranganathan Endowment Lectures; Nr. 28)
67
EXPERIMENTS BASED on POLYREPRESENTATION
We divide the following experiments into groups according
to the model, Figure 21. First, Experiments on the document
space are discussed. This is followed by an outline of
experiments with data fusion of IR models and IR interaction
as process, incorporating contextual elements. Finally, we
discuss polyrepresentation experiments associated with the
searcher’s retrieval and task situation – and point to future
potentials for polyrepresentation theory.
POLYREPRESENTATION of DOCUMENT SPACE
The McCain and Pao experiments with database fusions were
re-done by Christoffersen in a much larger scale study with
very positive results, seen from a polyrepresentation point of
view (2004).
Skov, Larsen and Ingwersen investigated combinations
of query structures and document representations (2008)
applying a rather small test collection consisting of 1200
documents, 29 search tasks and three-graded relevance
assessments, but including all references and citation
frequency for each document. The study tested 1) query
structure, i.e. natural langauge ‘bag-of-words’ mode versus
query structure value-added by MeSH (Medical Subject
Heading) terms as well as 2) the use of combinations of
Reference title words; TI; AB; and DE terms. A total of 15
different overlap combinations were tested, see Figure 24.
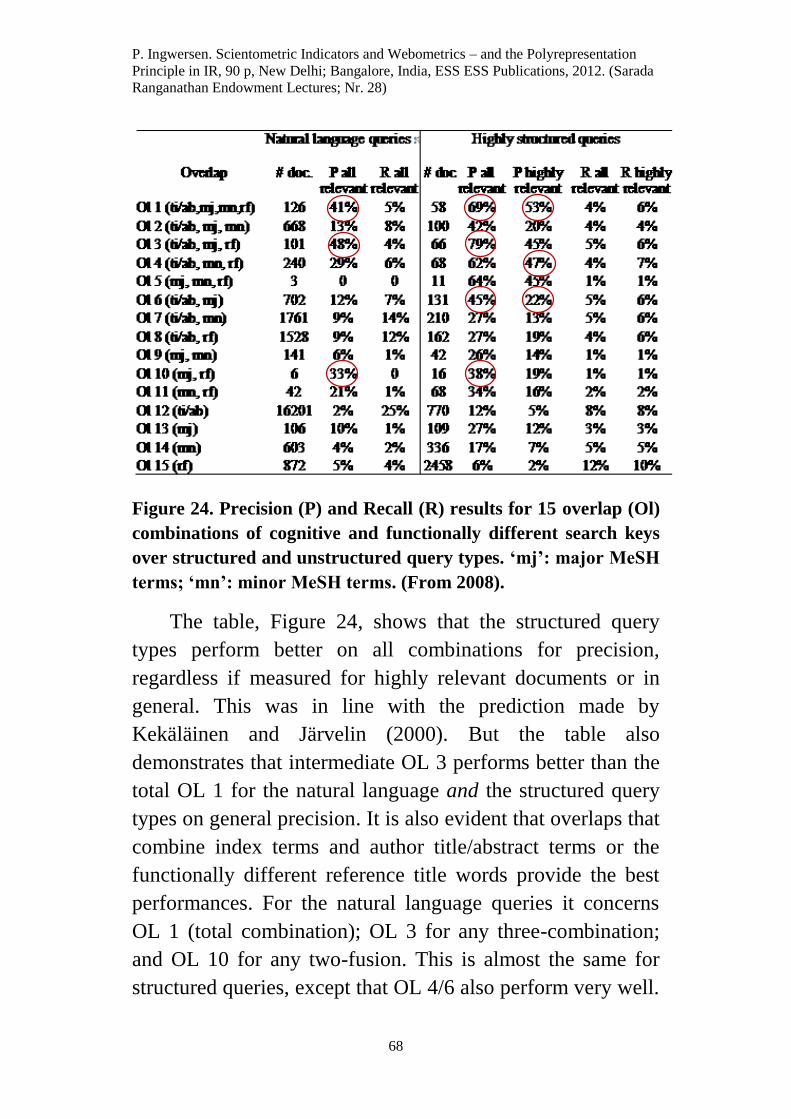
P. Ingwersen. Scientometric Indicators and Webometrics – and the Polyrepresentation
Principle in IR, 90 p, New Delhi; Bangalore, India, ESS ESS Publications, 2012. (Sarada
Ranganathan Endowment Lectures; Nr. 28)
68
Figure 24. Precision (P) and Recall (R) results for 15 overlap (Ol)
combinations of cognitive and functionally different search keys
over structured and unstructured query types. ‘mj’: major MeSH
terms; ‘mn’: minor MeSH terms. (From 2008).
The table, Figure 24, shows that the structured query
types perform better on all combinations for precision,
regardless if measured for highly relevant documents or in
general. This was in line with the prediction made by
Kekäläinen and Järvelin (2000). But the table also
demonstrates that intermediate OL 3 performs better than the
total OL 1 for the natural language and the structured query
types on general precision. It is also evident that overlaps that
combine index terms and author title/abstract terms or the
functionally different reference title words provide the best
performances. For the natural language queries it concerns
OL 1 (total combination); OL 3 for any three-combination;
and OL 10 for any two-fusion. This is almost the same for
structured queries, except that OL 4/6 also perform very well.
P. Ingwersen. Scientometric Indicators and Webometrics – and the Polyrepresentation
Principle in IR, 90 p, New Delhi; Bangalore, India, ESS ESS Publications, 2012. (Sarada
Ranganathan Endowment Lectures; Nr. 28)
69
The reference title words seem to contribute positively in all
their combinations – in line with what Garfield believed
would strengthen IR performance (1979; 1993).
Skov et al.’s findings strongly indicate that the more
cognitively and functionally different the representations
in overlaps, the higher the precision. Combinations with
reference title terms outperformed other combinations as well
as individual searches, but minor and major descriptor terms
combined did not perform well (OL5 and OL9). Structured
queries outperformed unstructured queries over all
combinations. Adding weights to selected combinations
busted such polyrepresentation combinations’ performance in
Top-10 rankings over natural language bag-of-words queries.
However, P@5 was highest for this query type compared to
any polyrepresentation combination. Re-ranking by citation
frequency decreased performance slightly but the range of
citations was small though!
Another way to apply citations and references in a
polyrepresentation manner was tried out by Larsen (2002)
following a so-called ‘boomerang’ principle. It implies to 1)
retrieve a set of documents by means of bag-of-words
retrieval and polyrepresentation according to Figure 23, right
hand side.; 2) apply the references in the set to go back in
time and retrieve the documents cited; these can be ranked
according to citation intensity; 3) move forward in time to all
the documents citing the second set, including the initial one;
4) rank the documents according to a variety of parameters.
The experiements did not show superior performance for the
polyrepresentation modus compared to the simplistic and
traditional natural language bag-of-words retrieval mode. The
P. Ingwersen. Scientometric Indicators and Webometrics – and the Polyrepresentation
Principle in IR, 90 p, New Delhi; Bangalore, India, ESS ESS Publications, 2012. (Sarada
Ranganathan Endowment Lectures; Nr. 28)
70
issue here is, among others, how far back to allow the
references to be included in the second step. One way not
tested so far would be to apply the citing half-life as limit.
This line of research is undergoing current development.
POLYREPRESENTATION of IR ENGINES
Figure 25 illustrates how data fusion of four algorithmically
different IR models/search engines may result in several
intermediate and total cognitive overlaps of documents
retrieved by each engine. Obviously, for each engine
Polyrepresentation principles might have been applied to the
document representations and/or the searcher statements –
see Figure 22.
Data fusion according to Polyrepresentation was tested
by Larsen, Ingwersen and Lund (2009). It was discovered
that the Polyrepresentation principle could be divided into
two different modes: Disjoint (or restricted) overlaps, for
which each document is only found in one overlap by means
of ‘not’ logic (Boolean). In Figure 25 the disjoint principle
implies that the documents in ‘fuse4’ are not also found as
part of any ‘fuse3’ configuration. Each overlap is thus
isolated (shown as shades of gray on figure 25).
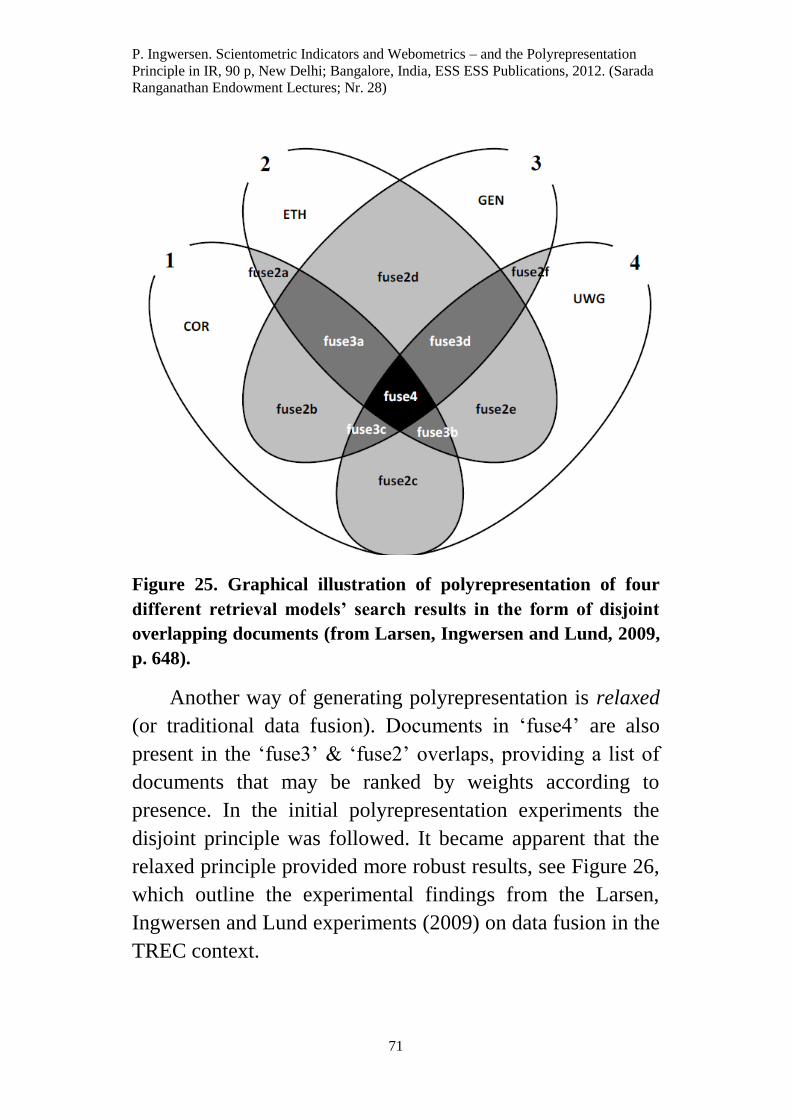
P. Ingwersen. Scientometric Indicators and Webometrics – and the Polyrepresentation
Principle in IR, 90 p, New Delhi; Bangalore, India, ESS ESS Publications, 2012. (Sarada
Ranganathan Endowment Lectures; Nr. 28)
71
Figure 25. Graphical illustration of polyrepresentation of four
different retrieval models’ search results in the form of disjoint
overlapping documents (from Larsen, Ingwersen and Lund, 2009,
p. 648).
Another way of generating polyrepresentation is relaxed
(or traditional data fusion). Documents in ‘fuse4’ are also
present in the ‘fuse3’ & ‘fuse2’ overlaps, providing a list of
documents that may be ranked by weights according to
presence. In the initial polyrepresentation experiments the
disjoint principle was followed. It became apparent that the
relaxed principle provided more robust results, see Figure 26,
which outline the experimental findings from the Larsen,
Ingwersen and Lund experiments (2009) on data fusion in the
TREC context.
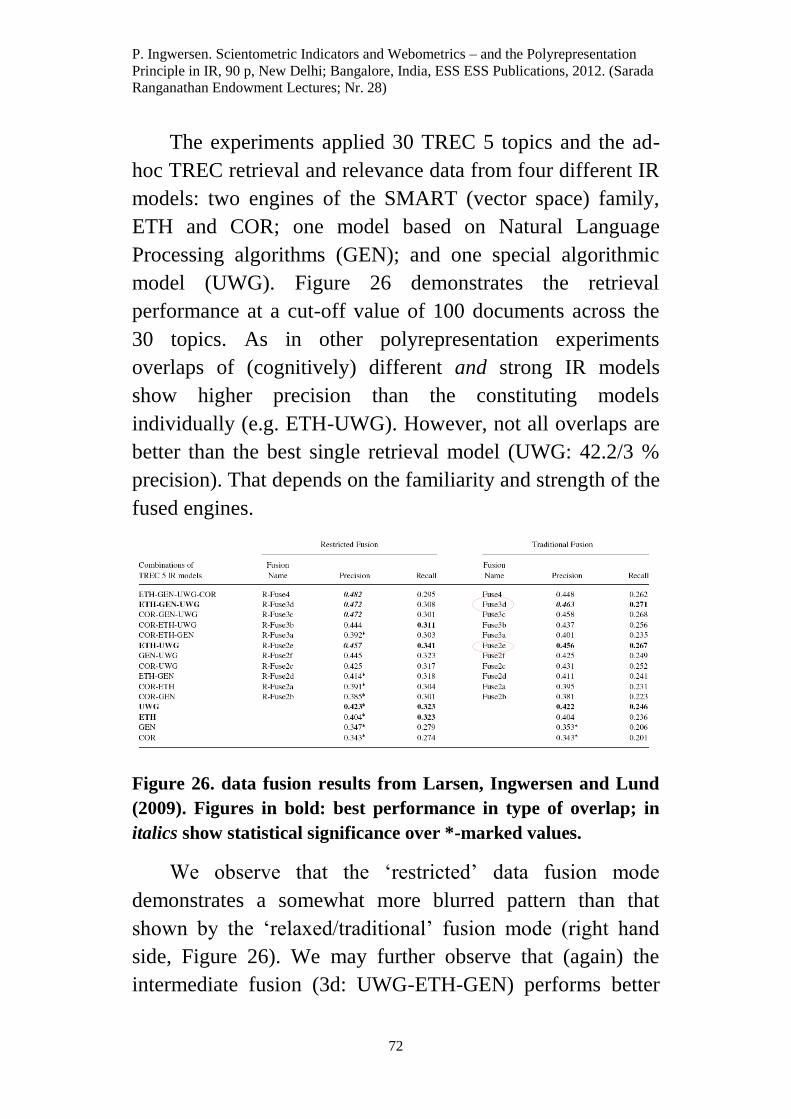
P. Ingwersen. Scientometric Indicators and Webometrics – and the Polyrepresentation
Principle in IR, 90 p, New Delhi; Bangalore, India, ESS ESS Publications, 2012. (Sarada
Ranganathan Endowment Lectures; Nr. 28)
72
The experiments applied 30 TREC 5 topics and the ad-
hoc TREC retrieval and relevance data from four different IR
models: two engines of the SMART (vector space) family,
ETH and COR; one model based on Natural Language
Processing algorithms (GEN); and one special algorithmic
model (UWG). Figure 26 demonstrates the retrieval
performance at a cut-off value of 100 documents across the
30 topics. As in other polyrepresentation experiments
overlaps of (cognitively) different and strong IR models
show higher precision than the constituting models
individually (e.g. ETH-UWG). However, not all overlaps are
better than the best single retrieval model (UWG: 42.2/3 %
precision). That depends on the familiarity and strength of the
fused engines.
Figure 26. data fusion results from Larsen, Ingwersen and Lund
(2009). Figures in bold: best performance in type of overlap; in
italics show statistical significance over *-marked values.
We observe that the ‘restricted’ data fusion mode
demonstrates a somewhat more blurred pattern than that
shown by the ‘relaxed/traditional’ fusion mode (right hand
side, Figure 26). We may further observe that (again) the
intermediate fusion (3d: UWG-ETH-GEN) performs better
P. Ingwersen. Scientometric Indicators and Webometrics – and the Polyrepresentation
Principle in IR, 90 p, New Delhi; Bangalore, India, ESS ESS Publications, 2012. (Sarada
Ranganathan Endowment Lectures; Nr. 28)
73
than the total fusion of all four IR models. This is due to the
weakness of the COR model and its only functional
difference from ETH (vector space family).
Another aspect of fusion of many different search
engines/retrieval models is demonstrated by Efron and
Winget (2010) by introducing pseudo relevance assessments
based on Polyrepresentation principles in a TREC context.
The idea was to replace the human relevance assessments,
made from many participating laboratories’ retrieval models
according to pooling strategies, by simply pooling and
weighting the retrieval results following Polyrepresentation
principles. Documents found by several engines received
higher weights according to different schemes. In this way
the performance of each retrieval engine was measured
against the pooled weighted list of documents, so to speak.
Tests demonstrate that the final ranking of the retrieval
models in between with respect to performance corresponds
quite well to the ranking made by human relevance
assessments.
One should mention that already in 2008 Baillie et al.
had proposed that the pooling strategy applied in the TREC
experiments favor retrieval based on Polyrepresentation.
Hence, when re-applying TREC datasets and retrieval results
in new (data fusion) experiments one would expect that
Polyrepresentation to be superior.
POLYREPRESENTATION in IR INTERACTION
The Glasgow IR group continued their relevance feedback
experiments from 2002 and 2003 (Ruthven et al.), but
adapted the Polyrepresentation approach in their later
experiments. White et al (2005; 2006; 2006) tested various
P. Ingwersen. Scientometric Indicators and Webometrics – and the Polyrepresentation
Principle in IR, 90 p, New Delhi; Bangalore, India, ESS ESS Publications, 2012. (Sarada
Ranganathan Endowment Lectures; Nr. 28)
74
ways of applying implicit relevance feedback in interface
designs captured from searchers through the IR interaction
process. White based several of his experiments on
simulations on users, of which the best solutions were further
tested with real test persons in the laboratory (2005; 2006).
White proposed to apply “[content-rich] search interfaces that
implement an aspect of polyrepresentation theory, and are
capable of displaying multiple representations of the retrieved
documents simultaneously in the results interface” (White,
2006, p. 1). The prototype interface implemented a
progressive revealment strategy where searchers could access
an increasing amount of retrieved document content by
following interactive relevance paths between different
representations created from the same document. Such
representations were top-ranking sentences from a retrieved
document, its title, its query-biased summary (commonly
four sentences), single summary sentences, or summary
sentences in context. By hovering over specific
representations or by clicking on icons the interface guided
the searcher further on, and the traversal of these paths was
then used by an IRF model to select terms for query
modification (White, 2006, p. 3). Three ‘simulated search’
scenarios (Borlund, 2003) were tested for retrieval
performance by means of searcher simulations of all possible
combinations of representations and paths available. The best
performing combination of representations consisted of
document title, its query-biased summary and summary
sentence in context (Larsen, Ingwersen and Kekäliänen,
2006).
The IR interaction process is valuable because it may
supply different kinds of information back to the IR system
P. Ingwersen. Scientometric Indicators and Webometrics – and the Polyrepresentation
Principle in IR, 90 p, New Delhi; Bangalore, India, ESS ESS Publications, 2012. (Sarada
Ranganathan Endowment Lectures; Nr. 28)
75
from the searcher and or his/her contextual situation. Bogers
and van den Bosch experimented with different algorithms
for recommender systems. Rating and recommendations from
many searchers over time constitute a kind of a social utility
indicator – see Lecture 2 – which is a useful tool for some
retrieval approaches. They experimented with a variety of
different recommender approaches and found, in line with
Polyrepresentation theory, that the best performance was
done by combinations of very (cognitively) different
recommender algorithms.
Also by application of IR interaction information
Beckers (2009) investigated information seeking strategies
and the use of Polyrepresentation in connection with book
retrieval. He proposed to “[support] both polyrepresentation
of information objects and multiple information seeking
strategies in order to cope with the shortcomings of most
current retrieval systems.” (p. 58). Beckers applied
Amazon.com and Library Thing representations and ratings
on the document side. He proposed a four-step model for the
IR interaction process, taking into account the
polyrepresentative nature of the documents and design of the
interface: Selection; Organization; Projection; and
Visualization.
POLYREPRESENTATION of the COGNITIVE SPACE
There are probably much more potential in the IR interaction
process than demonstrated above for capture of user-centered
and contextual data. First we discuss the experiments by
Kelly and Fu (2007) directly aimed at the searcher’s
cognitive space. In the section on Future Polyrepresentation
Research we refer to recent developments in this respect
(Lykke et al., 2010).
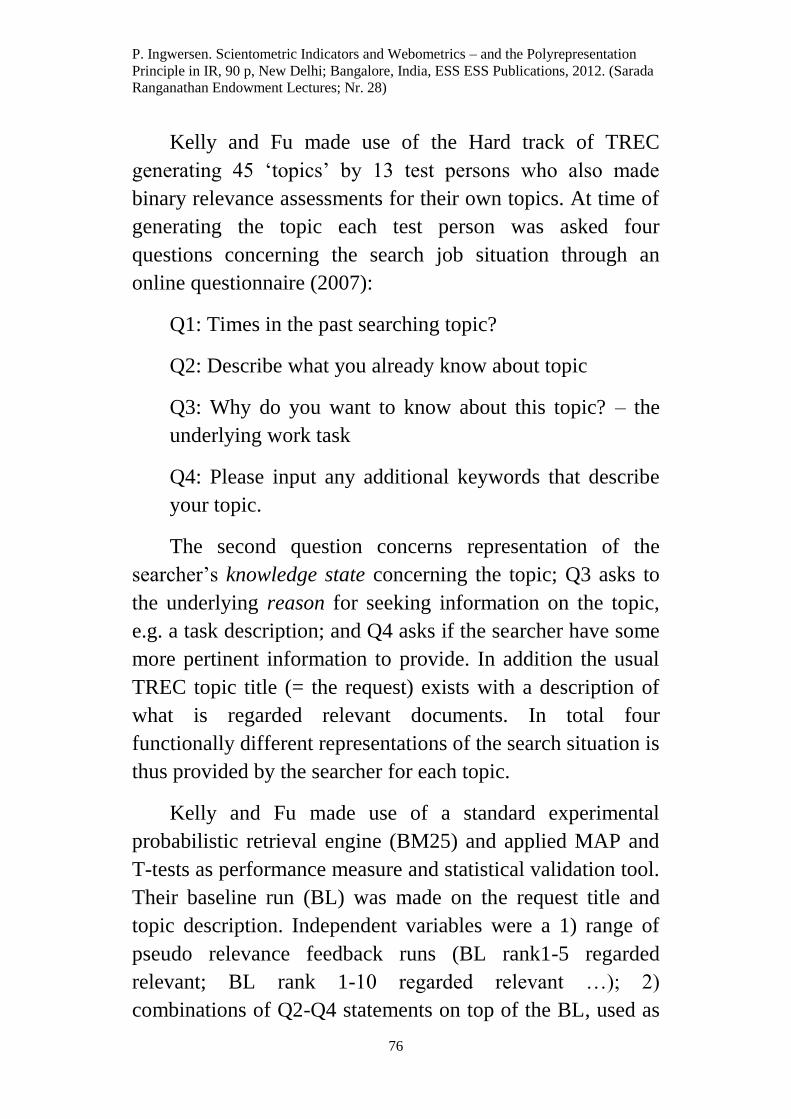
P. Ingwersen. Scientometric Indicators and Webometrics – and the Polyrepresentation
Principle in IR, 90 p, New Delhi; Bangalore, India, ESS ESS Publications, 2012. (Sarada
Ranganathan Endowment Lectures; Nr. 28)
76
Kelly and Fu made use of the Hard track of TREC
generating 45 ‘topics’ by 13 test persons who also made
binary relevance assessments for their own topics. At time of
generating the topic each test person was asked four
questions concerning the search job situation through an
online questionnaire (2007):
Q1: Times in the past searching topic?
Q2: Describe what you already know about topic
Q3: Why do you want to know about this topic? – the
underlying work task
Q4: Please input any additional keywords that describe
your topic.
The second question concerns representation of the
searcher’s knowledge state concerning the topic; Q3 asks to
the underlying reason for seeking information on the topic,
e.g. a task description; and Q4 asks if the searcher have some
more pertinent information to provide. In addition the usual
TREC topic title (= the request) exists with a description of
what is regarded relevant documents. In total four
functionally different representations of the search situation is
thus provided by the searcher for each topic.
Kelly and Fu made use of a standard experimental
probabilistic retrieval engine (BM25) and applied MAP and
T-tests as performance measure and statistical validation tool.
Their baseline run (BL) was made on the request title and
topic description. Independent variables were a 1) range of
pseudo relevance feedback runs (BL rank1-5 regarded
relevant; BL rank 1-10 regarded relevant …); 2)
combinations of Q2-Q4 statements on top of the BL, used as
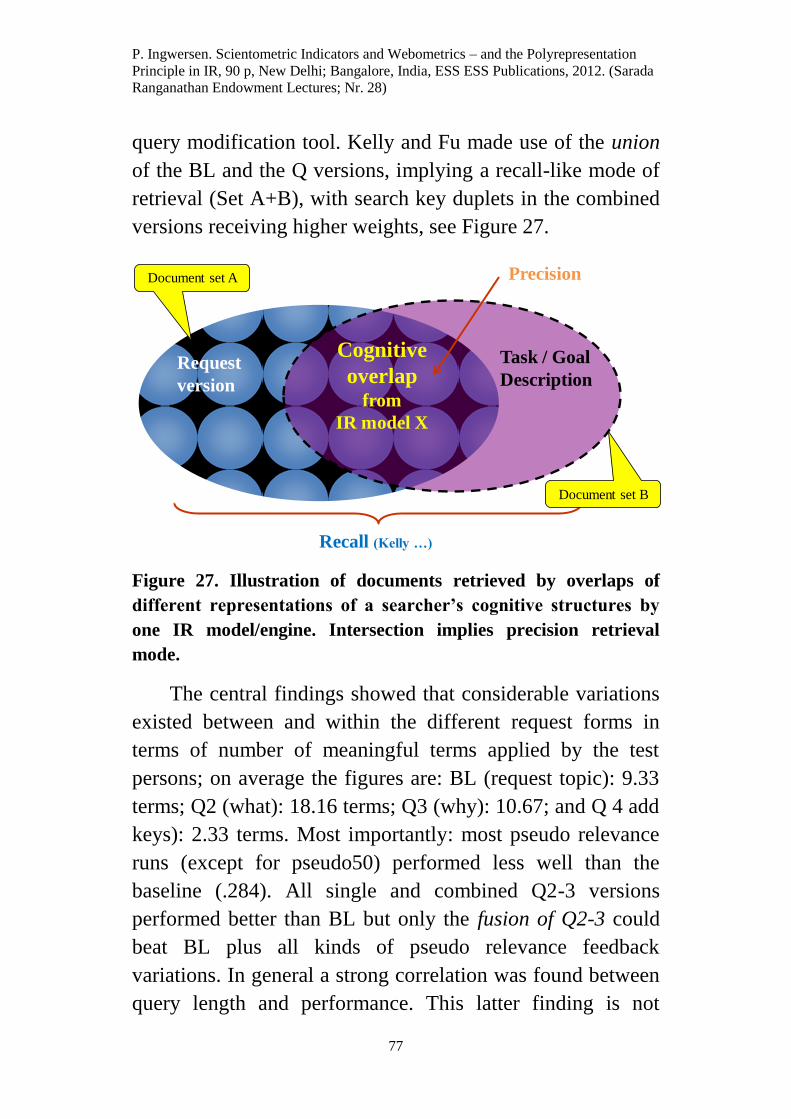
P. Ingwersen. Scientometric Indicators and Webometrics – and the Polyrepresentation
Principle in IR, 90 p, New Delhi; Bangalore, India, ESS ESS Publications, 2012. (Sarada
Ranganathan Endowment Lectures; Nr. 28)
77
query modification tool. Kelly and Fu made use of the union
of the BL and the Q versions, implying a recall-like mode of
retrieval (Set A+B), with search key duplets in the combined
versions receiving higher weights, see Figure 27.
Figure 27. Illustration of documents retrieved by overlaps of
different representations of a searcher’s cognitive structures by
one IR model/engine. Intersection implies precision retrieval
mode.
The central findings showed that considerable variations
existed between and within the different request forms in
terms of number of meaningful terms applied by the test
persons; on average the figures are: BL (request topic): 9.33
terms; Q2 (what): 18.16 terms; Q3 (why): 10.67; and Q 4 add
keys): 2.33 terms. Most importantly: most pseudo relevance
runs (except for pseudo50) performed less well than the
baseline (.284). All single and combined Q2-3 versions
performed better than BL but only the fusion of Q2-3 could
beat BL plus all kinds of pseudo relevance feedback
variations. In general a strong correlation was found between
query length and performance. This latter finding is not
Recall (Kelly …)
Request
version
Task / Goal
Description
Cognitive
overlapfrom
IR model X
PrecisionDocument set A
Document set B
P. Ingwersen. Scientometric Indicators and Webometrics – and the Polyrepresentation
Principle in IR, 90 p, New Delhi; Bangalore, India, ESS ESS Publications, 2012. (Sarada
Ranganathan Endowment Lectures; Nr. 28)
78
surprising from an IR perspective, with longer queries
commonly performing better than shorter ones.
FUTURE POLYREPRESENTATION RESEARCH
Many aspects of IR can be dealt with through
Polyrepresentation. We have reviewed a selection of studies
of some of the possibilities above. For each media, genre,
domain and document type there exist sets of cognitive actors
that may contribute a diversity of interpretations of
documents, requests, assessments, or other retrieval
phenomena. Some are quite different, being cognitively
different, others derive from the same (group of) actors, thus
being functionally different.
Time has an important impact on Polyrepresentation. For
the social utility types of interpretations, such as
rating/recommendations or use of citations/references it is a
question about how far back in time one wishes to analyze
the social phenomena. The underlying rationale for the
ratings, recommendations or citations may have changed
radically. This can be seen in the use of concepts and the
change of vocabulary over time. The same concept may
indeed exist, but under a new key (term), or a concept has
disappeared but the key (term) still exists – but with a
different meaning.
Thus, when searching a database using
Polyrepresentation, the age of the involved information
objects is central – but hitherto almost not studied. The
intuition is that all the representations, Figure 22, should be
concurrent manifestations rather than showing large temporal
variation.
P. Ingwersen. Scientometric Indicators and Webometrics – and the Polyrepresentation
Principle in IR, 90 p, New Delhi; Bangalore, India, ESS ESS Publications, 2012. (Sarada
Ranganathan Endowment Lectures; Nr. 28)
79
Another central facet of polyrepresentation lies in the
weighting of the different representations. Hitherto the
studies have assumed equal weighting for all the participating
representations/representations. However, as recently shown
by Lioma et al. (2010) other than standard (true/false) logics
are indeed available, e.g. probabilistic logic or subjective
logic. The former takes into account ignorance and
uncertainty when assessing propositions. The latter takes into
account that beliefs are held by individuals and operates on
subjective beliefs about the world in the presence of uncertain
or partially incomplete evidence.
Figure 28. Subjective logic. Consensus between independent
opinions (From Lioma et al., 2010, p.132).
Figure 28 displays how subjective logic may operate
with equal weights given to the two different observations
(representations in a Polyrepresentation sense) providing a
consensus opinion in a cognitive overlap. The effect of the
consensus operator is to reduce uncertainty. This is quite
same as done in the standard Polyrepresentation studies
discussed above. But this may not always be appropriate,
according to Lioma et al. (2010), for instance, in a topical
State x
Observer A Observer B
audb A
X
A
X
A
X
A
X ,,, audb B
X
B
X
B
X
B
X ,,,
combined opinion
A,B
B
X
A
X
BA
X ,
A and B are independent
Fair combination
P. Ingwersen. Scientometric Indicators and Webometrics – and the Polyrepresentation
Principle in IR, 90 p, New Delhi; Bangalore, India, ESS ESS Publications, 2012. (Sarada
Ranganathan Endowment Lectures; Nr. 28)
80
web search where the background knowledge may introduce
topic drift.
Consequently, one might wish to experiment with un-
equality between opinions (or representations), Figure 29.
The effect of the recommendation operator is to bias the
combination in favour of one representation, and thus
facilitating uses of contextual evidence. One may argue that
when an indexer (or indexing algorithm) makes use of an
ontology designed by other actors prior to the event, there
exists a dependency between the indexer and the ontology
construct and entities (e.g. terms). Similarly with respect to
the citing document titles and abstracts. They can be seen as
contextual (temporal event) and dependent of the document
cited. Hence one should add higher weights to such opinions.
A different track is to apply the quantum-inspired
geometrical retrieval framework, as suggested by Fromholz
et al. (2010, p. 115). “Multiple representations of documents,
like user-given reviews or the actual document content, can
give evidence towards certain facets of relevance. In this
respect polyrepresentation of documents, where such
evidence is combined, is a crucial concept to estimate the
relevance of a document. [The] paper … discusses how a
geometrical retrieval framework inspired by quantum
mechanics can be extended to support polyrepresentation. We
show by example how different representations of a
document can be modeled in a Hilbert space, similar to
physical systems known from quantum mechanics. We
further illustrate how these representations are combined by
means of the tensor product to support polyrepresentation,
and discuss the case that representations of documents are not
P. Ingwersen. Scientometric Indicators and Webometrics – and the Polyrepresentation
Principle in IR, 90 p, New Delhi; Bangalore, India, ESS ESS Publications, 2012. (Sarada
Ranganathan Endowment Lectures; Nr. 28)
81
independent from a user point of view. Besides giving a
principled framework for polyrepresentation, the potential of
this approach is to capture and formalise the complex
interdependent relationships that the different representations
can have between each other.”
Evidently there is capacity in Polyrepresentation for
developments that may enrich IR research. There exists a
need for studying which combinations of representations that
in any given case of media, genre, domain and document type
may enhance the most the performance and end result for the
searcher. It seems evident from the studies described above,
and from the general experience from data fusion research,
that low-performing engine/actor representations will reduce
performance. So, the future application of Polyrepresentation
should make use of the best performing
entities/representations combined. This also implies that
intermediate combinations of representations, such as
observed in our data fusion studies, may very well be better
performers than the total combination of several
representations.
We need to carry out more robust tests including bigger
and more recent data sets; graded relevance; real searchers,
non-textual material; and contextual information (like the
implicit relevance feedback studies by White et al.) and
citation/reference data.
Some of these requirements have been met in the ISearch
test collection, which currently is under development (Lykke
et al., 2010). ISearch comprises the integration of 160,000
journal articles in full text PDF and their abstracts, plus
additional 275,000 abstracts of articles, all from the
P. Ingwersen. Scientometric Indicators and Webometrics – and the Polyrepresentation
Principle in IR, 90 p, New Delhi; Bangalore, India, ESS ESS Publications, 2012. (Sarada
Ranganathan Endowment Lectures; Nr. 28)
82
arxiv.com portal on Physics and Computer Science. In
addition the collection includes 18,000 book records from
research libraries and is based on 65 real research tasks
represented by 5 situational facets constructed by Physics
PhD students and staff at universities who also preformed the
four-scale graded relevance assessments.
We hope to publish further polyrepresentation and
integrated search findings based on this collection in the
future.
References
Adamic, L. (1999). “The small world Web.” Lecture Notes in
Computer Science, 1696, 443-452.
Aguillo, I. F. (1998). “STM information on the Web and the
development of new Internet R&D databases and indicators.” Online
Information 98, Proceedings, 239-243.
Allen, E.S., Burke, J.M., Welch, M.E., Rieseberg, L.H. (1999). „How
reliable is science information on the Web?” Science, 402, 722.
Almind, T. C., and Ingwersen, P. (1997). ”Infometric analyses on the
World Wide Web, Methodological approaches to ‘webometrics’.”
Journal of Documentation, 53(4), 404-426.
Baillie, M., Azzopardi, L., & Ruthven, I. (2008). “Evaluating
epistemic uncertainty under incomplete assessments.” Information
Processing & Management, 44(2), 811–837.
Bar-Ilan, J. (1997). “The “mad cow disease,” Usenet newsgroups and
bibliometric laws.” Scientometrics, 39( 1), 29-55.
Bar-Ilan, J. (2004). “The use of Web search engines in information
science research.” Annual Review of Information Science and
Technology, 38, 231-288.
P. Ingwersen. Scientometric Indicators and Webometrics – and the Polyrepresentation
Principle in IR, 90 p, New Delhi; Bangalore, India, ESS ESS Publications, 2012. (Sarada
Ranganathan Endowment Lectures; Nr. 28)
83
Beckers, T. (2009). “Supporting Polyrepresentation and Information
Seeking Strategies.” In Proceedings of the 3rd Symposium on Future
Directions in Information Access (FDIA), 56–61.
Belkin, N.J., Kantor, P., Fox, E. and Shaw, J.A. (1995). “Combining
the evidence of multiple query representations for information
retrieval.” Information Processing & Management, 31, 431-448.
Björneborn, L. (2001). “Small-world linkage and co-linkage.”
Proceedings of the 12th
ACM Conference on Hypertext, 133-134.
Bjorneborn, L., and Ingwersen, P. (2001). “Perspectives of
webometrics.” Scientometrics, 50(1), 65-82.
Björneborn, L., and Ingwersen, P. (2004). „Towards a basic
framework for webometrics.” Journal of American Society for
Information Science and Technology, 55(14), 1216-1227.
Bogers, T. and van den Bosch, A. (2011). Fusing Recommendations
for Social Bookmarking Websites. International Journal of Electronic
Commerce, 15(3), 33–75.
Borlund, P. (2003): “The IIR evaluation model : a framework for
evaluation of interactive information retrieval systems.” Information
Research, 8(3), paper no. 152.
[http://informationr.net/ir/8-3/paper152.html]
Brin, S., and Page, L. (1998). „The anatomy of a large scale
hypertextual web search engine.” Computer Networks and ISDN
Systems, 30(1-7), 107-117.
Broder, A. et al. (2000). “Graph structure in the Web.” Computer
Networks, 33(1-6), 309-320.
Chavan, V. .S and Ingwersen, P. (2010). “Towards a Data Publishing
Framework for Primary Biodiversity Data, Challenges and
Potentials.” BMC Bioinformatics, 2009, 10 (Suppl. 14),S2.
P. Ingwersen. Scientometric Indicators and Webometrics – and the Polyrepresentation
Principle in IR, 90 p, New Delhi; Bangalore, India, ESS ESS Publications, 2012. (Sarada
Ranganathan Endowment Lectures; Nr. 28)
84
Christensen, F.H., Ingwersen, P., and Wormell, I. (1997). „Online
determination of the journal impact factor and its international
properties.” Scientometrics, 40(3), 529-540.
Christoffersen, M. (2004). “Identifying core documents with a
multiple evidence relevance filter.”Scientometrics, 61(3), 385-394.
Chu, H., He, S., and Thelwall, M. (2002). “Library and information
science schools in Canada and USA, A Webometric perspective.”
Journal of Education for Library and Information Science, 43(2).
Croft, W.B. and Thomson, R.H. (1987). ”I3R: A new approach to the
design of document retrieval systems.” Journal of the American
Society for Information Science, 38(6), 389-404.
De Solla Price, D. (1986). “Little Science, Big Science … and
Beyond.” With foreword by Robert Merton and Eugene Garfield.
Washington, Columbia University Press.
Efron, M. and Winget, M. (2010). “Query polyrepresentation for
ranking retrieval systems without relevance judgments. Journal of the
American Society for Information Science and Technology, 61(6),
1081-1091.
Elleby, A., and Ingwersen, P. (2010). “Publication Point Indicators, A
Comparative Case Study of two Publication Point Systems and
Citation Impact in an Interdisciplinary Context.” Journal of
Informetrics, 2010, 4, 512-523.
Elsevier. “Scopus”. Available at, http://www.scopus.com/
Frommholz, I., Larsen, B., Piwowarski, B., Lalmas, M., Ingwersen, P.
& van Rijsbergen, K. (2010). ”Supporting polyrepresentation in a
quantum-inspired geometrical retrieval framework. In: Belkin, N. J. &
Kelly, D. (eds.), IIiX'10 Proceeding of the Third Symposium on
Information Interaction in Context, New Brunswick, NJ, USA, August
18-21, 2010.. New York, ACM Press, 115-124.
P. Ingwersen. Scientometric Indicators and Webometrics – and the Polyrepresentation
Principle in IR, 90 p, New Delhi; Bangalore, India, ESS ESS Publications, 2012. (Sarada
Ranganathan Endowment Lectures; Nr. 28)
85
Garfield, E. (1979). “Citation indexing: Its theory and application in
science, technology and humanities.” New York, NY: Wiley
[Reprinted by ISI Press, 1983].
Garfield, E. (1993). “KeyWord Okys (TM): Algorithmic derivative
indexing.” Journal of the American Society for Information Science,
44(5), 298–299.
Global Biodiversity Information Facility (GBIF) – available at,
http://data.gbif.org
Glänzel, W. (2004). Keynote Lecture at the Nordic Bibliometric
Meeting, sepetmber. Umeå University, Sweden.
Granovetter, M.S. (1973). “The strength of weak ties.” American
Journal of Sociology, 78(6), 1360-1380.
Heidorn, P.B. (2008). “Shedding light on the dark data in the long tail
of science.” Library Trends, 57(2).
[https,//www.ideals.uiuc.edu/bitstream/handle/2142/9127/Heidorn_Lo
ngTail_PreprintwEdits.doc.pdf?sequence=7].
Holmberg, K. (2009). “Webometric Network Analysis, Mapping
Cooperation and Geopolitical Connections between Local
Government Administration on the Web”. Doctoral Dissertation. Åbo,
Åbo Akademi University Press. Available at,
http://urn.fi/URN,ISBN,978-951-765-511-8
Holmberg, K. (2010). “Web Impact Factors, A significant contribution
to Webometric research.” In, Larsen, B. (ed.), The Janus-faced
Scholar, A festschrift in Honor of Peter Ingwersen. Royal School Of
Library and Information Science and ISSI, 127-134.
Ingwersen, P. (1992).”Information Retrieval Interaction”. London,
Taylor Graham.
Ingwersen, P. (1996). “Cognitive perspectives of information retrieval
interaction: Elements of a cognitive IR theory.” Journal of
Documentation, 52, 3–50.
P. Ingwersen. Scientometric Indicators and Webometrics – and the Polyrepresentation
Principle in IR, 90 p, New Delhi; Bangalore, India, ESS ESS Publications, 2012. (Sarada
Ranganathan Endowment Lectures; Nr. 28)
86
Ingwersen, P. (1998). “The calculation of Web Impact Factors.”
Journal of Documentation, 54, 236-243
Ingwersen, P. and Chavan, V. S. (2011). “Indicators for a data usage
index, an incentive for publishing primary biodiversity data through a
global information infrastructure.” BMC Bioinformatics (in press).
Ingwersen, P., and Järvelin, K. (2005). “The Turn, Integration of
Information Seeking and Retrieval in Context.” Heidelberg, Springer.
Ingwersen, P., Larsen, B., and Kekäläinen, J. (2006). “ The
polyrepresentation continuum in IR.” In, Ruthven, I., et al. (eds.),
Information Interaction in Context, Proceedings of the International
Symposium on Information Interaction in Context (IiiX 2006).
Copenhagen; New York, Royal School of Library and Information
Science /ACM Press, 148-162.
Ingwersen, P., Larsen, B, Rousseau, R., and Russell, J. (2001). “The
publication-citation matrix and its derived quantities.” Chinese
Science Bulletin, 46(6), 524-528.
Ingwersen, P., Schneider, J.W., Scharff, M., and Larsen, B. (2007). ”
A national research profile-based Immediacy Index and citation ratio
indicator for research evaluation.” In, Torres-Salinas, D., and Moed,
H.F. (eds.), Proceedings of the 11th
ISSI Conference. Madrid,
CINDOC, 864-865.
Järvelin, K., and Persson, O. (2008). “The DCI index, Discounted
cumulated impact-based research evaluation.” Journal of the
American Society for Information Science andTechnology, 59(9),
1433–1440.
Järvelin, K., and Kekäläinen, J. (2002). “Cumulated gain-based
evaluation of IR techniques”. ACM Transactions on Information
Systems (ACM TOIS), 20(4), 422-446.
Jepsen, E.T., Seiden, P., Ingwersen, P., Björneborn, L., and Borlund,
P. (2004). „Characteristics of scientific Web publications, Preliminary
P. Ingwersen. Scientometric Indicators and Webometrics – and the Polyrepresentation
Principle in IR, 90 p, New Delhi; Bangalore, India, ESS ESS Publications, 2012. (Sarada
Ranganathan Endowment Lectures; Nr. 28)
87
data gathering and analysis.” Journal of American Society for
Information Science and Technology, 55(14), 1239-1249.
Jacso, P. (2008). “Google Scholar revisited.” Online Information
Review, 32(1), 102-114. Available,
http://www.emeraldinsight.com/Insight/ViewContentServlet?Filenam
e=Published/EmeraldFullTextArticle/Articles/2640320108.html
Kekäläinen, J. & Järvelin, K. (2000). “The co-effects of query
structure and expansion on retrieval performance in probabilistic text
retrieval.” Information Retrieval, 1(4), 329-344.
Kelly, D., & Fu, X. (2007). “Eliciting better information need
descriptions from users of information search systems.” Information
Processing & Management, 43(1), 30–46.
Kleinberg, J., and Lawrence, S. (2001). “The structure of the Web.”
Science, 294, 1849-1850.
Kousha, K., and Thelwall, M. (2007). “How is Science cited on the
Web? A classification of Google unique Web citations.” Journal of
American Society for Information Science and Technology, 58(11),
1631-1644.
Larsen, B. (2002). “Exploiting citation overlaps for information
retrieval: Generating a boomerang effect from the network of
scientific papers.” Scientometrics, 54(2), 155-178.
Larsen, B., Ingwersen, P. and Kekäläinen, J. (2006). ”The
Polyrepresentation continuum in IR.” In: Information Interaction in
Context: Proceedings of the First IIiX Symposium, Copenhagen.
ACM Press, 148-162.
Larsen, B., Ingwersen, P. and Lund, B. (2009).” Data Fusion
According to the Principle of Polyrepresentation”. .” Journal of
American Society for Information Science and Technology, 60(4),
646-654.
Lawrence, S., and Giles, C. L. (1999). “Accessibility and distribution
of information on the Web.” Nature, 400, 107-110.
P. Ingwersen. Scientometric Indicators and Webometrics – and the Polyrepresentation
Principle in IR, 90 p, New Delhi; Bangalore, India, ESS ESS Publications, 2012. (Sarada
Ranganathan Endowment Lectures; Nr. 28)
88
Li, X.M., Thelwall, M., Musgrove, P., and Wilkinson, D. (2003). “The
relationship between the WIFs or inlinks of Computer Science
Departments in UK and their RAE ratings or research productivities in
2001.” Scientometrics, 57(2), 239-255.
Lioma, C., Larsen, B., Schütze, H. and Ingwersen, P. (2010). “A
Subjective Logic Formalization of the Principle of Polyrepresentation
for Information Needs.” In, Belkin, N. J. and Kelly, D. (ed.), IIiX'10
Proceeding of the Third Symposium on Information Interaction in
Context, New Brunswick, NJ, USA, August 18-21, 2010. New York,
ACM, 125-134.
Lykke, M., Larsen, B., Lund, H. and Ingwersen, P. (2010).
“Developing a Test Collection for the Evaluation of Integrated Search.
In: Advances in Information Retrieval.” Proceedings of 32nd
European Conference on IR Research, ECIR 2010, Milton Keynes,
UK, March 28-31, (p. 627-630). Berlin, Springer. DOI- 10.1007/978-
3-642-12275-0_63.
McCain, K.W. (1989). “Descriptor and citation retrieval in the
medicine behavioral sciences literature: Retrieval overlaps and
novelty distribution.” Journal of the American Society for Information
Science, 40, 110-114.
Moed, H.F. (2005). “Citation analysis in research evaluation”.
Dordrecht, Springer.
Moed, H., de Bruin, R.E., and van Leuven, Th.N. (1995). “New
bibliometric tools for the assessment of national research
performance, database description, overview of indicators and first
applications.” Scientometrics, 33, 381-442.
Nielsen Blog Pulse; available, http://www.blogpulse.com/tools.html
Pao, M. (1994). “Relevance odds of retrieval overlaps from seven
search fields.” Information Processing & Management, 30(3), 305-
314.
Rao, I.K.R. (2008). “Growth of Literature and Measures of Scientific
Productivity – Scientometric Models.” New Delhi, Ess Ess
P. Ingwersen. Scientometric Indicators and Webometrics – and the Polyrepresentation
Principle in IR, 90 p, New Delhi; Bangalore, India, ESS ESS Publications, 2012. (Sarada
Ranganathan Endowment Lectures; Nr. 28)
89
Publications for Serada Ranganathan Endowment for Library Science,
Bangalore.
Ruthven, I., Lalmas, M. and van Rijsbergen, K. (2002). “Ranking
expansion terms with partial and ostensive evidence. “ In: Bruce, H. et
al. (Eds.) Emerging Frameworks and Methods. Proceedings of the 4th
International Conference on Conceptions of Library and Information
Science (CoLIS 4), July 21-25, 2002, Seattle, USA. Greenwood
Village, CO: Libraries Unlimited, 199-220.
Ruthven, I., Lalmas, M. and van Rijsbergen, K. (2003). “Incorporating
user search behaviour into relevance feedback. “ Journal of the
American Society for Information Science and Technology, 54(6),
529-549.
Schneider, J.W. (2009). “An outline of the bibliometric indicator used
for performance-based funding of research institutions in Norway.”
European Political Science, 8(3), 364-378.
Skov, M., Larsen, B. and Ingwersen, P. (2008). “Inter and intra-
document contexts applied in polyrepresentation for best match IR.”
Information Processing & Management, 44(5), 1673–1683.
Smith, A. G. (1999). “A tale of two Webspaces, Comparing sites
using Web impact factors.” Journal of Documentation, 55(5), 577-
592.
Smith, A. G., and Thelwall, M. (2002). “Web impact factors for
Australasian universities.” Scientometrics, 54(3), 363-380.
Swanson, D.R. (1986).” Undiscovered public knowledge.” Library
Quarterly, 56(2), 103-118.
Thelwall, M. (2000). “Web impact factors and search engine
coverage.” Journal of Documentation, 56, 185-189.
Thelwall, M. (2002). “Conceptualizing documentation on the Web,
An evaluation of different heuristic-based models for counting links
between university Web sites.” Journal of American Society for
Information Science and Technology, 53(12), 995-1005.
P. Ingwersen. Scientometric Indicators and Webometrics – and the Polyrepresentation
Principle in IR, 90 p, New Delhi; Bangalore, India, ESS ESS Publications, 2012. (Sarada
Ranganathan Endowment Lectures; Nr. 28)
90
Thelwall, M. (2003). “Web use and peer interconnectivity metrics for
academic Web sites. Journal of Information Science, 29(1), 1-10.
Thelwall, M., Vaughan, L., and Björneborn, L. (2005).
“Webometrics.”Annual Review of Information Science and
Technology, Chapter 3, 81-135.
Thelwall, M., and Harries, G. (2004). “Do better scholars’ web
publications have significantly higher online impact?” Journal of the
American Society for Information Science and Technology, 55(2),
149-159.
Thomson-Reuters. “Web of Science”. Available at,
http://www.isiknowldge.com/
Ulrich Database, see http://ulrichbase.com
van Raan, A.F.J. (1999). ”Advanced Bibliometric methods for the
evaluation of universities”. Scientometrics, 45(3), 417-423.
White, R.W. (2006). “Using searcher simulations to redesign a
polyrepresentative implicit feedback interface.” Information
Processing & Management, vol. 42(5), 1185-1202.
White, R.W., Jose, J.M. & Ruthven, I. (2006b). “An implicit feedback
approach for interactive information retrieval.” Information
Processing & Management,vol. 42(1), 166-190.
White, R.W., Ruthven, I. & Jose, J.M. & van Rijsbergen, C.J. (2005).
“Evaluating implicit feedback models using searcher simulations.”
ACM Transactions on Information Systems, 23(3), 325-361.
Yahoo Site Explorer; available at
http://siteexplorer.search.yahoo.com/new/