Embed Size (px)
Citation preview
Volume 4 Issue 2 October 2016 ISSN: 2321 – 788X
Shanlax International Journal of Arts, Science & Humanities 90
SCIENTOMETRICS TOOLS AND TECHNIQUES: AN OVERVIEW
T.BrindhaPh.D., Research Scholar (Part-Time), Bharathiyar University, Coimbatore
Dr.N.MurugesapandianLibrarian & Head(Rtd), Dept. of Library and Information Science,
Ganesar College of Arts and Science, Melasivapuri,Pudhukottai, TN
IntroductionJournals play an important role in scholarly communication. Periodicals are
sensitive indicators of the emerging new ideas in any discipline. They reveal the existingproblems requiring solution, research pattern to solve these problem, the practices fixed tovarious areas etc. “A scientific paper or text not only reveals the world building strategy ofits authors, but also the nature and force of the building blocks derived from the domain ofscience from which it draws and to which it contributes” [GUPTA & KUMAR, 2001].
The application of statistics to any scientific communication channels is calledscientometrics. Scientometrics is a branch of science. Scientometricians explain aboutinput and outputs resource in terms of organizational structure. They develop benchmarksto evaluate the quality of information resources and packages of information for decisionmaking in science. It provides a key opportunity to the researcher to publish their articleswith new strategies, innovations, new methods and new ideas.
Scientometrics – Term OriginThe term ‘Scientometrics’ was originated from a Russian word (naukometriya) and
coined by Vassily V.Nalimov and Z.M.Mulchenko in the year 1969. This term is mainly usedfor the study of all aspects of the literature of science and technology. The term hadgained wide recognition in the year 1978 by the foundation of the journal ‘Scientometrics’by Tiber Braun in Hungary. According to its subtitle, Scientometrics includes allquantitative aspects of the science of science, communication in science and sciencepolicy.
Scientometrics - DefinitionsNalimov and Mulchenko (1969) or USSR defined Scientometrics as the quantitative
method which deals with the analysis of science viewed as an information process.Beck (1978) defined Scientometrics as a stidy of the quantitative evaluation and intercomparison of scientific activity, productivity and progress.
Volume 4 Issue 2 October 2016 ISSN: 2321 – 788X
Shanlax International Journal of Arts, Science & Humanities 91
Bookstein (1995) defined Scientometrics as “the science of measuring science”.From the above definitions, it is clear that Scientometrics provides information
about the structure of knowledge and the way it is communicated; measures thepublication patterns of all forms of written communication; provides evaluative measuresto indicate individual country’s output; indicate the citation pattern of literature andstudies the use of documents.
Applications of ScientometricsScientometrics as a technique has extensive applications in identifying the research
trends in a subject, trends in an authorship and collaboration in research, core periodicals,obsolescence and dispersion of scientific literature useful in estimating the comprehensiveof secondary periodicals, studying the author’s productivity and impact of research,distribution of scientific publications by the research organization, citation studies and soon. Further, Scientometrics could be used in the identification of emerging research areas.
Timeline of ScientometricsEarly19th
century
Origins of bibliometric research inareas such as law & psychology
1926-1948
Lotka's Law, Zif's Law andBradford's Law developed.
In 1955 Eugene Garfield first describes theImpact Factor
In 1961 Publication of the ScienceCitation Index
In 1978 Launch of first dedicated journal,Scientometrics
1960s-70s
Growth of databases makeWidespread citation analysis areal possibility
Scientometrics Tools and PurposesThe scientometric tools are very much essential for accurate analysis of literature.
In scientometrics the qualitative as well as quantitative analysis are carried out by usingscientometrics tools like citation mapping, visualization, bibliographic coupling,co-authorship network, co-words mapping etc..Authormap - For Citation Mapping and Visualization. Explores author
relationships through co-citation patterns.Bibcouple.exe - For Visualization of the bibliographic coupling among authors
using WoS setBibexcel - For analyzing bibliographic data and used for co-citation ,
bibliographic coupling, mapping and clustering analysisBibJourn.exe - For Visualization of the bibliographic coupling in terms of cited
journalsCitespace - For Visualizing patterns and trends in scientific literature
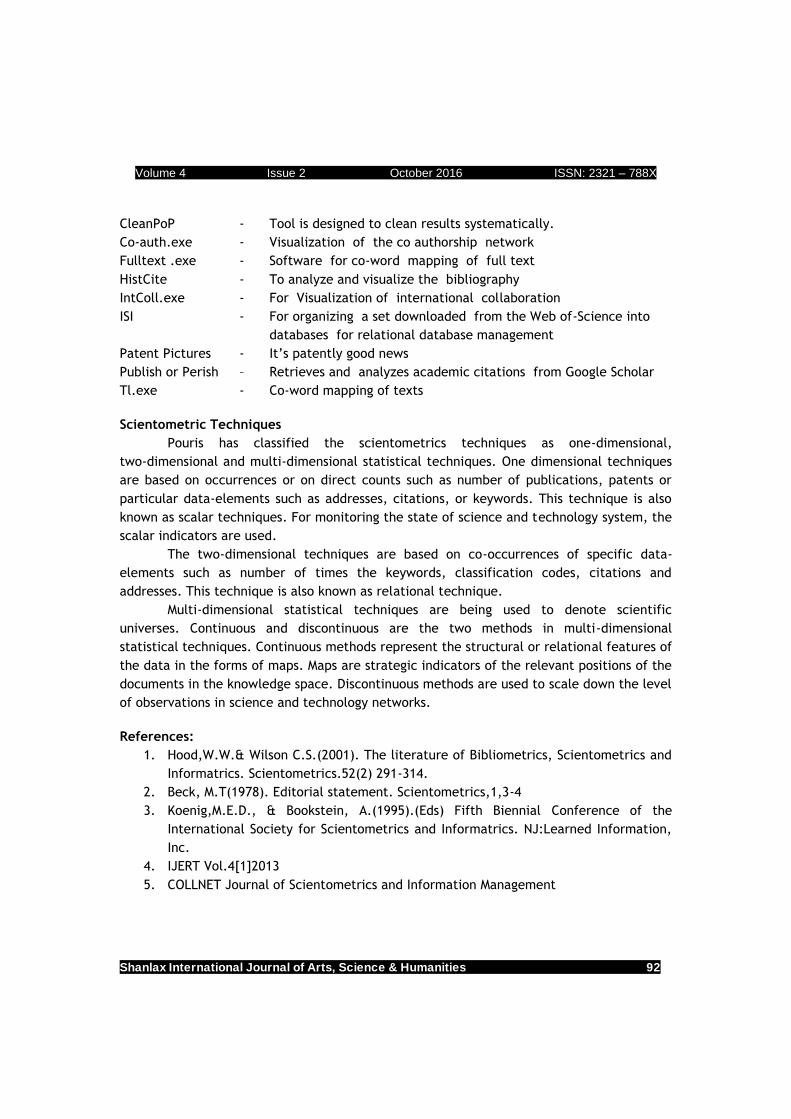
Volume 4 Issue 2 October 2016 ISSN: 2321 – 788X
Shanlax International Journal of Arts, Science & Humanities 92
CleanPoP - Tool is designed to clean results systematically.Co-auth.exe - Visualization of the co authorship networkFulltext .exe - Software for co-word mapping of full textHistCite - To analyze and visualize the bibliographyIntColl.exe - For Visualization of international collaborationISI - For organizing a set downloaded from the Web of-Science into
databases for relational database managementPatent Pictures - It’s patently good newsPublish or Perish – Retrieves and analyzes academic citations from Google ScholarTl.exe - Co-word mapping of texts
Scientometric TechniquesPouris has classified the scientometrics techniques as one-dimensional,
two-dimensional and multi-dimensional statistical techniques. One dimensional techniquesare based on occurrences or on direct counts such as number of publications, patents orparticular data-elements such as addresses, citations, or keywords. This technique is alsoknown as scalar techniques. For monitoring the state of science and technology system, thescalar indicators are used.
The two-dimensional techniques are based on co-occurrences of specific data-elements such as number of times the keywords, classification codes, citations andaddresses. This technique is also known as relational technique.
Multi-dimensional statistical techniques are being used to denote scientificuniverses. Continuous and discontinuous are the two methods in multi-dimensionalstatistical techniques. Continuous methods represent the structural or relational features ofthe data in the forms of maps. Maps are strategic indicators of the relevant positions of thedocuments in the knowledge space. Discontinuous methods are used to scale down the levelof observations in science and technology networks.
References:1. Hood,W.W.& Wilson C.S.(2001). The literature of Bibliometrics, Scientometrics and
Informatrics. Scientometrics.52(2) 291-314.2. Beck, M.T(1978). Editorial statement. Scientometrics,1,3-43. Koenig,M.E.D., & Bookstein, A.(1995).(Eds) Fifth Biennial Conference of the
International Society for Scientometrics and Informatrics. NJ:Learned Information,Inc.
4. IJERT Vol.4[1]20135. COLLNET Journal of Scientometrics and Information Management