Embed Size (px)
Citation preview
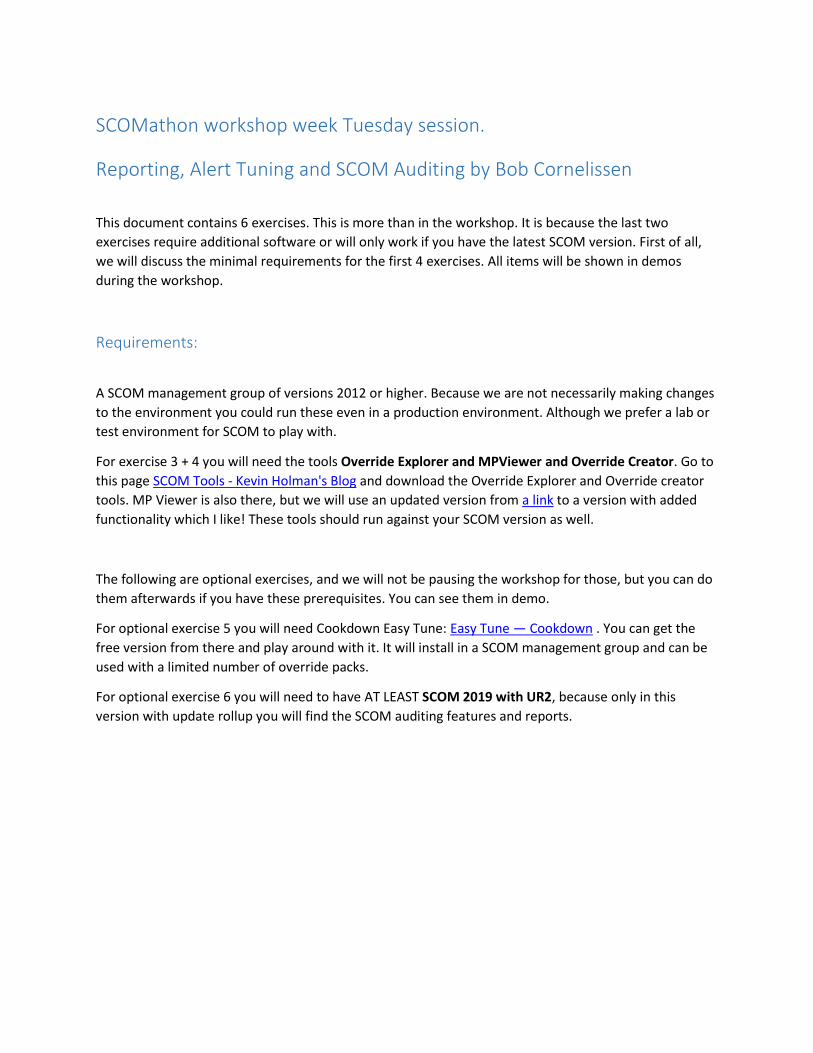
SCOMathon workshop week Tuesday session.
Reporting, Alert Tuning and SCOM Auditing by Bob Cornelissen
This document contains 6 exercises. This is more than in the workshop. It is because the last two
exercises require additional software or will only work if you have the latest SCOM version. First of all,
we will discuss the minimal requirements for the first 4 exercises. All items will be shown in demos
during the workshop.
Requirements:
A SCOM management group of versions 2012 or higher. Because we are not necessarily making changes
to the environment you could run these even in a production environment. Although we prefer a lab or
test environment for SCOM to play with.
For exercise 3 + 4 you will need the tools Override Explorer and MPViewer and Override Creator. Go to
this page SCOM Tools - Kevin Holman's Blog and download the Override Explorer and Override creator
tools. MP Viewer is also there, but we will use an updated version from a link to a version with added
functionality which I like! These tools should run against your SCOM version as well.
The following are optional exercises, and we will not be pausing the workshop for those, but you can do
them afterwards if you have these prerequisites. You can see them in demo.
For optional exercise 5 you will need Cookdown Easy Tune: Easy Tune — Cookdown . You can get the
free version from there and play around with it. It will install in a SCOM management group and can be
used with a limited number of override packs.
For optional exercise 6 you will need to have AT LEAST SCOM 2019 with UR2, because only in this
version with update rollup you will find the SCOM auditing features and reports.
Exercise 1 – Performance Detail report
• Within the Operations Manager Console, browse to the Reporting Pane.
• In the Microsoft Generic Report Library folder, open the report named Performance Detail.
• On the left-hand side of the parameters screen change the From field to Yesterday.
• On the right-hand side near the top click the Change button. This opens another screen with 3
sections.
• Above the top section click New series.
• Now in the bottom-left section click the Add Group button.
• Type Windows Computers and click the Search button
• In the middle select the All Windows Computers group and click the Add button.
• The group will be visible in the bottom selected objects area. Click OK.
• In the bottom-right section click the Browse button.
• In the Rule Name box type Processor time and click the Search button.
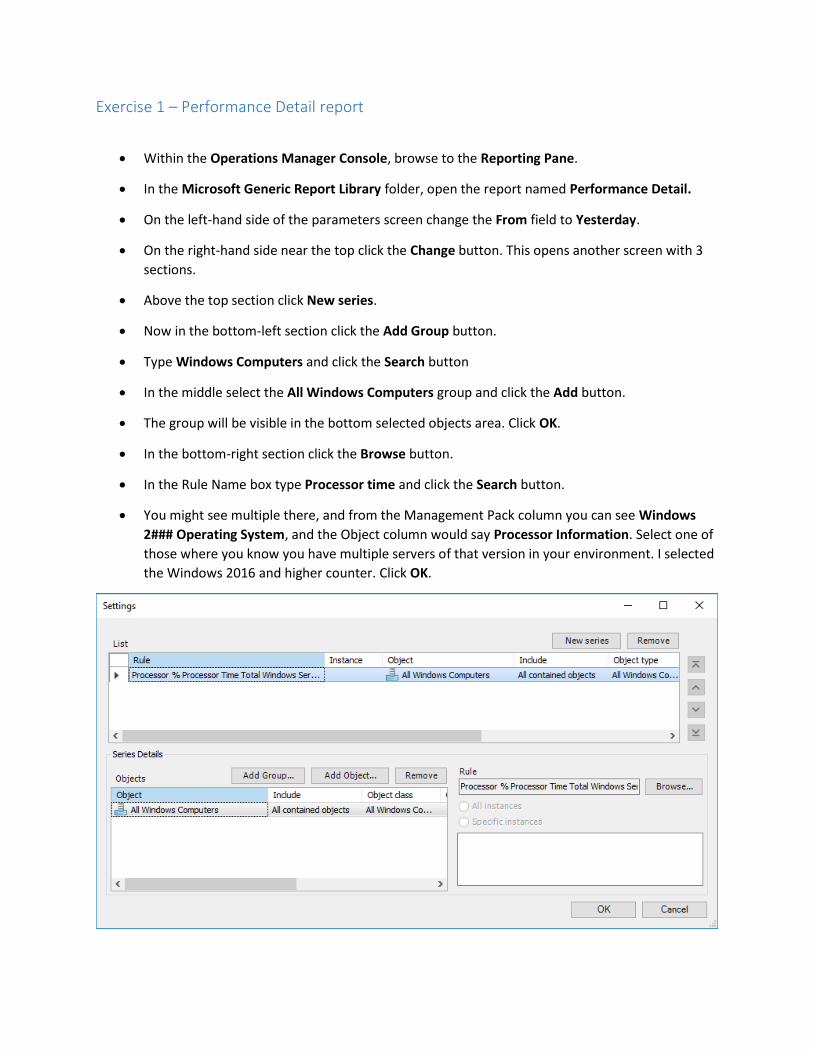
• You might see multiple there, and from the Management Pack column you can see Windows
2### Operating System, and the Object column would say Processor Information. Select one of
those where you know you have multiple servers of that version in your environment. I selected
the Windows 2016 and higher counter. Click OK.
• If the result looks like the above, click the OK button at the bottom.
• Now you have selected parameters for the report, Run the report by using the Run button in the
top menu marked with a green play button.
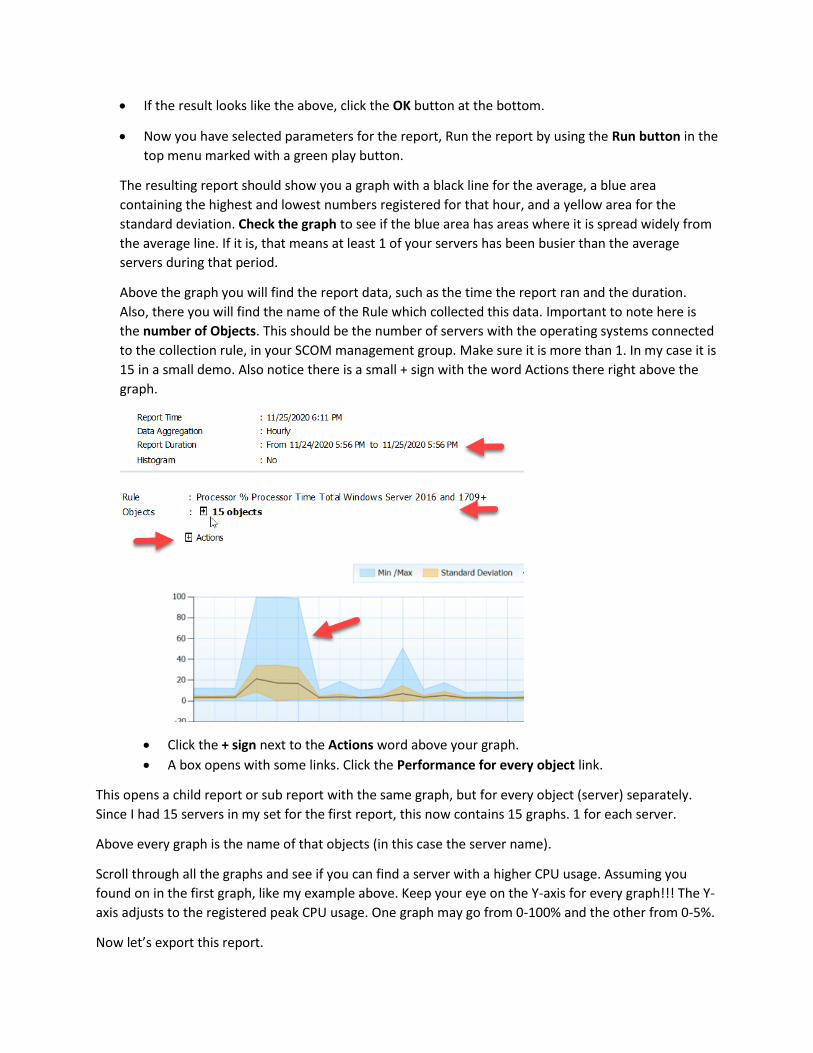
The resulting report should show you a graph with a black line for the average, a blue area
containing the highest and lowest numbers registered for that hour, and a yellow area for the
standard deviation. Check the graph to see if the blue area has areas where it is spread widely from
the average line. If it is, that means at least 1 of your servers has been busier than the average
servers during that period.
Above the graph you will find the report data, such as the time the report ran and the duration.
Also, there you will find the name of the Rule which collected this data. Important to note here is
the number of Objects. This should be the number of servers with the operating systems connected
to the collection rule, in your SCOM management group. Make sure it is more than 1. In my case it is
15 in a small demo. Also notice there is a small + sign with the word Actions there right above the
graph.
• Click the + sign next to the Actions word above your graph.
• A box opens with some links. Click the Performance for every object link.
This opens a child report or sub report with the same graph, but for every object (server) separately.
Since I had 15 servers in my set for the first report, this now contains 15 graphs. 1 for each server.
Above every graph is the name of that objects (in this case the server name).
Scroll through all the graphs and see if you can find a server with a higher CPU usage. Assuming you
found on in the first graph, like my example above. Keep your eye on the Y-axis for every graph!!! The Y-
axis adjusts to the registered peak CPU usage. One graph may go from 0-100% and the other from 0-5%.
Now let’s export this report.
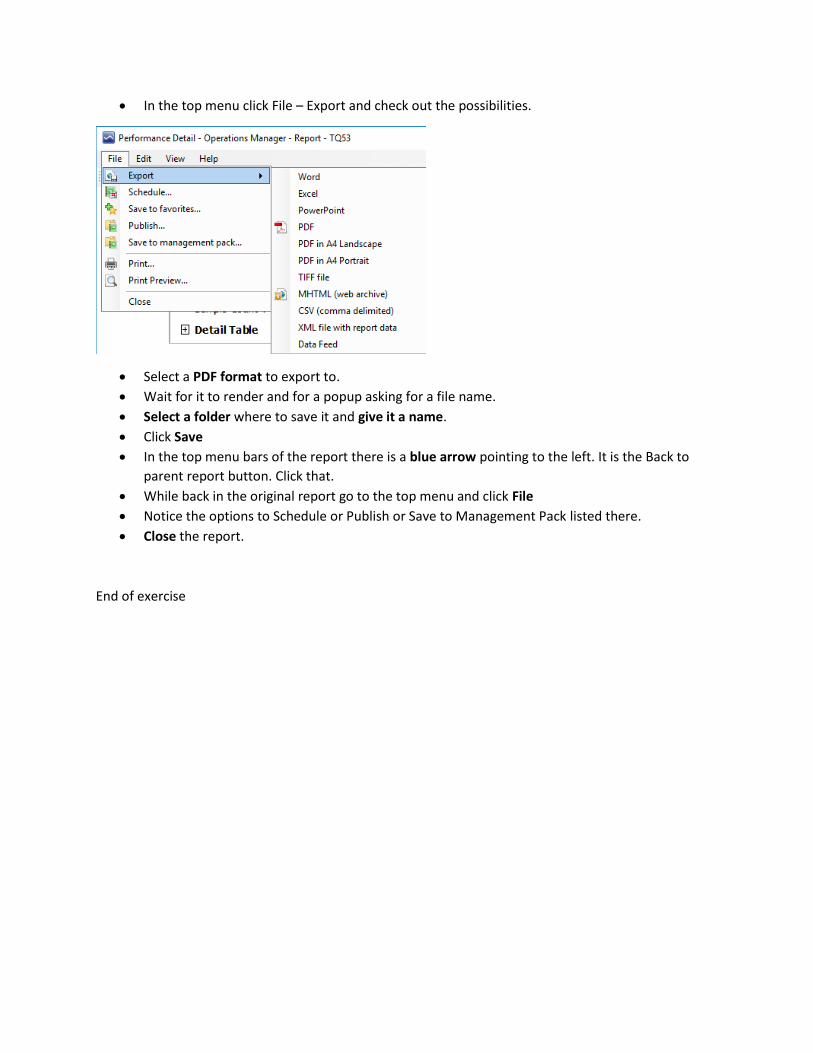
• In the top menu click File – Export and check out the possibilities.
• Select a PDF format to export to.
• Wait for it to render and for a popup asking for a file name.
• Select a folder where to save it and give it a name.
• Click Save
• In the top menu bars of the report there is a blue arrow pointing to the left. It is the Back to
parent report button. Click that.
• While back in the original report go to the top menu and click File
• Notice the options to Schedule or Publish or Save to Management Pack listed there.
• Close the report.
End of exercise
Exercise 2 – Data Volume by management pack report
• Within the Operations Manager Console, browse to the Reporting Pane.
• In the System Center Core Monitoring Reports folder, open the report named Data Volume by
Management Pack.
• Run the report with the following parameters:
o From: Yesterday
o To: Today
o Show Top: 30
• Sort the Perf Count column to get the highest numbers on top. In most cases the top few rows
are based on performance counter numbers anyway.
• Write down which management packs are generating the top 3 most performance counter
entries.
• Click the highest number in the Perf Count column. This opens a drill-down report for only
performance counter entries for that one management pack.
• In the drill-down report, examine the performance counters that are responsible for the
majority of collected performance data.
Think about this: Do you need this counter? And if so, would the data be less useful if you decrease the
collection frequency, to reduce the amount of data? Doubling the rule collection interval halves the
number next to the counter!
You will see the exact name of the Rule which is collecting this data. You could copy this name to a
notepad and later go to the SCOM console Authoring pane and find the Rules section and search by the
name of the rule. Once you find it you could override the specific rule. As you will notice this method is a
one-by-one process and might take a while, but it will work.
This time let’s view some similar information regarding collected events.
• Hit the blue back button in the top menu of the report.
• Now, sort the Event Count column to show the highest numbers on top. Often these are coming
from the Windows Operating System, ADFS and AD DC packs.
• Click the highest number in the Event Count column.
• In the resulting drill-down report you can see the rule collecting the events. If you scroll down,
you can see if certain computers/objects have much higher numbers of events than others.
Is there a specific Windows Computer responsible for most of the events? Perhaps certain Windows
services keep crashing and restarting every minute. Maybe someone forgot to disable extensive logging
after a short period of troubleshooting. Keep in mind that all this data is being piled up in both the
OperationsManager and OperationsManagerDW databases for as long as the retention reaches.
• Hit the blue back button, followed by opening the Parameters pane (third button in top menu,
or click View -Parameters)
• This time, de-select the Performance and Events data types, and run the report again.
• Review Discovery Data, Alert Count and State Changes in a way similar to how we examined
Performance and Event data.
End of exercise
Exercise 3 – MP Viewer
For this exercise we will have a look at MP Viewer from this link.
• Start the MP Viewer executable.
• Click File – Load Management Pack. Two options here, to load a pack from a file or from
management group. Select Management Group.
• Enter the Server name. If your account has SCOM access you can click Connect. Otherwise use
your SCOM admin credentials and click Connect.
• Select any management pack or a few at the same time and click OK at the bottom. I selected
Microsoft.Windows.Server.2016 both the discovery and monitoring packs and an overrides pack
I had created.
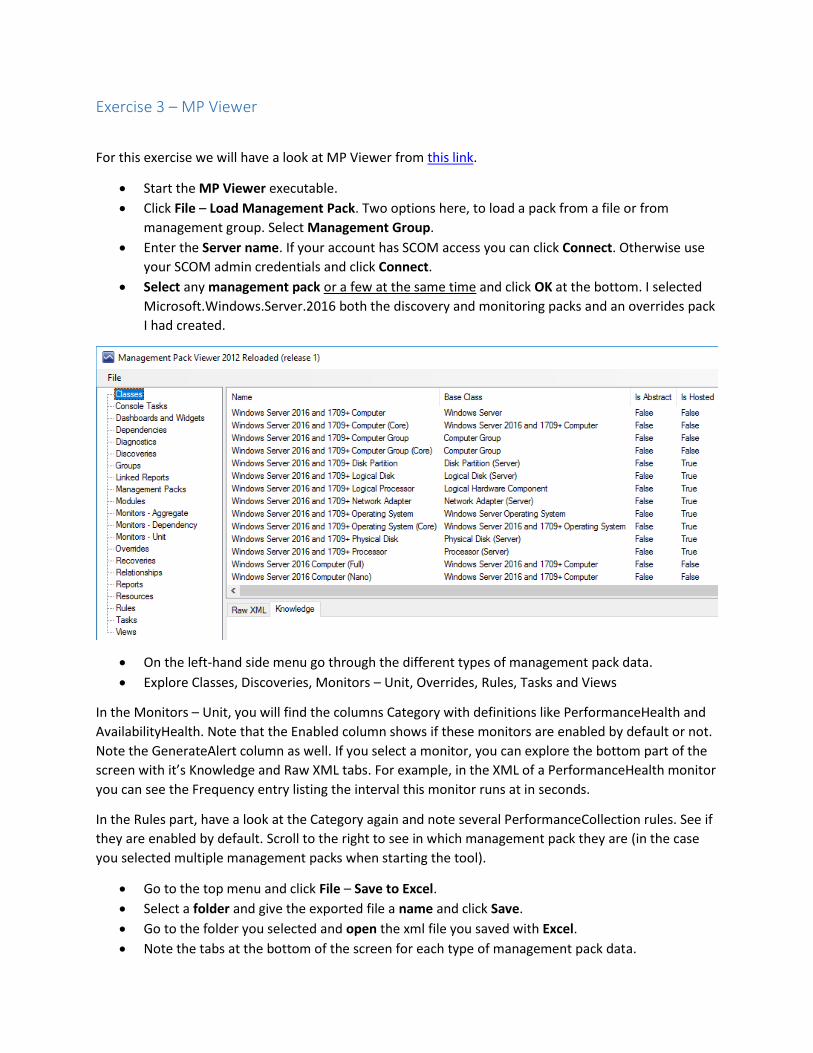
• On the left-hand side menu go through the different types of management pack data.
• Explore Classes, Discoveries, Monitors – Unit, Overrides, Rules, Tasks and Views
In the Monitors – Unit, you will find the columns Category with definitions like PerformanceHealth and
AvailabilityHealth. Note that the Enabled column shows if these monitors are enabled by default or not.
Note the GenerateAlert column as well. If you select a monitor, you can explore the bottom part of the
screen with it’s Knowledge and Raw XML tabs. For example, in the XML of a PerformanceHealth monitor
you can see the Frequency entry listing the interval this monitor runs at in seconds.
In the Rules part, have a look at the Category again and note several PerformanceCollection rules. See if
they are enabled by default. Scroll to the right to see in which management pack they are (in the case
you selected multiple management packs when starting the tool).
• Go to the top menu and click File – Save to Excel.
• Select a folder and give the exported file a name and click Save.
• Go to the folder you selected and open the xml file you saved with Excel.
• Note the tabs at the bottom of the screen for each type of management pack data.
• Go to the Monitors – Unit tab at the bottom and look at the contents. Note by the column
headers if a monitor is enabled and if it generates an alert
• Close Excel and close MP Viewer.
Exercise 4 – Override Explorer and Override Creator
For this exercise we will have a look at Override Explorer from this link and Override Creator from this
link.
Override Explorer
• Start the override explorer tool
• From the menu click File – Connect
• Type the name of your management server and click Connect
• On the left-hand side there is a list of Types and using the + symbols you can expand into some
of them to see what overrides exist for those types. Usually for Windows Server operating
system or SQL related types you will find some overrides.
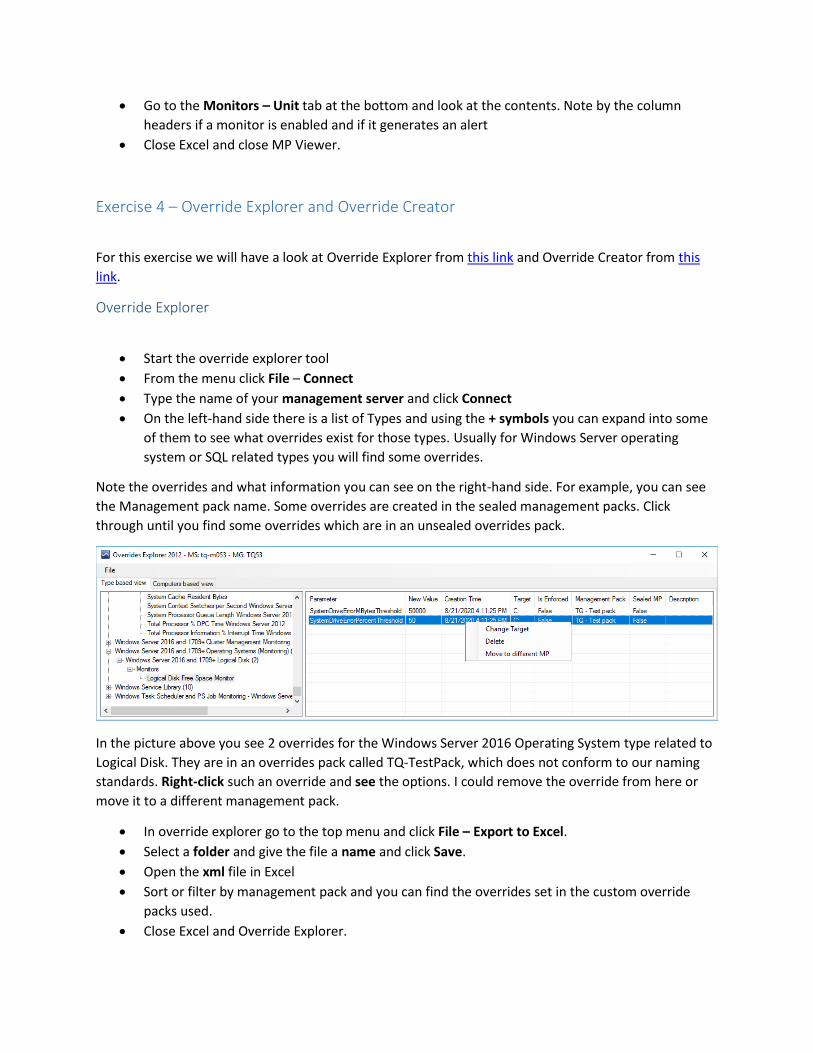
Note the overrides and what information you can see on the right-hand side. For example, you can see
the Management pack name. Some overrides are created in the sealed management packs. Click
through until you find some overrides which are in an unsealed overrides pack.
In the picture above you see 2 overrides for the Windows Server 2016 Operating System type related to
Logical Disk. They are in an overrides pack called TQ-TestPack, which does not conform to our naming
standards. Right-click such an override and see the options. I could remove the override from here or
move it to a different management pack.
• In override explorer go to the top menu and click File – Export to Excel.
• Select a folder and give the file a name and click Save.
• Open the xml file in Excel
• Sort or filter by management pack and you can find the overrides set in the custom override
packs used.
• Close Excel and Override Explorer.
Override Creator
This tool is meant to provide quick bulk overriding of workflows (monitors and rules) in SCOM.
• Start Override Creator
• Enter the name of your management server and click Connect
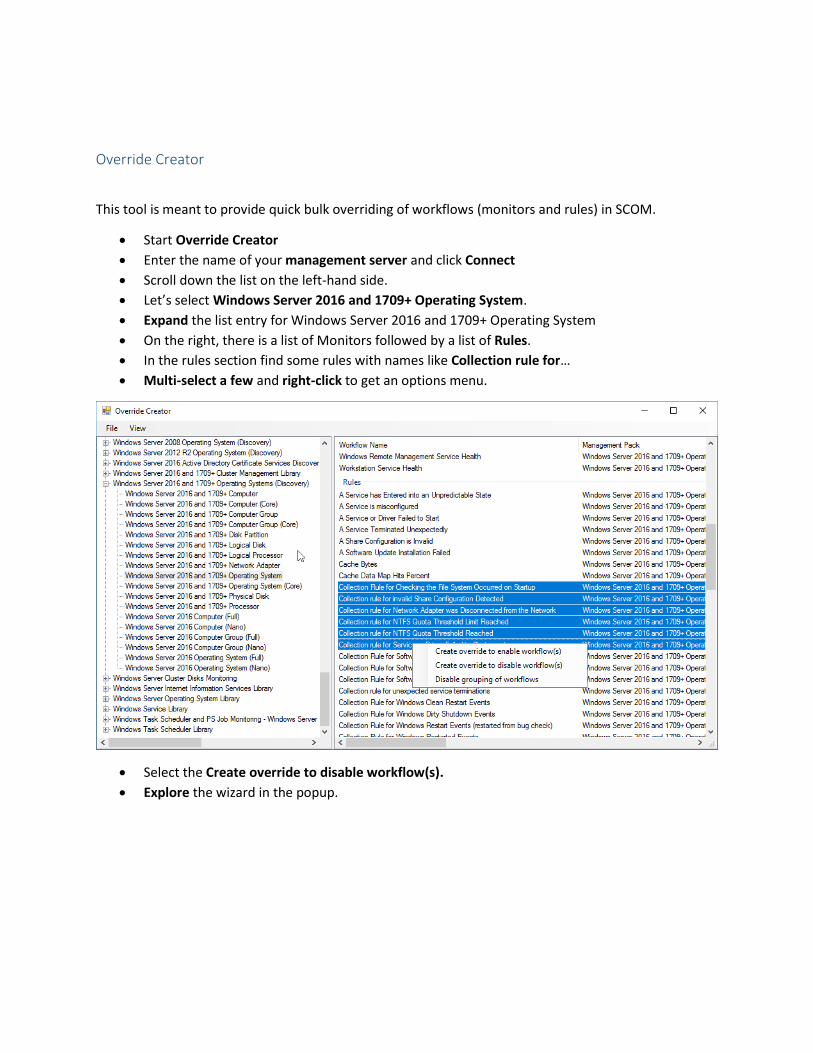
• Scroll down the list on the left-hand side.
• Let’s select Windows Server 2016 and 1709+ Operating System.
• Expand the list entry for Windows Server 2016 and 1709+ Operating System
• On the right, there is a list of Monitors followed by a list of Rules.
• In the rules section find some rules with names like Collection rule for…
• Multi-select a few and right-click to get an options menu.
• Select the Create override to disable workflow(s).
• Explore the wizard in the popup.
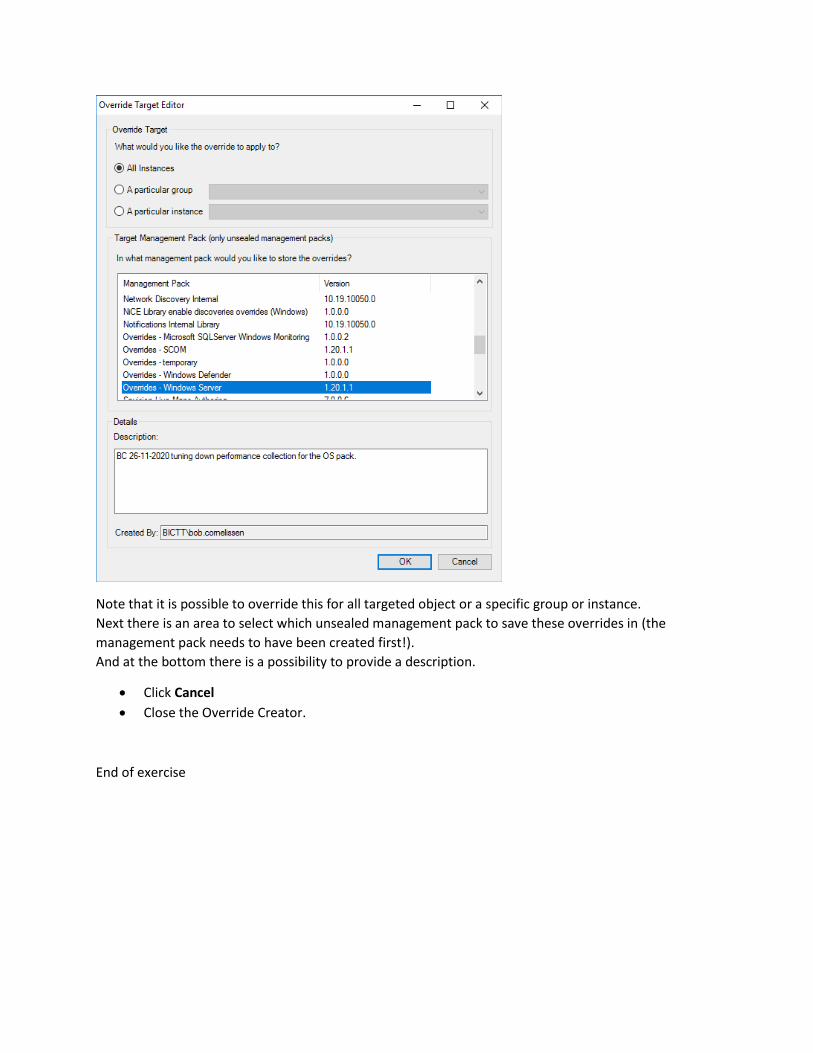
Note that it is possible to override this for all targeted object or a specific group or instance.
Next there is an area to select which unsealed management pack to save these overrides in (the
management pack needs to have been created first!).
And at the bottom there is a possibility to provide a description.
• Click Cancel
• Close the Override Creator.
End of exercise
Exercise 5 – Easy Tune
This exercise requires EasyTune from Cookdown (can use the free edition) and a SCOM management
group. EasyTune must have been downloaded and installed for this exercise. If you are applying custom
override sets it is advised to do this in a test/lab environment. We will be creating a custom pack though
for some of this, which can be removed easily and will target at an empty group, so should be no real
risk. In order to see the community store EasyTune will need internet access from this console.
• Open the SCOM console and go to the Administration section.
• Go to Management Packs and Create a new management pack
• Use your naming convention. As example I used “TQ Custom – SCOMathon” with version
1.20.12.1 and a description. Click Create.
• Go to the SCOM Authoring pane and navigate to Groups.
• Create a New Group.
• Call it “SCOMathon servers” and give it a description and make sure to select the management
pack you just created as destination.
• Click next next next Create without adding anything to the group. This way nothing can be
impacted when we target this group for overrides.
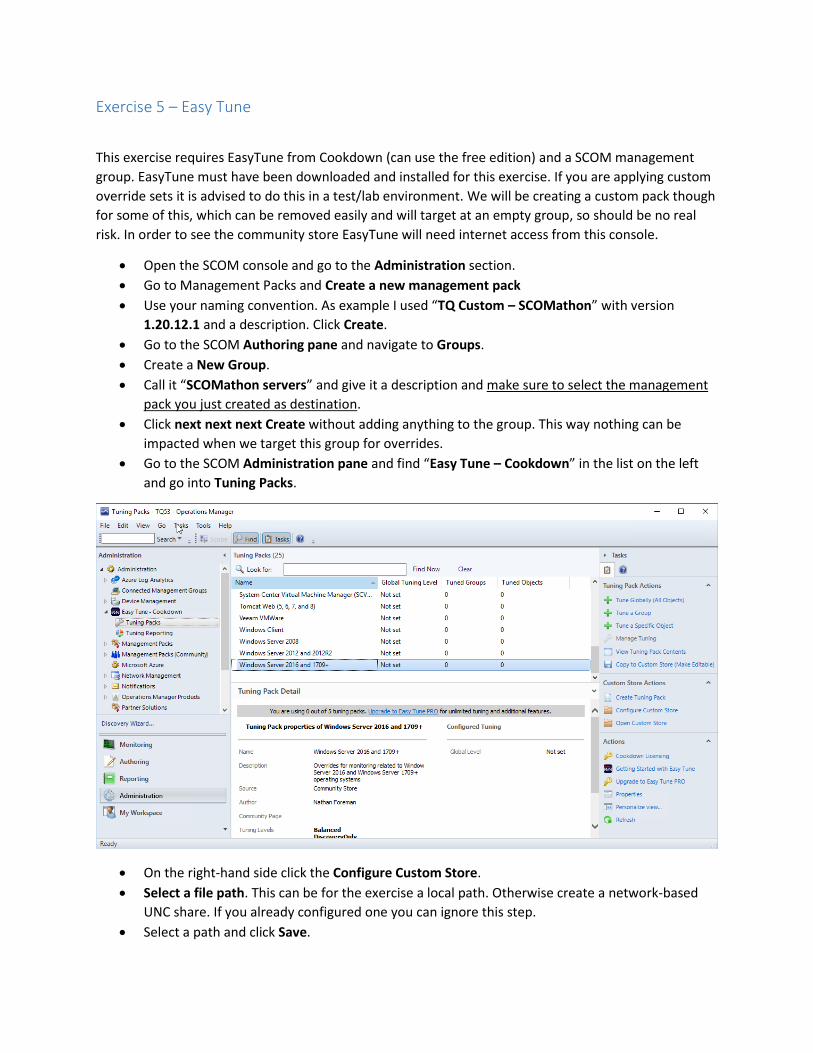
• Go to the SCOM Administration pane and find “Easy Tune – Cookdown” in the list on the left
and go into Tuning Packs.
• On the right-hand side click the Configure Custom Store.
• Select a file path. This can be for the exercise a local path. Otherwise create a network-based
UNC share. If you already configured one you can ignore this step.
• Select a path and click Save.
• Click the Close button
Check that you see the community store items as in the picture above. In order to get this list Easy Tune
pulls these items off a GitHub repo on the internet side.
• Select the community tuning pack called “Microsoft SQL Server (version agnostic)”.
• To the right click the task Copy to Custom Store (Make Editable).
• This will popup your custom store location and show a CSV file of the same pack.
• Open the CSV file belonging to the SQL Server pack in Excel.
Look at the columns available. DisplayName should point to what it is. The OverrideParameter is which
part of a rule or monitor or discovery we are changing. The DefaultValue shows what the original pack
comes with. Next there are a few custom columns for each tuning level. In this case Performance,
Production, QA and Test. Creating additional customizations can be done by adding a column before the
Notes column. Let’s leave this as it is right now.
• Close Excel.
• Throw away the csv file for now.
• Back in the SCOM console select the same tuning pack in the list “Microsoft SQL Server (version
agnostic)”.
• Look in the details pane below. You will see some details, including name of pack and author
and the custom tuning levels (in bold).
• Click the link to the community page.
• Scroll down that GitHub page and see the descriptions for the custom monitoring levels.
• Close the website and return to SCOM.
• In the right-hand side tasks pane click the Tune a Group option.
• At the Select a Group, click the Browse button.
• Type SCOMathon and search for the custom group we created earlier.
• Select that group and click OK.
• Click Next
• Select a tuning level. We will select Test for now.
• Scroll through the view below to see that there is a listing of overrides etc.
• Click Next.
• Click Use a Schedule.
• See that in this case you can use a default Business hours kind of monitoring scheme, but this
name and times can be adjusted.
• Un-select the Use a Schedule and click Next.
• The next screen gives us the opportunity to either create a new management pack automatically
(this will use a custom naming convention pointing back to the tuned pack and settings). Or the
possibility to Choose an existing pack.
• Let’s Cancel the wizard by clicking Cancel.
• Back in SCOM Administration pane you can cleanup by going to Management Packs and
removing the pack created for this exercise.
End of exercise
Exercise 6 – SCOM Auditing
This exercise will only work in a SCOM management group at version SCOM 2019 UR2 or higher! At the
time of this workshop this is the highest version and update rollup available.
• Within the Operations Manager Console, browse to the Reporting Pane.
• In the Microsoft Generic Report Library folder, open the report named Management Pack
History.
• On the left-hand side of the parameters screen check the From field that it says Today -7 days.
• Run the report by using the Run button at the top of the report.
Check if the report shows any activity for the last 7 days. If not, you can go back to the parameters field
and change the From date to something longer ago.
Notice that a change to a management pack generally means a delete of the pack and an install of the
pack at the same time.
• Close this report and go back into the reporting pane
• Open the Management Pack Objects report
• In the parameters area change the From field to a few days ago. For example, Previous Week –
Monday.
• Run the report
See if there are any changed reported on. If not, you can change the From field again to a longer period.
Check the actions done and who made the changes.
• Close the report and go back to the reporting pane.
• Select the Overrides Tracking report and open it.
• Change the From field to at least a few days. In my quiet demo environment I selected Previous
Month – First Day.
• Run the report
See if there are any overrides defined in the selected period.
Check the name of the management pack, what got changed (rule or monitor or..), what the changes
values are and when they got changed and who changed them.
• Close the report.
End of exercise