Embed Size (px)
Citation preview
Compiled by
University of St Andrews
Written by Ramboll, Town Rock Energy, University of St Andrews,
and Resource Efficient Solutions LLP
Date submitted:
11 March 2016
GEOTHERMAL ENERGYCHALLENGEGUARDBRIDGE GEOTHERMAL
TECHNOLOGY
DEMONSTRATOR PROJECT
Lead Partner: University of St Andrews
Consortia partners: Ramboll Energy Ltd
Town Rock Energy
British Geological Survey
Resource Efficient Solutions LLP
Eden Estuary Energy Ltd
Iain Todd
CONSORTIUM PARTNERS AND STAKEHOLDERS
Dept of Earth & Environmental SciencesUniversity of St AndrewsIrvine BuildingNorth StreetSt AndrewsKY16 9ALT: 01334 463996
Ramboll Energy2nd Floor, Bearford House39 Hanover StreetEdinburghEH2 2PJT: 07970 615 407
Town Rock EnergyEast Woodlands HouseDyceAberdeenAB21 0HDT: 07841 910719
British Geological SurveyMurchison HouseWest Mains RoadEdinburghEH9 3LAT: 0131 667 1000
Bibliographical Reference:Robinson, R.A.J., Townsend, P., Steen, P., Barron, H. Abesser, C.A., Muschamp, H.,McGrath, I., and Todd, I. (2016). Geothermal Energy Challenge Fund: theGuardbridge Geothermal Technology Project. 105 pp.
Resource Efficient Solutions LLPBankhead Central (1st floor)Bankhead ParkGlenrothesKY7 6GHT: 03451 555 555 Ext: 44045
Eden Estuary Energy LtdGuardbridge5 Atholl CrescentEdinburghEH3 8EJ
Iain ToddRenewable Energy consultantOffice 9Fife Renewable Innovation CentreAjax WayMethil, FifeKY8 3RST: 0771 566 2901
Fife Council (Stakeholder)3rd FloorKingdom HouseKingdom AvenueGlenrothes KJY7 5LY.T: 03451 555 555 ext 492184
GEOTHERMAL ENERGY CHALLENGE EXECUTIVE SUMMARY
This feasibility study investigates whether a geothermal district heating system,
which accesses Hot Sedimentary Aquifer (HSA) resources underlying a brownfield
site at Guardbridge in northeast Fife, can be developed in a cost-effective manner.
This project’s scope is to assess the available geological information and estimate
the hot saline aquifer heat supply, calculate the current heat demand at the
Guardbridge site, Guardbridge village, and the nearby towns of Leuchars and
Balmullo, and to incorporate future Guardbridge development plans (provided by
the University of St Andrews) and anticipated growth in housing stock (from Fife
Council) to estimate future heat demand. The capital, maintenance and repair
costs for the geothermal well and designed district heating network are used to
develop economic models for a number of district heat network scenarios. A key
aspect of this study is an evaluation of the opportunities to cost effectively de-risk
deep geothermal exploration in Central Scotland, and to outline the potential for
developing geological heat storage systems. The study identifies the key
legislative and environmental issues, risks and uncertainties associated with any
exploration and production, involves stakeholder engagement, and makes
recommendations for a Phase 2 stage for geothermal heat development at
Guardbridge.
Two of the key outputs from this feasibility study will be an economic model
and business case based on different heat demand options, and an optimised
model of well design based on different exploration strategies. Both are
transferable to similar operations at other geothermal sites. The key objectives
are therefore to:
(a)design a geothermal well that will be drilled in Phase 2 of the project, and
secure valuable information on Fife regional sub-surface geology and
geothermal properties of the primary aquifer,
(b)explore how advanced drilling techniques, such as directional drilling, can
be deployed to improve geothermal recovery,
(c) demonstrate how a geothermal system can integrate with an existing
biomass heating installation to optimise both schemes and provide a district
heat network for on-site industries and the local community,
(d)evaluate the potential for storage of seasonal heat energy in the subsurface
(a first in Scotland), and
(e)assess the relative merits of water treatment and on-site recycling, re-
injection or disposal to sea.
A regional geological model was constructed using available
data from the British Geological Survey, published data and academic theses. The
sub-surface geology was interpreted from surface geology and extrapolating the
local behaviour of geological structures into the Guardbridge area. Modelling the
geology involved defining the orientation and width of a natural fault zone, which
could be a significant influence on the behaviour of the Hot Sedimentary Aquifers.
The rock units of interest in this study are the Upper Devonian Scone Sandstone,
Glenvale Sandstone, Knox Pulpit and Kinnesswood formations, and the latter two
units are previously identified as having the highest potential to be highly
productive aquifers. The presence of a major fault near the Guardbridge site
means that the target aquifers are at very different depths on either side of the
fault. The report therefore investigates and evaluates three well options to target
the different aquifers at the varying depths on either side of the fault.
Hydrogeological modelling was conducted using FEFLOW® to evaluate the
behaviour of the fault on fluid flow rates, and to predict the necessary
conductivities to produce reasonable, economic and sustainable rates of fluid
extraction. Although not an accurate model of the Guardbridge site, and limited
by a significant lack of data constraining the important parameters, the flow
simulations suggest that fracture permeability in the aquifers and underlying rocks
is needed to sustain the flows recommended by this study, and re-injection would
be required if a producing well was to be sustainable over many decades.
Regionally developed rock quality predictors have been used to estimate the
permeability and temperature of the target aquifer intervals in the three selected
well options at, or near, Guardbridge. Oil field well simulation tools have been
used to estimate water flow rates, temperature profiles, and circulating rates from
different geological models of the wells. Two of the wells, GB-1 and ES-1, are not
expected to penetrate enough high permeability sandstone to support the
minimum water flow rates of 5 l/s and so are ruled out as viable aquifer producers.
GB-2 is a deviated well that penetrates the Kinnesswood and Knox Pulpit
formations, the best quality regional aquifers, in a zone where the fault may
enhance the permeability even more, and has potential to supply 5 to 20 l/s of
water at a surface temperature of 25 oC (± 2 oC). Such a well will be produced
using an electric submersible pump which will require 20 - 40 kw of power to
deliver 15 l/s of flow (although the volumetric rate will vary with the rock quality).
GB-2 is taken forward and drilling designs are provided with three outcomes: 1)
a dry hole scenario; 2) a 5 l/s scenario; and, 3) a 15 l/s scenario.
The vertical wells have been modelled as heat pump circulating wells, and
therefore would not produce any aquifer water at the surface. Only deeper wells,
up to 2500 m, have the potential to give surface temperature increase of 5 oC at
reasonable circulation rates (e.g. 8 l/s). A deep GB-1 well as a heat pump could
be taken forward in Phase 2 as an alternative heat source.
The proposed GB-2 deviated well can be drilled across the fault from the
Guardbridge site to a depth of 1200 m. A casing string set will isolate the shallow
geology and a slotted liner used to prevent hole collapse of the target intervals.
Such a well will require a 100 tonne conventional drilling rig and well control,
logging and coring tools will assess the aquifer quality. In the most likely case,
the drilling phase will take 24 days, including rig mobilisation and demobilisation.
If coring and logging demonstrate that the well will not flow adequately, then the
well will be suspended. Low cost options have been investigated that would allow
exploratory wells to be drilled and this could result in the recovery of regionally
significant data on the performance of the aquifers at depth, although none of the
boreholes could be completed to production stage due the drilling technology
employed.
The drilling scenarios investigated do not include a re-injection well, in order to
create an economically viable district heating network project, even though very
preliminary hydrogeological modelling demonstrates that re-injection is required
if the geothermal well is to be sustainable over 30+ years. Alternative
management of produced water investigated in this report are: water disposal-to-
sea and partial-full water recycling and re-use on site. The first option could have
environmental consequences on the adjacent Eden Estuary, which is part of the
Tay River and Eden Estuary Special Protection Area, and these potential impacts
would need formal assessment by a competent authority (Fife Council and SNH)
as part of a Habitat Regulations Appraisal, and an Environmental Impact
Assessment is most likely required. The second option reduces the environmental
impacts on the estuary, but has additional CAPEX and OPEX costs which are
estimated. The opportunity to be innovative about partial water recycling and re-
sale should be investigated in Phase 2.
The heat demand is based on preliminary district heating network layouts at
different scales, based on the demand analysis. Demand has been assessed at
Guardbridge and the nearby towns of Leuchars and Balmullo, using the Scotland
Heat Map and future development data provided by the University of St Andrews
and the Fife Development Plan. These various options provide an indication of the
potential annual and peak heating demands that can then be compared against
the geothermal heating potential, and an economic modelling tool was developed
to analyse the performance of the overall system, including key performance
indicators to evaluate the financial viability. This analysis leads to a preliminary
network design and an economic model of the potential scheme.
The District Heating Opportunity Assessment Tool (DHOAT) designed for the
Danish Energy Agency analyses the Heat Map data and preliminary network
designs and provides peak and annual demands and key performance indicators,
namely total heat demand and indicative CAPEX, OPEX, REPEX and heat sales. All
input parameters are modelled with an uncertainty of ±10%. Based on this
analysis, the proposed development of one well and estimated heat supply is not
sufficient capacity to provide heat outside of the Guardbridge site itself. All district
heating network designs and economic models were therefore based on the
aggregated customer base of the Guardbridge site. The economic model assumes
that geothermal heat can supply 50% of the Guardbridge site needs (2,867
MWh/a), with a capacity of 0.42 MW, and the other 50% would be provided by
the biomass plant. Revenues from heat sales are based on a heat sale price scaling
(MWh and p/kWh) and costs of heat from the biomass plant.
An Excel model calculates the profitability of the scheme based on a CAPEX of
£530,000 for the heating network and £1,517,000 for the well completion, flow
tests and water treatment. OPEX and REPEX costs are principally power
consumption for the heat and distribution pumps (£280,000), and a ESP and heat
pump replacement after 10 years (£250,000). NPV and IRR are used to
demonstrate viability for potential investors over a 21-year period; the best case
scenario shows that the scheme might achieve a 10% IRR and a positive NPV.
However, the heat sale price is too low to create sufficient margin to make the
economic performance attractive. This is principally due to the cost of the
geothermal heat. The capital cost of the geothermal well is a significant portion of
the project CAPEX and does not vary with the well heat potential, which is a
relatively modest value given the temperature and flow rate estimates presented.
Flow rate is highly uncertain, while temperature is better constrained and low due
to the shallow depth of the proposed well. The district heating network requires
higher temperatures and the addition of a heat pump increases the capital costs
and adds a relatively high operating cost for the electricity to run the pump.
The carbon emissions reductions are compared to an individual gas boiler
alternative (business as usual [BAU]) and the geothermal-biomass heat network
shows an 84% reduction in carbon emissions, assuming that the biomass boilers
and geothermal heat pumps each supply 50% of the network demand. About 58%
of the emissions reduction (13,878 tonnes CO2/kWh relative to BAU) is attributed
to heat generation from the biomass plant and the remaining 42% (9,812 tonnes
CO2/kWh relative to BAU) is attributed to the geothermal well and the heat pump.
These figures are based on a model lifetime of 20 years. The value of this carbon
saving has not been included in the economic model, however it could be
considered to represent an additional savings compared to the business-as-usual
alternative.
The heating network can be enhanced at a subsequent stage to provide
combined heating and cooling for the site. This would increase the utilisation of
the heat pump by operating in combined heating and cooling mode during inter-
seasonal periods. Although not explored in any extensive technical or economic
sense, the system could also potentially be used to fill separate hot and cold
seasonal heat stores.
Requirements for Phase 2 would begin with a non-invasive geophysical survey
to provide imaging of the fault and the target aquifers in the subsurface. This
could be completed in three months. Phase 2 would most likely require the
preparation of an Environmental Statement before any drilling could commence
on site, particularly addressing the viability of disposal of water to the sea.
However, current developments at Guardbridge have required Environmental
Statements (i.e. since 2014) and much baseline data already exists. The time
required to complete an EIA range from 12 weeks to prepare the report, or up to
one year of time if SNH and Fife Council require additional new data. A benefit of
the Guardbridge site is therefore its status as an industrial site with a pre-existing
history in terms of Environmental Statements. Ideally, Phase 2 would culminate
in revised well designs, procurement of the drilling rig, and test drilling to intercept
the fault and target aquifers. The time and costs are estimated and depend on the
choice of drilling option. A positive outcome from a test borehole would lead to
the design of a full production well and progression of the project as a Technology
Demonstrator. Regardless of whether the test borehole proves that the
Guardbridge District Heating Network project is viable, the data recovered as part
of the test drilling (core samples, flow tests and water chemistry) will be highly
significant for de-risking hot sedimentary aquifer exploration across central
Scotland.
The economic feasibility of the Guardbridge geothermal heat project is
dependent on the best case scenario for flow rates, along with a large number of
other poorly constrained variables. It could be economic, but there is a very large
uncertainty in the geothermal heat estimates. However, the additional value in
the potential research that can be achieved at Guardbridge in de-risking hot
sedimentary aquifer exploration in the Central Belt of Scotland, as well as
integrating low carbon heat source exploration with other technologies, including
dual heating and cooling and water recycling, should be considered when deciding
to progress this project.
ACKNOWLEDGEMENTS
Several people contributed to the analyses within this report but are not named
as authors. Dr Rachael Ellen of the British Geological Survey supported the
development of the geological model in Midland Valley’s Move software, and Lucy
McKay and Sarah Alexander, students at the University of St Andrews, contributed
significantly to the geological modelling (McKay) and hydrogeological modelling
(Alexander). Carolyn Bell of Resource Efficient Solutions is thanked for her
contribution to project management.
The authors acknowledge the use of the Move Software Suite granted by Midland
Valley's Academic Software Initiative to the University of St Andrews and
FEFLOW® (licensed to the British Geological Survey).
1. INTRODUCTION 1
1.1 Project Scope 1
1.2 Objectives 3
2. METHODOLOGY 4
2.1 Overview of methods 4
Geological models 4
Geothermal well design and regional impacts 5
District heating network design and economic model 5
Environmental impacts and regulatory requirements 6
Stakeholder Engagement 6
2.2 Role of consortia partners 6
2.3 Data sources and key documents 8
2.4 Assumptions and limitations 9
3. GEOTHERMAL MODEL DEVELOPMENT 11
3.1 Geological model 11
Background geology 11
Model construction 12
Production of simplified 3D geological model 15
3.2 Limitations of the geological model 16
3.3 Aquifer prospect evaluation 17
Scenario 1 - Well GB1 18
Scenario 2 - Well ES 20
Scenario 3 - Well GB2 23
Scenario 4 - Well GB2 25
3.4 Hydrogeological model 25
Regional groundwater flow system 25
Aquifer properties of the target formations 26
Dura Den Fault permeability 29
Hydrogeological model development 29
3.5 Play evaluation and de-risking 39
3.6 Regional impact of Guardbridge wells 42
Well GB1 – vertical well on site 42
Well ES – vertical well off site 43
CONTENTS
Well GB-2 – deviated well on site 44
4. HEAT SUPPLY 46
4.1 Predicted aquifer properties at wells 46
Well GB-1 46
Well ES 47
Well GB-2 47
4.2 Well completion options and performance 48
Well GB-1 design 48
Well GB-1 design (deeper option) 49
Well ES design 50
Well GB-2 design 51
4.3 Well design and drilling 52
4.4 Well costs 54
4.5 Well risks and other drilling options 56
Lower cost drilling options 56
Other capital costs: water disposal 58
Well life operation and repair costs 59
4.6 Well engineering activities in Phase 2 59
5. HEAT DEMAND ANALYSIS 61
5.1 Identifying Potential Demand 61
5.2 Future Developments 63
6. PRELIMINARY NETWORK ANALYSIS 66
6.1 Network Options and Phasing 66
1. FCO11 – Guardbridge 66
2. FCO12 – Guardbridge Phase 2 67
3. FCO21 – Leuchars Phase 1 67
4. FCO22 – Leuchars Phase 2 67
5. FCO23 – Leuchars Phase 3 67
6. FCO31 – Balmullo Phase 1 67
7. FCO32 – Balmullo Phase 2 67
6.2 Opportunity Assessment Tool 68
6.3 Network Analysis 68
7. GEOTHERMAL HEATING POTENTIAL 70
7.1 Initial Estimates of Output 70
7.2 Final Heat Production Estimates 71
8. NETWORK DESIGN 72
8.1 Well location 73
9. ENERGY CENTRE DESIGN 74
9.1 Combined heating and cooling operation 75
10. ECONOMIC ANALYSIS 77
10.1 CAPEX 78
10.2 OPEX and REPEX 78
10.3 Revenue 78
10.4 Modelling results 78
Heating Customer Perspective 82
District Heating Company Perspective 83
Biomass energy centre perspective 84
Geothermal well and heat pump perspective 84
10.5 Carbon emissions 84
10.6 Sensitivity 86
10.7 Summary of Economic Analysis 87
11. REGULATORY CONSIDERATIONS 89
11.1 Introduction to the environmental concerns 89
11.2 Regulatory requirements 90
11.3 Requirements for Phase 2 Stage 92
12. STAKE HOLDER MANAGEMENT 95
13. CONCLUSIONS 96
14. RECOMMENDATIONS AND NEXT STEPS 98
15. REFERENCES 101
15.1 Published articles and reports 101
15.2 Guidance and regulatory documents 102
1
1. INTRODUCTION
1.1 Project Scope
This feasibility study investigates whether a geothermal district heating system,
which accesses Hot Sedimentary Aquifer (HSA) resources underlying a brownfield
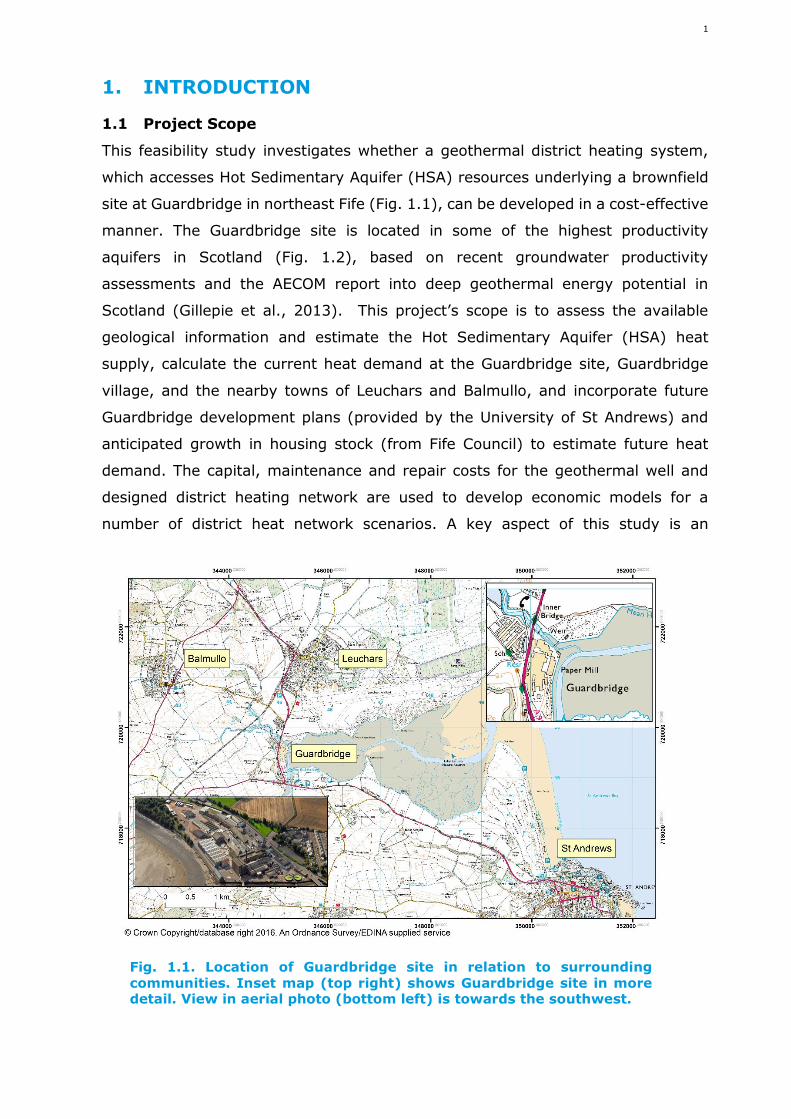
site at Guardbridge in northeast Fife (Fig. 1.1), can be developed in a cost-effective
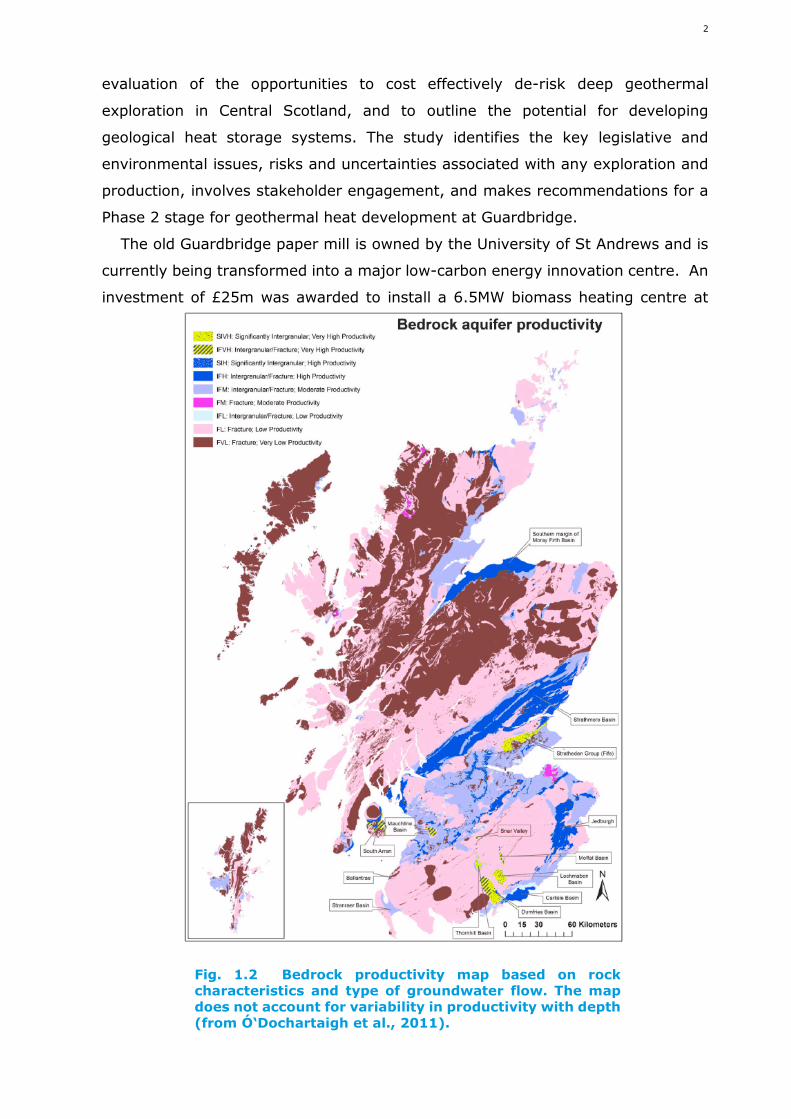
manner. The Guardbridge site is located in some of the highest productivity
aquifers in Scotland (Fig. 1.2), based on recent groundwater productivity
assessments and the AECOM report into deep geothermal energy potential in
Scotland (Gillepie et al., 2013). This project’s scope is to assess the available
geological information and estimate the Hot Sedimentary Aquifer (HSA) heat
supply, calculate the current heat demand at the Guardbridge site, Guardbridge
village, and the nearby towns of Leuchars and Balmullo, and incorporate future
Guardbridge development plans (provided by the University of St Andrews) and
anticipated growth in housing stock (from Fife Council) to estimate future heat
demand. The capital, maintenance and repair costs for the geothermal well and
designed district heating network are used to develop economic models for a
number of district heat network scenarios. A key aspect of this study is an
Fig. 1.1. Location of Guardbridge site in relation to surroundingcommunities. Inset map (top right) shows Guardbridge site in moredetail. View in aerial photo (bottom left) is towards the southwest.
2
evaluation of the opportunities to cost effectively de-risk deep geothermal
exploration in Central Scotland, and to outline the potential for developing
geological heat storage systems. The study identifies the key legislative and
environmental issues, risks and uncertainties associated with any exploration and
production, involves stakeholder engagement, and makes recommendations for a
Phase 2 stage for geothermal heat development at Guardbridge.
The old Guardbridge paper mill is owned by the University of St Andrews and is
currently being transformed into a major low-carbon energy innovation centre. An
investment of £25m was awarded to install a 6.5MW biomass heating centre at
Fig. 1.2 Bedrock productivity map based on rockcharacteristics and type of groundwater flow. The mapdoes not account for variability in productivity with depth(from Ó‘Dochartaigh et al., 2011).
3
Guardbridge, and develop a district heating scheme for a subset of the University
buildings in St Andrews; this will be operational during 2016. The new remit for
Guardbridge as a low-carbon energy innovation centre, which will support research
and development into energy integration, end- or off-grid supplies and circular
economies, provides a very suitable location for exploring the potential for a
geothermal heating scheme to serve the buildings and businesses within the
Guardbridge site, and district heating networks for the communities in close
proximity to the site.
1.2 Objectives
The key challenges and outstanding questions limiting the commercial development
of geothermal heat energy in Scotland are:
establishing the economic feasibility of geothermal exploration for heat;
the lack of adequate datasets that reduce the risks associated with expensive
drilling projects,
the need for more sophisticated optimisation techniques accommodating well
design, heat pump usage, and exploration depth,
the lack of sub-surface geological and fluid flow models which provide
frameworks for identifying and developing reservoirs that can sustain long term
fluid and heat flow, and
the development of diverse energy storage systems, and integration of
geothermal storage into existing energy production and storage methods.
To test the old assumptions that geothermal resources are not economic, two of
the key outputs from this feasibility study will be the economic model and business
case based on different heat demand options, and an optimised model of well
design based on different exploration strategies. Both are transferable to similar
operations at other geothermal sites. The key objectives are therefore to:
design a geothermal well that will be drilled in Phase 2 of the project, and
secure valuable information on the Fife regional sub-surface geology and
geothermal properties of the primary aquifer,
explore how advanced drilling techniques, such as directional drilling, can be
deployed to improve geothermal recovery,
demonstrate how a geothermal system can integrate with an existing
biomass heating installation to optimise both schemes and provide a district
heat network for on-site industries and the local community,
evaluate the potential for storage of seasonal heat energy in the subsurface
(a first in Scotland), and
assess the relative merits of water treatment and on-site recycling, re-
injection or disposal to sea.
4
2. METHODOLOGY
2.1 Overview of methods
In the following sections of this report, each of the key components of our feasibility
study are presented. The 3D geological model and rock characteristics are
presented first and form the baseline data for the geothermal well design. Different
well options are investigated based on the underlying geology, the rock
characteristics, and estimated flow rates and water temperatures. The well
performance scenarios are integrated into a district heating network design, and
an economic model has been constructed that includes the heat demands for
current and future scenarios and the capital, operation and maintenance costs of
exploration, production and heat network development. Finally, the legislative and
environmental issues arising from any HSA geothermal heat project are
investigated with input from the relevant regulatory bodies, and recommendations
for Phase 2 of the project to develop on-site heat and storage systems at the
Guardbridge site are presented.
Geological models
A regional-scale 3D geological model was developed by the University of St
Andrews and the British Geological Survey using the 1:100,000 – 1:250,000 British
Geological Survey digital maps, geological data from all the surrounding boreholes,
and previously constructed geological cross-sections. One aspect of the geological
modelling involved choosing an orientation for the Dura Den Fault which is located
to the south of the Guardbridge site, and modelling the amount of offset and
horizontal extent of the fault zone. This involved incorporating previous published
work, including a PhD thesis. All data was compiled in Midland Valley MoveTM
software and the depths to the relevant sedimentary units, their orientation and
thickness, and the behaviour of the Dura Den Fault are presented as a number of
cross-sections (Section 3.1).
Simple 2D and 3D hydrogeological models have been constructed which
incorporate rock characteristics described below and test flow rate scenarios for
the sedimentary aquifers (Section 3.4). The modelling is limited by the lack of
necessary data, namely adequate detail on the geological units, aquifer recharge,
source of water, and influence of the saline wedge from the Eden Estuary. The
modelling is performed in FEFLOW®, a finite element fluid flow model and was
performed by the British Geological Survey and the University of St Andrews.
5
Geothermal well design and regional impacts
The geological model provides estimates of the thicknesses and depths of the
sedimentary units for both sides of the Dura Den Fault. In order to characterise the
sedimentary rock characteristics for the units, such as porosity and permeability,
a combination of wireline datasets from onshore oil and gas wells, and published
hydrogeological data, were used (compiled by Town Rock Energy Ltd and the
University of St Andrews). The necessary and sufficient data do not as yet exist for
the sedimentary aquifers below Guardbridge, and this is one of the limiting aspects
of this (and any) geothermal study. However, the wireline data is representative of
rocks with similar properties and provides estimates for the rock characteristics at
depths relevant to this study (up to 2500 m depth).
Each sedimentary unit is given a porosity, permeability and thickness, with
appropriate levels of uncertainty (Section 3.3). The final aspect of the geological
investigation is to define the change in temperature with depth, called the
geothermal gradient. The study updates the geothermal gradient of Gillespie et al.
(2013) to calculate temperatures at depth.
Well design was undertaken by Town Rock Energy Ltd and utilises the geological
model, rock characteristics and geothermal gradient estimates. Four well scenarios
were proposed (two on the Guardbridge site and one off-site) and different
pumping technologies were investigated. Well performance is estimated based on
a range of possible flow rates and water temperatures at the surface, and costs
associated with drilling and production are calculated (Section 3.3).
A regional approach to de-risking geothermal exploration has been developed
by Town Rock Energy Ltd which utilises an approach standard in the oil and gas
industry (Section 3.5), and is generally applicable to the Central Belt of Scotland.
The regional impact of the well design results are outlined in Section 3.6.
The well design and drilling strategies were fully costed to well production stage
(Section 4). Based on the initial productivity predictions, it was possible to eliminate
three of the well scenarios and focus the final economic model on one well scenario.
District heating network design and economic model
The aim of this part of the study was to prepare preliminary district heating network
layouts at different scales, based on the demand analysis and the Scottish Heat
Map (www.gov.scot/heatmap), and was conducted by Ramboll Energy (Sections 5
- 6). The various options provide an indication of the potential annual and peak
heating demands that can then be compared against the geothermal heat potential
estimated for the geothermal well design. An economic modelling tool was
6
developed to analyse the performance of the overall system, to incorporate all costs
associated with the network construction, operational costs of the well on
completion, and includes key performance indicators to evaluate the financial
viability (Sections 7 - 0).
Environmental impacts and regulatory requirements
The Guardbridge site is adjacent to the nationally important Eden Estuary, which
is a Site of Scientific Interest and a Local Nature reserve. It is also part of the Firth
of Tay and Eden Estuary Special Area of Conservation. Gavin Johnson (Operations
Officer for Fife SNH) has been made aware of the project and provided an outline
of the issues and regulatory requirements. An existing set of Environmental
Statements, approved by Fife Council in 2014, document the identified impacts on
air quality, noise levels, water resources, landscape, ecology and nature
conservation arising from the ongoing construction and development at
Guardbridge and these were reviewed for this report, along with the Regulatory
Guidance:Geothermal Heat in Scotland publication by DECC (2016). Guidance was
also sought from SEPA (Steve Archibald, Glenrothes office) on abstraction and
disposal regulations and the Water Environment (Controlled Activities) Regulations
(2011) was reviewed to outline the levels of authorisation that will be required.
Stakeholder Engagement
The University has been involved with community engagement over a protracted
period of years due to the developments at the former Guardbridge Paper Mill. This
communication has increased over the last 12 months due to acceleration of on-
site demolition and construction, and the closure of sections of the road between
the site and St Andrews as the pipes connecting the biomass plant to St Andrews
are Leuchars and the A91 are put in place. The University has incuded discussions
about the potential for a geothermal well into these discussions, involving
Councillor Brett and members of the Community Council.
2.2 Role of consortia partners
The University of St Andrews was Lead Partner in this feasibility study. The British
Geological Survey and the University of St Andrews developed all the geological
and hydrogeological models. Town Rock Energy Ltd, with the University of St
Andrews, developed all the well Statement of Requirements and Town Rock Energy
developed the well options and drilling strategies, and the costings associated with
well exploration, production, operation and maintenance. Ramboll Energy

7
evaluated the heat demand, designed the district heat network and built an
economic model for the project. Resource Efficient Solutions had responsibility for
project management, and the University of St Andrews, with Iain Todd Consulting,
coordinated the stakeholder engagement. The University of St Andrews
investigated the legislative and environmental issues and had responsbility for the
compilation of the final report.
8
2.3 Data sources and key documents
Datasets Sources
Ordnance Survey Maps Digimap through Academic License with EDINA.
1:10,000 Scale Colour Raster [GeoTIFF geospatial data],
Scale 1:10,000, Tile(s): no41ne; no41nw; no42se;
no42sw; no51nw; no52nw. Updated: March 2013,
Ordnance Survey, Using: EDINA Digimap Ordnance Survey
Service, http://edina.ac.uk/digimap, Downloaded: March
2013.
Digital Terrain Models Digimap through Academic License with EDINA.
OS Terrain 5 DTM [ASC geospatial data], Scale 1:10,000,
Tile(s): no41ne; no41nw; no42se; no42sw; no51nw;
no52nw. Updated: March 2015, Ordnance Survey, Using:
EDINA Digimap Ordnance Survey Service,
http://edina.ac.uk/digimap, Downloaded: June 2015
British Geological Survey
digital maps and cross-
sections
1:100,000 to 1:250,000 NO41 and NO49 tiles. Reproduced
with the permission of the British Geological Survey
©NERC. All rights Reserved.
Scottish Natural Heritage
shapefiles for protected
areas
Public sector information licensed under the Open
Government Licence v3.0.
Wireline data Inch of Ferryton #1; Firth of Forth #1; Milton of Balgonie
#1, #2, #3; Thornton #1; Cousland #6; Carrington #1;
Midlothian #1; Stewart #1;
Data analysed by Town Rock Energy and underlying
analyses are not presented here.
Heat map demand Scotland Heat Map
http://www.gov.scot/heatmap
Local Development Plan
http://www.fifedirect.org.uk/fifeplan
FIFEplan Fife Local Development Plan Proposed Plan Pre-
examination Editing – June 2015)
Guardbridge Energy Centre Master Plan (revised January
2016) and input from Guardbridge Director (Ian McGrath)
Key Documents
Regulatory Guidance: Geothermal Heat in Scotland (2016)
Scottish Government (DECC) http://www.gov.scot/Topics/Business-
Industry/Energy/Energy-
sources/19185/GeothermalEnergy/RegulatoryGuidance
AECOM (2014) Study into the Potential for Deep Geothermal Energy inScotland: Volume 1 & 2Volume 1 http://www.gov.scot/Resource/0043/00437977.pdfVolume 2 http://www.gov.scot/Resource/0043/00437996.pdf
Supporting Guidance (WAT-SG-62) Groundwater Abstractions –
Geothermal Energy
9
https://www.sepa.org.uk/media/143949/watsg62_groundwater_abstraction
s_geothermal_energy.pdf
The Water Environment (Controlled Activities) Scotland) Regulations 2011
(as amended)
http://www.sepa.org.uk/regulations/water/
Conservation (Natural Habitats, &c.) Regulations 1994, as amended –
guidance
http://www.snh.gov.uk/protecting-scotlands-nature/protected-
areas/international-designations/natura-sites/
Natura sites and the Habitats Regulations - How to consider proposals
affecting Special Areas of Conservation and Special Protection Areas
in Scotland
http://www.snh.gov.uk/publications-data-and-research/publications/search-
the-catalogue/publication-detail/?id=1364
2.4 Assumptions and limitations
The conclusions and recommendations arising from this report are based on
assumptions outlined below and are limited by the considerable uncertainty
regarding the quality of the geothermal resource. All estimates assume that the
HSA behaves in a similar way to rock intervals that are within the eastern Midland
Valley and have been analysed using wireline data; those rocks have been drilled
at depths similar to the position of the aquifers beneath Guardbridge. The
behaviour of the fault adjacent to the site is critical and could either be a conduit
or an inhibitor of flow. These aspects of rock characteristics and potential flow rates,
which control the geothermal heat potential, are the largest unknowns in this study.
Temperature at depth is also not tightly constrained, but since geothermal
gradients for the onshore sub-surface are known from bottom hole temperatures,
the uncertainty on this is smaller (± 3-4 oC /km). It is impossible to constrain these
parameters better without drilling to reasonable depths (500 - 1000 m).
The Scotland Heat Map has been used to calculate heat demand, and most of
the uncertainties in these estimates arise from the scale of future expansion of the
network within the towns around Guardbridge and within the site itself. If new
housing projects are of a larger scale than modelled in this report, our residential
heat demand estimates are too low. The data used to finalise the heat demand
estimates for the Guardbridge Energy Centre are based on an up-to-date version
of the Guardbridge Energy Centre master plans (revised January 2016).
The economic viability is based on heat sale price and and biomass heat sale
cost, and it is possible that these will change. All price estimates for CAPEX, OPEX
and REPEX are subject to inflation and although inflation of costs has been

10
accounted for in the network development costings, prices quoted from December
2015 to January 2016 may be subject to change as the project develops.
11
3. GEOTHERMAL MODEL DEVELOPMENT
3.1 Geological model
A regional-scale geological model (1:100,000 – 1:250,000) was constructed by
compiling the surface geology maps with 1) a digital surface terrain model (tiles
NO41 and NO49), 2) projected faults and rock formation boundaries (horizons), 3)
coded and georectified boreholes displaying the top of each formation, 4) modelled
faults to a depth of 1000 m with an average plunge of 60°, and 5) georectified dip
data and the 1:50,000 DiGMapGB cross sections for the British Geological Survey
Sheets 41 (North Berwick) and 49 (Arbroath). For simplicity in this regional-scale
model, faults with a throw <30 m and intrusions <500 m in diameter were excluded
from the model.
Background geology
Based on cross section interpretation, the regional geology consists of strata
dipping towards the SE. To the north of Guardbridge lies the thick Ochil Volcanic
Formation (approximately 2000 m thick) consisting of olivine basaltic lavas and
volcaniclastic rocks, offset by a series of normal faults with an average
displacement of 200 m. The top of the lavas and associated volcaniclastic rocks of
the Ochil Volcanic Formation are overlain by sandstones of the Scone Sandstone
Formation which display an average thickness of 300 m. The Scone Sandstone
Formation consists of purple-brown and purple-grey, fine- to coarse-grained,
commonly cross-bedded sandstones with subsidiary siltstone, mudstone,
conglomerate, sparse andesitic lava flows and some calcareous beds with
concretionary limestones towards the top (Armstrong et al., 1985; Browne et al.,
2002).
Overlying the Scone Sandstone Formation is the Upper Devonian Glenvale
Sandstone Formation with gradational contacts consisting of brown, red, purple,
yellow and cream feldspathic sandstones, commonly containing bands of red
siltstone and pebbles of silty mudstone, but no siliceous pebbles (Browne et al.,
2002). Honouring all available geological data, the cross sections display the
Glenvale Sandstone Formation as having an average thickness of 600 m. Beneath
Guardbridge, the top of the Scone Sandstone Formation is located at ~530 m.
Although not exposed at the surface in northeastern Fife around Guardbridge, the
highly and moderately productive Upper Devonian Knox Pulpit and Kinnesswood
formations, respectively, sit stratigraphically above the Glenvale Sandstone
Formation, and are assumed to be present in the subsurface around Guardbridge.
12
Their type locality is in Glen Burn near Kinnesswood and Loch Leven (Browne et
al., 2002). The highly folded and faulted rocks of the Inverclyde and Strathclyde
groups overlie the Upper Devonian sedimentary rocks in the area to the south of
Guardbridge.
Model construction
The Late Carboniferous Dura Den Fault with a normal sense of displacement
(downthrown to the south) separates the Upper Devonian sedimentary and igneous
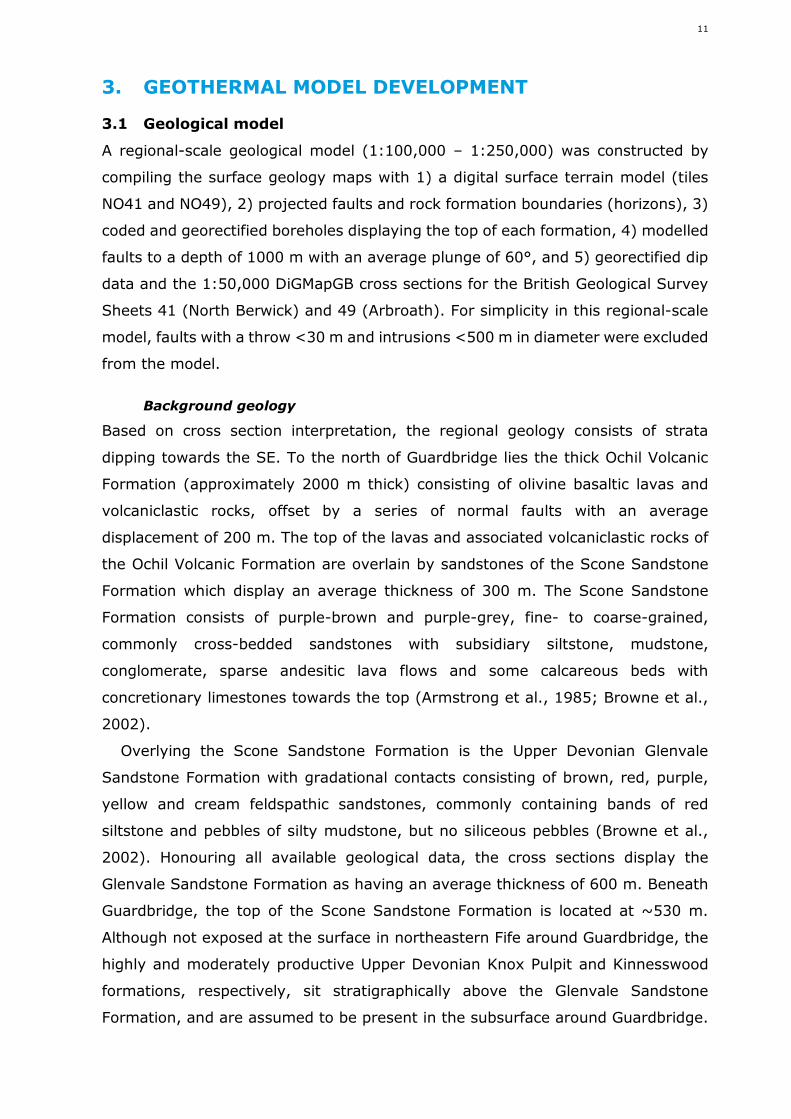
rocks in the north from the Carboniferous sedimentary rocks in the south (Fig 3.1).
The antithetic Maiden Rock Fault is downthrown to the north, and these two fault
systems (Dura Den and Maiden Rock) form a graben-type structure. The Maiden
Rock and Ceres faults form an en echelon (right stepping) structure such that the
graben is rhomb-shaped in the vicinity of Guardbridge. Rocks in the hanging wall
of the Dura Den and Maiden Rock faults have ‘rollover’ anticline and drag folds
associated with them (not shown on Fig. 3.1).
The Dura Den Fault orientation drawn from all cross sections (6 sections in total
and only two presented here) were collated in MoveTM to produce the listric Dura
Den Fault surface soling at a depth of ~6000 m (Fig. 3.2). The modelled Dura Den
Fault is the best interpretation honouring all available geological data. The location
and termination of the fault was determined from published British Geological
Survey 1:50,000 surface data and no additional field evidence is included in this
analysis as the exposure of the fault is very poor in northeast Fife. The actual
Fig. 3.1 Graphical representation of the Dura Den Fault (McCoss, 1987). Thecross-section is schematic, combining geological observations from manysites to summarise the sub-surface geometries of all formations and faults.Abbreviations: c3 Upper Old Red Sandstone, dL1-3 Calciferous SandstoneMeasures, dL4 Lower Limestone Group, STMS St Monance Syncline. Verticalexaggeration present.
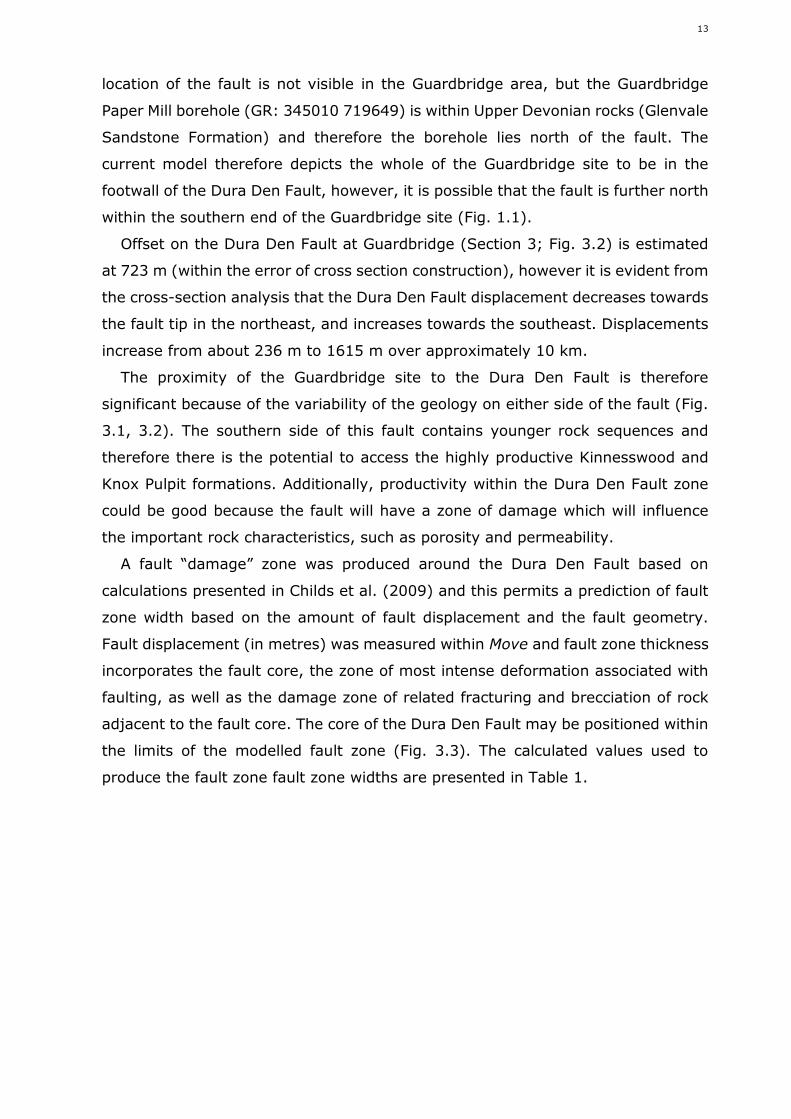
13
location of the fault is not visible in the Guardbridge area, but the Guardbridge
Paper Mill borehole (GR: 345010 719649) is within Upper Devonian rocks (Glenvale
Sandstone Formation) and therefore the borehole lies north of the fault. The
current model therefore depicts the whole of the Guardbridge site to be in the
footwall of the Dura Den Fault, however, it is possible that the fault is further north
within the southern end of the Guardbridge site (Fig. 1.1).
Offset on the Dura Den Fault at Guardbridge (Section 3; Fig. 3.2) is estimated
at 723 m (within the error of cross section construction), however it is evident from
the cross-section analysis that the Dura Den Fault displacement decreases towards
the fault tip in the northeast, and increases towards the southeast. Displacements
increase from about 236 m to 1615 m over approximately 10 km.
The proximity of the Guardbridge site to the Dura Den Fault is therefore
significant because of the variability of the geology on either side of the fault (Fig.
3.1, 3.2). The southern side of this fault contains younger rock sequences and
therefore there is the potential to access the highly productive Kinnesswood and
Knox Pulpit formations. Additionally, productivity within the Dura Den Fault zone
could be good because the fault will have a zone of damage which will influence
the important rock characteristics, such as porosity and permeability.
A fault “damage” zone was produced around the Dura Den Fault based on
calculations presented in Childs et al. (2009) and this permits a prediction of fault
zone width based on the amount of fault displacement and the fault geometry.
Fault displacement (in metres) was measured within Move and fault zone thickness
incorporates the fault core, the zone of most intense deformation associated with
faulting, as well as the damage zone of related fracturing and brecciation of rock
adjacent to the fault core. The core of the Dura Den Fault may be positioned within
the limits of the modelled fault zone (Fig. 3.3). The calculated values used to
produce the fault zone fault zone widths are presented in Table 1.
14
Fig. 3.2 Above: 1:50,000 Bedrock Polygon surface geology provided by theBGS. Guardbridge site represent by the black rectangle within the GlenvaleSandstone Formation (GEF), north of the Dura Den Fault. Below: Cross-sectioninterpretation. Formations: orange dashed - Ochil Volcanics (OVF); green -Scone Formation (SCN); pink - Glenvale Sandstone Formation (GEF); blue -Inverclyde Group (INV); purple - Fife Ness Formation (FNB); yellow -Anstruther Formation (ARBS); light mint green - Pittenweem Formation(PMB); dark mint green - Sandy Craig Formation (SCB); olive green -Pathhead Formation (PDB); dark purple – Hurlet (Hur); red – Lower LimestoneFormation (LLGS); bright green dashed - Central Scotland Late CarboniferousTholeiitic Dyke Swarm (CSTD); green/blue intrusion - Scottish LateCarboniferous to Early Permian Plugs and Vents Suite (SCPPV).
15
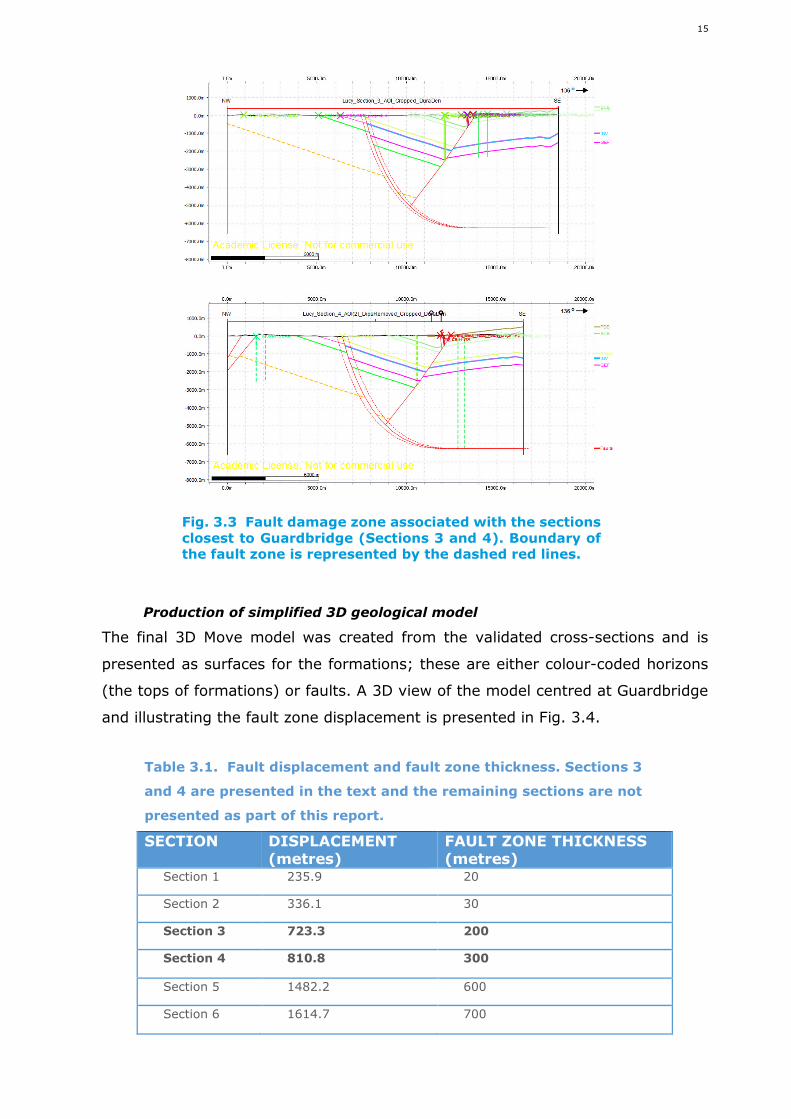
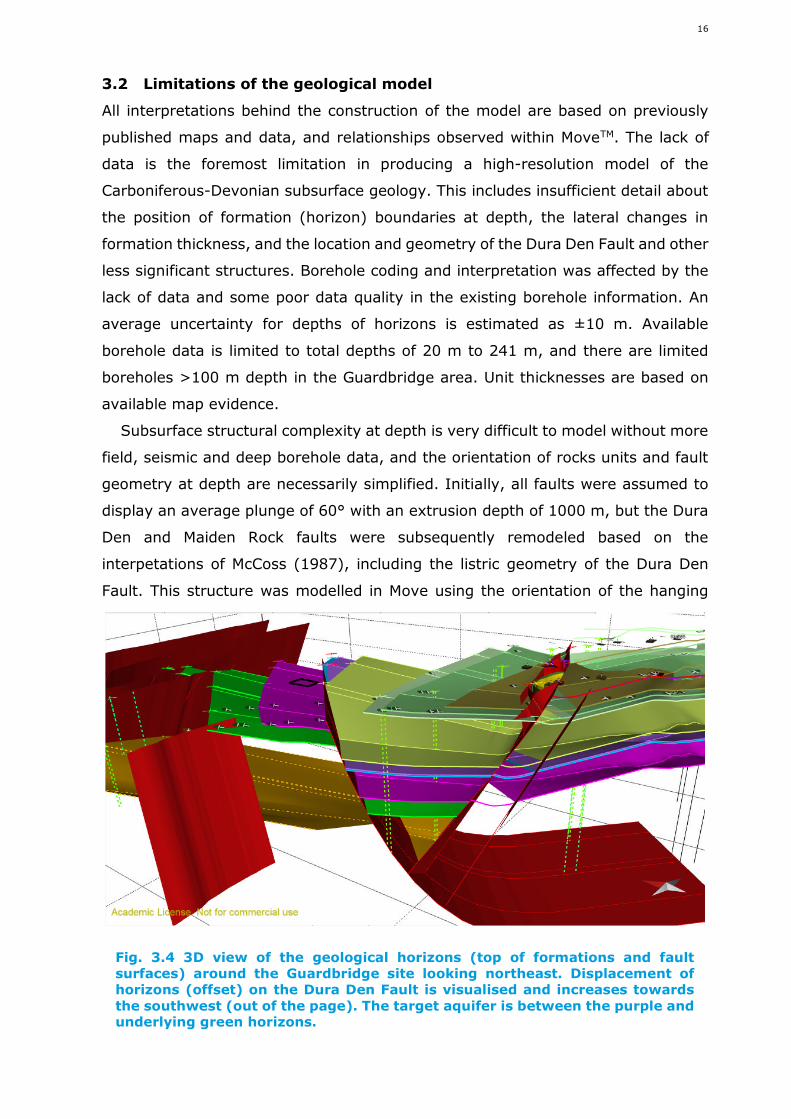
Production of simplified 3D geological model
The final 3D Move model was created from the validated cross-sections and is
presented as surfaces for the formations; these are either colour-coded horizons
(the tops of formations) or faults. A 3D view of the model centred at Guardbridge
and illustrating the fault zone displacement is presented in Fig. 3.4.
Table 3.1. Fault displacement and fault zone thickness. Sections 3
and 4 are presented in the text and the remaining sections are not
presented as part of this report.
SECTION DISPLACEMENT(metres)
FAULT ZONE THICKNESS(metres)
Section 1 235.9 20
Section 2 336.1 30
Section 3 723.3 200
Section 4 810.8 300
Section 5 1482.2 600
Section 6 1614.7 700
Fig. 3.3 Fault damage zone associated with the sectionsclosest to Guardbridge (Sections 3 and 4). Boundary ofthe fault zone is represented by the dashed red lines.
16
3.2 Limitations of the geological model
All interpretations behind the construction of the model are based on previously
published maps and data, and relationships observed within MoveTM. The lack of
data is the foremost limitation in producing a high-resolution model of the
Carboniferous-Devonian subsurface geology. This includes insufficient detail about
the position of formation (horizon) boundaries at depth, the lateral changes in
formation thickness, and the location and geometry of the Dura Den Fault and other
less significant structures. Borehole coding and interpretation was affected by the
lack of data and some poor data quality in the existing borehole information. An
average uncertainty for depths of horizons is estimated as ±10 m. Available
borehole data is limited to total depths of 20 m to 241 m, and there are limited
boreholes >100 m depth in the Guardbridge area. Unit thicknesses are based on
available map evidence.
Subsurface structural complexity at depth is very difficult to model without more
field, seismic and deep borehole data, and the orientation of rocks units and fault
geometry at depth are necessarily simplified. Initially, all faults were assumed to
display an average plunge of 60° with an extrusion depth of 1000 m, but the Dura
Den and Maiden Rock faults were subsequently remodeled based on the
interpetations of McCoss (1987), including the listric geometry of the Dura Den
Fault. This structure was modelled in Move using the orientation of the hanging
Fig. 3.4 3D view of the geological horizons (top of formations and faultsurfaces) around the Guardbridge site looking northeast. Displacement ofhorizons (offset) on the Dura Den Fault is visualised and increases towardsthe southwest (out of the page). The target aquifer is between the purple andunderlying green horizons.
17
wall horizons and the Constant Heave algorithm, which ultimately depends on
accuracy of cross-section construction. Cross-section 4 was used as a proxy for
fault construction. Other faults were modelled as planar structures at depth due to
lack of available data, but in reality are most likely curviplanar horizons. No strike-
slip component was taken into account during fault restorations (simple shear
algorithm used), and no growth structure or damage structures are accounted for
in the model.
3.3 Aquifer prospect evaluation
In order to investigate well design options, all the stratigraphic units and
thicknesses were compiled, based on the available borehole data and the geological
model presented in Section 3.1. As previously stated, the borehole penetration is
no more than 241 m around the Guardbridge area and is ~100 m within the
Guardbridge site, therefore depths and lithologies at deeper horizons are based on
the extrapolation of the surface geology below Guardbridge and the existing cross-
sections. All target horizon depths and thicknesses are based on the 2D and 3D
regional geological model presented in the previous section and the closest and/or
most detailed stratigraphy available (Browne et al., 1999; Browne et al., 2002;
Shell, 2002; Walters et al., 2007; Dean et al., 2011). Permeabilities and porosities
are estimated from published data of outcrop and shallow boreholes from Fife and
the Midlothian areas (see sections 3.4 and 4.1).
This report presents four drilling scenarios for the Guardbridge Geothermal
Energy Feasibility project. One on-site, relatively shallow, vertical borehole located
on the footwall, and outside of the damage zone, of the Dura Den Fault. The first
target is the Scone Sandstone Formation. The second drilling scenario is on the
hanging wall of the Dura Den Fault in a location near the A91 and Edenside area;
this well is also predicted to be outside the damage zone and to a depth of 1050
m. The target is the undivided Kinnesswood and Knox Pulpit formations. The
third scenario is a deviated well starting at a second on-site location within the
Guardbridge Energy Centre and deviating to a depth of 1100 m over 1000 m
distance. The main target is the Kinnesswood and Knox Pulpit formations and
the well will intercept the Dura Den Fault and damage zone for up to 400 m
distance. The fourth scenario extends the previous well by drilling parallel to the
dip of the Kinnesswood and Knox Pulpit formations to a depth of 1500 m over
a total horizontal distance of about 2000 m.
18
Scenario 1 - Well GB1
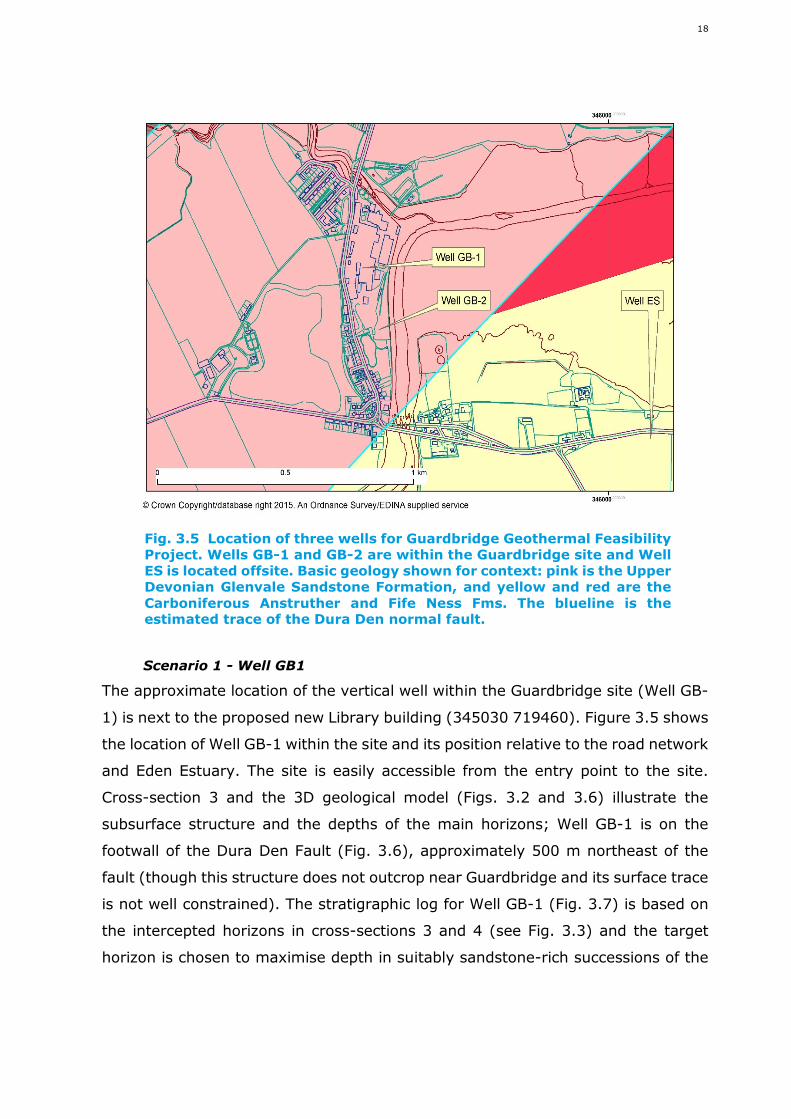
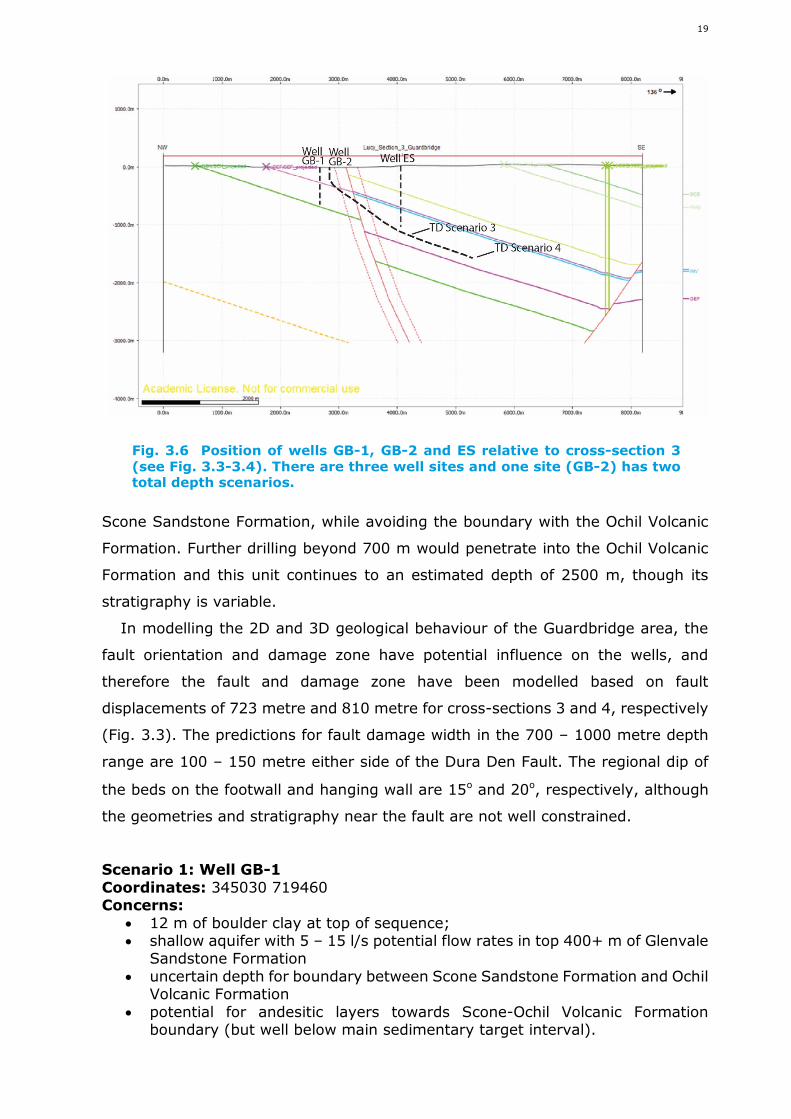
The approximate location of the vertical well within the Guardbridge site (Well GB-
1) is next to the proposed new Library building (345030 719460). Figure 3.5 shows
the location of Well GB-1 within the site and its position relative to the road network
and Eden Estuary. The site is easily accessible from the entry point to the site.
Cross-section 3 and the 3D geological model (Figs. 3.2 and 3.6) illustrate the
subsurface structure and the depths of the main horizons; Well GB-1 is on the
footwall of the Dura Den Fault (Fig. 3.6), approximately 500 m northeast of the
fault (though this structure does not outcrop near Guardbridge and its surface trace
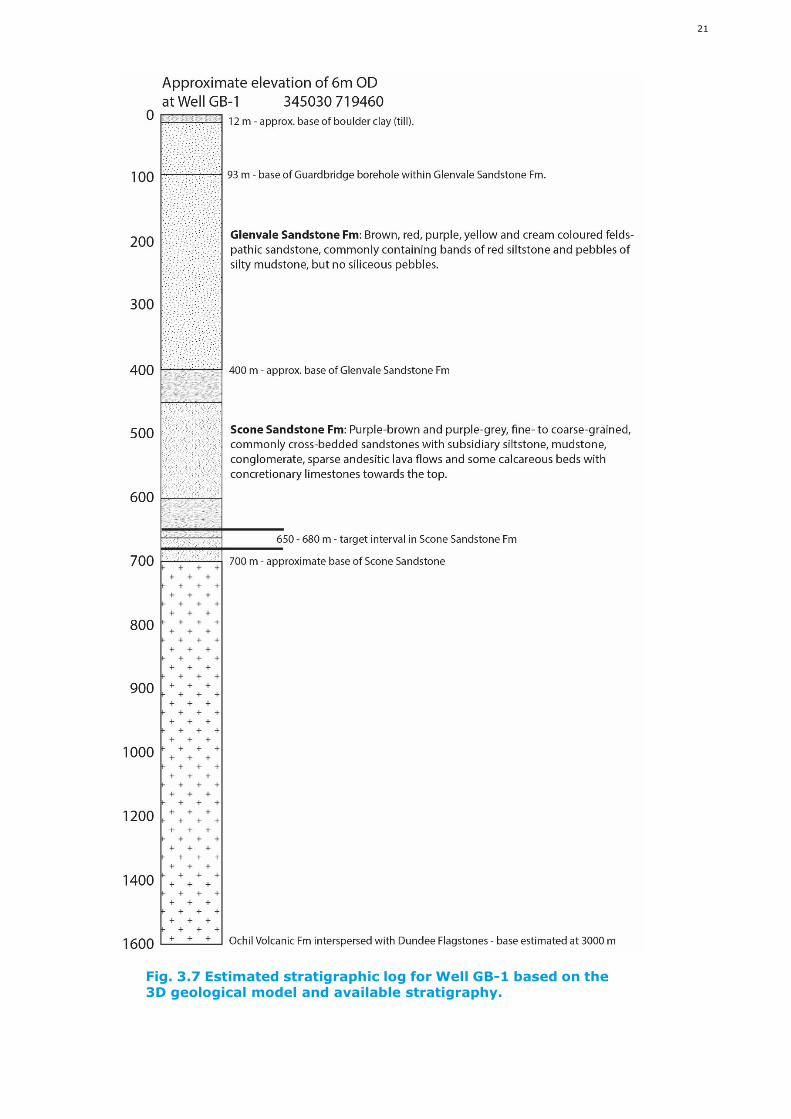
is not well constrained). The stratigraphic log for Well GB-1 (Fig. 3.7) is based on
the intercepted horizons in cross-sections 3 and 4 (see Fig. 3.3) and the target
horizon is chosen to maximise depth in suitably sandstone-rich successions of the
Fig. 3.5 Location of three wells for Guardbridge Geothermal FeasibilityProject. Wells GB-1 and GB-2 are within the Guardbridge site and WellES is located offsite. Basic geology shown for context: pink is the UpperDevonian Glenvale Sandstone Formation, and yellow and red are theCarboniferous Anstruther and Fife Ness Fms. The blueline is theestimated trace of the Dura Den normal fault.
19
Scone Sandstone Formation, while avoiding the boundary with the Ochil Volcanic
Formation. Further drilling beyond 700 m would penetrate into the Ochil Volcanic
Formation and this unit continues to an estimated depth of 2500 m, though its
stratigraphy is variable.
In modelling the 2D and 3D geological behaviour of the Guardbridge area, the
fault orientation and damage zone have potential influence on the wells, and
therefore the fault and damage zone have been modelled based on fault
displacements of 723 metre and 810 metre for cross-sections 3 and 4, respectively
(Fig. 3.3). The predictions for fault damage width in the 700 – 1000 metre depth
range are 100 – 150 metre either side of the Dura Den Fault. The regional dip of
the beds on the footwall and hanging wall are 15o and 20o, respectively, although
the geometries and stratigraphy near the fault are not well constrained.
Scenario 1: Well GB-1Coordinates: 345030 719460Concerns:
12 m of boulder clay at top of sequence; shallow aquifer with 5 – 15 l/s potential flow rates in top 400+ m of Glenvale
Sandstone Formation uncertain depth for boundary between Scone Sandstone Formation and Ochil
Volcanic Formation potential for andesitic layers towards Scone-Ochil Volcanic Formation
boundary (but well below main sedimentary target interval).
Fig. 3.6 Position of wells GB-1, GB-2 and ES relative to cross-section 3(see Fig. 3.3-3.4). There are three well sites and one site (GB-2) has twototal depth scenarios.
20
Uncertainties: exact position of the Dura Den Fault and the extent of the damage zone.
Latter estimated to be 100 – 150 m either side of the fault, therefore well islikely to be outside of damage zone if fault is correctly positioned.
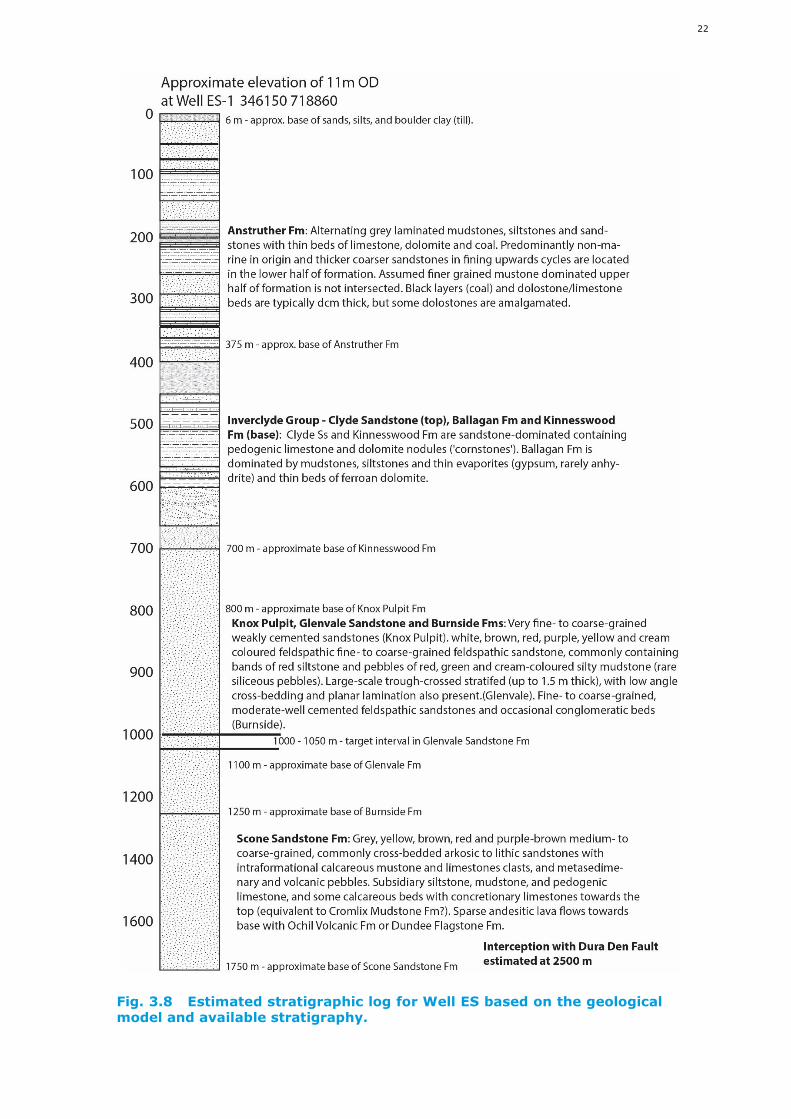
Scenario 2 - Well ES
The approximate location of the vertical well outside the Guardbridge site (Well ES)
is next to the A91 in a local farmer’s field. Figures 3.5 and 3.6 shows the location
of Well ES and its position relative to road network, Guardbridge and Eden Estuary.
The site is easily accessible from the A91. Section 3 (Fig. 3.2 – 3.3) illustrates the
subsurface structure and the depth and thicknesses of the main horizons; Well ES
is on the hangingwall of the Dura Den Fault, approximately 700 m southeast of the
fault. The stratigraphic log for Well ES (Fig. 3.8) is based on the intercepted
horizons in cross-sections 3 and 4 (Fig. 3.3) and the target is the Upper Devonian
aquifer rocks of the Kinnesswood/Knox Pulpit formations. The modelled damage
zone width is 100 - 150 metre either side of the fault and the regional dip of the
beds on hanging wall are 20o respectively, but geometries and stratigraphy near
the fault are not well constrained.
Scenario 2: Well ES
Coordinates: 345770 718750
Concerns:
~6 m of unconsolidated sand and carse clay, with boulder clay at base;
Anstruther Formation contains thin coals, plus organic-rich mudstones and
siltstones which may contain oil (oil shales);
Inverclyde Group rocks have thin evaporite and dolostone beds;
Main target (Knox Pulpit Formation) has 5 – 15 l/s potential flow rates up to
400+ m depth, but uncertain at depths of 700 – 1250 m.
Uncertainties:
exact position of the Dura Den Fault and the extent of the damage zone.
Latter estimated to be 100 -150 m either side of the fault, therefore well is
likely to be well outside of damage zone if fault is correctly positioned.
21
Fig. 3.7 Estimated stratigraphic log for Well GB-1 based on the3D geological model and available stratigraphy.
22
Fig. 3.8 Estimated stratigraphic log for Well ES based on the geologicalmodel and available stratigraphy.
23
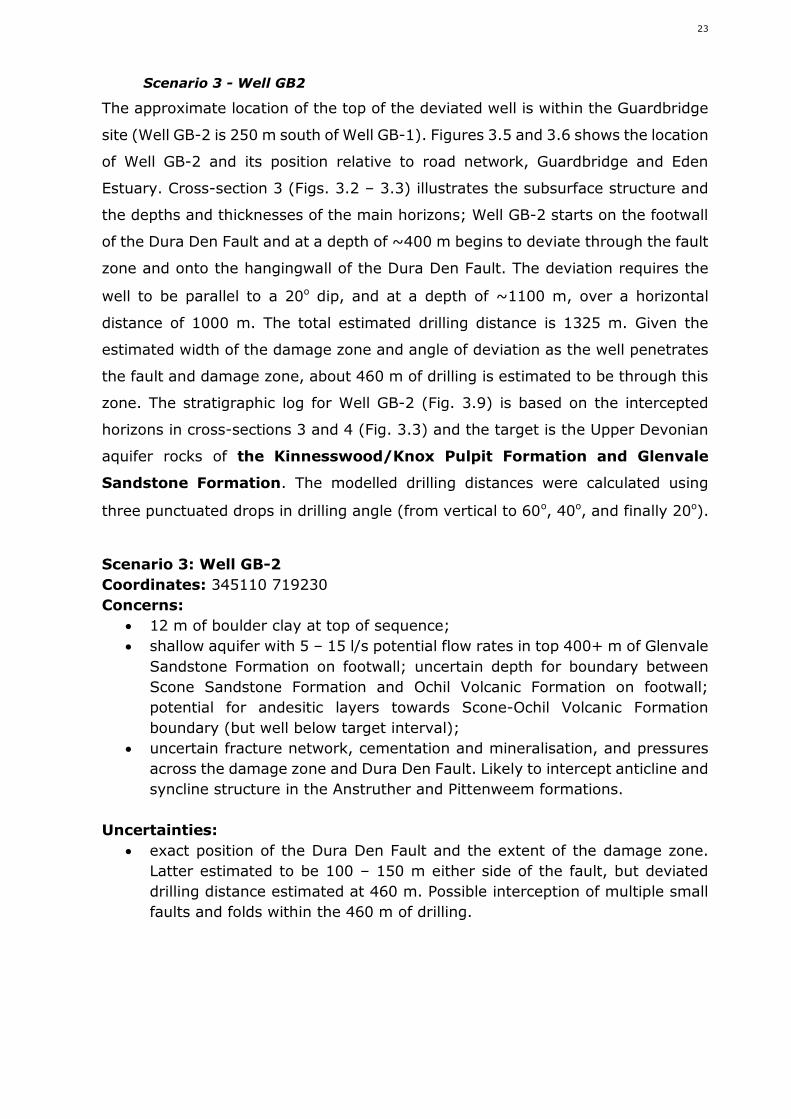
Scenario 3 - Well GB2
The approximate location of the top of the deviated well is within the Guardbridge
site (Well GB-2 is 250 m south of Well GB-1). Figures 3.5 and 3.6 shows the location
of Well GB-2 and its position relative to road network, Guardbridge and Eden
Estuary. Cross-section 3 (Figs. 3.2 – 3.3) illustrates the subsurface structure and
the depths and thicknesses of the main horizons; Well GB-2 starts on the footwall
of the Dura Den Fault and at a depth of ~400 m begins to deviate through the fault
zone and onto the hangingwall of the Dura Den Fault. The deviation requires the
well to be parallel to a 20o dip, and at a depth of ~1100 m, over a horizontal
distance of 1000 m. The total estimated drilling distance is 1325 m. Given the
estimated width of the damage zone and angle of deviation as the well penetrates
the fault and damage zone, about 460 m of drilling is estimated to be through this
zone. The stratigraphic log for Well GB-2 (Fig. 3.9) is based on the intercepted
horizons in cross-sections 3 and 4 (Fig. 3.3) and the target is the Upper Devonian
aquifer rocks of the Kinnesswood/Knox Pulpit Formation and Glenvale
Sandstone Formation. The modelled drilling distances were calculated using
three punctuated drops in drilling angle (from vertical to 60o, 40o, and finally 20o).
Scenario 3: Well GB-2
Coordinates: 345110 719230
Concerns:
12 m of boulder clay at top of sequence;
shallow aquifer with 5 – 15 l/s potential flow rates in top 400+ m of Glenvale
Sandstone Formation on footwall; uncertain depth for boundary between
Scone Sandstone Formation and Ochil Volcanic Formation on footwall;
potential for andesitic layers towards Scone-Ochil Volcanic Formation
boundary (but well below target interval);
uncertain fracture network, cementation and mineralisation, and pressures
across the damage zone and Dura Den Fault. Likely to intercept anticline and
syncline structure in the Anstruther and Pittenweem formations.
Uncertainties:
exact position of the Dura Den Fault and the extent of the damage zone.
Latter estimated to be 100 – 150 m either side of the fault, but deviated
drilling distance estimated at 460 m. Possible interception of multiple small
faults and folds within the 460 m of drilling.
24
Fig. 3.9 Estimated stratigraphy for the deviated well (GB-2). Depthmeasurements are the drilled length of the deviated well and thepink interval represents the fault damage zone.
25
Scenario 4 - Well GB2
The deviated well will be oriented parallel to dip (20o) at a vertical depth of ~1100
m and within the Glenvale Formation (Fig. 3.9). A continuation of the drilling at the
same dip will permit the same geological unit to be targeted at a greater depth
below the surface. An estimated drilling distance of 2495 m will target the Glenvale
Sandstone Formation at ~1500 m below the surface.
Scenario 4: Well GB-2
Coordinates: 345110 719230
Concerns:
Same concerns as scenario 3.
Uncertainties:
Same uncertainties as scenario 3. Assumption that Glenvale Formation is of
uniform thickness and that there are no further faults beyond the estimated
damage zone.
3.4 Hydrogeological model
In order to estimate the groundwater flow rates and pathways for the HSA targets
beneath Guardbridge, a review of the regional groundwaterflow system was
undertaken. This provides a general overview of aquifer behaviour and the regional
controls on sub-surface fluid flow. There are limitations to this analysis, however,
because there is very little known about the deep sub-surface hydrogeology in
Scotland, and therefore the geology beneath Guardbridge is insufficiently
understood (i.e. aquifer thicknesses and porosity/permeabilities, behaviour of the
Dura Den Fault); some of the key parameters required to model groundwater flow
are unknown. The estimated hydrogeological properties are combined with the
geological model developed in the previous sections to produce a conceptual and
preliminary numerical groundwater flow model to test some necessary conditions
for an economic HSA project at Guardbridge.
Regional groundwater flow system
The north-western and south-eastern margins of the Midland Valley, marked by
the Highland Boundary Fault and the Southern Upland Fault respectively, are
elevated with respect to the lower lying Forth-Clyde Axis. Within the regional
context, they present areas of highest fluid potential and could provide the driving
force for recharge and downward flow to a deep circulating regional groundwater
system. If recharge of cool water occurs north of the Ochill Hills (north of
Guardbridge), deep-seated flow may occur from north to south beneath the
26
volcanic rocks with corresponding upwelling and discharge along the Forth-Clyde
axis and near the coastline (Browne et al., 1987).
In the Eden River Valley of northeast Fife, the groundwater flow system appears
to be dominated by recharge from valley sides. The majority of the recharge is
either discharged directly as baseflow to the river or displaces shallow groundwater
which is later discharged as baseflow. Most flow is believed to be transported via
shallow flow paths (Ó Dochartaigh et al., 1999) in the upper 100 m of aquifers, and
most of these are weathered and fractured and have little intergranular
permeability; a small component of the flow may be feeding into a deeper regional
groundwater system.
The groundwater contour pattern within the Eden River valley implies that there
are two components to groundwater flow: one perpendicular from the valley sides
towards the River Eden and one parallel to the length of the valley. However, this
longitudinal groundwater flow component down the valley towards the coast
appears to be very small and is likely to be at depth, away from the influence of
the near-surface regime and constrained by the geological complexity of the area
and the reduced permeability of aquifers at depth. It is likely to be slow and in the
direction of the general regional hydraulic gradient (Ó Dochartaigh et al., 1999).
Groundwater chemistry of the shallow groundwater of Fife and Strathmore
provides no evidence for deep flow paths. The waters are weakly to moderately
mineralised and are almost invariably oxygenated with detectable concentrations
of dissolved oxygen (DO) and high Eh values (Ó Dochartaigh et al., 2006, Browne
et al., 1987). There is no evidence from stable isotope and CFC analysis that these
waters are especially old, though mixing between remnants of Pleistocene (more
than 10,000 years old) waters and modern water has been proposed for other
basins in Scotland (MacDonald et al., 2003) and cannot be wholly ruled out for Fife
and Strathmore in the absence of radiocarbon data (Ó Dochartaigh et al., 2006).
Hence, evidence for deep groundwater circulation is, at best, inconclusive. Deep
flows are probably small to moderate in volume, i.e. less than 10% of the total flow
within the catchment, and limited to isolated discrete pathways along zones of
tectonic weakness, such as faults (Browne et al., 1987).
Aquifer properties of the target formations
As stated earlier, the Upper Devonian rocks of the Midland Valley represent some
of the highest productivity aquifers in the Midland Valley and these are present
under the Guardbridge site. The Upper Devonian Stratheden Group aquifer
incorporates, in ascending succession, the Burnside, Glenvale, Knox Pulpit and
27
Kinnesswood formations and its base is marked by an unconformable contact with
the Lower Devonian Scone Sandstone Formation (Arbuthnott-Garvock Group); the
latter is transitional with the largely impermeable lavas of the Ochil Volcanic
Formation (Browne et al., 1987).
The sandstones of the Stratheden Group and Scone Sandstone Formation are
proven aquifers in Fife. The structure of the aquifer outcrop is largely controlled by
extensional faulting, with much of the aquifer being fault-bonded by the SW-NE
trending Fernie and Dura Den faults. The Scone Sandstone Formation is classed as
highly productive (MacDonald et al., 2004) with normal operating yields in the
Devonian sedimentary rocks in the range of 5 to 15 litres/second [l/s] (Ó
Dochartaigh, 2006). Groundwater flow is dominated by fracture permeability, even
in the sandstone formations where intergranular permeability is relatively high and
anisotropic, suggesting that there may be preferential horizontal flow along
bedding planes (Ó Dochartaigh, 2006). Measurements of the intergranular porosity
and permeability are not available for the Scone Sandstone Formation, but
measurements at one borehole in the Lower Devonian sedimentary rocks in the
Strathmore Basin (Fig. 1.2) at depths of between 7 and 147 m below ground level
indicate a median porosity of 14 % and a median hydraulic conductivity of 0.0014
m/d [metres/day] (Ó Dochartaigh, 2006), which is similar to the Upper Devonian
Glenvale Sandstone Formation in Fife (Ó Dochartaigh, 2004). The transmissivity of
the Arbuthnott-Garvock Group (undivided), which contains the Scone Sandstone
Formation, is given by Ó Dochartaigh et al. (2006) as between 4 - 290 m2/d with
a median value of 34 m2/d (6 samples), while specific capacity ranges between 2
and 258 m3/d/m with a median of 25 m3/d/m (7 samples). Storage in the Lower
Devonian aquifer is given as an average value of 0.002 (5 samples).
Little is known directly about groundwater flow in the Devonian volcanic rocks,
although fracture flow is likely to dominate, except along the boundaries of
individual lava flows which may be preferentially weathered, increasing the local
intergranular permeability. High flow rates in the Ochil Volcanic Formation occur in
boreholes in Dundee. Intercalations of volcanic rocks within the Scone Sandstone
Formaiton are likely to restrict groundwater flow both vertically and laterally.
The Knox Pulpit Formation, together with the overlying Kinnesswood Formation,
generally has the highest porosity and permeability of the Upper Devonian of Fife.
The underlying Glenvale and Burnside formations tend to have lower permeability,
but provide significant yields in some cases. Public supply boreholes abstracting
from the Knox Pulpit and Kinnesswood formations, such as Freuchie and Newton of
28
Lathrisk, provide yields of up to 46 l/s, while those constructed in the Glenvale and
Burnside Formations, such as Kinneston and the Kinnesswood boreholes, do not
generally yield more than 28 l/s. The highest permeability in each of the Upper
Devonian units tends to be in the uppermost 10 to 15 m of the saturated zone,
where weathering has significantly increased secondary permeability (Foster et al.,
1976). Porosity in the aquifer is generally relatively high. The sampled values
range from 4 to 30%, with a geometric mean of 19%. Laboratory measurements
of pore-size distribution and centrifuge specific yield for the same core samples
show that the specific yields of sandstones with porosities exceeding 20% are likely
to reach 12 to 15%. Sandstones with porosities of less than 20% tend to have
more variable pore size distributions and may have specific yields of less than 5%
(Foster et al., 1976). Hydraulic conductivities of 0.5 m/d (7 samples) are reported
for the (undivided) Upper Devonian aquifers in Fife (Ó Dochartaigh et al., 2015).
Transmissivity in the Knox Pulpit Formation is generally around 200 m2/d. Very
high transmissivity values in the Kinnesswood Formation (Kinnesswood borehole)
may be explained by the fact that the area is highly faulted. In comparison, testing
of the Kinneston borehole (Glenvale) gave a very low transmissivity of only 12 m2/d
(Ó Dochartaigh et al., 1999).
The higher permeabilities at outcrop are not representative of the deeper
subsurface due to compaction and mineralisation. Groundwater flow can be
dominated by fracture permeability, even in sandstone formations where
intergranular permeability is relatively high. However, the majority of fracture
inflows occur within 60 to 70 m of the ground surface. At greater depths, secondary
voids also occur, but to a lesser extent. In the Kettlebridge borehole, for example,
which is 123 m deep, only 10% of the total yield derives from below 100 m (Foster
et al., 1976). Theoretically, fractures are likely to be closed (or absent) at depths
of one kilometre or more beneath the central Midland Valley (Browne et al., 1987).
The permeability of the most deeply buried sandstones in Fife is estimated by
Browne et al. (1987) to be of the order of 0.014 m/d perhaps attaining 0.14 m/d
within selective but isolated zones, with a transmissivity of 20 m2/d for the Knox
Pulpit Formation (at 500m depth). Core samples suggest that the hydraulic
properties of the target formations become less favourable with increasing depths,
as mineral overgrowths and pressure solution reduces the porosity. Borehole
geophysics further suggest reduced permeability with depths (as inferred from
deep boreholes in the Knox Pulpit Formation (and parts of adjacent formations).
However, from a comparison with 4 m2/d at Marchwood (1666 – 1725 m) and
29
Southampton (1729 – 1796 m), 7 m2/d at Larne (968 – 1616 m) and >60 m2/d at
Cleethorpe (1100 -1498 m), the Upper Devonian/Lower Carboniferous aquifer in
Fife could be capable of supporting the level of abstraction required for low enthalpy
geothermal projects, although the abstracted fluids are likely to be mineralised.
Since there is a lack of deep boreholes (> 500 – 1000 m) through these aquifers,
and current measurements are derived from much shallower depths, it is not
possible to predict flow rates and transmissivities with any accuracy.
Dura Den Fault permeability
The role of the Dura Den Fault as a pathway for deep regional groundwater flow is
currently unknown. It has been proposed that fractures and faults that are oriented
parallel to the maximum horizontal stress orientation (sHmax) experience the lowest
normal stresses acting across them, therefore fractures will undergo the least
amount of closure and will thus be the most permeable (Heffer and Lean, 1993).
However, Laubach et al. (2004) observed that at depths of >3 km, open fractures
were not aligned parallel to the sHmax direction. Instead, fractures whose state of
stress are close to the failure criterion are more likely to be conductive because of
localized failure associated with a large shear component acting along the fracture
surfaces (Barton et al., 1995). These fractures are termed ‘critically stressed’
fractures and are oriented approximately 30º to the maximum horizontal stress
(sHmax) orientation (Rogers and Evans, 2002; Rogers, 2003).
Cherubini et al. (2014) suggest that an initial characterization of hydraulic
properties of faults could be achieved through an analysis of the fault positions in
relation to present-day in situ stress field, as applied by Sathar et al. (2012) for
Sellafield. The current stress field of Scotland is described as near east-west
extension (Baptie, 2010) with a NNW trend for the maximum horizontal
compressive stress (Heidbach et al., 2008). Trending approximately north-east,
the Dura Den Fault is oriented ~60-70º to the maximum horizontal stress
orientation, hence it may not fall into the category of ‘critically stressed fractures’,
although this requires local analysis (Sathar et al., 2012).
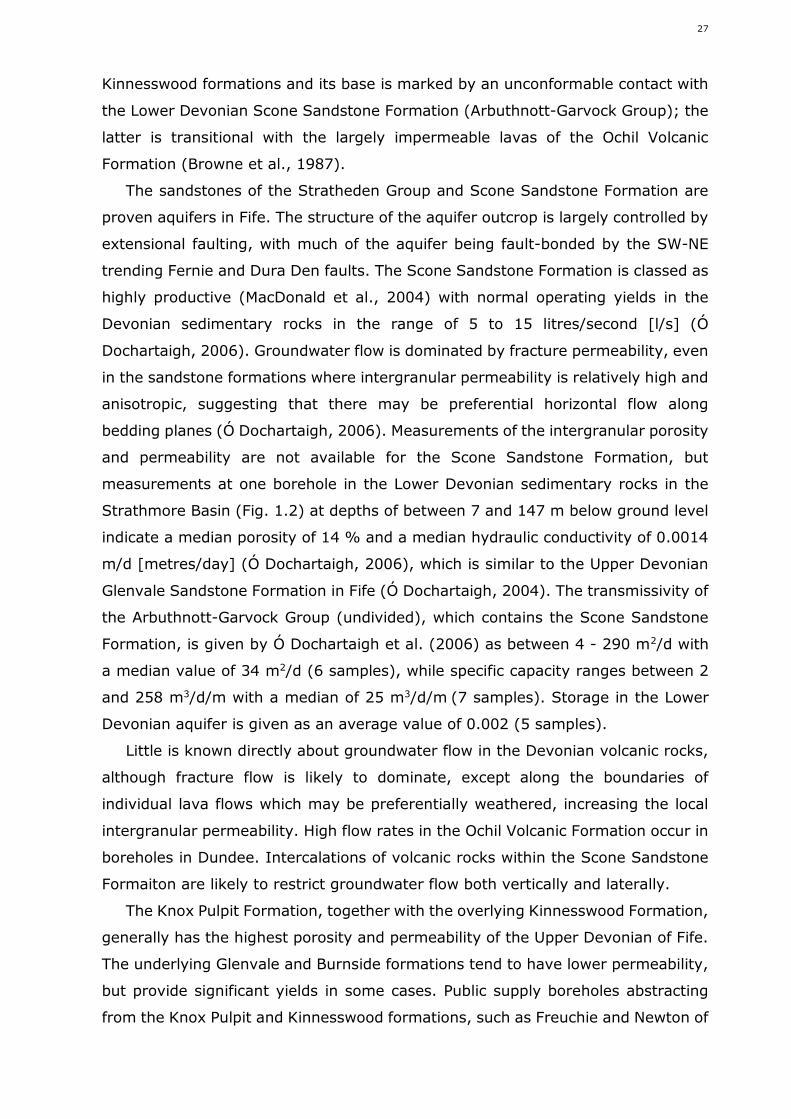
Hydrogeological model development
A simple conceptual hydrogeological model arising from the geological model and
regional review of the hydrogeology is presented in Figure 3.10. It focuses on the
aquifer target depths and thicknesses which are important parameters, and
incorporates the modelling of the Dura Den Fault damage zone. The aquifer
properties are presented in Table 3.2 and are taken from published literature and
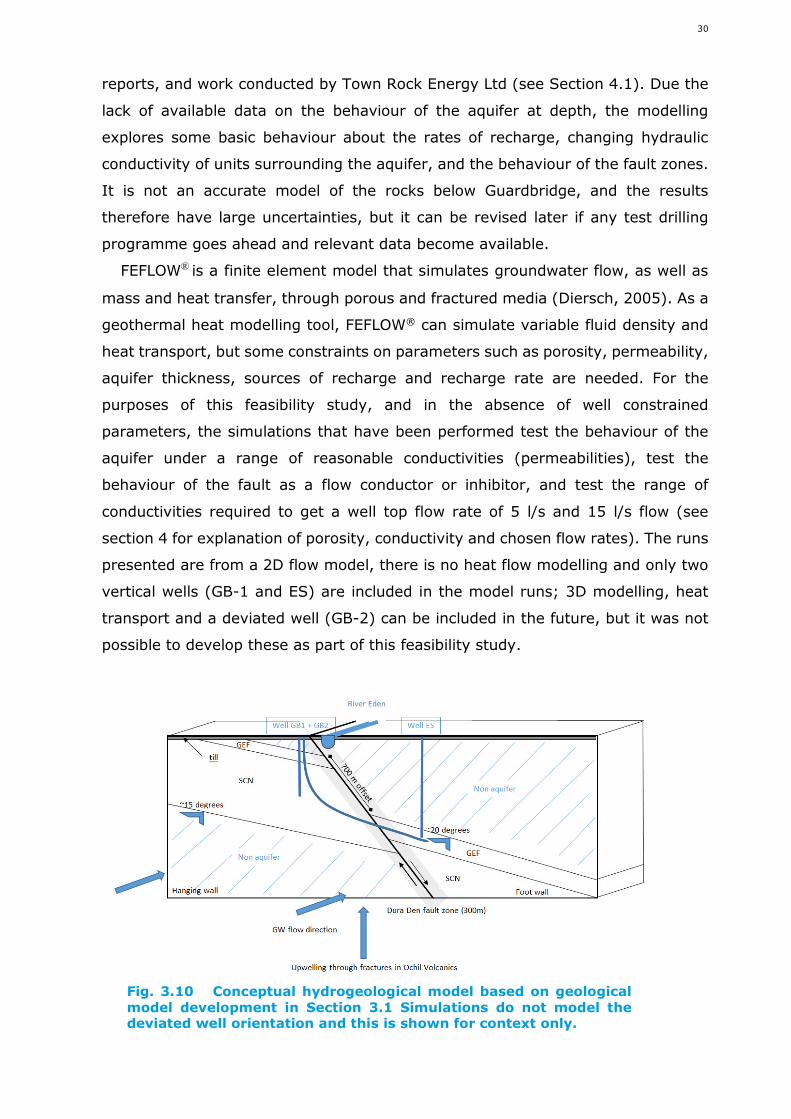
30
reports, and work conducted by Town Rock Energy Ltd (see Section 4.1). Due the
lack of available data on the behaviour of the aquifer at depth, the modelling
explores some basic behaviour about the rates of recharge, changing hydraulic
conductivity of units surrounding the aquifer, and the behaviour of the fault zones.
It is not an accurate model of the rocks below Guardbridge, and the results
therefore have large uncertainties, but it can be revised later if any test drilling
programme goes ahead and relevant data become available.
FEFLOW® is a finite element model that simulates groundwater flow, as well as
mass and heat transfer, through porous and fractured media (Diersch, 2005). As a
geothermal heat modelling tool, FEFLOW® can simulate variable fluid density and
heat transport, but some constraints on parameters such as porosity, permeability,
aquifer thickness, sources of recharge and recharge rate are needed. For the
purposes of this feasibility study, and in the absence of well constrained
parameters, the simulations that have been performed test the behaviour of the
aquifer under a range of reasonable conductivities (permeabilities), test the
behaviour of the fault as a flow conductor or inhibitor, and test the range of
conductivities required to get a well top flow rate of 5 l/s and 15 l/s flow (see
section 4 for explanation of porosity, conductivity and chosen flow rates). The runs
presented are from a 2D flow model, there is no heat flow modelling and only two
vertical wells (GB-1 and ES) are included in the model runs; 3D modelling, heat
transport and a deviated well (GB-2) can be included in the future, but it was not
possible to develop these as part of this feasibility study.
Fig. 3.10 Conceptual hydrogeological model based on geologicalmodel development in Section 3.1 Simulations do not model thedeviated well orientation and this is shown for context only.
31
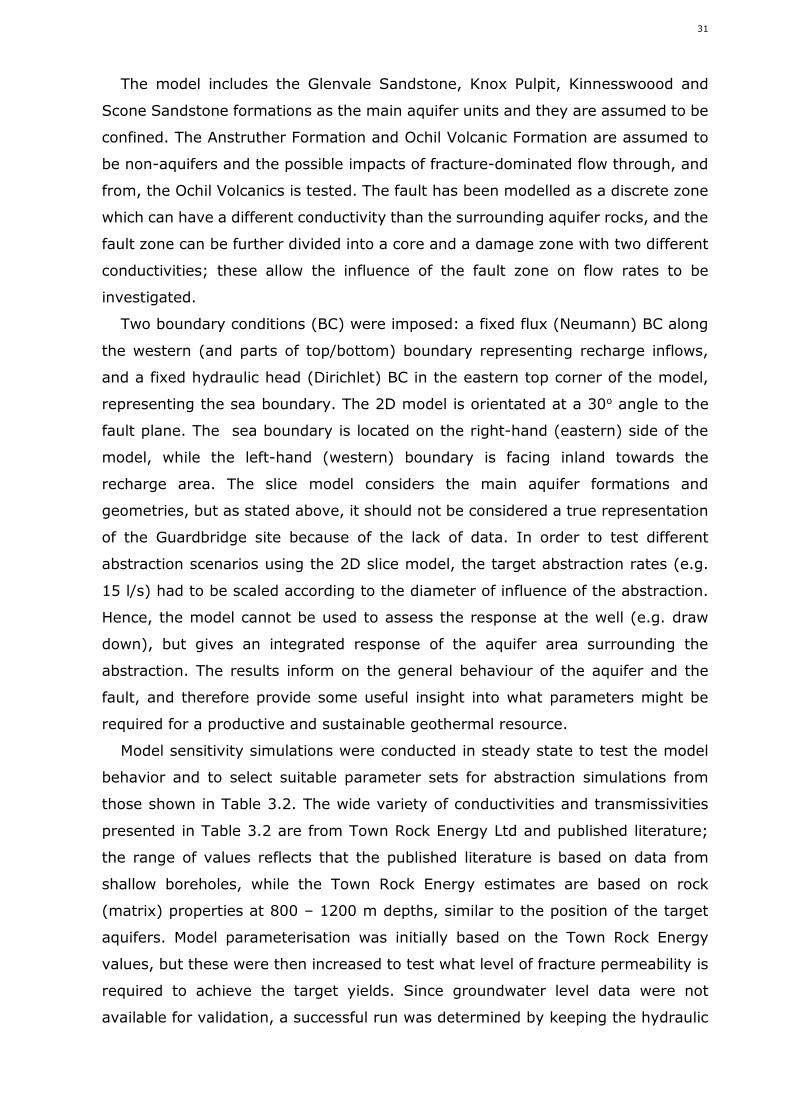
The model includes the Glenvale Sandstone, Knox Pulpit, Kinnesswoood and
Scone Sandstone formations as the main aquifer units and they are assumed to be
confined. The Anstruther Formation and Ochil Volcanic Formation are assumed to
be non-aquifers and the possible impacts of fracture-dominated flow through, and
from, the Ochil Volcanics is tested. The fault has been modelled as a discrete zone
which can have a different conductivity than the surrounding aquifer rocks, and the
fault zone can be further divided into a core and a damage zone with two different
conductivities; these allow the influence of the fault zone on flow rates to be
investigated.
Two boundary conditions (BC) were imposed: a fixed flux (Neumann) BC along
the western (and parts of top/bottom) boundary representing recharge inflows,
and a fixed hydraulic head (Dirichlet) BC in the eastern top corner of the model,
representing the sea boundary. The 2D model is orientated at a 30o angle to the
fault plane. The sea boundary is located on the right-hand (eastern) side of the
model, while the left-hand (western) boundary is facing inland towards the
recharge area. The slice model considers the main aquifer formations and
geometries, but as stated above, it should not be considered a true representation
of the Guardbridge site because of the lack of data. In order to test different
abstraction scenarios using the 2D slice model, the target abstraction rates (e.g.
15 l/s) had to be scaled according to the diameter of influence of the abstraction.
Hence, the model cannot be used to assess the response at the well (e.g. draw
down), but gives an integrated response of the aquifer area surrounding the
abstraction. The results inform on the general behaviour of the aquifer and the
fault, and therefore provide some useful insight into what parameters might be
required for a productive and sustainable geothermal resource.
Model sensitivity simulations were conducted in steady state to test the model
behavior and to select suitable parameter sets for abstraction simulations from
those shown in Table 3.2. The wide variety of conductivities and transmissivities
presented in Table 3.2 are from Town Rock Energy Ltd and published literature;
the range of values reflects that the published literature is based on data from
shallow boreholes, while the Town Rock Energy estimates are based on rock
(matrix) properties at 800 – 1200 m depths, similar to the position of the target
aquifers. Model parameterisation was initially based on the Town Rock Energy
values, but these were then increased to test what level of fracture permeability is
required to achieve the target yields. Since groundwater level data were not
available for validation, a successful run was determined by keeping the hydraulic
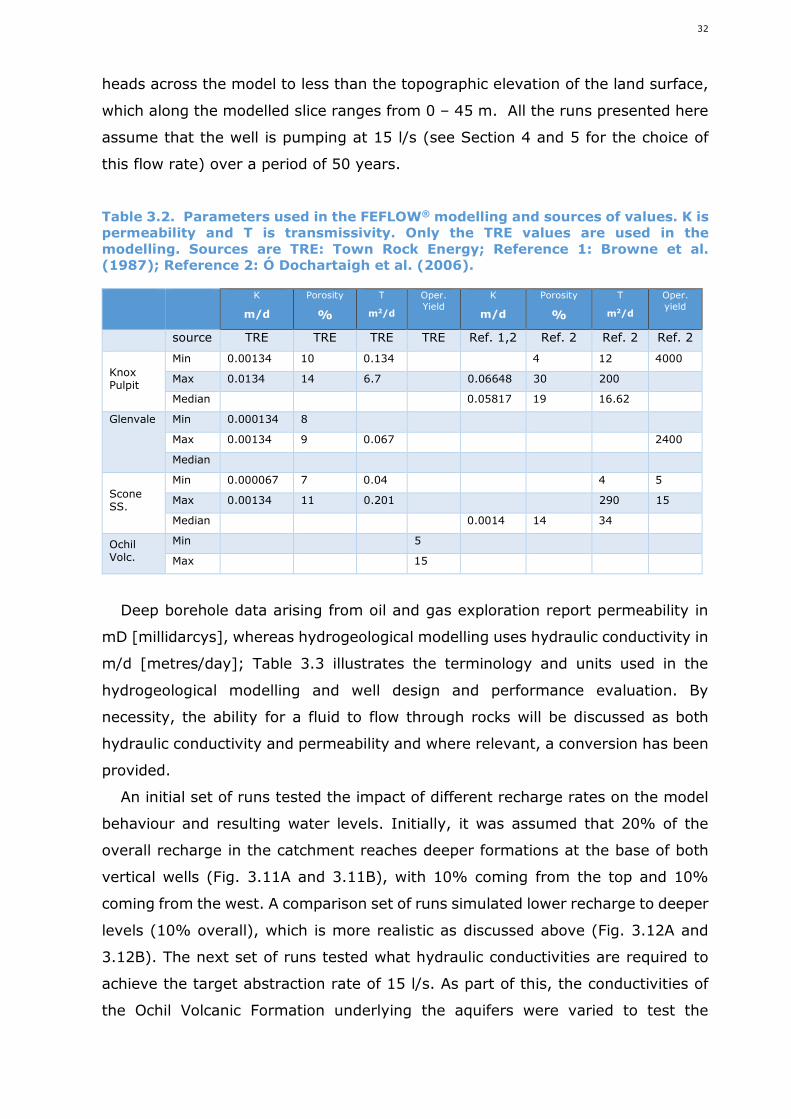
32
heads across the model to less than the topographic elevation of the land surface,
which along the modelled slice ranges from 0 – 45 m. All the runs presented here
assume that the well is pumping at 15 l/s (see Section 4 and 5 for the choice of
this flow rate) over a period of 50 years.
Table 3.2. Parameters used in the FEFLOW® modelling and sources of values. K ispermeability and T is transmissivity. Only the TRE values are used in themodelling. Sources are TRE: Town Rock Energy; Reference 1: Browne et al.(1987); Reference 2: Ó Dochartaigh et al. (2006).
K
m/d
Porosity
%
T
m2/d
Oper.Yield
K
m/d
Porosity
%
T
m2/d
Oper.yield
source TRE TRE TRE TRE Ref. 1,2 Ref. 2 Ref. 2 Ref. 2
KnoxPulpit
Min 0.00134 10 0.134 4 12 4000
Max 0.0134 14 6.7 0.06648 30 200
Median 0.05817 19 16.62
Glenvale Min 0.000134 8
Max 0.00134 9 0.067 2400
Median
SconeSS.
Min 0.000067 7 0.04 4 5
Max 0.00134 11 0.201 290 15
Median 0.0014 14 34
OchilVolc.
Min 5
Max 15
Deep borehole data arising from oil and gas exploration report permeability in
mD [millidarcys], whereas hydrogeological modelling uses hydraulic conductivity in
m/d [metres/day]; Table 3.3 illustrates the terminology and units used in the
hydrogeological modelling and well design and performance evaluation. By
necessity, the ability for a fluid to flow through rocks will be discussed as both
hydraulic conductivity and permeability and where relevant, a conversion has been
provided.
An initial set of runs tested the impact of different recharge rates on the model
behaviour and resulting water levels. Initially, it was assumed that 20% of the
overall recharge in the catchment reaches deeper formations at the base of both
vertical wells (Fig. 3.11A and 3.11B), with 10% coming from the top and 10%
coming from the west. A comparison set of runs simulated lower recharge to deeper
levels (10% overall), which is more realistic as discussed above (Fig. 3.12A and
3.12B). The next set of runs tested what hydraulic conductivities are required to
achieve the target abstraction rate of 15 l/s. As part of this, the conductivities of
the Ochil Volcanic Formation underlying the aquifers were varied to test the
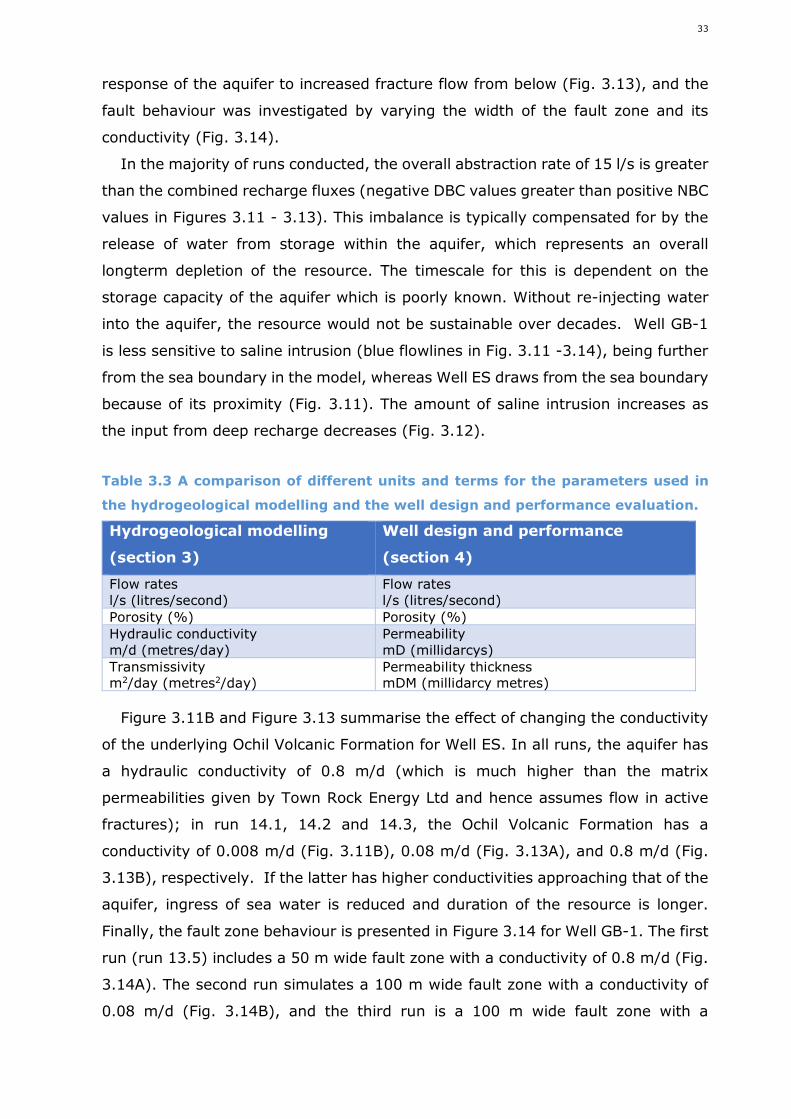
33
response of the aquifer to increased fracture flow from below (Fig. 3.13), and the
fault behaviour was investigated by varying the width of the fault zone and its
conductivity (Fig. 3.14).
In the majority of runs conducted, the overall abstraction rate of 15 l/s is greater
than the combined recharge fluxes (negative DBC values greater than positive NBC
values in Figures 3.11 - 3.13). This imbalance is typically compensated for by the
release of water from storage within the aquifer, which represents an overall
longterm depletion of the resource. The timescale for this is dependent on the
storage capacity of the aquifer which is poorly known. Without re-injecting water
into the aquifer, the resource would not be sustainable over decades. Well GB-1
is less sensitive to saline intrusion (blue flowlines in Fig. 3.11 -3.14), being further
from the sea boundary in the model, whereas Well ES draws from the sea boundary
because of its proximity (Fig. 3.11). The amount of saline intrusion increases as
the input from deep recharge decreases (Fig. 3.12).
Table 3.3 A comparison of different units and terms for the parameters used in
the hydrogeological modelling and the well design and performance evaluation.
Hydrogeological modelling
(section 3)
Well design and performance
(section 4)
Flow ratesl/s (litres/second)
Flow ratesl/s (litres/second)
Porosity (%) Porosity (%)
Hydraulic conductivitym/d (metres/day)
PermeabilitymD (millidarcys)
Transmissivitym2/day (metres2/day)
Permeability thicknessmDM (millidarcy metres)
Figure 3.11B and Figure 3.13 summarise the effect of changing the conductivity
of the underlying Ochil Volcanic Formation for Well ES. In all runs, the aquifer has
a hydraulic conductivity of 0.8 m/d (which is much higher than the matrix
permeabilities given by Town Rock Energy Ltd and hence assumes flow in active
fractures); in run 14.1, 14.2 and 14.3, the Ochil Volcanic Formation has a
conductivity of 0.008 m/d (Fig. 3.11B), 0.08 m/d (Fig. 3.13A), and 0.8 m/d (Fig.
3.13B), respectively. If the latter has higher conductivities approaching that of the
aquifer, ingress of sea water is reduced and duration of the resource is longer.
Finally, the fault zone behaviour is presented in Figure 3.14 for Well GB-1. The first
run (run 13.5) includes a 50 m wide fault zone with a conductivity of 0.8 m/d (Fig.
3.14A). The second run simulates a 100 m wide fault zone with a conductivity of
0.08 m/d (Fig. 3.14B), and the third run is a 100 m wide fault zone with a
34
conductivity of 0.8 m/d (Fig. 14C). The higher fault conductivities presents a fast
pathway for water movement from deeper horizons towards the well, but the
overall sustainability will depend on the volume of water available within these
horizons from deep recharge routes.
In summary, based on a set of poorly constrained parameters required to model
geothermal flow, the simple model presented here suggests that 15 l/s abstraction
is possible given that the aquifer thicknesses used in the model are representative
and assuming that there is sufficient fracture permeability to achieve the assumed
hydraulic conductivities. The runs suggest that re-injection will be required to
provide a sustainable resource for decades (to 50 years), but this does not address
how temperature reduces with time. The current conceptual model underlying this
2D slice model requires that the Ochil Volcanic Formation is sufficiently conductive
(due to fracturing) to permit deep water flows and that 10% of the overall recharge
travels via deep flow pathways towards the coast. It also requires fracture
permeability in the Glenvale/Knox Pulpit/Kinnesswood and Scone Sandstone
formations. However, the properties of these formations and their behaviour at
depths are so poorly understood, and further data are required before more robust
conclusions about feasibility and sustainability can be drawn. The amount of saline
intrusion modelled here is not realistic, because of the constraints and orientation
of the 2D model, and further work on a 3D model with heat transfer and more
constraints on the underlying parameters will significantly improve the model
results.
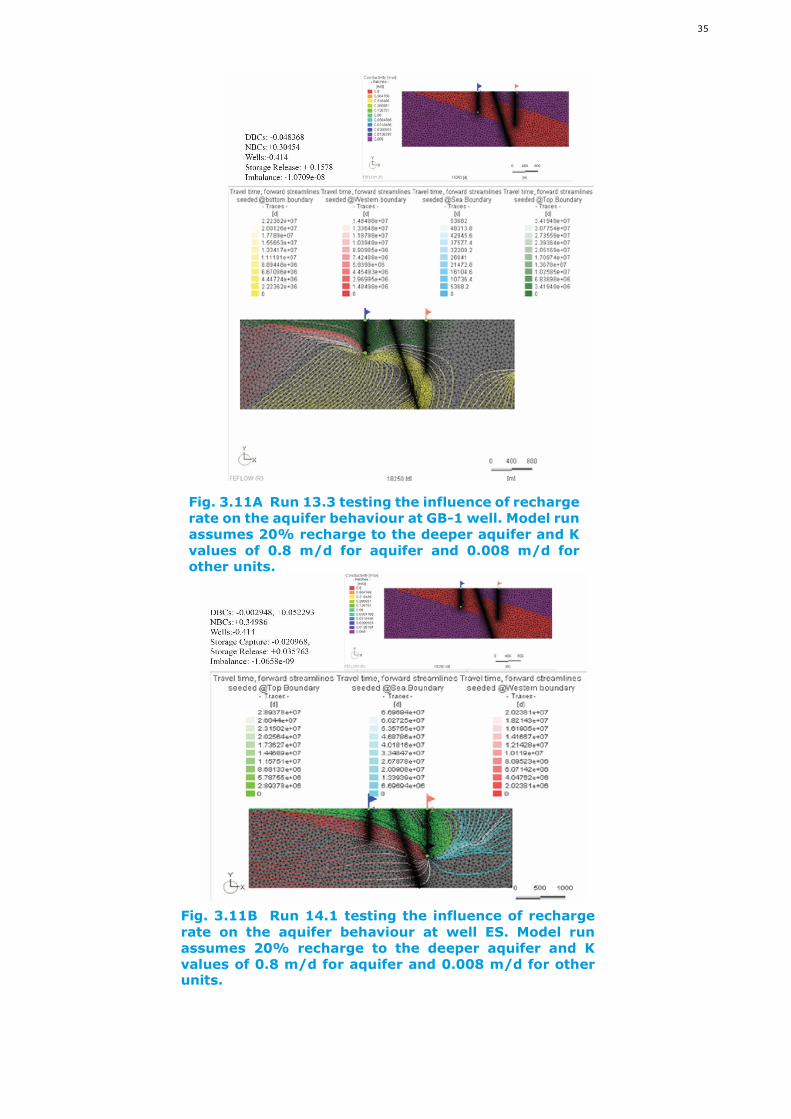
35
Fig. 3.11A Run 13.3 testing the influence of rechargerate on the aquifer behaviour at GB-1 well. Model runassumes 20% recharge to the deeper aquifer and Kvalues of 0.8 m/d for aquifer and 0.008 m/d forother units.
Fig. 3.11B Run 14.1 testing the influence of rechargerate on the aquifer behaviour at well ES. Model runassumes 20% recharge to the deeper aquifer and Kvalues of 0.8 m/d for aquifer and 0.008 m/d for otherunits.
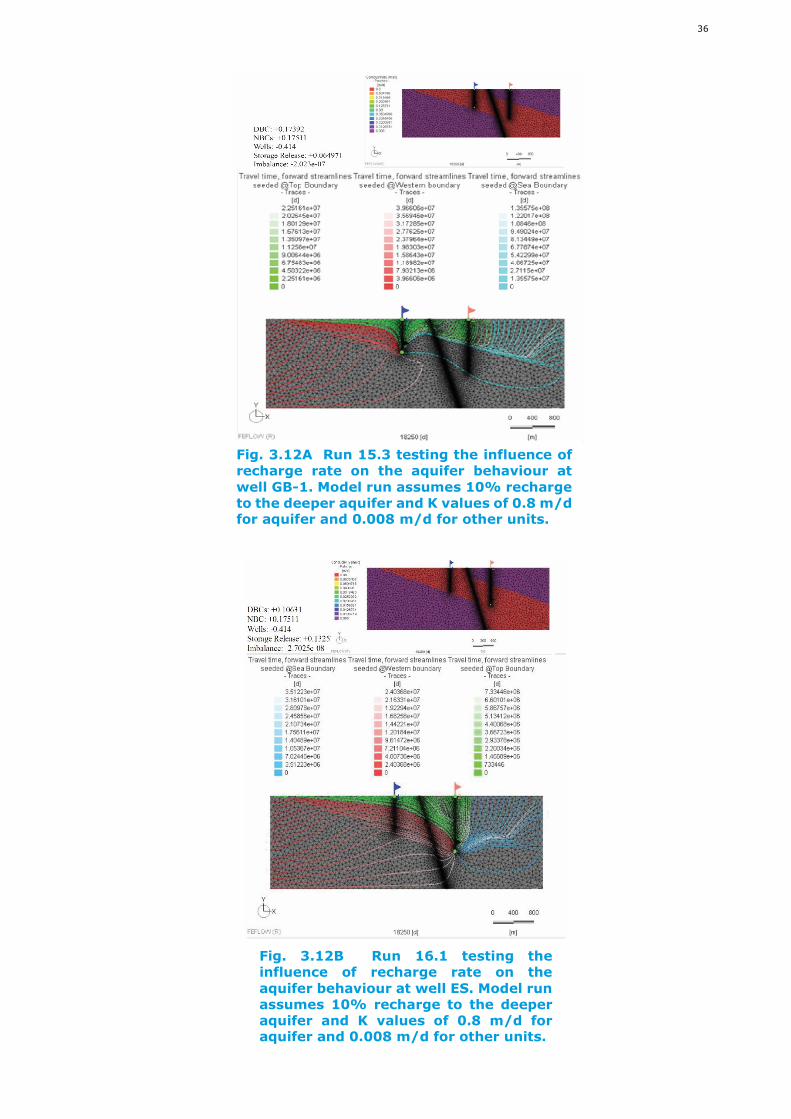
36
Fig. 3.12A Run 15.3 testing the influence ofrecharge rate on the aquifer behaviour atwell GB-1. Model run assumes 10% rechargeto the deeper aquifer and K values of 0.8 m/dfor aquifer and 0.008 m/d for other units.
Fig. 3.12B Run 16.1 testing theinfluence of recharge rate on theaquifer behaviour at well ES. Model runassumes 10% recharge to the deeperaquifer and K values of 0.8 m/d foraquifer and 0.008 m/d for other units.
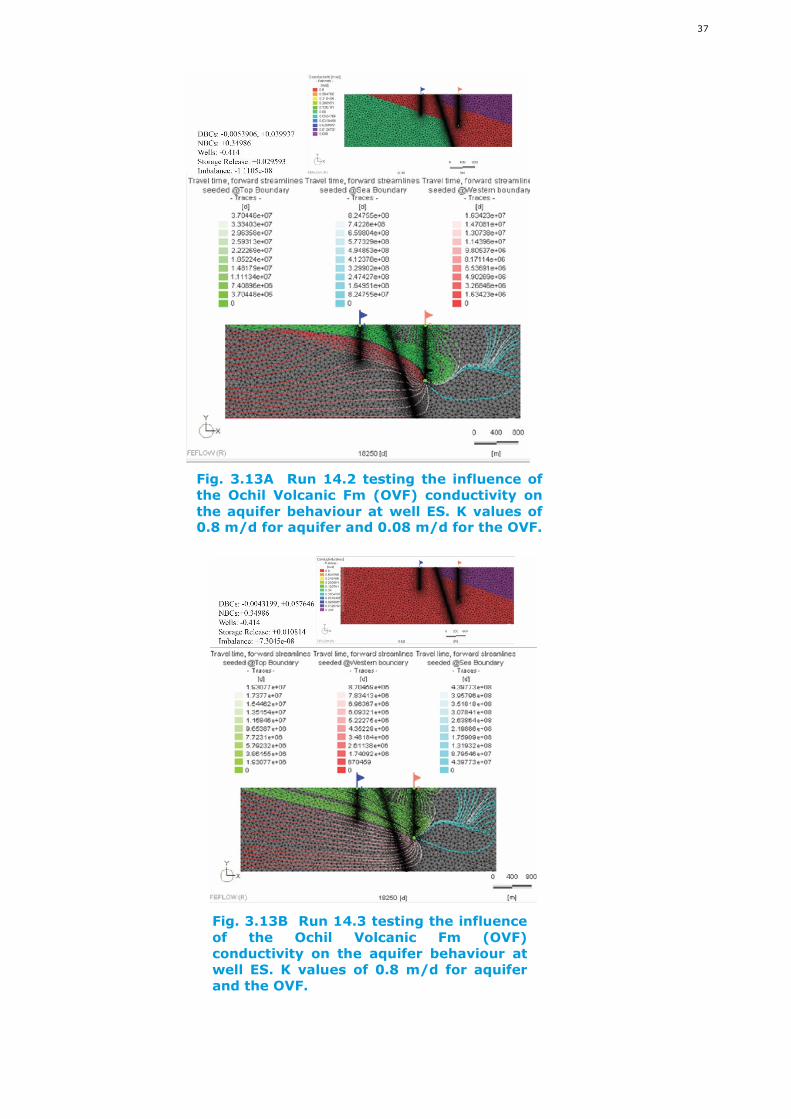
37
Fig. 3.13A Run 14.2 testing the influence ofthe Ochil Volcanic Fm (OVF) conductivity onthe aquifer behaviour at well ES. K values of0.8 m/d for aquifer and 0.08 m/d for the OVF.
Fig. 3.13B Run 14.3 testing the influenceof the Ochil Volcanic Fm (OVF)conductivity on the aquifer behaviour atwell ES. K values of 0.8 m/d for aquiferand the OVF.
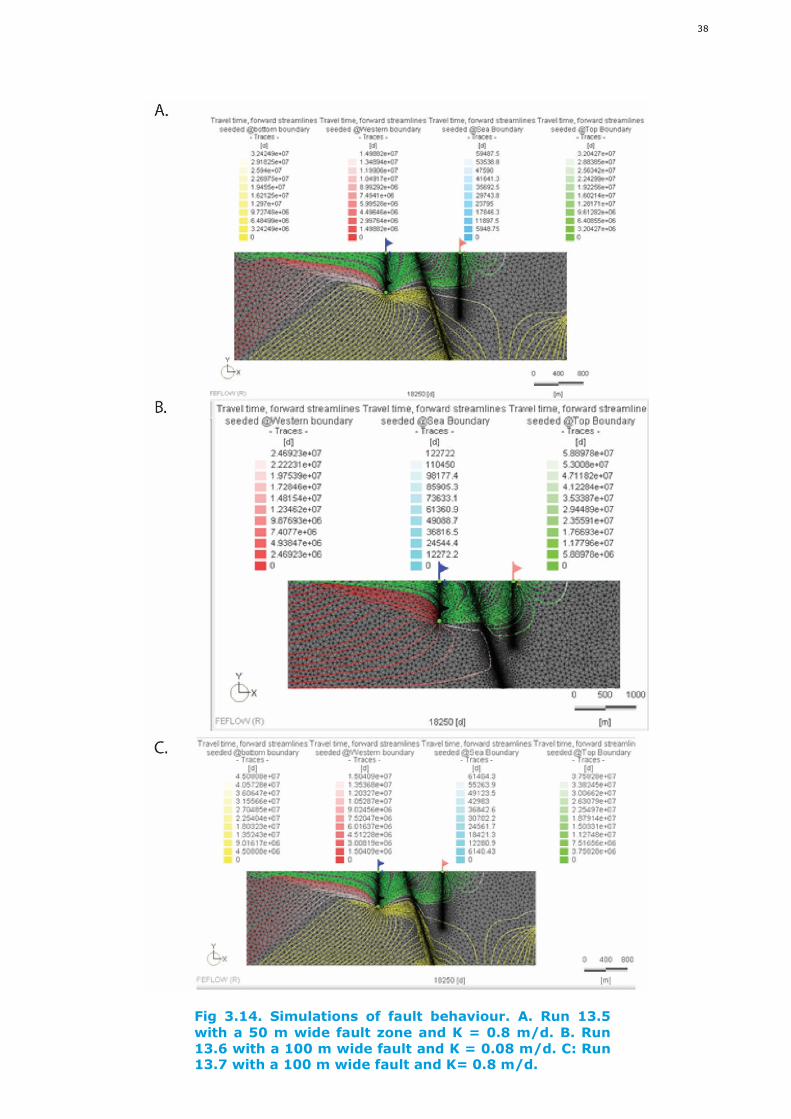
38
Fig 3.14. Simulations of fault behaviour. A. Run 13.5with a 50 m wide fault zone and K = 0.8 m/d. B. Run13.6 with a 100 m wide fault and K = 0.08 m/d. C: Run13.7 with a 100 m wide fault and K= 0.8 m/d.
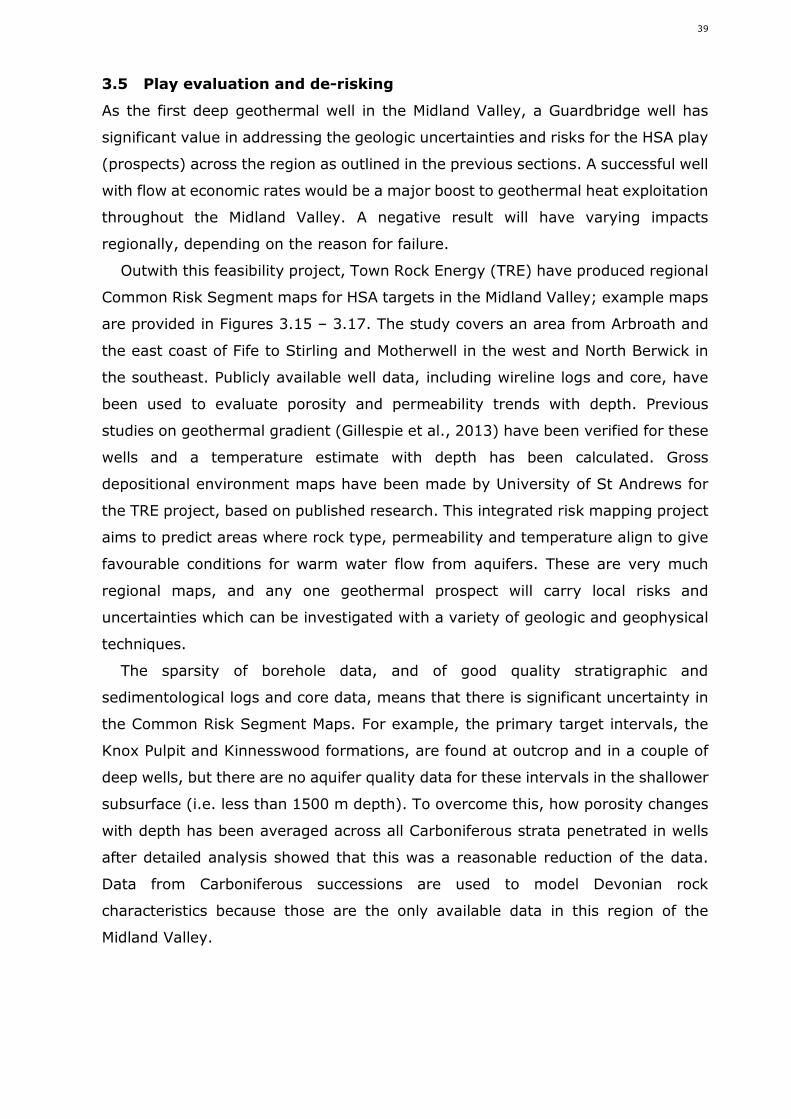
39
3.5 Play evaluation and de-risking
As the first deep geothermal well in the Midland Valley, a Guardbridge well has
significant value in addressing the geologic uncertainties and risks for the HSA play
(prospects) across the region as outlined in the previous sections. A successful well
with flow at economic rates would be a major boost to geothermal heat exploitation
throughout the Midland Valley. A negative result will have varying impacts
regionally, depending on the reason for failure.
Outwith this feasibility project, Town Rock Energy (TRE) have produced regional
Common Risk Segment maps for HSA targets in the Midland Valley; example maps
are provided in Figures 3.15 – 3.17. The study covers an area from Arbroath and
the east coast of Fife to Stirling and Motherwell in the west and North Berwick in
the southeast. Publicly available well data, including wireline logs and core, have
been used to evaluate porosity and permeability trends with depth. Previous
studies on geothermal gradient (Gillespie et al., 2013) have been verified for these
wells and a temperature estimate with depth has been calculated. Gross
depositional environment maps have been made by University of St Andrews for
the TRE project, based on published research. This integrated risk mapping project
aims to predict areas where rock type, permeability and temperature align to give
favourable conditions for warm water flow from aquifers. These are very much
regional maps, and any one geothermal prospect will carry local risks and
uncertainties which can be investigated with a variety of geologic and geophysical
techniques.
The sparsity of borehole data, and of good quality stratigraphic and
sedimentological logs and core data, means that there is significant uncertainty in
the Common Risk Segment Maps. For example, the primary target intervals, the
Knox Pulpit and Kinnesswood formations, are found at outcrop and in a couple of
deep wells, but there are no aquifer quality data for these intervals in the shallower
subsurface (i.e. less than 1500 m depth). To overcome this, how porosity changes
with depth has been averaged across all Carboniferous strata penetrated in wells
after detailed analysis showed that this was a reasonable reduction of the data.
Data from Carboniferous successions are used to model Devonian rock
characteristics because those are the only available data in this region of the
Midland Valley.
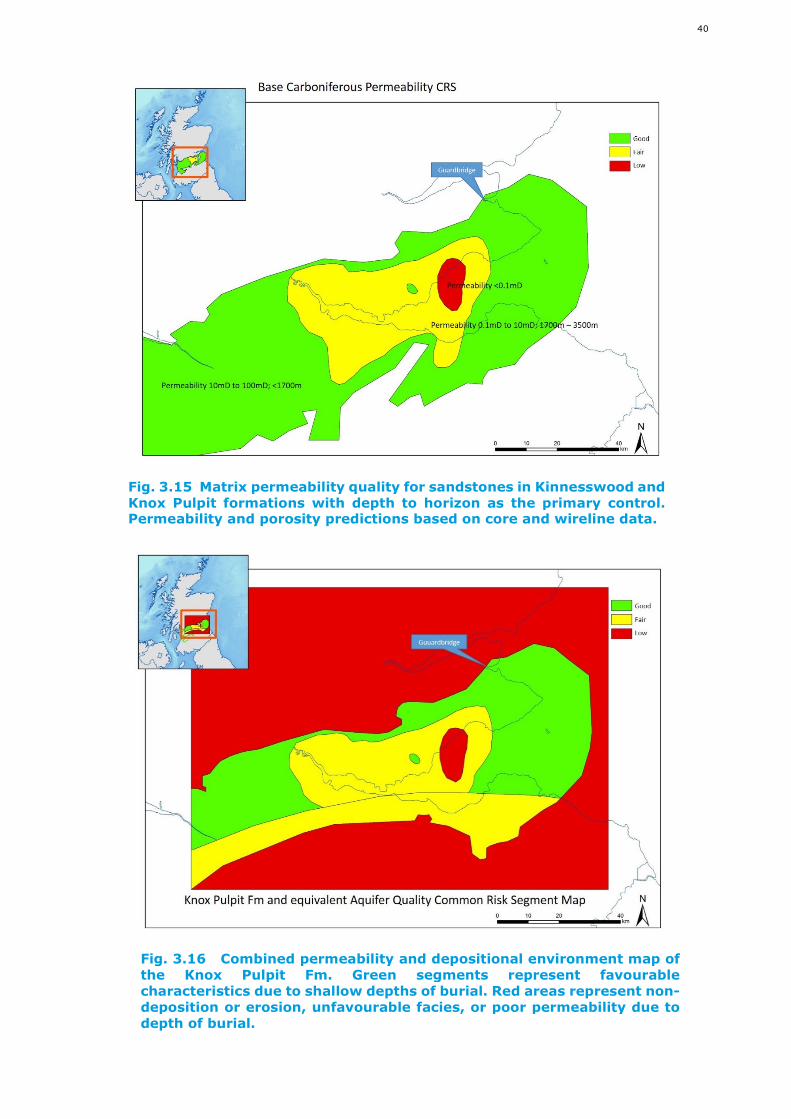
40
Fig. 3.15 Matrix permeability quality for sandstones in Kinnesswood andKnox Pulpit formations with depth to horizon as the primary control.Permeability and porosity predictions based on core and wireline data.
Fig. 3.16 Combined permeability and depositional environment map ofthe Knox Pulpit Fm. Green segments represent favourablecharacteristics due to shallow depths of burial. Red areas represent non-deposition or erosion, unfavourable facies, or poor permeability due todepth of burial.
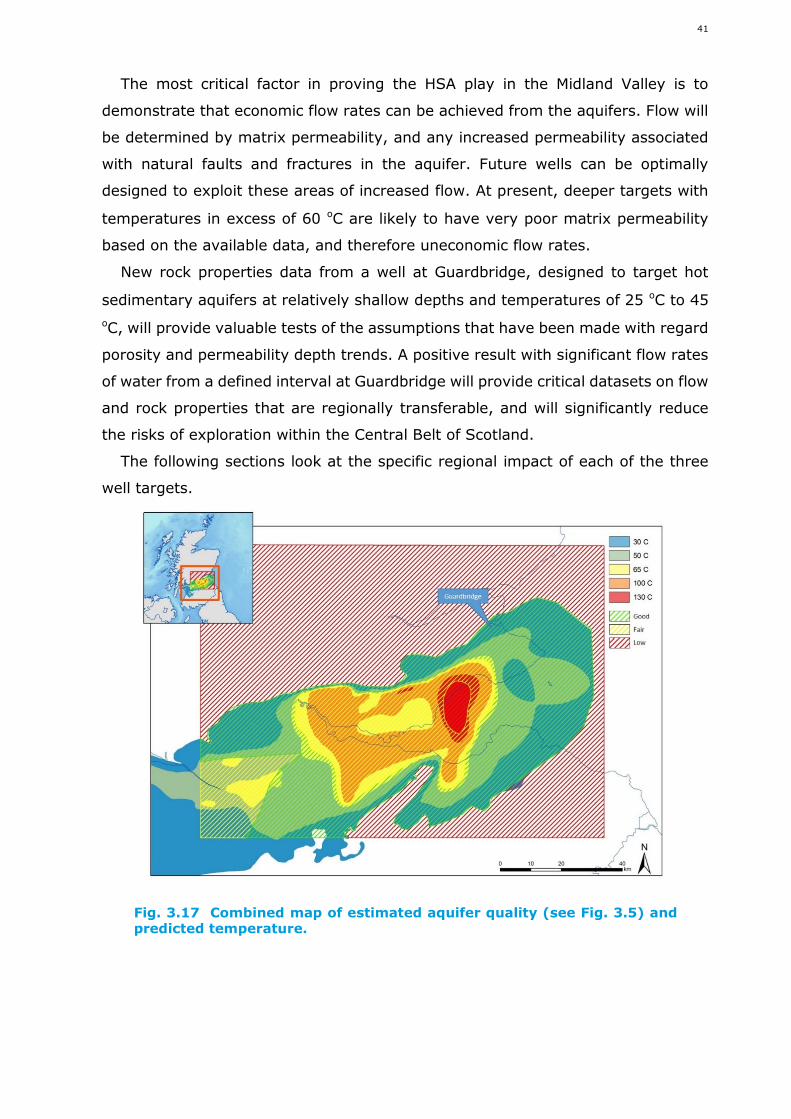
41
The most critical factor in proving the HSA play in the Midland Valley is to
demonstrate that economic flow rates can be achieved from the aquifers. Flow will
be determined by matrix permeability, and any increased permeability associated
with natural faults and fractures in the aquifer. Future wells can be optimally
designed to exploit these areas of increased flow. At present, deeper targets with
temperatures in excess of 60 oC are likely to have very poor matrix permeability
based on the available data, and therefore uneconomic flow rates.
New rock properties data from a well at Guardbridge, designed to target hot
sedimentary aquifers at relatively shallow depths and temperatures of 25 oC to 45
oC, will provide valuable tests of the assumptions that have been made with regard
porosity and permeability depth trends. A positive result with significant flow rates
of water from a defined interval at Guardbridge will provide critical datasets on flow
and rock properties that are regionally transferable, and will significantly reduce
the risks of exploration within the Central Belt of Scotland.
The following sections look at the specific regional impact of each of the three
well targets.
Fig. 3.17 Combined map of estimated aquifer quality (see Fig. 3.5) andpredicted temperature.
42
3.6 Regional impact of Guardbridge wells
Well GB1 – vertical well on site
This well is located within the Guardbridge site and targets the upper units of the
Glenvale Sandstone and the Scone Sandstone formations (Fig. 3.7). Drilling this
well would increase our knowledge and understanding of the local and regional
stratigraphy by providing lithology and formation thickness data which could be
used to improve the regional mapping of the Scone Sandstone Formation in the
northeast Midland Valley and update the Devonian HSA play. This play has not been
mapped in detail at this time, though initial outcrop studies have been conducted
and some surface porosity and thermal conductivity data have been collected by
Town Rock Energy Ltd and the University of St Andrews.
The recovery of subsurface core would permit measurements of porosity and
permeability to be made on fresh rock at a depth of around 500 m. These would
be rare samples and would allow comparison with outcrop porosity and
permeability data from locations in Fife, Perthshire, Tayside and Angus which may
have been impacted by weathering and are generally less cemented and
compacted. Identifying good porosity in the Scone Sandstone Formation would be
encouraging for development of the play in, at least, the central and eastern
Midland Valley.
Core samples would also allow identification and measurement of natural
fractures, and whether the fractures are open or mineralised. A flow test would
address whether the Scone Sandstone Formation can give economic flow rates of
warm water. Devonian rocks that lie beneath Fife south of the Ochil Fault have
generally been assumed to be too deep and too tight to produce water without
stimulation. A successful flow from the Scone Sandstone Formation would trigger
a review of where this Devonian target might be present at depth in Fife.
GB-1 also targets the Ochil Volcanic Formation underlying the Scone Sandstone
Formation. Similar volcanic rocks provide potable water from wells in and around
Dundee at potentially economic flow rates. A demonstration of significant water
flow from the Ochil Volcanics with core data that showed open fractures would be
encouraging for the development of the play. This would trigger a review of the
play in the Stirling, Perth and Tayside area, especially where heat demand is high
(e.g. Dundee, Perth and Stirling).
Bottom hole temperature data will be valuable in determining the geothermal
gradient at the Guardbridge site, and establishing whether this is on trend with
regional data or whether local variations are significant.
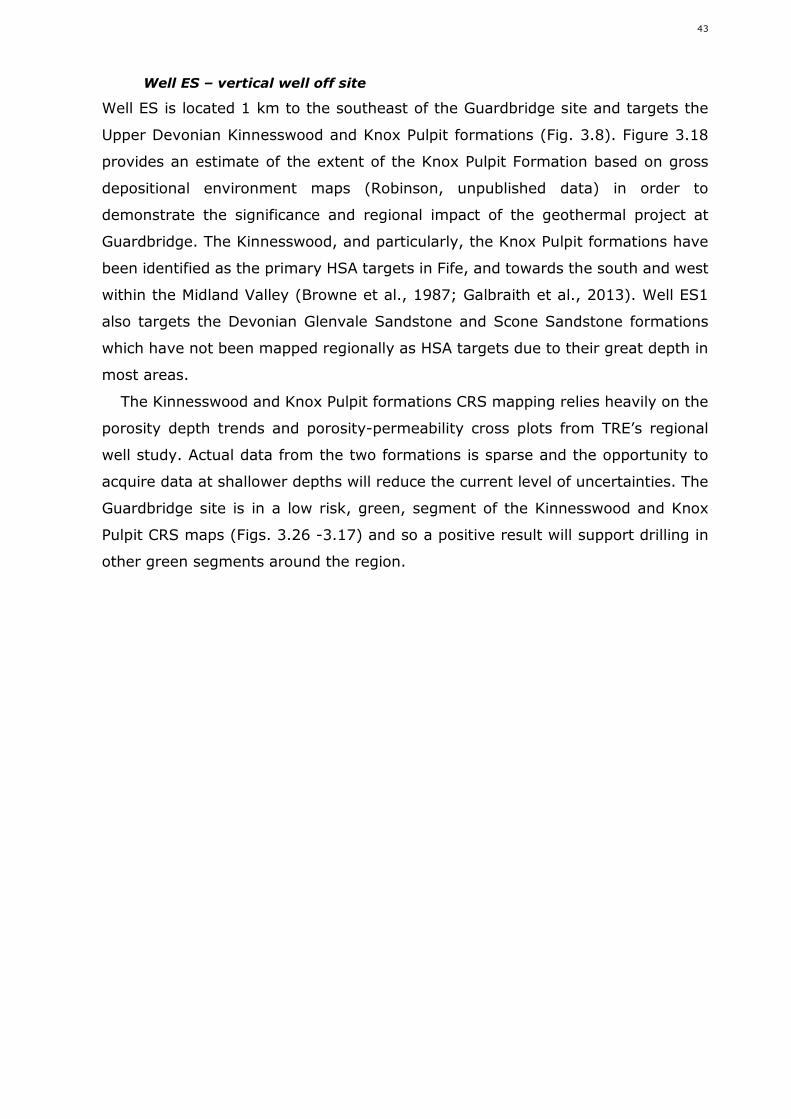
43
Well ES – vertical well off site
Well ES is located 1 km to the southeast of the Guardbridge site and targets the
Upper Devonian Kinnesswood and Knox Pulpit formations (Fig. 3.8). Figure 3.18
provides an estimate of the extent of the Knox Pulpit Formation based on gross
depositional environment maps (Robinson, unpublished data) in order to
demonstrate the significance and regional impact of the geothermal project at
Guardbridge. The Kinnesswood, and particularly, the Knox Pulpit formations have
been identified as the primary HSA targets in Fife, and towards the south and west
within the Midland Valley (Browne et al., 1987; Galbraith et al., 2013). Well ES1
also targets the Devonian Glenvale Sandstone and Scone Sandstone formations
which have not been mapped regionally as HSA targets due to their great depth in
most areas.
The Kinnesswood and Knox Pulpit formations CRS mapping relies heavily on the
porosity depth trends and porosity-permeability cross plots from TRE’s regional
well study. Actual data from the two formations is sparse and the opportunity to
acquire data at shallower depths will reduce the current level of uncertainties. The
Guardbridge site is in a low risk, green, segment of the Kinnesswood and Knox
Pulpit CRS maps (Figs. 3.26 -3.17) and so a positive result will support drilling in
other green segments around the region.
44
A successful result which demonstrates that there is a higher overall porosity
for these formations at shallow depths than has been predicted, based on trends
in other Carboniferous strata, would be significant regionally. Such a result may
allow the green segment on the Kinnesswood and Knox Pulpit CRS maps to expand
into the yellow segments which are currently downgraded due to loss of porosity
and permeability at depth. Deeper, warmer water may be more productive in terms
of flow rates than currently predicted.
Success in the older Scone Sandstone Formation and Glenvale Sandstone
Formation would have similar impact to a positive result at GB-1; that is,
encouraging a review of this geologic interval in the area of the Strathmore Basin
to the north (Fig 1.2).
Well GB-2 – deviated well on site
This more complex well trajectory is a hybrid of the GB-1 and ES wells. The well
head is located within the Guardbridge site and the well deviates so that the bottom
of the well is located about 1 km to the southeast. The primary target is the
undivided Knox Pulpit and Kinnesswood formations (in the vicinity of the Dura Den
Fault (Fig. 3.9). This potentially combines the highest porosity and permeability
aquifer with an area of natural fractures associated with the Dura Den Fault. In an
optimal scenario, flow will be enhanced by a combination of open fractures and
Fig. 3.18 Gross Depositional Environment (GDE) map for the Knox PulpitFormation showing an estimate of the regional extent of the aeolian (andfluvial) deposit.

45
good aquifer permeability, and more of the aquifer will be accessed by drilling at a
high angle to the formation; flow along the fault zone may increase the
sustainability of the aquifer. However, the fault-related fractures could be
cemented and that could result in reduced aquifer permeability. A positive outcome
demonstrating good flow rates in the Knox Pulpit/Kinnesswood aquifer will have
the same regional impacts as Well ES. In addition, demonstration of increased flow
associated with the fault would trigger a review of fault and fracture distribution
and stress history in the region in order to identify other areas where faulting may
enhance productivity. Success in a deviated well would also inform future well
design options. Optimising well design to achieve higher flow rates will be key to
achieving economic feasibility for HSA wells.
46
4. HEAT SUPPLY
4.1 Predicted aquifer properties at wells
An estimate of aquifer quality, specifically rock permeability and downhole rock
temperature, is required for each target interval to predict flow rate and water
temperature at the surface for the different well completion designs.
Town Rock Energy Ltd (TRE) have previously constructed a regional database of
petrophysical properties of sandstones in the target intervals. This draws on all
publicly available deep wells in the Fife and Firth of Forth areas (Section 2.3). It
carries significant uncertainty. For example, the Knox Pulpit Formation, which is
generally agreed as the best target, is only found at depth in one well. However,
experience in generating similar databases for oil and gas exploration has shown
that the approach is a reasonable guide at this stage of evaluation.
For each well, the primary and secondary target intervals are identified with a
depth range. The TRE depth versus porosity relationship is used to estimate an
average porosity for the target sandstones. The porosity value is used to estimate
the average permeability using a relationship determined from core plug
measurements. The porosity-permeability relationship was developed prior to this
study by TRE, based on new analysis of core data held by the British Geological
Survey and earlier published data for the wells in Fife and the Firth of Forth area.
The average permeability for an interval is multiplied by the aquifer thickness
penetrated in the well to give a total permeability for the target. There is large
uncertainty in this estimate. At any one depth, the range in porosity might be 6 -
15 %, which gives a permeability range of 0.1 - 10 mD (two orders of magnitude)
(0.013 -0.013 m/d in units of hydraulic conductivity). To simplify the evaluation,
the most likely estimate has been used, except where the rocks are likely to have
higher permeabilities (e.g. in the Knox Pulpit and Kinnesswood formations and in
the zone across the fault in GB-2, where two scenarios are evaluated).
TRE have used published temperature depth plots for the Midland Valley
(Gillespie et al., 2013) and verified the trend by reviewing the raw well log
temperature and circulation data in the prior petrophysics study.
Well GB-1
This well (Fig. 3.7) has a thin Scone Sandstone Formation target which has
probably been up to 4000 m deeper at maximum burial before being uplifted.
Taking an optimistic porosity of 11 % from a trend that does not allow for the
deeper burial effects gives 1 mD (0.0013 m/d) of permeability and so 30 mDM
47
(0.039 m2/d) of permeability thickness (transmissivity) for the target interval. If
the burial history is assumed to degrade porosity then it will be closer to 6%, with
negligible permeability. There are secondary, tighter, targets in the overlying
Glenvale Sandstone Formation, which may offer another 150 mDM. The volcanic
rocks below 700 m in the GB-1 well may have reasonable flow rates, based on
some shallow potable water wells in Dundee where natural fractures and porosity
deliver 5 - 15 l/s of water. This cannot be tested without drilling. Temperature in
the primary target interval is estimated at 24oC.
Well ES
All rocks below 600 m could contribute to flow in this well. Primary targets are
found at 700 - 800 m in the Kinnesswood and Knox Pulpit Formation and 1000-
1050 m in the Glenvale Sandstone Formation (Fig. 3.8). Porosities gradually
decrease over the target intervals from 11% in the Kinnesswood Formation to 7 %
in the Scone Sandstone Formation. Permeability decreases from 1 mD to 0.05 mD
(0.0013 to 0.000066 m/d), although the Knox Pulpit Formation may see 10 mD on
average (0.013 m/d), based on the quality seen in outcrop. This gives permeability
thicknesses of 100-1000 mDM in the primary target of the Kinnesswood/Knox
Pulpit aquifer and 200 mDM over all the remaining intervals. This well has a
significantly higher chance of achieving natural flow from the rocks than GB-1.
Temperature in the primary target interval is estimated at 27oC.
Well GB-2
This deviated well crosses the Dura Den Fault (Fig. 3.9). The thickness of the fault
damage zone is estimated (see section 3.1) and the better quality
Kinnesswood/Knox Pulpit aquifer is also present in the fault damage zone. The
interval is estimated to have a porosity of 12 % and a permeability of 10 mD (0.013
m/d), though natural fractures in the fault zone could enhance this to an average
of 100 mD (0.13 m/d). Two alternatives are evaluated: the sandstone in the
primary target has 2200 mDM, or with the addition of open natural fractures in the
fault damage zone, there may be over 10,000 mDM. There is an alternate reduced
flow model arising from the fault acting as an inhibitor of flow due to cementation
from fluids, which reduce the rock porosity and permeability. The deeper zones in
this well away from the fault zone are not predicted to make a significant
contribution. Temperature in the primary target interval is estimated at 24oC.
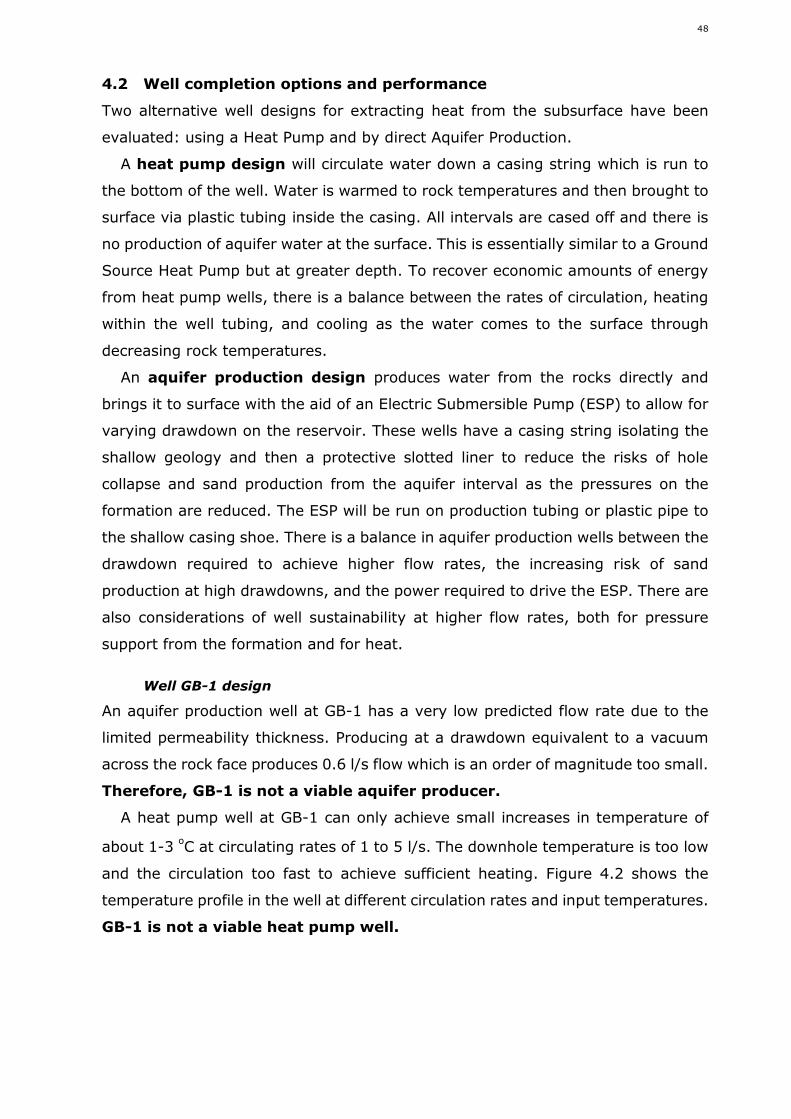
48
4.2 Well completion options and performance
Two alternative well designs for extracting heat from the subsurface have been
evaluated: using a Heat Pump and by direct Aquifer Production.
A heat pump design will circulate water down a casing string which is run to
the bottom of the well. Water is warmed to rock temperatures and then brought to
surface via plastic tubing inside the casing. All intervals are cased off and there is
no production of aquifer water at the surface. This is essentially similar to a Ground
Source Heat Pump but at greater depth. To recover economic amounts of energy
from heat pump wells, there is a balance between the rates of circulation, heating
within the well tubing, and cooling as the water comes to the surface through
decreasing rock temperatures.
An aquifer production design produces water from the rocks directly and
brings it to surface with the aid of an Electric Submersible Pump (ESP) to allow for
varying drawdown on the reservoir. These wells have a casing string isolating the
shallow geology and then a protective slotted liner to reduce the risks of hole
collapse and sand production from the aquifer interval as the pressures on the
formation are reduced. The ESP will be run on production tubing or plastic pipe to
the shallow casing shoe. There is a balance in aquifer production wells between the
drawdown required to achieve higher flow rates, the increasing risk of sand
production at high drawdowns, and the power required to drive the ESP. There are
also considerations of well sustainability at higher flow rates, both for pressure
support from the formation and for heat.
Well GB-1 design
An aquifer production well at GB-1 has a very low predicted flow rate due to the
limited permeability thickness. Producing at a drawdown equivalent to a vacuum
across the rock face produces 0.6 l/s flow which is an order of magnitude too small.
Therefore, GB-1 is not a viable aquifer producer.
A heat pump well at GB-1 can only achieve small increases in temperature of
about 1-3oC at circulating rates of 1 to 5 l/s. The downhole temperature is too low
and the circulation too fast to achieve sufficient heating. Figure 4.2 shows the
temperature profile in the well at different circulation rates and input temperatures.
GB-1 is not a viable heat pump well.
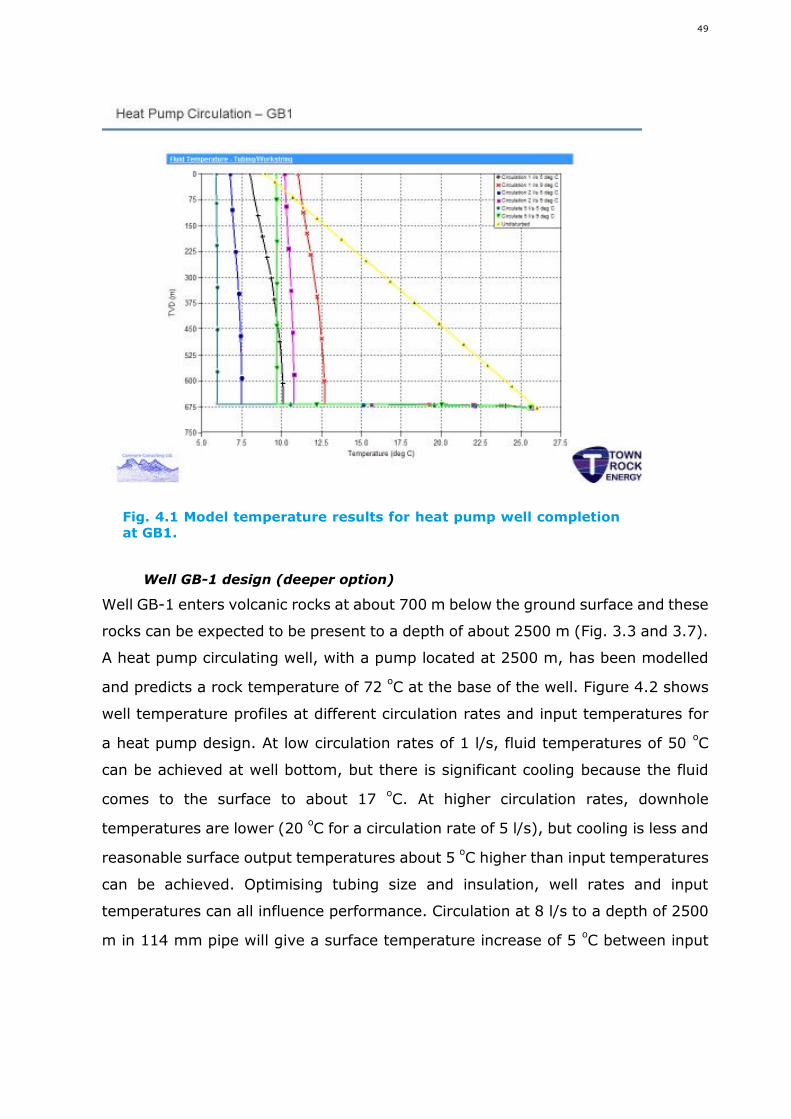
49
Well GB-1 design (deeper option)
Well GB-1 enters volcanic rocks at about 700 m below the ground surface and these
rocks can be expected to be present to a depth of about 2500 m (Fig. 3.3 and 3.7).
A heat pump circulating well, with a pump located at 2500 m, has been modelled
and predicts a rock temperature of 72oC at the base of the well. Figure 4.2 shows
well temperature profiles at different circulation rates and input temperatures for
a heat pump design. At low circulation rates of 1 l/s, fluid temperatures of 50oC
can be achieved at well bottom, but there is significant cooling because the fluid
comes to the surface to about 17oC. At higher circulation rates, downhole
temperatures are lower (20oC for a circulation rate of 5 l/s), but cooling is less and
reasonable surface output temperatures about 5oC higher than input temperatures
can be achieved. Optimising tubing size and insulation, well rates and input
temperatures can all influence performance. Circulation at 8 l/s to a depth of 2500
m in 114 mm pipe will give a surface temperature increase of 5oC between input
Fig. 4.1 Model temperature results for heat pump well completionat GB1.
50
and output, where input temperature is between 5oC and 9
oC. GB-1 deeper
option may be viable as a deep circulating heat pump well.
Well ES design
An aquifer production well at ES has very low flow rates unless the higher expected
permeability model is used. In the 1000 mDM case, a flow rate of 5 l/s is achievable
with a 20 kw ESP, giving 28oC water temperature at the well head. There is
insufficient rock quality to give higher rates of flow. ES may be a viable aquifer
producer at low rates, but with the impact of additional costs attributed to the
well’s off-site location and the risk of lower productivity, it is not considered further.
ES as a heat pump circulating well has similar characteristics to GB-1. It is too
shallow to give sufficient temperature increases at the rates required. ES is not a
viable heat pump well.
Fig. 4.2 Model temperature results for heat pump well competion at GB1at 2500 m depth.
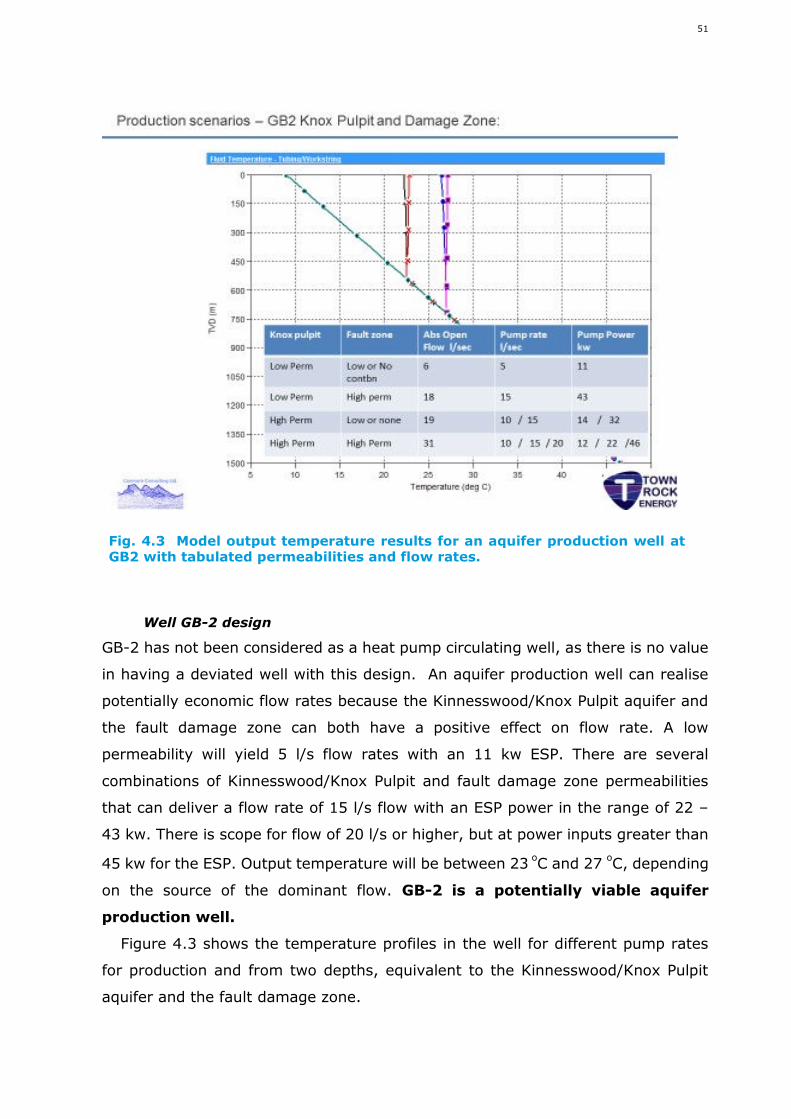
51
Well GB-2 design
GB-2 has not been considered as a heat pump circulating well, as there is no value
in having a deviated well with this design. An aquifer production well can realise
potentially economic flow rates because the Kinnesswood/Knox Pulpit aquifer and
the fault damage zone can both have a positive effect on flow rate. A low
permeability will yield 5 l/s flow rates with an 11 kw ESP. There are several
combinations of Kinnesswood/Knox Pulpit and fault damage zone permeabilities
that can deliver a flow rate of 15 l/s flow with an ESP power in the range of 22 –
43 kw. There is scope for flow of 20 l/s or higher, but at power inputs greater than
45 kw for the ESP. Output temperature will be between 23oC and 27
oC, depending
on the source of the dominant flow. GB-2 is a potentially viable aquifer
production well.
Figure 4.3 shows the temperature profiles in the well for different pump rates
for production and from two depths, equivalent to the Kinnesswood/Knox Pulpit
aquifer and the fault damage zone.
Fig. 4.3 Model output temperature results for an aquifer production well atGB2 with tabulated permeabilities and flow rates.
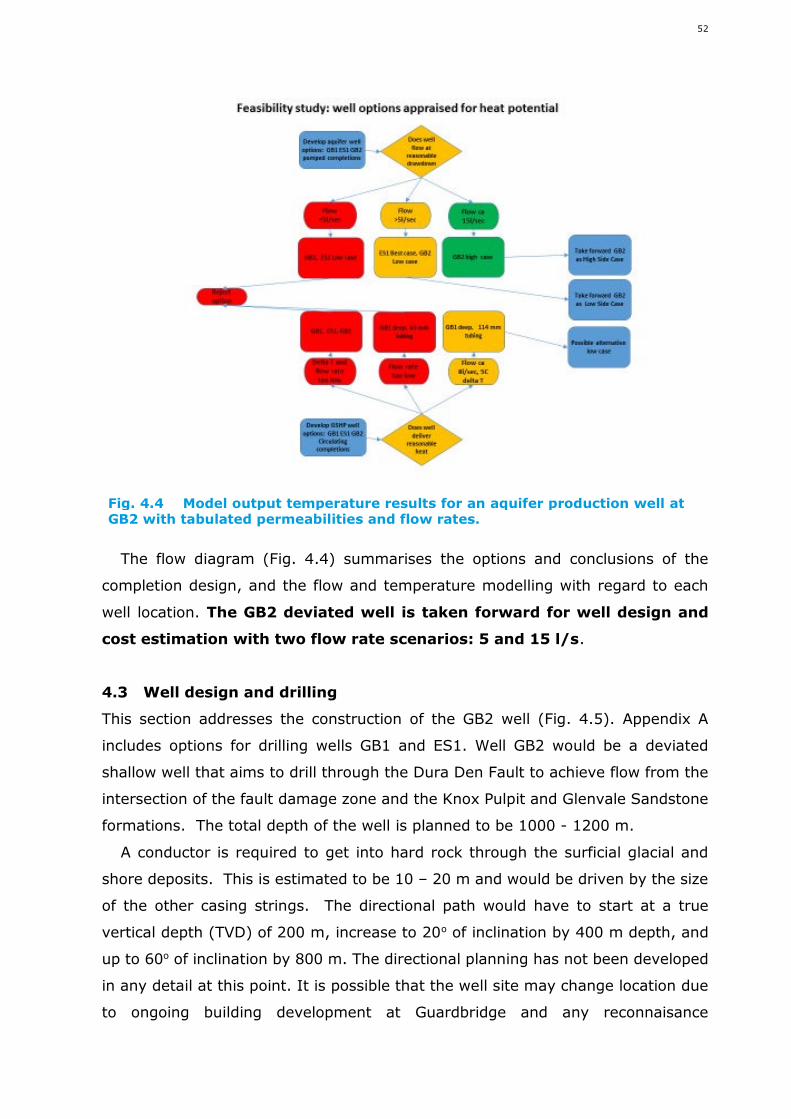
52
The flow diagram (Fig. 4.4) summarises the options and conclusions of the
completion design, and the flow and temperature modelling with regard to each
well location. The GB2 deviated well is taken forward for well design and
cost estimation with two flow rate scenarios: 5 and 15 l/s.
4.3 Well design and drilling
This section addresses the construction of the GB2 well (Fig. 4.5). Appendix A
includes options for drilling wells GB1 and ES1. Well GB2 would be a deviated
shallow well that aims to drill through the Dura Den Fault to achieve flow from the
intersection of the fault damage zone and the Knox Pulpit and Glenvale Sandstone
formations. The total depth of the well is planned to be 1000 - 1200 m.
A conductor is required to get into hard rock through the surficial glacial and
shore deposits. This is estimated to be 10 – 20 m and would be driven by the size
of the other casing strings. The directional path would have to start at a true
vertical depth (TVD) of 200 m, increase to 20o of inclination by 400 m depth, and
up to 60o of inclination by 800 m. The directional planning has not been developed
in any detail at this point. It is possible that the well site may change location due
to ongoing building development at Guardbridge and any reconnaisance
Fig. 4.4 Model output temperature results for an aquifer production well atGB2 with tabulated permeabilities and flow rates.
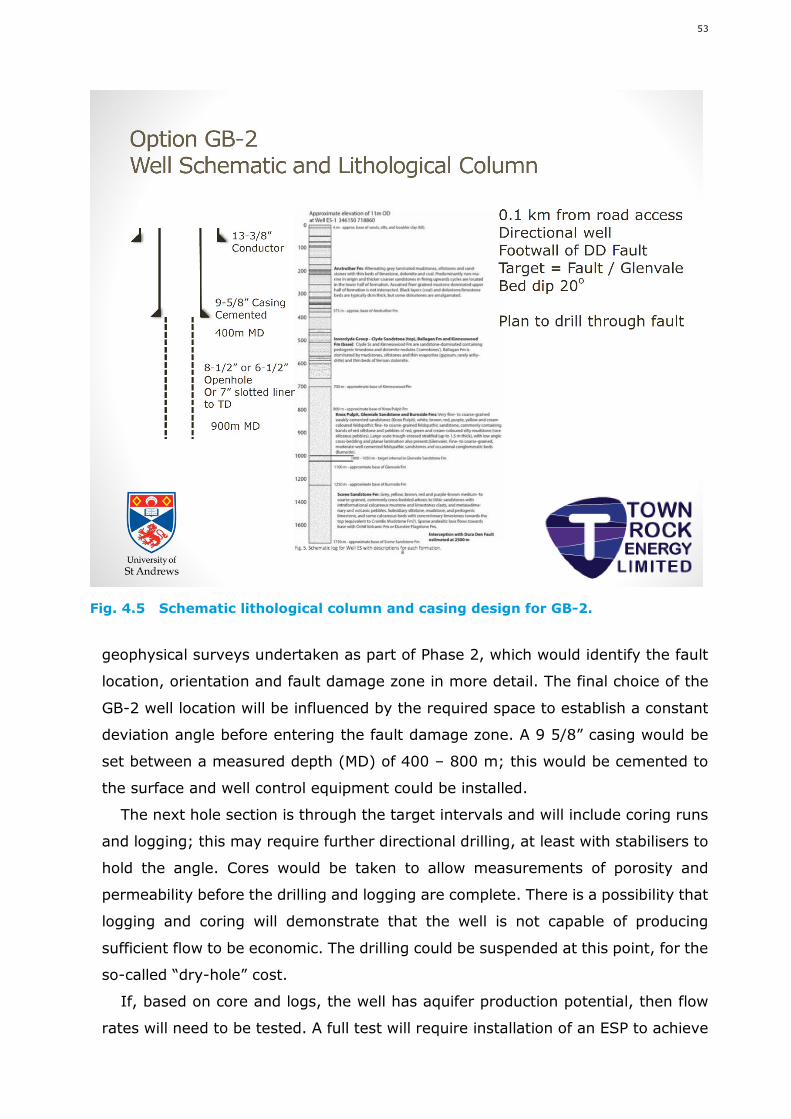
53
geophysical surveys undertaken as part of Phase 2, which would identify the fault
location, orientation and fault damage zone in more detail. The final choice of the
GB-2 well location will be influenced by the required space to establish a constant
deviation angle before entering the fault damage zone. A 9 5/8” casing would be
set between a measured depth (MD) of 400 – 800 m; this would be cemented to
the surface and well control equipment could be installed.
The next hole section is through the target intervals and will include coring runs
and logging; this may require further directional drilling, at least with stabilisers to
hold the angle. Cores would be taken to allow measurements of porosity and
permeability before the drilling and logging are complete. There is a possibility that
logging and coring will demonstrate that the well is not capable of producing
sufficient flow to be economic. The drilling could be suspended at this point, for the
so-called “dry-hole” cost.
If, based on core and logs, the well has aquifer production potential, then flow
rates will need to be tested. A full test will require installation of an ESP to achieve
Fig. 4.5 Schematic lithological column and casing design for GB-2.
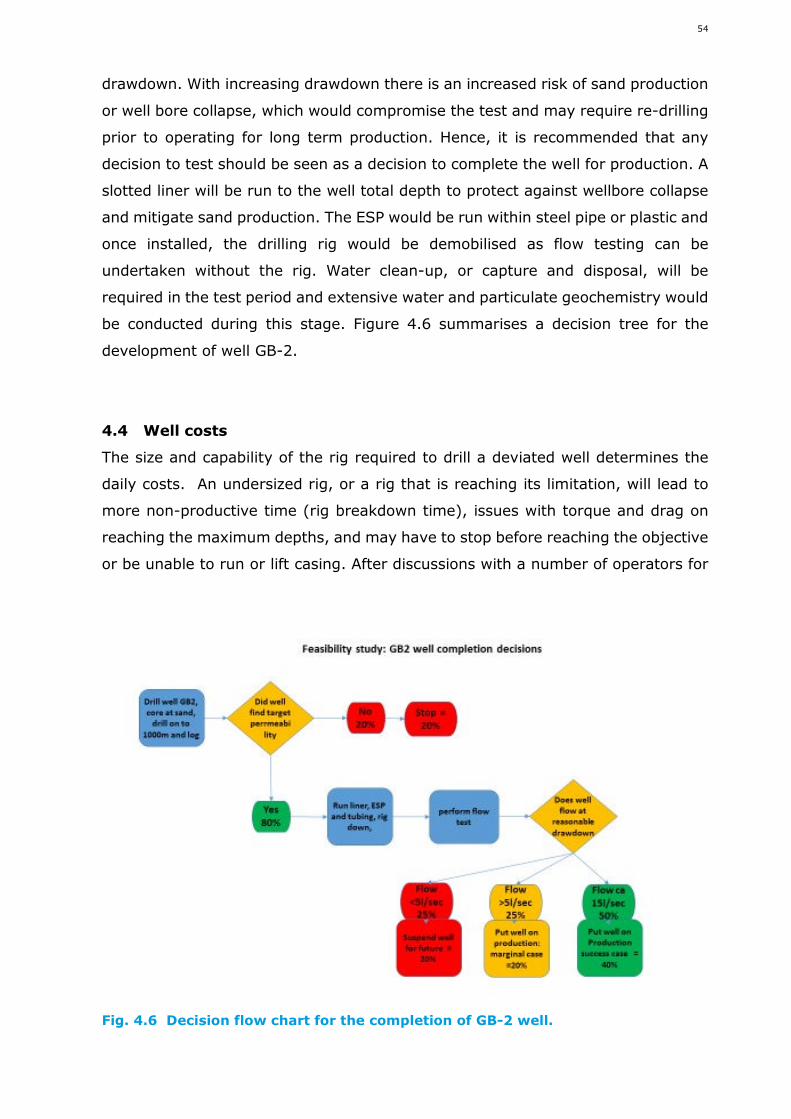
54
drawdown. With increasing drawdown there is an increased risk of sand production
or well bore collapse, which would compromise the test and may require re-drilling
prior to operating for long term production. Hence, it is recommended that any
decision to test should be seen as a decision to complete the well for production. A
slotted liner will be run to the well total depth to protect against wellbore collapse
and mitigate sand production. The ESP would be run within steel pipe or plastic and
once installed, the drilling rig would be demobilised as flow testing can be
undertaken without the rig. Water clean-up, or capture and disposal, will be
required in the test period and extensive water and particulate geochemistry would
be conducted during this stage. Figure 4.6 summarises a decision tree for the
development of well GB-2.
4.4 Well costs
The size and capability of the rig required to drill a deviated well determines the
daily costs. An undersized rig, or a rig that is reaching its limitation, will lead to
more non-productive time (rig breakdown time), issues with torque and drag on
reaching the maximum depths, and may have to stop before reaching the objective
or be unable to run or lift casing. After discussions with a number of operators for
Fig. 4.6 Decision flow chart for the completion of GB-2 well.
55
this well, a 100 tonne rig capable of 24 hour operations, drilling with a closed loop
mud system and with well control equipment, is recommended.
Cost estimation is based around a time versus depth curve for the well which
fixes the costs associated with daily rates, such as the rig rental and crew, and
directional drilling. The time depth curve (Fig. 4.7) assumes that the 9 5/8” casing
is set at 400 m. Shifting it down to accommodate directional work will shorten the
lower hole section and the length of liner required. The curve shows a total depth
of 1000 m; extending the depth to 1200 m will produce a small increase to the
total cost. The time required includes rig mobilisation and demobilisation.
Consumable costs, such as casing, mud and fuel oil, have been included based on
current industry rates. Service costs, such as wireline logging and coring, are also
based on current onshore rates, although there is little recent experience in
Scotland. Costs include contracting a drilling supervisor and drilling engineer for
the duration of the well. Provision has been made in the costs for mud disposal.
Costs have not included well planning in the next stage, for which a provision of
at least £50,000 is recommended. Costs have not included provision for site
security, a health and safety adviser or the provision of utilities (other than rig
fuel), as this is all assumed to be available within the Guardbridge site.
The well costs have been independently reviewed, but nevertheless carry a large
uncertainty at this stage, as there are no offset data for drilling performance, no
certainty that the high angle well trajectory can be achieved at shallow depths, and
no recent experience of drilling near environmentally sensitive areas. Dry hole cost
is £900,000 with a P90 – P10 range of £750,000 to £1,100,000. Production well
cost is £1,100,000 with a P90 – P10 range of £900,000 to £1,300,000.
56
4.5 Well risks and other drilling options
An initial risk register (Table 4.1) has been compiled for wells at Guardbridge. All
wells have similar risks except GB-2, which has additional risks with the directional
drilling and drilling across the Dura Den Fault.
Lower cost drilling options
Other drilling options have been reviewed and offer both opportunities and risks.
There is an opportunity to progress costing and design of a well similar to GB-2,
but using a minerals slant drilling rig. This would use a slanted mast in order to
eliminate the directional work, and drill a straight slanted hole across the fault and
through the target zones. It would eliminate the costs associated with directional
drilling and a higher specification rig, but would increase drilling time and is suited
to a smaller hole size. The drilling angle is likely to be limited to 20o, so there may
be a trajectory that could test the geology and the fault, but it is not possible to
Fig. 4.7 Time-depth curve for well GB-2 with a TD of 1000 m (MD).
0
200
400
600
800
1000
1200
0 5 10 15 20 25 30 35
Guardbridge GB-21000m Directional Well
Costs (P90)Dry hole cost: £750kCompleted cost: £900k
Costs (P10)Dry hole cost: £1,100kCompleted cost: £1,300k
Dep
thm
Costs (mid-range)Dry hole cost: £900kCompleted cost: £1,100k
Days
57
drill the higher 60o angle well proposed by GB-2 with a slant rig. It would be
possible to recover core for the whole well bore below installing the surface casing
(i.e. potentially through the fault zone and target horizons). It would also be
possible to acquire some wireline log data, but flow testing may not be possible or
would be very restricted by the small hole size. The well could not be completed as
a producer. It is anticipated that the costs may be in the region of £250,000 -
£450,000. This would need to be further investigated to confirm costs and review
associated risks, especially with regard to well control.
Table 4.1. Risks associated with well development.Risk / Hazard Consequence Control Measures
Losses tounconsolidated sands
Formation collapse;loss of mud
Mud additives, offset data researchrequired.Higher risk for GB-2
Hard formations Vibration and damageto equipment;higher costs
Offset data research required;further design on bits and drillstring design
Unconsolidatedtarget zone
Liner will need to becemented andperforated;Higher costs;formation damage
Formation strength information;offset data research requiredPotential contingency of cementedliner and perforation.
Caverns Major losses;stuck pipe
Water influx Need heavier mud andfluid;require another stringof casing/liner
Confidence in pressures for eachformation.
Variable drill rate Damaged bits and/orlost equipment in hole;higher costs
Bit and drill string design
Drilling throughfaults
Formation collapse;loss of mud;Difficult to controldirectional drilling.
Geophysical survey data throughthe fault and formations.Higher risk for GB-2
Collapse of boreholeduring testing and/orproduction
No access to clean outborehole at a laterdate
Install slotted liner to preventborehole collapse.
A geotechnical drilling company have proposed drilling a probe well of 120 mm
diameter to 600 m with air drilling. This would cost less than £100,000, assuming
no casings would be required and that drilling could be done with air/foam drilling.
This would be a vertical well and would therefore recover less than optimal amounts
of data. It may be considered as an option to test the geology on either side of the
fault, for example to test the depth to the Ochil Volcanic Formation on the footwall
(on-site) or to test the depth to the top of the Knox Pulpit Formation and its
thicknesses on the hanging wall (off-site).
58
Other capital costs: water disposal
In the event of a successful drilling operation with economic flow rates, well GB-2
would be put on long term aquifer production. This requires disposal of the
produced water. Three options have been identified:
Inject the water back into the aquifer
This is used in some Danish projects, but it is not the case at Southampton.
Injection can maintain aquifer pressure, though there are uncertainties about this
until the geology is better understood. Injection water will need to be placed some
distance from the producer to prevent early thermal breakthrough of the cooler
injected water to the producer. There is greater uncertainty about injection into a
well than productivity. The production well can flow with a significant drawdown,
but it is more difficult to inject at a significant overpressure. Issues include pump
power, formation breakdown (fracturing), and controlling solids in the injected
fluid. Injection wells will generally require more frequent intervention and
downtime. It may be necessary to have two injection wells to protect against
extended inoperation of the producing well. Finally, an injection well will have
similar costs to a producer and may require a surface linkage to pumps.
Dispose of the water into the sea
The Southampton scheme disposes of its water to sea. The complexity and
feasibility of doing this at Guardbridge depends on water quality, and we assume
that the aquifer water will be partly saline, and possibly more concentrated than
sea water. If settlement, filtration and dilution can be used to passively treat the
water then a settling lagoon equivalent to an Olympic swimming pool would be
required to handle 15 l/s of produced water. Environmental concerns are dealt with
in Section 11.
Clean and recycle the water locally
The potential for treating the water and recycling it locally is worth investigating.
There are water requirements on site and filtration to remove particulates, plus
chlorinaton, could be necessary and sufficient treatments to produce potable water,
although further desalination treatments are required for conductivities above 5000
s (pers. commun., Culligan (UK) Ltd). Relevant technology from Culligan (UK) Ltd
includes two OSFY 48 or 54 filtration units and a GAC filter that use 10W of power
and are therefore inexpensive to run. To de-salinate, vacuum membrane distillation
can be integrated into a geothermal energy plant to reduce the operational costs.
Cost estimates for any water treatment, in the absense of a re-injection well,
are very uncertain, but in the range of £250,000 to £500,000. Desalination has
59
much higher power costs and creates a residual brine waste, therefore it may be
uneconomic and unmanageable at the Guardbridge site.
Well life operation and repair costs
Operating expenditure for the well is limited to the power required to run the ESP.
This varies for different scenarios, which are addressed in the economic summary.
If used, the passive water treatment plant will have a small operational expenditure
for the disposal of solids and it is assumed that this will be part of the overall
Guardbridge site costs and an estimate is not provided.
Periodic well interventions to clean out solids and to replace the ESP are very
difficult to forecast. Typically, in oil fields with higher temperatures and variable
rates, ESP’s have lifetimes of 18 months, but a range of 1 month to 20 years. The
Guardbridge downhole pump will have relatively benign operating conditions. The
only relevant recent experience is for an ESP in a geothermal well in Copenhagen
which has operated for 12 years at 60 l/s, and has been replaced primarily due to
build-up of dirt in the well over this period. The cost of a well intervention to replace
tubing is also difficult to estimate as this requires a fuller understanding of the well
design and geology, but one assumption is that it will not require a 100 tonne rig
as the tubing can be removed with a light rig or crane.
4.6 Well engineering activities in Phase 2
To progress to a ready-to-drill well, there will be several activities:
1. Conduct a geophysical survey of Guardbridge and surrounding area to attempt
to remotely image the aquifer targets and the fault behaviour, and thereby
reduce the uncertainty in well trajectory for a deviated GB-2 well.
2. Revise the well trajectory based on increased geological knowledge and choice
of drilling rig and review directional drilling constraints.
3. Review available (offset) well data on rate of penetration, drilling fluid and well
control to better constrain design and costs.
4. Evaluate whether drilling using a “minerals” slant rig or shallow “probe”
boreholes will add value or significantly reduce uncertainty in the final well.
5. Finalise the optimal design for well completion.
6. Produce economic model (costs and re-sale value) for on-site water recycling
or disposal-to-sea options, and finalise decisions on water management.
7. Expand and manage the exploration and operation risk register.
8. Complete documentation and licensing applications for DECC, SEPA, SNH,
Scottish Water and the Health and Safety Officer.

60
9. Provide Health and Satefy Executive (HSE) inspectors with detailed drilling
plans and risk assessments.
10. Procure rig and other services.
It is estimated that it could take 6 months to reach Stage 7, at which point a case
for drilling and rig procurement would be complete. Estimates of time to complete
procurement and final well planning is not estimated here.
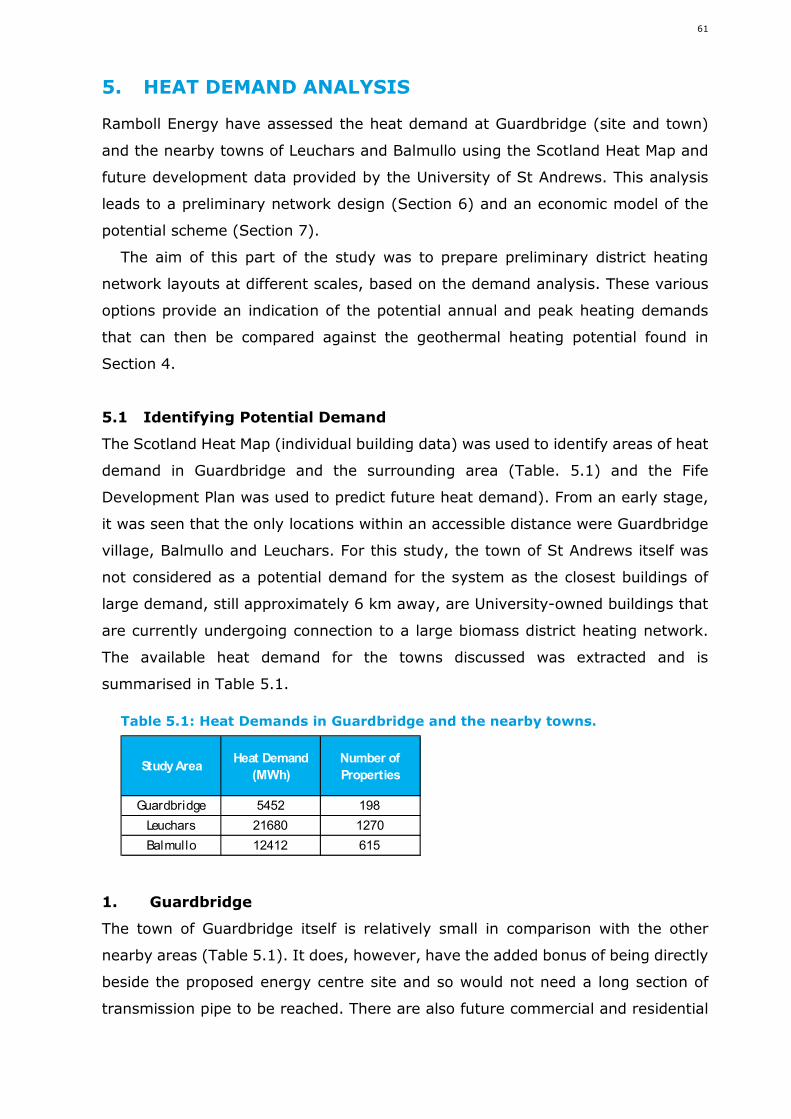
61
5. HEAT DEMAND ANALYSIS
Ramboll Energy have assessed the heat demand at Guardbridge (site and town)
and the nearby towns of Leuchars and Balmullo using the Scotland Heat Map and
future development data provided by the University of St Andrews. This analysis
leads to a preliminary network design (Section 6) and an economic model of the
potential scheme (Section 7).
The aim of this part of the study was to prepare preliminary district heating
network layouts at different scales, based on the demand analysis. These various
options provide an indication of the potential annual and peak heating demands
that can then be compared against the geothermal heating potential found in
Section 4.
5.1 Identifying Potential Demand
The Scotland Heat Map (individual building data) was used to identify areas of heat
demand in Guardbridge and the surrounding area (Table. 5.1) and the Fife
Development Plan was used to predict future heat demand). From an early stage,
it was seen that the only locations within an accessible distance were Guardbridge
village, Balmullo and Leuchars. For this study, the town of St Andrews itself was
not considered as a potential demand for the system as the closest buildings of
large demand, still approximately 6 km away, are University-owned buildings that
are currently undergoing connection to a large biomass district heating network.
The available heat demand for the towns discussed was extracted and is
summarised in Table 5.1.
Table 5.1: Heat Demands in Guardbridge and the nearby towns.
1. Guardbridge
The town of Guardbridge itself is relatively small in comparison with the other
nearby areas (Table 5.1). It does, however, have the added bonus of being directly
beside the proposed energy centre site and so would not need a long section of
transmission pipe to be reached. There are also future commercial and residential
Study AreaHeat Demand
(MWh)
Number of
Properties
Guardbridge 5452 198
Leuchars 21680 1270
Balmullo 12412 615
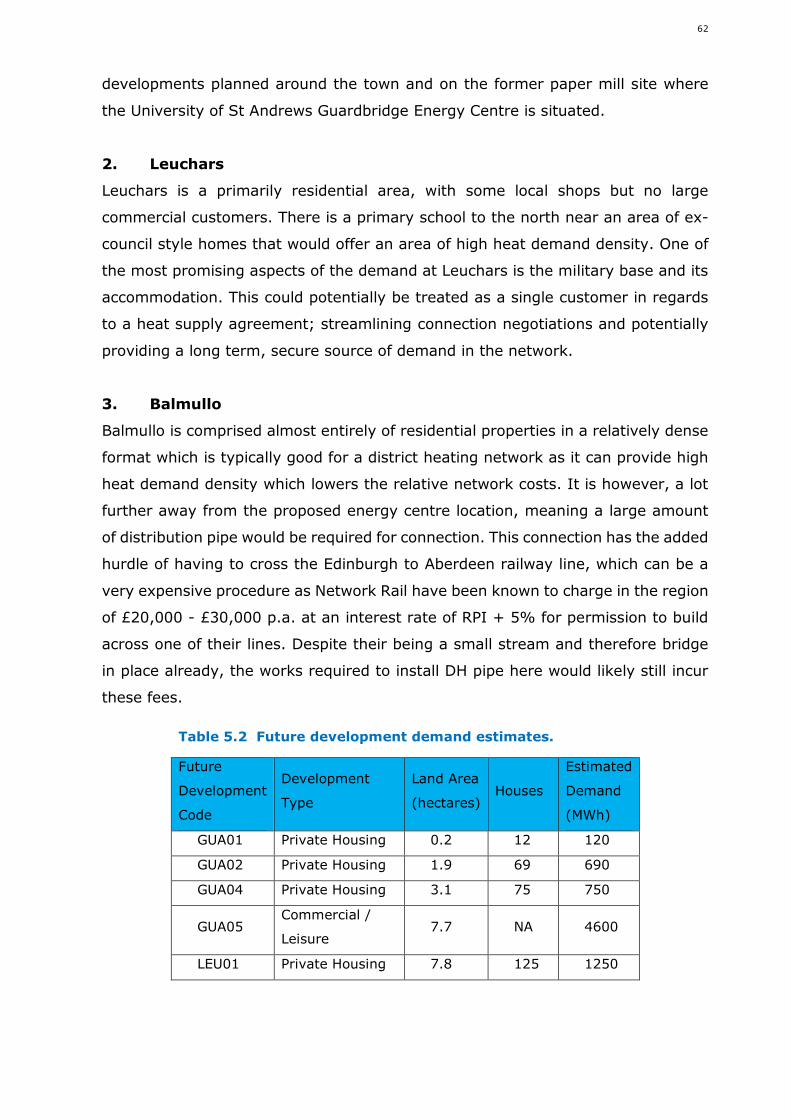
62
developments planned around the town and on the former paper mill site where
the University of St Andrews Guardbridge Energy Centre is situated.
2. Leuchars
Leuchars is a primarily residential area, with some local shops but no large
commercial customers. There is a primary school to the north near an area of ex-
council style homes that would offer an area of high heat demand density. One of
the most promising aspects of the demand at Leuchars is the military base and its
accommodation. This could potentially be treated as a single customer in regards
to a heat supply agreement; streamlining connection negotiations and potentially
providing a long term, secure source of demand in the network.
3. Balmullo
Balmullo is comprised almost entirely of residential properties in a relatively dense
format which is typically good for a district heating network as it can provide high
heat demand density which lowers the relative network costs. It is however, a lot
further away from the proposed energy centre location, meaning a large amount
of distribution pipe would be required for connection. This connection has the added
hurdle of having to cross the Edinburgh to Aberdeen railway line, which can be a
very expensive procedure as Network Rail have been known to charge in the region
of £20,000 - £30,000 p.a. at an interest rate of RPI + 5% for permission to build
across one of their lines. Despite their being a small stream and therefore bridge
in place already, the works required to install DH pipe here would likely still incur
these fees.
Table 5.2 Future development demand estimates.
Future
Development
Code
Development
Type
Land Area
(hectares)Houses
Estimated
Demand
(MWh)
GUA01 Private Housing 0.2 12 120
GUA02 Private Housing 1.9 69 690
GUA04 Private Housing 3.1 75 750
GUA05Commercial /
Leisure7.7 NA 4600
LEU01 Private Housing 7.8 125 1250
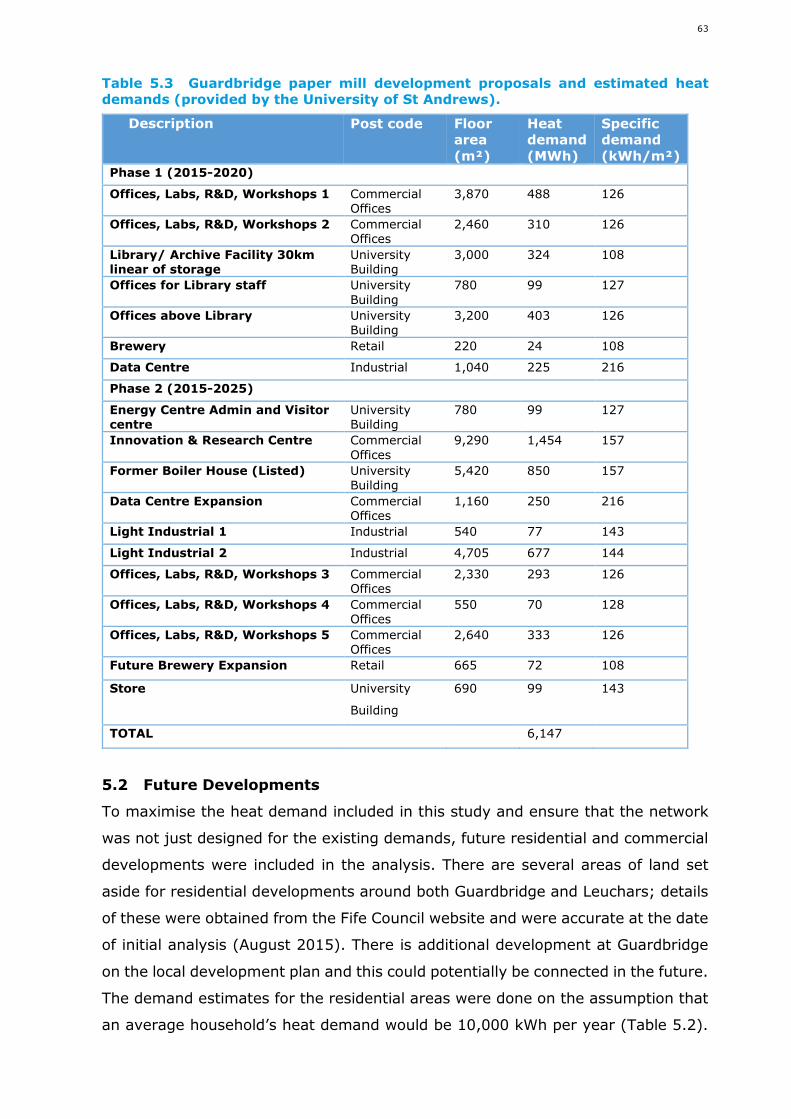
63
Table 5.3 Guardbridge paper mill development proposals and estimated heatdemands (provided by the University of St Andrews).
Description Post code Floorarea(m²)
Heatdemand(MWh)
Specificdemand(kWh/m²)
Phase 1 (2015-2020)
Offices, Labs, R&D, Workshops 1 CommercialOffices
3,870 488 126
Offices, Labs, R&D, Workshops 2 CommercialOffices
2,460 310 126
Library/ Archive Facility 30kmlinear of storage
UniversityBuilding
3,000 324 108
Offices for Library staff UniversityBuilding
780 99 127
Offices above Library UniversityBuilding
3,200 403 126
Brewery Retail 220 24 108
Data Centre Industrial 1,040 225 216
Phase 2 (2015-2025)
Energy Centre Admin and Visitorcentre
UniversityBuilding
780 99 127
Innovation & Research Centre CommercialOffices
9,290 1,454 157
Former Boiler House (Listed) UniversityBuilding
5,420 850 157
Data Centre Expansion CommercialOffices
1,160 250 216
Light Industrial 1 Industrial 540 77 143
Light Industrial 2 Industrial 4,705 677 144
Offices, Labs, R&D, Workshops 3 CommercialOffices
2,330 293 126
Offices, Labs, R&D, Workshops 4 CommercialOffices
550 70 128
Offices, Labs, R&D, Workshops 5 CommercialOffices
2,640 333 126
Future Brewery Expansion Retail 665 72 108
Store University
Building
690 99 143
TOTAL 6,147
5.2 Future Developments
To maximise the heat demand included in this study and ensure that the network
was not just designed for the existing demands, future residential and commercial
developments were included in the analysis. There are several areas of land set
aside for residential developments around both Guardbridge and Leuchars; details
of these were obtained from the Fife Council website and were accurate at the date
of initial analysis (August 2015). There is additional development at Guardbridge
on the local development plan and this could potentially be connected in the future.
The demand estimates for the residential areas were done on the assumption that
an average household’s heat demand would be 10,000 kWh per year (Table 5.2).
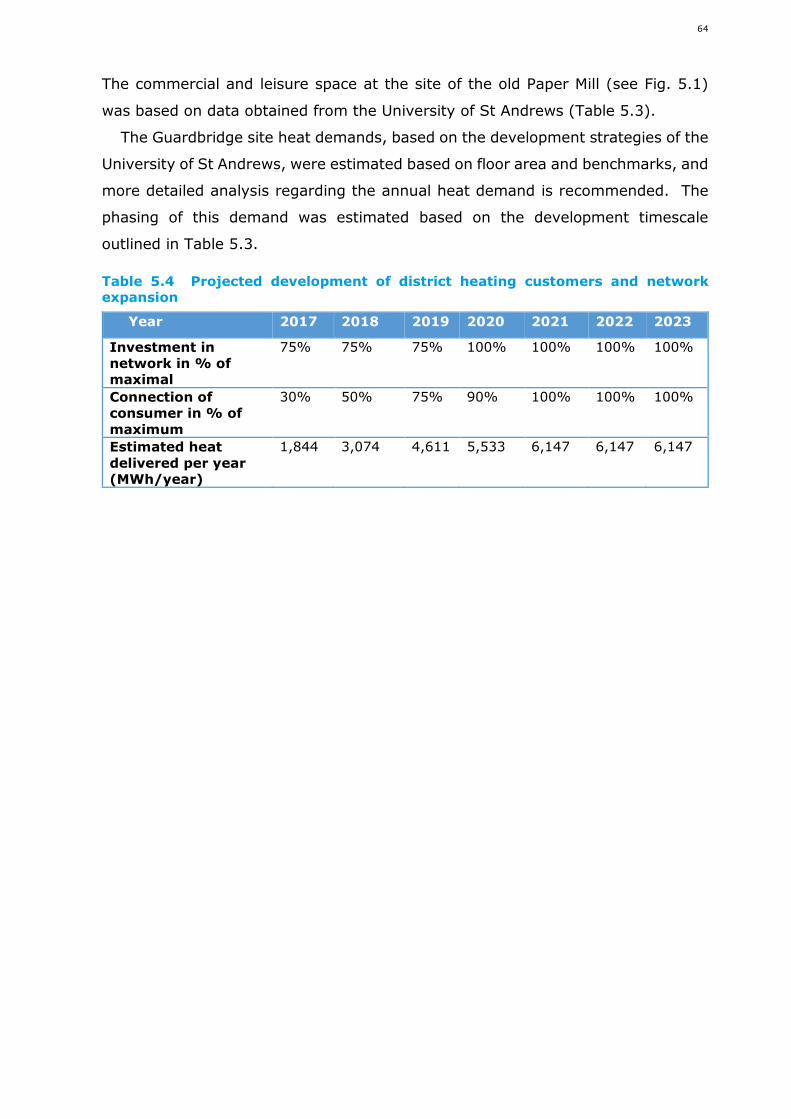
64
The commercial and leisure space at the site of the old Paper Mill (see Fig. 5.1)
was based on data obtained from the University of St Andrews (Table 5.3).
The Guardbridge site heat demands, based on the development strategies of the
University of St Andrews, were estimated based on floor area and benchmarks, and
more detailed analysis regarding the annual heat demand is recommended. The
phasing of this demand was estimated based on the development timescale
outlined in Table 5.3.
Table 5.4 Projected development of district heating customers and networkexpansion
Year 2017 2018 2019 2020 2021 2022 2023
Investment innetwork in % ofmaximal
75% 75% 75% 100% 100% 100% 100%
Connection ofconsumer in % ofmaximum
30% 50% 75% 90% 100% 100% 100%
Estimated heatdelivered per year(MWh/year)
1,844 3,074 4,611 5,533 6,147 6,147 6,147
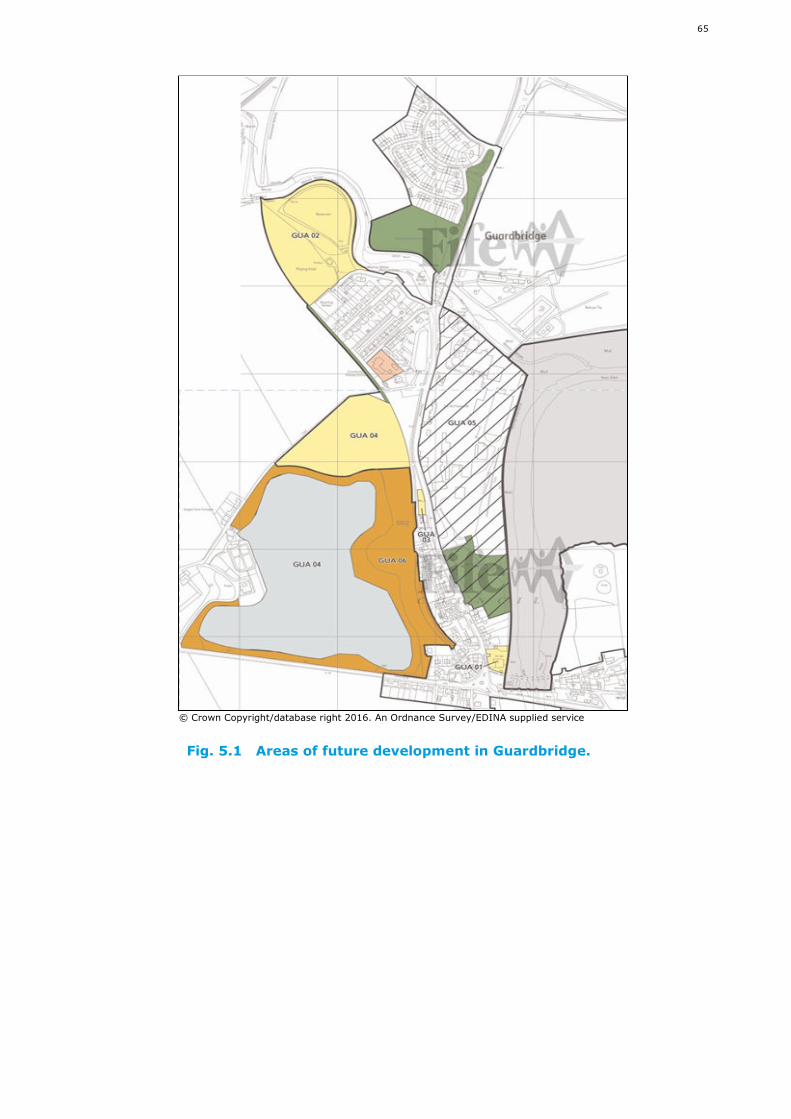
65
Fig. 5.1 Areas of future development in Guardbridge.
© Crown Copyright/database right 2016. An Ordnance Survey/EDINA supplied service
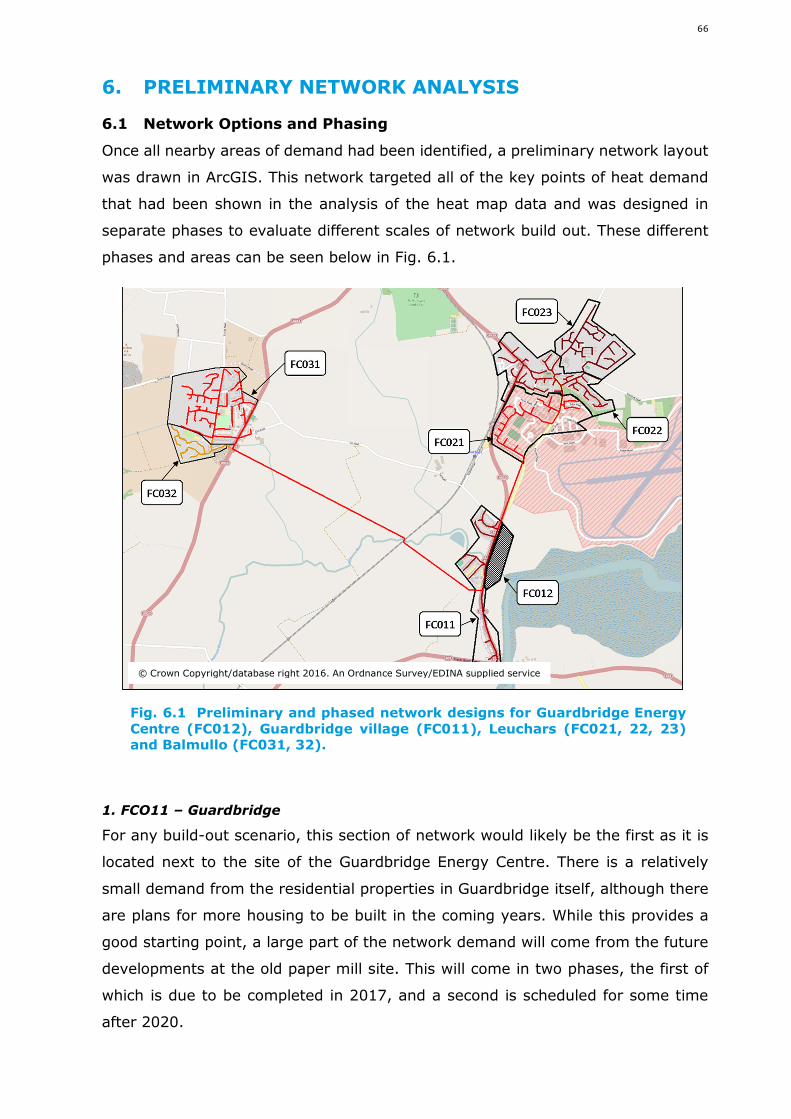
66
6. PRELIMINARY NETWORK ANALYSIS
6.1 Network Options and Phasing
Once all nearby areas of demand had been identified, a preliminary network layout
was drawn in ArcGIS. This network targeted all of the key points of heat demand
that had been shown in the analysis of the heat map data and was designed in
separate phases to evaluate different scales of network build out. These different
phases and areas can be seen below in Fig. 6.1.
Fig. 6.1 Preliminary and phased network designs for Guardbridge EnergyCentre (FC012), Guardbridge village (FC011), Leuchars (FC021, 22, 23)and Balmullo (FC031, 32).
1. FCO11 – Guardbridge
For any build-out scenario, this section of network would likely be the first as it is
located next to the site of the Guardbridge Energy Centre. There is a relatively
small demand from the residential properties in Guardbridge itself, although there
are plans for more housing to be built in the coming years. While this provides a
good starting point, a large part of the network demand will come from the future
developments at the old paper mill site. This will come in two phases, the first of
which is due to be completed in 2017, and a second is scheduled for some time
after 2020.
© Crown Copyright/database right 2016. An Ordnance Survey/EDINA supplied service

67
2. FCO12 – Guardbridge Phase 2
This option is the second phase of development at the Guardbridge site. The site
will consist mostly of research and commercial space and is estimated to have a
total demand of approximately 4,500 MWh. Such a large demand close to the site
of heat generation should be an advantage to any network.
3. FCO21 – Leuchars Phase 1
Although supplying Leuchars would require a large amount of connecting pipework,
the military housing particularly represents a good source of potential demand and
has the advantage of being a single customer which can provide better demand
security. An extension into the military base also has the advantage of opening up
the network to supply residential demand throughout Leuchars and could help to
make full use of the site’s geothermal potential.
4. FCO22 – Leuchars Phase 2
The second phase of the Leuchars expansion would reach out in either direction
along the main road through the town centre. This has the potential to supply both
residential and local commercial customers and as the main connecting pipework
is already in place, should help to raise the linear heat density (LHD) of the system
as a whole.
5. FCO23 – Leuchars Phase 3
Phase three of the Leuchars expansion spreads out to the northeast to reach the
local primary school and an area of council-style blocks of houses that should have
a relatively high heat demand density. While there is good demand in this area, it
should be noted that the area is less densely packed than the rest of Leuchars and
so it may not be economically viable to extend the network this far for a lower than
usual demand.
6. FCO31 – Balmullo Phase 1
To the west of Guardbridge is Balmullo, a residential area of moderate density with
a significant annual heat demand of approximately 8.5 GWh. However, the
connecting pipeline required to get to Balmullo is almost 7 km in length, and
although the majority of this could be done through soft ground, the railway line
to cross is a major issue as discussed in Section 5.1.
7. FCO32 – Balmullo Phase 2
This second phase in the Balmullo arm of the network is a small extension into
an estate of newer build private properties. These are large houses and so the area
68
has a good level of heat demand density, however these figures could be based on
benchmarks and in reality newer builds will be more energy efficient and will likely
not be willing to pay again for a new source of heating.
6.2 Opportunity Assessment Tool
The District Heating Opportunity Assessment Tool (DHOAT) developed by Ramboll
for the Scottish Government was used to analyse the heat map data and
preliminary network designs. This tool provides clear indications of what the peak
and annual demands would be at each stage of the network’s development, as well
as providing a preliminary set of key performance indicator (KPI) data, including:
Total heat demand
Indicative CAPEX
Indicative Network OPEX
Indicative heat sales
The outputs of each scenario can be compared against one another to determine
which would be most suitable for the heating network. This decision is based on
both the technical figures derived from early modelling, as well as knowledge of
the local property types, potential connection issues and any commercial and
construction hurdles, such as the railway line that would have to be crossed to
reach Balmullo. Another useful KPI to determine the performance of the proposed
networks is Linear Heat Density (LHD); this is a ratio of demand to pipe length
(MWh/m) and can provide a good early stage indication of whether the network
has enough demand to justify the initial capital costs of pipe installation.
6.3 Network Analysis
Table 6.1 presents the initial analysis for the proposed networks. There is a
significant variation in the linear heat density between the various options that
show quite clearly how additional transmission pipe can significantly decrease the
potential of a network. The table also provides approximate estimates of the
required primary heat supply capacity which will later be compared against the
predicted heating potential of the geothermal resource under Guardbridge, in order
to determine what extent of network would be feasible.
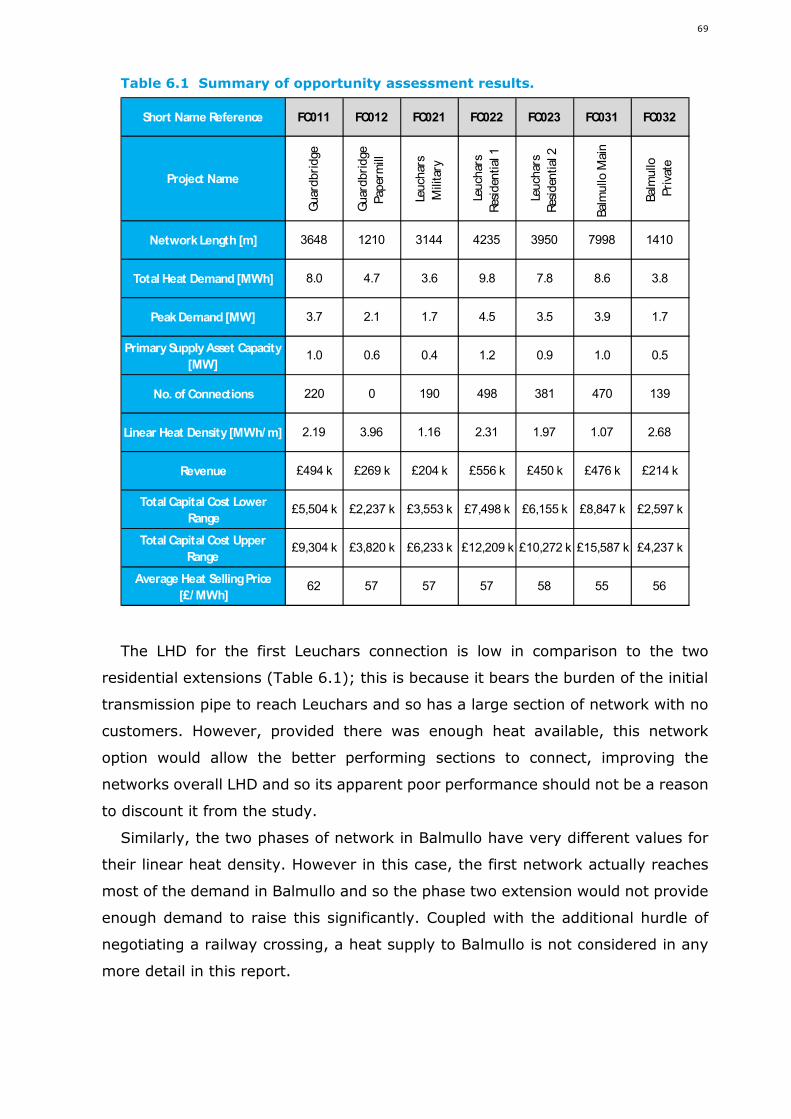
69
Table 6.1 Summary of opportunity assessment results.
The LHD for the first Leuchars connection is low in comparison to the two
residential extensions (Table 6.1); this is because it bears the burden of the initial
transmission pipe to reach Leuchars and so has a large section of network with no
customers. However, provided there was enough heat available, this network
option would allow the better performing sections to connect, improving the
networks overall LHD and so its apparent poor performance should not be a reason
to discount it from the study.
Similarly, the two phases of network in Balmullo have very different values for
their linear heat density. However in this case, the first network actually reaches
most of the demand in Balmullo and so the phase two extension would not provide
enough demand to raise this significantly. Coupled with the additional hurdle of
negotiating a railway crossing, a heat supply to Balmullo is not considered in any
more detail in this report.
Short Name Reference FC011 FC012 FC021 FC022 FC023 FC031 FC032
Project Name
Guar
dbri
dge
Guar
dbri
dge
Pap
erm
ill
Leuch
ars
Mili
tary
Leuch
ars
Res
iden
tial
1
Leuch
ars
Res
iden
tial
2
Bal
mullo
Mai
n
Bal
mullo
Pri
vate
NetworkLength [m] 3648 1210 3144 4235 3950 7998 1410
Total Heat Demand [MWh] 8.0 4.7 3.6 9.8 7.8 8.6 3.8
PeakDemand [MW] 3.7 2.1 1.7 4.5 3.5 3.9 1.7
PrimarySupplyAsset Capacity
[MW]1.0 0.6 0.4 1.2 0.9 1.0 0.5
No. of Connections 220 0 190 498 381 470 139
Linear Heat Density [MWh/ m] 2.19 3.96 1.16 2.31 1.97 1.07 2.68
Revenue £494 k £269 k £204 k £556 k £450 k £476 k £214 k
Total Capital Cost Lower
Range£5,504 k £2,237 k £3,553 k £7,498 k £6,155 k £8,847 k £2,597 k
Total Capital Cost Upper
Range£9,304 k £3,820 k £6,233 k £12,209 k £10,272 k £15,587 k £4,237 k
Average Heat SellingPrice
[£/ MWh]62 57 57 57 58 55 56
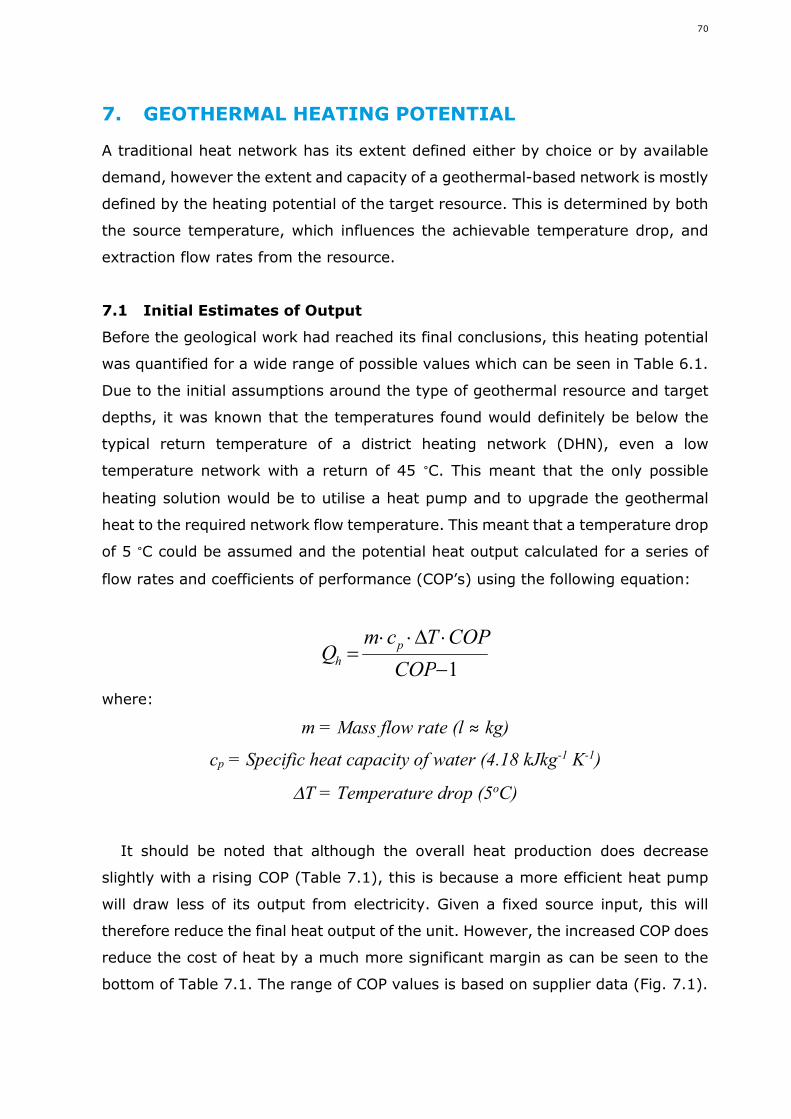
70
7. GEOTHERMAL HEATING POTENTIAL
A traditional heat network has its extent defined either by choice or by available
demand, however the extent and capacity of a geothermal-based network is mostly
defined by the heating potential of the target resource. This is determined by both
the source temperature, which influences the achievable temperature drop, and
extraction flow rates from the resource.
7.1 Initial Estimates of Output
Before the geological work had reached its final conclusions, this heating potential
was quantified for a wide range of possible values which can be seen in Table 6.1.
Due to the initial assumptions around the type of geothermal resource and target
depths, it was known that the temperatures found would definitely be below the
typical return temperature of a district heating network (DHN), even a low
temperature network with a return of 45 °C. This meant that the only possible
heating solution would be to utilise a heat pump and to upgrade the geothermal
heat to the required network flow temperature. This meant that a temperature drop
of 5 °C could be assumed and the potential heat output calculated for a series of
flow rates and coefficients of performance (COP’s) using the following equation:
1
COP
COPTcmQ
p
h
where:
m = Mass flow rate (l ≈ kg)
cp = Specific heat capacity of water (4.18 kJkg-1 K-1)
T = Temperature drop (5oC)
It should be noted that although the overall heat production does decrease
slightly with a rising COP (Table 7.1), this is because a more efficient heat pump
will draw less of its output from electricity. Given a fixed source input, this will
therefore reduce the final heat output of the unit. However, the increased COP does
reduce the cost of heat by a much more significant margin as can be seen to the
bottom of Table 7.1. The range of COP values is based on supplier data (Fig. 7.1).
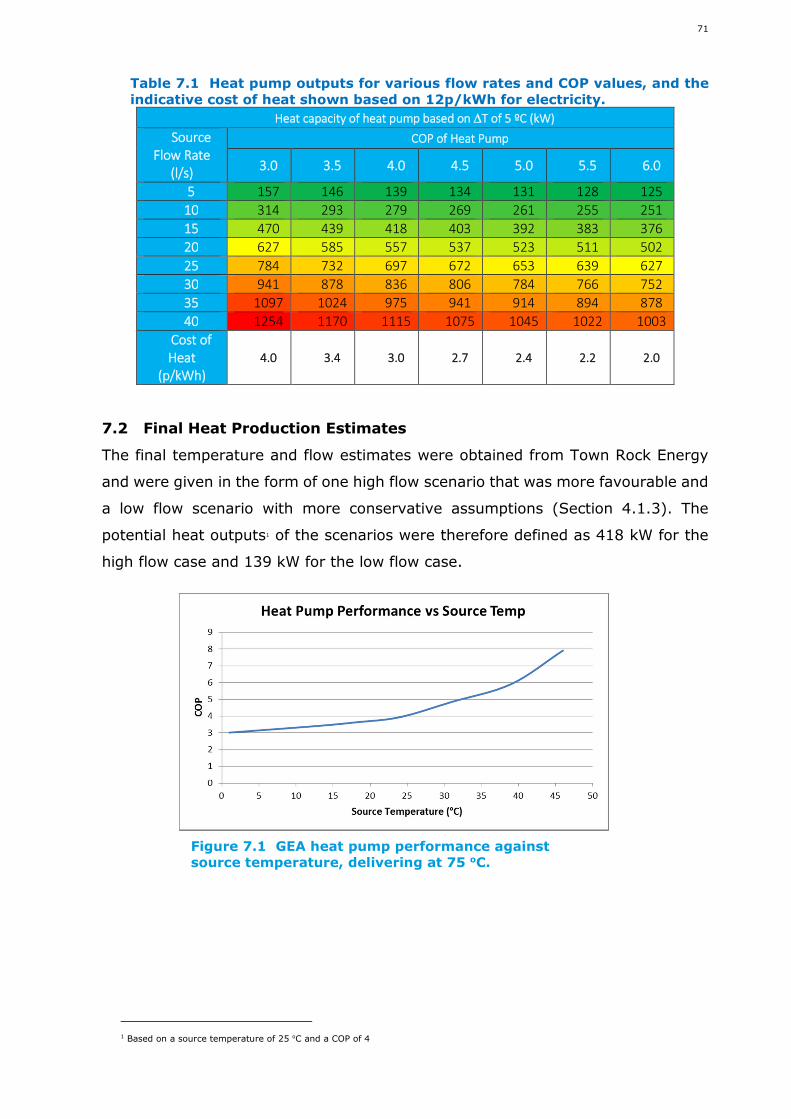
71
Table 7.1 Heat pump outputs for various flow rates and COP values, and theindicative cost of heat shown based on 12p/kWh for electricity.
Heat capacity of heat pump based on T of 5 ºC (kW)
SourceFlow Rate
(l/s)
COP of Heat Pump
3.0 3.5 4.0 4.5 5.0 5.5 6.0
5 157 146 139 134 131 128 125
10 314 293 279 269 261 255 251
15 470 439 418 403 392 383 376
20 627 585 557 537 523 511 502
25 784 732 697 672 653 639 627
30 941 878 836 806 784 766 752
35 1097 1024 975 941 914 894 878
40 1254 1170 1115 1075 1045 1022 1003
Cost ofHeat
(p/kWh)4.0 3.4 3.0 2.7 2.4 2.2 2.0
7.2 Final Heat Production Estimates
The final temperature and flow estimates were obtained from Town Rock Energy
and were given in the form of one high flow scenario that was more favourable and
a low flow scenario with more conservative assumptions (Section 4.1.3). The
potential heat outputs1 of the scenarios were therefore defined as 418 kW for the
high flow case and 139 kW for the low flow case.
1 Based on a source temperature of 25 oC and a COP of 4
Figure 7.1 GEA heat pump performance againstsource temperature, delivering at 75 oC.
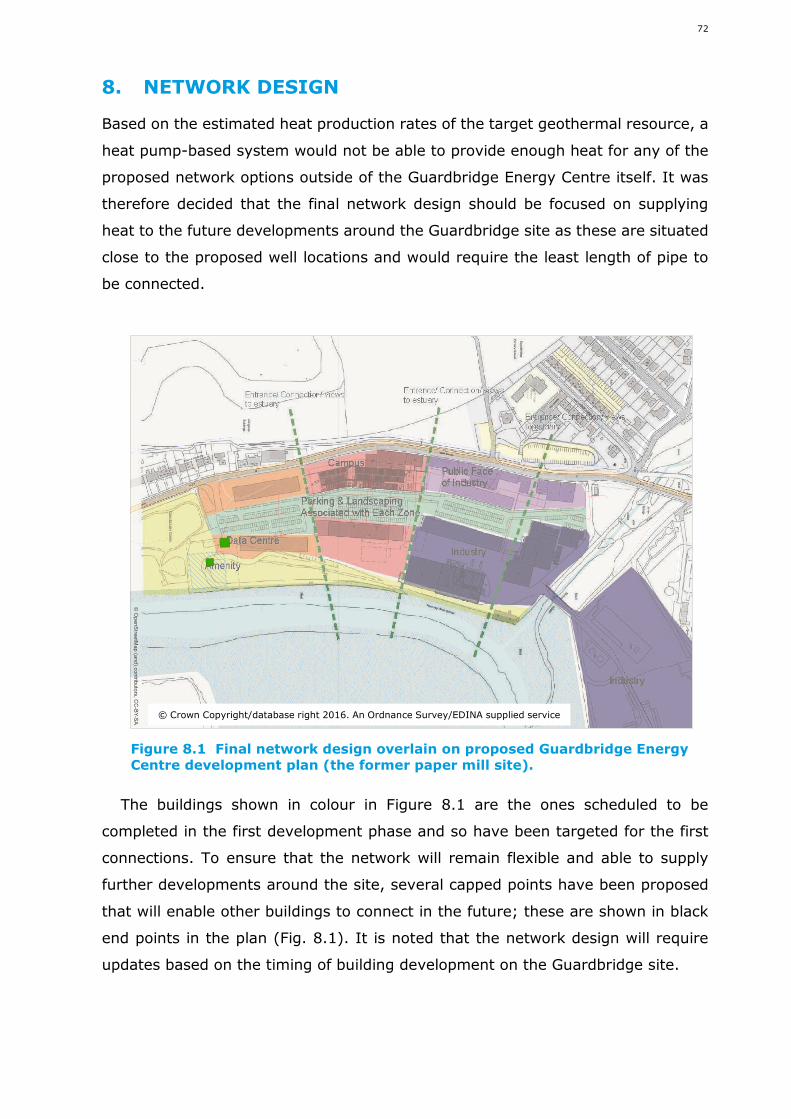
72
8. NETWORK DESIGN
Based on the estimated heat production rates of the target geothermal resource, a
heat pump-based system would not be able to provide enough heat for any of the
proposed network options outside of the Guardbridge Energy Centre itself. It was
therefore decided that the final network design should be focused on supplying
heat to the future developments around the Guardbridge site as these are situated
close to the proposed well locations and would require the least length of pipe to
be connected.
The buildings shown in colour in Figure 8.1 are the ones scheduled to be
completed in the first development phase and so have been targeted for the first
connections. To ensure that the network will remain flexible and able to supply
further developments around the site, several capped points have been proposed
that will enable other buildings to connect in the future; these are shown in black
end points in the plan (Fig. 8.1). It is noted that the network design will require
updates based on the timing of building development on the Guardbridge site.
Figure 8.1 Final network design overlain on proposed Guardbridge EnergyCentre development plan (the former paper mill site).
©O
penS
treetM
ap
(an
d)
contrib
uto
rs,C
C-B
Y-S
A
© Crown Copyright/database right 2016. An Ordnance Survey/EDINA supplied service
73
8.1 Well location
This smaller more localised network also benefits from the fact that the preferred
well option for the project was proposed to lie inside the Guardbridge site, hence
eliminating the need for any long stretches of transmission pipe to get from the
well-head to the geothermal energy centre or heat demand.
The geothermal energy centre and production well have been placed a short
distance apart to allow for future maintenance of the borehole. Initially it is
estimated to require a drilling area of approximately 65 x 65 m, while any
subsequent work would require just 45 x 45 m. This smaller maintenance allowance
can be seen in Figure 8.1 as the blue hashed square around the production well
and the initial drilling footprint is the black square around this. Due to the footprint
required for drilling such a deep borehole, all construction around the site would
have to wait until after the well had been completed. However, this is the most
likeky case as the well production would have to be proved valuable before
construction of the geothermal energy centre took place.
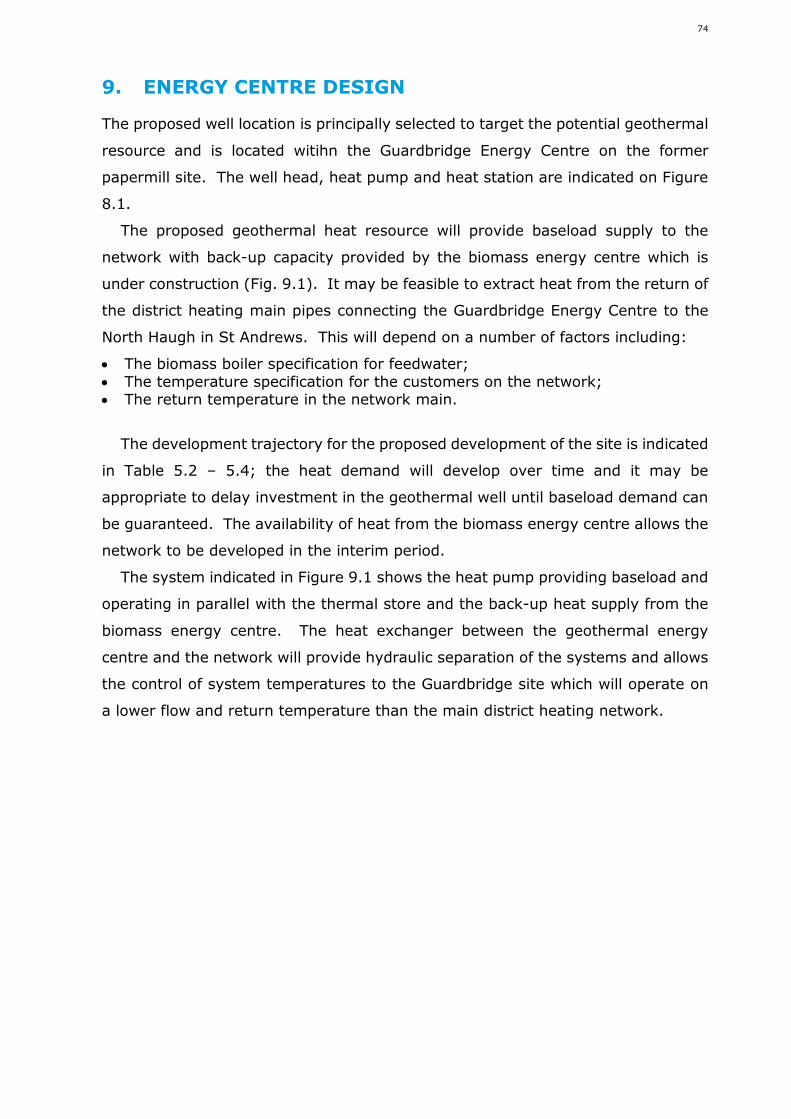
74
9. ENERGY CENTRE DESIGN
The proposed well location is principally selected to target the potential geothermal
resource and is located witihn the Guardbridge Energy Centre on the former
papermill site. The well head, heat pump and heat station are indicated on Figure
8.1.
The proposed geothermal heat resource will provide baseload supply to the
network with back-up capacity provided by the biomass energy centre which is
under construction (Fig. 9.1). It may be feasible to extract heat from the return of
the district heating main pipes connecting the Guardbridge Energy Centre to the
North Haugh in St Andrews. This will depend on a number of factors including:
The biomass boiler specification for feedwater; The temperature specification for the customers on the network; The return temperature in the network main.
The development trajectory for the proposed development of the site is indicated
in Table 5.2 – 5.4; the heat demand will develop over time and it may be
appropriate to delay investment in the geothermal well until baseload demand can
be guaranteed. The availability of heat from the biomass energy centre allows the
network to be developed in the interim period.
The system indicated in Figure 9.1 shows the heat pump providing baseload and
operating in parallel with the thermal store and the back-up heat supply from the
biomass energy centre. The heat exchanger between the geothermal energy
centre and the network will provide hydraulic separation of the systems and allows
the control of system temperatures to the Guardbridge site which will operate on
a lower flow and return temperature than the main district heating network.
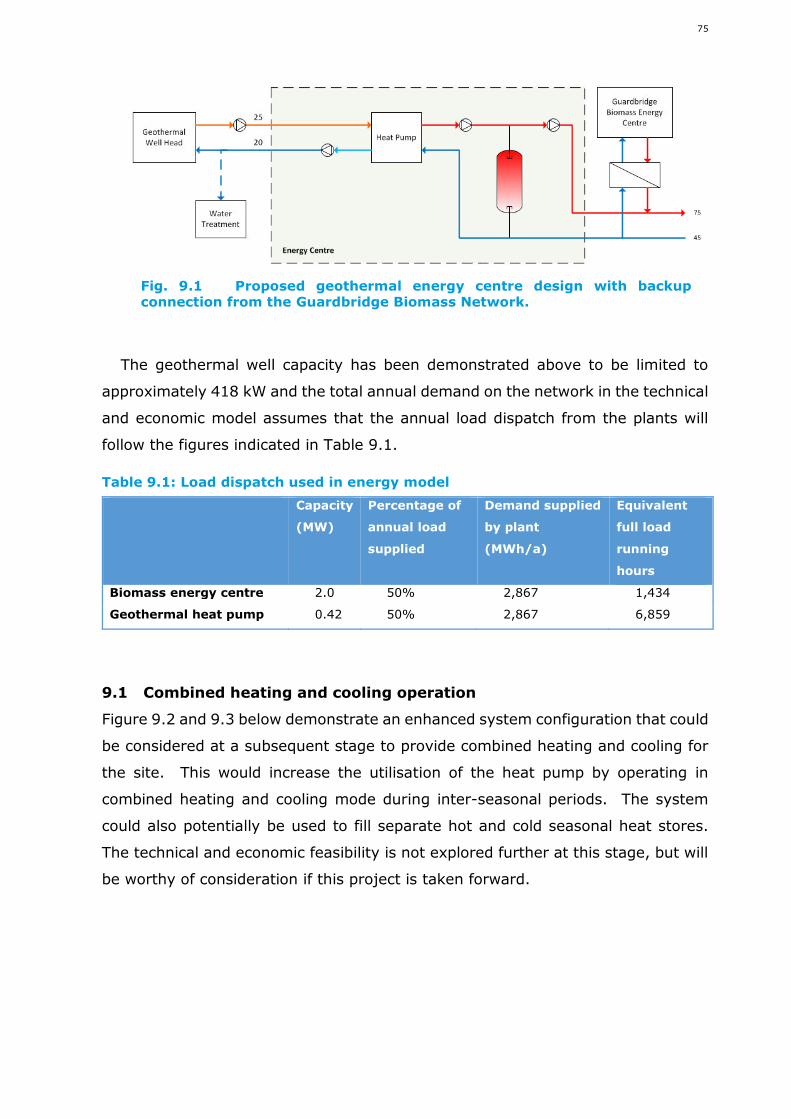
75
The geothermal well capacity has been demonstrated above to be limited to
approximately 418 kW and the total annual demand on the network in the technical
and economic model assumes that the annual load dispatch from the plants will
follow the figures indicated in Table 9.1.
Table 9.1: Load dispatch used in energy model
Capacity
(MW)
Percentage of
annual load
supplied
Demand supplied
by plant
(MWh/a)
Equivalent
full load
running
hours
Biomass energy centre 2.0 50% 2,867 1,434
Geothermal heat pump 0.42 50% 2,867 6,859
9.1 Combined heating and cooling operation
Figure 9.2 and 9.3 below demonstrate an enhanced system configuration that could
be considered at a subsequent stage to provide combined heating and cooling for
the site. This would increase the utilisation of the heat pump by operating in
combined heating and cooling mode during inter-seasonal periods. The system
could also potentially be used to fill separate hot and cold seasonal heat stores.
The technical and economic feasibility is not explored further at this stage, but will
be worthy of consideration if this project is taken forward.
Fig. 9.1 Proposed geothermal energy centre design with backupconnection from the Guardbridge Biomass Network.
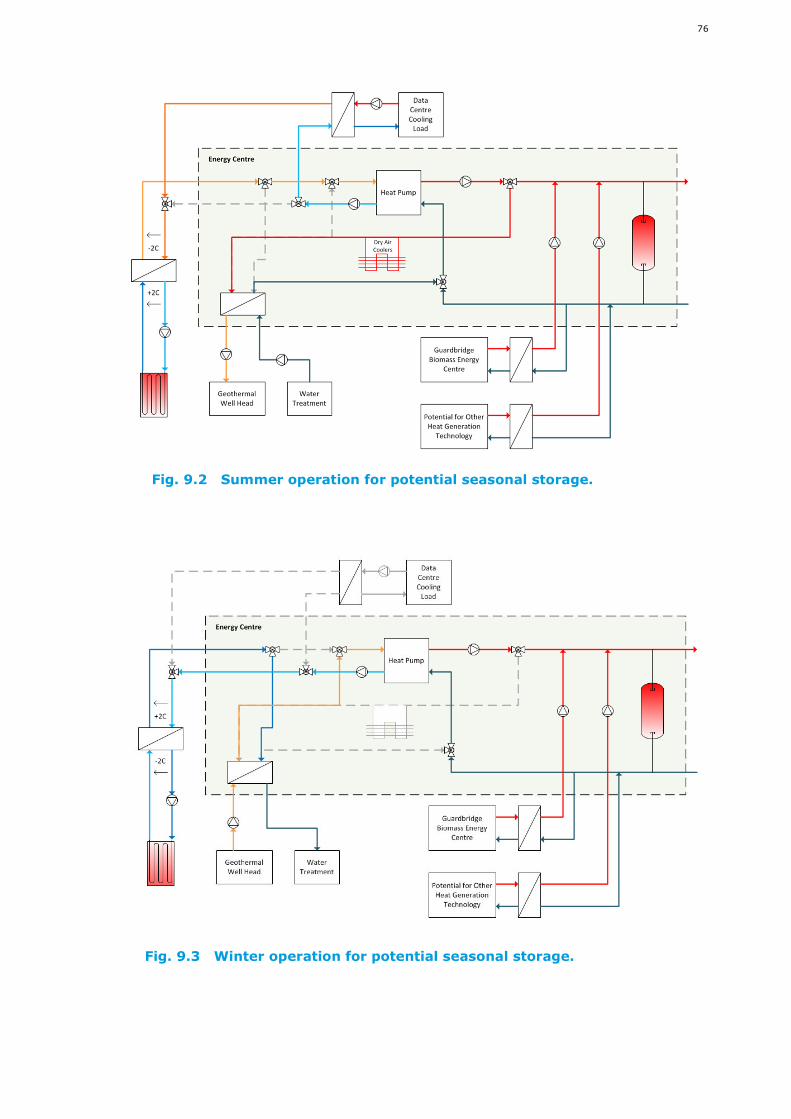
76
Fig. 9.2 Summer operation for potential seasonal storage.
Fig. 9.3 Winter operation for potential seasonal storage.
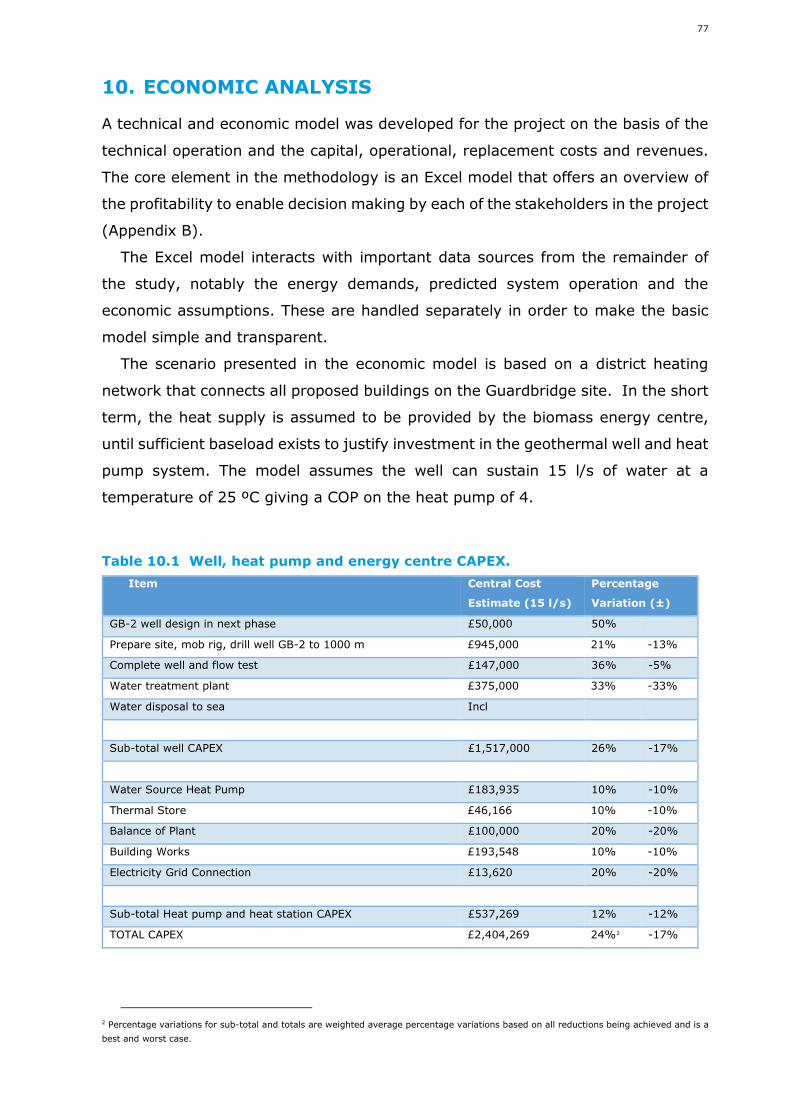
77
10. ECONOMIC ANALYSIS
A technical and economic model was developed for the project on the basis of the
technical operation and the capital, operational, replacement costs and revenues.
The core element in the methodology is an Excel model that offers an overview of
the profitability to enable decision making by each of the stakeholders in the project
(Appendix B).
The Excel model interacts with important data sources from the remainder of
the study, notably the energy demands, predicted system operation and the
economic assumptions. These are handled separately in order to make the basic
model simple and transparent.
The scenario presented in the economic model is based on a district heating
network that connects all proposed buildings on the Guardbridge site. In the short
term, the heat supply is assumed to be provided by the biomass energy centre,
until sufficient baseload exists to justify investment in the geothermal well and heat
pump system. The model assumes the well can sustain 15 l/s of water at a
temperature of 25 ºC giving a COP on the heat pump of 4.
Table 10.1 Well, heat pump and energy centre CAPEX.
Item Central Cost
Estimate (15 l/s)
Percentage
Variation (±)
GB-2 well design in next phase £50,000 50%
Prepare site, mob rig, drill well GB-2 to 1000 m £945,000 21% -13%
Complete well and flow test £147,000 36% -5%
Water treatment plant £375,000 33% -33%
Water disposal to sea Incl
Sub-total well CAPEX £1,517,000 26% -17%
Water Source Heat Pump £183,935 10% -10%
Thermal Store £46,166 10% -10%
Balance of Plant £100,000 20% -20%
Building Works £193,548 10% -10%
Electricity Grid Connection £13,620 20% -20%
Sub-total Heat pump and heat station CAPEX £537,269 12% -12%
TOTAL CAPEX £2,404,269 24%2 -17%
2 Percentage variations for sub-total and totals are weighted average percentage variations based on all reductions being achieved and is a
best and worst case.
78
10.1 CAPEX
The district heating network CAPEX is estimated to be £530,000 for a total pipe
network length of approximately 1,200m. A small cost of £40,000 has been
included to account for the cost of connecting to the heat transmission main from
the biomass energy centre (Table 10.1).
The model includes the cost of heat interface units for all customers but, as
discussed below, these costs are assumed to be repaid by customers as a
connection charge. This can be presented to customers as an avoided cost for
installation of an alternative heating system.
10.2 OPEX and REPEX
The operational costs are estimated to be principally for the power consumption of
the heat pump and distribution pumps to the district heating network. This equates
to a cost of approximately £280,000 per year. The model assumes a major
replacement and clean out of the well after 10 years at a cost of £250,000.
10.3 Revenue
The principal revenues in the model are the RHI and heat sales to consumers. The
RHI has been assigned to the project at £50.8/MWh. The heat sales price is a
variable and needs to reflect a competitive price against the alternative business
case, which would be individual gas boilers or electric heat pumps. The price
considered in the base model varies by customer size and is listed in Table 10.2.
Table 10.2 Assumed cost of heat to consumers.
Customer size Heat sale price
Heat sales price 0-250 MWh 47 p/kWh
Heat sales price 250-2500 MWh 43 p/kWh
Heat sales price 2500-25000 MWh 42 p/kWh
Heat sales price 25000-250000 MWh 36 p/kWh
10.4 Modelling results
The model generates a 20-year cashflow for the project based on the figures
estimated from the analysis described in this report. It calculates the overall
economic performance of the project to society in terms of the payback, internal
rate of return (IRR), net present value (NPV), and return on investment. This result
is useful to optimise the overall system, but the model also presents a transparent
economic model that illustrates the benefit to each of the organisations. This is
79
critical in establishing a delivery model that attracts all stakeholders of the system
into the project.
The modelling assumptions are presented in a clear and transparent way. The
model considers the effect of a range of financing options for the different
scenarios, and is run on the basis of the financial parameters for the district heating
network shown in Table 10.3. The financing of the geothermal well and energy
centre is likely to require specific project investment criteria and for the purposes
of this analysis, the NPV and IRR are assumed to provide suitable parameters to
assess the viability. The NPV presented in this report for the geothermal well and
energy centre is calculated on the basis of a 3%3
discount rate.
The financial projections are in real terms and do not include inflation. One option
will be to finance with the cheapest international 20–year loans on the market
(assuming a public sector or state guarantee for the loan). Another option is to
assume a private equity financing and a specified return on the invested capital.
The model can be adjusted to reflect the revenues from a specified competitive
heat price and the result will be an additional short term financing at a specified
interest rate.
3 This is likely to be low if the geothermal well needs to be financed privately
Fig. 10.1 Share of benefit under district heating scenariopresented.
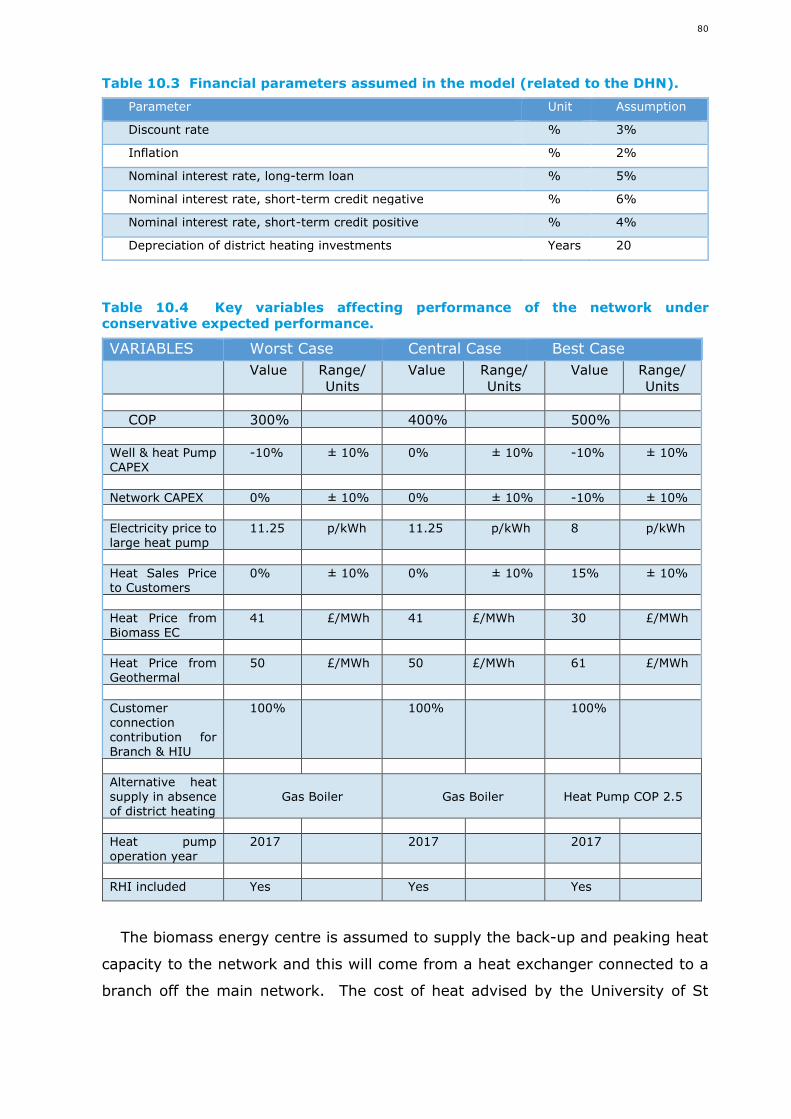
80
Table 10.3 Financial parameters assumed in the model (related to the DHN).
Parameter Unit Assumption
Discount rate % 3%
Inflation % 2%
Nominal interest rate, long-term loan % 5%
Nominal interest rate, short-term credit negative % 6%
Nominal interest rate, short-term credit positive % 4%
Depreciation of district heating investments Years 20
Table 10.4 Key variables affecting performance of the network underconservative expected performance.
VARIABLES Worst Case Central Case Best Case
Value Range/Units
Value Range/Units
Value Range/Units
COP 300% 400% 500%
Well & heat PumpCAPEX
-10% ± 10% 0% ± 10% -10% ± 10%
Network CAPEX 0% ± 10% 0% ± 10% -10% ± 10%
Electricity price tolarge heat pump
11.25 p/kWh 11.25 p/kWh 8 p/kWh
Heat Sales Priceto Customers
0% ± 10% 0% ± 10% 15% ± 10%
Heat Price fromBiomass EC
41 £/MWh 41 £/MWh 30 £/MWh
Heat Price fromGeothermal
50 £/MWh 50 £/MWh 61 £/MWh
Customerconnectioncontribution forBranch & HIU
100% 100% 100%
Alternative heatsupply in absenceof district heating
Gas Boiler Gas Boiler Heat Pump COP 2.5
Heat pumpoperation year
2017 2017 2017
RHI included Yes Yes Yes
The biomass energy centre is assumed to supply the back-up and peaking heat
capacity to the network and this will come from a heat exchanger connected to a
branch off the main network. The cost of heat advised by the University of St
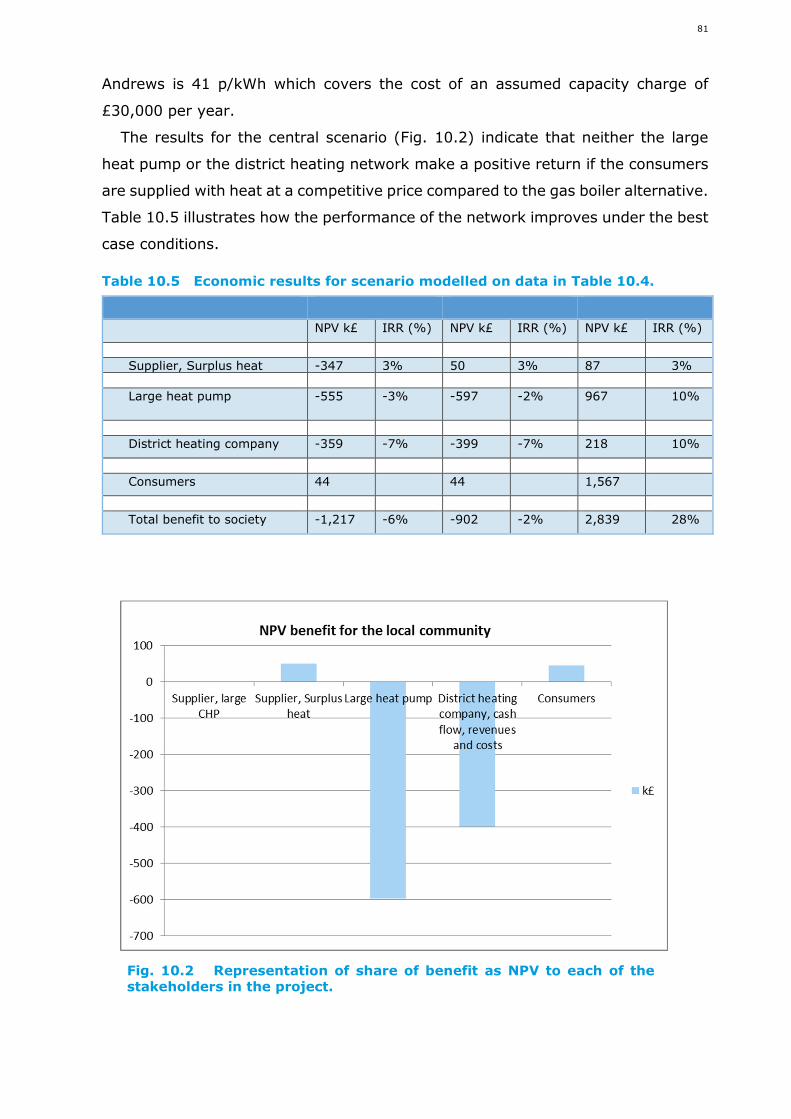
81
Andrews is 41 p/kWh which covers the cost of an assumed capacity charge of
£30,000 per year.
The results for the central scenario (Fig. 10.2) indicate that neither the large
heat pump or the district heating network make a positive return if the consumers
are supplied with heat at a competitive price compared to the gas boiler alternative.
Table 10.5 illustrates how the performance of the network improves under the best
case conditions.
Table 10.5 Economic results for scenario modelled on data in Table 10.4.
NPV k£ IRR (%) NPV k£ IRR (%) NPV k£ IRR (%)
Supplier, Surplus heat -347 3% 50 3% 87 3%
Large heat pump -555 -3% -597 -2% 967 10%
District heating company -359 -7% -399 -7% 218 10%
Consumers 44 44 1,567
Total benefit to society -1,217 -6% -902 -2% 2,839 28%
Fig. 10.2 Representation of share of benefit as NPV to each of thestakeholders in the project.
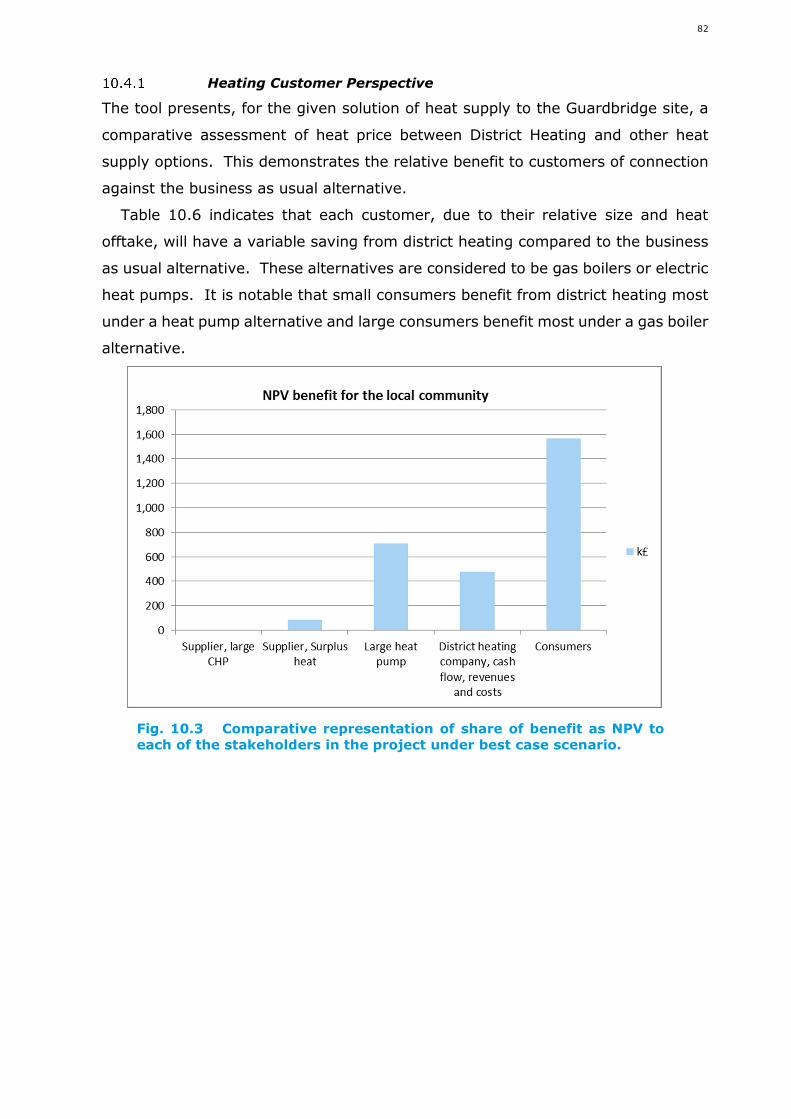
82
Heating Customer Perspective
The tool presents, for the given solution of heat supply to the Guardbridge site, a
comparative assessment of heat price between District Heating and other heat
supply options. This demonstrates the relative benefit to customers of connection
against the business as usual alternative.
Table 10.6 indicates that each customer, due to their relative size and heat
offtake, will have a variable saving from district heating compared to the business
as usual alternative. These alternatives are considered to be gas boilers or electric
heat pumps. It is notable that small consumers benefit from district heating most
under a heat pump alternative and large consumers benefit most under a gas boiler
alternative.
Fig. 10.3 Comparative representation of share of benefit as NPV toeach of the stakeholders in the project under best case scenario.
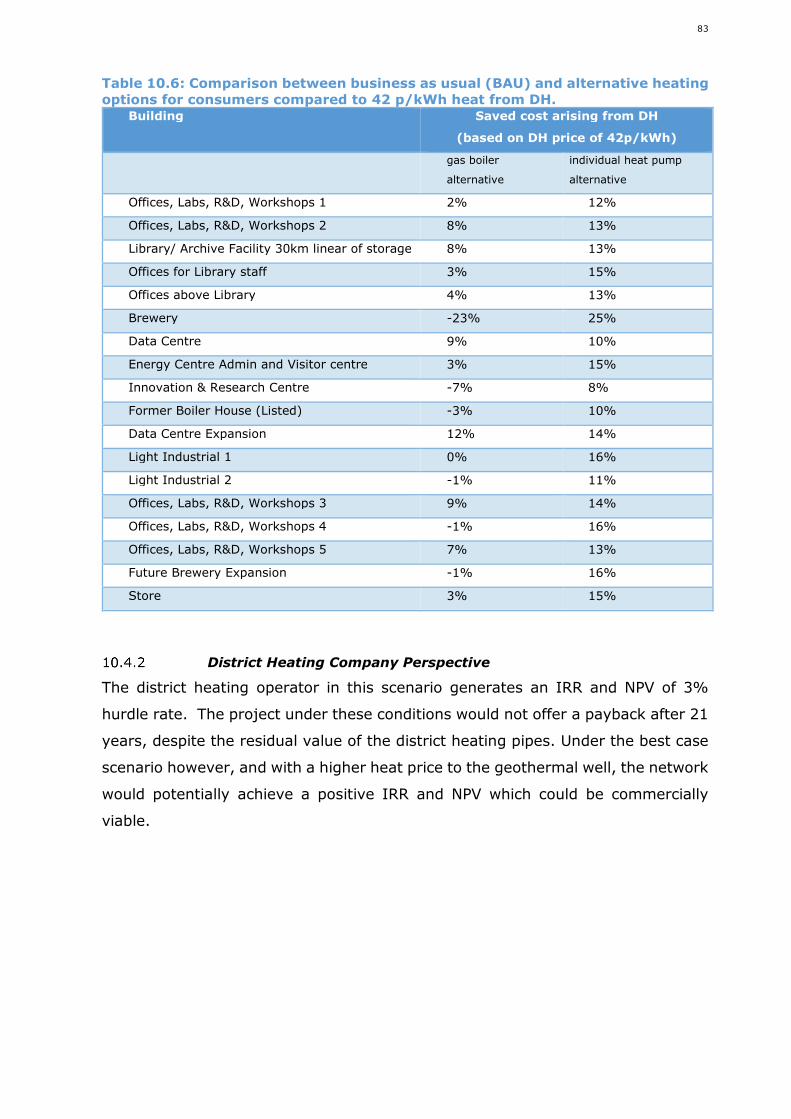
83
Table 10.6: Comparison between business as usual (BAU) and alternative heatingoptions for consumers compared to 42 p/kWh heat from DH.
Building Saved cost arising from DH
(based on DH price of 42p/kWh)
gas boiler
alternative
individual heat pump
alternative
Offices, Labs, R&D, Workshops 1 2% 12%
Offices, Labs, R&D, Workshops 2 8% 13%
Library/ Archive Facility 30km linear of storage 8% 13%
Offices for Library staff 3% 15%
Offices above Library 4% 13%
Brewery -23% 25%
Data Centre 9% 10%
Energy Centre Admin and Visitor centre 3% 15%
Innovation & Research Centre -7% 8%
Former Boiler House (Listed) -3% 10%
Data Centre Expansion 12% 14%
Light Industrial 1 0% 16%
Light Industrial 2 -1% 11%
Offices, Labs, R&D, Workshops 3 9% 14%
Offices, Labs, R&D, Workshops 4 -1% 16%
Offices, Labs, R&D, Workshops 5 7% 13%
Future Brewery Expansion -1% 16%
Store 3% 15%
District Heating Company Perspective
The district heating operator in this scenario generates an IRR and NPV of 3%
hurdle rate. The project under these conditions would not offer a payback after 21
years, despite the residual value of the district heating pipes. Under the best case
scenario however, and with a higher heat price to the geothermal well, the network
would potentially achieve a positive IRR and NPV which could be commercially
viable.
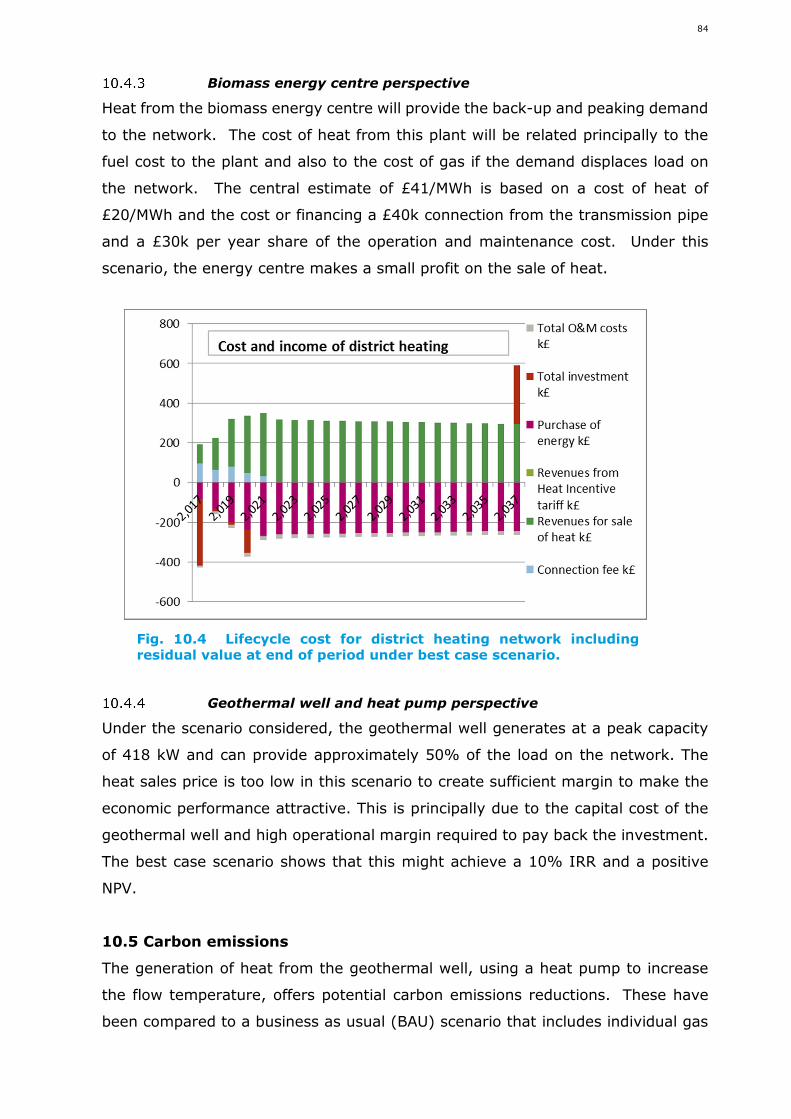
84
Biomass energy centre perspective
Heat from the biomass energy centre will provide the back-up and peaking demand
to the network. The cost of heat from this plant will be related principally to the
fuel cost to the plant and also to the cost of gas if the demand displaces load on
the network. The central estimate of £41/MWh is based on a cost of heat of
£20/MWh and the cost or financing a £40k connection from the transmission pipe
and a £30k per year share of the operation and maintenance cost. Under this
scenario, the energy centre makes a small profit on the sale of heat.
Geothermal well and heat pump perspective
Under the scenario considered, the geothermal well generates at a peak capacity
of 418 kW and can provide approximately 50% of the load on the network. The
heat sales price is too low in this scenario to create sufficient margin to make the
economic performance attractive. This is principally due to the capital cost of the
geothermal well and high operational margin required to pay back the investment.
The best case scenario shows that this might achieve a 10% IRR and a positive
NPV.
10.5 Carbon emissions
The generation of heat from the geothermal well, using a heat pump to increase
the flow temperature, offers potential carbon emissions reductions. These have
been compared to a business as usual (BAU) scenario that includes individual gas
Fig. 10.4 Lifecycle cost for district heating network includingresidual value at end of period under best case scenario.
85
boilers for each of the customers (Table 10.7). The heat production in the
alternative business case requires heat supply of 113,351MWh to be generated by
gas boilers. This equates to 28,574 tonnes of carbon emissions. The analysis in
the model shows an 84% reduction in carbon emissions under a scenario where
biomass boilers and water source heat pumps supply the majority of the demand
through a local district heating network.
The carbon emissions factor associated with the biomass boilers is 7
kgCO2/kWhth based on the carbon emissions of different fuels, provided by the
Biomass Energy Centre website (www.biomassenergy.org.uk). The carbon
emissions factor associated with the electricity grid is 300 kgCO2/kWh and this is
predicted to reduce over the lifecycle of the project. The reduction in grid emissions
intensity has been included in the model based on Figure 5.2 in the DECC report
enetitled Updated Energy & Emissions Projections - November 2015.
Under the scenario modelled for this study, the biomass boilers contribute
approximately 50% of the heat demand (up to 3 MWh per year) and the heat
pumps contribute the remaining 50% of the demand. The biomass boilers have
low carbon emissions associated with them and the majority of the predicted CO2
emissions are associated with the carbon emissions intensity of the grid supplying
the geothermal well pumps and the heat pump. This equates to 4,677 tonnes over
the 20-year lifetime of the model. These are significantly lower than the alternative
scenario where heating is supplied from gas boilers. Furthermore, the carbon
intensity of the electricity grid is reducing with the build out of low carbon energy
generation systems connecting to the electricity grid. About 58% (13,878 tonnes
CO2/kWh saved relative to the BAU) of the carbon emissions reduction is attributed
to the heat supplied from the biomass plant and 9,812 tonnes CO2/kWh saved
relative to the BAU (42%) is attributed to the geothermal well pumps and the heat
pumps.
Table 10.7 Carbon emissions reductions from district heating compared toindividual gas boilers.
20 Year Lifecycle Carbon Emissions Reduction
Total CO2 emission district heating 4,677 Tonnes
Total CO2 emission baseline 28,574 Tonnes
Saved CO2 emission district heating compared to baseline 23,987 Tonnes
The value of this carbon saving is not included in the model since it does not
currently represent a cost to the University, however it could be considered to
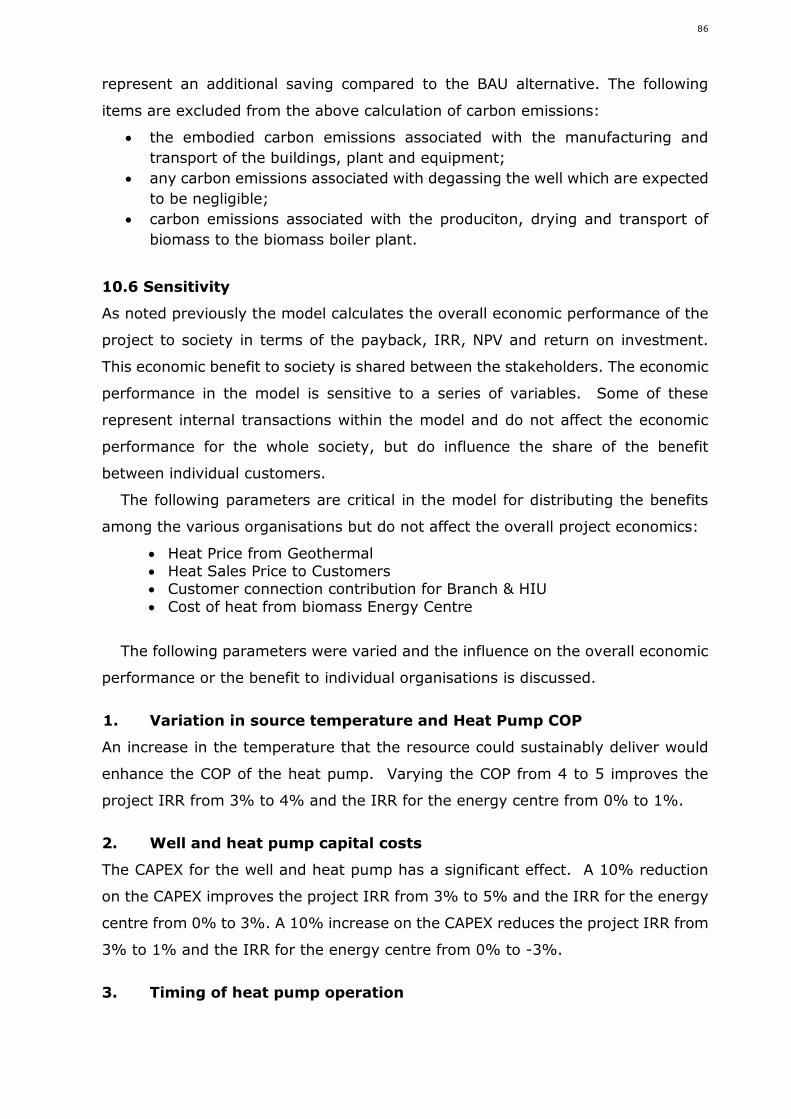
86
represent an additional saving compared to the BAU alternative. The following
items are excluded from the above calculation of carbon emissions:
the embodied carbon emissions associated with the manufacturing and
transport of the buildings, plant and equipment;
any carbon emissions associated with degassing the well which are expected
to be negligible;
carbon emissions associated with the produciton, drying and transport of
biomass to the biomass boiler plant.
10.6 Sensitivity
As noted previously the model calculates the overall economic performance of the
project to society in terms of the payback, IRR, NPV and return on investment.
This economic benefit to society is shared between the stakeholders. The economic
performance in the model is sensitive to a series of variables. Some of these
represent internal transactions within the model and do not affect the economic
performance for the whole society, but do influence the share of the benefit
between individual customers.
The following parameters are critical in the model for distributing the benefits
among the various organisations but do not affect the overall project economics:
Heat Price from Geothermal Heat Sales Price to Customers Customer connection contribution for Branch & HIU Cost of heat from biomass Energy Centre
The following parameters were varied and the influence on the overall economic
performance or the benefit to individual organisations is discussed.
1. Variation in source temperature and Heat Pump COP
An increase in the temperature that the resource could sustainably deliver would
enhance the COP of the heat pump. Varying the COP from 4 to 5 improves the
project IRR from 3% to 4% and the IRR for the energy centre from 0% to 1%.
2. Well and heat pump capital costs
The CAPEX for the well and heat pump has a significant effect. A 10% reduction
on the CAPEX improves the project IRR from 3% to 5% and the IRR for the energy
centre from 0% to 3%. A 10% increase on the CAPEX reduces the project IRR from
3% to 1% and the IRR for the energy centre from 0% to -3%.
3. Timing of heat pump operation
87
The uncertain development of the heat load at the site, and the opportunity to
supply heat from the biomass energy centre, means that it may be prudent to wait
until the load is guaranteed before investing in the geothermal well. This is feasible
and does not affect the overall cost assumptions, but delays the investment in the
network. Establishing the network from 2017 and investing in the heat pump in
2020 improves the IRR from 3% to 4%.
4. Renewable heat incentive (RHI)
The RHI is vital to the economic viability of the project and will allow the
demonstration of the project with the expectation that the lessons learnt from
installing deep geothermal wells can be shared, and the costs and risks of
installation can be reduced generally. The removal of the RHI from the modelling
assumptions reduces the overall IRR to society from 3% to -2%.
10.7 Summary of Economic Analysis
Based on the economic analysis, the project can demonstrate reasonable
performance under a scenario where the anticipated geothermal resource can yield
the predicted performance and the costs and risks are well managed. The model
clearly shows, however, that the economic performance of the scheme is sensitive
to a number of factors and it is the combination of sensitivities that need to be
considered. Tables 10.4 and 10.5 indicate the relative performance under the
baseline set of assumptions and a reasonable best case assumption.
The results in Table 10.5 indicate that the central estimate for the project
delivers a -2% IRR and the district heating company generates a negative IRR and
NPV. The geothermal system will deliver a negative IRR and NPV over a 20-year
lifetime. This result will make the geothermal system, with the inherent risk of not
reaching the required permeability in the rock, a poor investment prospect. It is
notable, however, that there are a number of sensitivities that could improve the
model performance and this scenario has been presented below.
The results presented as the best case scenario in Table 10.5 show a significantly
more attractive project. The assumptions made in this scenario are not
unreasonable, but will require further investigation, although they do not provide
a margin for uncertainty and risk. The cashflow for this scenario is shown in Figure
10.5.
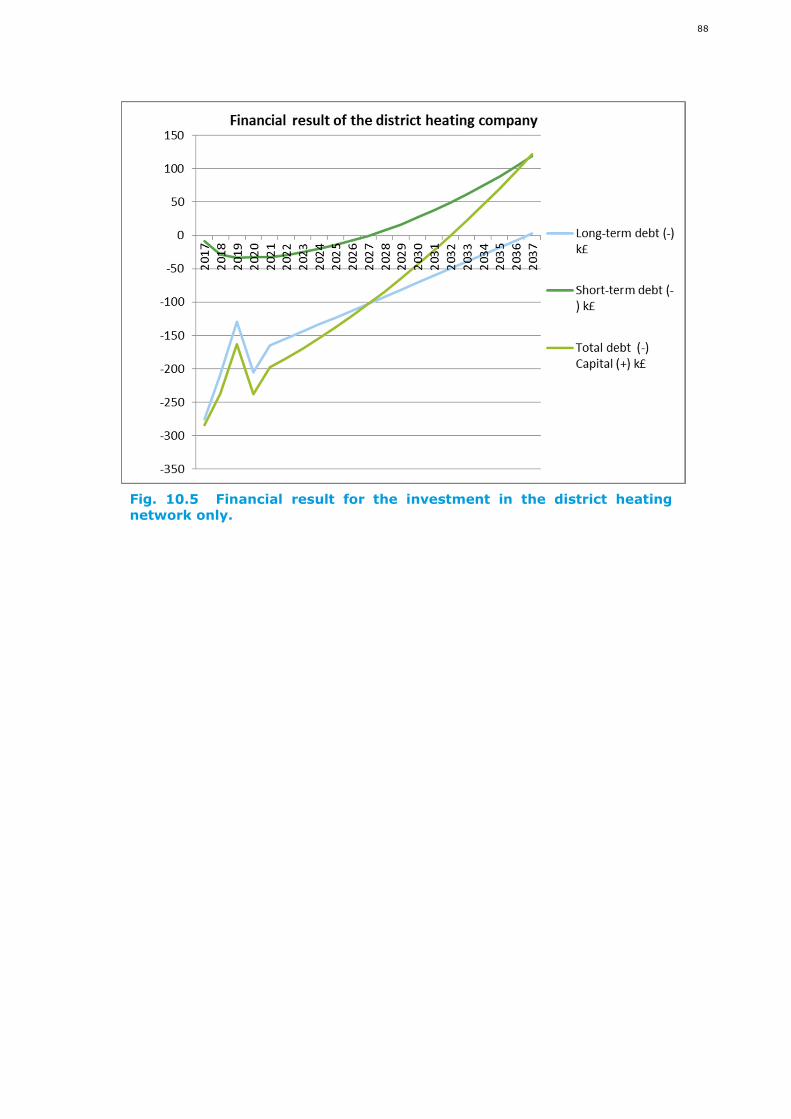
88
Fig. 10.5 Financial result for the investment in the district heatingnetwork only.
89
11. REGULATORY CONSIDERATIONS
11.1 Introduction to the environmental concerns
The key environmental concerns about the development and production of a
geothermal well are related to the exploitation of a groundwater resource, the
impact of exploration and operation on the surrounding environment in the
sensitive and protected area of the Eden Estuary, and what happens to the
geothermal water after the heat is extracted. The Eden Estuary is part of the Firth
of Tay and Eden Estuary Special Area of Conservation (SAC) site and the estuaries
represent high quality Annex 1 estuarine habitats (Regulation 33(2) of the
Conservation Regulations). The Eden Estuary is a Site of Special Scientific Interest
and a Local Nature Reserve. The Guardbridge Energy Centre sits between the Eden
River and the Motray Water, directly adjacent to the tidal flats of the upper estuary
(Fig. 11.1). Species include tidal reed beds of Phragmites australis and mudflats
contain mud-dwelling invertebrates, such as the amphipod Corophium volutator,
the mud snail Hydrobia ulvae and ragworm Hediste diversicolor; these species
support the over-wintering waders and wildfowl. Saltmarsh communities include
Juncus gerardii, Scirpus spp. and Puccinellia spp. with Festuca spp. (Bates et al.,
Fig. 13. Guardbridge is sited next to the Eden Estuary which has SSSI, SPA,SAC and Ramsar status. Data are gathered from Scottish Natural Heritage.
90
2002). Sparse beds of eelgrass Zostera angustifolia can also be found to some
extent in both estuaries and reefs of the mussel Mytilus edulis are common on the
intertidal banks of the main Eden Estuary channel (Bates et al., 2002). The reefs
support the common starfish Asterias rubensin. The mussel reefs are confined to
the intertidal muddy areas where they support ephemeral green algae, such as
Enteromorpha sp. that extend as thick mats during the summer months. Several
species listed in Annex II of the Habitats and Species Directive also occur regularly
in the Firth of Tay and Eden Estuary SAC. There is a non-breeding population of
grey seals (Halichoerus grypus) that travel up and down the estuary, and otters
Lutra lutra occur on the River Eden above Guardbridge. The intertidal sediment
flats (to mean low water springs) are an existing Ramsar site and classified SPA for
overwintering wildfowl and waders, as well as for the marsh harrier Circus
aeruginosus and little tern Sterna albifrons (Bates et al., 2002).
As a tidal estuary, the salinity changes from upstream of Guardbridge to the
estuary mouth and over tidal and seasonal cycles. Salinities approaching 0 psu are
associated with the River Eden flows upstream of Guardbrdige, but can reach 25
psu within the mudflats at and around Guardbridge, or as high as 46 psu in salt
flats (Spears et al., 2008). Any water disposal to sea as part of the water
geothermal water management would need to accommodate these spatially and
temporally varying salinities.
11.2 Regulatory requirements
The regulatory issues involve licensing to abstract a groundwater resource and for
disposal to sea, and also adherence to EC habitat regulations. The relevant
regulatory authorities and organisations involved are the Scottish Environmental
Protection Agency (SEPA), Fife Council, Scottish Natural Heritage, and Scottish
Water. Exploration for, and disposal of, water is regulated under the Water
Environment (Controlled Activities) Scotland Regulations (CAR) 2011 (amended
2013). Geothermal exploration and abstraction will require registration and a
Simple License (for a borehole > 200 m deep and abstracting 50 – 2000 m3/d).
Disposal to sea will require a Complex License that covers surface water run-off
during drilling and inorganic and thermal effluents as point source pollutants (>
100m3/d). Applications to SEPA for registration and authorisation will also need to
follow guidance covered in WAT-RM-05: Regulation of Trade Effluent Discharges to
Surface Waters or WAT-RM-06: Regulation of Trade Effluent Discharges to
Groundwater.
91
Table 11.1 Identified environmental issues associated with a hot saline aquifergeothermal project at Guardbridge.
Factors to consider Likely effects Potential impacts
Drill site preparation – creatingstable and flat surface for drillrig.
Soil and rock removal (limitedquantities)
Particulate material couldenter surface waterways
Drilling Well GB-2 – dry holescenario
Elevated noise and dust levelsfor 15 – 30 days. Use of drillingmuds adds particulate matterto site.
Potential disturbance tobreeding birds. Particulatematerial could enter surfacewaterways and groundwater.
Drilling Well GB-2 – productionhole scenario
Same effects Same impacts
Pump flow rate tests and initialwater extraction
No effects identified for pumptests. Extracted water needs tobe stored and tested for waterchemistry and particulatecontent. If suitable, waterwould be diluted to ambientEden Estuary salinities.
Test water could causedeterioration to habitats if notde-mineralised and of toohigh/low temperature (greaterthan 3 oC difference)(short lived).
Demobilisation of rigs anddrilling support
Elevated noise and dust levelsfor 1-2 days.
Minimal impact of materialsentering surface waterways(and short lived).
slump risk from the drilling
Development of well toproduction phase
Dust as site is renovated foroperational phase.
Minimal impact of materialsentering surface waterways(and short lived).
Construction of geothermalenergy centre
Elevated noise and dustlevels. Some influx ofpollutents into soils.
Minimal impact of materialsentering surface waterways(and short lived).
Construction of heatingnetwork
Some noise and dust creation. Minimal impact of materialsentering surface waterways(and short lived).
Operation of geothermal well– water treatment andrecycling option
Water treated throughfiltration systems and recycledon-site. Negligible losses.
Minimal to no impact.
Operation of geothermal well– partial recycling, and somedisposal to sea. Water settlingand dilution, filtration andpossible treatments dependingon chemistry of water.
Water equilibrated to estuarytemperatures in settling pond,and diluted to estuarysalinities.
Commercial effluent couldcause deterioration to habitatsif not de-mineralised or ifaffecting natural salinities –cumulative effect to beconsidered once volumes arebetter understood.
Article 6(3) of the EC Habitats Directive is adhered to in Scotland through a
Habitat Regulations Appraisal (HRA) which is required for any plan or project which
is likely to have a significant or uncertain effect on the integrity of a site (HRA of
Plans: Guidance for Plan-making bodies in Scotland, 2015). Since the Eden Estuary
is a Special Area of Conservation (SAC), a Special Protected Area (SPA) and a
Ramsar site, as well as a Site of Special Scientific Interest (Fig. 11.1), any
developments surrounding such sites and involving noise, disruption of soils and
rock, or disposal of water and sediments to sea requires careful consideration,
licensing and permissions.
92
For this report, an outline of the recommended developments for a geothermal
well as proposed in Section 4 has been discussed with the Scottish Environmental
Protection Agency and Scottish Natural Heritage, in order to identify the main
concerns and the appropriate licensing and legislative requirements. As part of this
report, the potential factors, effects and impacts associated with a Guardbridge
geothermal project, were it to go ahead, have been listed in Table 11.1, and this
would need to be formalised for the screening stage of a Habitat Regulations
Appraisal.
11.3 Requirements for Phase 2 Stage
SNH (Gavin Johnson of SNH Cupar) were contacted as part of this feasibility study
and this section summarises their response. If the project is to go to the stage of
exploratory test drilling, or is to be completed as a production well, it is very likely
to that an Environmental Impact Assessment and an Environmental Statement
from the developer will be required before any work on site can commence, due to
adjacency of the Guardbridge site to the Eden estuary SPA; the final decision for
this lies with Fife Council. The project is “likely to have a significant effect” which
will need to be evaluated. Regardless of whether an EIA is required, a legislative
assessment will be required by the developer in the form of a Report to Inform an
Appropriate Assessment.
As part of the planning applications for the biomass plant (Fife Council
14/02334/EIA), Environmental Statements were submitted which have been
reviewed as part of this report. These extensive documents provide an existing
baseline for any future Environmental Statements and are therefore very useful in
identifying the risks to the sensitive surrounding areas. SNH have noted that while
the investigation into the environmental impacts of exploration and operation of a
geothermal well will be a function of the scale of the proposed construction,
operation, waste water disposal and heat storage if developed, the project will be
viewed in conjunction with other ongoing operations at Guardbridge.
SNH was advised by their ornithologist that construction and operational (direct
and indirect) impacts will need to be assessed. For Phase 2, detailed plans will be
required to provide more information on partial and/or full disposal-to-sea, the
disposal location and the nature of what is being disposed in terms of salinity, pH,
and elemental geochemistry, as well as the temperature, volume, flow rate of the
water. An assessment of any disposal will need to evaluate the impact upon the
biota within the intertidal sediments or the eelgrass growth, i.e. the prey/food base
93
for the qualifying bird interests of the SSSI, SPA and Ramsar sites. To evaluate the
impact of the disposal-to-sea option on the biota, particularly the saltmarsh, SNH
will require values for the maximum disposal quantities and frequencies, along with
the Eden River river flow data and estuarine flushing.
Given the potential for the project to progress with a recommendation for some
or all of the geothermal water to be disposed to sea, a competent authority (SNH
or Fife Council with the latter’s consultation) will need to complete an Appropriate
Assessment. Phase 2 of the Guardbridge Geothermal Project will need to consider
all of the conservation objectives below:
1. Population of the species as a viable component of the site2. Distribution of the species within site3. Distribution and extent of habitats supporting the species4. Structure, function and supporting processes of habitats supporting the
species5. No significant disturbance of the species
Table 11.2 summarises some of the environmental and legislative guidance that
will be relevant to developing Phase 2 of the project.
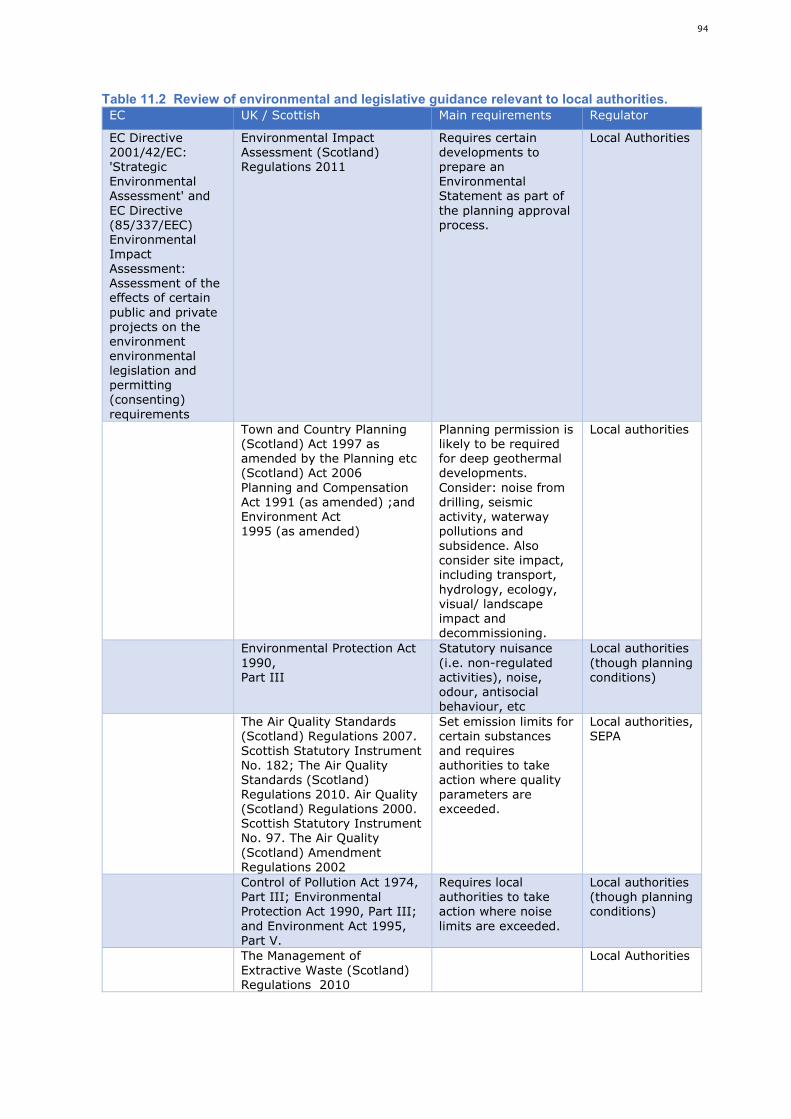
94
Table 11.2 Review of environmental and legislative guidance relevant to local authorities.EC UK / Scottish Main requirements Regulator
EC Directive2001/42/EC:'StrategicEnvironmentalAssessment' andEC Directive(85/337/EEC)EnvironmentalImpactAssessment:Assessment of theeffects of certainpublic and privateprojects on theenvironmentenvironmentallegislation andpermitting(consenting)requirements
Environmental ImpactAssessment (Scotland)Regulations 2011
Requires certaindevelopments toprepare anEnvironmentalStatement as part ofthe planning approvalprocess.
Local Authorities
Town and Country Planning(Scotland) Act 1997 asamended by the Planning etc(Scotland) Act 2006Planning and CompensationAct 1991 (as amended) ;andEnvironment Act1995 (as amended)
Planning permission islikely to be requiredfor deep geothermaldevelopments.Consider: noise fromdrilling, seismicactivity, waterwaypollutions andsubsidence. Alsoconsider site impact,including transport,hydrology, ecology,visual/ landscapeimpact anddecommissioning.
Local authorities
Environmental Protection Act1990,Part III
Statutory nuisance(i.e. non-regulatedactivities), noise,odour, antisocialbehaviour, etc
Local authorities(though planningconditions)
The Air Quality Standards(Scotland) Regulations 2007.Scottish Statutory InstrumentNo. 182; The Air QualityStandards (Scotland)Regulations 2010. Air Quality(Scotland) Regulations 2000.Scottish Statutory InstrumentNo. 97. The Air Quality(Scotland) AmendmentRegulations 2002
Set emission limits forcertain substancesand requiresauthorities to takeaction where qualityparameters areexceeded.
Local authorities,SEPA
Control of Pollution Act 1974,Part III; EnvironmentalProtection Act 1990, Part III;and Environment Act 1995,Part V.
Requires localauthorities to takeaction where noiselimits are exceeded.
Local authorities(though planningconditions)
The Management ofExtractive Waste (Scotland)Regulations 2010
Local Authorities
95
12. STAKE HOLDER MANAGEMENT
The University of St Andrews has been in discussion with the Guardbridge
community for the last 3 years over all developments at the site. It has developed
a full community engagement programme through 2015/16 relating to its Biomass
Energy Centre construction project. Communications and engagement meetings
have been held on Community Council meeting nights at Balmullo and Guardbridge,
with additional drop in meetings at St Andrews and Guardbridge. Separate
councillor briefings have also been held. Discussions have involved Councillor Tim
Brett and a new forum involving the community and the University is being
developed to manage and improve the flow of information between all parties. As
a part of ongoing discussion, the community have been made aware of the
Geothermal Energy Feasibility Study and its remit. Given the timing of the study
and that final conclusions were drawn in January 2016, no specific presentation
has been made to the Guardbridge community in regards the final
recommendations of the feasibility study. This can now go ahead with the
conclusion of the study and submission of the report to the Scottish Government,
and the University is in contact with Cllr Brett and the Community Council of
Guardbridge to organise a presentation.
The viability of extending the geothermal district heating infrastructure beyond
the borders of the Guardbridge industrial site appears to be uneconomic at this
time, and so the decision was made to confine community discussions for the
geothermal project to heat users in the Guardbridge site. The university and Eden
Brewery are both supportive of the potential for renewable heat energy from this
project.
96
13. CONCLUSIONS
The following conclusions arise from the Guardbridge geothermal heat feasibility
project in terms of estimated water temperatures and flow rates, well design
options, investigation of the scale of potential district heating network, the CAPEX,
OPEX and REPEX for exploration and DHN network development, and construction
of economic models accounting for all predicted financial costs and the revenue
from the sale of the heat.
C1. At the end of this study, which corresponds to the Catalyst Stage following
the Low Carbon Infrastucture Transition programme project stages, the
evaluation has shown a potentially viable scheme both technically and
economically, though at low return in the base case.
C2. The geology beneath the Guardbridge site is suitable for geothermal
exploration and using available rock characteristics data and the presented
geological model, two flow rates are predicted that are 1) low and 2)
reasonable-high estimates associated with temperatures in the range of 23
– 27 oC.
C3. Several well designs have been considered, all technically achievable, and a
single well design has been taken forward for the economic evaluation. The
well is estimated to be capable of delivering water at about 25 oC with a flow
rate of 15 litres/second, producing 418 kw of heat(± 10%).
C4. The economic model developed for this project predicts that the district
heating network option that is economic involves the Guardbridge site only,
and that with a flow rate of 15 l/s, 50% of the district heat required at
Guardbridge could be supplied by geothermal sources.
C5. The combination of geological thickness and depth uncertainty, plus the very
large range in porosity and permeability observed at any depth in offset
wells, results in an order of magnitude uncertainty in flow rates and
corresponding heat potential. Higher temperatures due to deeper aquifers,
or higher flow rates due to better permeability, will both significantly improve
the project’s performance economically.
C6. It is expected that some uncertainty in aquifer depth and thickness can be
reduced through undertaking low cost geophysical surveys, which have not
been possible within this study. The primary geological uncertainty of flow
rate can only be constrained and reduced by drilling and testing the aquifer
flow rate.
C7. Developing a wider DHN to surrounding communities is not economic based
on the current network density or considering the known future potential
network developments. A single well at the relatively low temperature
97
estimated here will not provide sufficient heat to expand the network beyond
the Guardbridge site.
C8. The geothermal heat project benefits from the proximity to the biomass
energy centre and combining the two systems could provide a dual heating
and cooling system, and an opportunity to conduct research on integrating
different low carbon energy systems.
C9. The location of the Guardbridge project is ideal for producing critical data on
the most productive Hot Sedimentary Aquifers in the Central Belt of Scotland
and could be used to significantly de-risk other HSA geothermal exploration
projects.
C10. Recycling some of the geothermal water to potable standards for use or sale
is worthy of further investigation. A flow rate of 15 l/s equates to 54 m3/h
which is a considerable volume to process, but filtering and chlorination may
be low energy and sufficient methods to produce potable water. Waters in
excess of 5000 s would need additional treatment at a cost of 5 –
10kW/m3per day. The Guardbridge site could provide the research focus to
advance technology in this area and develop the on-site and off-site
customer base, but some disposal-to-sea of treated water will be required,
dependent on flow rates and the volume of water that can be utilised or sold.
C11. Any progress to an exploration phase will most likely require an Environmental
Impact Statement and assessments from SNH and Fife Council, along with
planning permission approval and abstraction licenses from Fife Council and
SEPA, and permission to drill under any land that is not part of the
Guardbridge site.
98
14. RECOMMENDATIONS AND NEXT STEPS
The following recommendations arise from the feasibility project in terms of
developing a strategy for Phase 2 and for progressing the Guardbridge project to
the drilling stage. Although some indicative costs are provided for a non-invasive
geophysical survey, the EIA (if required) and the initial drilling stages, the detailed
scope of the project and specific costs associated with any engineering, stakeholder
engagement, financing and project management are not included, as they are
somewhat contingent on findings from the environmental assessments and initial
drilling results.
R1. The Guardbridge HSA Geothermal Heat Project should be progressed to the
next stage which is a Development in the Low Carbon Infrastructure Transition
Programme project. In this stage, the final business case, financing options and
business organisation will be developed. Whilst it has marginal economic value
at the end of the Catalyst stage, there are opportunities in the Development
stage to increase the project value through proving better aquifer delivery,
through cost reduction particularly with respect to locally sourced electricity
pricing for the heat pumps, and optimising the business model and financing
options with regard to different stakeholders. The Development stage will
probably include drilling to reduce uncertainty before committing to the capital
investment required for the District Heating Network. Alternatively, the DHN
may be built with initial heat source from the biomass plant assuming a later
progression once the geothermal heat source is available.
R2. Reduction of aquifer uncertainties requires a drilling programme. This is seen
as a three-stage programme: build a detailed case for drilling, including
decisions on whether test boreholes are going to add value; procure a rig and
complete detailed well planning and permitting; drill and test the well.
To progress the first phase, which is the decision to drill a well, there will be
several activities:
Conduct a non-invasive geophysical survey of Guardbridge and
surrounding area to attempt to remotely image the aquifer targets and
the fault geometry and thickness and reduce the uncertainty in well
trajectory for a deviated GB-2 well. Costs in the range of £10,000 will
provide these geophysical data. About three months would be required
to acquire, process and interpret the data.
At the same time, planning applications will be submitted to Fife Council
outlining the construction and completion phases of the geothermal
exploration. It is most likely that an Environment Impact Assessment will
be required before the project can progress to the site preparation and
drilling stage. Relevant license applications to SNH, Fife Council, as well
99
as SEPA, will be completed and, if deemed necessary, an Environmental
Impact Assessment will be completed. The time frame for this is a
minimum of 3 months at an approximate cost of about £30,000, but could
take longer and be more costly if more baseline data are required by Fife
Council and/or SNH. Permission to drill must be negotiated with any
landowners affected.
Revise the well trajectory based on increased geological knowledge and
understanding of directional drilling constraints at shallow depths.
Review available (offset) well data on rate of penetration, drilling fluid
and well control to better constrain design and costs.
Decide whether a “minerals” slant or a geotechnical rig and an exploration
borehole will add value or significantly reduce uncertainty in the final well.
This will depend on whether these lower cost approaches can provide
meaningful data on aquifer flow potential.
If an exploration well is decided, a rig will be procured, the well plan
completed and drilling undertaken assuming all permissions are in place.
Work to reach this stage will require at least six months and planning
costs in the range £30,000 to £50,000. A test bore will cost in the range
£100,000 to £450,000 depending on the objectives of the well and
necessary rig type.
Evaluate the results of the exploration well, including flow rate tests and
water chemistry, revise the final well design and optimse the well
completion design.
Note that the procurement and detailed well planning and permitting time for the
final production well has not been estimated as it would require a formal
organisational structure. This would form part of the activities of the project in its
Demonstrator Stage.
R3. The consortium involved in this feasibility report should be responsible for
Phase 2 work and the creation of a suitable ESCO or similar organisation would
occur at an early stage to take the project forward to execution and operation,
if decided.
R4. An economic model comparing re-injection costs (requiring a second well but
extending the life of the resource) against on-site water recycling (costs and
re-sale value) or disposal-to-sea (environmental concerns) is required in Phase
2, in order to finalise decisions on water management. Currently, the estimated
water treatment costs include development of a settling pond, and the CAPEX
and OPEX for filtration and chlorination (£350,000). Any disposal to sea of
treated water has to be approved by the competent authorities. Higher salinity
water may require reverse osmosis (vacuum membrane) treatment with higher
operational costs and results in a residual brine waste.
100
R5. Optimise CAPEX and OPEX assumptions in the project. In particular, the best
case in this study has highlighted the value added by accessing lower electricity
prices throughout the project’s life for heat pumps. This may be possible
through accessing the generating capacity of the Guardbridge project as new
energy sources come on line.
R6. Revision of the DHN design to accommodate any changes in the customer base
at Guardbridge would be made after a decision to complete the well is made,
and at that point more detailed plans and costings will be produced.
R7. Some of the geothermal water can be recycled on site to potable standards as
part of an geothermal heat and water recycling project, developing a circular
economy model for the resource. The on-site demand and re-sale potential
should be evaluated as part of Phase 2. The innovation centre and University
is well placed to advance research in streamlined water management for
geothermal projects.
101
15. REFERENCES
15.1 Published articles and reports
Armstrong M., Paterson I.B. and Browne M.A.E., 1985. Geology of the Perth and Dundeedistrict. London: Her Majesty’s Stationery Office.
Bates, C. R., Moore, C. G., Malthus, T., Mair, J. M. and Karpouzli, E. (2004). Broad scalemapping of habitats in the Firth of Tay and Eden Estuary, Scotland. Scottish NaturalHeritage Commissioned Report No. 007 (ROAME F01AA401D).
Baptie, B. 2010. Seismogenesis and state of stress in the UK. Tectonophysics 482: 150-159.
Browne M.A.E., Robins N.S., Evans R.B., Monro S.K., and Robson P.G., 1987. The UpperDevonian and Carboniferous sandstones of the Midland Valley of Scotland. Investigationof the Geothermal Potential of the UK. British Geological Survey Geothermal ResourcesProgram.
Browne M.A.E., Dean M.T., Hall I.H.S., McAdam A.D., Monro S.K. and Chishold J.I., 1999.A lithostratigraphical framework for the Carboniferous rocks of the Midland Valley ofScotland. British Geological Survey Research Report, RR/99/07.
Browne, M.A.E., Smith, R.A., and Aitken, A.M. (2002) Stratigraphical framework for theDevonian (Old Red Sandstone) rocks of Scotland south of a line from Fort Willam toAberdeen. British Geological Survey Research Report, RR/01/04. 67 pp.
Cherubini, Y, Cacace, M. Scheck-Wenderoth, M, and Noack, V (2014) Influence of majorfault zones on 3-D coupled fluid and heat transport for the Brandenburg region (NEGerman Basin). Geoth. Energ. Sci., 2, 1–20.
Childs C., Manzocchi T., Walsh J.J., Bonson C.G., Nicol A. and Schopfer M.P.J., 2009. Ageometric model of fault zone and fault rock thickness variation. Journal of StructuralGeology, 31, pp. 118 – 127.
Diersch, H.-J.G.: FEFLOW finite element subsurface flow and transport simulation system,Reference Manual, User’s Manual and White Papers Vol. I, II, III, IV, WASY – Institutefor Water Resources Planning and Systems Research, Berlin (2005).
Foster S S D, Stirling W G N and Paterson I B 1976. Groundwater storage in Fife andKinross – its potential as a regional resource. Rep. Inst. Geol. Sci., No 76/9, 21pp.
Gaus I, Ó Dochartaigh BÉ (2000) Conceptual modelling of data-scarce aquifers in Scotland:the sandstone aquifers of Fife and Dumfries Geological Society, London, SpecialPublications 182:157-168 doi:10.1144/gsl.sp.2000.182.01.15
Gillespie M.R., Crane E.J. and Barron H.F., 2013. Deep geothermal energy potential inScotland. British Geological Survey Commissioned Report, CR/12/131.
Heffer, K. and Lean, J. (1993) Earth stress orientation a control on, and guide to, floodingdirectionality in a majority of reservoirs. Pp. 799822 in: Reservoir Characterization III(W. Linville, editor). PennWell Books, Tulsa, Oklahoma, USA.
Heidbach, O., Tingay, M., Bath, A., Reinecker, J., Kurfess, D. & Muller, B. 2008. The WorldStress Map database release 2008. DOI 10.1594/GFZ.WSM.Rel2008
Laubach, S.E., Olson, J.E. and Gale, J.F.W. (2004) Are open fractures necessarily alignedwith maximum horizontal stress? Earth and Planetary Science Letters, 222, 191195.
Macdonald, A.M., Ball, D.F. and Ó Dochartaigh, B.É. (2004) A GIS of aquifer productivity inScotland: explanatory notes. BGS Commissioned Report CR/04/047N.
Macdonald, A.M., Darling, W.G., Ball, D.F. and Oster H. (2003) Identifying trends ingroundwater quality using residence time indicators: an example from the Dumfriesbasin, Scotland. Hydrogeology Journal 11: 504-517.
McCoss A.M, 1987. Geometry and Kinematics of Transpression and Transtension. A thesissubmitted for the Degree of Doctor of Philosophy of the Faculty of Science, Queen’sUniversity of Belfast.
Ó Dochartaigh B.É.. 2004. The physical properties of the Upper Devonian/LowerCarboniferous aquifer in Fife. BGS Internal Report IR/04/003.
Ó Dochartaigh, B.É., Ball D.F., Browne M.A.E., Shand P., MacDonald A.M., Robins, N.S.,and McNeill, G.W. (1999) The Upper Devonian Sandstone Aquifer of Fife BritishGeological Survey Report WD/99/39.
102
Ó Dochartaigh, B.É., Macdonald, A.M., Fitzsimons, V., and Ward, R. (2015). Scotland'saquifers and groundwater bodies. British Geological Survey Open Report, OR/15/028.76pp.
Ó Dochartaigh, B.É., Smedley, P.L., Macdonald, A.M., and Darling, W.G. (2006) BaselineScotland: the Lower Devonian aquifer of Strathmore. British Geological SurveyCommissioned Report, CR/06/250N. 60pp.
NERC, 2015. BGS Lexicon of Named Rock Units. Available at:http://www.bgs.ac.uk/lexicon/lexicon.cfm?pub=KPF (Accessed 31/08/15).
Rogers, S.F. (2003) Critical stress-related permeability in fractured rocks. Pp. 716 in:Fracture and In-situ Stress Characterization of Hydrocarbon Reservoirs (M. Ameen,editor) Geological Society, London.
Rogers, S.F. and Evans, C.J. (2002) Stress-dependent flow in fractured Rocks at Sellafield,United Kingdom. Pp. 241250 in: Geological Applications of Well Logs (M. Lovell and N.Parkinson, editors). AAPG Methods in Exploration No. 13. The American Association ofPetroleum Geologists, Tulsa, Oklahoma, USA.
Sathat, S; Reeves, H.J., Cuss, R.J. and Harrington. J.F. (2012), The role of stress historyon the flow of fluids through Fractures, Mineralogical Magazine, December 2012, Vol.76(8), pp. 3165–3177
Shell, P.J. 2002. Depositional and stratigraphic framework of the VIsean of Fife and theCentral North Sea. A thesis submitted as part of the PhD in Geoscience degree, Universityof St Andrews.
Spears, B.M., Saunders, J.E., Davidson, I., and Paterson, D.M. (2008) Microalgal sedimentbiostabilisation along a salinity gradient in the Eden Estuary, Scotland: unravelling aparadox. Marine and Freshwater Research, 59, 313-321.
15.2 Guidance and regulatory documents
Regulatory Guidance: Geothermal Heat in Scotland
http://www.gov.scot/Resource/0049/00493200.pdf
The Water Environment (Controlled Activities) (Scotland) Regulations 2011 (as
amended) http://www.sepa.org.uk/regulations/water/
Scottish National Planning Framework 3
http://www.gov.scot/Publications/2014/06/3539/downloads
http://www.gov.scot/Resource/0049/00493200.pdf
Conservation (Natural Habitats, &c.) Regulations 1994, as amended – guidance
http://www.snh.gov.uk/protecting-scotlands-nature/protected-areas/international-
designations/natura-sites/
Natura sites and the Habitats Regulations - How to consider proposals affecting
Special Areas of Conservation and Special Protection Areas in Scotland
http://www.snh.gov.uk/publications-data-and-research/publications/search-the-
catalogue/publication-detail/?id=1364
DECC Report: Updated Energy and Emissions Projects 2015
https://www.gov.uk/government/uploads/system/uploads/attachment_data/file/5
01292/eepReport2015_160205.pdf
Biomass Energy Centre
http://www.biomassenergycentre.org.uk

w w w . g o v . s c o t
© Crown copyright 2016
This publication is licensed under the terms of the Open Government Licence v3.0 except where otherwise stated. To view this licence, visit nationalarchives.gov.uk/doc/open-government-licence/version/3 or write to the Information Policy Team, The National Archives, Kew, London TW9 4DU, or email: [email protected].
Where we have identified any third party copyright information you will need to obtain permission from the copyright holders concerned.
This publication is available at www.gov.scot
Any enquiries regarding this publication should be sent to us at The Scottish GovernmentSt Andrew’s HouseEdinburghEH1 3DG
ISBN: 978-1-78652-129-3 (web only)
Published by The Scottish Government, March 2016
Produced for The Scottish Government by APS Group Scotland, 21 Tennant Street, Edinburgh EH6 5NAPPDAS67484 (03/16)