Embed Size (px)
Citation preview
SCOUR AND BANK MIGRATION
Prepared for/\
\/
NORTHWEST ALASKAN PIPELINE COMPANY
By
Northern Technical Services
/1
1r
November 1981
/4
TABLE OF CONTENTS
Section
LO SCOUR DEPTH ESTIMATION
1. Introduction
2.0 REVIEW OF SCOUR ESTIMATION METHODS
2.1 General Scour2.1.1 Evidence of Historic Scour Limits2.1.2 Regime Method2.1.3 Mathematical Modelling2.2 Local Scour
3.0 SCOUR DEPTH ESTIMATION METHODOLOGY
3.1 Flow Chart3.2 Special Cases3.2.1 Alluvial Fans3.2.2 Multiple Channels3.2.3 Icings and Aufeis3.2.4 Floodplain Scour3.2.5 Unclassified Streams
4.0 SCOUR ESTIMATION FORMULATION
4.1 General Scour4.11 Regime Theory4.1.2 Mathematical Modelling 104.2 Local Scour 114.2.1 Scour at Bridge Piers 114.2.2 Scour at Spur Dikes and Guide Banks 13
5.0 BASIC DATA REQUIREMENTS AND PREPARATION 15
5.1 General Scour 155.1.1 Historic Scour Limit Data 155.1.2 Regime Method Data 155.1.3 Mathematical Model Data 155.1.4 Bed Material Data Collection Methodology 155.2 Local Scour 175.2.1 Bridge Pier Data 175.2.2 Spur Dikes and Guide Bank Data 17
TABLE OF CONTENTS Continued
Section Page
6.0 BANK MIGRATION ESTIMATION 18
6.1 Introduction 186.2 Aerial Photography Interpretation 186.3 On-Site Bank Evaluation 20
7.0 SCOUR DEPTH ESTIMATION AND BANK MIGRATIONEXAMPLE 21
7.1 Scour Estimation 2172 Bank Migration Estimation 23
8.0 REFERENCES 25
LIST OF TABLES
Table No Table Page
Recommended Factors for RegimeMethod Application
Values of the Laceys Silt Factor
Recommended Factors for Pier NoseShapes 12
Multiplying Factors for Depth of Scour atSkewed Piers 13
LIST OF FIGURES
Figure No Figure Page
Scour Depth Estimation Flow Chart
Slope-dr/D50 Relation for Flow inAlluvial Channels at Various Valuesof BedLoad Charge
Bank Migration Estimation Flow Chart 19
Bed Material Gradation CurveUpper Tanana River Crossing 22
Lateral Bank Migration PhotoComparison Upper Tanana RiverCrossing 24
1.0 SCOUR DEPTH ESTIMATION
11 INTRODUCTION
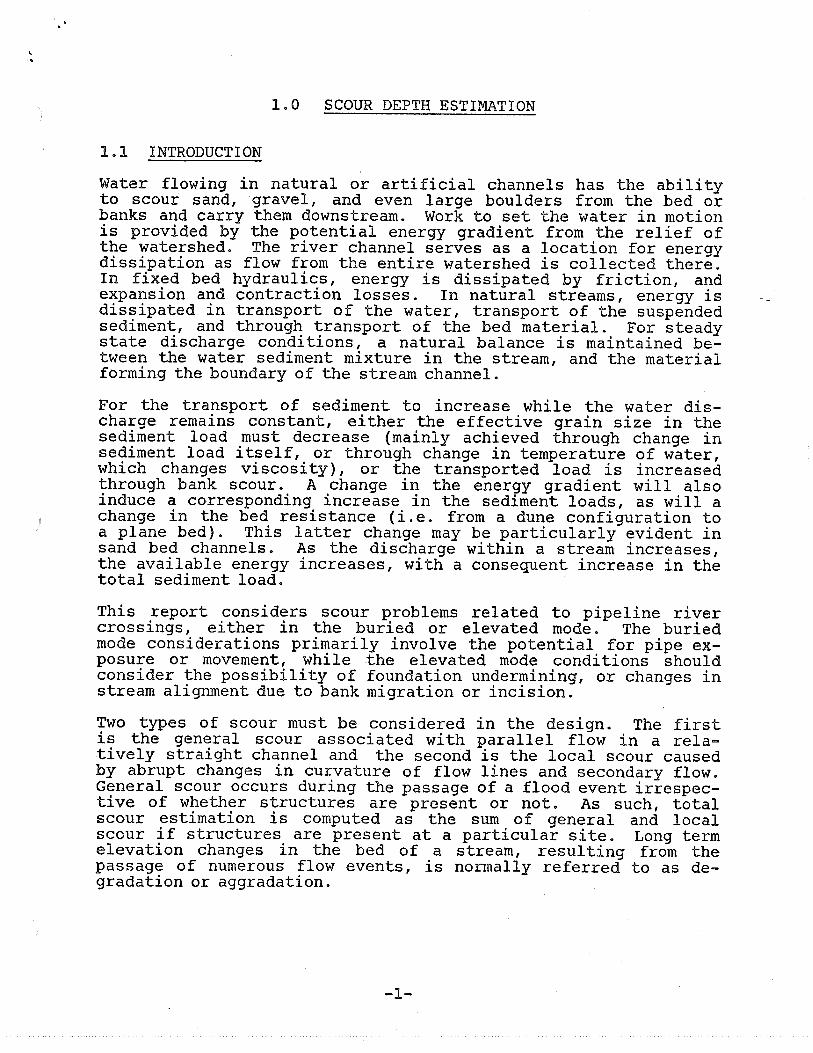
Water flowing in natural or artificial channels has the abilityto scour sand gravel and even large boulders from the bed orbanks and carry them downstream Work to set the water in motionis provided by the potential energy gradient from the relief ofthe watershed The river channel serves as location for energydissipation as flow from the entire watershed is collected thereIn fixed bed hydraulics energy is dissipated by friction andexpansion and contraction losses In natural streams energy is
dissipated in transport of the water transport of the suspendedsediment and through transport of the bed material For steadystate discharge conditions natural balance is maintained between the water sediment mixture in the stream and the materialforming the boundary of the stream channel
For the transport of sediment to increase while the water discharge remains constant either the effective grain size in thesediment load must decrease mainly achieved through change insediment load itself or through change in temperature of waterwhich changes viscosity or the transported load is increasedthrough bank scour change in the energy gradient will alsoinduce corresponding increase in the sediment loads as willchange in the bed resistance i.e from dune configuration to
plane bed This latter change may be particularly evident insand bed channels As the discharge within stream increasesthe available energy increases with consequent increase in thetotal sediment load
This report considers scour problems related to pipeline rivercrossings either in the buried or elevated mode The buriedmode considerations primarily involve the potential for pipe exposure or movement while the elevated mode conditions shouldconsider the possibility of foundation undermining or changes instream alignment due to bank migration or incision
Two types of scour must be considered in the design The firstis the general scour associated with parallel flow in relatively straight channel and the second is the local scour causedby abrupt changes in curvature of flow lines and secondary flowGeneral scour occurs during the passage of flood event irrespective of whether structures are present or not As such totalscour estimation is computed as the sum of general and localscour if structures are present at particular site Long termelevation changes in the bed of stream resulting from thepassage of numerous flow events is normally referred to as degradation or aggradation
2.0 REVIEW OF SCOUR ESTIMATION METHODS
2. GENERAL SCOUR
Many difficulties exist in the analytical definition of the processes delineating sediment transport and consequent scour depthestimation These difficulties arise from the large number ofinterrelated variables affecting the behavior of stream channelsBecause of this complexity no single method for estimating scourcan be considered totally definitive An estimate should be madefrom an evaluation of the independent methods which are outlinedin the following sections Not all methods will apply to everystream and the method most applicable for the stream should bemore heavily weighed in the estimation of scour
2.1.1 Evidence of Historic Scour Limits
The most reliable estimates of scour may be obtained from coimparison of cross section profiles collected during high flowevents Unfortunately very little data of this nature existand flood stage cross section profiles are usually only availableif discharge measurements have been made at the time of theevent
Evidence of scour limits may also be found with the occurence oforganic material found in borehole logs alteration of mineralsin the alluvium and the occurence of armour layers in boreholelogs and test pits Data of this nature should be investigatedin estimation of scour at stream crossings
2.1.2 Regime Method
Channels constructed in alluvium tend to adjust their boundariesuntil stable relation involving depth bed material and ve1oc-ity of flow is obtained Canals that achieve this state are saidto be in regime Engineers attempting to apply this relation tonatural streams found that the major difference between naturalstream and an irrigation canal is that whereas in natural streamsflows are highly variable irrigation canals tend to operate atfixed discharge Application of the regime method necessitatesthe use of empirical judgement on behalf of the engineer and ingeneral is only applicable to flows with low Froude numbersusually within the ripple to dune flow regime
2.1.3 Mathematical Modelling
During the last decade computer oriented water/sediment routingmodels have been developed to assist in the delineation of theinteraction between suspended sediment bed material movementwater velocity and flow depth These models which consider
stream reach in preference to single location and may be operated to route complete hydrographs generally require far moreextensive data and computer time than alternate methods Thesemodels are most applicable to the study of long term aggradationor degradation in streams and in the estimation of bed elevationchanges resulting from encroachments within floodplains or streambed modification
In conjunction with the large data requirements for execution ofthese models empirical flow data and aggradation or degradationmeasurements are required to calibrate and verify the model priorto its use in estimating future bed elevation changes
2.2 Local Scour
Local scour occurs in non-uniform flow regions where the watersediment mixture is accelerated or decelerated The major causesof local scour are the fluctuations of forces such as pressurelift and shear
Local scour is function of many factors such as the channelslope channel cross section bed material transported sediments flow direction and duration ice logs man-made hydraulicstructures etc The number and complexity of these factors haveled to the development of experimental and theoretical approximations
Some of the methods described in Section 2.1 can also be used topredict scour in limited contraction
3.0 SCOUR DEPTH ESTIMATION METHODOLOGY
This section describes the procedures used for estimation ofscour depth at particular location in stream In additionvarious approaches to scour have been described for specialcases
3.1 Flow Chart
From the flow chart given in Figire the first step is to define the stream as an alluvial fan braided split channelmeandering or sinuous stream The second step is to classify thestream as major or minor stream major stream has pipelinedesign flood greater than or equal to 10000 cfs while minorstream has pipeline design flood less than 10000 cfs andgreater than or equal to 1000 cfs The next step is to evaluatehistoric scour limits from surveyed cross section data and borehole logs The next step is to determine the hydraulic parameters of the cross section for which scour is to be computedGeneral scour is then computed in the main channel and on thefloodplain if applicable If structures are present localscour is computed and added to general scour to determine thetotal scour at location The total scour is then compared withhistoric scour limits if available and the Z1 factors aremodified if necessary
3.2 Special Cases
3.2.1 Alluvial Fans
Scour and bank migration on alluvial fans may occur under twoindependent modes Within the fan itself there is possibilitythat channel switching may occur as most alluvial fan streamsare perched However general or local scour is usually not significant as alluvial fans are in an aggrading mode
If the downstream channel is extremely unstable there is pos-sibility that lateral bank movement may shift into the alluvialfan changing the bed slope of the fan stream and consequentlyinducing extensive headcutting The main channel will be evalu-ated morphologically to ascertain the probability of this occur.ring and if necessary remedial measures recommended to preventheadcutting If no alternative crossing locations are availableon the fan the worst case scenario of head-cutting and theresulting stabilized new stream bed elevation under the conditionof most lateral bank migration shall be used as the designcriteria for scour

IN OTTO
nos ORALMNG/DOCUMENT ES THE PNOPNRTT CO TNT ALASLAN REOTTATWERT OLJR.ACI TO MANNATOTY DISO..OSOTE LINDEN TilT FREENCU OF RL000MATH001
NATURAl GAS TOANSPONTUflON COMPANY GIlD CONTAINS INFONUANOS THAT ACT ANN USE ON DISCLOSURE 04 INYOTIJAYIOTL CONTA/NED INTILLS DRAINING/
ESTEEMED TORE COSFIOENT1AL ANT/ON PNOPTATANY OH SA/D COMPANY DIEOH DOCUMENT MAY ALSO OR PHOAIOITDO IT MOTILE OF APPUCLOAL LAWS SUCH AZ
TN/RD PANTIES WHO POTS/A/LEO RELICT OLFONMATION TO THEE COLJPOEY YET FEDERAL TRADE RECALlS ACT NO USE OR DISCLOSURE IS ALJTFEOHL000
PURSUANT TO A/CEASE ON LISA AGREEMENT ISFOAEAATLOH COOLTALSLD NO THUS EXCEPT AU PEOO.NlTRD ST SALT COMOANT ON ITS AGENT NODHEEWNOT ULAZZAFI
ONALA/SG/OOCUUEILH LUILICN IS CONFIDENT/AL USD00 PUOPTIETART IN ROT PTPTLRLE COMPANY
STREAM TY
_____ ____FAN BRAIDED cHANNEi1 LMEANoEJ SiNUOUS
_____FcLAssY3TFI
STREAM MAJOR STREAM
EVALUATE FSSTOfiC SCOUR LJMJT EVALUATE-HISTORIC SCOUR LSMTS
IT ESTSI4ATE BANK FU.L DISCHARGE /DATA BIFUT
FROM FIELD OSSERVAflONSCROSS ECTONAL DATA
FL0O DISCHARGES
MAME4GS ROUGHNESS COEFFICIENTS
O4AiNCHANNELAIIDOVEREAME
REACH LENGTHS
CONDUCT BACKWATER ANALYSE
DETERMINE HYDRAUUC PARAMETERS
COMPUTE GENERAL SCOUR DETERMINE HYDRAUliC PARAMETERS
iN MAiN CHAIEL ON P1000 P151
COMPUTE GENERAL SCOUR ON
P1000 PLAM AND IN WiN CIWS/El
__ YES_____ NO
COMPUTE LOCAL SCOUR
OF3TRUCIURE
Sm___________________
COMIHUTETOTALSCOI.RNO
GENERAL SCOURLOCAL 8COLR__________HU _________
AL
-1 ___________ ___________
COMPARE E8TS.ATED 5OCt51
WITh HISTORIC SCOUR
5Cflo __________-.lMOO1FY FACTORS NECESSARY
AO ____
0-0 NON
1N ._4
O4IN
3.2.2 Multiple Channels
If multiple channels exist under the design flood conditions themaximum stage recorded shall be used for the computation of scourdepth At locations where the pipeline will be placed adjacentto channel other then the main channel scour computations willbe conducted at this channel also
32.3 Icings and Aufeis
The effect of ice upon the stream especially the effects uponbank erosion during breakup events can be the most influentialfactor in significant stream morphological changes All generaland local scour estimates will be made in conjunction with observed aufeis and icing conditions at the site Ice induced bankerosion shall also be assessed during the bank migration evaluation
3.2.4 Floodplain Scour
If following the backwater analysis overbank flow occurs theoverbank flow depths will be evaluated in conjunction with theassociated velocities to determine if detrimental erosion islikely to occur on the floodplain
3.2.5 Unclassified Streams
For small unclassified streams scour depth estimation shall bemade from evaluation of historic data and an estimation of thebank full discharge from field observation Estimated scourshall then be computed at the maximum depth section using esti-mated bed material sizes from field observation
If structures are present at the site the possible effect of thecrossing upon the structure and vice versa shall be evaluatedqualitatively and from any historic data available at the site
6--
4.0 SCOUR ESTIMATION FORMULATION
4.1 GENERAL SCOUR
4.1.1 Regime Theory
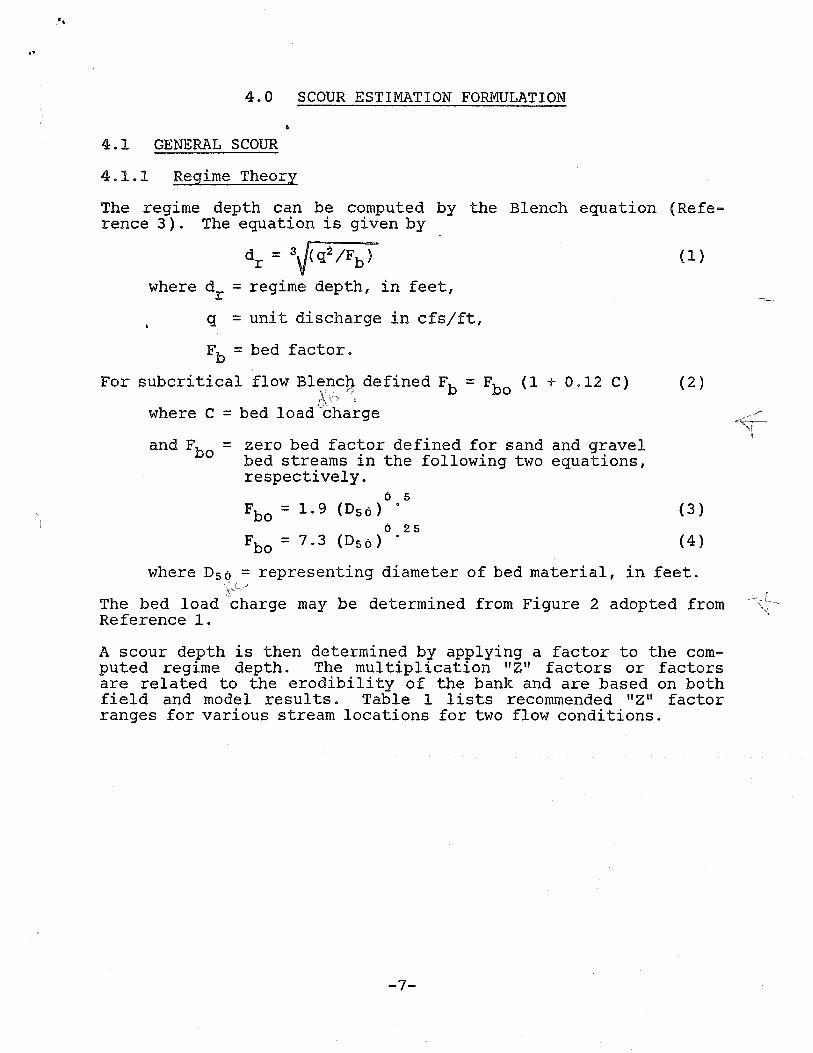
The regime depth can be computed by the Blench equation Refe-rence The equation is given by
dr3\/2bwhere dr regime depth in feet
unit discharge in cfs/ft
Fb bed factor
For subcritical flow Blench defined Fb Fbo 0.12
where bed load charge
and FbQ zero bed factor defined for sand and gravelbed streams in the following two equationsrespectively
O5Fbo 1.9 D50
25
Fbo ID50
where ID50 representing diameter of bed material in feet
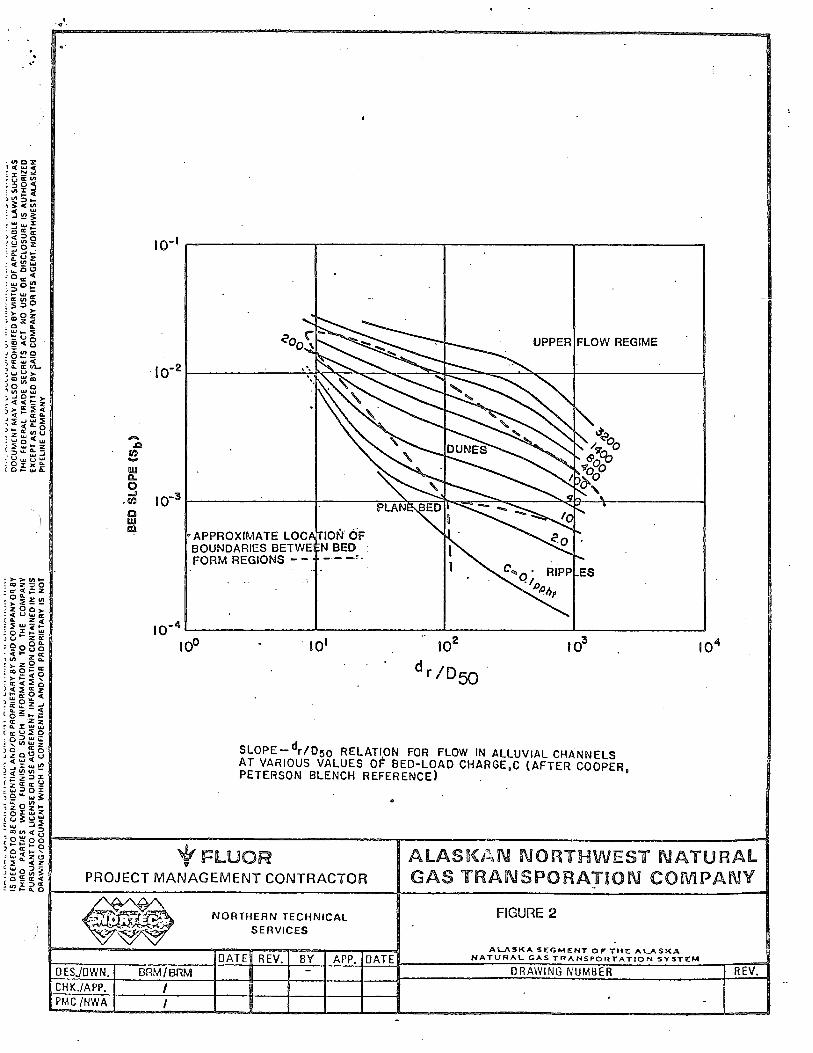
The bed load charge may be determined from Figure adopted fromReference
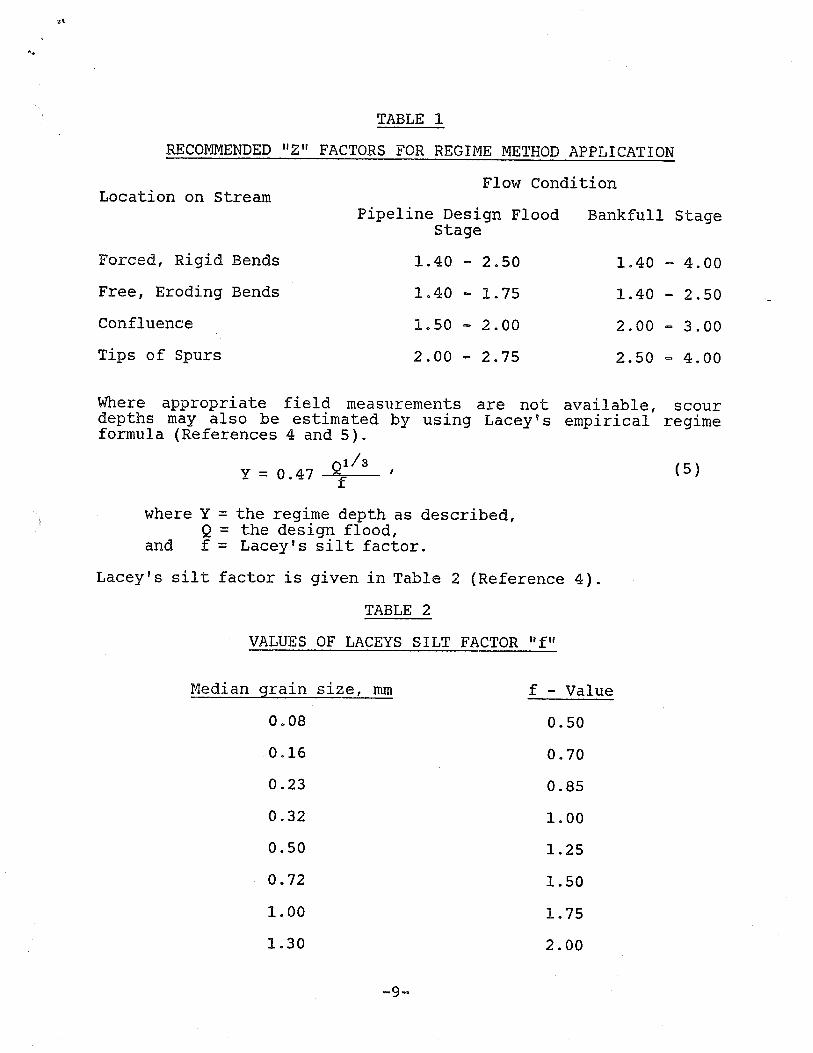
scour depth is then determined by applying factor to the computed regime depth The multiplication factors or factorsare related to the erodibility of the bank and are based on bothfield and model results Table lists recommended factor
ranges for various stream locations for two flow conditions
7..
D0l0
UPPER FLOW REGIME
-2 __________ __________ ________________ ______ ______ ______
__________ __________oo________
Cl
PLAN\APPROXIMATE LOCd ION OFBOUNDARIES BETWE BEDFORM REGIONS
RIPP ES
IE100 101 10 10 IO
ZZ
SLOPE_dr/D50 RELATION FOR FLOW IN ALLUVIAL CHANNELSAT VARIOUS VALUES Ol BED-LOAD CHARGE1C AFTER COOPERPETERSON BLENCH REFERENCE
cut
frFLUOR ALASKAN NORTHWEST NATURALPROJECT MANAGEMENT CONTRACTOR GAS TRANSPORA1ON COMPANY
NORTHERN TECHNICAL FIGURE
SERVICES
ALASKA SEGMENT THE ALASKADATE REV BY APP DATE NATURAL GAS TRANSPORTATTON SYSTEM
SJDWN.BRM/BRM -fDRAWING NUMBER
TABLE
RECONIIENDED HZ FACTORS FOR REGIME METHOD APPLICATION
Flow ConditionLocation on Stream
Pipeline Design Flood Bankfull StageStage
Forced Rigid Bends 1.40 2.50 1.40 4.00
Free Eroding Bends 1.40 1.75 1.40 2.50
Confluence 1.50 2.00 2.00 3.00
Tips of Spurs 2.00 2.75 2.50 4.00
Where appropriate field measurements are not available scourdepths may also be estimated by using Laceys empirical regimeformula References and
_____Y0.47
where the regime depth as describedthe design flood
and Laceys silt factor
Laceyvs silt factor is given in Table Reference
TABLE
VALUES OF LACEYS SILT FACTOR ft
Median grain size mm Value
0.08 0.50
0.16 0.70
0.23 0.85
0.32 1.00
0.50 1.25
072 1.50
1.00 1.75
1.30 2.00
9.-
Equation provides only the regime depth To estimate scourdepth multiplying factor should be applied as in Blenchsmethod The formula equation is only applicable to sand bedmaterial and it may tend to overestimate scour depth in coarsermaterials
Very little literature is available summarizing appropriatefactor values for different stream types bed material types andactual locations within the stream As such estimation of thefactors requires extensive in-field application experience on behalf of the engineer using the regime methodology and asmentioned previously scour depth estimations from the regimeequations shall be compared to any historical data availableand to the computed scour resulting from the water/sedimentrouting model applied to major streams Also normal depth orHEC-2 will be used for determination of flood elevations andother hydraulic parameters at the particular cross sectionNote should be made that both of these methods assume rigidboundary conditions and HEC-2 may not be applicable at flowregimes approaching the critical range in which case normaldepth computations shall be used
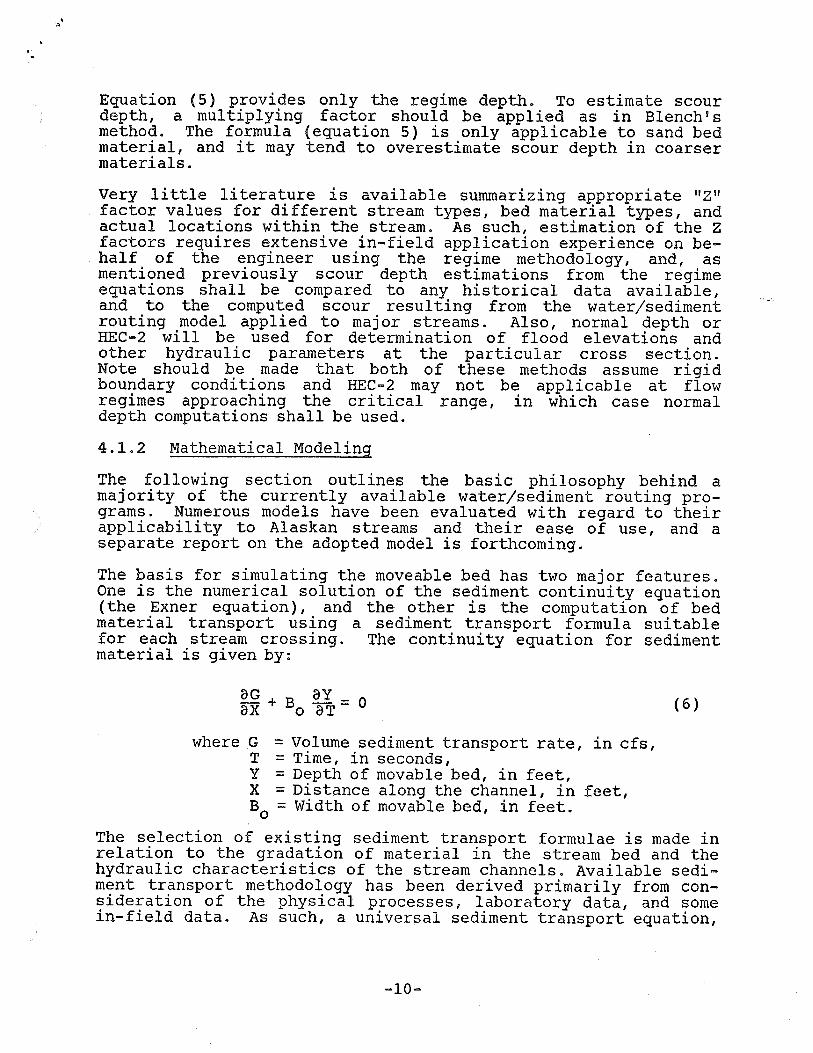
4.1.2 Mathematical Modeling
The following section outlines the basic philosophy behindmajority of the currently available water/sediment routing programs Numerous models have been evaluated with regard to theirapplicability to Alaskan streams and their ease of use andseparate report on the adopted model is forthcoming
The basis for simulating the moveable bed has two major featuresOne is the numerical solution of the sediment continuity equationthe Exner equation and the other is the computation of bedmaterial transport using sediment transport formula suitablefor each stream crossing The continuity equation for sedimentmaterial is given by
ax oaT
where Volume sediment transport rate in cfsTime in secondsDepth of movable bed in feetDistance along the channel in feet
B0 Width of movable bed in feet
The selection of existing sediment transport formulae is made inrelation to the gradation of material in the stream bed and thehydraulic characteristics of the stream channels Available sediment transport methodology has been derived primarily from consideration of the physical processes laboratory data and somein-field data As such universal sediment transport equation
to cover the broad range of scour computation from gravel bed tosand-bed alluvial streams is not possible at present Forgravel beds the Meyer-Peter Mueller method is recommended Forsand-bed streams the Einstein Modified Einstein Colby orToffaletti method will be integrated into the sediment routingmodel for delineated discharges
4.2 LOCAL SCOUR
4.2.1 Scour at Bridge Piers
Local scour at bridge piers is caused by the development of vortex systems at the pier At the upstream nose of the piervortex with horizontal axis is developed and wraps around thebase of the pier Downstream of the pier wake vortex systemwith vertical axis is developed as result of blockage of flowby the pier These vortex systems account for the development ofscour holes at the base of bridge piers on the upstream and downstream sides of the pier
The strength of these vortex systems is largely function of thepier shape at the upstream and downstream faces streamlinedpier will reduce the strength of these vortices and thereby reduce the amount of local scour that occurs at the pier
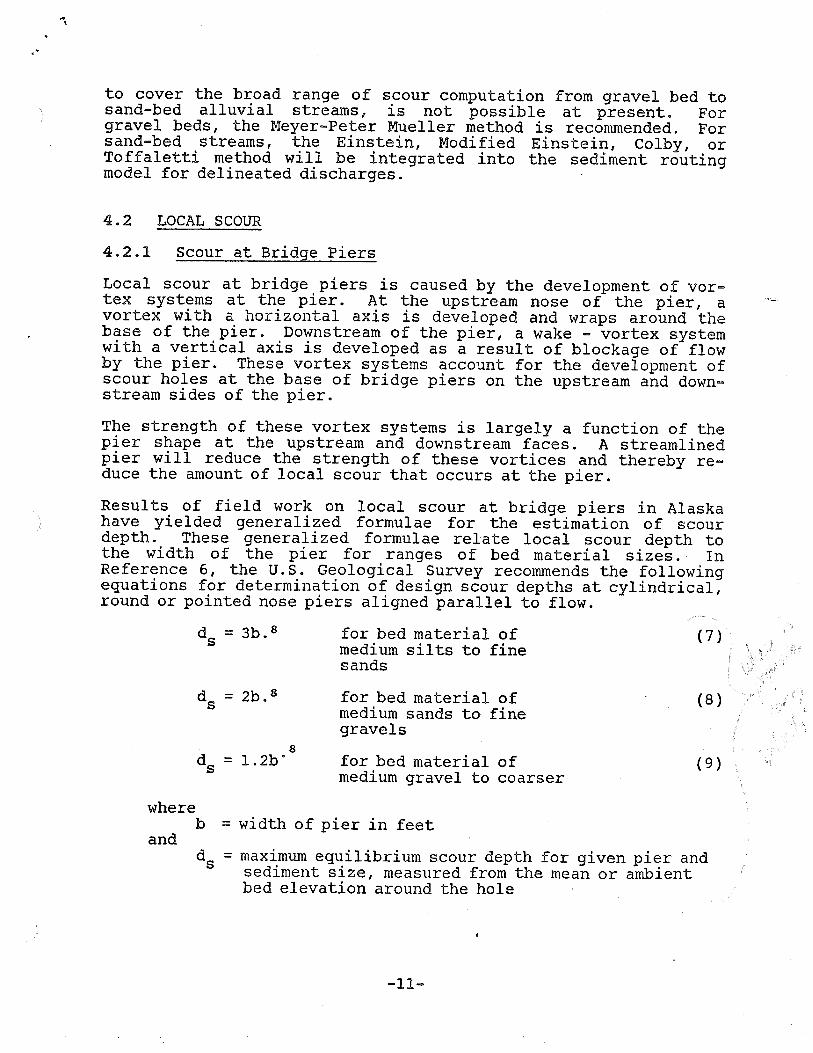
Results of field work on local scour at bridge piers in Alaskahave yielded generalized formulae for the estimation of scourdepth These generalized formulae relate local scour depth tothe width of the pier for ranges of bed material sizes InReference the U.S Geological Survey recommends the followingequations for determination of design scour depths at cylindricalround or pointed nose piers aligned parallel to flow
3b for bed material ofmedium silts to finesands
d5 2b for bed material ofmedium sands to finegravels
l.2b for bed material ofmedium gravel to coarser
wherewidth of pier in feet
and
d5maximum equilibrium scour depth for given pier andsediment size measured from the mean or ambientbed elevation around the hole
11
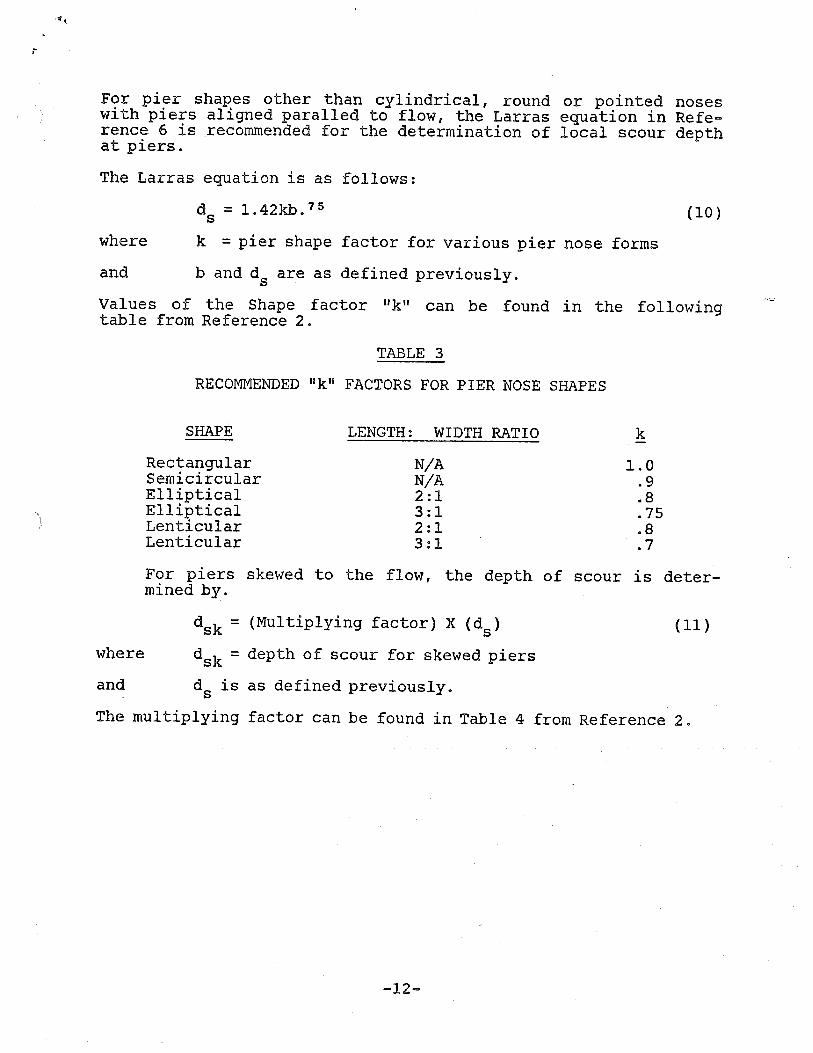
For pier shapes other than cylindrical round or pointed noseswith piers aligned paralled to flow the Larras equation in Reference is recommended for the determination of local scour depthat piers
The Larras equation is as follows
1.42kb.75 10where pier shape factor for various pier nose forms
and and d5 are as defined previously
Values of the Shape factor can be found in the followingtable from Reference
TABLE
RECONNENDED FACTORS FOR PIER NOSE SHAPES
SHAPE LENGTH WIDTH RATIO
Rectangular N/A 1.0Semicircular N/A .9
Elliptical 21 .8
Elliptical 31 .75Lenticular 21 .8Lenticular 31 .7
For piers skewed to the flow the depth of scour is deter.mined by
dsk Multiplying factor d5 11where dsk depth of scour for skewed piers
andd5
is as defined previously
The multiplying factor can be found in Table from Reference
12
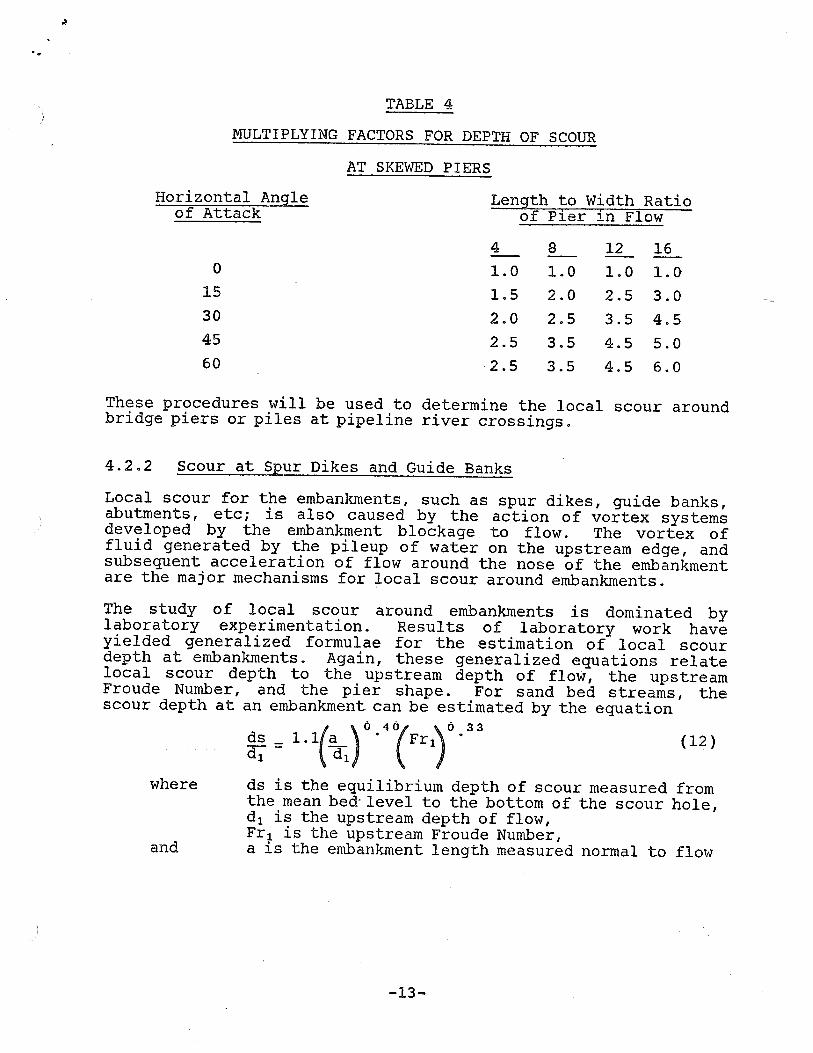
TABLE
IVIJLTIPLYING FACTORS FOR DEPTH OF SCOUR
AT SKEWED PIERS
Horizontal Angle Length to Width Ratioof Attack of Pier in Flow
12 16
1.0 1.0 1.0 1.0
15 1.5 2.0 2.5 3.0
30 2.0 2.5 3.5 4.5
45 2.5 3.5 4.5 5.0
60 2.5 3.5 4.5 6.0
These procedures will be used to determine the local scour aroundbridge piers or piles at pipeline river crossings
4.2.2 Scour at Spur Dikes and Guide Banks
Local scour for the enthankments such as spur dikes guide banksabutments etc is also caused by the action of vortex systemsdeveloped by the embankment blockage to flow The vortex offluid generated by the pileup of water on the upstream edge andsubsequent acceleration of flow around the nose of the embankmentare the major mechanisms for local scour around embankmØnts
The study of local scour around enthankments is dominated bylaboratory experimentation Results of laboratory work haveyielded generalized formulae for the estimation of local scourdepth at embankments Again these generalized equations relatelocal scour depth to the upstream depth of flow the upstreamFroude Number and the pier shape For sand bed streams thescour depth at an embankment can be estimated by the equation
4Ojds_ 1.la Fr1\ 12
where ds is the equilibrium depth of scour measured fromthe mean bed level to the bottom of the scour holed1 is the upstream depth of flowFr1 is the upstream Froude Number
and is the embankment length measured normal to flow
l3
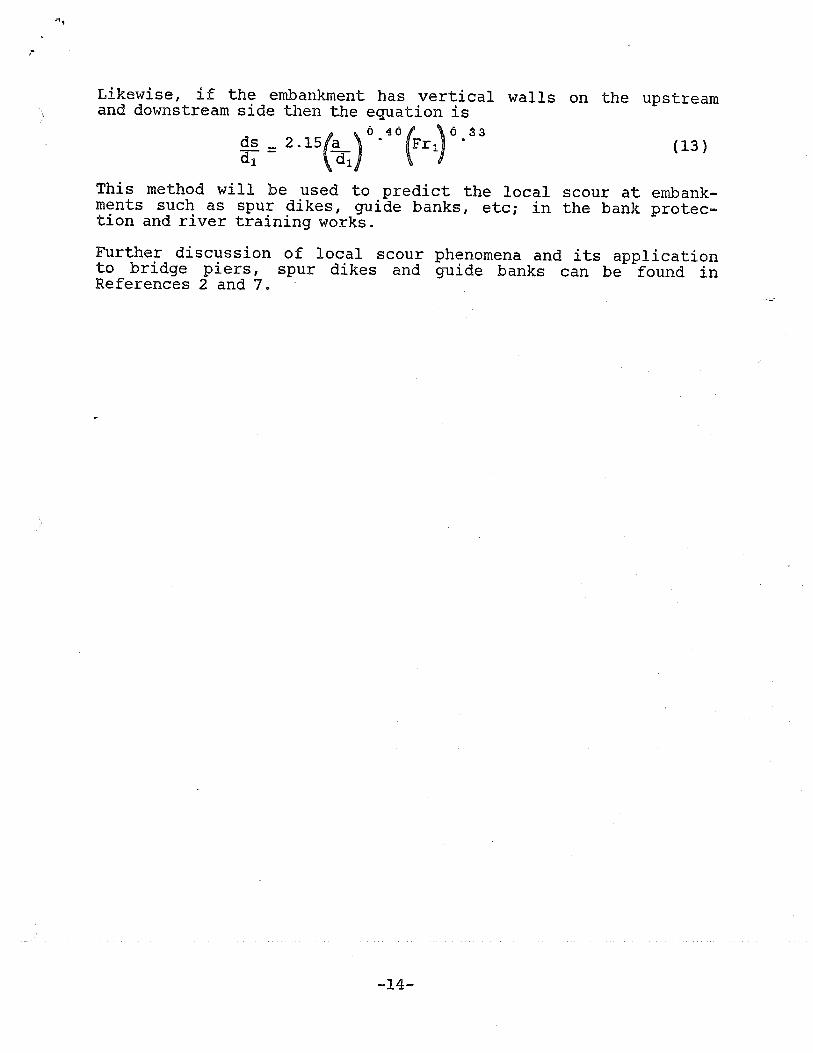
Likewise if the embankment has vertical walls on the upstreamand downstream side then the equation is
4Ofds 2.l5a Fr1 13d1 d1J
This method will be used to predict the local scour at embankments such as spur dikes guide banks etc in the bank protection and river training works
Further discussion of local scour phenomena and its applicationto bridge piers spur dikes and guide banks can be found inReferences and
5.0 BASIC DATA REQUIREMENTS AND PREPARATION
GENERAL COUR
5.1.1 Historic Scour Limit Data
Basic data requirements for this evaluation method requires comparative cross sections or depth soundings recorded during bothlow flow and high flow conditions Borehole logs and exploratory geologic data will also assist in determining past bed elevations and consequential scour depth
5.1.2 Regime Method Data
Primary data requirements include the general hydraulic crosssection parameters including velocities and maximum depthsThe design discharge and peak unit width discharges are alsorequired together with size gradations of the bed material Theselection of appropriate factors requires considerable experience in river engineering hydraulics and design
5.1.3 Mathematical Model Data
The following is basic summary of data requirements for scourestimation using mathematical models complete description ofdata collection techniques and preparation for the model may befound in the forthcoming report specifically addressing modeluse
Basic data for water/sediment routing models include
Initial channel geometry including detailed description of natural levees along the channel
Gradation of suspended load and streanthed material
Water discharge hydrograph
Water temperature
Suspended sediment data
5.1.4 Bed Material Data Collection Methodology
The regime method and mathematical model both require as inputthe d50 and d9 of the bed material The d50 is defined as thediameter of sediment particles for which 50% are finer Reference The is defined as the diameter of sediment particlesfor which 90% are finer Reference To determine the size ofd50 and d90 samples of the bed material must be obtained from
15
the study area and analyzed by sieve analysis Standard laboratory procedures should be used when conducting laboratory sieveanlaysis Samples must be obtained from the bed of the river in
manner as to provide samples which represent the actual composition of the river bed Therefore the following methods havebeen developed
For Shallow WADEABLE Streams
Whenever possible samples should be taken at locationsequally spaced across the stream If the stream has maximum water surface width less than 40 feet one sample onthe thalweg will be sufficient Samples should be taken atcross-sections on or near the alignment one upstream andone downstream
Silt and Sand Bed Streams
Samples should be collected using 2-inch suctionsampler with the entire sample being analyzed usingsieve analysis techniques
Coarse Sand to Gravel Bed Streams
Attempt initially to use the suction sampler If thematerial will not remain in the sampler and very fewfines are present the soil auger may be used thoughthe finer material may be lost during extraction Ifthis is the case bucket sample should be taken from
low velocity section of the stream if necessary awayfrom the thalweg
Cobble to boulder bed streams
Prior to sampling test hole should be dug at thewater surface edge to determine if the bed surface isan armour layer If finer material exists under thebed surface the bucket sample method described previously should be used If the bed sub-layers consistof similar sized material to the bed surface the pebble count method should be adopted
For Deep NON-WADEABLE Streams
Sample spacing and number of samples should be the same forwadeable streams
16
Silt and Sand Bed Streams
Samples should be collected using grab type or scraping type sampler though with both of these equipmenttypes some of the fines may be lost during sampleretreival If the stream is wadeable approximatelyhalfway to the thaiweg from the bank the use ofsuction sampler may be more advantageous The sampleis then analyzed using standed sieve analysis technique
Coarse Sand to Gravel Bed Streams
If the stream is wadeable to approximately halfway tothe thaiweg from the bank the suction sample or soilauger should be used The grab sampler or scrapingsampler should be used on the thalweg though if thebed is primarily coarse gravels these samplers may beineffective In this case bucket samples should betaken from the deepest water section possible Thesesamples should be divided and analyzed as for theHwadeabletl streams
Cobble to Boulder Bed Streams
Prior to sampling test hole should be dug at thewater surface edge to determine if the bed surface isan armour layer If finer material exists under thebed surface the bucket sample method described previously should be used For reasonably homogeneoussub-layer and bed material the pebble count methodusing edge of water samples should be used
5.2 LOCAL SCOUR
5.2.1 Bridge Pier Data
Estimation of this type of local scour requires general hydraulic parameters including the design discharge the associatedapproach velocity and depth immediately upstream of the pierThe physical parameters of the pier are also required
5.2.2 Spur Dikes and Guide Bank Data
Analysis of scour for these structures requires the same datatypes as required for bridge piers
17
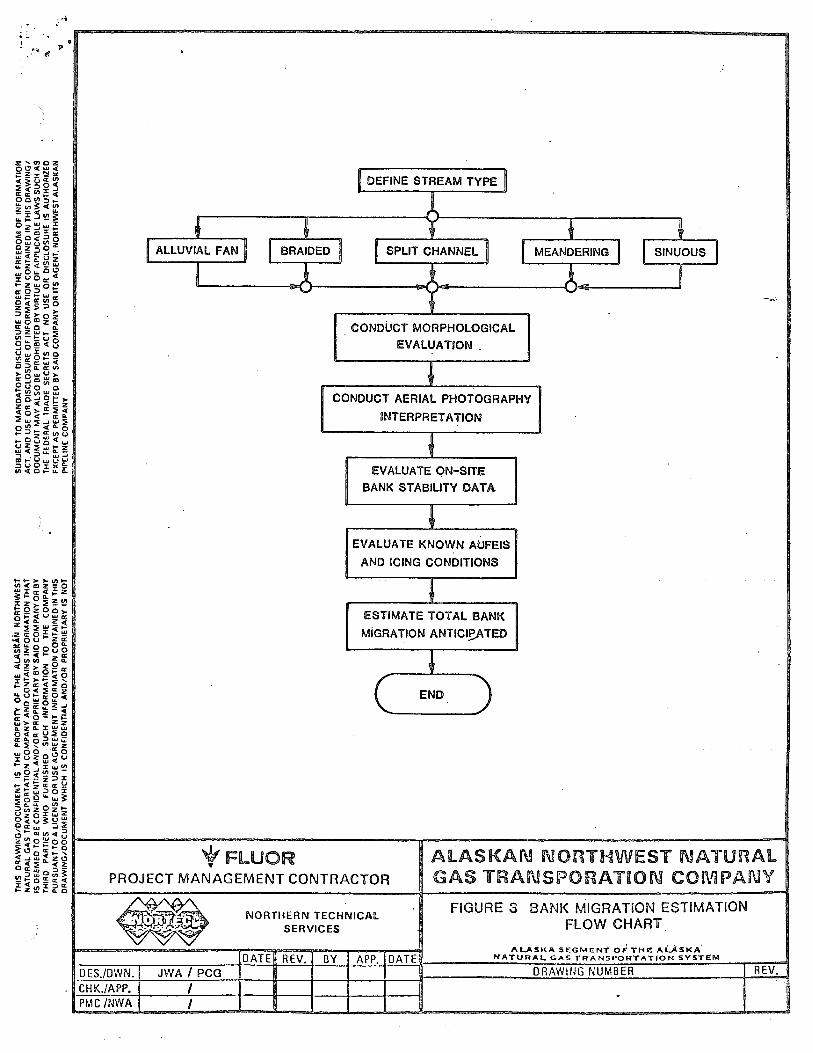
6.0 BANK MIGRATION ESTIMATION
6.1 INTRODUCTION
Bank migration lateral stream migration is an important consideration in design development because it may undermine bridgeabutments at buried crossfligs The solution is to design thepipeline emplacement to withstand the maximum lateral migrationwhich could occur during the pipeline design flood or bank erosion that could normally be expected during the life of the
project
In single channel bank erosion may result from high velocitiesremoving bed and bank material or from thermal erosion of channel banks In braided rivers it could result from rapidchange in flow pattern within or adjacent to an active channelarea during high discharge period Icing aufeis can alsocause severe bank erosion when it forms on braided channel andblocks the existing flow thus forming new channel or broadening the existing channel
Bank migration estimation outlined in the procedure chartFigure is conducted primarily through comparative aerialphotograph interpretation and on-site bank evaluations
6.2 AERIAL PHOTOGRAPHY INTERPRETATION
Photo comparison will be used to determine historical bank migration For each stream crossing the distance of bank migrationis measured by superposition of the earliest available photography between 1948 and 1955 and the most recent photographyMigration at specific locations is obtained by measuring the distance of migration between photographs reduced to the same scaleand preferably under similar discharge conditions Migrationrate derivation is not considered feasible as the most severebank location changes occur during the comparatively short timeperiods of high flows
The most recent aerial photography shall also be used to delineate meander patterns over long geologic time periods and recognition of any stable geologic structures that will act as bankmigration control point These photos shall also assist in thebank migration estimation induced by man made structures orartificially induced regime changes
18W
DEFINE STREAM TYPE
1I FANJ SPLIT CHANNJ SINUOUS
CONDUCT MORPHOLOGICAL
EVALUATION
CONDUCT AERIAL PHOTOGRAPHY
INTERPRETATION
.u4 ______________________
EVALUATE ON-SITE
BANK STABILITY DATA
EVALUATE KNOWN AUFEIS
AND ICING CONDITIONS
ESTIMATE TOTAL BANK
MIGRATION ANTICIP_ATED00 _____________________i-
ENDoU0uzOu
ZwO0I
UZOI0uUCl
z00OFLUOR ALASKAFJ NORTHWEST NATURAL
PROJECT MANAGEMENT CONTRACTOR GAS TRANSPORATON COMPANY
NORTHERN TECHNICALflGURE BANK MIGRA1ON ESTIMATION
ALASKA SEGMENT TH ALASKADATE REV BY APP DATE NATURAL GAS TRANSPORTATJOI4 SYSTEM
JWA/PGJ1I1J_DRAWING NUMBER
6.3 ON-SITE BANK EVALUATION
In conjunction with the aerial photography interpretation thepossibility of bank migration bank incision and new channeldevelopment can be assessed through observation of the geologyvegetation and man made structures at the site Sitespecificcross section surveys and discharge measurements will assist indelineating whether the main channel has been in its presentlocation for many years and whether bed material size gradationchanges heavily armoured bars or large recent sediment inflowsfrom an adjacent tributary may cause shift in the main channeland potential bank scour
Aufeis and pre-breakup field inspection data shall also be usedto determine the occurrence of severe ice buildups that mayinduce channel shifting extensive bank scour and consequentmigration or complete mass wasting of the banks Past icingproblems may also be revealed in the observation of swales andvegetation scars
2O
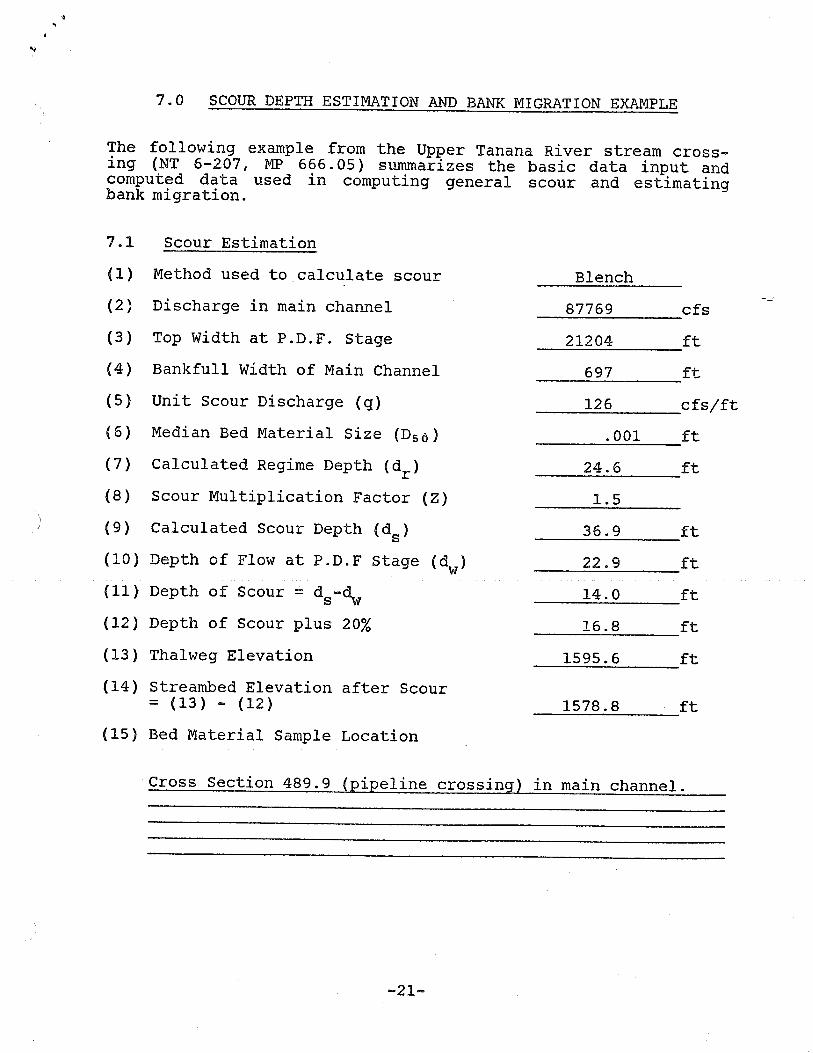
7.0 SCOUR DEPTH ESTIMATION AND BANK MIGRATION EXAMPLE
The following example from the Upper Tanana River stream Crossing NT 6207 NP 666.05 summarizes the basic data input andcomputed data used in computing general scour and estimatingbank migration
7.1 Scour Estimation
Method used to calculate scour Blench
Discharge in main channel 87769 cfs
Top Width at P.D.F Stage 21204 ft
Bankfull Width of Main Channel 697 ft
Unit Scour Discharge 126 cfs/ft
Median Bed Material Size D50 .001 ft
Calculated Regime Depth dr 24.6 ft
Scour Multiplication Factor 1.5
Calculated Scour Depth d5 36.9 ft
10 Depth of Flow at P.D.F Stage dy 22.9 ft
11 Depth of Scour d5.d 14.0 ft
12 Depth of Scour plus 20% 16.8 ft
13 Thalweg Elevation 1595.6 ft
14 Streanthed Elevation after Scour13 12 1578.8 ft
15 Bed Material Sample Location
Cross Section 489.9 pipeline crossing in main channel
21
--________________________________
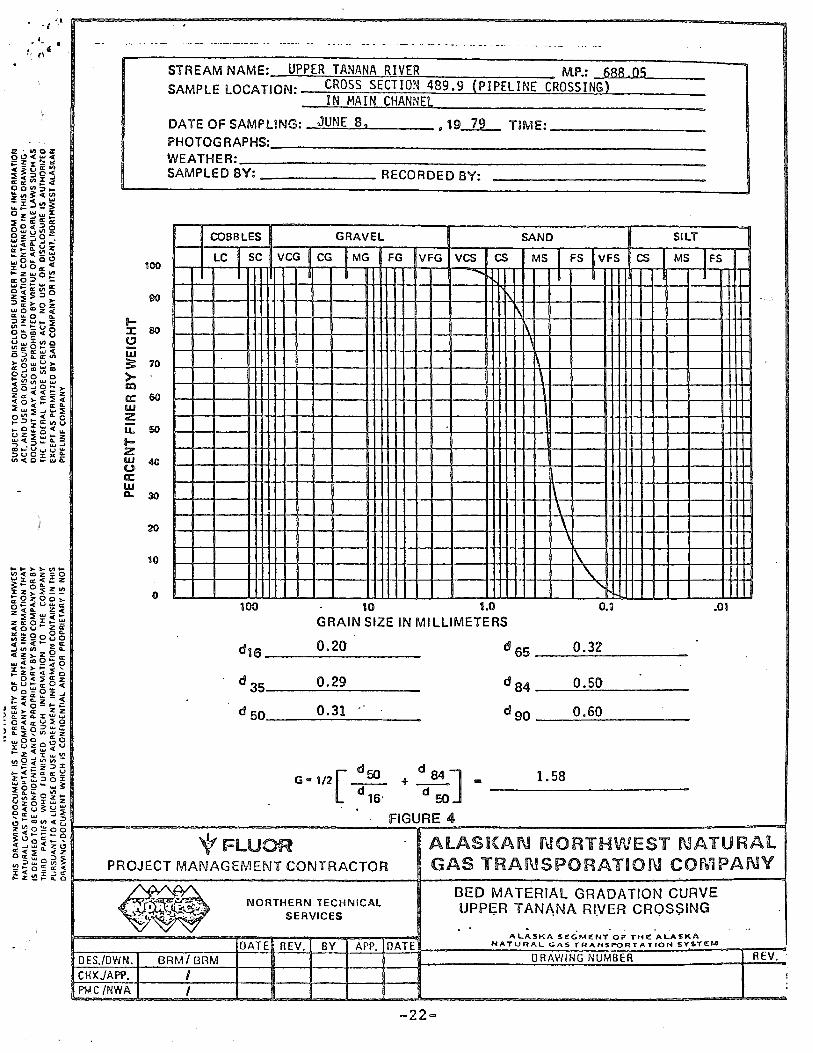
------.-- -.---
STREAMNAME UPPER TANANA RIVER M.P _68805SAMPLE LOCATION CROSS SECTION 489.9 PIPELINE CROSSING
IN MAIN CHANNEL
DATE OF SAMPUNG JUNE 79 TOME ___________________PHOTOGRAPHS_________________________________________________WEATHER________________________________________________________
SAMPLEDBY_ RECORDEDBY _______________________
ozw_
OJBBLES GRAVEL SAND SILT
100 L4SC VCGICGtGFG VFG vcs CS
MS4..F4YFS Cs1Ms4s
80
I80
70 ___ -- --cr60 -__
--
50
40
LU
30 --
irrnffl100 10 1.0 0.1 .01
GRAIN SIZE IN MILLIMETERS_o O-.z_OuO
0.20 0.32.zz2 16 ___________________ 65 __________________
0.29 dQA 0.50ooo_J
d50 0.31 d90 0.60ougo_
_.oaXQZO
flG1/2 ____ ____d1
FIGUREzvO.OO
frFLUOR 1ASKAN iORTHWEST NATURALPROJECT MANAGEMENT CONTRACTOR GAS TRA\1SPORATON COMPANY
BED MATERIAL GRADATION CURVENORTHERN TECHNICAL UPPER TANANA RIVER CROSSING
ALASKA SGMNT or TH ALASKADATE REV BY1 APP DATEL P4ATUIAL GAS tMANSPORTATION SYSTEM
DES./DWN.j BRMI BRM DRAWING NUMBER REV
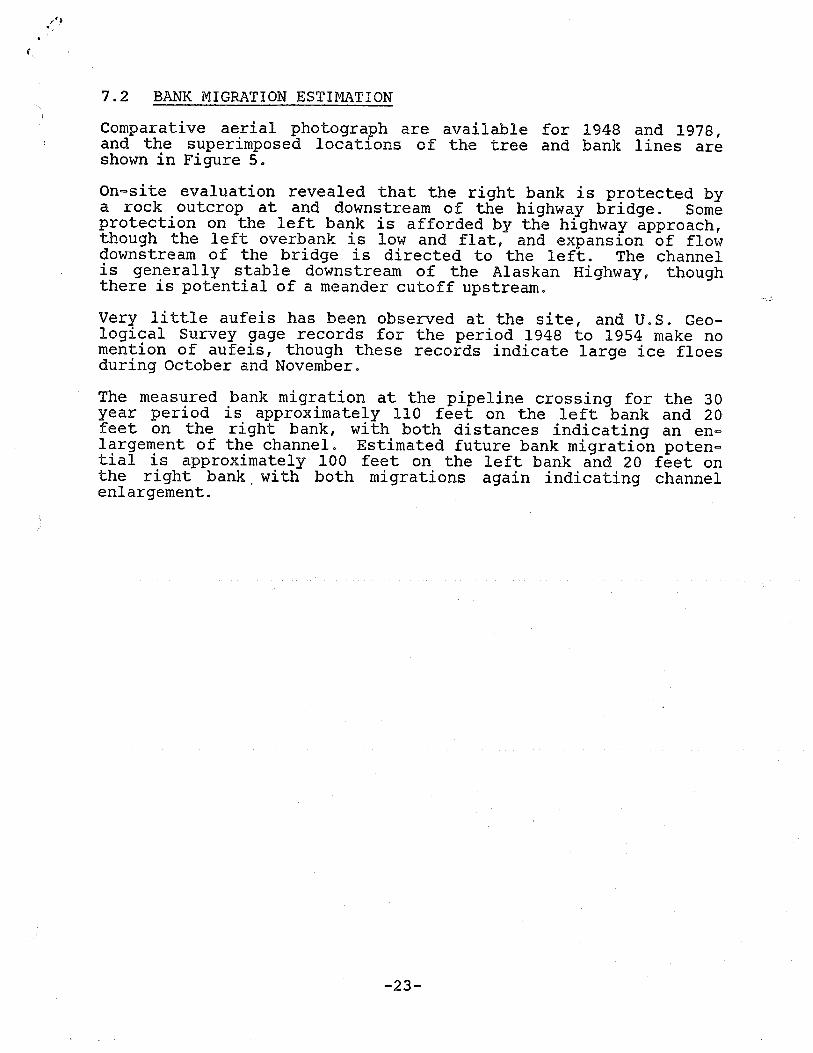
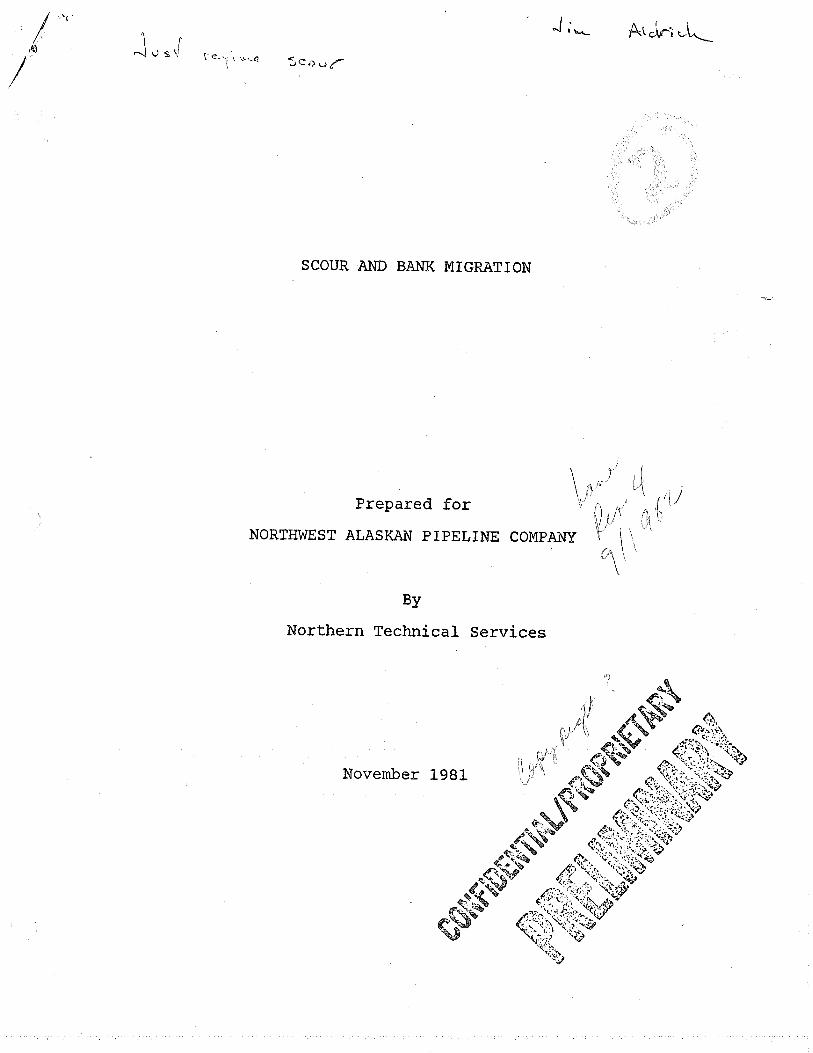
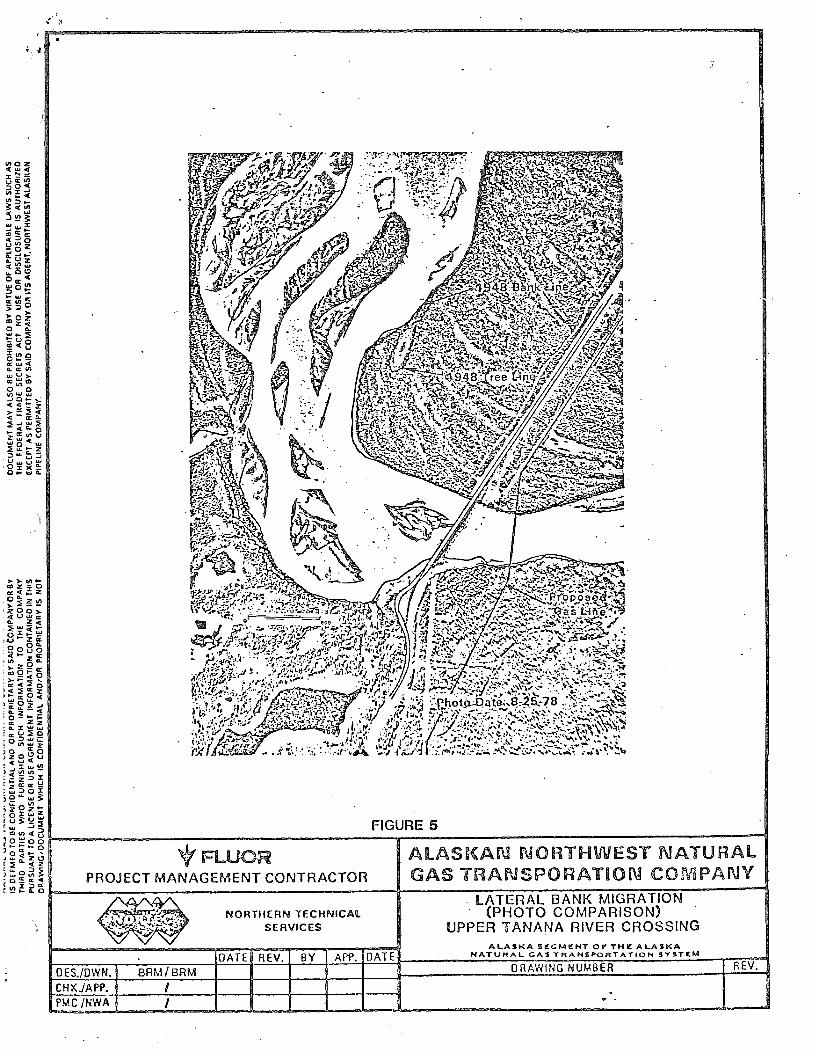
7.2 BANK MIGRATION ESTIMATION
Comparative aerial photograph are available for 1948 and 1978and the superimposed locations of the tree and bank lines areshown in Figure
On-.site evaluation revealed that the right bank is protected byrock outcrop at and downstream of the highway bridge Some
protection on the left bank is afforded by the highway approachthough the left overbank is low and flat and expansion of flowdownstream of the bridge is directed to the left The channelis generally stable downstream of the Alaskan Highway thoughthere is potential of meander cutoff upstream
Very little aufeis has been observed at the site and U.S Geological Survey gage records for the period 1948 to 1954 make nomention of aufeis though these records indicate large ice floesduring October and November
The measured bank migration at the pipeline crossing for the 30
year period is approximately 110 feet on the left bank and 20feet on the right bank with both distances indicating an enlargement of the channel Estimated future bank migration potential is approximately 100 feet on the left bank and 20 feet onthe right bank with both migrations again indicating channelenlargement
S.
42..I fr
37c.J
pi\c
-J
.i if -._-__ .1
ff
I.
v---\ .- ..
.-.- .-
_.3
\__zc fr
id
I-Lfr .-.f
i1 f\
L-
.1j_-ir 1-
\.-i- _..-// 1jwtoDtt B25.78 -t
ii Z-
.-
.i
..\
ii.j -J
IuiU-J
IJ
FIGURE
oofrFLUCR ALASKAJ \3ORTHWEST NATURAL
PROJECT MANAGEMENT CONTRACTOR GAS TRANSPORATfiON COMPANYLATERAL BANK MIGRATION
NORTHERN TECHNICAL PHOTO COMPARISONSERVICES UPPER TANANA RIVER CROSSING
DATE REV BY APP DATE NATURAL GA TRANSPORTATION 5YTZM
BRMBRMJjJ_JJj DRAWING NUMBER
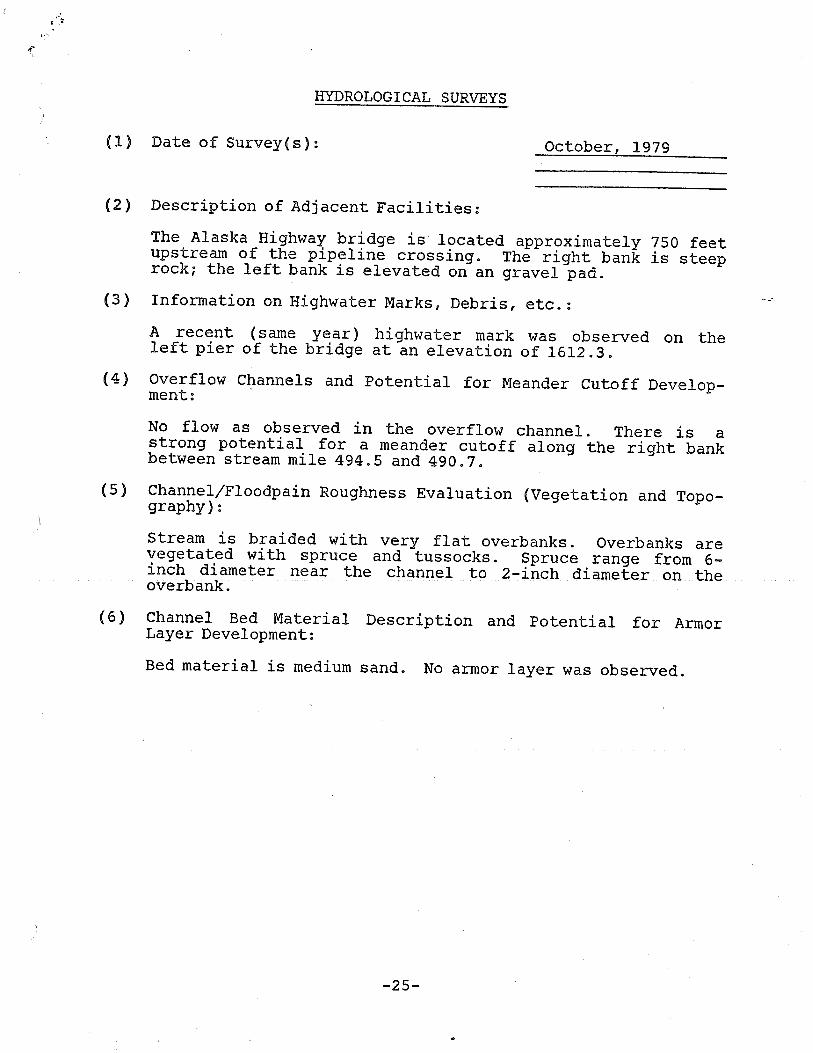
HYDROLOGI CAL SURVEYS
Date of Surveys October 1979
Description of Adjacent Facilities
The Alaska Highway bridge is located approximately 750 feetupstream of the pipeline crossing The right bank is steeprock the left bank is elevated on an gravel pad
Information on Highwater Marks Debris etcrecent same year highwater mark was observed on the
left pier of the bridge at an elevation of 1612.3
Overflow Channels and Potential for Meander Cutoff Development
No flow as observed in the overflow channel There isstrong potential for meander cutoff along the right bankbetween stream mile 494.5 and 490.7
Channel/Floodpain Roughness Evaluation Vegetation and Topography
Stream is braided with very flat overbanks Overbanks arevegetated with spruce and tussocks Spruce range frominch diameter near the channel to 2inch diameter on theoverbank
Channel Bed Material Description and Potential for ArmorLayer Development
Bed material is medium sand No armor layer was observed
25
8.0 REFERENCES
Cooper R.H Peterson A.W and Blench 1972 Critical Review of Sediment Transport Experiments Proceedingsof ASCE Journal of Hydraulics Division HY5 May 1972
Simons D.B and Senturk 1977 Sediment TransportTechnology Water Resources Publications Fort CollinsColorado
Blench 1966 Mobile.bed Fluviology Department ofTechnical Services University of Alberta Alberta Canada
Neil C.R 1973 Guide to Bridge Hydraulics.1 Road andTransportation Association of Canada University of TorontoPress
Lacey 1930 Stable Channels in Alluvium Minutes ofProceedings Institution of Civil Engineers 22925992
Norman V.W 1975 Scour at Selected Bridge Sites inAlaska U.S Geol Survey Water Resources mv 3275160
U.S Department of Transportation Federal Highway Administration 1975 Highways in the River Environment Hydr-aulic and Environmental Design Considerations Training andDesign Manual Washington D.C