Embed Size (px)
Citation preview
Wasserbaukolloquium 2006: Strömungssimulation im Wasserbau 157
Dresdner Wasserbauliche Mitteilungen Heft 32
Scour Development and Bridge Abutment Safety during the Floods
Boriss Gjunsburgs, Roberts Neilands, and Elena Govsha
Bridge crossings on plain rivers were modelled and scour development at the abutments and guide banks were studied. Tests were carried out in flumes 3.5 m wide and 21 m long in clear water conditions for FrR = Frf. The differential equation of equilibrium of the bed sediment movement in clear water was used, and a method for calculating the development of an abutment scour hole with time during the floods was elaborated and confirmed by experimental data (Gjunsburgs and Neilands, 2001; 2004; 2005). The local scour at bridge abutments on plain rivers starts as soon as the floodplain is flooded and stops at the peak of the flood or just after it. A new method for calculating the equilibrium depth of scour is presented. The equilibrium depth, width, and volume of the scour hole are achieved when the local velocity calculated at the flood peak becomes equal to the velocity at which starts sediment movement. The parameters of the scour hole computed during one, two, or several floods can be compared with its equilibrium parameters calculated by the equations suggested, and the risk factor of abutment scour can be determined as a ratio of hs/hequil.
In Laborbedingungen wurde der Brückeübergang des Flusshochflutbettes modeliert und die Bildung örtlicher Auskolkung an den Stützen und den Dämmen erforscht. Die Experimente wurden in 3.5 m breiter und 21 m langer Laborrinne ausgeführt, in den Umstanden, wann die Bewegung der Grundanspülungen nicht geschiet. Die Experimente wurden in Bedingungen ausgeführt, wann FrR=Frf. Man hat die differentiale Gleichungen der Bewegung der Grundanspülungen ausgenutzt und die Bildung der neuen Auskolkungen während des Hohchwassers an den Stützen mit der Rechnungsmethode ausgearbeitet und nach den Angaben der Experimente geprüft (Gjunsburgs un Neilands, 2001; 2004; 2005). Die örtliche Auskolkung an den Stützen beginnt sobald das Hochflutbett überschwemmt und hört beim Hochwasser oder gleich nach dem auf. Es wurde eine neue Methode ausgearbeitet, mit der maximale Tiefe örtlicher Auskolkung berechnen kann. Es wurden die Grenzwerte der Auskolkungstiefe, - Breite und - Rauminhalt erreicht, wann die örtliche Geschwindigkeit des Stroms bei Hochwasser gleich mit der Geschwindigkeit wird, bei der die Bewegung der Grundanspülungen beginnt. Die Parameter der Auskolkungsgrube nach einer, zwei oder mehr Überschwemmungen kann man mit maximalen Parametern der Auskolkungsgrube vergleichen, die mit den angebotenen Formeln berechnet wurden. Der Faktor des Stützauslokungsrisiko kann man im Verhältnis hs/hequil berechnen.
158 Scour development and bridge abutments safety during the floods
1 Introduction
The flow in plain rivers contracted by bridge crossings in floods leads to scour at piers, abutments, or guide banks and can cause considerable damage and losses.
An analysis of the literature showed that the calculations of scour by different formulas do not take into account the flow and riverbed changes during the floods, the contraction rate of the flow, and the local increase in velocity and cannot evaluate the stability of the constructions in the flow and the risk factor after several floods.
The scour at the abutments was modelled. Tests were made with rigid and sand beds. The condition that FrR = Frf was fulfilled, where FrR and Frf were the Froude numbers for the flows in plain rivers and flumes, respectively. Based on these tests, a method for calculating the development of the depth, width, and volume of scour during the floods was elaborated (Gjunsburgs and Neilands, 2001; 2004; 2005). In this study, a new method for calculating the equilibrium parameter of a scour hole is suggested. The method allows us to estimate the stability of the abutments in the flow after one, two, or several floods.
2 Experimental Setup
Tests were carried out at the Transport Research Institute (Russia) in a flume 3.5 m wide and 21 m long and at the Budapest Technical University (Hungary) in a flume 1.35 m wide and 9 m long. Experimental data for the open-flow conditions are presented in Table 1.
The tests with a rigid bed were performed for different flow contractions, in order to investigate the velocity and the water level changes in the vicinity of the embankment, along it, and near a modelled abutment. The aim of the tests with a sand bed was to study the scour processes, the changes in the velocity with time, the effect of hydraulic parameters and the contraction rate of the flow, grain size of the bed material, and the scour development in time. The openings of the bridge model were 50, 80, 120, and 200 cm in the first flume and 44.5, 57.5, 77.5, and 97.5 cm in the second one. The contraction rate of the flow Q/Qb (Q was the discharge of the flow and Qb was the discharge of the flow in a bridge opening in open-flow conditions) varied from 1.25 to 5.69 at a depth of floodplain of 5, 7, and 13 cm. The Froude numbers varied from 0.078 to 0.151. The slope in the first and second flumes was 0.0012 and 0.0015, respectively.
The tests with a sand bed were carried out in the conditions of clear water. The sand was placed 1 m up and down the contraction of the flumes. The mean size
Wasserbaukolloquium 2006: Strömungssimulation im Wasserbau 159
Dresdner Wasserbauliche Mitteilungen Heft 32
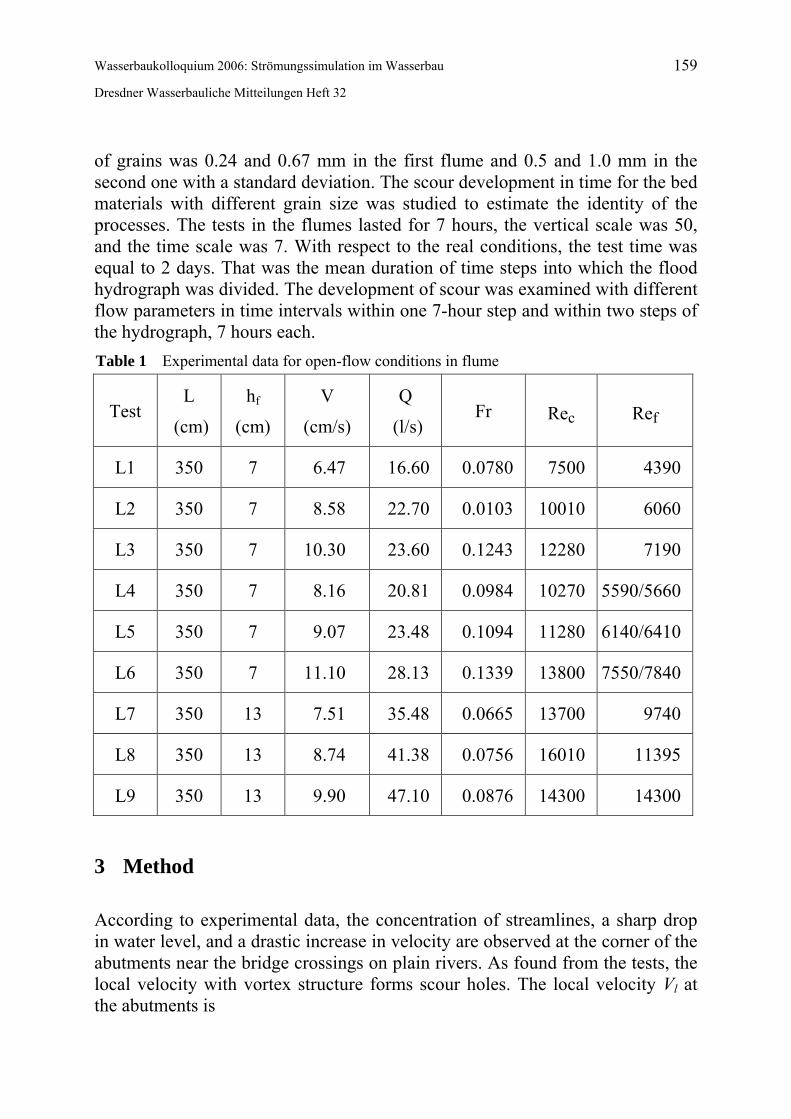
of grains was 0.24 and 0.67 mm in the first flume and 0.5 and 1.0 mm in the second one with a standard deviation. The scour development in time for the bed materials with different grain size was studied to estimate the identity of the processes. The tests in the flumes lasted for 7 hours, the vertical scale was 50, and the time scale was 7. With respect to the real conditions, the test time was equal to 2 days. That was the mean duration of time steps into which the flood hydrograph was divided. The development of scour was examined with different flow parameters in time intervals within one 7-hour step and within two steps of the hydrograph, 7 hours each. Table 1 Experimental data for open-flow conditions in flume
Test L
(cm)
hf
(cm)
V
(cm/s)
Q
(l/s) Fr Rec Ref
L1 350 7 6.47 16.60 0.0780 7500 4390
L2 350 7 8.58 22.70 0.0103 10010 6060
L3 350 7 10.30 23.60 0.1243 12280 7190
L4 350 7 8.16 20.81 0.0984 10270 5590/5660
L5 350 7 9.07 23.48 0.1094 11280 6140/6410
L6 350 7 11.10 28.13 0.1339 13800 7550/7840
L7 350 13 7.51 35.48 0.0665 13700 9740
L8 350 13 8.74 41.38 0.0756 16010 11395
L9 350 13 9.90 47.10 0.0876 14300 14300
3 Method
According to experimental data, the concentration of streamlines, a sharp drop in water level, and a drastic increase in velocity are observed at the corner of the abutments near the bridge crossings on plain rivers. As found from the tests, the local velocity with vortex structure forms scour holes. The local velocity Vl at the abutments is
160 Scour development and bridge abutments safety during the floods
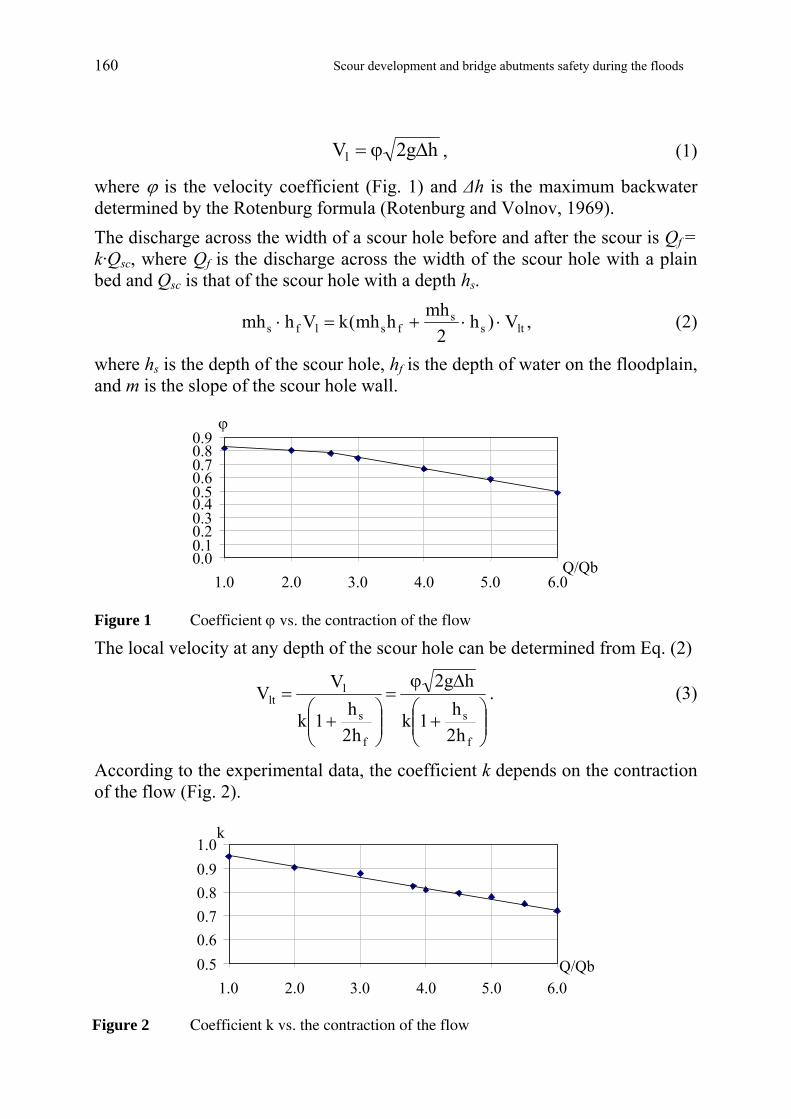
hg2Vl ∆ϕ= , (1)
where ϕ is the velocity coefficient (Fig. 1) and ∆h is the maximum backwater determined by the Rotenburg formula (Rotenburg and Volnov, 1969). The discharge across the width of a scour hole before and after the scour is Qf = k·Qsc, where Qf is the discharge across the width of the scour hole with a plain bed and Qsc is that of the scour hole with a depth hs.
ltss
fslfs V)h2
mhhmh(kVhmh ⋅⋅+=⋅ , (2)
where hs is the depth of the scour hole, hf is the depth of water on the floodplain, and m is the slope of the scour hole wall.
0.0 0.1 0.2 0.3 0.4 0.5 0.6 0.7 0.8 0.9
1.0 2.0 3.0 4.0 5.0 6.0 Q/Qb
ϕ
Figure 1 Coefficient ϕ vs. the contraction of the flow
The local velocity at any depth of the scour hole can be determined from Eq. (2)
⎟⎟⎠
⎞⎜⎜⎝
⎛+
∆ϕ=
⎟⎟⎠
⎞⎜⎜⎝
⎛+
=
f
s
f
s
llt
h2h1k
hg2
h2h1k
VV . (3)
According to the experimental data, the coefficient k depends on the contraction of the flow (Fig. 2).
0.5 0.6 0.7 0.8 0.9 1.0
1.0 2.0 3.0 4.0 5.0 6.0 Q/Qb
k
Figure 2 Coefficient k vs. the contraction of the flow
Wasserbaukolloquium 2006: Strömungssimulation im Wasserbau 161
Dresdner Wasserbauliche Mitteilungen Heft 32
The velocity of the beginning of sediment movement V0 can be found from the Studenitcnikov formula (Studenitcnikov, 1964):
25.0f
25.00 hd6.3V = . (4)
At a scour depth hs, the velocity V0t is given by
,h2h1hd6.3V
25.0
f
s25.0f
25.0ot ⎟⎟
⎠
⎞⎜⎜⎝
⎛+⋅β= (5)
where β is the coefficient of reduction in the velocity because of vortex structures and d is the grain size of the bed material in the layer H. The velocity Vlt is decreasing and Vot is increasing with development of the scour hole. The scour ceases when Vlt becomes equal to βVot.
25.0
f
.equilo
f
.equil
l
h2h
1V
h2h
1k
V⎟⎟⎠
⎞⎜⎜⎝
⎛+⋅β=
⎟⎟⎠
⎞⎜⎜⎝
⎛+
. (6)
The equilibrium depth of scour can be determined from Eq. (6) as follows:
α⋅⋅⋅⎥⎥⎦
⎤
⎢⎢⎣
⎡−⎟⎟
⎠
⎞⎜⎜⎝
⎛β
= kkk1Vk
Vh2h sm
8.0
o
lf.equil , (7)
where km is a coefficient depending on the side-wall slope of the abutment (Yaroslavcev, 1956), ks is a coefficient depending on the abutment shape, and kα is a coefficient depending on the angle of flow crossing (Richardson and Davis, 1995).
For calculating the development of scour holes during the floods, a new method was developed (Gjunsburgs and Neilands, 2001; 2004; 2005). To determine the development of a scour hole during the flood, the hydrograph was divided into time steps of 1 or 2 days, and each time step was divided into time intervals. For each time step, the following initial parameters must be determined: depth of water in the floodplain; contraction rate of the flow; maximum backwater; grain size of the bed material; thickness of the bed layer; specific weight of the bed material. As a result, we can determine the scour depth, the width, and volume at the end of each time step or after one, two, or several floods. The scour hole parameters calculated during or after one, two, or several floods can be compared with the equilibrium parameters found by Eq. (7), and thus the stability of the abutment can be evaluated. The risk factor of abutment scour can be calculated as a ratio between hs, the scour depth after the floods of certain probability, and hequil., the equilibrium depth of scour hole at the abutments of
162 Scour development and bridge abutments safety during the floods
the same probability. By using the risk factor, we can estimate the current stability of the abutments or to predict/compute the time of safe maintenance at the stage of design.
4 Results
An analysis of Eq. (7) shows that the relative equilibrium depth of scour depends on the following hydraulic and riverbed parameters:
⎟⎟⎠
⎞⎜⎜⎝
⎛β
= αk;k;k;P;P;hh;
VkV;
iFr;
hd;
QQƒ
hh
smKbKfo
l
of
i
bf
.equil , (8)
where Q/Qb is the contraction rate of the flow; di/hf is the relative grain size of the bed material; Fr/io is the Froude number in relation to the river slope; Vl/kβVot is the velocity ratio; h/hf is the relative depth of water; PK is the kinetic parameter of the open flow; PKb is the kinetic parameter of the flow under the bridge; km, ks, and kα are coefficients described above.
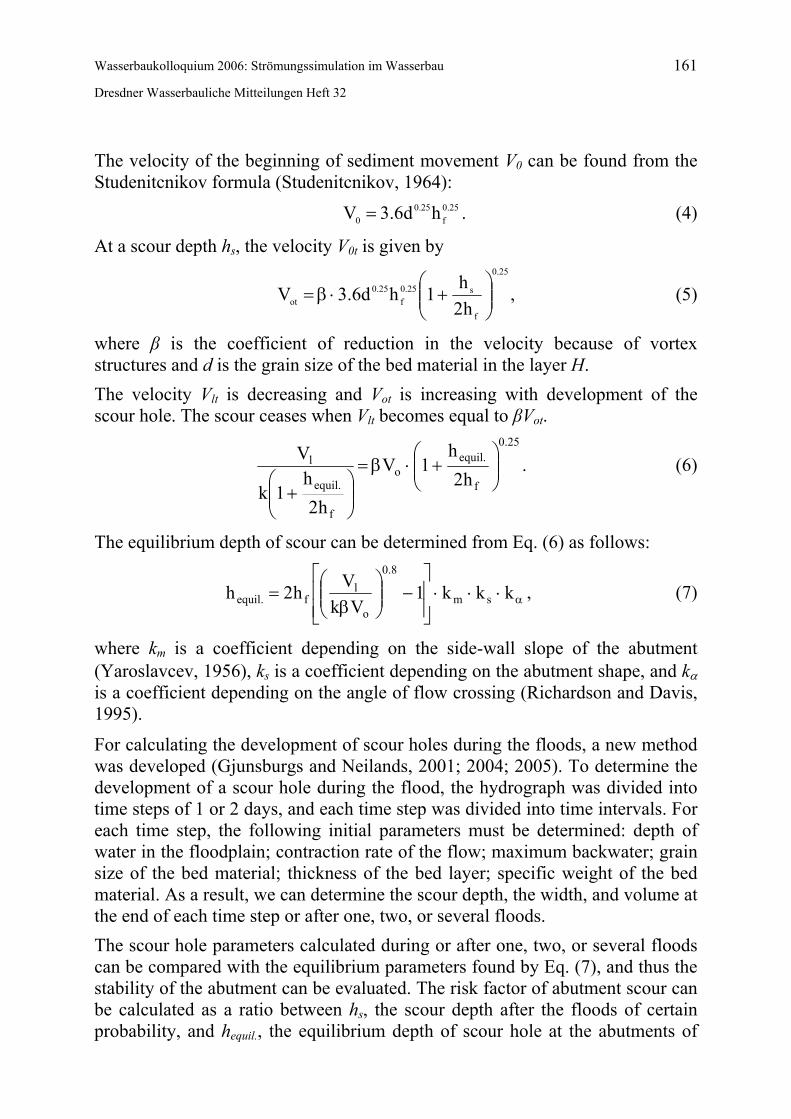
Figure 3 shows the relative equilibrium depth of scour versus the contraction rate of flow. With increase in the contraction of the flow, the equilibrium depth of scour increases.
0.0 0.5 1.0 1.5 2.0 2.5 3.0 3.5
1.0 2.0 3.0 4.0 5.0 6.0Q/Q b
h equil. /hf
Fr1
Fr2
Fr3
Figure 3 Relative equilibrium depth of scour vs. the contraction rate of the flow
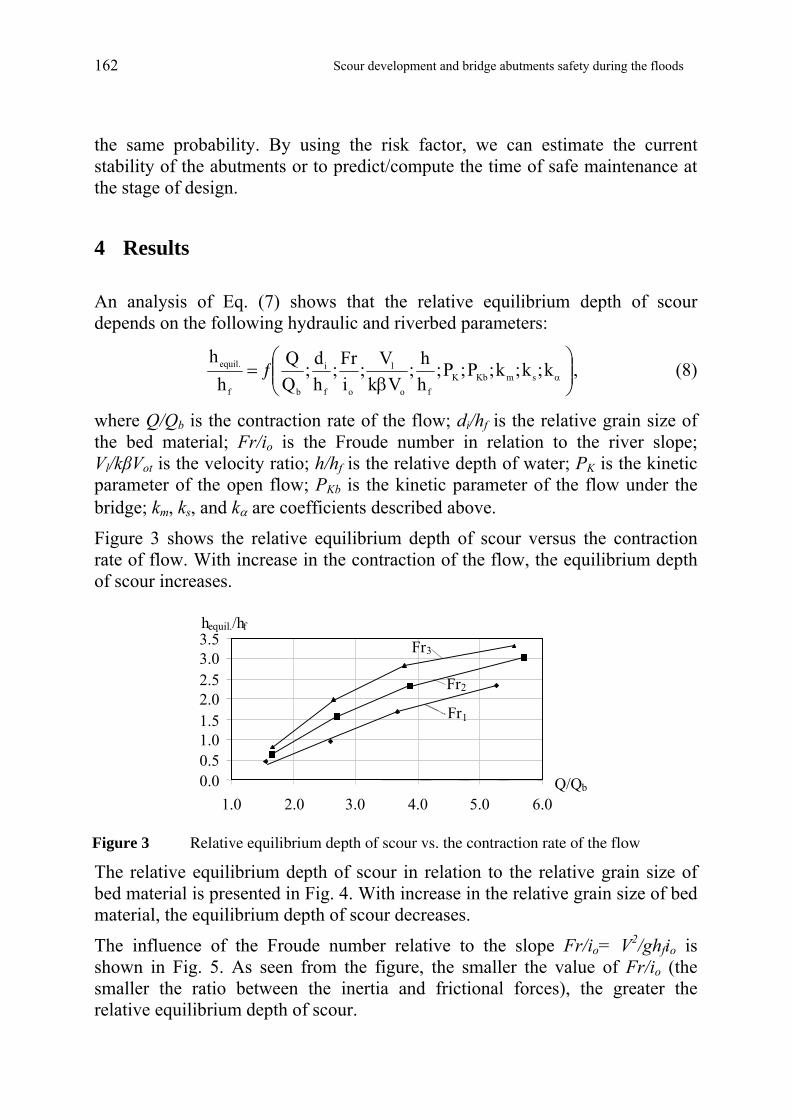
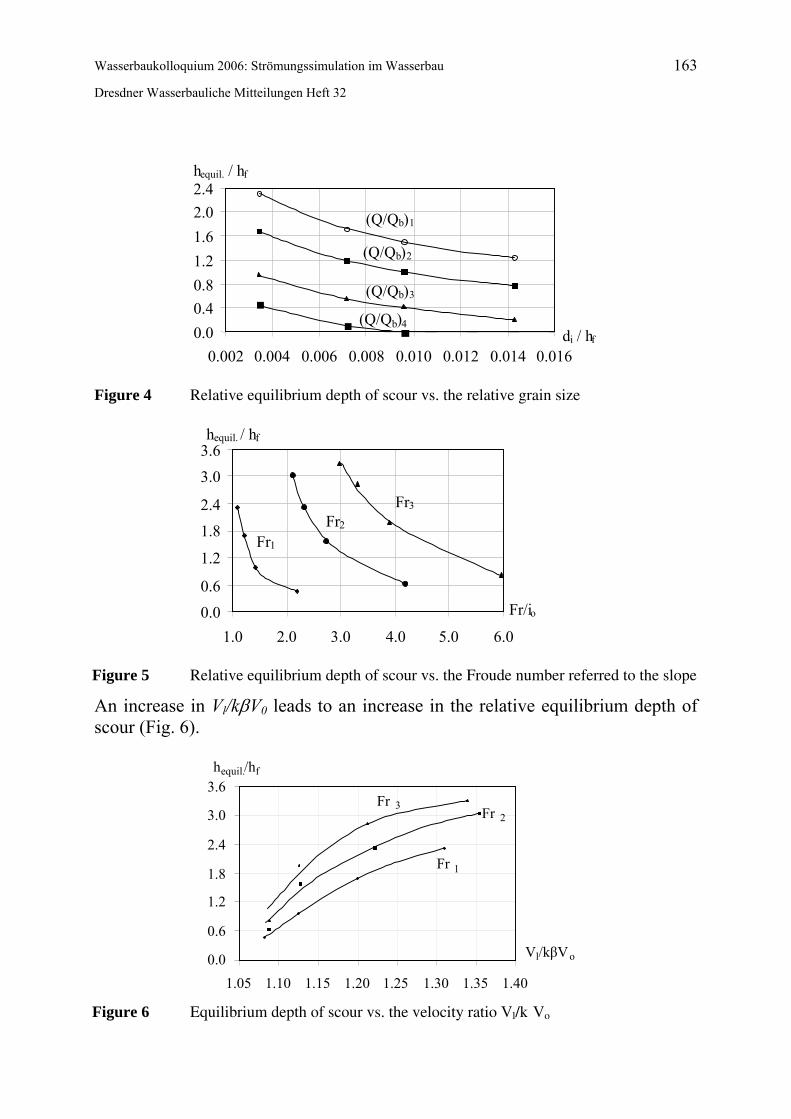
The relative equilibrium depth of scour in relation to the relative grain size of bed material is presented in Fig. 4. With increase in the relative grain size of bed material, the equilibrium depth of scour decreases.
The influence of the Froude number relative to the slope Fr/io= V2/ghfio is shown in Fig. 5. As seen from the figure, the smaller the value of Fr/io (the smaller the ratio between the inertia and frictional forces), the greater the relative equilibrium depth of scour.
Wasserbaukolloquium 2006: Strömungssimulation im Wasserbau 163
Dresdner Wasserbauliche Mitteilungen Heft 32
0.0 0.4 0.8 1.2 1.6 2.0 2.4
0.002 0.004 0.006 0.008 0.010 0.012 0.014 0.016 d i / h f
h equil. / hf
(Q/Qb)1
(Q/Qb)3
(Q/Qb)2
(Q/Qb)4
Figure 4 Relative equilibrium depth of scour vs. the relative grain size
0.0 0.6
1.2
1.8 2.4
3.0 3.6
1.0 2.0 3.0 4.0 5.0 6.0
Fr/io
h equil. / h f
Fr 1
Fr3
Fr2
Figure 5 Relative equilibrium depth of scour vs. the Froude number referred to the slope
An increase in Vl/kβV0 leads to an increase in the relative equilibrium depth of scour (Fig. 6).
0.0
0.6
1.2
1.8
2.4
3.0
3.6
1.05 1.10 1.15 1.20 1.25 1.30 1.35 1.40
h equil./h f
Fr 1
Fr 2Fr 3
Vl/kβV o
Figure 6 Equilibrium depth of scour vs. the velocity ratio Vl/k�Vo
164 Scour development and bridge abutments safety during the floods
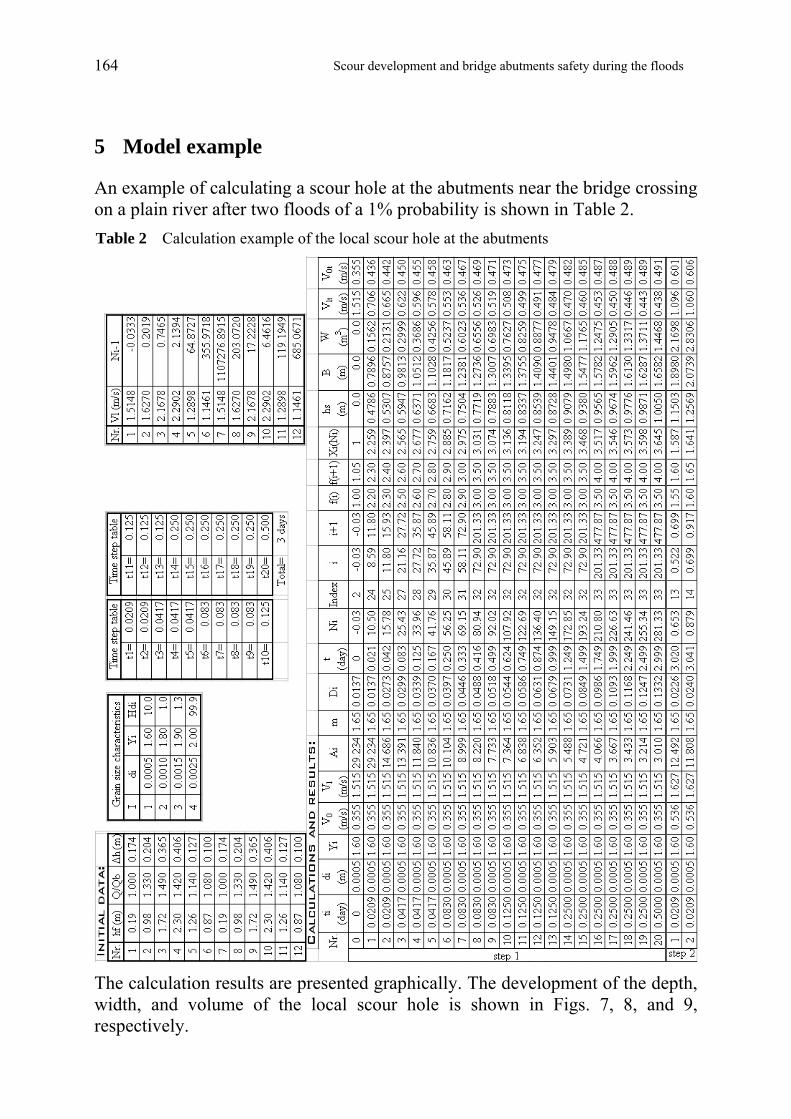
5 Model example
An example of calculating a scour hole at the abutments near the bridge crossing on a plain river after two floods of a 1% probability is shown in Table 2. Table 2 Calculation example of the local scour hole at the abutments
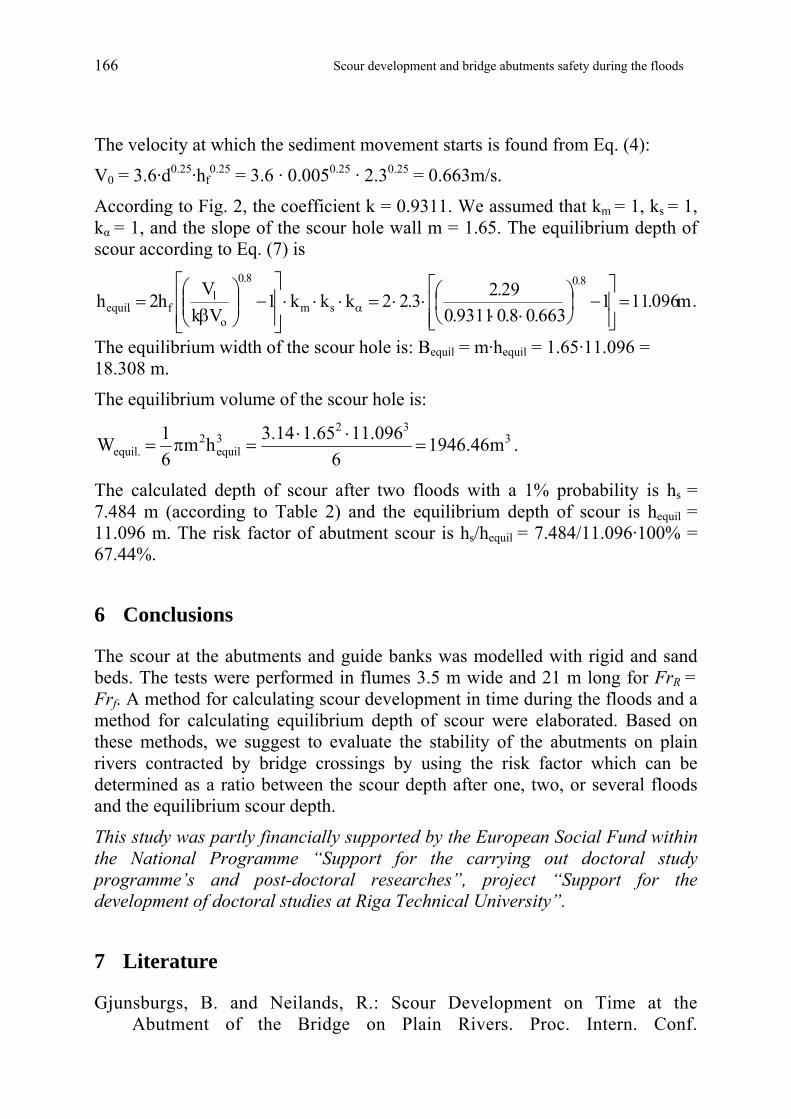
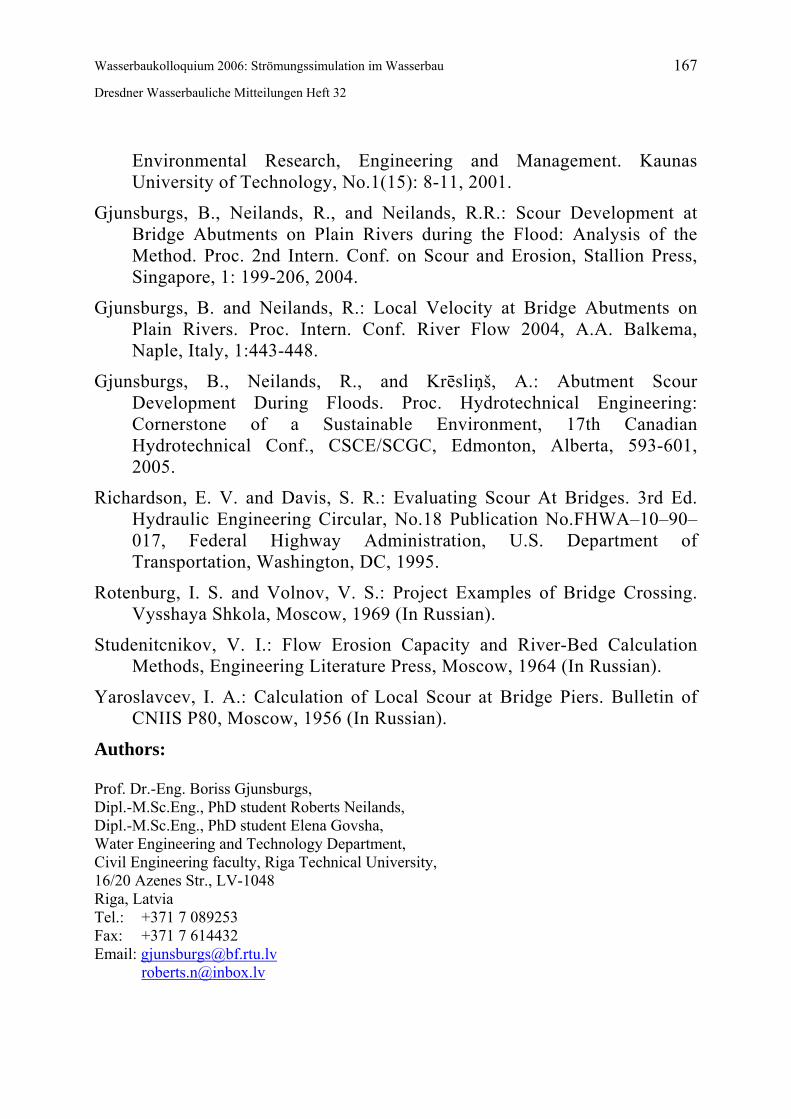
The calculation results are presented graphically. The development of the depth, width, and volume of the local scour hole is shown in Figs. 7, 8, and 9, respectively.
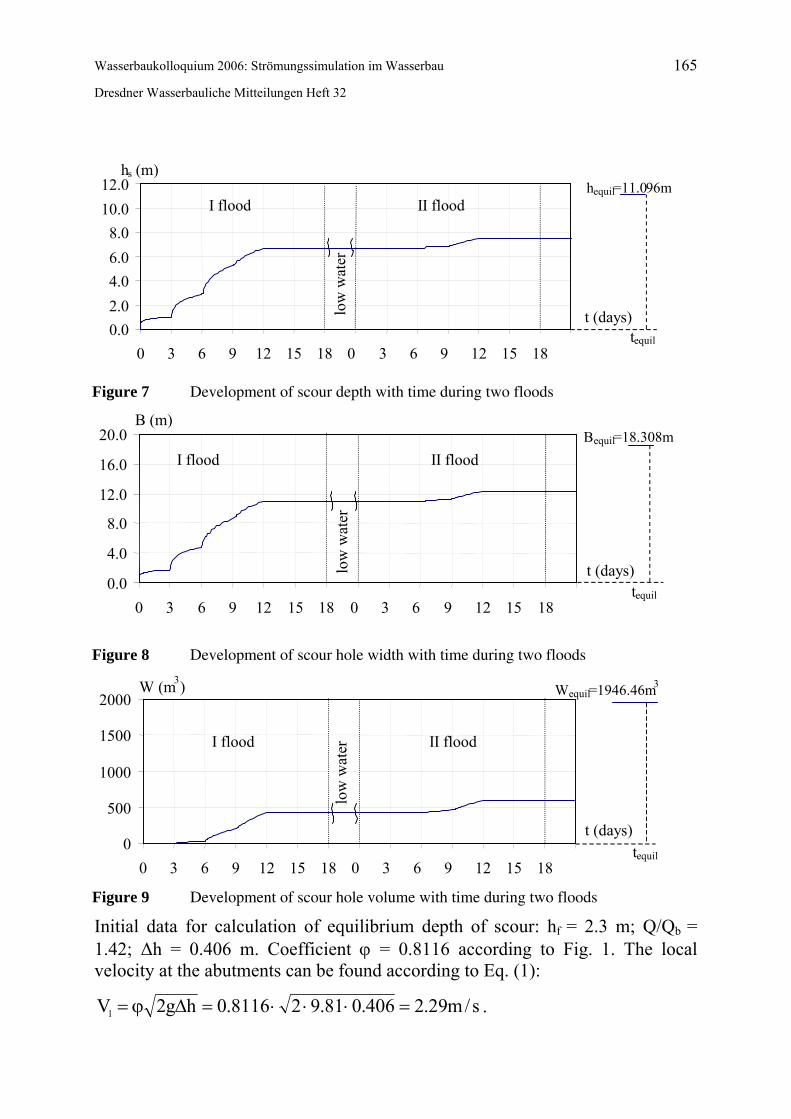
Wasserbaukolloquium 2006: Strömungssimulation im Wasserbau 165
Dresdner Wasserbauliche Mitteilungen Heft 32
0.0 2.0 4.0 6.0 8.0
10.0 12.0
0 3 6 9 12 15 18 0 3 6 9 12 15 18
t (days)
h equil =11.0 96m
t equil
h s (m)
I flood
low
wat
er
II flood
Figure 7 Development of scour depth with time during two floods
0.0
4.0
8.0
12.0
16.0
20.0
0 3 6 9 12 15 18 0 3 6 9 12 15 18
t (days)
B (m) B equil =18.308m
I flood
low
wat
er
II flood
t equil
Figure 8 Development of scour hole width with time during two floods
0
500
1000
1500
2000
0 3 6 9 12 15 18 0 3 6 9 12 15 18
t (days)
W (m 3 ) W equil =1946.46m3
I flood
low
wat
er II flood
t equil
Figure 9 Development of scour hole volume with time during two floods
m; Q/Qb = Initial data for calculation of equilibrium depth of scour: hf = 2.31.42; ∆h = 0.406 m. Coefficient ϕ = 0.8116 according to Fig. 1. The local velocity at the abutments can be found according to Eq. (1):
s/m29.2406.081.928116.0hg2Vl =⋅⋅⋅=∆ϕ= .
166 Scour development and bridge abutments safety during the floods
The velocity at which the sediment movement starts is found from Eq. (4): 0.25 0.25 0.25 0.25
umed that km = 1, ks = 1, he equilibrium depth of
V0 = 3.6·d ·hf = 3.6 · 0.005 · 2.3 = 0.663m/s.
According to Fig. 2, the coefficient k = 0.9311. We assk = 1, and the slope of the scour hole wall m = 1.65. Tα scour according to Eq. (7) is
m096.111663.08.09311.0
29.23.22kkk1V
h2h8.08.0
l ⋅⎥⎤
⎢⎡
−⎟⎞
⎜⎛
=Vk sm
of.equil =
⎥⎥⎦
⎤
⎢⎢⎣
⎡−⎟
⎠⎞
⎜⎝⎛
⋅⋅⋅⋅=⋅⋅
⎥⎦⎢⎣⎟⎠
⎜⎝ β α .
The equilibrium width of the scour hole is: Bequil = m·hequil = 1.65·11.096 = 18.308 m.
The equilibrium volume of the scour hole is:
332
3equil
2.equil 1096.1165.114.3hm1W =
⋅⋅=π= m46.946
66.
The calculated depth of scour after two floods with a 1% probability is hs = 7.484 m (according to Table 2) and the equilibrium depth of scour is h =
6 Conclusions
e utments and guide banks was modelled with rigid and sand beds. The tests were performed in flumes 3.5 m wide and 21 m long for Fr =
port for the carrying out doctoral study
7 Literature
Gjunsburgs, B. and Neilands, R.: Scour Development on Time at the Abutment of the Bridge on Plain Rivers. Proc. Intern. Conf.
equil 11.096 m. The risk factor of abutment scour is hs/hequil = 7.484/11.096·100% = 67.44%.
Th scour at the abR
Frf. A method for calculating scour development in time during the floods and a method for calculating equilibrium depth of scour were elaborated. Based on these methods, we suggest to evaluate the stability of the abutments on plain rivers contracted by bridge crossings by using the risk factor which can be determined as a ratio between the scour depth after one, two, or several floods and the equilibrium scour depth.
This study was partly financially supported by the European Social Fund within the National Programme “Supprogramme’s and post-doctoral researches”, project “Support for the development of doctoral studies at Riga Technical University”.
Wasserbaukolloquium 2006: Strömungssimulation im Wasserbau 167
Dresdner Wasserbauliche Mitteilungen Heft 32
tal Research, Engineering and Management. Kaunas University of Technology, No.1(15): 8-11, 2001.
CSCE/SCGC, Edmonton, Alberta, 593-601,
Rich
ortation, Washington, DC, 1995.
Stud ity and River-Bed Calculation
Yaro ridge Piers. Bulletin of
Auth
Dipl.-ng., PhD student Elena Govsha,
eering and Technology Department, nical University,
Environmen
Gjunsburgs, B., Neilands, R., and Neilands, R.R.: Scour Development at Bridge Abutments on Plain Rivers during the Flood: Analysis of the Method. Proc. 2nd Intern. Conf. on Scour and Erosion, Stallion Press, Singapore, 1: 199-206, 2004.
Gjunsburgs, B. and Neilands, R.: Local Velocity at Bridge Abutments on Plain Rivers. Proc. Intern. Conf. River Flow 2004, A.A. Balkema, Naple, Italy, 1:443-448.
Gjunsburgs, B., Neilands, R., and Krēsliņš, A.: Abutment Scour Development During Floods. Proc. Hydrotechnical Engineering: Cornerstone of a Sustainable Environment, 17th Canadian Hydrotechnical Conf., 2005.
ardson, E. V. and Davis, S. R.: Evaluating Scour At Bridges. 3rd Ed. Hydraulic Engineering Circular, No.18 Publication No.FHWA–10–90–017, Federal Highway Administration, U.S. Department of Transp
Rotenburg, I. S. and Volnov, V. S.: Project Examples of Bridge Crossing. Vysshaya Shkola, Moscow, 1969 (In Russian).
enitcnikov, V. I.: Flow Erosion CapacMethods, Engineering Literature Press, Moscow, 1964 (In Russian).
slavcev, I. A.: Calculation of Local Scour at BCNIIS P80, Moscow, 1956 (In Russian).
ors:
Prof. Dr.-Eng. Boriss Gjunsburgs, M.Sc.Eng., PhD student Roberts Neilands,
Dipl.-M.Sc.EWater EnginCivil Engineering faculty, Riga Tech16/20 Azenes Str., LV-1048 Riga, Latvia Tel.: +371 7 089253 Fax: +371 7 614432 Email: [email protected]

UBV Umweltbüro GmbH Vogtland
-Erkundung/Planung/Management-
Projekte im Bereich Wasserversorgung, Gewässerschutz und Hochwasserschutz
Schutzzonengutachten für Wasserfassung Fichtenberg und Jacobsthal, Rothenburg-Dunkelhäuser, Zeißig langjähriges Grundwassermonitoring im Einzugsgebiet
der Wasserfassung Fichtenberg, Mockritz, Kurpark Bad Elster und Bad Brambach Planung und Bauleitung für die Errichtung von 3 neuen
Trinkwasserbrunnen in Jacobsthal Grundwasservorratsnachweis für die Wasserfassungen
Zschornau-Schiedel, Königsbrück-Keulenberg, Kamenz Erarbeitung von wasserrechtlichen Antragsunterlagen Durchführung von Langzeitpumpversuchen (z.B. in
Fichtenberg, Bad Brambach Mineralwasserbrunnen und Heilquellen im Oberen Vogtland) Planung, Bau und Betrieb des Notwasserversorgungs-
systems für die Städte Plauen, Chemnitz, Dresden, Hoyerswerda, Reichenbach, Schleiz, Saalfeld, Rudolstadt, Bad Blankenburg und Sonneberg Erarbeitung von Hochwasserschutzkonzeptionen für die
Göltzsch und das Löbauer Wasser Planung, Bau und Betrieb von Oberflächenwassermess-
netzen in Plauen und Hoyerswerda Gründung der Stiftung „Sauberes Wasser Europa“ mit
Sitz in Weischlitz.
Sitz der Firma: Büro Dresden: Büro Hoyerswerda: Thossener Str. 6 Leipziger Str. 93 Th.-Müntzer-Str. 25 08538 Weischlitz 01127 Dresden 02977 Hoyerswerda 037436/912-0 03 51 / 2 07 49 10 0 35 71 / 60 72 34 Fax: 037436/912-20 Fax 03 51 / 2 07 49 20 Fax 0 35 71 / 60 72 35
e-mail: [email protected] Internet : www.ubv-net.de