Embed Size (px)
Citation preview

SCR Performance Optimization Through Advancements in Aftertreatment PackagingJared Blaisdell, Andrew Gilb, Phebe Preethi, Joe Sweeney, Karthik Viswanathan, Paul Way, Nathan Zambon
DEER 2008
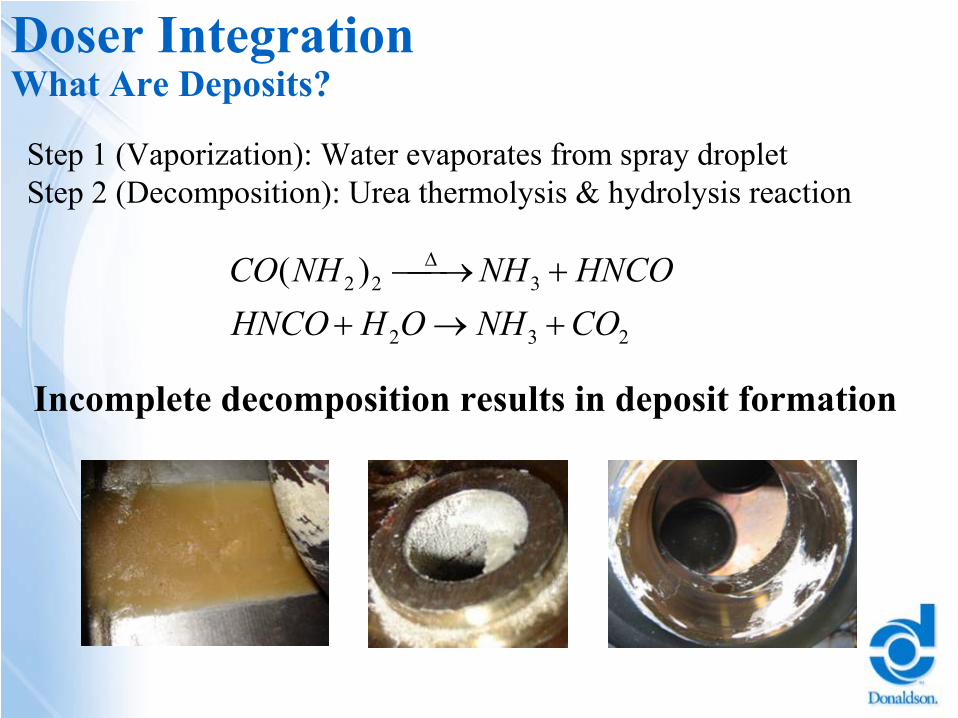
Outline Optimization Through Aftertreatment Packaging
•
Urea Doser Integration–
Urea deposit formation & chemistry
–
Eliminating deposit formation
•
Urea Preparation–
Mixer design & simulation
–
Urea solution vaporization
–
Flow distribution
–
Urea distribution & mixing
•
Single & Dual Wall Packaging–
NOX
reduction impact
–
Skin temperature
•
Summary
Control Strategy
Urea Dosing System
Optimized Packaging
Catalysts
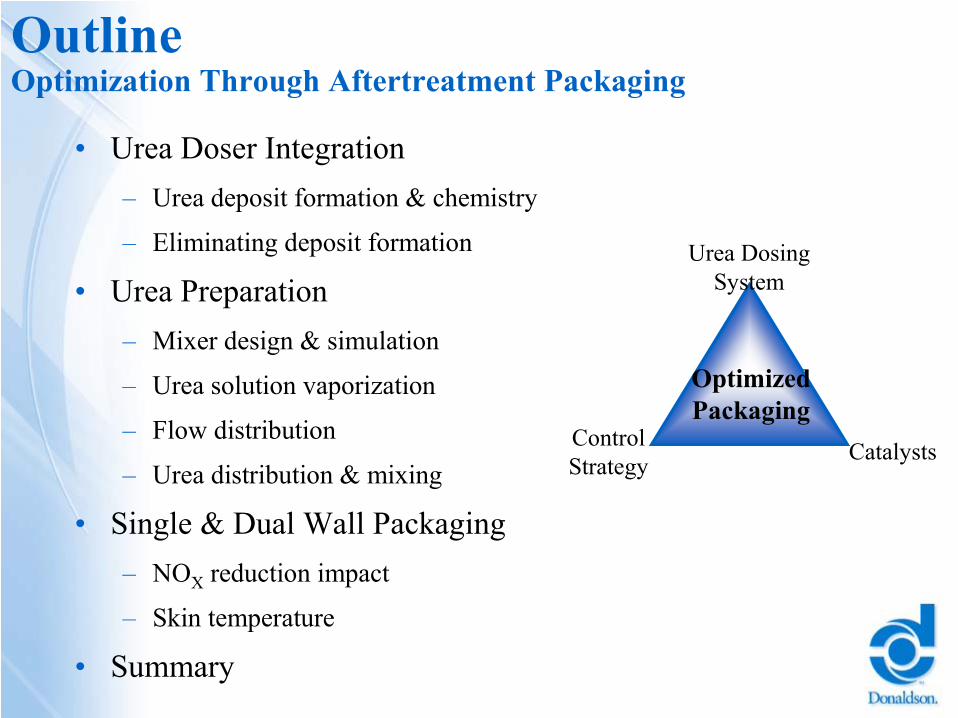
Doser Integration What Are Deposits?
232
322 )(CONHOHHNCOHNCONHNHCO
+→++⎯→⎯Δ
Step 1 (Vaporization): Water evaporates from spray dropletStep 2 (Decomposition): Urea thermolysis & hydrolysis reaction
Incomplete decomposition results in deposit formation
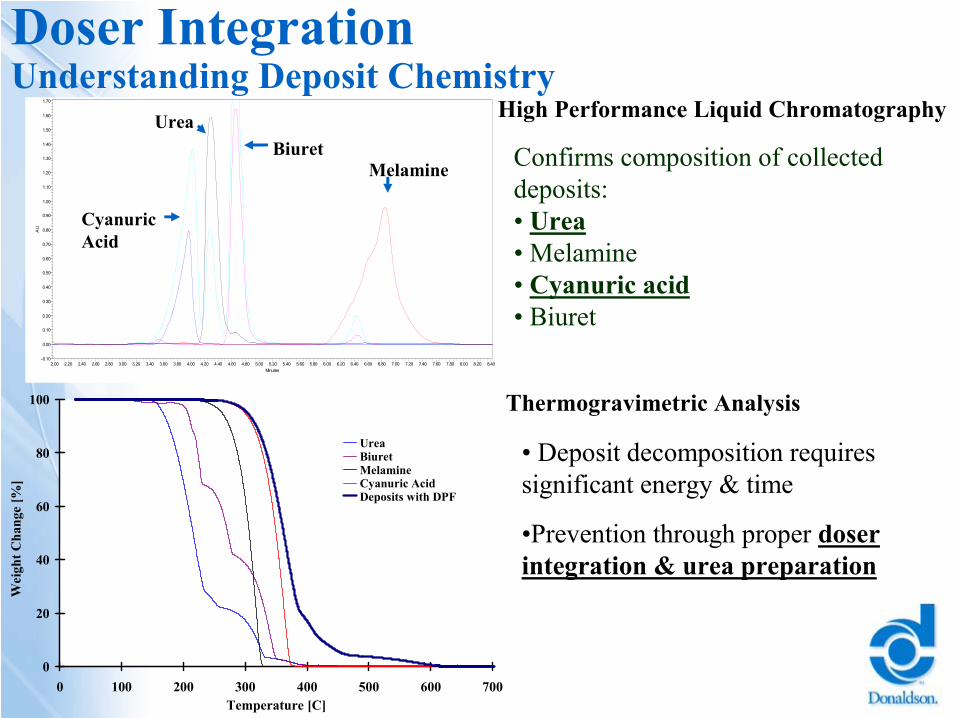
High Performance Liquid Chromatography
Confirms composition of collected deposits:• Urea• Melamine• Cyanuric acid• Biuret
AU
-0.10
0.00
0.10
0.20
0.30
0.40
0.50
0.60
0.70
0.80
0.90
1.00
1.10
1.20
1.30
1.40
1.50
1.60
1.70
Minutes2.00 2.20 2.40 2.60 2.80 3.00 3.20 3.40 3.60 3.80 4.00 4.20 4.40 4.60 4.80 5.00 5.20 5.40 5.60 5.80 6.00 6.20 6.40 6.60 6.80 7.00 7.20 7.40 7.60 7.80 8.00 8.20 8.40
Cyanuric Acid
UreaBiuret
Melamine
Thermogravimetric Analysis
•
Deposit decomposition requires significant energy & time
•Prevention through proper doser integration & urea preparation
Doser Integration Understanding Deposit Chemistry
0
20
40
60
80
100
0 100 200 300 400 500 600 700Temperature [C]
Wei
ght C
hang
e [%
]
UreaBiuretMelamineCyanuric AcidDeposits with DPF
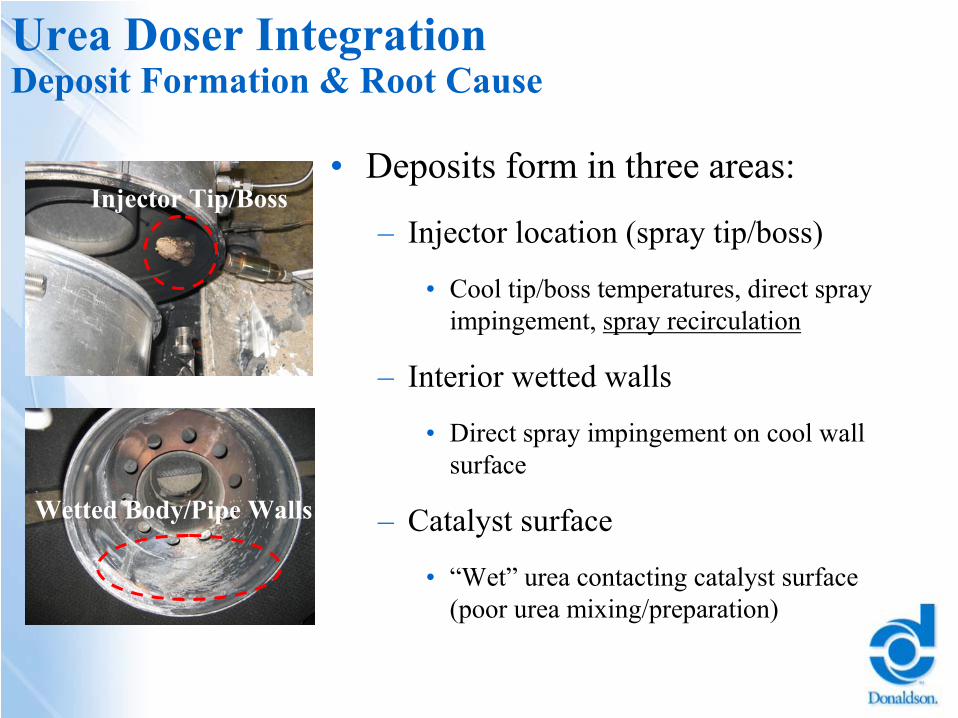
Urea Doser Integration Deposit Formation & Root Cause
•
Deposits form in three areas:
–
Injector location (spray tip/boss)
•
Cool tip/boss temperatures, direct spray impingement, spray recirculation
–
Interior wetted walls
•
Direct spray impingement on cool wall surface
–
Catalyst surface
•
“Wet”
urea contacting catalyst surface (poor urea mixing/preparation)
Injector Tip/Boss
Wetted Body/Pipe Walls
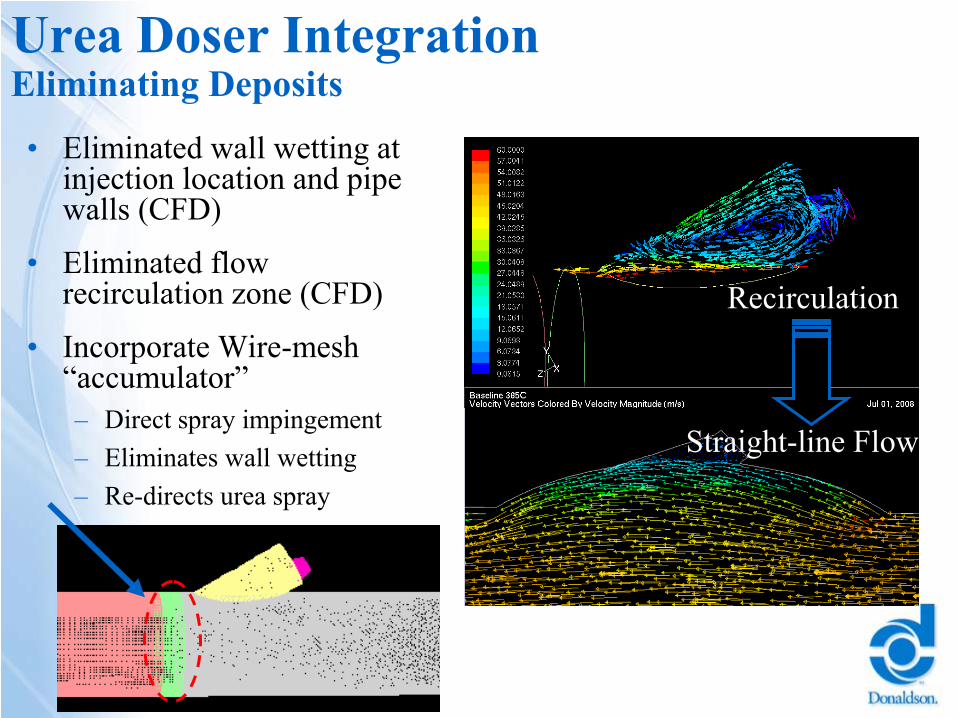
Urea Doser Integration Eliminating Deposits
•
Eliminated wall wetting at injection location and pipe walls (CFD)
•
Eliminated flow recirculation zone (CFD)
•
Incorporate Wire-mesh “accumulator”–
Direct spray impingement–
Eliminates wall wetting–
Re-directs urea spray
Recirculation
Straight-line Flow
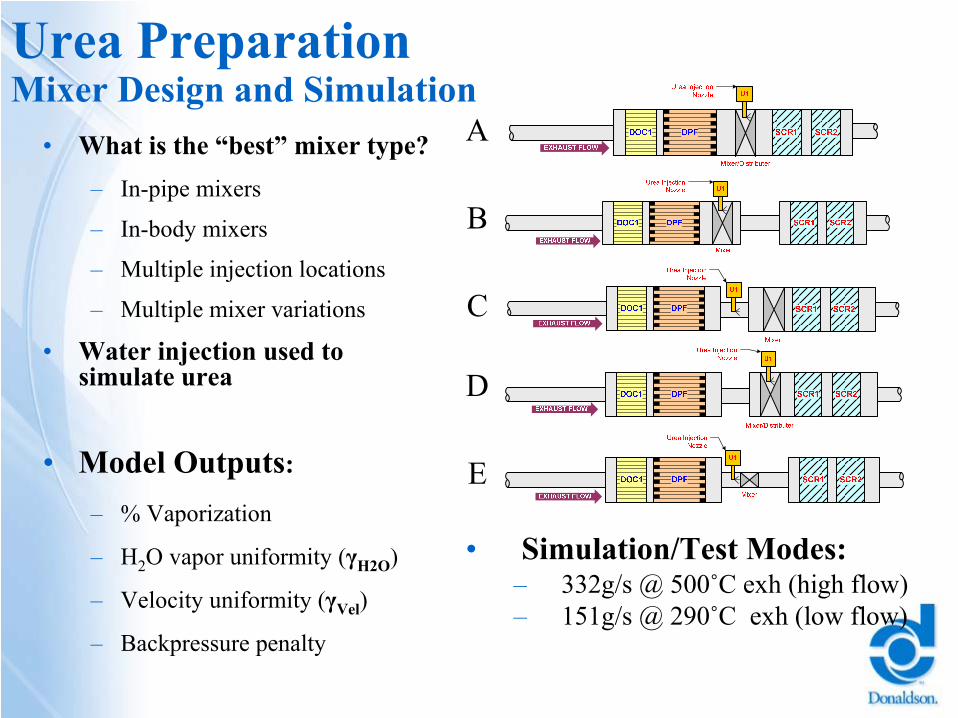
Urea Preparation Mixer Design and Simulation
•
What is the “best”
mixer type?–
In-pipe mixers
–
In-body mixers
–
Multiple injection locations
–
Multiple mixer variations
•
Water injection used to simulate urea
•
Model Outputs:
–
% Vaporization
–
H2
O vapor uniformity (γH2O
)
–
Velocity uniformity (γVel
)
–
Backpressure penalty
• Simulation/Test Modes:
–
332g/s @ 500˚C exh
(high flow)–
151g/s @ 290˚C exh
(low flow)
A
B
C
D
E
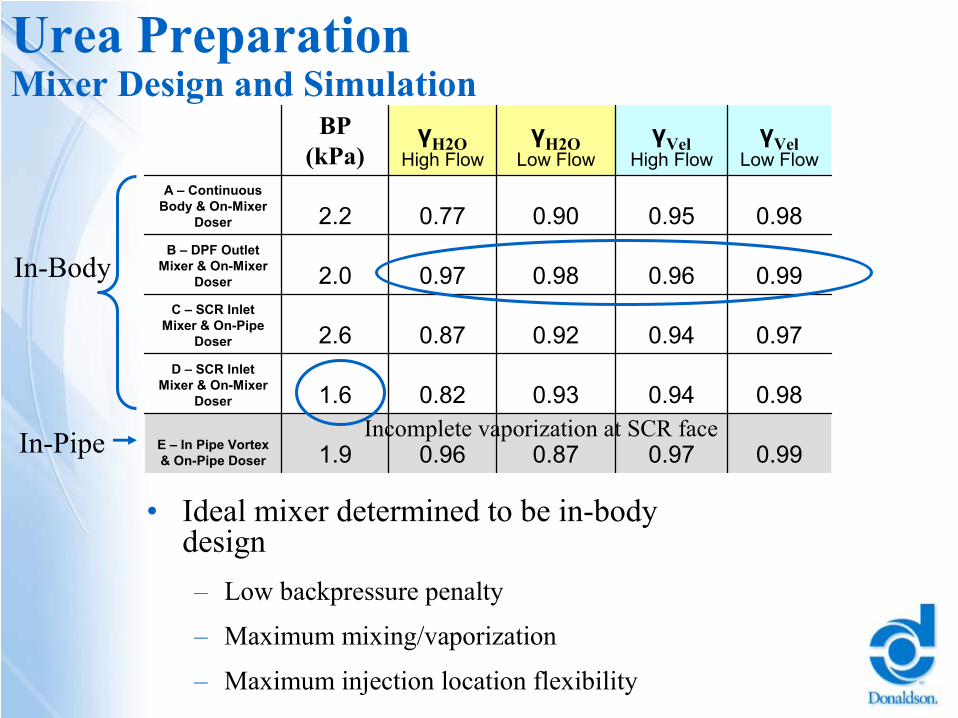
Urea Preparation Mixer Design and Simulation
•
Ideal mixer determined to be in-body design–
Low backpressure penalty
–
Maximum mixing/vaporization
–
Maximum injection location flexibility
BP (kPa)
γH2OHigh Flow
γH2OLow Flow
γVelHigh Flow
γVelLow Flow
A –
Continuous Body & On-Mixer
Doser 2.2 0.77 0.90 0.95 0.98B –
DPF Outlet Mixer & On-Mixer
Doser 2.0 0.97 0.98 0.96 0.99C –
SCR Inlet Mixer & On-Pipe
Doser 2.6 0.87 0.92 0.94 0.97D –
SCR Inlet Mixer & On-Mixer
Doser 1.6 0.82 0.93 0.94 0.98
E –
In Pipe Vortex & On-Pipe Doser 1.9 0.96 0.87 0.97 0.99
Incomplete vaporization at SCR face
In-Body
In-Pipe
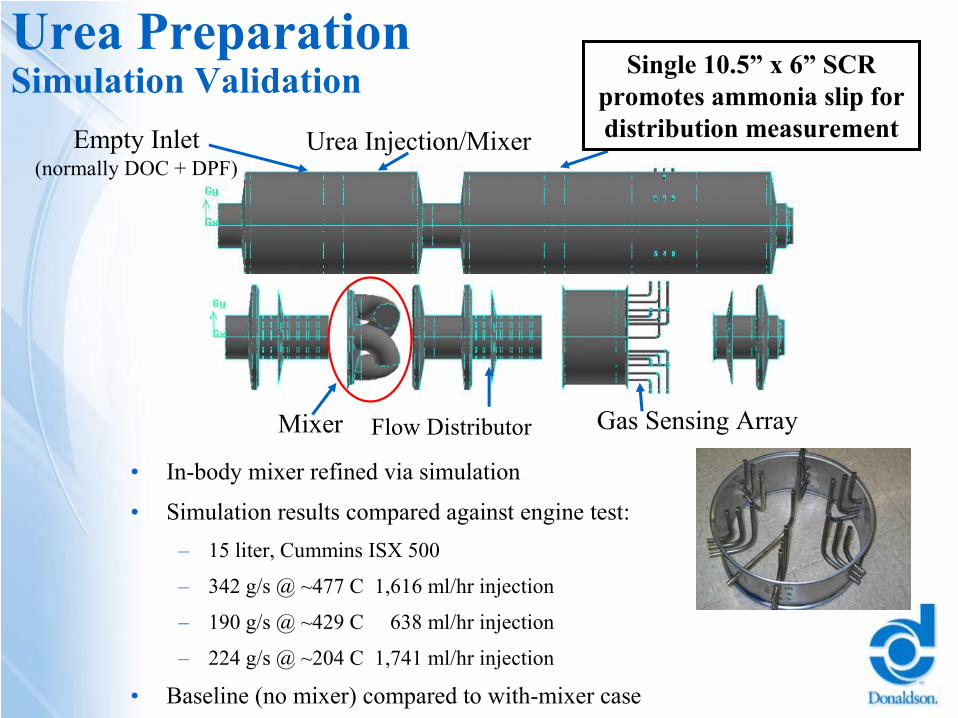
Urea Preparation Simulation Validation
•
In-body mixer refined via simulation
•
Simulation results compared against engine test:–
15 liter, Cummins ISX 500
–
342 g/s
@ ~477 C 1,616 ml/hr injection
–
190 g/s
@ ~429 C 638 ml/hr injection
–
224 g/s
@ ~204 C 1,741 ml/hr injection
•
Baseline (no mixer) compared to with-mixer case
Gas Sensing ArrayMixer
Empty Inlet(normally DOC + DPF)
Single 10.5”
x 6”
SCRpromotes ammonia slip for distribution measurement
Flow Distributor
Urea Injection/Mixer
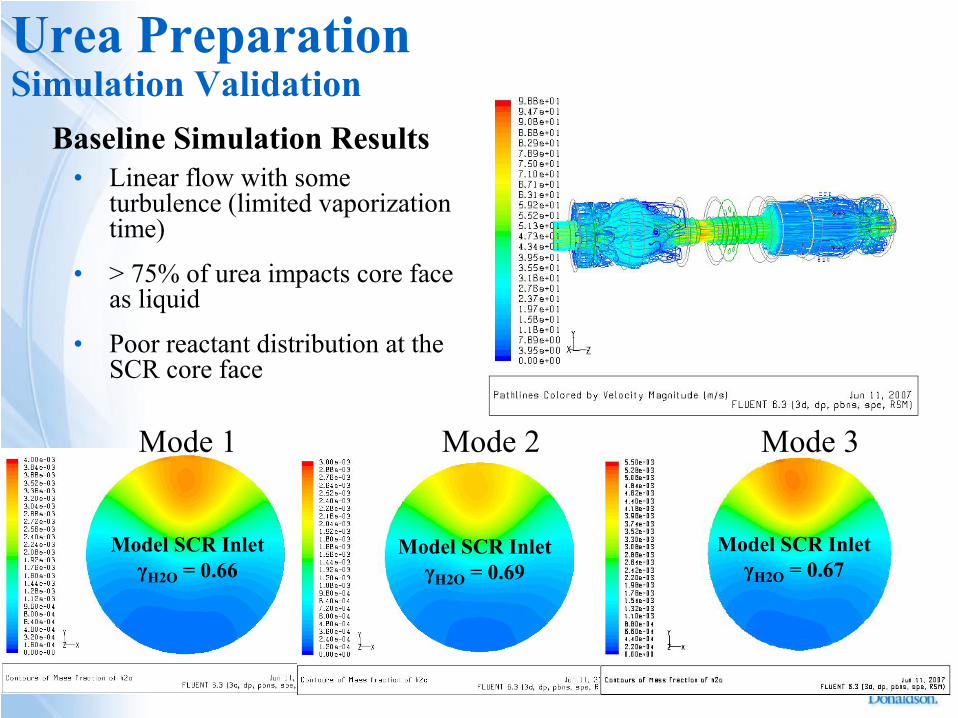
Model SCR InletγH2O
= 0.66Model SCR Inlet
γH2O
= 0.69Model SCR Inlet
γH2O
= 0.67
•
Linear flow with some turbulence (limited vaporization time)
•
> 75% of urea impacts core face as liquid
•
Poor reactant distribution at the SCR core face
Mode 1 Mode 2 Mode 3
Baseline Simulation Results
Urea Preparation Simulation Validation
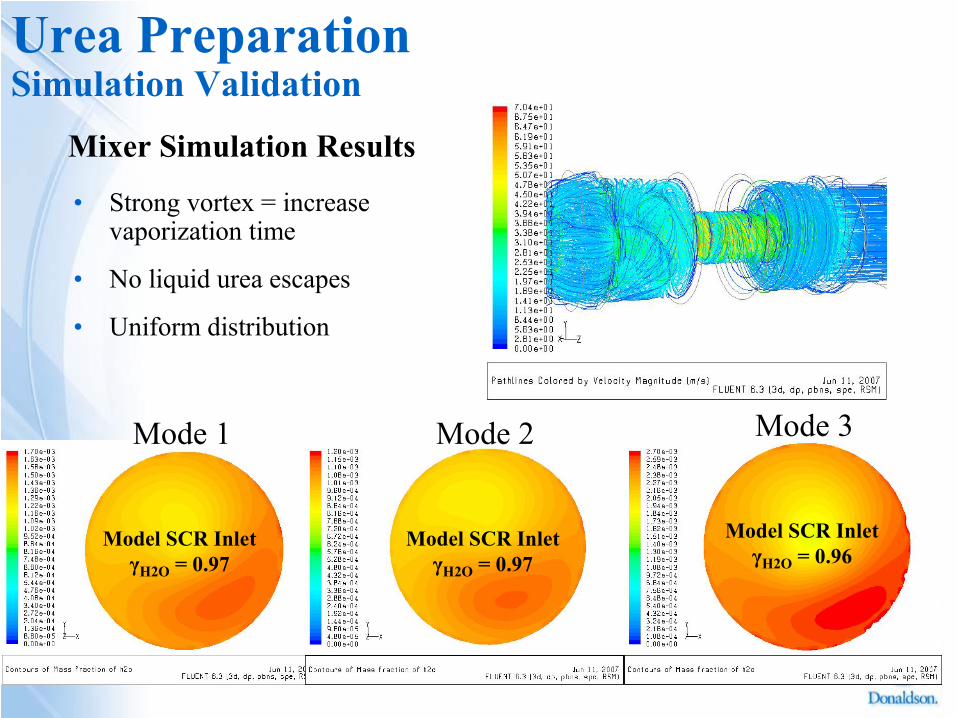
Model SCR InletγH2O
= 0.97Model SCR Inlet
γH2O
= 0.97Model SCR Inlet
γH2O
= 0.96
Mode 1 Mode 2 Mode 3
•
Strong vortex = increase vaporization time
•
No liquid urea escapes
•
Uniform distribution
Mixer Simulation Results
Urea Preparation Simulation Validation
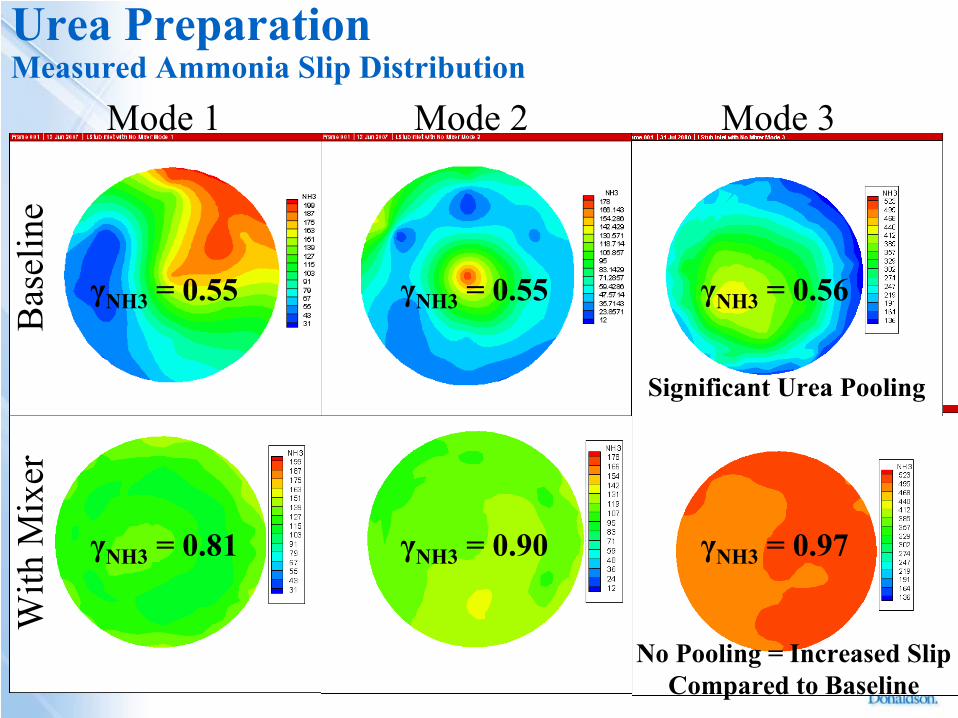
Urea Preparation Measured Ammonia Slip Distribution
γNH3
= 0.81 γNH3
= 0.90 γNH3
= 0.97
γNH3
= 0.55 γNH3
= 0.55 γNH3
= 0.56
Mode 1 Mode 2 Mode 3
Bas
elin
eW
ith M
ixer
Significant Urea Pooling
No Pooling = Increased SlipCompared to Baseline
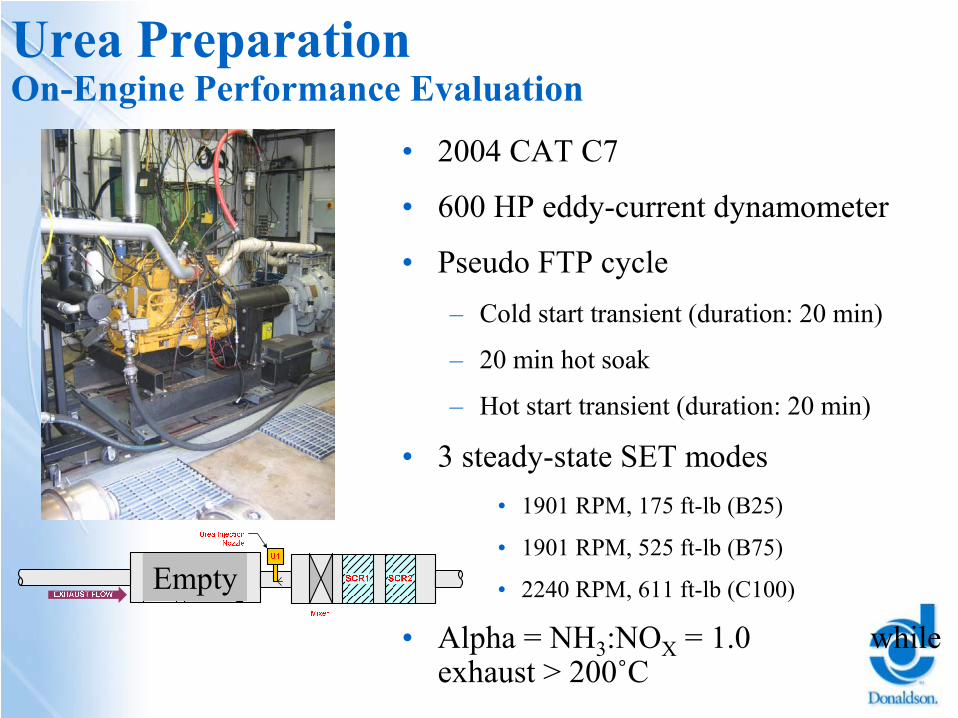
Urea Preparation On-Engine Performance Evaluation
•
2004 CAT C7
•
600 HP eddy-current dynamometer
•
Pseudo FTP cycle–
Cold start transient (duration: 20 min)
–
20 min hot soak
–
Hot start transient (duration: 20 min)
•
3 steady-state SET modes •
1901 RPM, 175 ft-lb (B25)
•
1901 RPM, 525 ft-lb (B75)
•
2240 RPM, 611 ft-lb (C100)
•
Alpha = NH3
:NOX
= 1.0 while exhaust > 200˚C
Empty
0%
10%
20%
30%
40%
50%
60%
70%
80%
90%
100%
1 2 3Mode
% N
ox R
educ
tion
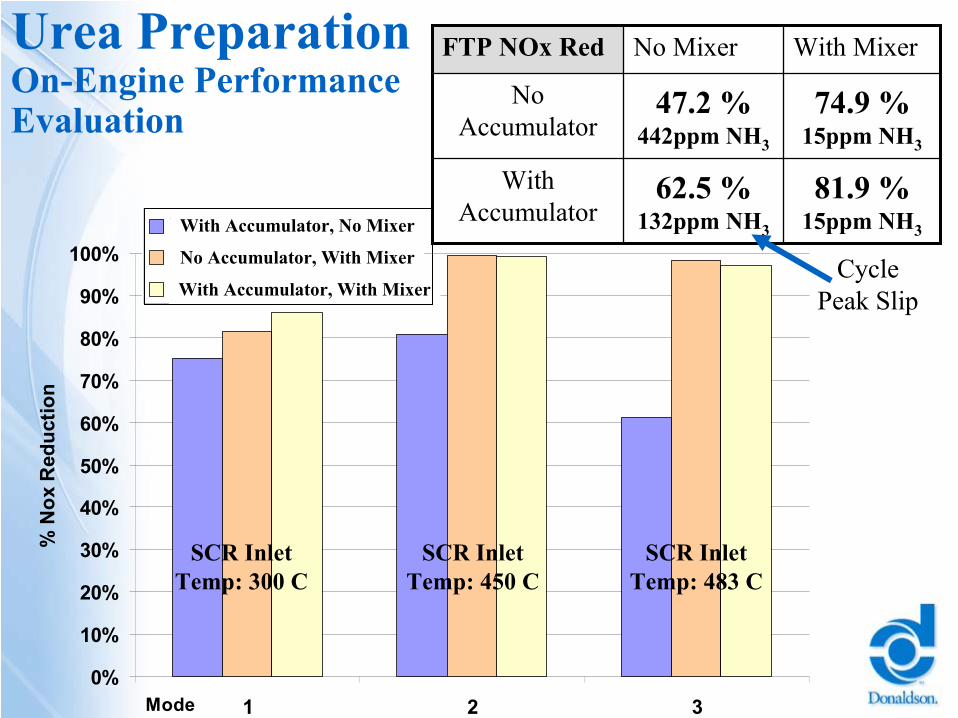
With Mesh No MixerNo Mesh With MixerWith Mesh With Mixer
SCR Inlet Temp: 300 C
SCR Inlet Temp: 450 C
SCR Inlet Temp: 483 C
Urea Preparation On-Engine Performance
Evaluation
FTP NOx Red No Mixer With Mixer
No Accumulator
47.2 % 442ppm NH3
74.9 % 15ppm NH3
With Accumulator
62.5 % 132ppm NH3
81.9 % 15ppm NH3
Cycle Peak Slip
With Accumulator, No Mixer
No Accumulator, With Mixer
With Accumulator, With Mixer
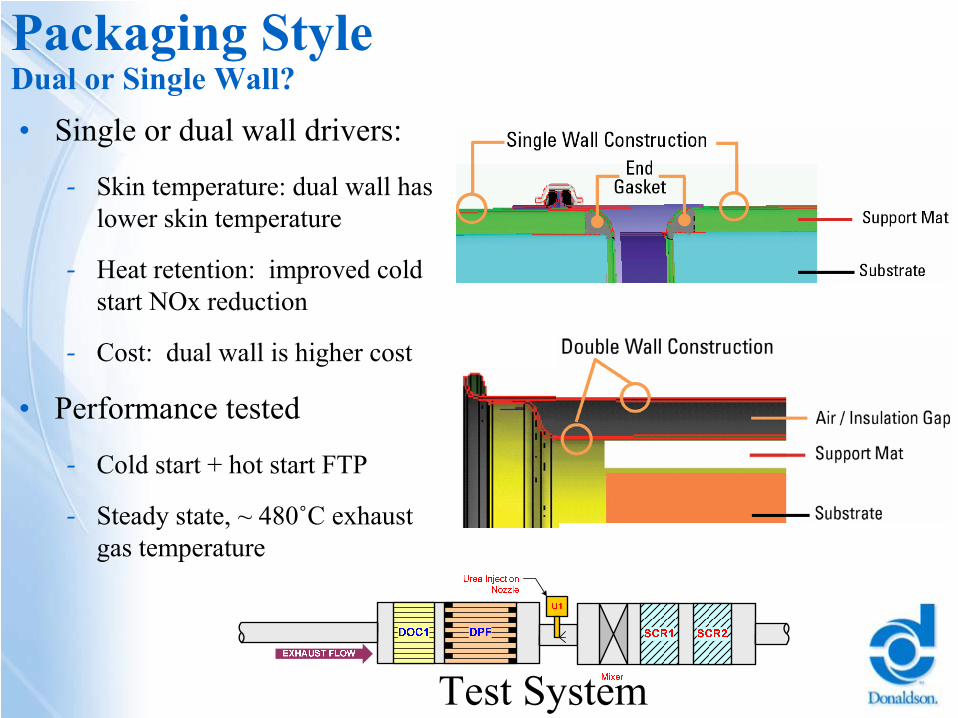
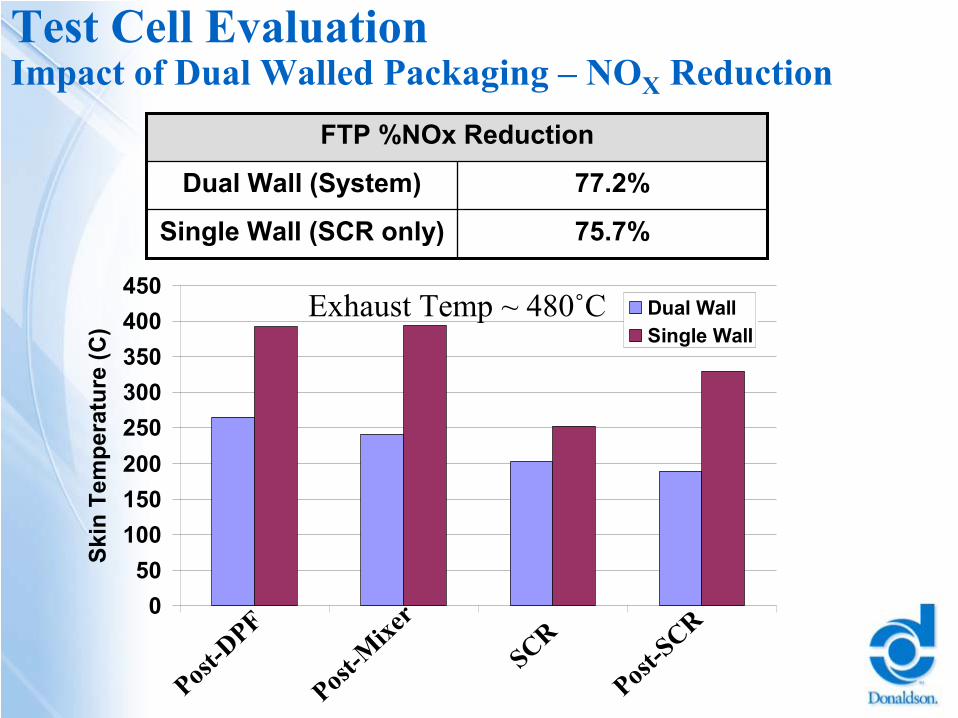
Packaging Style Dual or Single Wall?
•
Single or dual wall drivers:
-
Skin temperature: dual wall has lower skin temperature
-
Heat retention: improved cold start NOx reduction
-
Cost: dual wall is higher cost
•
Performance tested
-
Cold start + hot start FTP
-
Steady state, ~ 480˚C exhaust gas temperature
Test System
050
100150200250300350400450
Skin
Tem
pera
ture
(C)
Dual WallSingle Wall
Test Cell Evaluation Impact of Dual Walled Packaging –
NOX
ReductionFTP %NOx Reduction
Dual Wall (System) 77.2%
Single Wall (SCR only) 75.7%
Post-D
PF
Post-M
ixer
SCR
Post-SCR
Exhaust Temp ~ 480˚C
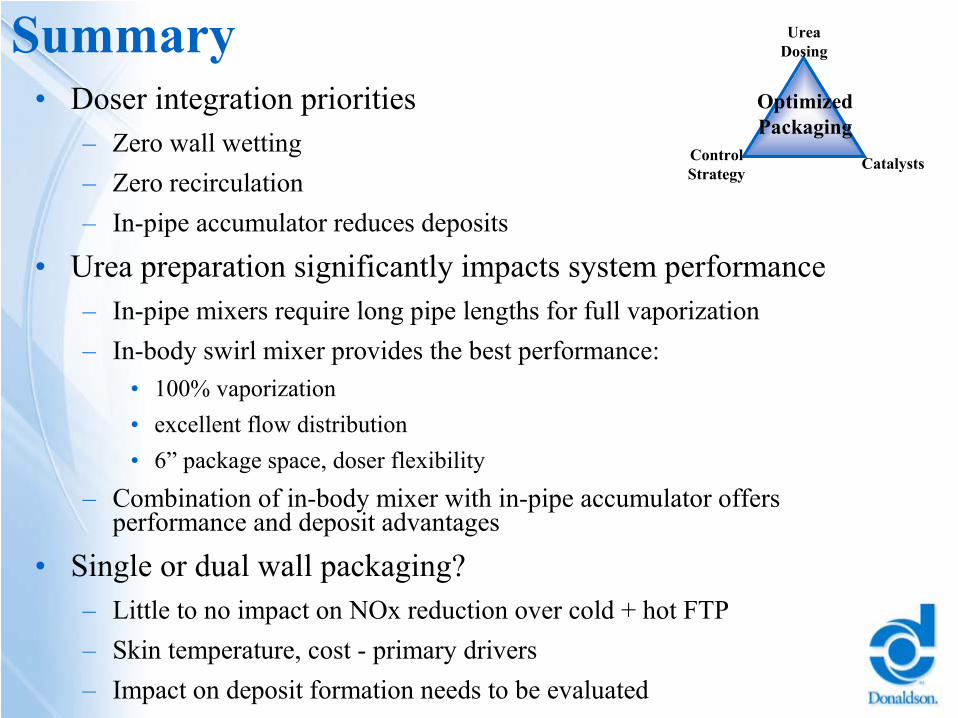
Summary•
Doser integration priorities–
Zero wall wetting–
Zero recirculation–
In-pipe accumulator reduces deposits
•
Urea preparation significantly impacts system performance–
In-pipe mixers require long pipe lengths for full vaporization–
In-body swirl mixer provides the best performance:•
100% vaporization •
excellent flow distribution •
6”
package space, doser flexibility–
Combination of in-body mixer with in-pipe accumulator offers performance and deposit advantages
•
Single or dual wall packaging? –
Little to no impact on NOx reduction over cold + hot FTP–
Skin temperature, cost -
primary drivers–
Impact on deposit formation needs to be evaluated
Control Strategy
Urea Dosing
Optimized Packaging
Catalysts