Embed Size (px)
Citation preview
Chapter 1
51
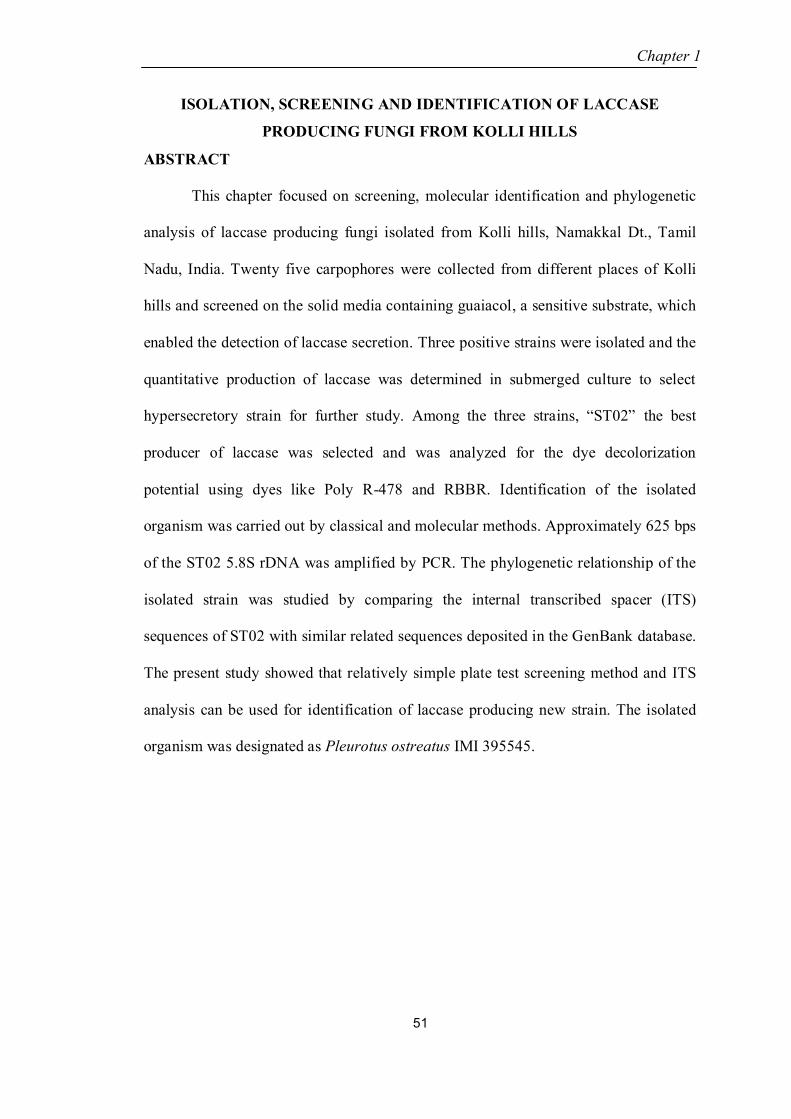
ISOLATION, SCREENING AND IDENTIFICATION OF LACCASE
PRODUCING FUNGI FROM KOLLI HILLS
ABSTRACT
This chapter focused on screening, molecular identification and phylogenetic
analysis of laccase producing fungi isolated from Kolli hills, Namakkal Dt., Tamil
Nadu, India. Twenty five carpophores were collected from different places of Kolli
hills and screened on the solid media containing guaiacol, a sensitive substrate, which
enabled the detection of laccase secretion. Three positive strains were isolated and the
quantitative production of laccase was determined in submerged culture to select
hypersecretory strain for further study. Among the three strains, “ST02” the best
producer of laccase was selected and was analyzed for the dye decolorization
potential using dyes like Poly R-478 and RBBR. Identification of the isolated
organism was carried out by classical and molecular methods. Approximately 625 bps
of the ST02 5.8S rDNA was amplified by PCR. The phylogenetic relationship of the
isolated strain was studied by comparing the internal transcribed spacer (ITS)
sequences of ST02 with similar related sequences deposited in the GenBank database.
The present study showed that relatively simple plate test screening method and ITS
analysis can be used for identification of laccase producing new strain. The isolated
organism was designated as Pleurotus ostreatus IMI 395545.

Chapter 1
52
1.1. INTRODUCTION
Laccases are interesting proteins for industrial applications because extensive
studies have shown the potential of fungal phenol oxidases as a biological alternative
for chemical oxidative processes e.g. pulp delignification, textile industry, food
industry, bioremediation, organic synthesis, pharmaceutical sector and
nanobiotechnology [Kunamneni et al., 2008b]. Recently, most of the laccase studied
are of fungal origin, especially from white-rot fungi, Anthracophyllum discolor
[Bustamante et al., 2010], Pycnoporus sanguineus [Eugenio et al., 2009],
Trichoderma harzianum [Sadhasivam et al., 2008] etc.
Screening of a large number of white-rot fungi is, therefore, necessary to
select strains that are able to produce high titers of laccases with novel characters.
Such a screening trial should, preferably, rely on the use of inexpensive, rapid and
sensitive testing methods and the screening strategy must be compiled in such a
manner as to identify fungal strains and enzymes that will work under industrial
conditions [Monteiro and De Carvalho, 1998]. Microbes that produce laccases have
been screened for either on solid media containing colored indicator compounds that
enable the visual detection of laccase production [Nishida et al., 1988; De Jong et al.,
1992; Barbosa et al., 1996] or with liquid cultivation monitored with enzyme activity
measurements [Myasoedova et al., 2008]. As laccases oxidize various types of
substrates, several different compounds have been used as indicators for laccase
production. Recently, Chhaya and Gupte [2010] identified a new strain Fusarium
incarnatum for the production of laccase using o-dianisidine in the plate test.
Inadequate experimentation may lead to the misidentification of a laccase for
other phenol oxidizing enzymes such as manganese peroxidase. The use of substrates

Chapter 1
53
such as syringaldazine and ABTS should be used with caution since these substrates
are catalyzed by both laccase and manganese peroxidase [Mayer and Staples, 2002].
Plate-test screening with laccase indicator compounds has been reported previously
[Alcalde et al., 2005; Mechichi et al., 2006; Kalmis et al., 2008; Liu et al., 2009].
In mycology, sequences from the ITS region of the nuclear rDNA are
commonly used for the identification of fungi [Koljalg et al., 2005; Naumann et al.,
2007; Nilsson et al., 2008]. The ITS sequence including both ITS1 and ITS2, which
are separated by the conserved short 5.8S rRNA, has been commonly used to infer
phylogenetic relationships of closely related species as well as to assess the variability
of a population, e.g. of geographically distant isolates (ecotypes). Since the ITS region
is highly conserved intra-specifically but variable between different species it is often
used in taxonomy [Koljalg et al., 2005]. Phylogenetic analysis is an essential
component of patenting the new organism. The evolutionary distance is generally
displayed in the form of trees and a wide diversity of algorithms was available to
construct them. Discovery of novel laccases with different substrate specificities and
improved physical properties such as thermostable or acid tolerant is important
qualities for industrial applications.
In this study, laccase-producing fungi were isolated from various samples
around the Eastern Ghats of Kolli hills using sensitive substrate. In addition, the
production of laccase by the positive strains was confirmed in liquid culture. The
isolated hypersecretory strain was identified by phylogenetic analysis.

Chapter 1
54
1.2. MATERIALS AND METHODS
1.2.1. Chemicals
Catalase, lactophenol cotton blue and potato dextrose agar (PDA) were
purchased from Himedia, (Mumbai, India). Chloromphenicol, Poly R-478 and
Remazol Brilliant Blue R (RBBR) were purchased from s d fine-chem Limited, India.
Benomyl (Benofit) was purchased from Coromondel fertilizers limited (Tamil Nadu,
India). SoluteReady® genomic DNA purification kit, PCR reagents, agarose gel
electrophoresis consumables and primers were purchased from Heleini Biomolecules,
(Chennai, India).
1.2.2. Isolation of microorganism
Twenty five basidiomycetous carpophores (stalk of a fruiting body in fungi)
were collected from the deep forest of Kolli hills in Namakkal Dt., Tamil Nadu, India.
Carpophores were picked and stored in thermocol boxes. The samples were then
sprayed with 70% ethanol and soaked in petri-dishes for 5 minutes for surface
sterilization. A sample of the interior flesh of the fruiting body was excised and
placed on the potato dextrose agar to isolate the fungi [Pant and Adholeya, 2007].
In addition, 0.01% (w/v) chloramphenicol or chlorotetracycline was added to the
media in order to inhibit the growth of bacteria and 1% (w/v) of Benomyl was added
in order to select for wood decay fungi [Maloy, 1974].
1.2.3. Screening test
The ability of the fungal strains to secrete extracellular laccase was visualized
according to the method of Kiiskinen et al. [2004]. The assay plate contained 15 ml of
4% potato dextrose agar amended with 0.01% of guaiacol. The plates were incubated

Chapter 1
55
at 30 C for 1–3 days. The presence of brick red color around the mycelium was
considered as guaiacol oxidizing laccase secreting organism.
1.2.4. Laccase production in liquid media
The selected three positive fungal strains detected in the plate-test, were
subjected to qualitative determination of laccase production in submerged culture
[Pant and Adholeya, 2007]. The strains were grown in 50 ml of 4% potato dextrose
broth (PDB) in a 100 ml Erlenmeyer flask. The flasks were incubated at 30 C on a
rotary shaker (120 rpm).
1.2.5. Dye decolorization potential
Dye decolorization potential of the isolated hypersecretory strain was carried
out according to the method of Kiiskinen et al. [2004]. 0.04% (w/v) Poly R-478 or
RBBR was added individually to 15 ml of 4% potato dextrose agar medium in petri
plates. The pH was adjusted to 5.5 before autoclaving at 121°C for 15 min. The dyes
were added to the media after autoclaving as sterile-filtered water solutions. The
positive reaction on the plate was visualized within 5-6 days of incubation at 30 °C.
1.2.6. Enzyme assay
Laccase activity was determined using guaiacol as the substrate according to
the method of Sandhu and Arora [1985]. The assay mixture contained 4.80 ml of
sodium phosphate buffer pH 6.0 (100 mM), 0.1 ml of guaiacol (10 mM) and 0.1 ml of
enzyme extract. One activity unit (U) was defined as the amount of enzyme oxidized
1μmol guaiacol per minute. The kinetic reaction was spectrophotometrically recorded
at 470 nm (ε = 21,600/M/cm) incubated at 60 °C for 30 min, in an UV-Visible
spectrophotometer 118 (Systronics, India). The blank contained all the assay

Chapter 1
56
constituents except the active enzyme, buffer or heat inactivated enzyme was used in
its place. The enzyme activity was expressed as U/l.
In order to rule out the role of peroxidases in the oxidation and prove the
oxidation was only by laccase, the enzyme was pre-incubated with catalase (1000
units/ml) ( EC: 1.11.1.6) for 30 min at 30 C prior to assay to remove any endogenous
hydrogen peroxide [Pointing, 2001].
Lignin peroxidase (LiP) and manganese dependent peroxidase activities
(MnP) were measured as follows.
Lignin Peroxidase (LiP), (EC 1.11.1.14) activity was determined by
monitoring the oxidation of veratryl alcohol to veratraldehyde (ε = 9,300/M/cm) at 37
°C as indicated by an increase in absorbance at 310 nm [Tien and Kirk, 1988]. The
reaction mixture (2.5 ml) contained 0.5 ml enzyme extract, 0.5 ml H2O2 (2 mM),
0.5 ml veratryl alcohol solution (10 mM ) and 1.0 ml sodium acetate buffer pH 3.0
(10 mM). One unit of enzyme activity was defined as the amount of enzyme oxidizing
1 μmol of substrate per minute. The enzyme activity was expressed as U/l.
Manganese Peroxidase (MnP), (EC 1.11.1.13) activity was measured with
phenol red as the substrate at 610 nm [Kuwahara et al., 1984]. Reaction mixture
contained 0.5 ml enzyme extract, 0.1 ml phenol red solution (0.1%), 0.1 ml sodium
lactate pH 4.5 (250 mM), 0.2 ml bovine serum albumin solution (0.5%), 0.05 ml
manganese sulphate (2 mM) and 0.05 ml H2O2 (2 mM) in sodium succinate buffer
pH 4.5 (20 mM). Activity was expressed as increase in absorbance at 610 nm per
minute per mililitre. One unit of enzyme activity was defined as the amount of
enzyme oxidizing 1 μmol of substrate per minute. The enzyme activity was expressed
as U/l.

Chapter 1
57
1.2.7. Fungal identification method
The classical method of identifying fungi is by using light microscopy. The
spore structure of the fungi was identified by Lactophenol cotton blue mounting
method [Aneja, 2005].
1.2.7.1. Isolation of genomic DNA
Twenty grams of mycelium was used for DNA isolation according to Hamelin
et al. [1996], with some modifications. The fungal mycelium grown on PDB was
harvested and any media attached to it was removed by washing with sterile water.
The washed sample was ground to a fine powder in liquid nitrogen. 15 ml of
extraction buffer (1.4 M NaCl, 0.1 M Tris-HCl (pH 8), 0.02 M EDTA, 200 μl β-2-
mercaptoethanol, 2 % cetyl-trimethyl-ammonium bromide) was added to 100 mg of
the grounded mycelia. The mixture was incubated at 65 °C for 1 h and extracted by
adding 10 ml of phenol: choloroform: isoamyl alcohol (25:24:1). This was gently
shaken and centrifuged at 15,000 rpm. Supernatant was transferred to a new tube and
the aqueous phase was precipitated with cold isopropanol by incubating for 1 h
at −20 °C, and then centrifuged for 15 min at 15,000 rpm. The pellets were washed
with 70% ethanol, air dried, resuspended in 50 μl of TE buffer (10 mM Tris-HCl
pH 8.0, 1 mM EDTA) and stored at 4 °C.
1.2.7.2. PCR targeting ITS region and sequencing the amplicon
From the total genomic DNA, a DNA segment containing the 3’ end of the
nuclear 18 S rDNA, ITS 1, 5.8 S rDNA, ITS 2 and the 5’ end of 28 S rDNA were
amplified using primers ITS1 (5´TCCGTAGGTGAACCTGCGG3´) and ITS 4
(5´TCCTCCGCTTATTGATATGC 3´) [White et al., 1990]. PCR amplification was
performed in a total volume of 25 μl. Amplification reactions (25 μl) contained 10 X

Chapter 1
58
Taq buffer, 2 mM MgCl2, 0.4 mM dNTP mix, and 2 U Proofreading Taq DNA
polymerase. 1 l of both forward primer and reverse primer (10 pmol/μl) were added
with 2 l of genomic DNA. The volume of the mixture was made up to 50 l by
adding 21 l of nuclease free water. The mixture was mixed gently and spun down
briefly for about 30 min. PCR was performed in a thermocycler (Corbett Research,
Austria). Initial denaturation of 95 °C for 2 min was followed by 30 cycles of 94 °C
for 1 min, 58 °C for 1 min (primer annealing), 72 °C for 1 min (primer extension).
A final extension of 72 °C for 5 min was incorporated, followed by cooling to 4 °C
until recovery of the samples. Sequencing of the PCR products was carried out by
HELINI Biomolecules (Chennai, India) on an ABI Prism 3100-Avant Genetic
Analyzer (USA) and the obtained sequence was aligned using the BioEdit sequence
alignment editor version 7.0.4.1.
1.2.7.3. Analysis of PCR product
Amplified PCR products were electrophoresed in a 2% agarose gel using
1X Tris–borate–EDTA buffer (100 mM Tris–HCl/l, pH 8.3, 83 mM boric acid/l,
1 mM EDTA/l) at 100V and visualized by ethidium bromide staining. Sizes of the
amplified products were determined using different size of standard DNA ladder. The
reproducibility of DNA profiles was tested by repeating twice the PCR amplification
with each of the selected primers. Only reproducible bands were considered for
analyses.
1.2.7.4. Analysis of sequence data
A comparative study has been carried out with other rDNA sequences with
the rDNA from the selected fungus (ST02) was accomplished using the BLAST
[Altschul et al., 1997] algorithm, at the website: http://www.ncbi.nlm.nih.gov.

Chapter 1
59
Thirty four most similar meaningful sequences related to the isolated fungal sequence
were downloaded and analyzed.
Related fungal sequences were selected by BLAST match and then by FASTA
query of the NCBI fungi data subset. The selected sequences were aligned by using
clustlW2 [Thompson et al., 1994] version CLUSTAL 2.0.12. All the sequences were
used to construct the phylogenetic tree by using Geneious pro trial 4.8.5 software with
the following parameters i.e. 65% similarity (5.0/-4.0) cost matrix, Gap open penalty
= 12, Gap extension penalty = 3. The construction of phylogenetic tree was based on
the Tamura et al. [2004] genetic distance model. The alignment was inspected closely
to ensure that were no PCR chimaera events.
1.3. RESULTS
Among the 25 samples collected, 3 strains were selected as positive organisms
which formed halo of intense brown color around the fungal colonies. Based on the
reddish brown zone, three strains were designated as ST01, ST02 and ST03 (Figure
1.1). Among the three isolated positive organisms, hypersecretory strain was selected
by quantitative production of laccase in the potato dextrose broth. Significant amount
of laccase activities were measured for all the three strains. Sample was drawn from
the culture for every 24 h to assay the production of laccase. Figure 1.2 shows the
production of laccase by selected strains. Among the three strains, ST02 which
showed highest production of laccase (410±1.6 U/l) was selected for the further
analysis.
The selected hypersecretory positive strain “ST02” was subjected
to decolorization of indicator dye compounds. Figure 1.3 displays qualitative
decolorization of Poly R-478 dye on incubation with ST02 strain. Initial pink color of

Chapter 1
60
the dye was decolorized to colorless on the 6th day of incubation with ST02. Figure
1.4 shows the RBBR dye was completely decolorized on 6th day of incubation. In the
case of RBBR, initial blue color of the dye was decolorized to colorless. The selected
strain “ST02” decolorized both the dyes effectively.
The pure culture of ST02 on potato dextrose agar was rich white aerial
mycelium (Figure 1.5). The reverse of the mycelia was colorless, pigmentation was
not produced even after two weeks of cultivation, hence the spores were used for
identification. In the lactophenol cotton blue staining, spores were cylindrical to
subcylindrical, thin-walled, hyaline, and not amyloid or dextrinoid, without germ pore
(Figure 1.6). The hyphal system may be monomitic or dimitic, without binding
hyphae. As the morphology was uninformative and ambiguous, rDNA sequence
comparison was used for identification.
Genomic DNA was successfully isolated from the selected fungus ST02. The
isolated DNA was confirmed by staining with ethidium bromide viewed under
transilluminator (Figure 1.7). The genomic DNA was subjected to PCR-amplification
of the ITS region of the rDNA using ITS1 and ITS4 primers. The approximate
number of the base pair of the amplified PCR products (~625) was determined with
the DNA ladder sequence (Figure 1.8). The ITS1–ITS4 primer pair was used to
amplify the intervening 5.8S rDNA and the adjacent ITS1 and ITS2 regions, with
partial sequence of 18S and 28S rDNA (Figure 1.9). The sequencing of the amplified
ITS gene sequence of 5.8S region was shown in the figure 1.10.
To identify the strain ST02, rDNA sequence comparison was used. The rDNA
sequence of ST02 was compared with the rDNA sequence of other fungi present in
the database. The obtained closely related sequence in the FASTA format and their

Chapter 1
61
length varies from 763 bp to 605 bp. The collected sequences were aligned by
clustalW2 (www.ebi.ac.uk/Tools/clustalW2/index.html.) (Appendix 1). To confirm
the identification, 5.8S rDNA region from ST02 was used. The sequence for the same
have been deposited in the gene bank under the following accession number
“GU967699.1” as shown in the figure 1.11. The phenogram reflecting the
phylogenetic relationship between ST02 was constructed using data from the Basic
Local Alignment Search Tool (BLAST) analysis of the rDNA region (Figure 1.12 and
figure 1.13). The details of the organisms, respective accession number of sequences
used to construct the trees are given in the table 1.1.
1.4. DISCUSSION
Among the 25 samples collected, three strains showed reddish brown halo
around the growing mycelium in PDA amended with guaiacol, the substrate for
laccase identification. The chromogen guaiacol is a very sensitive substrate that
allows rapid screening of fungal strains producing extracellular guaiacol oxidizing
enzymes by means of a color reaction [Okino et al., 2000]. The selected three strains
produced the laccase, which catalyzes the oxidative polymerization of guaiacol to
form reddish brown zones in the medium (Figure 1.1). The obtained results have good
agreement with the report of Kiiskinen et al. [2004] for the isolation of laccase
producing fungus.
Fungal strains that show positive reaction in the plate-test for the secretion of
laccase, where further analyzed in liquid culture for the quantitative estimation.
Among the three strains “ST02” secretes laccase on second day of the culture
whereas, other two strains secretes on next day. Maximum secretion of laccase was
seen on 12th
day of the culture (Figure 1.2). Among the three strains, ST02 produced

Chapter 1
62
the maximum laccase activity (410±1.6 U/l). The production of laccase peaks at the
late stage of cultivation. The above observation shows that the secreted enzyme is not
a primary metabolite and it was a secondary metabolite [Xavier, 2007]. On 15th
day
onwards the secretion of laccase was decreased in all the three strains. Mazumder et
al. [2009] observed that Pleurotus ostreatus have strong proteolytic activity in
submerged fermentation (SmF) presumably caused subsequent laccase degradation,
which lowered the ultimate laccase production in SmF compared to SSF.
The selected hypersecretory positive strain (ST02) was further investigated to
analyze the potential of decolorization of dyes like Poly R-478 and RBBR
individually. Dye decolorization and halo formation as a result of oxidation of
indicator colored compounds were due to lignolytic enzymes production [Couto et al.,
2000; Kiiskinen et al., 2004]. The isolated strain “ST02” decolorizes both the
indicator dyes successfully (Figure 1.3 and 1.4). According to Pant and Adholeya
[2007] a strain that turns the poly R-478 into yellow or colorless was considered as a
ligninolytic enzyme producing organism. The studies of Palmieri et al. [2005] and
Erkurt et al. [2007] proved that the decolorization of anthraquinonic dye RBBR was
solely due to the laccase activity. The decolorization of RBBR dye was used as a tool
for biodegradation studies it offers an additional advantage compared to usual
substrates. Moreover dyes are stable, soluble, possess high molar extinction
coefficients and low toxicity and can be applied in simple, rapid and quantitative
spectrophotometric assays. RBBR has widely been used since this compound
represents an important group of organopollutants [Deveci et al., 2004; Novotny et
al., 2004b].
The correlation between the guaiacol and polymeric dyes were good. The
color reactions with synthetic dyes and guaiacol are more easily detectable, detect
Chapter 1
63
more laccase-positives, and these compounds can thus reliably be used for laccase
activity screening [Kiiskinen et al., 2004]. According to Masalu [2004] the plate-test
with indicator compounds is an efficient and simple method for screening the
bioprospecting fungi with lignolytic enzymes for industrial applications.
The morphological characters of the isolated strain spores were uninformative
and confused with other related genera (Figure 1.5 and 1.6). Hence the molecular
method was used for the identification of isolated strain. ITS regions of fungal rDNA
have been successfully used for species identification [Pant and Adholeya, 2007].
The isolated strain “ST02” was identified using rDNA homology. Figure 1.7
shows the purified genomic DNA isolated from ST02. Figure 1.8 shows the
amplification of 5.8S rDNA of ST02 from the genomic DNA, which was ~625 bp,
this was closer to other similar sequences reported in NBCI database in table 1.1
(AY265829.1; AY854077.1; EF514247.1). The 5.8S rDNA sequence of “ST02” (GU
967699.1) was blasted in the nucleotide sequence data base of pubmed and the first
blast hit was Pleurotus ostreatus strain MUCL 28511(EF458642.1) which showed
90% query coverage and maximum identity. Another organism Pleurotus ostreatus
strain CCRC 36249 (AY265839.1) shared maximum query coverage of 96% with the
ITS sequence of the isolated strain ST02. Organism showing more than 90%
similarity in the 5.8S ITS sequence can be considered as belonging to the same
species [Sugita and Nishikawa, 2003], whereas for 18S rDNA sequence homology
needs, ≥ 99% sequence identity can safely be considered as belonging to the same
genus [Guarro et al., 1999].
Since the 5.8S rDNA is a hyper variable region, the evolutionary distance
resolved by ITS is usually restricted to demarcating within the species level and

Chapter 1
64
cannot be completely relied. The 5.8S rDNA sequence homology leads to the
conclusion that the isolated strain ST02 (GU 967699.1) belongs to the genus
Pleurotus and species ostreatus. Peterson et al. [2004] reported three penicillium sp
based on the ITS sequence and large subunit rDNA. Following a similar approach, a
new fungal strain of Bjerkandera audusta was identified by Kowalska et al. [2006].
A few other facts also correlated with the identification of the strain ST02.
Phylogenetic tree was constructed by two different methods (Neighbour joining
method and UPGMA method) for the obtained related ITS sequence of the isolated
strain. The main virtue of neighbor-joining relative to these other methods is its
computational efficiency. Unlike the UPGMA algorithm for phylogenetic tree
reconstruction, neighbor-joining does not assume that all lineages evolve at the same
rate (molecular clock hypothesis) and produces an unrooted tree. Phenogram was
constructed using neighbor-joining method and the evolutionary distance calculated
by the Tamura-Nei model shows that the strain Pleurotus ostreatus voucher HMAS
66080 (EF514248.1) was very close to the isolated strain (Figure 1.12). Alam et al.
[2010] reported that the size of ITS1 and ITS2 region varied among the strains and
ITS2 was more variable than that of ITS1, whereas the 5.8S sequence was identical to
the Pleurotus sp. Figure 1.13 shows the phenogram, constructed by UPGMA method
with the same sequence that was used for neighbor-joining method and the
distance was calculated by Tamura-Nei model, Pleurotus ostreatus strain MUCL
28511(EF458642.1) was very close to the isolated strain ST02, moreover this was
only strain which shares 90% of query coverage and and 90% maximum identity to
the isolated selected strain. Zervakis et al. [2004] used the 5.8S rDNA regions as
nucleotide sequence divergence portion for molecular phylogeny of mushroom

Chapter 1
65
species Pleurotus cystidiosus and allied taxa. The above discussion gives strong
correlation with 5.8S rDNA sequence with UPGMA phlylogenetic analysis.
The 5.8S rDNA sequence homology leads to conclusion that the isolated strain
“ST02” was new and belongs to the genus Pleurotus and species ostreatus. The above
organism was deposited and acknowledged by Commonwealth Agricultural Bureaux
International (CABI) as “Pleurotus ostreatus IMI 395545”.
1.5. CONCLUSION
This study showed that high laccase producers can be discovered from
environmental samples by very simple plate test screening methods. Guaiacol is a
sensitive substrate for screening the laccase producing organisms. Dye decolorization
potential of the fungus was also determined for the future applications. Using 5.8S
rDNA sequences, a number of fungi species have been identified. The present study
has proved that 5.8S rDNA sequence analysis is a valuable tool for the detection of
genus and species of unknown fungus. In addition, their evolutionary relationships
could provide an important clue for further exploration of new strains. NJ and
UPGMA method of phylogenetic analysis is more reliable method to find new fungal
strains based on ITS sequence.

Chapter 1
66
Figure 1.1. Oxidative polymerization of guaiacol to reddish brown zones in the
medium by positive strains.
Figure 1.2. Laccase production by the selected three positive strains in potato
dextrose broth.
0
50
100
150
200
250
300
350
400
450
2 4 6 8 10 12 14 16
Days
Lac
case
act
ivit
y (
U/l
)
ST01 ST02 ST03

Chapter 1
67
Figure 1.3. Poly-R478 oxidation by ST02. (A) Day 0 (B) Day 6.
Figure 1.4. RBBR oxidation by ST02. (A) Day 0 (B) Day 6.
A B

Chapter 1
68
Figure 1.5. Pure culture of the isolated strain ST02.
Figure 1.6. Mycelium structure of the strain ST02 in light microscope 40 X.

Chapter 1
69
Figure 1.9. Schematic representation of the fungal ribosomal genes containing
the primer target areas used in this study [Sugita and Nishikawa,
2003].
Nuclear small rDNA 18S ITS 1 ITS 2 5.8 S
rDNA
Nuclear large rDNA (25-28S)
ITS 1
ITS 4
Figure 1.7. Lane 1: Genomic DNA of
ST02. Lane 2: DNA
Ladder.
Lane 2: Lambda DNA / Hind III
digest.
Figure 1.8. Lane 1: PCR amplification of
5.8S rDNA (625 bp). Lane 2:
DNA Ladder.
500bp
23130bp
9416bp
6557bp
4361bp
2322bp
2027bp
Lane 1 Lane 2 Lane 1 Lane 2
1000bp
750bp
250bp
100bp
625bp

Chapter 1
70
Figure 1.10. The sequencing of amplified ITS gene sequence of ST02 5.8S rDNA.

Chapter 1
71
Figure 1.11. 5.8S rDNA sequence of the strain ST02 (Pleurotus ostreatus RP7)
in NCBI web site.

Chapter 1
72
Figure 1.12. Phenogram of ST02 (GU967699.1) constructed based on 5.8S
rDNA sequences using neighbor-joining method.

Chapter 1
73
Figure 1.13. Phenogram of ST02 (GU967699.1) constructed based on 5.8S
rDNA sequences using UPGAM method.

Chapter 1
74
Table 1.1. List of Sequences showing significant alignments with Pleurotus
ostreatus isolate RP7 (ST02) 5.8S rDNA
Accession No Name of the strain Length Q.C* M.I**
GU967699.1 Pleurotus ostreatus isolate RP7 625 100 100
AB286167.1 Pleurotus eryngii 660 86 91
AY265815.1 Pleurotus columbinus strain CBS
281.32
639 86 91
AY265829.1 Pleurotus ostreatus f. florida strain
ATCC 38539
638 86 90
AY265831.1 Pleurotus ostreatus f. florida strain
ASI 2016
638 86 90
AY265832.1 Pleurotus floridanus strain CCRC
36038
640 86 91
AY265839.1 Pleurotus ostreatus strain CCRC
36249
640 96 91
AY265848.1 Pleurotus spodoleucus strain ASI
2012
640 86 91
AY368663.1 Pleurotus floridanus strain CCRC
36210
640 86 91
AY368665.1 Pleurotus ostreatus strain ASI 2029 640 86 91
AY540325.1 Pleurotus ostreatus strain S042 673 86 91
AY540326.1 Pleurotus sapidus strain S046 669 86 91
AY540327.1 Pleurotus sapidus strain S047 703 86 91
AY540332.1 Pleurotus ostreatus strain S474 678 86 91
AY581431.1 Pleurotus nebrodensis isolate W6 620 84 91
AY581432.1 Pleurotus nebrodensis isolate W7 605 84 91
AY581433.1 Pleurotus nebrodensis isolate W8 624 86 91
AY581434.1 Pleurotus nebrodensis isolate WW 678 86 91
AY854077.1 Pleurotus ostreatus isolate AFTOL-
ID 564
630 86 91

Chapter 1
75
DQ077884.1 Pleurotus ostreatus 640 86 91
DQ077886.1 Pleurotus spodoleucus 639 86 91
DQ077887.1 Pleurotus nebrodensis 639 86 91
DQ333236.1 Pleurotus eryngii clone 3 692 86 91
EF458642.1 Pleurotus ostreatus strain MUCL
28511
763 90 90
EF458649.1 Pleurotus sajor-caju strain MUCL
31674
710 86 91
EF514247.1 Pleurotus ostreatus strain CGMCC
5.37
629 86 91
EF514248.1 Pleurotus ostreatus voucher HMAS
66080
662 86 91
EU424284.2 Pleurotus cornucopiae strain
ACCC50234
617 82 92
EU424300.2 Pleurotus ostreatus strain CBS
593.82
679 86 91
EU424301.2 Pleurotus cornucopiae strain
ACCC50375
630 83 92
EU424316.2 Pleurotus sapidus strain
ACCC50155
679 86 91
FJ501549.1 Pleurotus ostreatus/Coprinus
comatus fusant isolate SMCC4.11.15
661 86 91
FJ501564.1 Pleurotus ostreatus isolate
SMCC4.03.14
661 86 91
FJ501571.1 Pleurotus ostreatus/Coprinus
comatus fusant isolate SMCC4.11.7
660 86 91
FJ810181.1 Pleurotus sapidus strain dd08093 703 86 91
Q.C* = Query Coverage M.I** = Max Identity