Embed Size (px)
Citation preview
819
Screening for Diabetic Retinopathy Using Computer Visionand Physiological Markers
Christopher E. Hann, Ph.D., B.Sc.,1 James A. Revie, BE(Hons),1 Darren Hewett, BE(Hons),1J. Geoffrey Chase, B.S., M.S., Ph.D.,1,2 and Geoffrey M. Shaw, MBChB, FANCZA, FJFICM3
Author Affiliations: 1University of Canterbury, Centre for Bio-Engineering, Department of Mechanical Engineering, Christchurch, New Zealand; 2Christchurch School of Medicine and Health Sciences, University of Otago, Christchurch, New Zealand; and 3University of Otago School of Medicine, Christchurch, New Zealand, and Department of Intensive Care, Christchurch Hospital, New Zealand
Abbreviations: (DHs) dot hemorrhages, (DR) diabetic retinopathy, (LCR) largest connected region, (NPV) negative prediction value, (PPV) positive prediction value
Keywords: computer vision, diabetes, diabetic retinopathy, digital images, fundus images, image processing
Corresponding Author: Christopher E. Hann, University of Canterbury, Centre for Bio-Engineering, Department of Mechanical Engineering, Private Bag 4800, Christchurch, New Zealand; email address [email protected]
Journal of Diabetes Science and Technology Volume 3, Issue 4, July 2009 © Diabetes Technology Society
Abstract
Background:Hyperglycemia and diabetes result in vascular complications, most notably diabetic retinopathy (DR). The prevalence of DR is growing and is a leading cause of blindness and/or visual impairment in developed countries. Current methods of detecting, screening, and monitoring DR are based on subjective human evaluation, which is also slow and time-consuming. As a result, initiation and progress monitoring of DR is clinically hard.
Methods:Computer vision methods are developed to isolate and detect two of the most common DR dysfunctions—dot hemorrhages (DH) and exudates. The algorithms use specific color channels and segmentation methods to separate these DR manifestations from physiological features in digital fundus images. The algorithms are tested on the first 100 images from a published database. The diagnostic outcome and the resulting positive and negative prediction values (PPV and NPV) are reported. The first 50 images are marked with specialist determined ground truth for each individual exudate and/or DH, which are also compared to algorithm identification.
Results:Exudate identification had 96.7% sensitivity and 94.9% specificity for diagnosis (PPV = 97%, NPV = 95%). Dot hemorrhage identification had 98.7% sensitivity and 100% specificity (PPV = 100%, NPV = 96%). Greater than 95% of ground truth identified exudates, and DHs were found by the algorithm in the marked first 50 images, with less than 0.5% false positives.
Conclusions:A direct computer vision approach enabled high-quality identification of exudates and DHs in an independent data set of fundus images. The methods are readily generalizable to other clinical manifestations of DR. The results justify a blinded clinical trial of the system to prove its capability to detect, diagnose, and, over the long term, monitor the state of DR in individuals with diabetes.
J Diabetes Sci Technol 2009;3(4):819-834
ORIGINAL ARTICLES

820
Screening for Diabetic Retinopathy Using Computer Vision and Physiological Markers Hann
www.journalofdst.orgJ Diabetes Sci Technol Vol 3, Issue 4, July 2009
Introduction
Diabetic retinopathy (DR) is one of the main causes of blindness and visual impairment in developed countries.1–2 In the United States the prevalence rates of retinopathy and vision-threatening retinopathy are estimated to be 40.3 and 8.2%, respectively, for diabetic adults 40 years or older.3 Within the next 15 to 30 years the number of people with diabetes is expected to double due to factors such as obesity, an aging population, and inactive lifestyles.4 Studies have shown that early detection, combined with appropriate treatment and management, can prevent the loss of vision in up to 95% of cases.2,5–7 DR is the manifestation of systemic disease, which affects up to 80% of all patients who have had diabetes for 10 years or more.8 The high prevalence of diabetes therefore makes mass screening an expensive and time-consuming process.
It has been shown that an automated system could greatly reduce the workload by filtering out 50% of the screening population.9 A large retrospective analysis of 10,000 consecutive patient visits has been performed,10 but it was concluded that automated detection of DR using published algorithms cannot yet be recommended for clinical practice. In addition, it was also concluded10 that if the algorithms can be improved, such a system may lead to improved prevention of blindness and vision loss in patients with diabetes.
Diabetic retinopathy results from the leakage of small vessels in the retina correlated to a prolonged period of hyperglycemia. In the early stages of the disease, known as nonproliferative retinopathy, there may be hemorrhages due to bleeding of the capillaries or exudates resulting from protein deposits in the retina. There is usually no vision loss unless there is a build-up of fluid in the center of the eye. As the disease progresses, new abnormal vessels grow in the retina, known as neovascularization. These vessels frequently leak into the vitreous. This stage of the disease is called proliferative retinopathy and may cause severe visual problems. The goal of the screening system is to detect the nonproliferative stage of DR so that the disease can be managed appropriately to decrease the chances of vision impairment.
The use of seven-field stereo fundus photography reviewed by a trained reader to diagnose DR is the current, noninvasive gold standard. DR grading using fundus images is significantly more sensitive than
standard opthalmoscopy, which can miss approximately 50% of subjects with only microaneurysms, resulting in underreporting of DR prevalence rates by approximately 10%.11,12 Research has demonstrated combining fundus photography and computer algorithms to automatically grade DR (e.g., see Abramoff and colleagues10). These algorithms search for bad lesions in the fundus images, which define the severity of DR. The lesions are categorized into microaneurysms, hemorrhages, and exudates based on their location, morphology, and color. However, most rely on training sets that are human marked or graded, thus introducing subjective evaluation.
Thus, a method developed by Sanchez and colleagues13 to detect hard exudates produced a sensitivity of 88% with an average of 4.83 false positives per image. Walter and associates14 developed a method to detect micro-aneurysms and obtained a sensitivity of 88.5% with an average of 2.13 false positives per image. For the problem of just detecting DR, the method of Sinthnayothin and colleagues15 correctly identified 90.1% of patients with retinopathy and 81.3% of patients without retinopathy. Therefore, Sinthnayothin and associates15 identified 18.7% false positives, which is quite large and is a typical problem in most methods. As noted, the most common current approaches to automating DR screening are statistical classifying methods9,13–15 and/or neural networks and similar methods.16,17
This article takes an alternative, more analytical approach by focusing on direct identification using accurate geometric models at the preprocessing stage. Two independent algorithms were developed to detect exudates and dot hemorrhages (DHs). Information from color, morphology, and intensity gradients of the fundus photograph provides the means to detect the number of exudates and DHs, thus determining the presence of DR. It uses additional standard computer vision algorithms to identify and eliminate false positives, without reducing true positive results. Overall, this article thus focuses on the problem of detecting DR accurately, rather than just grading images, which is a salient difference from most prior work. In addition, it focuses on identifying lesions or diseases independently, rather than all at once, even though only one image is used. Finally, it is thus based on directly identifying physiologically observed states and uses that information directly, which some other approaches ignore in whole or part.
821
Screening for Diabetic Retinopathy Using Computer Vision and Physiological Markers Hann
www.journalofdst.orgJ Diabetes Sci Technol Vol 3, Issue 4, July 2009
MethodologyTwo separate algorithms are written for automatically detecting exudates and dot hemorrhages. The algorithms were developed based on fundus images from the Diaret dbO_v_1_1 database.19,20 The images were captured using a 50 degree field of view and resolution of 1.5 megapixels. Imaging noise, optical aberrations, and accuracy of the photometric information are unknown for the photographs. Note that the images from the database do not correspond to any typical population, but were selected dedicatedly so that the sample is biased.20 The types of DR present in the images were dot hemorrhages, exudates, microaneurysms, and neovascularization. A non-DR related lesion is drusen. Drusen are bright lesions associated especially with age-related macular degeneration, which can have a similar appearance to exudates.21 However, because no drusen were reported in the ground truths of the database, it was not possible to develop an algorithm to differentiate between drusen and exudates. Future work will address this issue. The two methods used to test the images for DHs and exudates are outlined in separate sections with a summary at the end.
Exudate DetectionExudates are common abnormalities in the retina of diabetic patients. Exudates are bright lipids leaked from a blood vessel. The leaked fluid tends to stay close to the lesion, giving a generally well-defined edge suitable for computer analysis (e.g., see Ege and colleagues18).
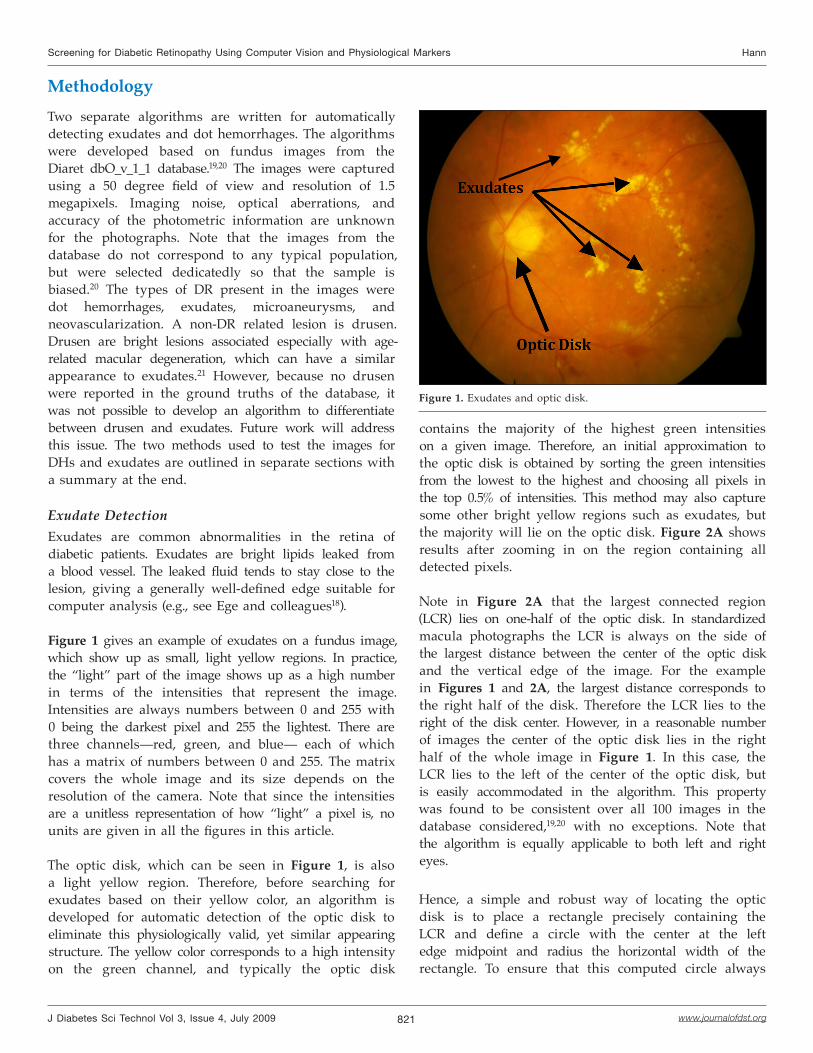
Figure 1 gives an example of exudates on a fundus image, which show up as small, light yellow regions. In practice, the “light” part of the image shows up as a high number in terms of the intensities that represent the image. Intensities are always numbers between 0 and 255 with 0 being the darkest pixel and 255 the lightest. There are three channels—red, green, and blue— each of which has a matrix of numbers between 0 and 255. The matrix covers the whole image and its size depends on the resolution of the camera. Note that since the intensities are a unitless representation of how “light” a pixel is, no units are given in all the figures in this article.
The optic disk, which can be seen in Figure 1, is also a light yellow region. Therefore, before searching for exudates based on their yellow color, an algorithm is developed for automatic detection of the optic disk to eliminate this physiologically valid, yet similar appearing structure. The yellow color corresponds to a high intensity on the green channel, and typically the optic disk
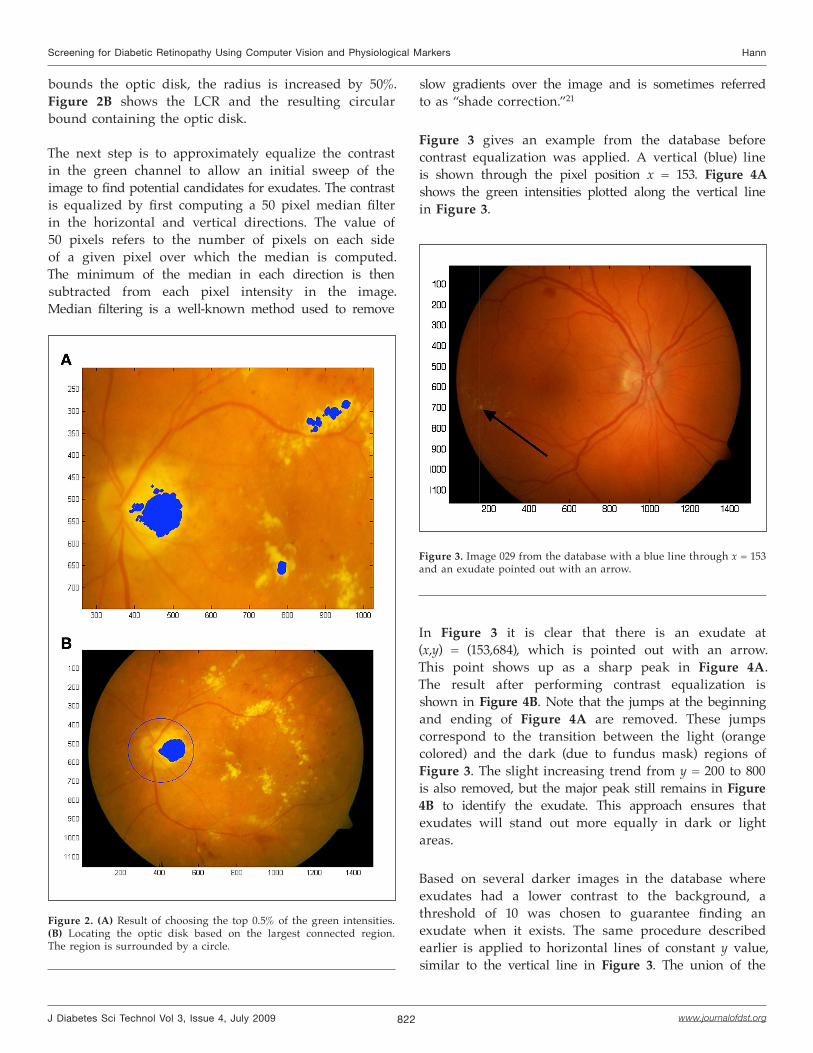
contains the majority of the highest green intensities on a given image. Therefore, an initial approximation to the optic disk is obtained by sorting the green intensities from the lowest to the highest and choosing all pixels in the top 0.5% of intensities. This method may also capture some other bright yellow regions such as exudates, but the majority will lie on the optic disk. Figure 2A shows results after zooming in on the region containing all detected pixels.
Note in Figure 2A that the largest connected region (LCR) lies on one-half of the optic disk. In standardized macula photographs the LCR is always on the side of the largest distance between the center of the optic disk and the vertical edge of the image. For the example in Figures 1 and 2A, the largest distance corresponds to the right half of the disk. Therefore the LCR lies to the right of the disk center. However, in a reasonable number of images the center of the optic disk lies in the right half of the whole image in Figure 1. In this case, the LCR lies to the left of the center of the optic disk, but is easily accommodated in the algorithm. This property was found to be consistent over all 100 images in the database considered,19,20 with no exceptions. Note that the algorithm is equally applicable to both left and right eyes.
Hence, a simple and robust way of locating the optic disk is to place a rectangle precisely containing the LCR and define a circle with the center at the left edge midpoint and radius the horizontal width of the rectangle. To ensure that this computed circle always
Figure 1. Exudates and optic disk.
822
Screening for Diabetic Retinopathy Using Computer Vision and Physiological Markers Hann
www.journalofdst.orgJ Diabetes Sci Technol Vol 3, Issue 4, July 2009
slow gradients over the image and is sometimes referred to as “shade correction.”21
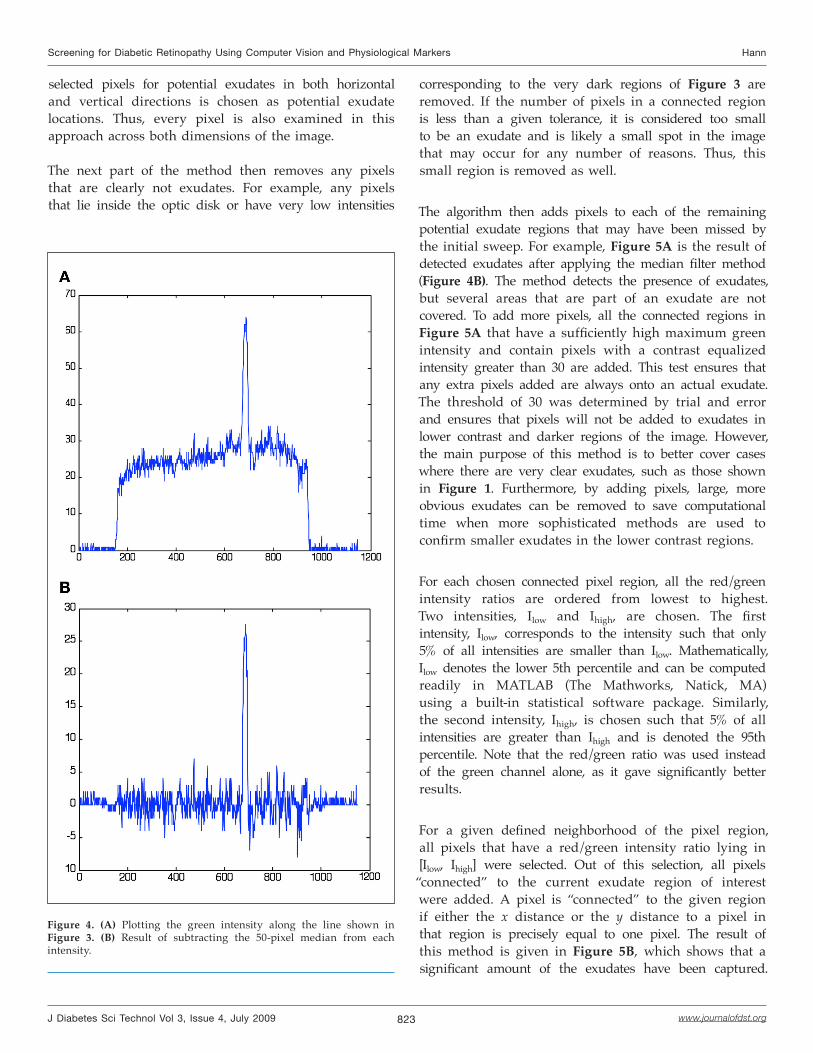
Figure 3 gives an example from the database before contrast equalization was applied. A vertical (blue) line is shown through the pixel position x = 153. Figure 4A shows the green intensities plotted along the vertical line in Figure 3.
In Figure 3 it is clear that there is an exudate at (x,y) = (153,684), which is pointed out with an arrow. This point shows up as a sharp peak in Figure 4A. The result after performing contrast equalization is shown in Figure 4B. Note that the jumps at the beginning and ending of Figure 4A are removed. These jumps correspond to the transition between the light (orange colored) and the dark (due to fundus mask) regions of Figure 3. The slight increasing trend from y = 200 to 800 is also removed, but the major peak still remains in Figure 4B to identify the exudate. This approach ensures that exudates will stand out more equally in dark or light areas.
Based on several darker images in the database where exudates had a lower contrast to the background, a threshold of 10 was chosen to guarantee finding an exudate when it exists. The same procedure described earlier is applied to horizontal lines of constant y value, similar to the vertical line in Figure 3. The union of the
Figure 3. Image 029 from the database with a blue line through x = 153 and an exudate pointed out with an arrow.
bounds the optic disk, the radius is increased by 50%. Figure 2B shows the LCR and the resulting circular bound containing the optic disk.
The next step is to approximately equalize the contrast in the green channel to allow an initial sweep of the image to find potential candidates for exudates. The contrast is equalized by first computing a 50 pixel median filter in the horizontal and vertical directions. The value of 50 pixels refers to the number of pixels on each side of a given pixel over which the median is computed. The minimum of the median in each direction is then subtracted from each pixel intensity in the image. Median filtering is a well-known method used to remove
Figure 2. (A) Result of choosing the top 0.5% of the green intensities. (B) Locating the optic disk based on the largest connected region. The region is surrounded by a circle.
823
Screening for Diabetic Retinopathy Using Computer Vision and Physiological Markers Hann
www.journalofdst.orgJ Diabetes Sci Technol Vol 3, Issue 4, July 2009
selected pixels for potential exudates in both horizontal and vertical directions is chosen as potential exudate locations. Thus, every pixel is also examined in this approach across both dimensions of the image.
The next part of the method then removes any pixels that are clearly not exudates. For example, any pixels that lie inside the optic disk or have very low intensities
corresponding to the very dark regions of Figure 3 are removed. If the number of pixels in a connected region is less than a given tolerance, it is considered too small to be an exudate and is likely a small spot in the image that may occur for any number of reasons. Thus, this small region is removed as well.
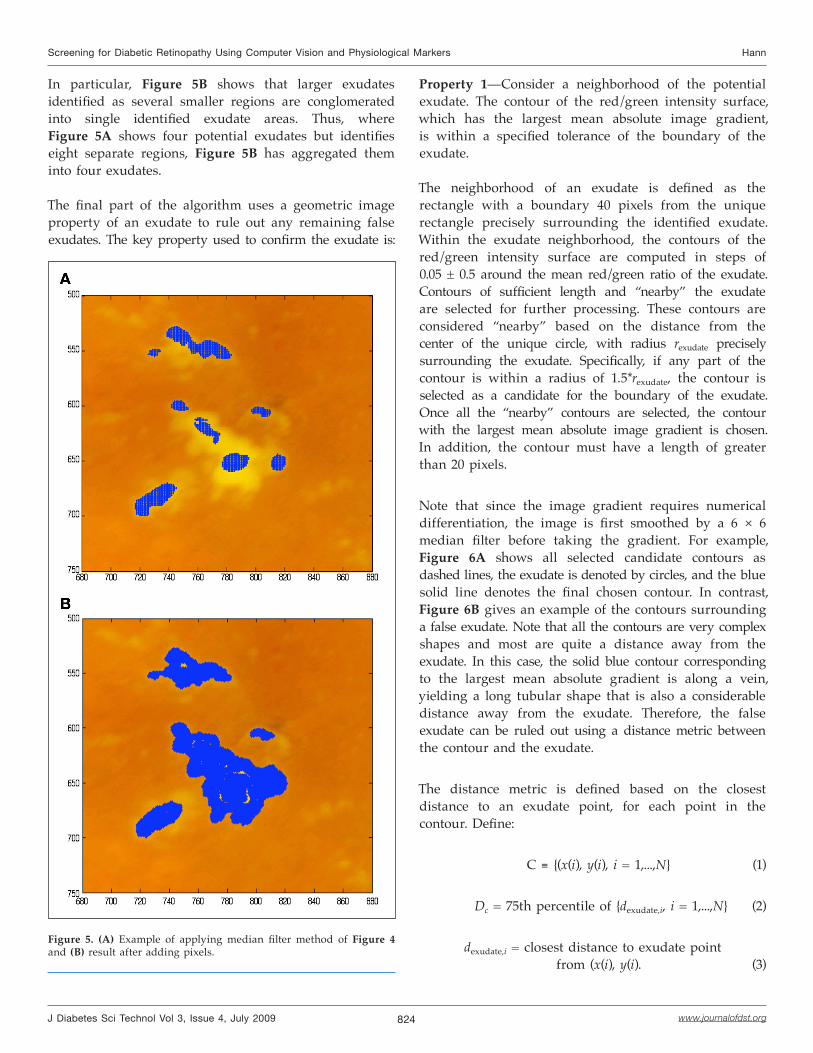
The algorithm then adds pixels to each of the remaining potential exudate regions that may have been missed by the initial sweep. For example, Figure 5A is the result of detected exudates after applying the median filter method (Figure 4B). The method detects the presence of exudates, but several areas that are part of an exudate are not covered. To add more pixels, all the connected regions in Figure 5A that have a sufficiently high maximum green intensity and contain pixels with a contrast equalized intensity greater than 30 are added. This test ensures that any extra pixels added are always onto an actual exudate. The threshold of 30 was determined by trial and error and ensures that pixels will not be added to exudates in lower contrast and darker regions of the image. However, the main purpose of this method is to better cover cases where there are very clear exudates, such as those shown in Figure 1. Furthermore, by adding pixels, large, more obvious exudates can be removed to save computational time when more sophisticated methods are used to confirm smaller exudates in the lower contrast regions.
For each chosen connected pixel region, all the red/green intensity ratios are ordered from lowest to highest. Two intensities, Ilow and Ihigh, are chosen. The first intensity, Ilow, corresponds to the intensity such that only 5% of all intensities are smaller than Ilow. Mathematically, Ilow denotes the lower 5th percentile and can be computed readily in MATLAB (The Mathworks, Natick, MA) using a built-in statistical software package. Similarly, the second intensity, Ihigh, is chosen such that 5% of all intensities are greater than Ihigh and is denoted the 95th percentile. Note that the red/green ratio was used instead of the green channel alone, as it gave significantly better results.
For a given defined neighborhood of the pixel region, all pixels that have a red/green intensity ratio lying in [Ilow, Ihigh] were selected. Out of this selection, all pixels
“connected” to the current exudate region of interest were added. A pixel is “connected” to the given region if either the x distance or the y distance to a pixel in that region is precisely equal to one pixel. The result of this method is given in Figure 5B, which shows that a significant amount of the exudates have been captured.
Figure 4. (A) Plotting the green intensity along the line shown in Figure 3. (B) Result of subtracting the 50-pixel median from each intensity.
824
Screening for Diabetic Retinopathy Using Computer Vision and Physiological Markers Hann
www.journalofdst.orgJ Diabetes Sci Technol Vol 3, Issue 4, July 2009
Figure 5. (A) Example of applying median filter method of Figure 4 and (B) result after adding pixels.
In particular, Figure 5B shows that larger exudates identified as several smaller regions are conglomerated into single identified exudate areas. Thus, where Figure 5A shows four potential exudates but identifies eight separate regions, Figure 5B has aggregated them into four exudates.
The final part of the algorithm uses a geometric image property of an exudate to rule out any remaining false exudates. The key property used to confirm the exudate is:
Property 1—Consider a neighborhood of the potential exudate. The contour of the red/green intensity surface, which has the largest mean absolute image gradient, is within a specified tolerance of the boundary of the exudate.
The neighborhood of an exudate is defined as the rectangle with a boundary 40 pixels from the unique rectangle precisely surrounding the identified exudate. Within the exudate neighborhood, the contours of the red/green intensity surface are computed in steps of 0.05 ± 0.5 around the mean red/green ratio of the exudate. Contours of sufficient length and “nearby” the exudate are selected for further processing. These contours are considered “nearby” based on the distance from the center of the unique circle, with radius rexudate precisely surrounding the exudate. Specifically, if any part of the contour is within a radius of 1.5*rexudate, the contour is selected as a candidate for the boundary of the exudate. Once all the “nearby” contours are selected, the contour with the largest mean absolute image gradient is chosen. In addition, the contour must have a length of greater than 20 pixels.
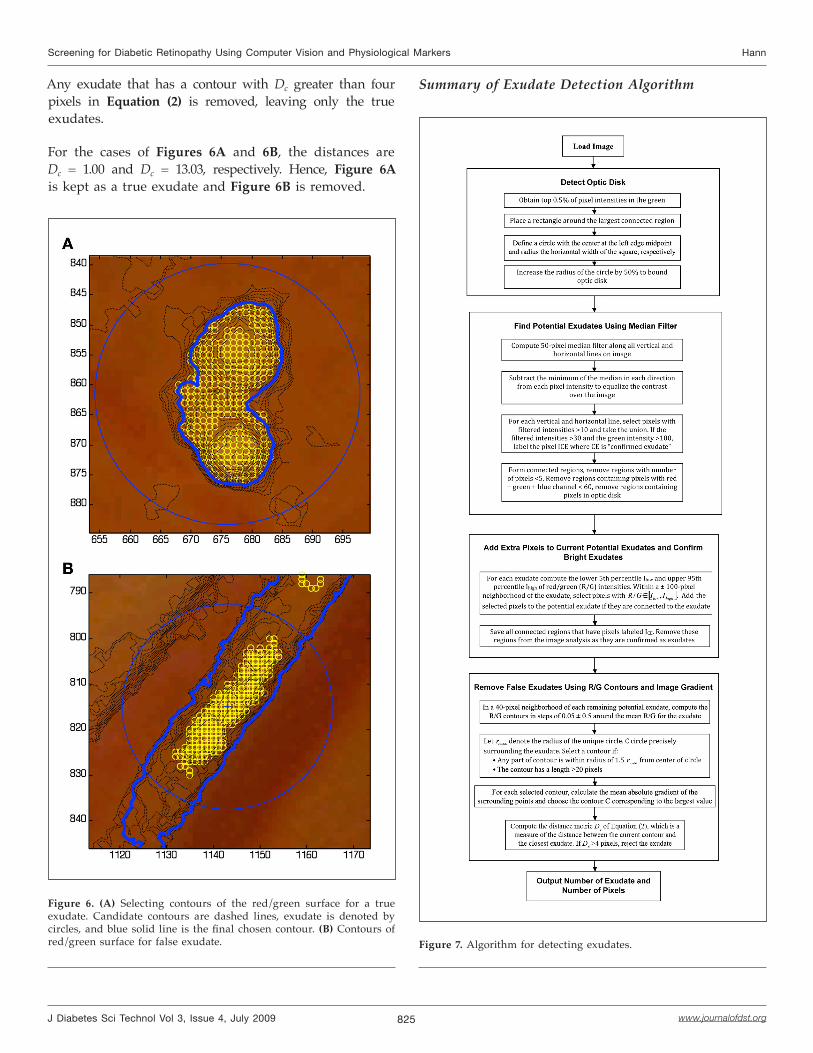
Note that since the image gradient requires numerical differentiation, the image is first smoothed by a 6 × 6 median filter before taking the gradient. For example, Figure 6A shows all selected candidate contours as dashed lines, the exudate is denoted by circles, and the blue solid line denotes the final chosen contour. In contrast, Figure 6B gives an example of the contours surrounding a false exudate. Note that all the contours are very complex shapes and most are quite a distance away from the exudate. In this case, the solid blue contour corresponding to the largest mean absolute gradient is along a vein, yielding a long tubular shape that is also a considerable distance away from the exudate. Therefore, the false exudate can be ruled out using a distance metric between the contour and the exudate.
The distance metric is defined based on the closest distance to an exudate point, for each point in the contour. Define:
C ≡ {(x(i), y(i), i = 1,...,N} (1)
Dc = 75th percentile of {dexudate,i, i = 1,...,N} (2)
dexudate,i = closest distance to exudate pointfrom (x(i), y(i). (3)
825
Screening for Diabetic Retinopathy Using Computer Vision and Physiological Markers Hann
www.journalofdst.orgJ Diabetes Sci Technol Vol 3, Issue 4, July 2009
Any exudate that has a contour with Dc greater than four pixels in Equation (2) is removed, leaving only the true exudates.
For the cases of Figures 6A and 6B, the distances are Dc = 1.00 and Dc = 13.03, respectively. Hence, Figure 6A is kept as a true exudate and Figure 6B is removed.
Figure 6. (A) Selecting contours of the red/green surface for a true exudate. Candidate contours are dashed lines, exudate is denoted by circles, and blue solid line is the final chosen contour. (B) Contours of red/green surface for false exudate.
Summary of Exudate Detection Algorithm
Figure 7. Algorithm for detecting exudates.
826
Screening for Diabetic Retinopathy Using Computer Vision and Physiological Markers Hann
www.journalofdst.orgJ Diabetes Sci Technol Vol 3, Issue 4, July 2009
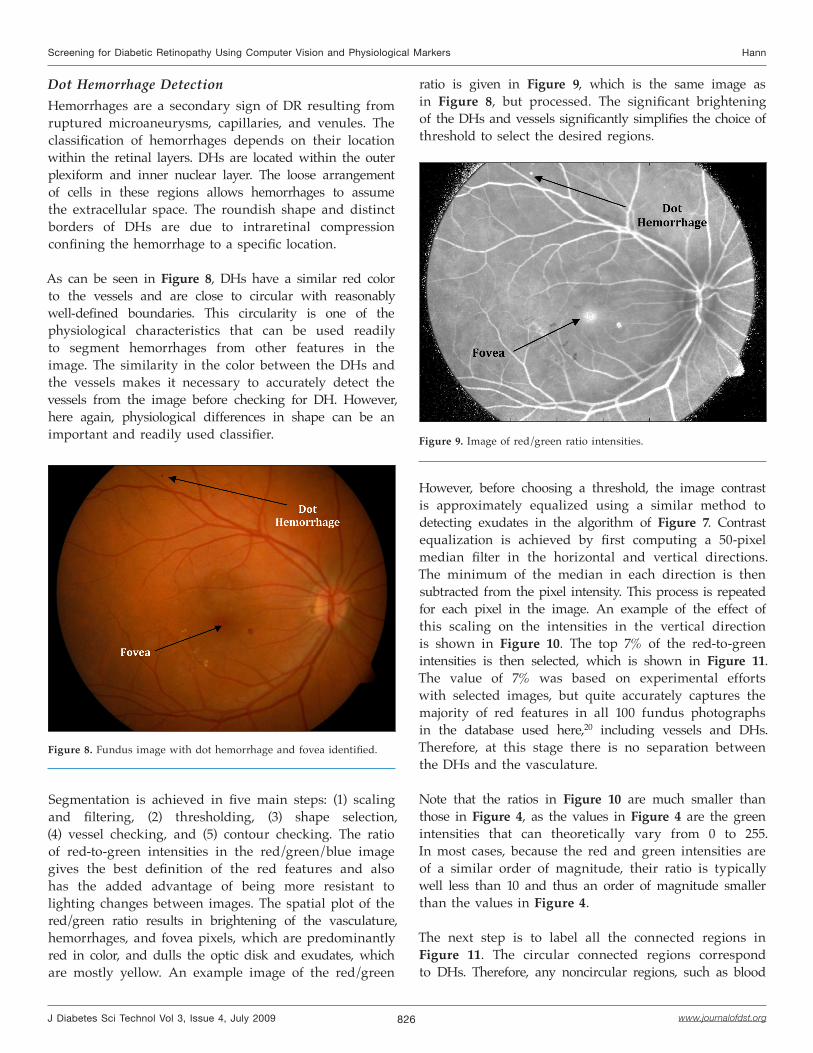
Dot Hemorrhage DetectionHemorrhages are a secondary sign of DR resulting from ruptured microaneurysms, capillaries, and venules. The classification of hemorrhages depends on their location within the retinal layers. DHs are located within the outer plexiform and inner nuclear layer. The loose arrangement of cells in these regions allows hemorrhages to assume the extracellular space. The roundish shape and distinct borders of DHs are due to intraretinal compression confining the hemorrhage to a specific location.
As can be seen in Figure 8, DHs have a similar red color to the vessels and are close to circular with reasonably well-defined boundaries. This circularity is one of the physiological characteristics that can be used readily to segment hemorrhages from other features in the image. The similarity in the color between the DHs and the vessels makes it necessary to accurately detect the vessels from the image before checking for DH. However, here again, physiological differences in shape can be an important and readily used classifier.
ratio is given in Figure 9, which is the same image as in Figure 8, but processed. The significant brightening of the DHs and vessels significantly simplifies the choice of threshold to select the desired regions.
Figure 8. Fundus image with dot hemorrhage and fovea identified.
Segmentation is achieved in five main steps: (1) scaling and filtering, (2) thresholding, (3) shape selection, (4) vessel checking, and (5) contour checking. The ratio of red-to-green intensities in the red/green/blue image gives the best definition of the red features and also has the added advantage of being more resistant to lighting changes between images. The spatial plot of the red/green ratio results in brightening of the vasculature, hemorrhages, and fovea pixels, which are predominantly red in color, and dulls the optic disk and exudates, which are mostly yellow. An example image of the red/green
Figure 9. Image of red/green ratio intensities.
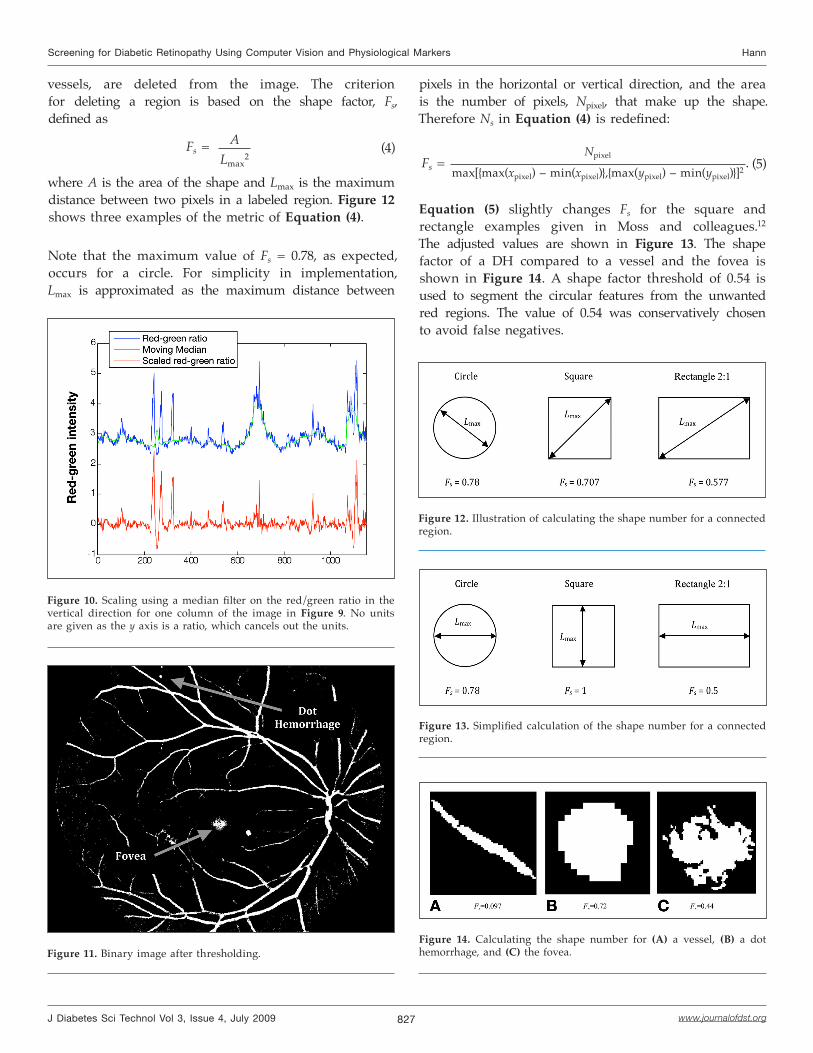
However, before choosing a threshold, the image contrast is approximately equalized using a similar method to detecting exudates in the algorithm of Figure 7. Contrast equalization is achieved by first computing a 50-pixel median filter in the horizontal and vertical directions. The minimum of the median in each direction is then subtracted from the pixel intensity. This process is repeated for each pixel in the image. An example of the effect of this scaling on the intensities in the vertical direction is shown in Figure 10. The top 7% of the red-to-green intensities is then selected, which is shown in Figure 11. The value of 7% was based on experimental efforts with selected images, but quite accurately captures the majority of red features in all 100 fundus photographs in the database used here,20 including vessels and DHs. Therefore, at this stage there is no separation between the DHs and the vasculature.
Note that the ratios in Figure 10 are much smaller than those in Figure 4, as the values in Figure 4 are the green intensities that can theoretically vary from 0 to 255. In most cases, because the red and green intensities are of a similar order of magnitude, their ratio is typically well less than 10 and thus an order of magnitude smaller than the values in Figure 4.
The next step is to label all the connected regions in Figure 11. The circular connected regions correspond to DHs. Therefore, any noncircular regions, such as blood
827
Screening for Diabetic Retinopathy Using Computer Vision and Physiological Markers Hann
www.journalofdst.orgJ Diabetes Sci Technol Vol 3, Issue 4, July 2009
pixels in the horizontal or vertical direction, and the area is the number of pixels, Npixel, that make up the shape. Therefore Ns in Equation (4) is redefined:
Fs = Npixel
max[{max(xpixel) – min(xpixel)},{max(ypixel) – min(ypixel)}]2. (5)
Equation (5) slightly changes Fs for the square and rectangle examples given in Moss and colleagues.12
The adjusted values are shown in Figure 13. The shape factor of a DH compared to a vessel and the fovea is shown in Figure 14. A shape factor threshold of 0.54 is used to segment the circular features from the unwanted red regions. The value of 0.54 was conservatively chosen to avoid false negatives.
Figure 10. Scaling using a median filter on the red/green ratio in the vertical direction for one column of the image in Figure 9. No units are given as the y axis is a ratio, which cancels out the units.
Figure 11. Binary image after thresholding.
vessels, are deleted from the image. The criterion for deleting a region is based on the shape factor, Fs, defined as
Fs = ALmax
2 (4)
where A is the area of the shape and Lmax is the maximum distance between two pixels in a labeled region. Figure 12 shows three examples of the metric of Equation (4).
Note that the maximum value of Fs = 0.78, as expected, occurs for a circle. For simplicity in implementation, Lmax is approximated as the maximum distance between
Figure 12. Illustration of calculating the shape number for a connected region.
Figure 13. Simplified calculation of the shape number for a connected region.
Figure 14. Calculating the shape number for (A) a vessel, (B) a dot hemorrhage, and (C) the fovea.
828
Screening for Diabetic Retinopathy Using Computer Vision and Physiological Markers Hann
www.journalofdst.orgJ Diabetes Sci Technol Vol 3, Issue 4, July 2009
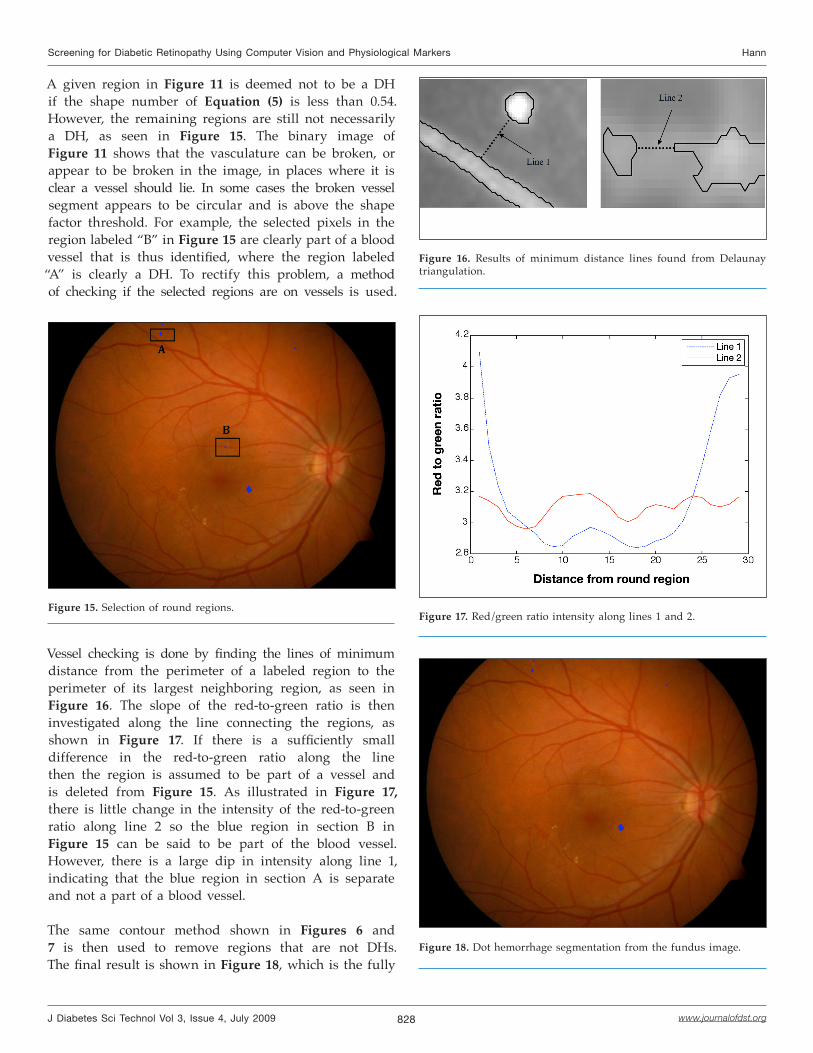
A given region in Figure 11 is deemed not to be a DH if the shape number of Equation (5) is less than 0.54. However, the remaining regions are still not necessarily a DH, as seen in Figure 15. The binary image of Figure 11 shows that the vasculature can be broken, or appear to be broken in the image, in places where it is clear a vessel should lie. In some cases the broken vessel segment appears to be circular and is above the shape factor threshold. For example, the selected pixels in the region labeled “B” in Figure 15 are clearly part of a blood vessel that is thus identified, where the region labeled “A” is clearly a DH. To rectify this problem, a method of checking if the selected regions are on vessels is used.
Figure 15. Selection of round regions.
Vessel checking is done by finding the lines of minimum distance from the perimeter of a labeled region to the perimeter of its largest neighboring region, as seen in Figure 16. The slope of the red-to-green ratio is then investigated along the line connecting the regions, as shown in Figure 17. If there is a sufficiently small difference in the red-to-green ratio along the line then the region is assumed to be part of a vessel and is deleted from Figure 15. As illustrated in Figure 17, there is little change in the intensity of the red-to-green ratio along line 2 so the blue region in section B in Figure 15 can be said to be part of the blood vessel. However, there is a large dip in intensity along line 1, indicating that the blue region in section A is separate and not a part of a blood vessel.
The same contour method shown in Figures 6 and 7 is then used to remove regions that are not DHs. The final result is shown in Figure 18, which is the fully
Figure 16. Results of minimum distance lines found from Delaunay triangulation.
Figure 17. Red/green ratio intensity along lines 1 and 2.
Figure 18. Dot hemorrhage segmentation from the fundus image.
829
Screening for Diabetic Retinopathy Using Computer Vision and Physiological Markers Hann
www.journalofdst.orgJ Diabetes Sci Technol Vol 3, Issue 4, July 2009
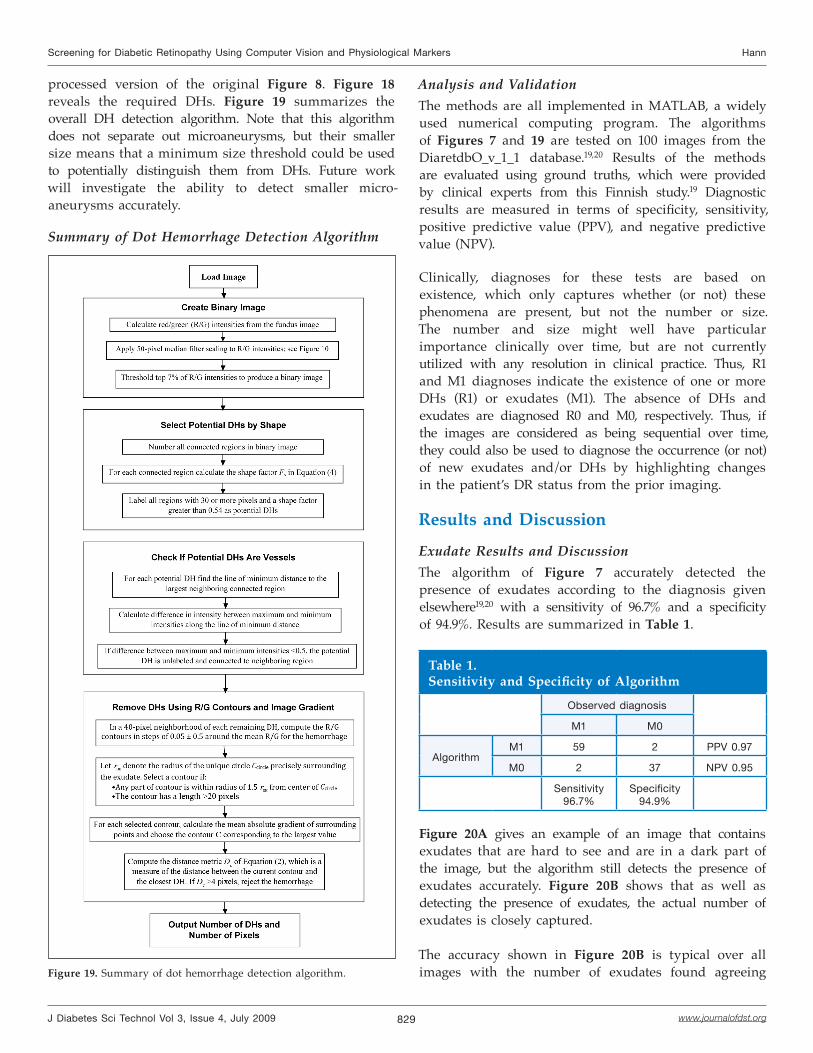
processed version of the original Figure 8. Figure 18 reveals the required DHs. Figure 19 summarizes the overall DH detection algorithm. Note that this algorithm does not separate out microaneurysms, but their smaller size means that a minimum size threshold could be used to potentially distinguish them from DHs. Future work will investigate the ability to detect smaller micro-aneurysms accurately.
Summary of Dot Hemorrhage Detection Algorithm
Analysis and ValidationThe methods are all implemented in MATLAB, a widely used numerical computing program. The algorithms of Figures 7 and 19 are tested on 100 images from the DiaretdbO_v_1_1 database.19,20 Results of the methods are evaluated using ground truths, which were provided by clinical experts from this Finnish study.19 Diagnostic results are measured in terms of specificity, sensitivity, positive predictive value (PPV), and negative predictive value (NPV).
Clinically, diagnoses for these tests are based on existence, which only captures whether (or not) these phenomena are present, but not the number or size. The number and size might well have particular importance clinically over time, but are not currently utilized with any resolution in clinical practice. Thus, R1 and M1 diagnoses indicate the existence of one or more DHs (R1) or exudates (M1). The absence of DHs and exudates are diagnosed R0 and M0, respectively. Thus, if the images are considered as being sequential over time, they could also be used to diagnose the occurrence (or not) of new exudates and/or DHs by highlighting changes in the patient’s DR status from the prior imaging.
Results and Discussion
Exudate Results and DiscussionThe algorithm of Figure 7 accurately detected the presence of exudates according to the diagnosis given elsewhere19,20 with a sensitivity of 96.7% and a specificity of 94.9%. Results are summarized in Table 1.
Figure 19. Summary of dot hemorrhage detection algorithm.
Table 1.Sensitivity and Specificity of Algorithm
Observed diagnosis
M1 M0
AlgorithmM1 59 2 PPV 0.97
M0 2 37 NPV 0.95
Sensitivity96.7%
Specificity94.9%
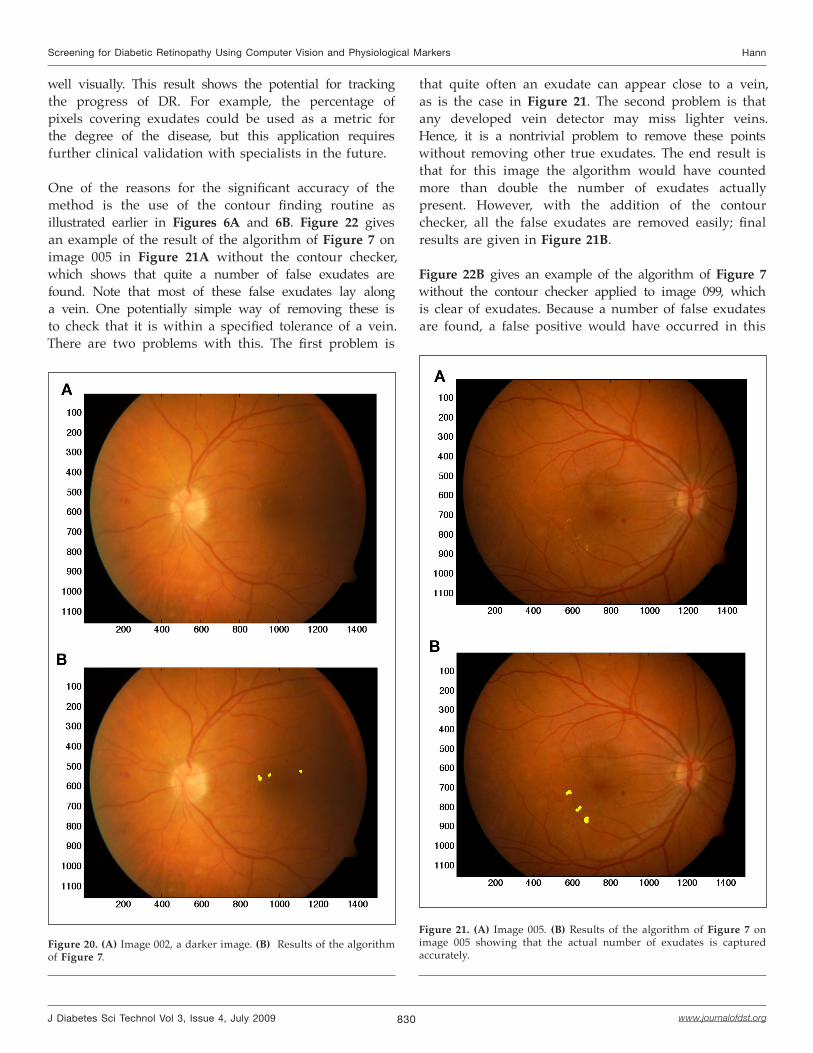
Figure 20A gives an example of an image that contains exudates that are hard to see and are in a dark part of the image, but the algorithm still detects the presence of exudates accurately. Figure 20B shows that as well as detecting the presence of exudates, the actual number of exudates is closely captured.
The accuracy shown in Figure 20B is typical over all images with the number of exudates found agreeing
830
Screening for Diabetic Retinopathy Using Computer Vision and Physiological Markers Hann
www.journalofdst.orgJ Diabetes Sci Technol Vol 3, Issue 4, July 2009
well visually. This result shows the potential for tracking the progress of DR. For example, the percentage of pixels covering exudates could be used as a metric for the degree of the disease, but this application requires further clinical validation with specialists in the future.
One of the reasons for the significant accuracy of the method is the use of the contour finding routine as illustrated earlier in Figures 6A and 6B. Figure 22 gives an example of the result of the algorithm of Figure 7 on image 005 in Figure 21A without the contour checker, which shows that quite a number of false exudates are found. Note that most of these false exudates lay along a vein. One potentially simple way of removing these is to check that it is within a specified tolerance of a vein. There are two problems with this. The first problem is
Figure 20. (A) Image 002, a darker image. (B) Results of the algorithm of Figure 7.
that quite often an exudate can appear close to a vein, as is the case in Figure 21. The second problem is that any developed vein detector may miss lighter veins. Hence, it is a nontrivial problem to remove these points without removing other true exudates. The end result is that for this image the algorithm would have counted more than double the number of exudates actually present. However, with the addition of the contour checker, all the false exudates are removed easily; final results are given in Figure 21B.
Figure 22B gives an example of the algorithm of Figure 7 without the contour checker applied to image 099, which is clear of exudates. Because a number of false exudates are found, a false positive would have occurred in this
Figure 21. (A) Image 005. (B) Results of the algorithm of Figure 7 on image 005 showing that the actual number of exudates is captured accurately.
831
Screening for Diabetic Retinopathy Using Computer Vision and Physiological Markers Hann
www.journalofdst.orgJ Diabetes Sci Technol Vol 3, Issue 4, July 2009
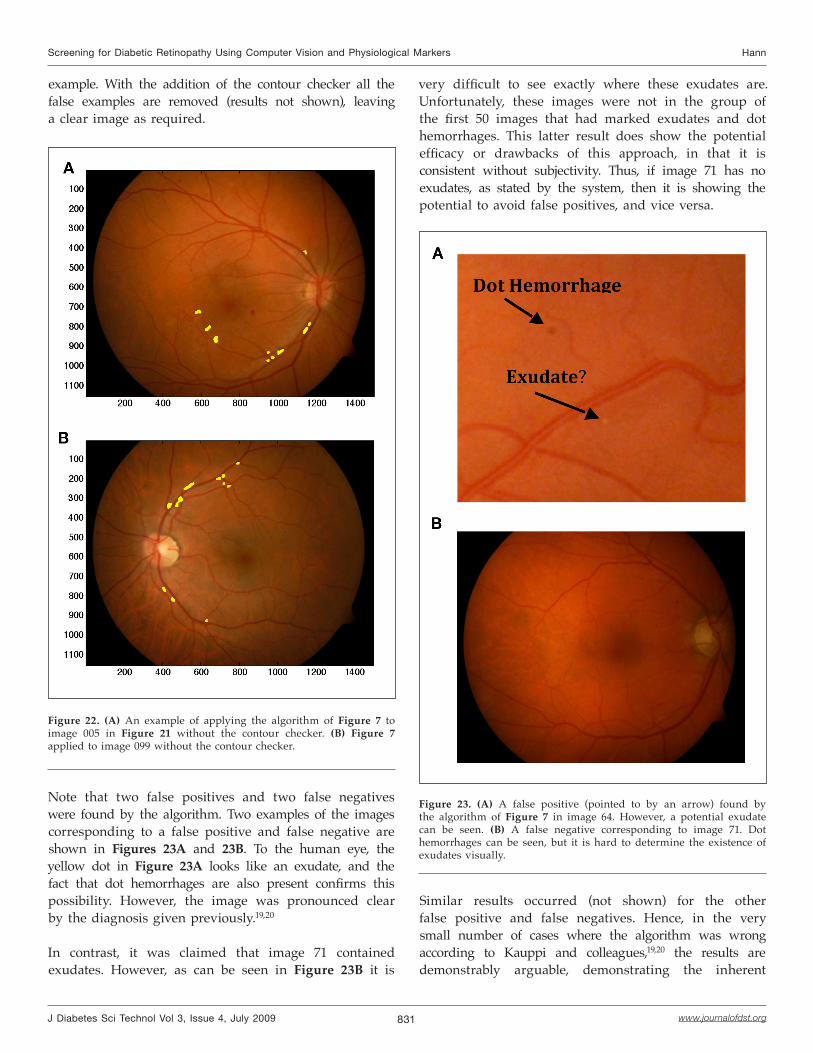
example. With the addition of the contour checker all the false examples are removed (results not shown), leaving a clear image as required.
very difficult to see exactly where these exudates are. Unfortunately, these images were not in the group of the first 50 images that had marked exudates and dot hemorrhages. This latter result does show the potential efficacy or drawbacks of this approach, in that it is consistent without subjectivity. Thus, if image 71 has no exudates, as stated by the system, then it is showing the potential to avoid false positives, and vice versa.
Figure 22. (A) An example of applying the algorithm of Figure 7 to image 005 in Figure 21 without the contour checker. (B) Figure 7 applied to image 099 without the contour checker.
Note that two false positives and two false negatives were found by the algorithm. Two examples of the images corresponding to a false positive and false negative are shown in Figures 23A and 23B. To the human eye, the yellow dot in Figure 23A looks like an exudate, and the fact that dot hemorrhages are also present confirms this possibility. However, the image was pronounced clear by the diagnosis given previously.19,20
In contrast, it was claimed that image 71 contained exudates. However, as can be seen in Figure 23B it is
Figure 23. (A) A false positive (pointed to by an arrow) found by the algorithm of Figure 7 in image 64. However, a potential exudate can be seen. (B) A false negative corresponding to image 71. Dot hemorrhages can be seen, but it is hard to determine the existence of exudates visually.
Similar results occurred (not shown) for the other false positive and false negatives. Hence, in the very small number of cases where the algorithm was wrong according to Kauppi and colleagues,19,20 the results are demonstrably arguable, demonstrating the inherent
832
Screening for Diabetic Retinopathy Using Computer Vision and Physiological Markers Hann
www.journalofdst.orgJ Diabetes Sci Technol Vol 3, Issue 4, July 2009
subjectivity involved in DR screening. Thus, no computer algorithm should be expected to fully agree with every ophthalmologist’s observation in these types of cases, but does provide a consistent measure without subjectivity.
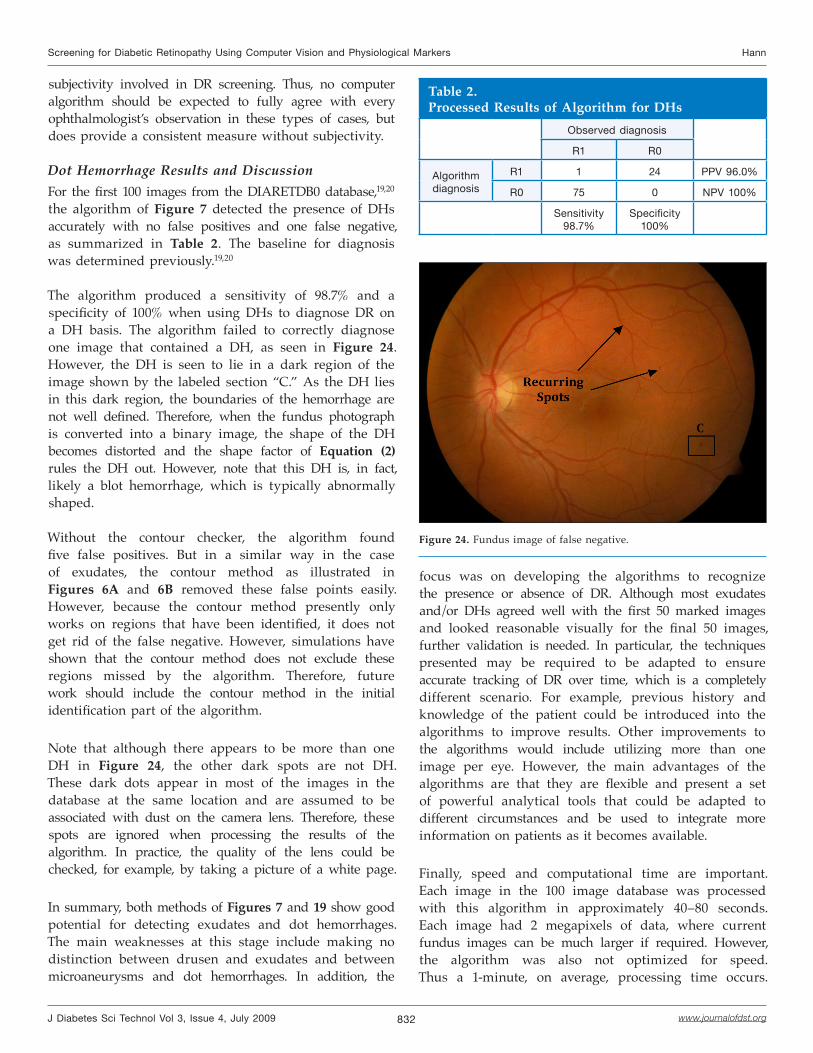
Dot Hemorrhage Results and DiscussionFor the first 100 images from the DIARETDB0 database,19,20 the algorithm of Figure 7 detected the presence of DHs accurately with no false positives and one false negative, as summarized in Table 2. The baseline for diagnosis was determined previously.19,20
The algorithm produced a sensitivity of 98.7% and a specificity of 100% when using DHs to diagnose DR on a DH basis. The algorithm failed to correctly diagnose one image that contained a DH, as seen in Figure 24. However, the DH is seen to lie in a dark region of the image shown by the labeled section “C.” As the DH lies in this dark region, the boundaries of the hemorrhage are not well defined. Therefore, when the fundus photograph is converted into a binary image, the shape of the DH becomes distorted and the shape factor of Equation (2) rules the DH out. However, note that this DH is, in fact, likely a blot hemorrhage, which is typically abnormally shaped.
Without the contour checker, the algorithm found five false positives. But in a similar way in the case of exudates, the contour method as illustrated in Figures 6A and 6B removed these false points easily. However, because the contour method presently only works on regions that have been identified, it does not get rid of the false negative. However, simulations have shown that the contour method does not exclude these regions missed by the algorithm. Therefore, future work should include the contour method in the initial identification part of the algorithm.
Note that although there appears to be more than one DH in Figure 24, the other dark spots are not DH. These dark dots appear in most of the images in the database at the same location and are assumed to be associated with dust on the camera lens. Therefore, these spots are ignored when processing the results of the algorithm. In practice, the quality of the lens could be checked, for example, by taking a picture of a white page.
In summary, both methods of Figures 7 and 19 show good potential for detecting exudates and dot hemorrhages. The main weaknesses at this stage include making no distinction between drusen and exudates and between microaneurysms and dot hemorrhages. In addition, the
focus was on developing the algorithms to recognize the presence or absence of DR. Although most exudates and/or DHs agreed well with the first 50 marked images and looked reasonable visually for the final 50 images, further validation is needed. In particular, the techniques presented may be required to be adapted to ensure accurate tracking of DR over time, which is a completely different scenario. For example, previous history and knowledge of the patient could be introduced into the algorithms to improve results. Other improvements to the algorithms would include utilizing more than one image per eye. However, the main advantages of the algorithms are that they are flexible and present a set of powerful analytical tools that could be adapted to different circumstances and be used to integrate more information on patients as it becomes available.
Finally, speed and computational time are important. Each image in the 100 image database was processed with this algorithm in approximately 40–80 seconds. Each image had 2 megapixels of data, where current fundus images can be much larger if required. However, the algorithm was also not optimized for speed. Thus a 1-minute, on average, processing time occurs.
Table 2.Processed Results of Algorithm for DHs
Observed diagnosis
R1 R0
Algorithm diagnosis
R1 1 24 PPV 96.0%
R0 75 0 NPV 100%
Sensitivity98.7%
Specificity100%
Figure 24. Fundus image of false negative.
833
Screening for Diabetic Retinopathy Using Computer Vision and Physiological Markers Hann
www.journalofdst.orgJ Diabetes Sci Technol Vol 3, Issue 4, July 2009
With optimization or the use of C, a more powerful programming language instead of the user-friendly MATLAB program, this time would be on the order of 1–10 seconds. Clinically, such turnaround times would enable the images to be taken and results provided to the clinician and expressed to the patient, in real time while still in the office, if desired.
ConclusionsAutomatic methods for screening exudates and DHs have been developed based on image processing methods that utilize color, morphology, and intensity gradients in fundus photographs. One hundred images from a standard database were used to test the methods. For exudate detection, the clinical diagnostic sensitivity was 96.7% and specificity was 94.9%. For dot hemorrhage clinical diagnosis, the sensitivity was 98.7% and the specificity was 100%. From visual checks of the first 50 ground truth graded images, >95% of exudates/DHs were detected with virtually no false positives (<0.5%), which suggests that the method could be used to accurately track changes over time. However, these results need to be validated in future clinical trials.
The reasons for the very high sensitivity with no false positives are the use of the red/green ratio combined with a contour finding method and the image gradient after median filtering. The red/green ratio has the advantage of helping normalize out changes in light across the images and improves the contrast of DR features relative to the background. Additional filtering, using physiological and morphological details, reduced false positives without reducing true positive results. Furthermore, no statistical classifying methods were required. The methods demonstrate a significant improvement over other algorithms in the literature and show potential for practical, clinical DR screening. The use of color channels to identify DR lesions directly allows clinical expertise and observation to be incorporated directly into the algorithm, providing a potentially far superior result.
Finally, it is also obvious that further clinical testing and trials will be required to prove the algorithm in practice. However, the same approach can be generalized to other manifestations of DR. The ability to detect the number and size of these manifestations implies that further clinical outcomes will become available in terms of tracking or monitoring the patient-specific evolution of DR accurately.
References:
Icks A, Trautner C, Haastert B, Berger M, Giani G. Blindness due to diabetes: population based age- and sex- specific incidence rates. Diabet Med. 1997;14(7):571-5.
Fong D, Aiello L, Gardner T, King G, Blankenship G, Cavallerano J, Ferris F 3rd, Klein R. Retinopathy in diabetes. Diabetes Care. 2004;27 Suppl 1:S84-7.
Kempen JH, O’Colmain BJ, Leske MC, Haffner SM, Klein R, Moss SE, Taylor HR, Hamman RF; Eye Diseases Prevalence Research Group. The prevalence of diabetic retinopathy among adults in the United States. Arch Ophthalmol. 2004;122(4):552-63.
Wild S, Roglic G, Green A, Sicree R, King H. Global prevalence of diabetes: estimates for the year 2000 and projections for 2030. Diabetes Care. 2004;27(5):1047-53.
Fong D, Aiello L, Gardner T, King G, Blankenship G, Cavallerano J, Ferris FL 3rd, Klein R; American Diabetes Association. Diabetic retinopathy. Diabetes Care. 2003;26(1):226-9.
Chia D, Yap E. Comparison of the effectiveness of detecting diabetic eye disease: diabetic retinal photography versus ophthalmic consultation. Singapore Med J. 2004;45(6):276-9.
ETDRS report number 9. Early Treatment Diabetic Retinopathy Study Research Group. Early photocoagulation for diabetic retinopathy. Ophthalmology. 1991;98(5 Suppl):766-85.
Kertes PJ, Johnson TM, editors. Evidence based eye care. Lippincott Williams & Wilkins; 2007.
Hipwell J, Strachant F, Olson J, McHardy K, Sharp P, Forrester J. Automated detection of microaneurysms in digital red free photographs: a diabetic retinopathy screening tool. Diabet Med. 2000;17(8):588-94.
Abramoff MD, Niemeijer M, Suttorp-Schulten MS, Viergever MA, Russell SR, Van Ginneken B. Evaluation of a system for automatic detection of diabetic retinopathy from color fundus photographs in a large population of patients with diabetes. Diabetes Care. 2008;31(2):193-8.
Kinyoun JL, Martin DC, Fujimoto WY, Leonetti DL. Ophthalmoscopy versus fundus photographs for detecting and grading diabetic retinopathy. Invest Ophtalmol Vis Sci. 1992;33(6):1888-93.
Moss SE, Klein R, Kessler SD, Richie KA. Comparison between ophthalmoscopy and fundus photography in determining severity of diabetic retinopathy. Ophthalmology. 1985; 92(1):62-7.
Sánchez CI, Hornero R, López MI, Aboy M, Poza J, Abásolo D. A novel automatic image processing algorithm for detection of hard exudates based on retinal image analysis. Med Eng Phys. 2008;30(3):350-7.
Walter T, Massin P, Erginay A, Ordonez R, Jeulin C, Klein J. Automatic detection of microaneurysms in color fundus images. Med Image Anal. 2007;11(6):555-66.
Sinthnayothin C, Boyce J, Williamson T, Cook H, Mensah E, Lal S, Usher D. Automated detection of diabetic retinopathy on digital fundus images. Diabet Med. 2002;19(2):105-12.
Frame AJ, Undill PE, Cree MJ, Olson JA, McHardy KC, Sharp PF, Forrester JF. A comparison of computer based classification methods applied to the detection of microaneurysms in opthalmic fluorescein angiograms. Comput Biomed Res. 1998;28:225-38.
Gardner GG, Keating D, Williamson TH, Elliott AT. Automatic detection of diabetic retinopathy using an artificial neural network: a screening tool. Br J Ophthalmol. 1996;80(11):940-4.
Ege BM, Hejlesen OK, Larsen OV, Moller K, Jennings B, Kerr D, Cavan DA. Screening for diabetic retinopathy using computer based image analysis and statistical classification. Computer Methods Programs Biomed. 2000;62(3):165-75.
1.
2.
3.
4.
5.
6.
7.
8.
9.
10.
11.
12.
13.
14.
15.
16.
17.
18.

834
Screening for Diabetic Retinopathy Using Computer Vision and Physiological Markers Hann
www.journalofdst.orgJ Diabetes Sci Technol Vol 3, Issue 4, July 2009
Kauppi T, Kalesnykiene V, Kamarainen JK, Lensu L, Sorri I, Uusitalo H, Kalviainen H, Pietila J. Evaluation database and methodology for diabetic retinopathy algorithms. Technical report; 2006. Available from: http://www.it.lut.fi/project/imageret/diaretdb0/.
Kauppi T, Kalesnykiene V, Kamarainen JK, Lensu L, Sorri I, Raininen A, Voutilainen R, Uusitalo H, Kalviainen H, Pietila J. The DIARETDB1 diabetic retinopathy database and evaluation protocol. Proceedings of the British Machine Vision Conference (BMVC2007); 2007. Vol. 1, pp. 252-61.
Niemeijer M, van Ginneken B, Russell SR, Suttorp-Schulten MS, Abràmoff MD. Automated detection and differentiation of drusen, exudates, and cotton-wool spots in digital color fundus photographs for diabetic retinopathy diagnosis. Invest Ophtalmol Vis Sci. 2007;48(5) 2260-7.
19.
20.
21.


![The Guide - Diabetic Retinopathy - Vision Lossvisionloss.org.au/wp-content/uploads/2016/05/The... · the guide [diabetic retinopathy] What is Diabetic Retinopathy? Diabetic Retinopathy](https://img.pdfslide.net/doc/110x75/5e3ed00bf9c32e41ea6578a8/the-guide-diabetic-retinopathy-vision-the-guide-diabetic-retinopathy-what.jpg)