Embed Size (px)
Citation preview

Screw Press Dewatering
Optimization
By
Kelly Brown, BDP Industries, Inc.

Where should your focus be???

What is the objective of your
optimization? Maximize Capacity: Solids Loading, Flow Rate
Maximize Cake Solids
Minimize Polymer Usage
Stable performance: consistent cake solids
Reduce Operating Labor
Lower Energy Costs
Reduce maintenance costs
Increase Screw Press availability
Improve material handling properties
Any others you can thinking of???

Solids Capture!!!
What is Solids Capture: (Percentage of suspended solids in
the feed that ends up in the
discharge)
% Capture = (C/F) [(F-E)/(C-E)] x 100%
Where:
C = Dewatered Sludge Total Solids (% TS)
F = Feed (% TSS); excluding any dilution from
polymer solution flow
E = Filtrate (% TSS); excluding any dilution
from polymer solution and belt wash
water flows
Dewatering Optimization usually focuses on Cake
Solids, in this effort filtrate clarity, solids capture,
takes a back seat.

Tools for Optimization:
Chemical Treatment: ◦ Type
◦ Dosage
Operator Observations
Equipment settings: ◦ Flows
◦ Screw Rpm
◦ Cone Pressure
◦ Feed Pressure
Instrumentation: ◦ Flows
◦ Suspended Solids
◦ Turbidity
◦ Zeta potential
Mechanical Condition of Equipment
Monterey CA, WWTP, Screw Press

Chemical Treatment:
Laboratory:
◦ Polymer Screening
Charge, Charge
Density, Linear /
Branched
◦ Conditioning:
Mixing Intensity,
Dosage,
Time
◦ Bench Simulations
Full Scale Trials

Chemical Treatment
Form Time,
Sludge Volume
Ratio.
Filtrate Clarity
Flocc Structure
Spreading
Cake Release
Amount of
Solids
Expressed

Bench Simulations:
Bench Simulations:
◦ Spreading
◦ Cake Release
◦ Expressed Solids

Observations:
Flocc Structure

Observations:
Filtrate
Clarity
Drainage
along Screw
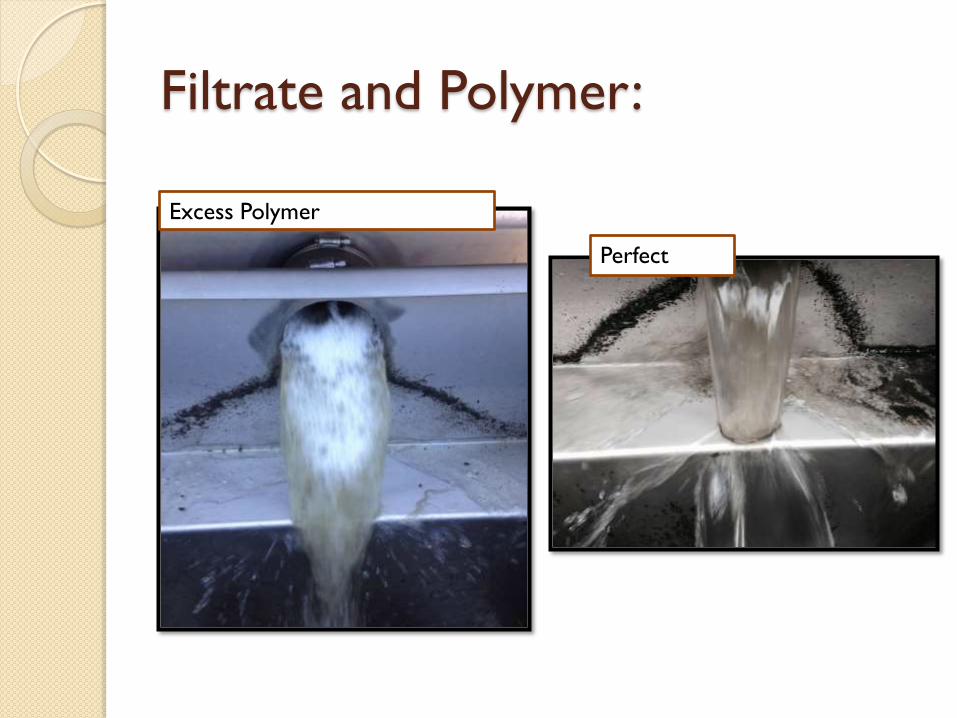
Filtrate and Polymer:
Excess Polymer
Perfect
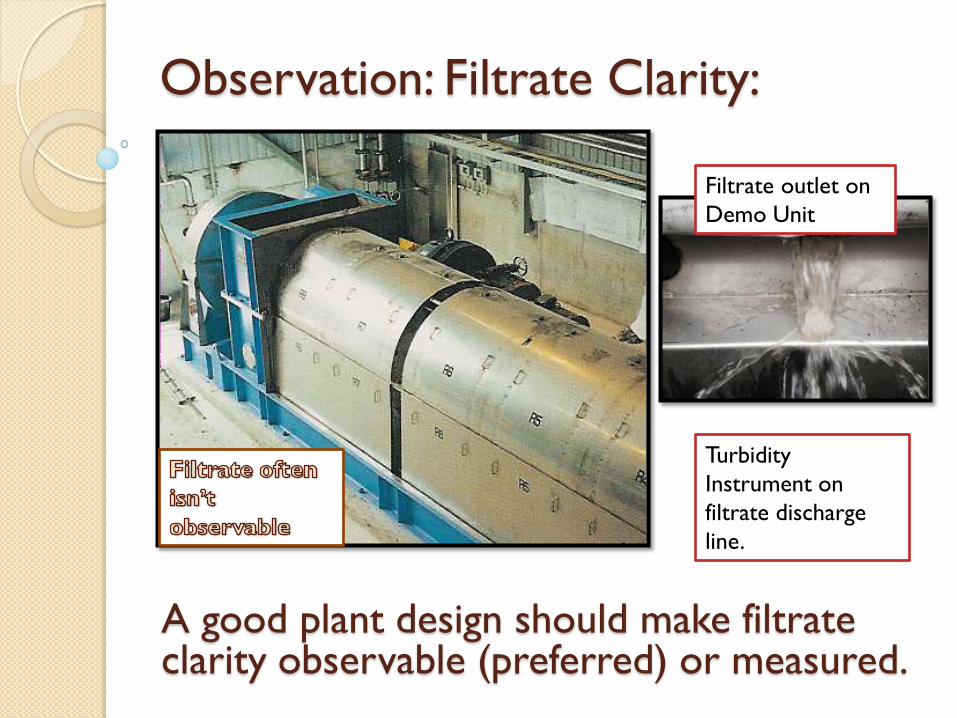
Observation: Filtrate Clarity:
A good plant design should make filtrate clarity observable (preferred) or measured.
Filtrate outlet on
Demo Unit
Turbidity
Instrument on
filtrate discharge
line.

Observations:
Discharge Cake ◦ Scaly look at cone
◦ Powdery look on pile
◦ Pile Bounce

Equipment Settings:
◦ Control Panel Setting: Flows:
Feed Flow, gpm
Polymer Flow, gph
Screw, rpm
Screw Torque, amps
Cone Pressure, psi
Feed Pressure, psi
◦ Ohaus: Feed Suspended solids
Cake solids
◦ Spread Sheet Calculations: lb/hr, lb/ton
Ohaus
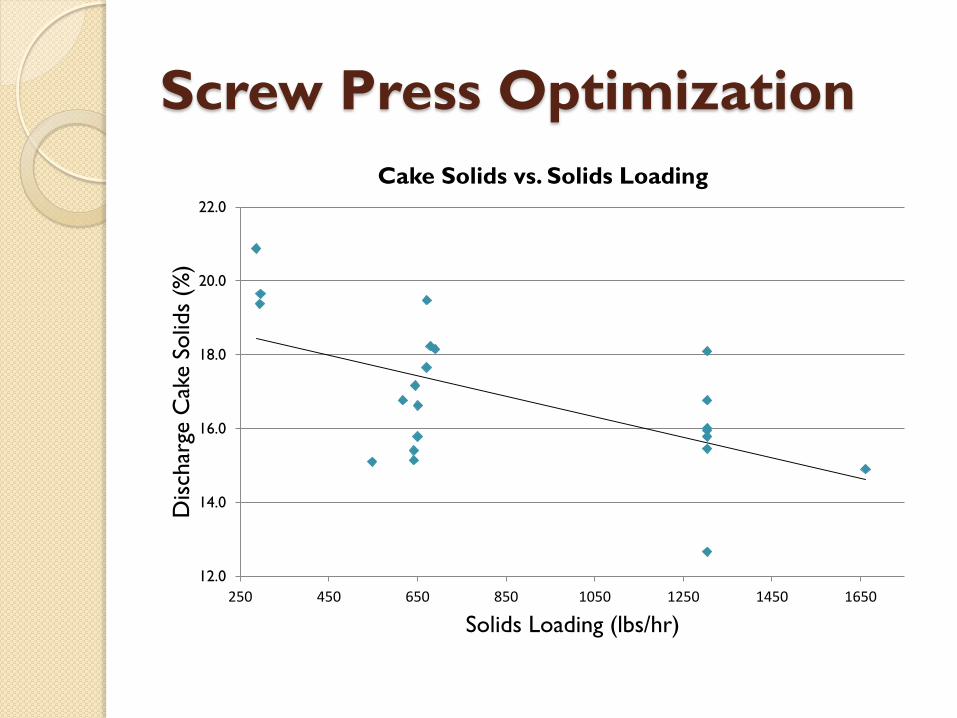
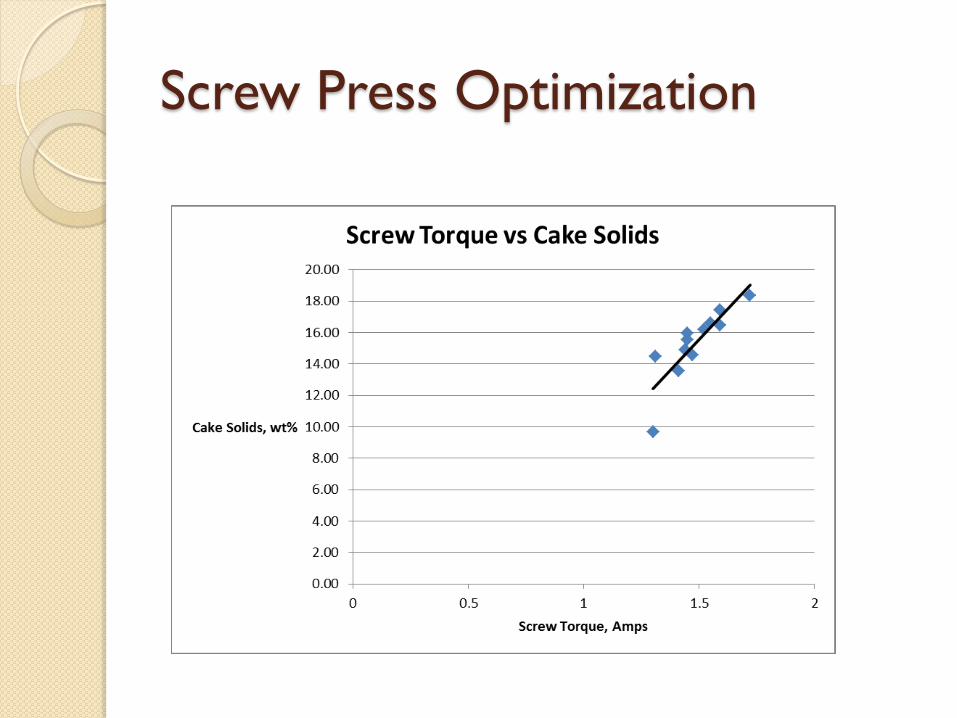
Screw Press Optimization
12.0
14.0
16.0
18.0
20.0
22.0
250 450 650 850 1050 1250 1450 1650
Dis
char
ge C
ake S
olid
s (%
)
Solids Loading (lbs/hr)
Cake Solids vs. Solids Loading
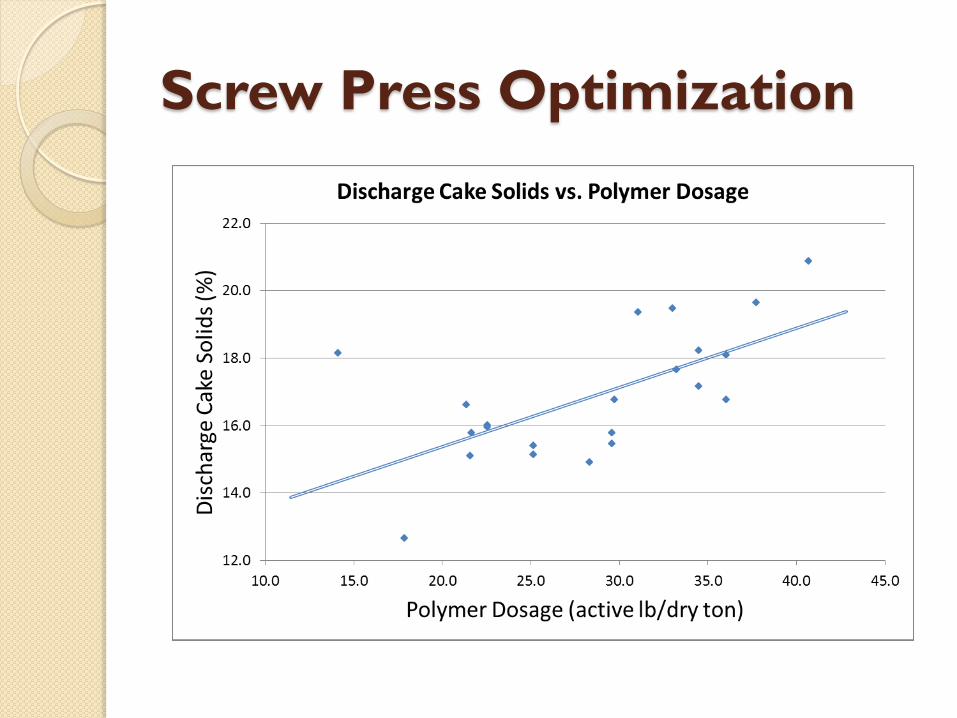
Screw Press Optimization
Screw Press Optimization

Screw Press Optimization
Instruments:
Magnetic Flow Meters: highly recommended.
Pump rpm
Turbidity Sensors
Pressure / Weight Sensors: Sludge Levels in Chutes / Pumps etc.
Belt Scales
Others, not recommend: Viscosity, Streaming current, zeta potential

Mechanical:
Flight brushes:
required to keep cake
heel from developing.
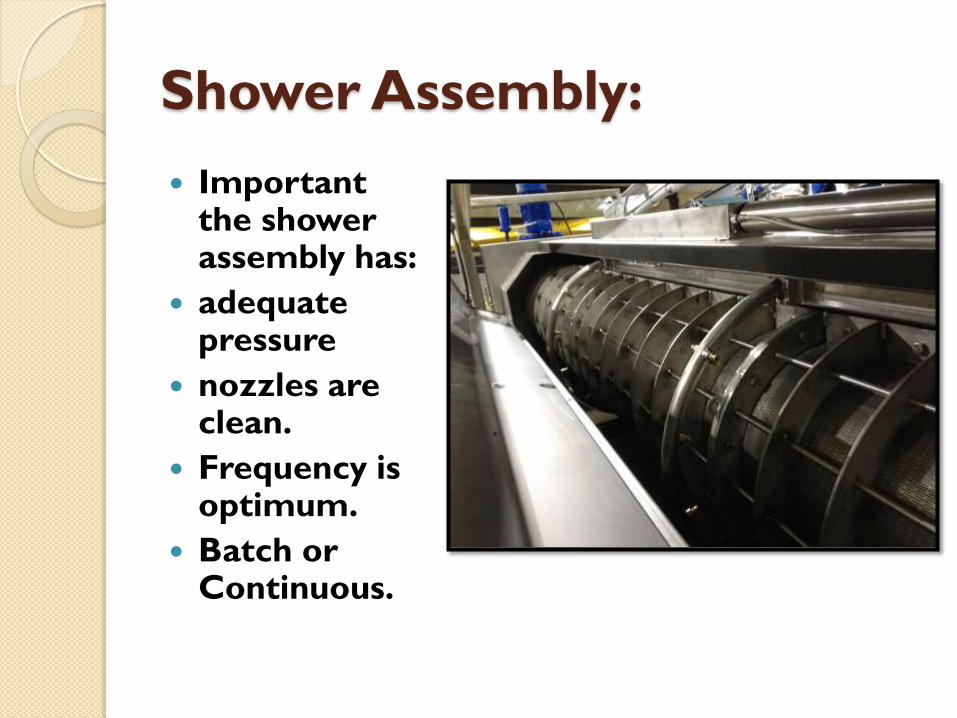
Shower Assembly:
Important the shower assembly has:
adequate pressure
nozzles are clean.
Frequency is optimum.
Batch or Continuous.

Why is Solids Capture Critical?
Industry standard 95%, many below 80% and some as low as 60%.
Dirty filtrate means accelerated wear on dewatering unit
Increase labor in keeping facility clean
Recycled solids wear on pumps and other equipment.
Increases dewatering chemical costs and lowers cake solids.
More important with Smaller size wwtp.

On a Broader Scale Poor Solids
Capture Causes: Higher energy costs for plant
Lowers plant performance
Creates additional particles that are difficult to dewater. ◦ Bacteria type, filamentous
◦ Colloidal Particles
◦ Particles with poor surface chemistry for flocculation
Best to get these out in the first pass

Sulfur Springs WWTP Texas
17% cake solids
was maximum
possible
New Dewatering
System with
improved
capture
3 months later,
23% cake solids.
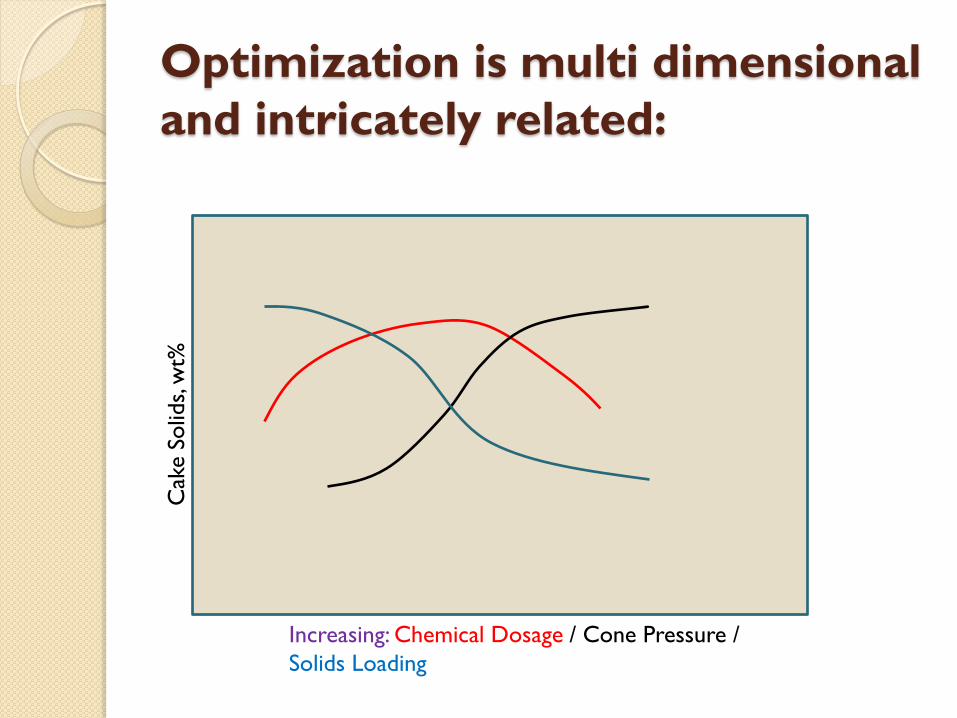
Optimization is multi dimensional
and intricately related:
Increasing: Chemical Dosage / Cone Pressure /
Solids Loading
Cak
e S
olid
s, w
t%

Optimization is multi dimensional
and the intricately related:
Increasing: Chemical Dosage / Cone Pressure /
Solids Loading
Solid
s C
aptu
re, w
t%
Stable “Feed Solids Concentration” is
of Critical Importance and Often
poorly designed.
Chemical dosage
Solids Loading
Cone Pressure
Etc.
Mixed surge
tank.
◦ 60 minutes
◦ Dampens out
changes
◦ Operators have
time to react.
Consistency in monitoring
all the factors key
• Develop Relationships that
consider all the factors.
• Effort will yield improved overall
plant performance.
• It is worth the effort.

Questions?