Embed Size (px)
Citation preview
© Copyright 2015 Xilinx
1
SDK Application debug on Linux/QEMU Training
This training is broken into two sections; Hardware Debug, and QEMU Debug.
In the Hardware debug, we shall build a Zynq Hardware design in the Vivado 2015.2 IP Integrator,
build a Linux image with a TCF Agent running on the board and connect to this from SDK in order to
debug a Linux Application.
In the QEMU section, we shall debug an application using both GDB debugger, and Xilinx System
Debugger that is remotely connected to a QEMU. We shall test this for both Zynq CortexA9, and
MPSoC A53 and R5 processors.
Pre-requisite:
Vivado 2015.2, and Petalinux 2015.2.1 (or 2015.2 installed)
Section 1: Hardware Debug
Step 1: Build the HW:
Here, I am using Vivado 2015.2 to build a very simple Block Design (BD) in Vivado IP Integrator (IPI)
targeting the ZC702.
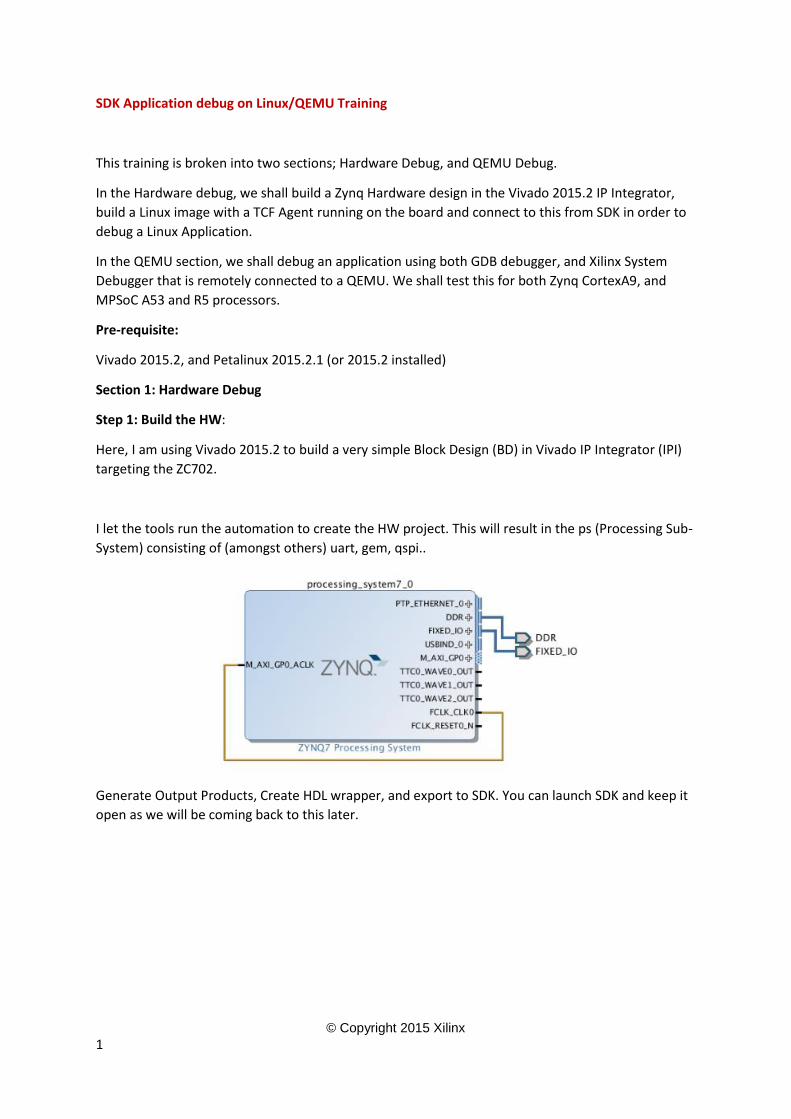
I let the tools run the automation to create the HW project. This will result in the ps (Processing Sub-
System) consisting of (amongst others) uart, gem, qspi..
Generate Output Products, Create HDL wrapper, and export to SDK. You can launch SDK and keep it
open as we will be coming back to this later.
© Copyright 2015 Xilinx
2
Step 2: Create Linux Image:
Here, we shall be using the Petalinux tool to create the linux image.
In a new terminal, Navigate to the SDK folder (that was created when we exported to SDK in step 1).
Use the Petalinux Commands below:
petalinux-create --type project --template zynq --name demo
petalinux-config --get-hw-description -p demo This will pop up the config GUI. User, can explore this. However, for this demo all the defaults will be
kept. Select <Exit> to exit.
User can explore the rootfs config to add the tcf-agent and netcat using the command below:
cd demo
petalinux-config –c rootfs
o Filesystem Packages -> base -> tcf-agent -> [*] tcf-agent
o Filesystem Packages -> console/network -> [*] netcat
o <Save> and <Exit>
User can explore the kernel config using the command below:
cd demo
petalinux-config –c kernel
Next, we will need to update the device tree to connect the GEM to the external PHY node. The
Devicetree Generator (DTG) will only build the internal system to the chip. However, this is straight
forward to achieve.
Open demo\subsystems\linux\configs\device-tree\system-top.dts and replace it with the content
below:
/dts-v1/; /include/ "system-conf.dtsi" / { }; &gem0 { local-mac-address = [00 0a 35 00 c0 12]; phy-handle = <&phy0>; phy-mode = "rgmii-id"; mdio { #address-cells = <1>; #size-cells = <0>; phy0: phy@7 { compatible = "marvell,88e1116r"; device_type = "ethernet-phy"; reg = <7>; }; }; };
© Copyright 2015 Xilinx
3
Finally, to build the image. Use the command below (this may take awhile)
petalinux-build
Tip: to verify that the devicetree DTB was created correctly. Use the command below:
cd images/linux/
../../build/linux/kernel/xlnx-3.19/scripts/dtc/dtc -I dtb -O dts -o system.dts system.dtb
cd ../..
This will create a system.dts in the images/linux folder. You can investigate he devicetree here.
Next, create the boot image using the command below:
petalinux-package --boot --fsbl images/linux/zynq_fsbl.elf --fpga
../design_1_wrapper_hw_platform_0/design_1_wrapper.bit --uboot
This will create the two files needed for the SD card:
images/linux/image.ub
images/linux/BOOT.BIN
© Copyright 2015 Xilinx
4
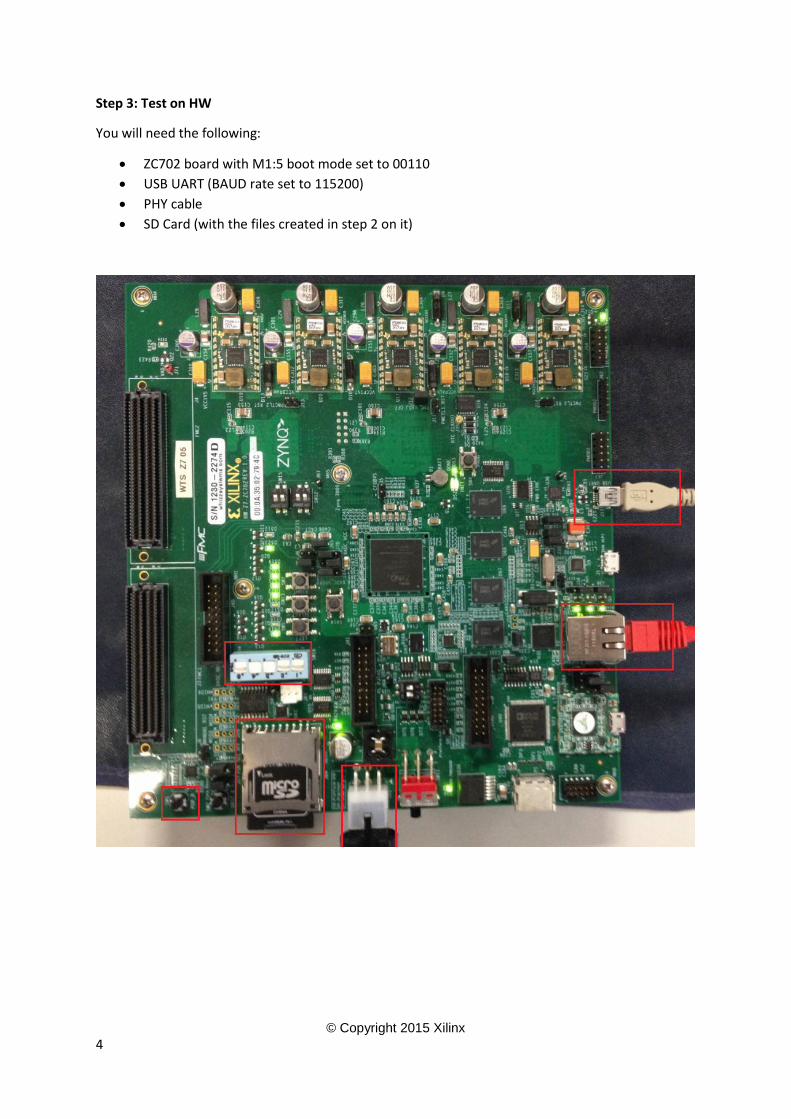
Step 3: Test on HW
You will need the following:
ZC702 board with M1:5 boot mode set to 00110
USB UART (BAUD rate set to 115200)
PHY cable
SD Card (with the files created in step 2 on it)
© Copyright 2015 Xilinx
5
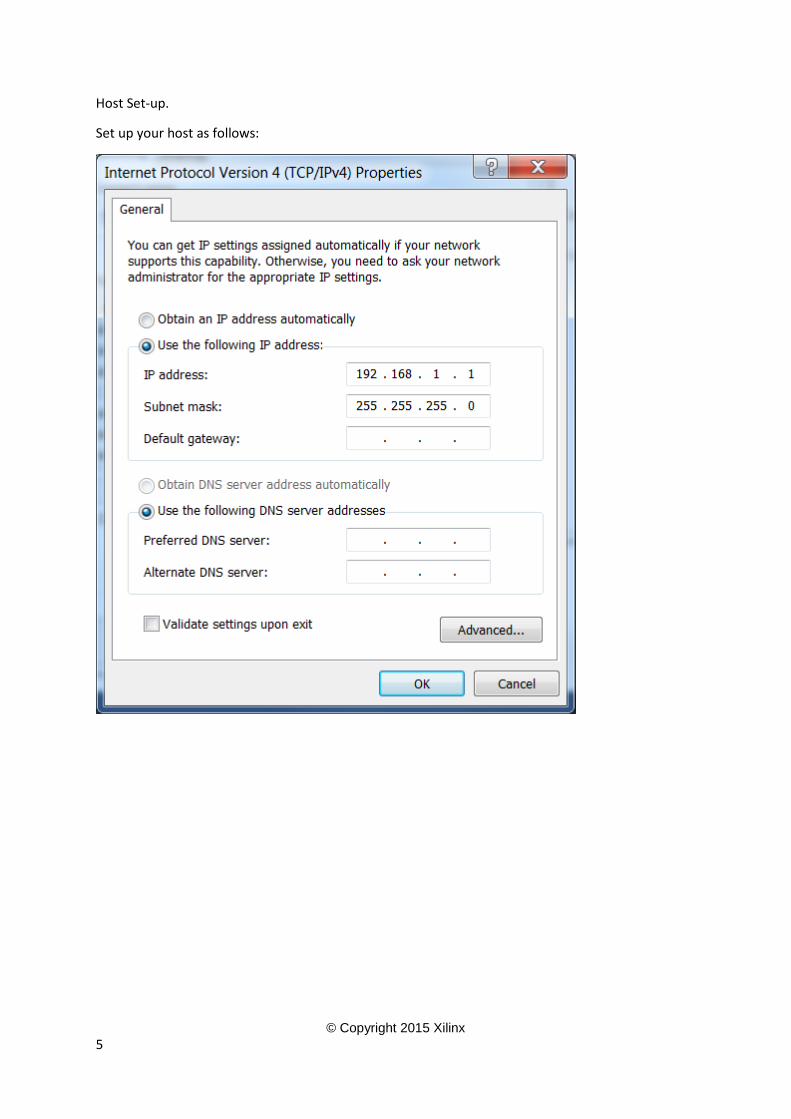
Host Set-up.
Set up your host as follows:
© Copyright 2015 Xilinx
6
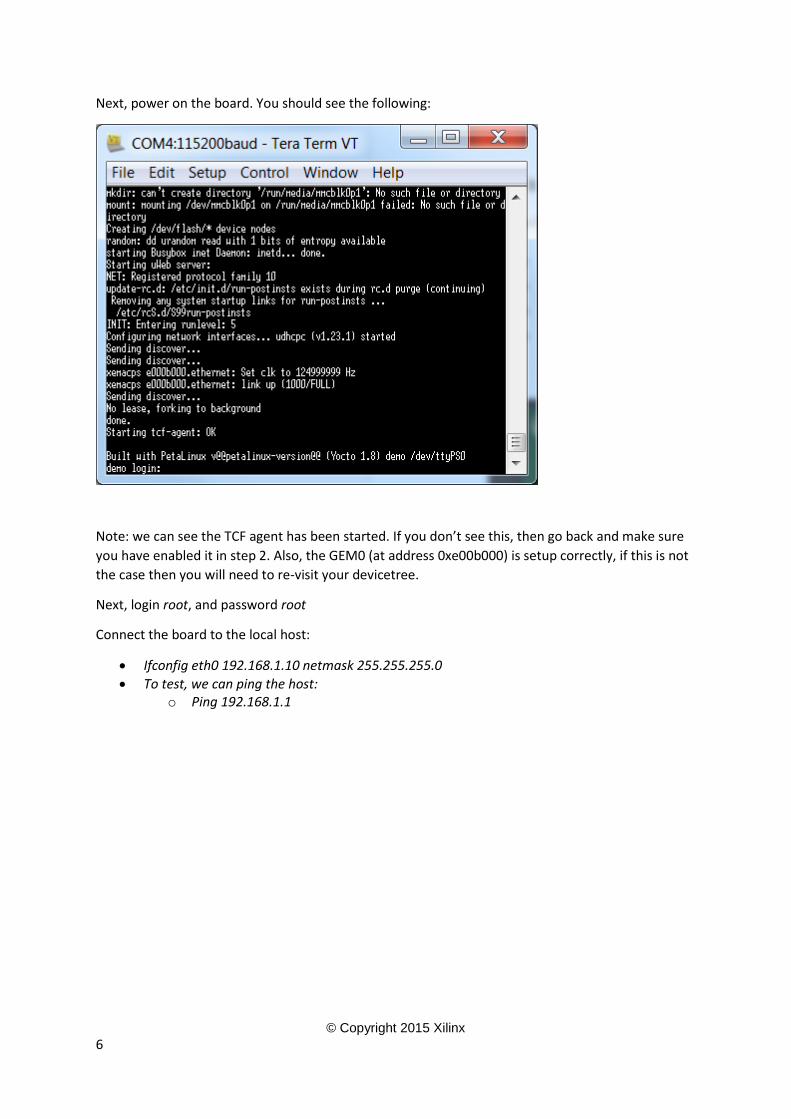
Next, power on the board. You should see the following:
Note: we can see the TCF agent has been started. If you don’t see this, then go back and make sure
you have enabled it in step 2. Also, the GEM0 (at address 0xe00b000) is setup correctly, if this is not
the case then you will need to re-visit your devicetree.
Next, login root, and password root
Connect the board to the local host:
Ifconfig eth0 192.168.1.10 netmask 255.255.255.0
To test, we can ping the host: o Ping 192.168.1.1
© Copyright 2015 Xilinx
7
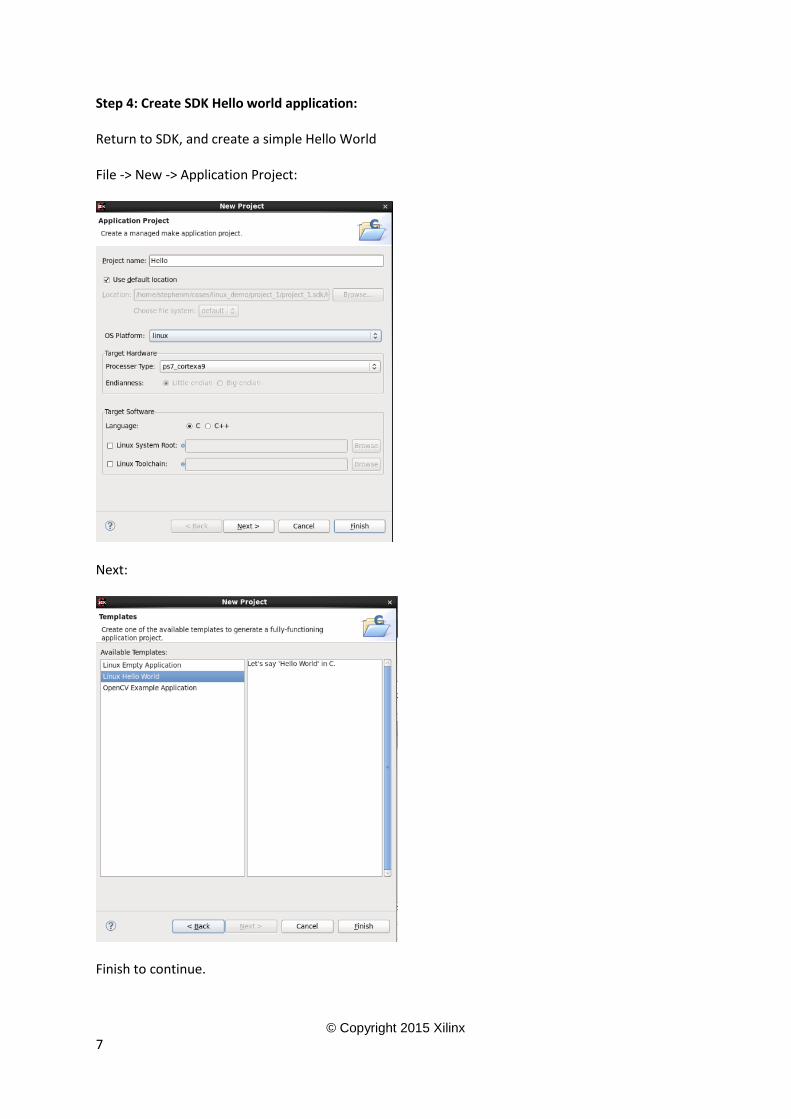
Step 4: Create SDK Hello world application: Return to SDK, and create a simple Hello World File -> New -> Application Project:
Next:
Finish to continue.
© Copyright 2015 Xilinx
8
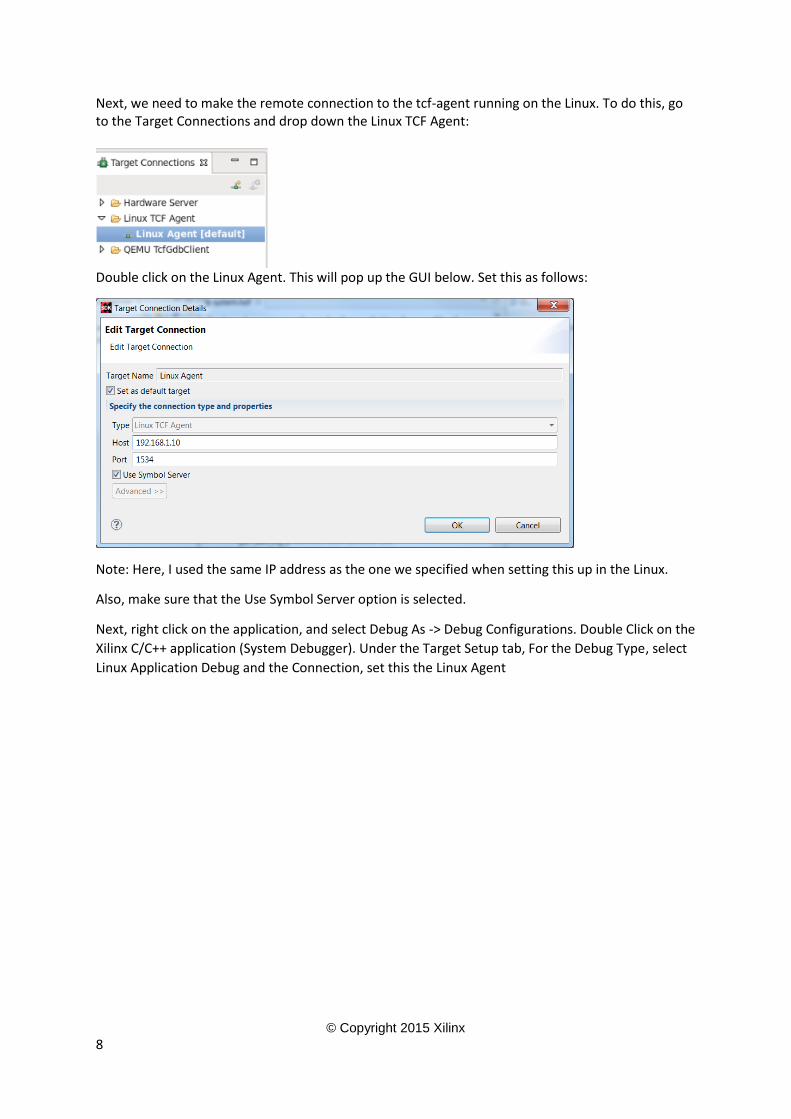
Next, we need to make the remote connection to the tcf-agent running on the Linux. To do this, go to the Target Connections and drop down the Linux TCF Agent:
Double click on the Linux Agent. This will pop up the GUI below. Set this as follows:
Note: Here, I used the same IP address as the one we specified when setting this up in the Linux.
Also, make sure that the Use Symbol Server option is selected.
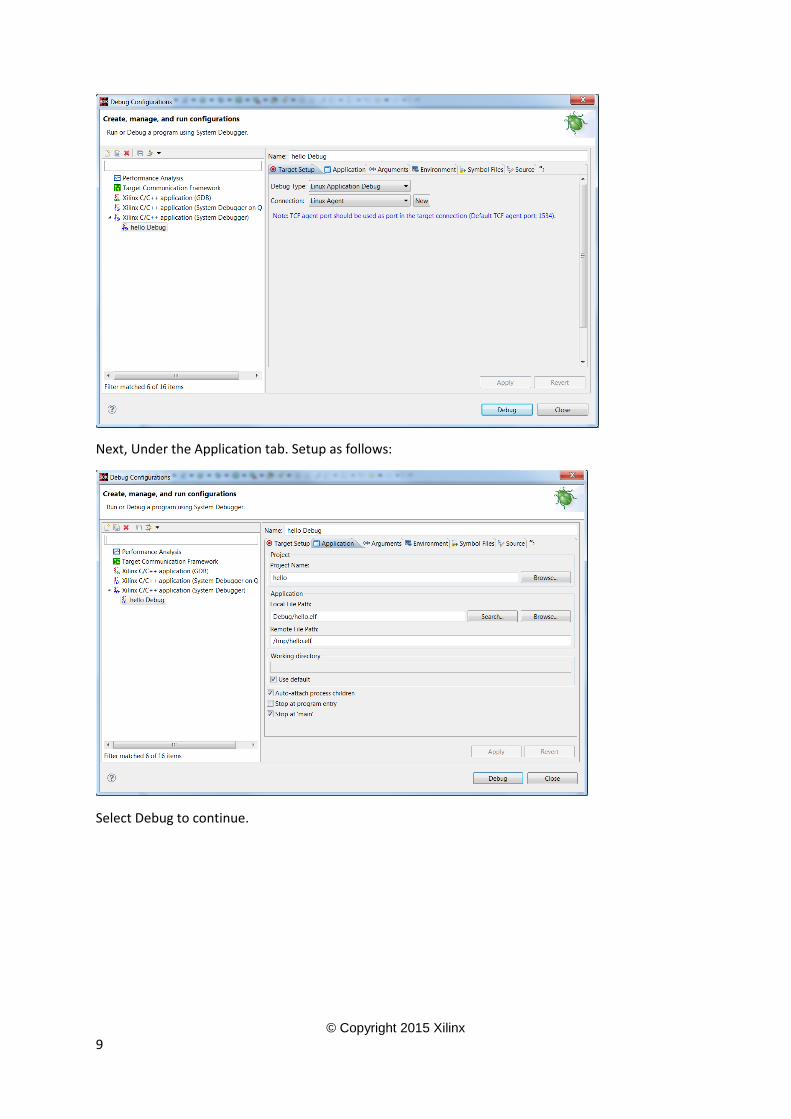
Next, right click on the application, and select Debug As -> Debug Configurations. Double Click on the
Xilinx C/C++ application (System Debugger). Under the Target Setup tab, For the Debug Type, select
Linux Application Debug and the Connection, set this the Linux Agent
© Copyright 2015 Xilinx
9
Next, Under the Application tab. Setup as follows:
Select Debug to continue.
© Copyright 2015 Xilinx
10
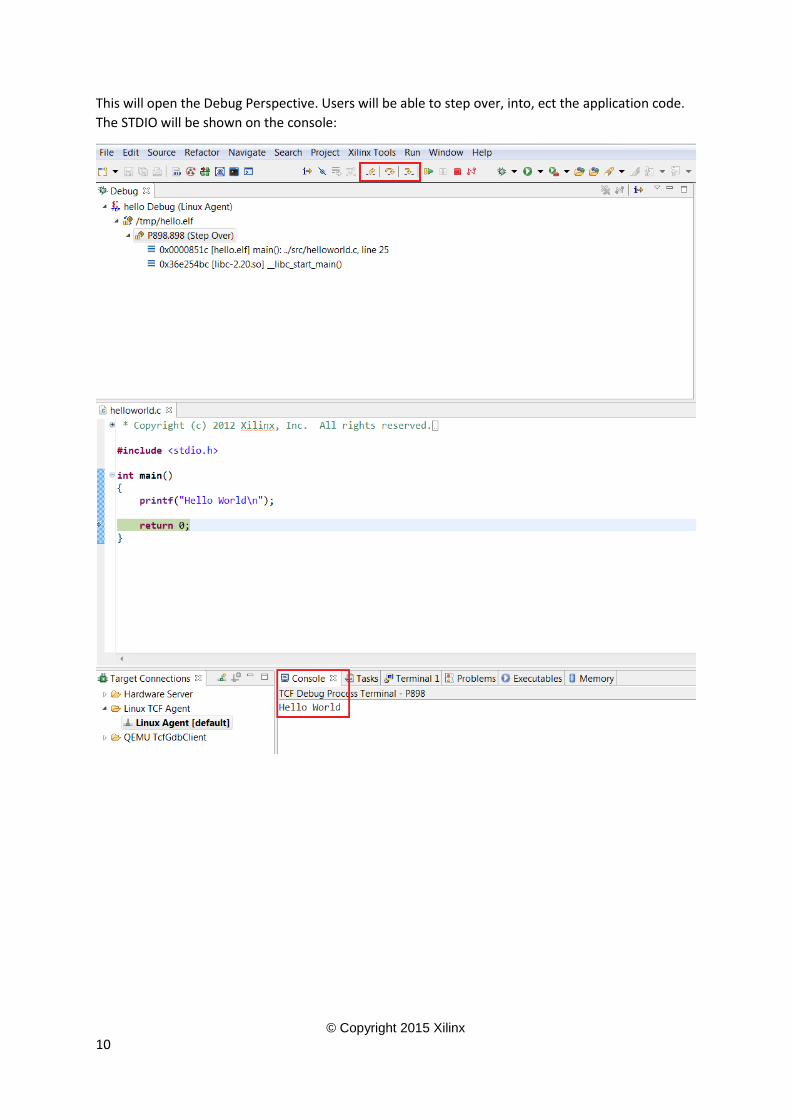
This will open the Debug Perspective. Users will be able to step over, into, ect the application code.
The STDIO will be shown on the console:
© Copyright 2015 Xilinx
11
Section 2: QEMU Debug
Using the QEMU to debug A Standalone Zynq Application:
Petalinux comes Pre-packaged with QEMU. We can use this to debug ZC702 standalone application
too.
Tip: To get the path to the QEMU use the command below:
which qemu-system-aarch64
/proj/gsd/petalinux/2015.2/tools/linux-i386/petalinux/bin/qemu-system-aarch64 -m 1024 -
nographic -M arm-generic-fdt-plnx -dtb $path/images/linux/system.dtb -serial /dev/null -serial
mon:stdio -gdb tcp::1137 –S
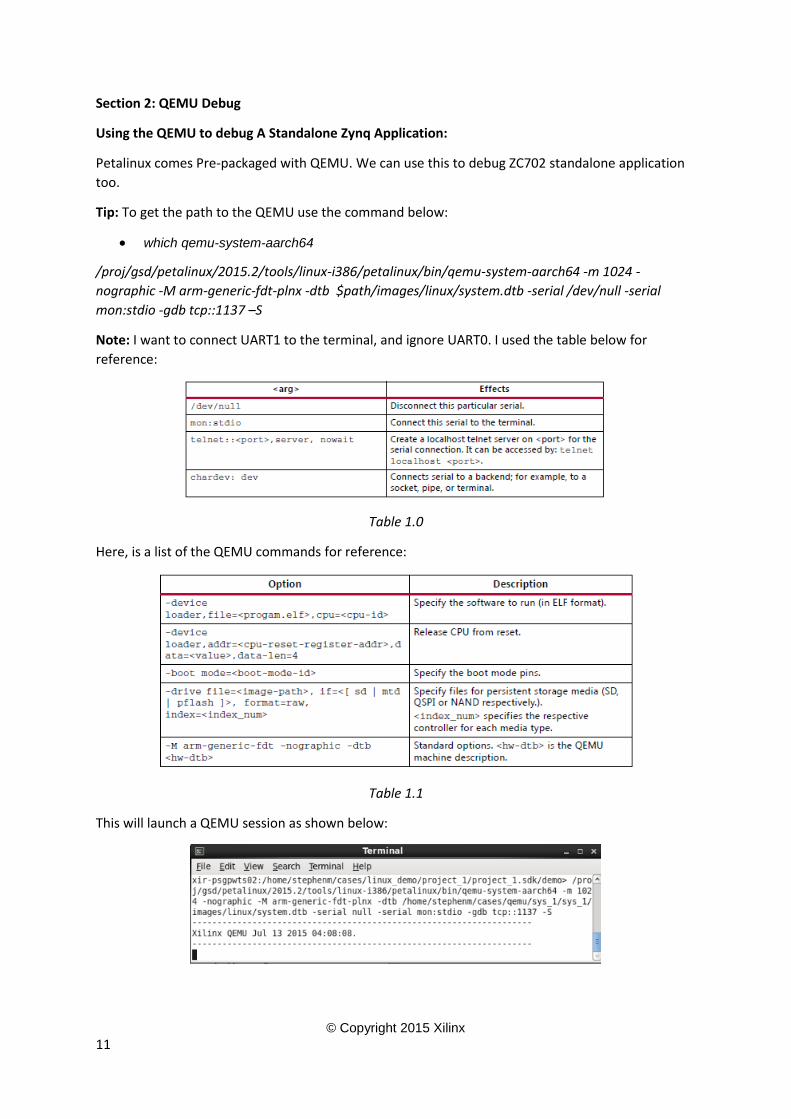
Note: I want to connect UART1 to the terminal, and ignore UART0. I used the table below for
reference:
Table 1.0
Here, is a list of the QEMU commands for reference:
Table 1.1
This will launch a QEMU session as shown below:
© Copyright 2015 Xilinx
12
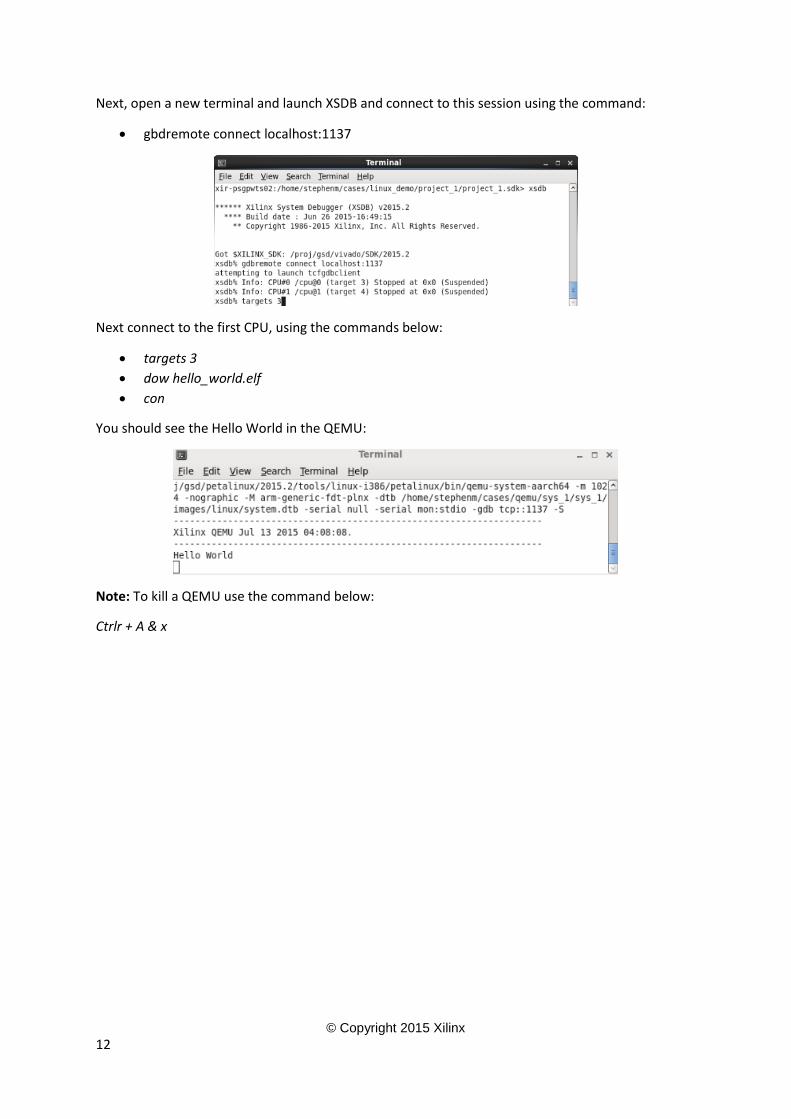
Next, open a new terminal and launch XSDB and connect to this session using the command:
gbdremote connect localhost:1137
Next connect to the first CPU, using the commands below:
targets 3
dow hello_world.elf
con
You should see the Hello World in the QEMU:
Note: To kill a QEMU use the command below:
Ctrlr + A & x
© Copyright 2015 Xilinx
13
Introducing the MPSoC in QEMU:
The flow to use MPSoC is pretty similar to Zynq, with added complexity due to the increased
processors.
petalinux-create -t project -s /proj/petalinux/petalinux-v2015.SW_Beta2_bsps_latest/Xilinx-
ZynqMP-QEMU-EAApr2015-v2015.SW_Beta2-final.bsp
source /proj/petalinux/petalinux-v2015.SW_Beta2_daily_latest/petalinux-v2015.SW_Beta2-
final/settings.csh
cd Xilinx-ZynqMP-QEMU-EAApr2015
petalinux-build
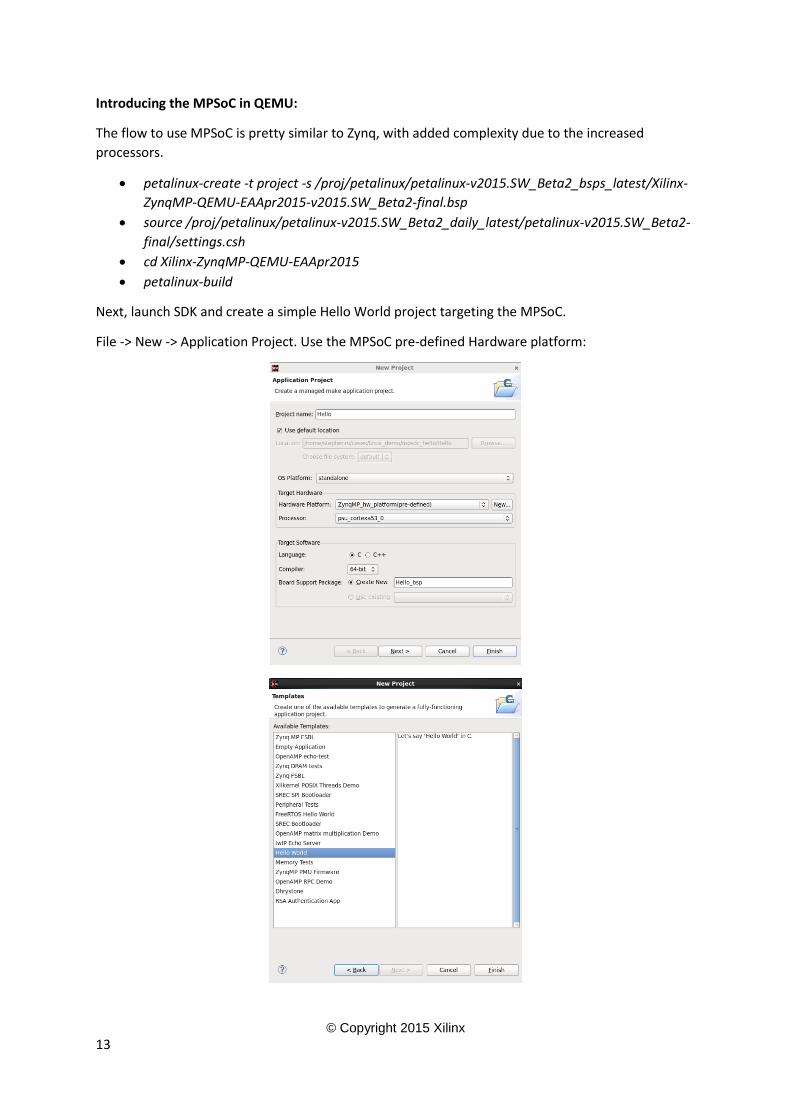
Next, launch SDK and create a simple Hello World project targeting the MPSoC.
File -> New -> Application Project. Use the MPSoC pre-defined Hardware platform:
© Copyright 2015 Xilinx
14
Debugging Hello World A53 App on MPSoC using XSDB CommandLine
We can use the pre-built DTB to debug the Hello world application targeting the first A53 (CPU0). For
example, we can run the command below:
/proj/gsd/petalinux/2015.2/tools/linux-i386/petalinux/bin/qemu-system-aarch64 -nographic -M
arm-generic-fdt -dtb /home/stephenm/cases/linux_demo/project_1/project_1.sdk/Xilinx-ZynqMP-
QEMU-EAApr2015/pre-built/linux/images/xilinx-ronaldo-arm.dtb -device
loader,file=/home/stephenm/cases/linux_demo/mpsoc_hello/Hello/Debug/Hello.elf,cpu=0 -device
loader,addr=0xfd1a0104,data=0x8000000e,data-len=4 -serial mon:stdio -gdb tcp::1137 –S
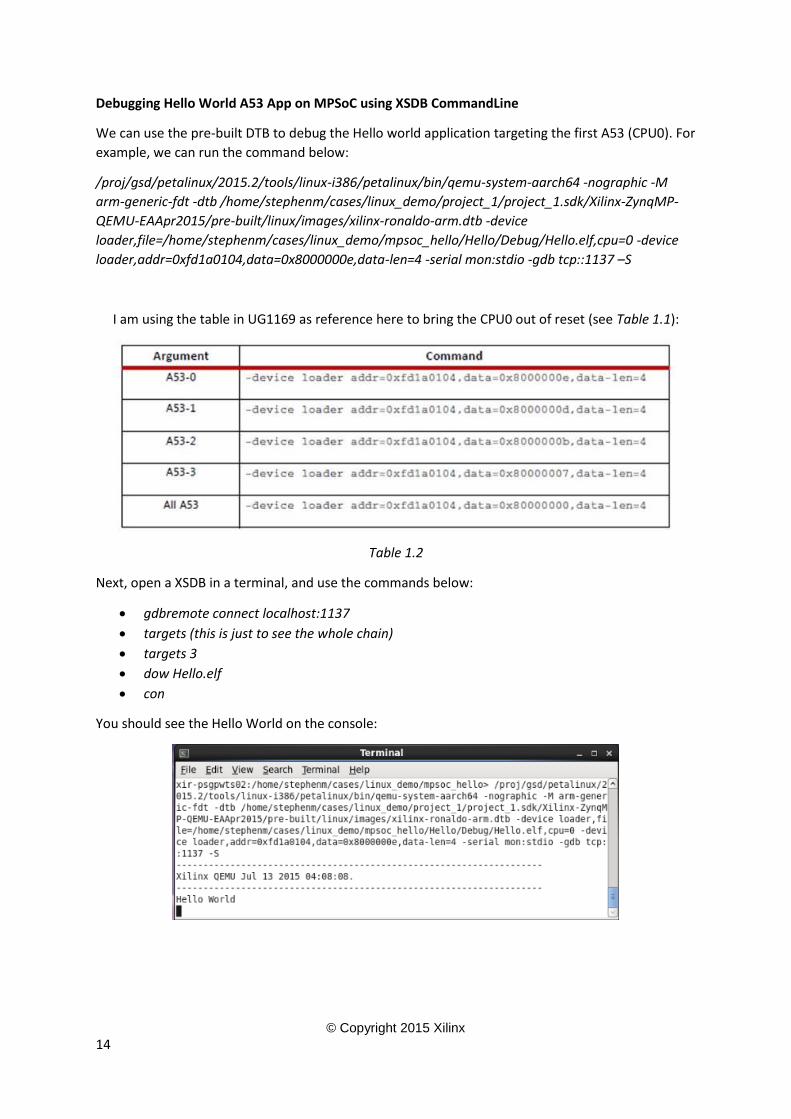
I am using the table in UG1169 as reference here to bring the CPU0 out of reset (see Table 1.1):
Table 1.2
Next, open a XSDB in a terminal, and use the commands below:
gdbremote connect localhost:1137
targets (this is just to see the whole chain)
targets 3
dow Hello.elf
con
You should see the Hello World on the console:
© Copyright 2015 Xilinx
15
Debugging Hello World A53 App on MPSoC using SDK GUI
There are two ways to connect to a QEMU session in SDK, users can connect to a QEMU session that
is launched from a separate Terminal, or they can connect to a QEMU running from SDK. Here, I will
discuss both.
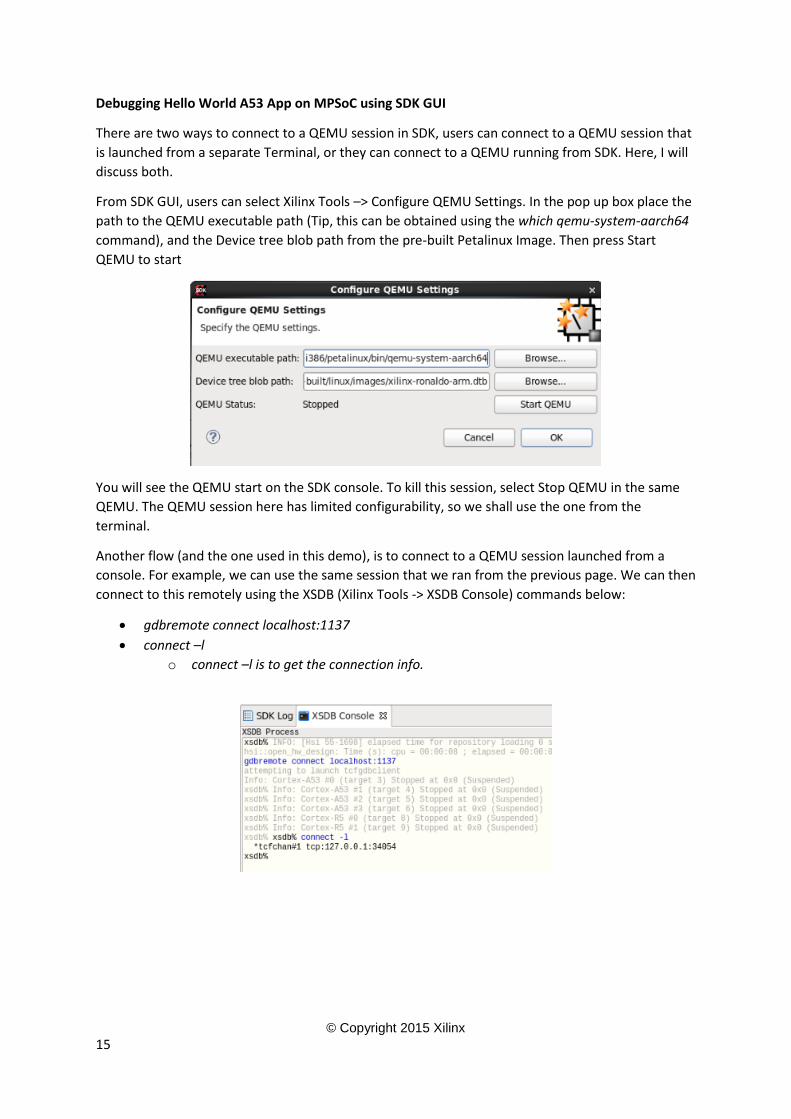
From SDK GUI, users can select Xilinx Tools –> Configure QEMU Settings. In the pop up box place the
path to the QEMU executable path (Tip, this can be obtained using the which qemu-system-aarch64
command), and the Device tree blob path from the pre-built Petalinux Image. Then press Start
QEMU to start
You will see the QEMU start on the SDK console. To kill this session, select Stop QEMU in the same
QEMU. The QEMU session here has limited configurability, so we shall use the one from the
terminal.
Another flow (and the one used in this demo), is to connect to a QEMU session launched from a
console. For example, we can use the same session that we ran from the previous page. We can then
connect to this remotely using the XSDB (Xilinx Tools -> XSDB Console) commands below:
gdbremote connect localhost:1137
connect –l
o connect –l is to get the connection info.
© Copyright 2015 Xilinx
16
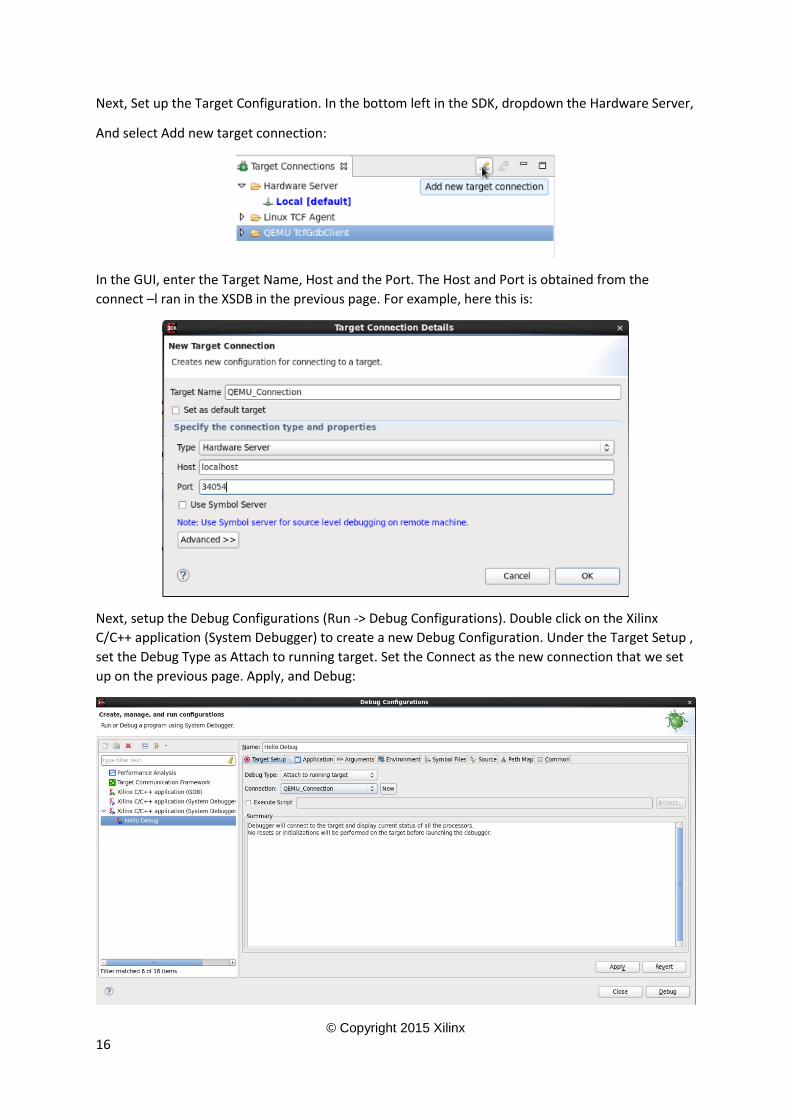
Next, Set up the Target Configuration. In the bottom left in the SDK, dropdown the Hardware Server,
And select Add new target connection:
In the GUI, enter the Target Name, Host and the Port. The Host and Port is obtained from the
connect –l ran in the XSDB in the previous page. For example, here this is:
Next, setup the Debug Configurations (Run -> Debug Configurations). Double click on the Xilinx
C/C++ application (System Debugger) to create a new Debug Configuration. Under the Target Setup ,
set the Debug Type as Attach to running target. Set the Connect as the new connection that we set
up on the previous page. Apply, and Debug:
© Copyright 2015 Xilinx
17
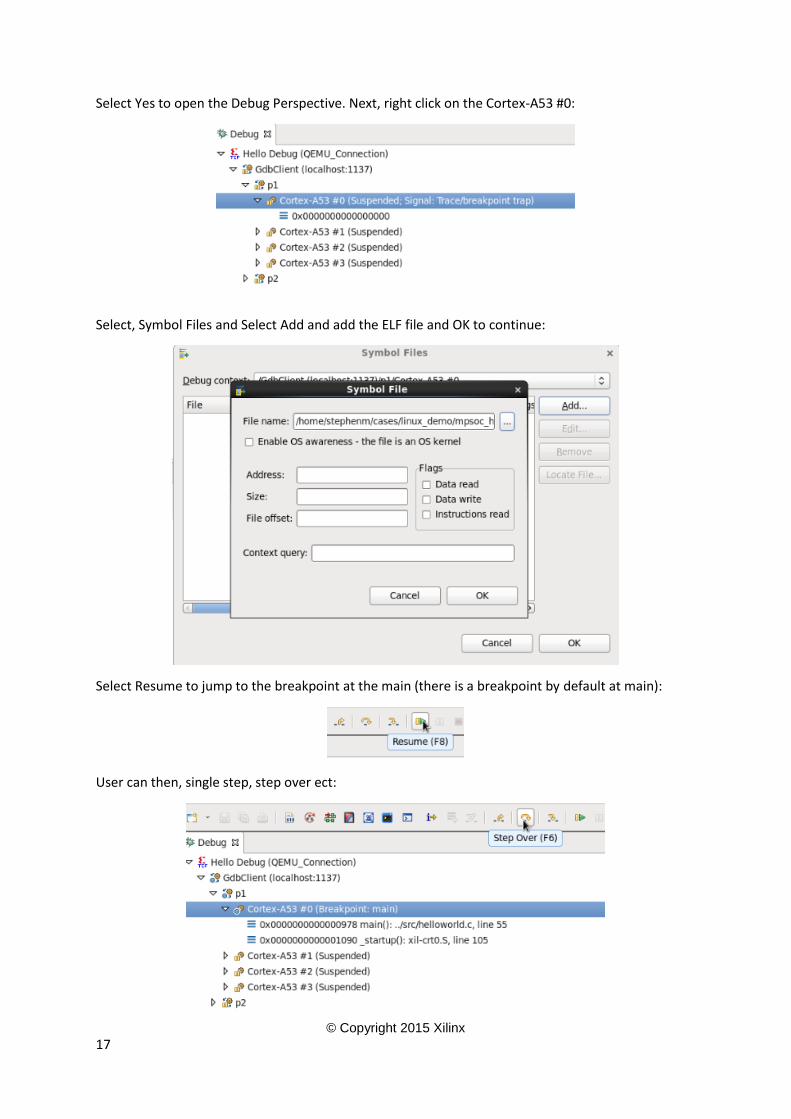
Select Yes to open the Debug Perspective. Next, right click on the Cortex-A53 #0:
Select, Symbol Files and Select Add and add the ELF file and OK to continue:
Select Resume to jump to the breakpoint at the main (there is a breakpoint by default at main):
User can then, single step, step over ect:
© Copyright 2015 Xilinx
18
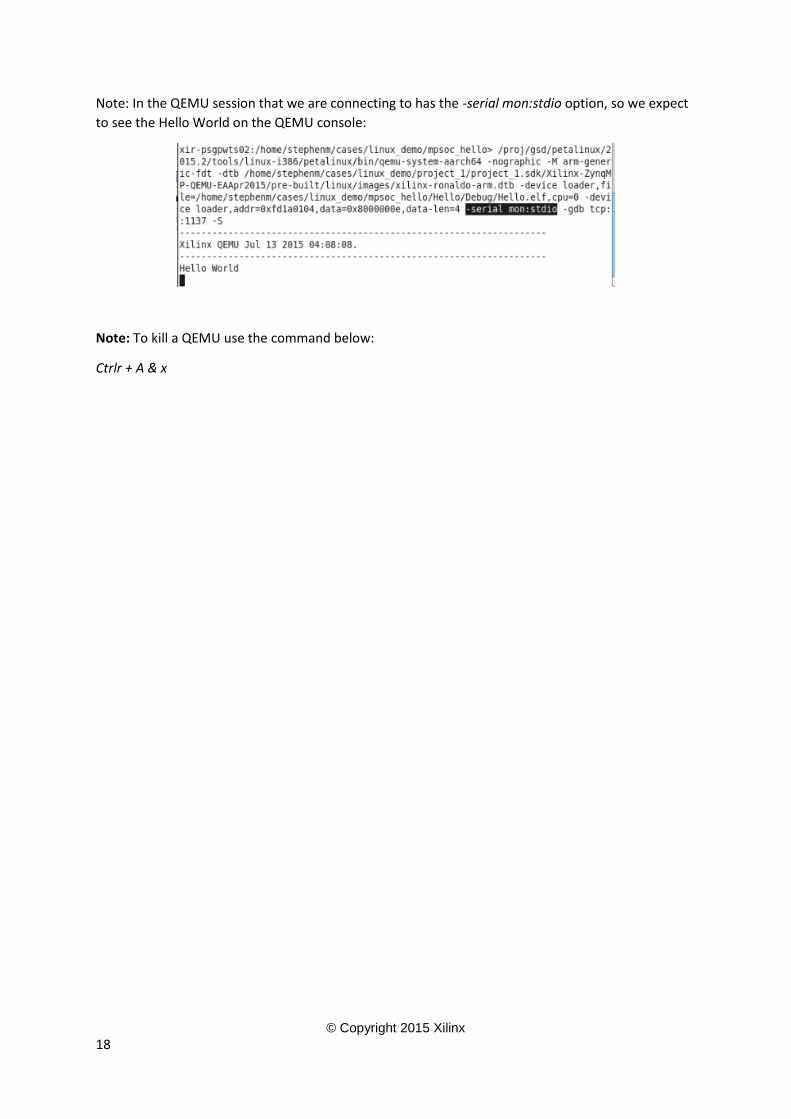
Note: In the QEMU session that we are connecting to has the -serial mon:stdio option, so we expect
to see the Hello World on the QEMU console:
Note: To kill a QEMU use the command below:
Ctrlr + A & x
© Copyright 2015 Xilinx
19
Debugging Hello World A53 App on MPSoC using GDB
Here, we can use the GDB debugger to debug a Hello World application on the first A53 processor.
We can use the same command as above:
/proj/gsd/petalinux/2015.2/tools/linux-i386/petalinux/bin/qemu-system-aarch64 -nographic -M
arm-generic-fdt -dtb /home/stephenm/cases/linux_demo/project_1/project_1.sdk/Xilinx-ZynqMP-
QEMU-EAApr2015/pre-built/linux/images/xilinx-ronaldo-arm.dtb -device
loader,file=/home/stephenm/cases/linux_demo/mpsoc_hello/Hello/Debug/Hello.elf,cpu=0 -device
loader,addr=0xfd1a0104,data=0x8000000e,data-len=4 -serial mon:stdio -gdb tcp::1440 –S
Then in a separate terminal, launch the GDB:
aarch64-none-elf-gdb Hello.elf
o For Linux, this is aarch64-linux-gnu-gdb
target remote: 1440
b main (to set a breakpoint at main)
c to continue
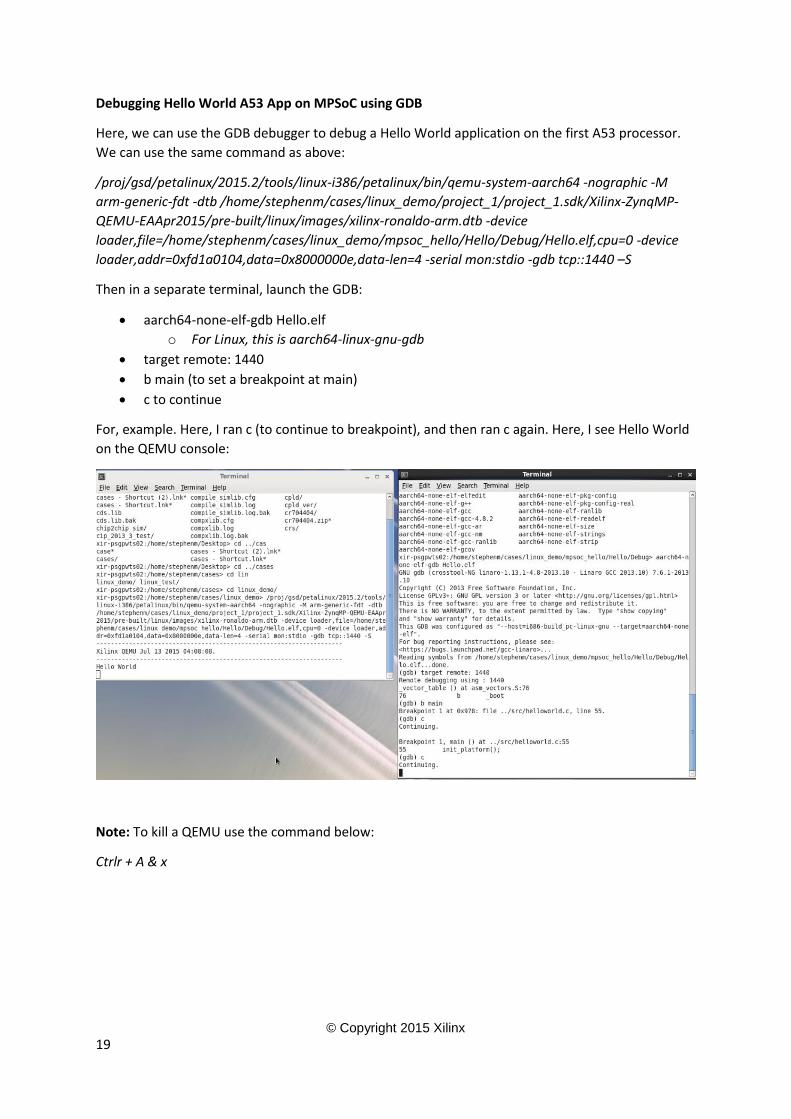
For, example. Here, I ran c (to continue to breakpoint), and then ran c again. Here, I see Hello World
on the QEMU console:
Note: To kill a QEMU use the command below:
Ctrlr + A & x
© Copyright 2015 Xilinx
20
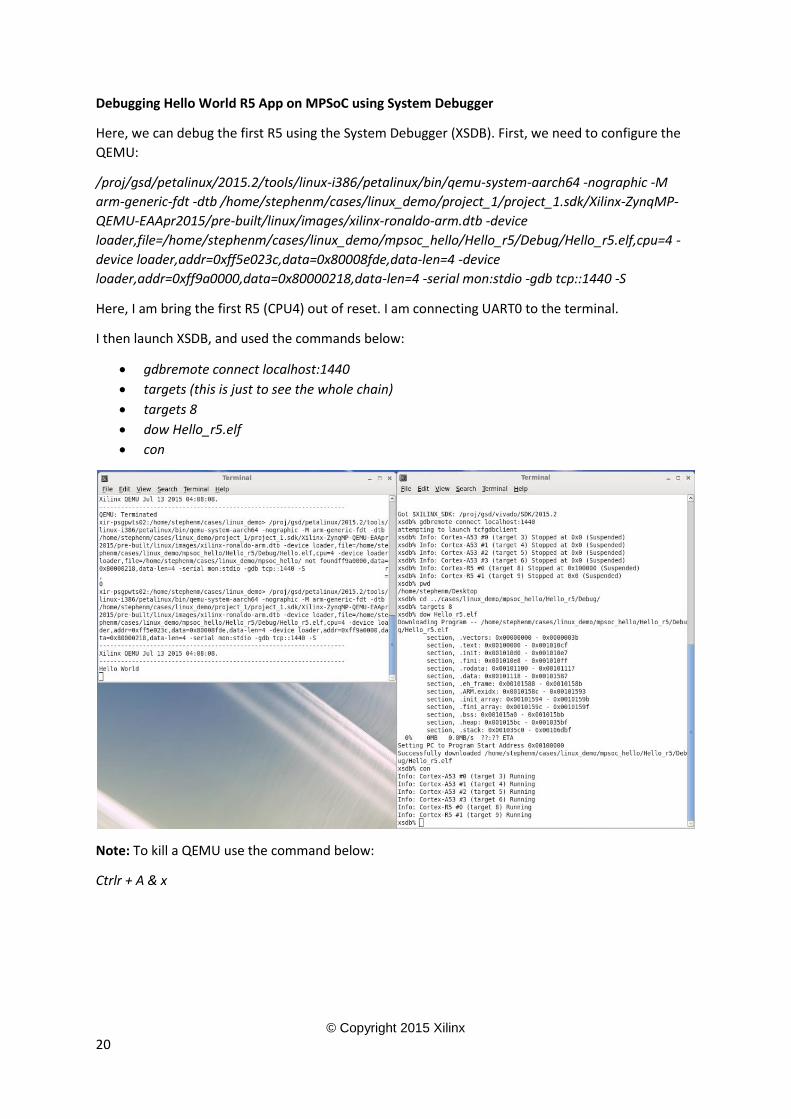
Debugging Hello World R5 App on MPSoC using System Debugger
Here, we can debug the first R5 using the System Debugger (XSDB). First, we need to configure the
QEMU:
/proj/gsd/petalinux/2015.2/tools/linux-i386/petalinux/bin/qemu-system-aarch64 -nographic -M
arm-generic-fdt -dtb /home/stephenm/cases/linux_demo/project_1/project_1.sdk/Xilinx-ZynqMP-
QEMU-EAApr2015/pre-built/linux/images/xilinx-ronaldo-arm.dtb -device
loader,file=/home/stephenm/cases/linux_demo/mpsoc_hello/Hello_r5/Debug/Hello_r5.elf,cpu=4 -
device loader,addr=0xff5e023c,data=0x80008fde,data-len=4 -device
loader,addr=0xff9a0000,data=0x80000218,data-len=4 -serial mon:stdio -gdb tcp::1440 -S
Here, I am bring the first R5 (CPU4) out of reset. I am connecting UART0 to the terminal.
I then launch XSDB, and used the commands below:
gdbremote connect localhost:1440
targets (this is just to see the whole chain)
targets 8
dow Hello_r5.elf
con
Note: To kill a QEMU use the command below:
Ctrlr + A & x