Embed Size (px)
Citation preview

SDP Annual Conference
Charleston, SC September 20-23, 2016

The Society of Depreciation Professionals
extends its sincere appreciation to our
Gold Sponsors for their support of the
Annual Conference and Training
Alliance Consulting Group was formed by its Managing Partner, Dane Watson,
PE, CDP, in 2004 to provide depreciation, fixed asset and expert consulting
services for the full range of utilities in North America. Mr. Watson is actively
involved in the day-to-day operations of the business along with three senior
professionals – Dr. Karen Ponder, Rhonda Watts and Rebecca Richards as well
as other supporting staff. Alliance is dedicated to providing quality
depreciation consulting and fixed asset expert services. Their engineering and
accounting professionals have 100 years of combined experience around the utility industry, and have been employed in
the industry as utility employees and managers, auditors and consultants.
AUS Consultants has been delivering unsurpassed consulting services to the
utility industry for decades. Their expertise includes all aspects of the utility
regulatory and ratemaking arenas, as well as the valuation field. Because they
focus exclusively on the utility industry, they have developed deep industry
expertise and experience, which they pass on to their clients, providing first-rate
services and ensuring their clients’ success. Their consultants have decades of experience, are well respected throughout
the industry, and understand the key strategic issues faced by today’s utility professionals. All of their consultants are
utility experts and have advised vertically integrated utilities as well as utilities operating in the restructured industry.
AUS Consultants’ valuation expertise includes utility asset valuation, as well as the valuation of intellectual property and
intangible assets. AUS Consultants publishes two of the top utility reports in the industry: the AUS Monthly Utility
Report and the AUS Telephone Plant Index.
Founded in 1915, Gannett Fleming, is a global infrastructure firm that provides
planning, design, technology, and construction management services for a
diverse range of markets and disciplines. They have helped to shape
infrastructure and improve communities through transportation, environmental, water, energy, and facility-related
projects in more than 65 countries. The firm embraces sustainability and innovation for all activities, finding the best
solutions and the most efficient processes while being responsible stewards of the environment. Gannett Fleming
Valuation and Rate Consultants, LLC provides consulting services to investor-owned and publicly-owned utilities and
has successfully represented clients in public pricing policy and related matters before regulators and in courts of law.
Their team of engineers, accountants and analysts has a broad experience base to meet your needs and is skilled in using
computer-modeling techniques to customize studies and analysis. They combine the guiding traditional principles with
innovative approaches to provide an understandable product that can stand the test of scrutiny.
PowerPlan provides a fully integrated suite of asset-centric accounting, tax,
budgeting and regulatory software solutions. PowerPlan integrates asset data
across multiple departments and automates key workflows. By ensuring
everyone has visibility into detailed asset data at each phase of the asset lifecycle, you are able to make better decisions,
ultimately improving financial performance. The world’s most demanding asset-centric companies already trust
PowerPlan to manage more than $2.3 trillion in assets.

SDP Conference Materials
September 19-20, 2016
Section 1: Conference Schedule
Speaker Bios
Attendee List
Section 2: Electric Rate Ratemaking
Michael Gorman, Brubaker & Associates
Section 3: Tax and the Regulatory Impact
Matthew Kahn, conEdison, Inc.
Section 4: Cost Segregation Studies & Tangible Property Regulations
Ashley Sullivan & David Fabian, MS Consultants
Section 5: North American Utility Regulatory Trends
Derek Manville, PWC
Section 6: Making and Managing a Depreciation Study
John Wiedmayer, Gannett Fleming
Section 7: Results of Operations Modeling & Working Cash
Andy Strasner & David White, Utility Consulting Group
Section 8: Early Plant Retirement: Accounting Considerations
Cindy Leed & Melissa Abernathy, Duke Energy
Section 9: Accounting Update
John Lacey, California State University Long Beach
Materials as of 9/21/16
Click the section number to jump to that presentation.

Section 1 Click to jump back to Table of Contents

Sunday, September 18, 2016
SDP Conference Schedule
September 19-20, 2016
5:30-7:00 PM Welcome Reception Gold Ballroom
Monday, September 19, 2016
7:30-8:30 AM
8:30-8:45 AM
Registration and Breakfast
Welcome Remarks Rick Fisher, CDP
Carolina A
Carolina B
David Garrett
8:45-9:45 AM Regulation, Technological
Change & Capital Recovery:
Three Decades Later
Hon. Branko Terzic Carolina B
9:45-10:45 AM Electric Rate Ratemaking Michael Gorman Carolina B
10:45-11:00 AM Break
11:00 AM-12:00 PM Managing a Depreciation
Study
John Wiedmeyer Carolina B
12:00-1:30 PM Lunch and SDP Annual Meeting Carolina A
1:30-2:30 PM Tax Relief and the
Regulatory Impact
Matthew Kahn Carolina B
2:30-3:30 PM Cost Segregation Studies &
Tangible Property Regulations
Ashley Sullivan
David Fabian
Carolina B
3:30-3:45 PM Break
3:45-4:45 PM North American Utility
Regulatory Trends
Derek Manville Carolina B
5:30-7:00 PM Evening Reception
Continued on next page
- Off site The Macintosh479B King Street Charleston, SC 29403

Tuesday, September 20, 2016
7:45-8:30 AM
8:30-9:30 AM
Registration and Breakfast
Working Cash & Results Andy Strasner
Carolina A
Carolina B
of Operations Modeling Dave White
9:30-10:30 AM Early Plant Retirement
Accounting Considerations
Cynthia Lee Carolina B
10:30-10:45 AM Break
10:45-11:30 Accounting Updates John Lacey Carolina B
End of program

SDP Conference Speaker Biographies David Fabian, MS Consultants
David Fabian has 25+ years’ tax and accounting experience. He joined MS Consultants in 1999 and has
been personally involved in over 7,500 Cost Segregation projects in more than 30 states. David has
presented on a variety of topics including depreciation & cost segregation, energy modeling, tangible
property regs, & more. He also developed comprehensive in-house training and quality control
programs.
Michael Gorman, Brubaker & Associates Inc.
Mr. Gorman is a Managing Principal at BAI. He received Degrees of Bachelor of Science in Electrical
Engineering from Southern Illinois University at Carbondale and Master of Business Administration from
the University of Illinois at Springfield. Mr. Gorman has also done extensive graduate studies in Financial
Economics. He earned the designation Chartered Financial Analyst (CFA) from the CFA Institute.
Mr. Gorman has been in the consulting practice since 1990, and in the energy business since 1983. Mr.
Gorman was employed by the Illinois Commerce Commission and held positions including Director of
the Financial Analysis Department, Senior Analyst, Planning Analyst and Utility Engineer. Mr. Gorman
was also employed by Merrill Lynch as a Financial Consultant. In this position, he consulted on cash
management and investment strategies.
His responsibilities at BAI include project management, cost of capital studies, depreciation studies,
financial integrity studies, system resource planning studies alternative regulation plan/mechanisms cost
of studies, mechanisms, service, rate design, production cost evaluations, commodity risk management,
commodity procurement management, competitive supplier management and counterparty credit risk.
Cynthia (“Cindy”) S. Lee, Duke Energy Corporation
Cindy is the Director of Asset Accounting for Duke Energy Corporation, and has been at the Company
since 2002. She is a graduate of Rollins College with a Bachelor of Arts in Economics and a graduate of
The Johns Hopkins University with a Master of Business Administration. Cindy is a Certified Public
Accountant licensed in the state of North Carolina. As the Director of Asset Accounting, Cindy has
responsibility for the accounting functions for Duke Energy’s Asset Accounting function within the
Regulated Utilities business segment for each of the jurisdictions we operate (NC, SC, FL, OH, KY, IN).
She is also one of Duke Energy’s property accounting representatives with Edison Electric Institute, a
trade association of electric utility companies. Cindy lives in Charlotte with her husband Randy, and
daughter Derren.
Matthew Kahn, MST, Consolidated Edison, Inc.
Matthew Kahn is a Tax Manager with the New York Utility, Con Edison, Inc. As part of his role with the
company, Mr. Kahn is involved in the rate case process and oversees the preparation and review of
depreciation studies for the electric, gas, and steam businesses of the Utility. He holds a Bachelor’s

Degree in Accounting, and a Master’s Degree in Taxation, both from Bentley University. Mr. Kahn has
submitted testimony regarding depreciation and income tax accounting issues in the State of New York.
Derek Manville, PWC
Derek is a Director in PwC’s Advisory – Power & Utilities practice based in Atlanta, Georgia. Derek has
spent the last 10 years implementing complex business process and technology transformation
programs within the Utilities industry.
Derek’s relevant project experience including:
Merger Integration (Pre & Post-Merger)
Regulatory Strategy & Process Improvement
Financial Planning, Budgeting, & Forecasting
Financial Reporting (Internal & External)
Financial Chart of Accounts (CoA) Design
Derek leads PwC’s Advisory Regulatory process improvement offering – delivering regulatory
management process improvement and technology solutions to utilities clients. Derek graduated with
his Master of Business Administration (MBA) from Georgia Institute of Technology and a Bachelors of
Political Science from the Wright State University.
Andy Strasner, Manager, Utility Consulting Group LLC
Andy has over fifteen years of consulting experience serving various clients in the utility industry. His
experience includes project management, systems design and implementation, business requirements,
strategy development and business process reengineering. Prior to joining UCG, Andy was employed by
BearingPoint as a manager in the utility practice. He was also previously employed by Arthur Andersen
Business Consulting and served clients primarily in the utility industry. He holds a Bachelor’s degree in
Business-Economics and Accounting from the University of California at Santa Barbara.
Ashley Sullivan, MS Consultants
Ashley is a Quality Control Manager for Cost Segregation Studies at MS Consultants and joined the
company in 2013. She has over 12 years Cost Segregation experience. She heads up the Virginia office.
Ashley holds a Senior Cost Segregation Professional designation with ASCSP. She travels extensively
nationwide to meet with clients and discuss opportunities.
The Honorable Branko Terzic, Berkeley Research Group
Branko Terzic is a Managing Director at Berkeley Research Group (BRG) LLC and a Nonresident Senior
Fellow of the Atlantic Council’s Global Energy Center in Washington, DC. Dr. Terzic is a Founding
member of the Society of Depreciation Professionals (SDP) and was its first Vice President. In a speech
given at the 1986 Iowa State University Regulatory Conference, while in his last year as a Wisconsin PSC
Commissioner, Terzic called for the formation of the depreciation society.
Terzic’s service in government includes that of Commissioner on the U.S. Federal Energy Regulatory
Commission, Commissioner on the State of Wisconsin Public Service Commission and Chairman of the
State of Wisconsin Racing Board. In business prior to joining BRG, Terzic served as Executive Director of
the Deloitte Center for Energy Solutions; Global Regulatory Policy Leader for Deloitte & Touche LLP;
Chairman, President and CEO of Yankee Energy System, Inc.; Managing Director Arthur Andersen
Economic Consulting, Special Investigations Engineer at Wisconsin Electric Power Company and as a
management consultant. He has been a member of the National Petroleum Council and National Coal
Council and is a former Chairman of the United Nations Economic Commission for Europe (UN ECE) Ad
Hoc Group of Experts on Cleaner Electricity Production. A frequent speaker at industry forums and a
prolific writer Terzic currently appears regularly on CNN International and Fox Business channel. Terzic
was elected to the Energy Efficiency Forum Hall of Fame (2009) and was honored with the “Champion
Award” by The Women’s Council on Energy and Environment (2008) as well as other industry awards.
He is a faculty member of the Washington Campus consortium of 16 MBA schools, is a member of the
ASME, AEE, IAEE, Energy Bar Association and other organizations. Branko Terzic holds a BS in Energy
Engineering and was awarded an honorary Doctor of Sciences Engineering degree both from the
University of Wisconsin-Milwaukee.
Dave White, Utility Consulting Group LLC
Dave has over 25 years of experience serving numerous clients in the utility industry. He has been
involved in a wide range of consulting assignments covering regulatory, shared services, operations and
technology processes and systems. Prior to joining the management consulting firm Utility Consulting
Group LLC, Dave was employed by BearingPoint as a senior manager in their utility practice. He was also
a senior manager with Arthur Andersen Business Consulting, serving a number of utilities in North
America. Prior to Andersen, he was employed by Sargent & Lundy and managed cross-functional teams,
budgeted and scheduled projects, and counseled domestic and international clients on the procurement
of equipment and the design of electric substations. Dave holds a M.B.A from University of California at
Los Angeles, and a Bachelor of Science degree in Electrical Engineering from Northwestern University.
John F. Wiedmayer, CDP, Gannett Fleming, Inc.
John Wiedmayer is a Project Manager, Depreciation Studies for the Valuation and Rate Division of
Gannett Fleming, Inc. He has over 29 years of consulting experience and has conducted numerous
depreciation, valuation, and cost of service studies for clients in the electric, gas, railroad, telephone,
water, and wastewater industries.
John holds a B.A. from Lafayette College in Engineering and an M.B.A. from Penn State University. Mr.
Wiedmayer’s research paper for his M.B.A. was devoted to electric utility industry restructuring. He has
completed five week-long courses of depreciation training offered by Depreciation Programs, Inc. in
Grand Rapids, MI. He is a member of the National Society of Professional Engineers and the
Pennsylvania Society of Professional Engineers. Mr. Wiedmayer has provided expert testimony related
to depreciation in several states (MO, IL, NY, PA, KY, AZ, MD, and UT); in Nova Scotia, Newfoundland,
and Labrador; and before the FERC. John has served on the SDP Board and was SDP President in 2005.

SDP Annual Conference and Training | September 18-23, 2016 | Francis Marion Hotel, Charleston, SC
Annual Conference Attendee List
Melissa Abernathy Duke Energy [email protected]
Ned Allis Gannett Fleming Valuation and Rate Consultants, LLC [email protected]
Brian Andrews Brubaker & Associates, Inc. [email protected]
Brian Bahr SouthWest Water Company [email protected]
Bryan Barnes PowerPlan Inc. [email protected]
Stephen Barreca BCRI Valuation Services [email protected]
Richard Bennett PowerPlan, Inc. [email protected]
Donna Bourne FortisAlberta [email protected]
Kiki Carlson Suburban Water Systems [email protected]
Jason Cash American Electric Power [email protected]
Michael Chalwell Consolidated Edison Company of New York, Inc. [email protected]
Richard Clarke Gannett Fleming Valuation and Rate Consultants, LLC [email protected]
Donald Clayton Tangibl LLC [email protected]
William Chris Colberg USDA Rural Utilities Service [email protected]
Ryan Cole CSX Transportation [email protected]
Corrado Costanzo TransCanada [email protected]
Karen Daly LG&E and KU Services [email protected]
Manoj Dandekar Baker Mckenzie Consulting LLC [email protected]
David Davis American Electric Power [email protected]
Amber DeLucenay TECO Energy - Peoples Gas [email protected]

SDP Annual Conference and Training | September 18-23, 2016 | Francis Marion Hotel, Charleston, SC
Annual Conference Attendee List
David Fabian MS Consultants, LLC [email protected]
Richard Fisher PowerPlan [email protected]
Sandra Funderburg Southern California Gas Company [email protected]
Ron Garner AR Public Service Commission [email protected]
David Garrett Garrett Group LLC [email protected]
Tammi Goldstein Pacific Gas and Electric Company [email protected]
Michael P. Gorman Brubaker & Associates, Inc. [email protected]
Tracy Greer SRP [email protected]
Chris Harris Virginia State Corporation Commission [email protected]
Marianella Hensley TECO Energy - Peoples Gas [email protected]
Wade Horigan Tangibl LLC [email protected]
Melissa Howard Gannett Fleming, Inc. [email protected]
Jeremy Hubert PA PUC [email protected]
Paul Hunt Southern California Edison [email protected]
Jerry Janow Gannett Fleming Canada ULC [email protected]
Susan Jensen Surface Transportation Board [email protected]
John Johnson Atmos Energy Corporation [email protected]
Frederick Johnston Gannett Fleming, Inc. [email protected]
Lance Kaufman Bardwell Consulting [email protected]
Robert Kelly SouthWest Water Company [email protected]
SDP Annual Conference and Training | September 18-23, 2016 | Francis Marion Hotel, Charleston, SC
Annual Conference Attendee List
Larry Kennedy Gannett Fleming Canada ULC [email protected]
Nick Korolsky SRP [email protected]
Steven Kramer Regulatory Commission of Alaska [email protected]
Priti Laderoute EPCOR Utilities Inc [email protected]
Jim LaPan State of Michigan Govt - LARA - MPSC [email protected]
James Layne Regulatory Commission of Alaska [email protected]
Cindy Lee Duke Energy [email protected]
Patricia Lee Consultant [email protected]
Qun Li ConEdsion [email protected]
Debra Marston EPCOR Distribution & Transmission Inc. [email protected]
Dannielle McGrath Atco Pipelines [email protected]
Tiawna Moffat FERC [email protected]
Sebastian Morales Aqua America [email protected]
Lorrie Mullen Alberta Utilities Commission [email protected]
James Murray Rural Utilities Servvice [email protected]
Carol Myers Virginia State Corporation Commission [email protected]
Flora Ngai Southern California Gas Company [email protected]
Jacqueline Nguyen Southern California Edison [email protected]
Amanda Nori Gannett Fleming Canada ULC [email protected]
Tony O'Connor TransCanada PipeLines [email protected]

SDP Annual Conference and Training | September 18-23, 2016 | Francis Marion Hotel, Charleston, SC
Annual Conference Attendee List
Michael Plunkett PowerPlan [email protected]
Karen Ponder Alliance Consulting Group [email protected]
Dixon Quong Atco Pipelines [email protected]
Joanna Richard Gannett Fleming Valuation and Rate Consultants, LLC [email protected]
Casey Robb State of Wyoming [email protected]
Earl Robinson AUS Consultants [email protected]
David Sheffer AUS Consultants [email protected]
Russell Shipe Brunswick EMC [email protected]
Aaron Smith PowerPlan, Inc. [email protected]
John Spanos Gannett Fleming Valuation and Rate Consultants, LLC [email protected]
Douglas Steiner Salt River Project [email protected]
Jack Stevens USDA/RUS [email protected]
Alla Strickland GDS Associates, Inc [email protected]
Ashley Sullivan MS Consultants, LLC [email protected]
Branko Terzic Berkeley Research Group LLC [email protected]
Crystal Turner ONE Gas [email protected]
Matthew Vanderbilt San Diego Gas & Electric [email protected]
Kevin Watkins Consumers Energy [email protected]
Dane Watson Alliance Consulting Group [email protected]
Brent Weber Anchorage Water & Wastewater Utility [email protected]

SDP Annual Conference and Training | September 18-23, 2016 | Francis Marion Hotel, Charleston, SC
Annual Conference Attendee List
Sean Welsh Virginia State Corporation Commission [email protected]
Kimber Wichmann Wyoming Dept of Environmental Quality [email protected]
John Wiedmayer Gannett Fleming Valuation and Rate Consulatants, LLC, Inc. [email protected]
Herb Wilson ONE Gas, Inc. [email protected]
Gerrilynn Wolfe AR Public Service Commission [email protected]
Valerie Yeager CSX Transportation [email protected]
David Young Southern California Edison [email protected]

Section 2 Click to jump back to Table of Contents

““Electric Rate Electric Rate Ratemaking”Ratemaking”presented by
Michael Gorman
September 19, 2016September 19, 2016
BRUBAKER & ASSOCIATES, INC.
Michael Gorman
16690 Swingley Ridge Rd., Suite 140P. O. Box 412000
Chesterfield, Missouri 63017636 898 6725
1
636-898-6725www.consultbai.com

Three Steps in theThree Steps in theRatemaking ProcessRatemaking ProcessRatemaking ProcessRatemaking Process
1) Utility Revenue
Requirements
1) Utility Revenue
RequirementsRequirements
2) Class Cost of Service
Requirements
2) Class Cost of Service COMMCOMMINDLTG
RES
)
3) R t D i
)
3) R t D i
INDOTHOTH
3) Rate Design3) Rate Design INDUSTRIAL
2
Utility Revenue Utility Revenue Utility Revenue Utility Revenue RequirementsRequirementsRequirementsRequirements
3

Test Year
12 Months12 Months12 Months12 Months
P FP FHistoricalHistoricalTest YearTest Year PeriodPeriod
RateRatePro FormaPro Forma
9 9 MonthsMonths_______________., future test year
4
., current test year

Historical Pro Forma Adjustments
Change Pro Forma Revenue Revenue Plant Depr. Normal Operating Revenue Proposedp p g p
Current Rates Additions Rates O&M Sales Results Adjustment Rates
I. RevenueSales Revenue $625,000 $5,000 $630,000 $23,500 3.7% $653,500
Miscellaneous Revenue $1,000 $1,000 $1,000
Total $626,000 $631,000 $654,500
II. Operating ExpensesOperation & Maintenace $439,300 $5,000 $444,300 $444,300
Depreciation $34,000 $4,281 $1,519 $39,800 $39,800
Other Taxes $25,029 $171 $25,200 $25,200
Income taxes:
Current $21 112 $21 112 8 225 $29 337 Current $21,112 $21,112 8,225 $29,337
Deferred $15,000 ($1,498) $13,502 $13,502
Total Operating Expense $534,441 $543,914 $552,139
III. Operating Income $91,559 $87,086 $102,361
IV. Rate BasePlant-In-Service $1,148,744 $171,256 $1,320,000 $1,320,000
Acc. Depr. $412,159 $2,141 $414,300 $414,300
Net Plant $736,585 $905,700 $905,700
Add:
CWIP $350,000 $140,800 $209,200 $209,200
Plant Held For Future Use $25,000 $6,700 $18,300 $18,300
Material & Supplies $75,000 $75,000 $75,000
Cash Working Capital $43,800 $43,800 $43,800
Less:
Acc Deferred Income Tax $101 251 $749 $102 000 $102 000Acc. Deferred Income Tax $101,251 $749 $102,000 $102,000
Rate Base $1,129,134 $1,150,000 $1,150,000
Rate Of Return 8.11% 7.57% 8.90%

Rate of ReturnWeightedWeighted
PercentPercent Cost Cost Cost Cost Type of CapitalType of Capital
LongLong--term debtterm debt 47 0047 00%% 7 007 00%% 3 293 29 %%LongLong--term debtterm debt 47.0047.00%% 7.007.00%% 3.293.29 %%
Preferred stockPreferred stock 6 006 00 7 257 25 0 440 44Preferred stockPreferred stock 6.006.00 7.257.25 0.440.44
Common equityCommon equity 47 0047 00 11 0011 00 5 175 17
TotalTotal 100.00100.00%% 8.908.90 %%
Common equityCommon equity 47.0047.00 11.0011.00 5.175.17
6

Class CostClass Cost LTGRESClass CostClass Cost
of Serviceof ServiceCOMMCOMMIND
LTG
OTHOTHof Serviceof Service
7

Customer ClassesCustomer Classes• Residential
• General Service (Commercial)
• Large Power (Industrial)
Lighting• Lighting
• OtherOther
Demand Size, Load Factor, Delivery Voltage
8

Step 1: FunctionalizationStep 1: Functionalization
AmountFUNCTION
ProductionProduction
TransmissionTransmission
$395,217
8 172TransmissionTransmission
DistributionDistribution
Customer AccountsCustomer Accounts
8,172
151,713
39 150Customer AccountsCustomer Accounts
Admin. & GeneralAdmin. & General
T t l RT t l R
39,150
60,248
$Total RevenueTotal Revenue $654,500
9

Step 2: ClassificationStep 2: Classification•• DemandDemand::
C t th t ith d dCosts that vary with demand
•• Energy:Energy:Costs that vary with energy provided
•• Customer:Customer:Costs related to customers served
•• DirectDirect AssignmentAssignment•• Direct Direct AssignmentAssignmentCosts attributable directly to a customer or
class
10
class
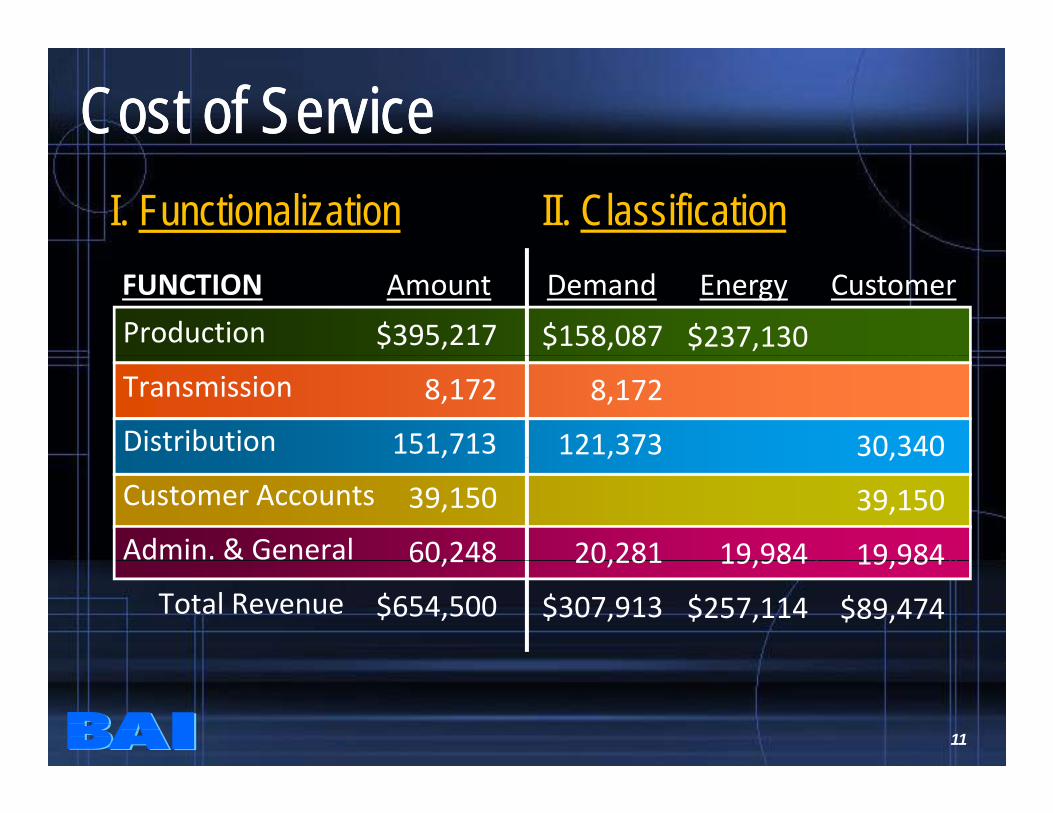
Cost of ServiceCost of ServiceII. ClassificationI. Functionalization
ProductionAmountFUNCTION
$395,217
Demand Energy Customer
$158,087 $237,130
Transmission
Distribution
8,172
151,713
8,172
121,373 30,340Customer Accounts
Admin. & General
,
39,150
60,248
,
20,281 19,984
,
39,150
19 984Total Revenue
60,248
$654,500
20,281
$307,913
19,984
$257,114
19,984
$89,474
11

TransmissionTransmission & Delivery of Electricity& Delivery of ElectricityTransmission
GENERATION GENERATION
Subtransmission
Distribution
DEMANDDEMAND
CUSTOMERCUSTOMER
KWKW
CUSTCUST##
DEMAND
CUSTOMER
KW
CUST#
Res.Com.C&I SecOther
DEMANDDEMAND
CUSTOMERCUSTOMER
KWKW
CUSTCUST##
DEMAND
CUSTOMER
KW
CUST#
Res.Com.C&I SecOther
DEMANDDEMAND
CUSTOMERCUSTOMER
KWKW
##
DEMAND
CUSTOMER
KW
#
Res.Com.C&I Sec
TRANS.
Industrial
12
CUSTCUST##
CUST# C&I Sec
Other

• Demand – Coincident (CP) vs.Non‐Coincident (NCP)Non Coincident (NCP)
• Based on class usage at generator, notat meter
13

Illustrative Example of Coincident vs.Illustrative Example of Coincident vs.NonNon Coincident DemandsCoincident DemandsNonNon--Coincident DemandsCoincident Demands
System PeakSystem Peak
NCPCP
man
d NCPCP
CP
NCP
Dem
RESRESCP
GSGS
INDINDNCP CP
CP
14TimeLTGLTG

Demand Loss FactorsGeneration / MeterDemand Available
100.00 kW GenerationGeneration
1.019 / 1.0001.019 / 1.000Trans/Sub CustomerTrans/Sub Customer
Transmission /Transmission /SubtransmissionSubtransmission98.11 kW
ters
ters
1.043 / 1.000 1.043 / 1.000 Primary CustomerPrimary Customer
95.88 kW PrimaryPrimaryMet
Met
1.071 / 1.000 1.071 / 1.000 Secondary CustomerSecondary Customer
93.34 kW SecondarySecondary
15
yy

Production / Transmission Allocation Production / Transmission Allocation MethodologiesMethodologies
d k ( )
MethodologiesMethodologies
• Coincident Peak (CP)
• Four Coincident Peak (4CP)• Four Coincident Peak (4CP)
• Average and Excess (A&E)g ( )
• Peak and Average (P&A)
16

Alternative 1Alternative 1C i id t P k D dC i id t P k D dCoincident Peak DemandCoincident Peak Demand
• Allocates demand on basis of each class’ demand at the time of the system peak
• Many variations are possible, i.e.,
– highest month in year (1CP)highest month in year (1CP)
– average of four highest months (4CP )
– maximum four summer month(s)maximum four summer month(s) (Sum 4CP)
17

CP Demand Allocation Factor Used for Production and Transmission Plant
GSGS IndInd
402402
LtgLtg
77
TotalTotalResRes
Coincident Coincident PeakPeak328328
1.07651.0765
402402
1.04611.0461
77
1.07711.0771
2,0412,041
1.07001.0700
1,3041,304
1.07711.0771
(MW) at Meter(MW) at Meter
Loss FactorLoss Factor
353353
16 16%16 16%
420420
19 23%19 23%
77
0 32%0 32%
2,1842,1841,4041,404CP at GenerationCP at Generation
All ti F tAll ti F t 16.16%16.16% 19.23%19.23% 0.32%0.32% 100%100%64.29%64.29%Allocation FactorAllocation Factor
18

Alternative 2Alternative 2F C i id t P k (4CP) D d F C i id t P k (4CP) D d Four Coincident Peak (4CP) Demand Four Coincident Peak (4CP) Demand
• Allocates demand to each class
based on the average of the fourbased on the average of the four
highest months for the system
19

Example:Example:Four Coincident Peak (4CP) DemandFour Coincident Peak (4CP) DemandFour Coincident Peak (4CP) DemandFour Coincident Peak (4CP) DemandMW at Generator Res GS Ind Ltg TotalMW at Generator Res GS Ind Ltg Total
1. Peak Month: October 1 404 353 420 7 2 184
Top Four Peak Months in Yearea o t Octobe 1,404 353 420 7 2,184
2. Peak Month: August 1,380 366 424 7 2,177
3. Peak Month: July 1,364 300 488 7 2,159
4. Peak Month: September 928 444 607 - 1,979
Four Month Average 1,269 365 484 5 2,1234CP Demand Factor 59.78% 17.18% 22.79% 0.25% 100.00%
20

Alternative 3Alternative 3A & E D dA & E D dAverage & Excess DemandAverage & Excess Demand
• Considers maximum demand
(NCP) of each class
• Considers energy use of each class
(l d f t )(load factor)
• Considers system peak loadConsiders system peak load
21

Average & Excess DemandAverage & Excess DemandSystem Peak in Jan = 2,185 MW
Excess Demand =NCP A g Demand
ExcessExcess== 918 MW918 MW NCP – Avg Demand 918 MW918 MW
Average = Average = 1,267 MW1,267 MW
Average Demand =
Energy / 8 760 hrs,,
J F M A M J J A S O N D
Energy / 8,760 hrs
22

Example:Example:Average & Excess DemandAverage & Excess DemandAverage & Excess DemandAverage & Excess DemandMW at Generator Res GS Ind Ltg TotalMW at Generator Res GS Ind Ltg Total
NCP 1,404 583 700 24 2,711Avg Demand (a) 532 230 493 12 1,267Class Excess Demand 872 353 207 12 1,444
System Excess 554 224 131 7 918 (c)System Excess Demand (b) 554 224 131 7 918 (c)
Average & Excess 1,086 454 625 20 2,185
(a) Energy at Generator / 8,760 hours
AED A.F. 49.72% 20.79% 28.59% 0.90% 100.00%
23
( ) gy(b) Allocated on the basis of Class Excess Demand(c) System Excess Demand = 1 CP – Avg Demand = 2,185 – 1,267

Alternative 4Alternative 4P k d A D dP k d A D dPeak and Average DemandPeak and Average Demand
• Allocates average demand on basis of
energy * (System L.F.)gy ( y )
• Allocates peak demand on basis of
l NCP d d * (1 S t L F )class NCP demand * (1-System L.F.)
• No excess demand
• Combines for composite allocation
24

Peak Peak & & Average Average DemandDemandSystem Peak in Jan = 2,185 MW
Peak Demands
Average = Average =
Peak Demands =
Monthly Class NCP MW
Peak Peak = = 2 1852 185 MWMW
1,267 MW1,267 MWAverage Demand =
Energy / 8,760 hrs2,185 2,185 MWMW
J F M A M J J A S O N D
gy
25

Example:Example:Peak Peak & & Average Average DemandDemandPeak Peak & & Average Average DemandDemandMW at Generator Res GS Ind Ltg TotalMW at Generator Res GS Ind Ltg Total
NCP 1,404 583 700 24 2,711
System Annual LF = 58%
NCP
Avg. DemandFactor (a)
,
51.79%
532
41.99%
21.50%
230
18.15%
25.82%
493
38.91%
0.89%
12
0.95%
,
100.00%
1,267
100.00%
(1-LF) * Pk DemandLF * Avg. Demand
21.75%
24.35%
9.03%
10.53%
10.84%
22.57%
0.37%
0.55%
42.00%
58.00%
(a) Energy at Generator / 8,760 hours
Peak & Average A.F. 46.10% 19.56% 33.41% 0.92% 100.00%
g
26
( ) gy

Summary:Summary:Demand Allocation FactorsDemand Allocation FactorsDemand Allocation FactorsDemand Allocation Factors
MW at Generator Res GS Ind Ltg Total
64.29% 16.16% 19.23% 0.32% 100.00%CP Factor 64.29% 16.16% 19.23% 0.32% 100.00%CP Factor
4CP Factor 59.78% 17.18% 22.79% 0.25% 100.00%
A & E Factor 49.72% 20.79% 28.59% 0.90% 100.00%
Peak & Average A.F. 46.10% 19.56% 33.41% 0.92% 100.00%
27
Production Energy at GenerationProduction Energy at Generationgygy
Energy ChargeSeasonalSeasonal––SeasonalSeasonal
––TimeTime--ofof--DayDay
28

Energy Loss FactorsGeneration / MeterEnergy Available
100.00 kWh GenerationGeneration
T i i /T i i /1.019 / 1.0001.019 / 1.000Trans/Sub CustomerTrans/Sub Customer
Transmission /Transmission /SubtransmissionSubtransmission98.11 kWh
ters
ters
1.043 / 1.000 1.043 / 1.000 Primary CustomerPrimary Customer
95.88 kWh PrimaryPrimaryMet
Met
1.071 / 1.000 1.071 / 1.000 Secondary CustomerSecondary Customer
93.34 kWh SecondarySecondary
29
yy

Energy AllocationsS l C V i iSeasonal Cost Variation
Summer Months
Peak (6.0¢)Peak (6.0¢)
Cycling (3.5¢)Cycling (3.5¢)
Base (2 5¢)Base (2 5¢)
J J FF M M A A M M J J J J A A SS O O N N D D
Base (2.5¢)Base (2.5¢)
30

Energy AllocationsOff-Peak Energy Cost
Peak BaseBaseCycle Cycle
90%90%10%10%
Cyclingyy
Peak Peak TotalTotal
0%0%100%100%
BaseTotal Cost = 3.3¢/kW
Off‐Peak Hours1 2 3 4 5 6 19 20 21 22 23 24
On-Peak Energy CostBaseBaseCycleCyclePeakPeak
50%50%30%30%20%20%
Peak
C li PeakPeakTotalTotal
20%20%100%100%
Cycling
Total Cost = Base 4.1¢/kW
7 8 9 10 11 12 13 14 15 16 17 18
On‐Peak Hours 31

Example:Example:Annual Energy Allocation FactorsAnnual Energy Allocation Factors
ResRes GSGS IndInd LtgLtg
MWh SalesMWh Sales 4,350,0004,350,000 1,880,0001,880,000 4,170,0004,170,000 100,000100,000
Loss FactorLoss Factor 1.07141.0714 1.07021.0702 1.03601.0360 1.07271.0727
MWh MWh Gen.Gen. 4,660,6134,660,613 2,011,9782,011,978 4,320,1354,320,135 107,274107,274
Energy A.FEnergy A.F.. 41.99%41.99% 18.13%18.13% 38.92%38.92% 0.97%0.97%
32

Example:Example:“TOU” Energy Allocation FactorsTOU Energy Allocation Factors
ResRes GSGS IndInd LtgLtg
OnOn--Pk MWh*Pk MWh*1,508,9841,508,984 2,160,0682,160,068 21,45521,4553,728,4903,728,490
OnOn Pk MWhPk MWh
OffOff--Pk MWh*Pk MWh*
Generation
G ti
OnOn--Pk A.FPk A.F 50.26%50.26% 20.34%20.34% 29.12%29.12% 0.29%0.29%
932,123932,123 502,995502,995 2,160,0682,160,068 85,81985,819Generation
OffOff--Pk A.FPk A.F.. 25.32%25.32% 13.66%13.66% 58.68%58.68% 2.33%2.33%
*MWH@ Generator
33
*MWH @ Generator

Annual Production Capacity and Energy Costs by Rate Class under Various Allocation MethodsRate Class under Various Allocation Methods
$125.75
$250$140
CP D d
s $93.10
$107.63 $200
$100
$120 CP DemandA & E DemandPeak & Average 4CP DemandEnergy
Cap
acity
Cos
ts
nerg
y C
osts
$72.38 $72.38 $72.38
$55.98
$87.60
$67.31
$76.95
$85.78
$150
$60
$80
$/M
WhS
($KW)
nergy
C En
$55.98$51.92
$50
$100
$40
$60
$0$0
$20
RES GS INDRES GS IND
34

Capacity Costs / PricesCapacity Costs / PricesR C t / M k t L dR C t / M k t L dResource Costs / Market LoadsResource Costs / Market Loads
Capacity Energy*
I. Utility Resource
C bi d C l $12 65 $25 31
Capacity Energy $/kW $/MWh
Combined Cycle
Combustion Turbine
$12.65
$9.80
$25.31
$46.55
II. Market Price
PJM / MISOSingle price needed
for peak loadfor peak load
*Gas $3 50 / Dth and variable O&M at $15 20 (CT) and $6 55 (CC) per MWh
35
Gas $3.50 / Dth and variable O&M at $15.20 (CT) and $6.55 (CC) per MWh

NN i id t d di id t d d•• NonNon--coincident demandcoincident demand
•• Equipment needed for deliveryEquipment needed for delivery•• Equipment needed for deliveryEquipment needed for delivery
voltagevoltage
–– Subtransmission voltageSubtransmission voltage
–– Primary voltagePrimary voltagePrimary voltagePrimary voltage
–– Secondary voltageSecondary voltage
36

Illustrative Example of Coincident vs.Illustrative Example of Coincident vs.NonNon Coincident DemandsCoincident DemandsNonNon--Coincident DemandsCoincident Demands
System PeakSystem Peak
NCPCP
man
d NCPCP
CP
NCP
Dem
RESRESCP
GSGS
INDINDNCP CP
CP
37TimeLTGLTG

Distribution Classification
•Minimum Distribution System /yZero Intercept
C t i d t t t– Costs incurred to connect customerto system unrelated to demand orusageusage
•Demand Costs – Non-Load
38

Distribution SystemDemand Available
100.00 kW GenerationGeneration
Transmission /Transmission /SubtransmissionSubtransmission98.11 kW
ters
ters
95.88 kW PrimaryPrimaryMet
Met
93.34 kW SecondarySecondary
39
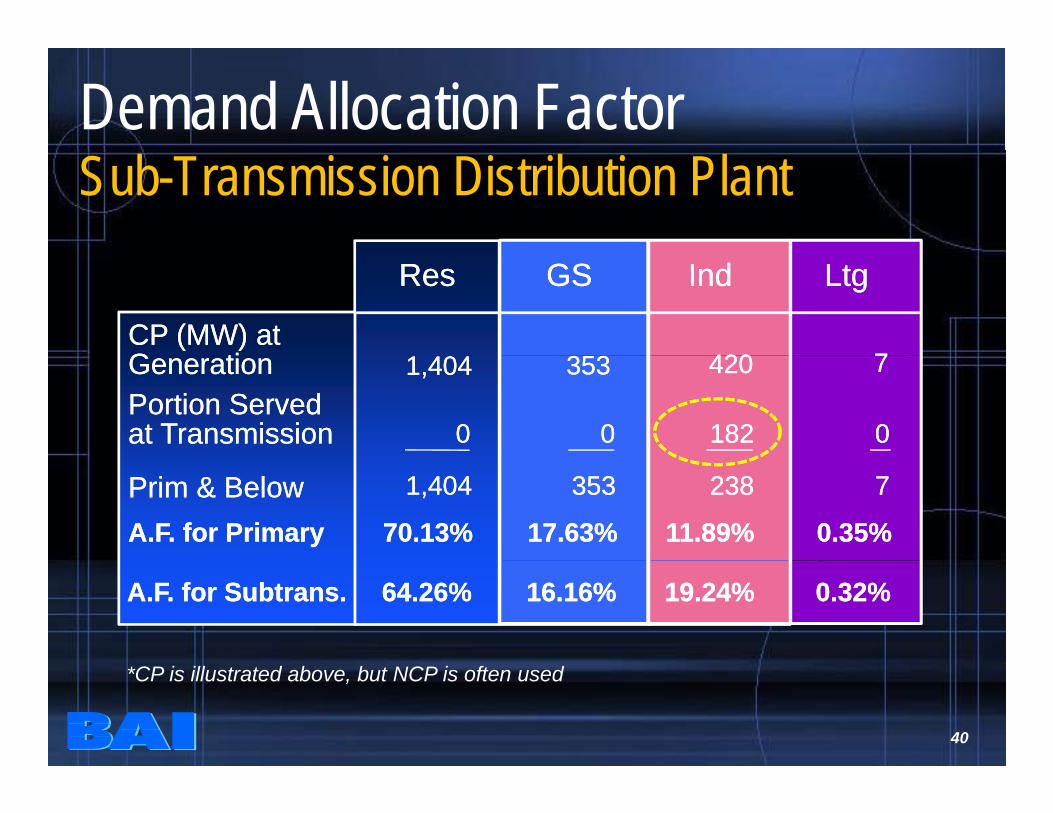
Demand Allocation FactorSub-Transmission Distribution Plant
CP (MW) atCP (MW) atG tiG ti 3 33 3 420420 77
ResRes GSGS IndInd LtgLtg
GenerationGeneration 1,4041,404
Portion Portion ServedServedat Transmissionat Transmission 00
353353
00
420420
182182
77
00
Prim & BelowPrim & Below 1,4041,404
A.F. for PrimaryA.F. for Primary 70.13%70.13%
353353
17.63%17.63%
238238
11.89%11.89%
77
0.35%0.35%
A.F. for Subtrans.A.F. for Subtrans. 64.26%64.26% 16.16%16.16% 19.24%19.24% 0.32%0.32%
40
*CP is illustrated above, but NCP is often used

Demand Allocation FactorSecondary Distribution Plant
ResRes GSGS IndInd LtgLtg
NCPNCP DemandDemandNCP NCP DemandDemand
Secondary Secondary
(MW)(MW) 1,3041,304 526526 121121 2323
NCP NCP A.F.A.F. 66.06%66.06% 26.65%26.65% 6.13%6.13% 1.17%1.17%
41
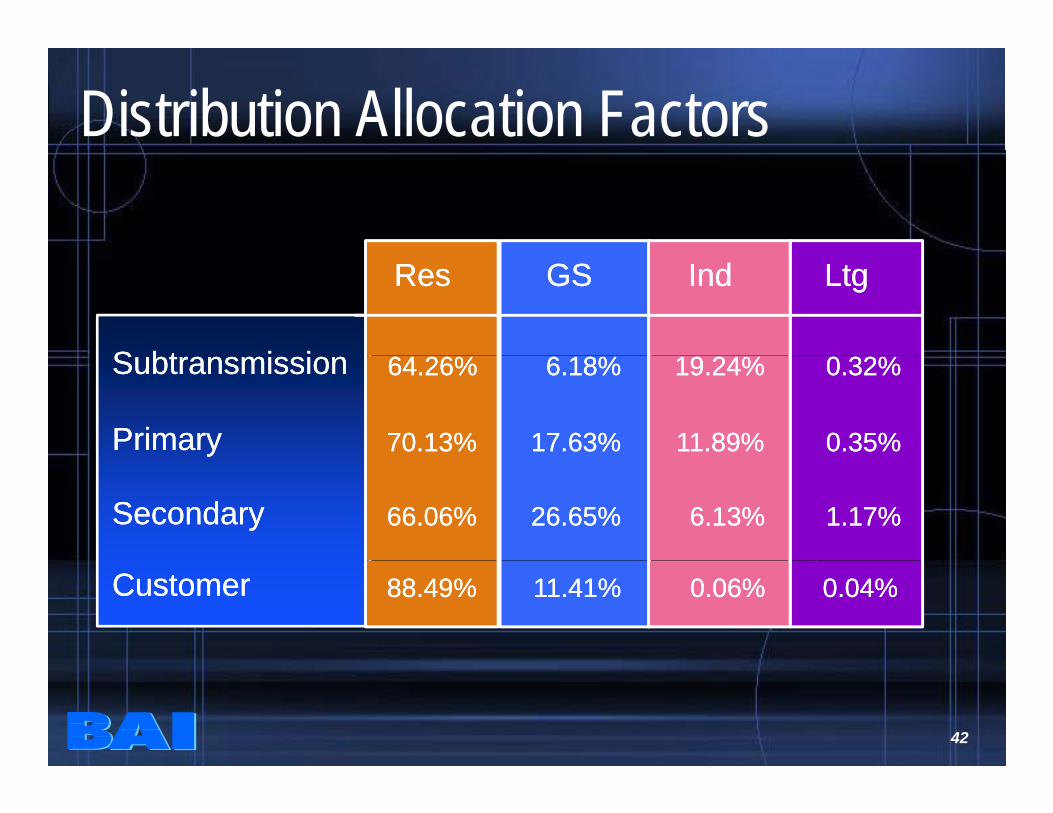
Distribution Allocation Factors
ResRes GSGS IndInd LtgLtg
S bt i iS bt i iSubtransmissionSubtransmission
PrimaryPrimary 70.13%70.13% 17.63%17.63% 11.89%11.89% 0.35%0.35%
64.26%64.26% 6.18%6.18% 19.24%19.24% 0.32%0.32%
SecondarySecondary 66.06%66.06% 26.65%26.65% 6.13%6.13% 1.17%1.17%
CustomerCustomer 88.49%88.49% 11.41%11.41% 0.06%0.06% 0.04%0.04%
42
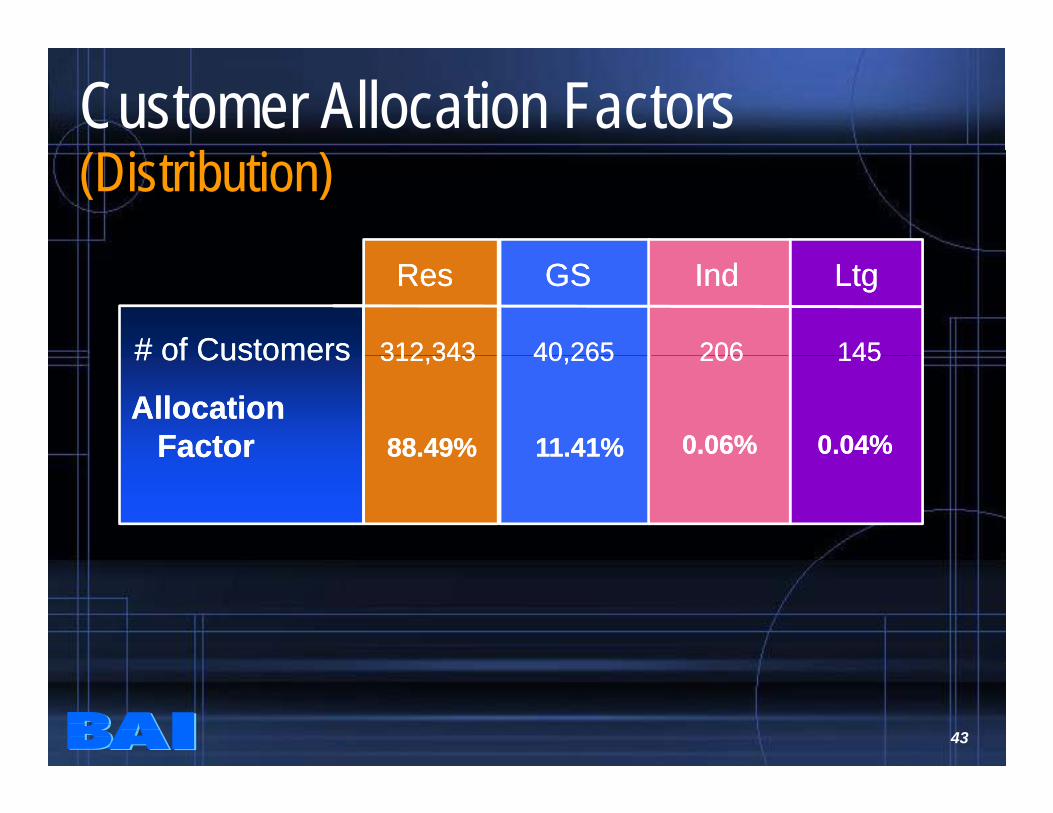
Customer Allocation Factors(Distribution)
# of Customers# of Customers
ResRes GSGS IndInd LtgLtg
312 343312 343 40 26540 265 206206 145145# of Customers# of Customers 312,343312,343 40,26540,265 206206 145145
AllocationAllocationFactorFactor 88.49%88.49% 11.41%11.41% 0.06%0.06% 0.04%0.04%
43

Weighted Customer Allocation FactorsMeters/Services
Cost of MeterCost of Meter
ResRes GSGS IndInd LtgLtg
$180$180 $185$185 $69 030$69 030 $180$180Cost of MeterCost of Meter
Relative to Relative to
ResidentialResidential
$180$180 $185$185 $69,030$69,030 $180$180
$180$180 $180$180 $180$180 $180$180ResidentialResidential
WeightWeight 1.0001.000 1.0281.028 383.5383.5 1.0001.000
$180$180 $180$180 $180$180 $180$180
44
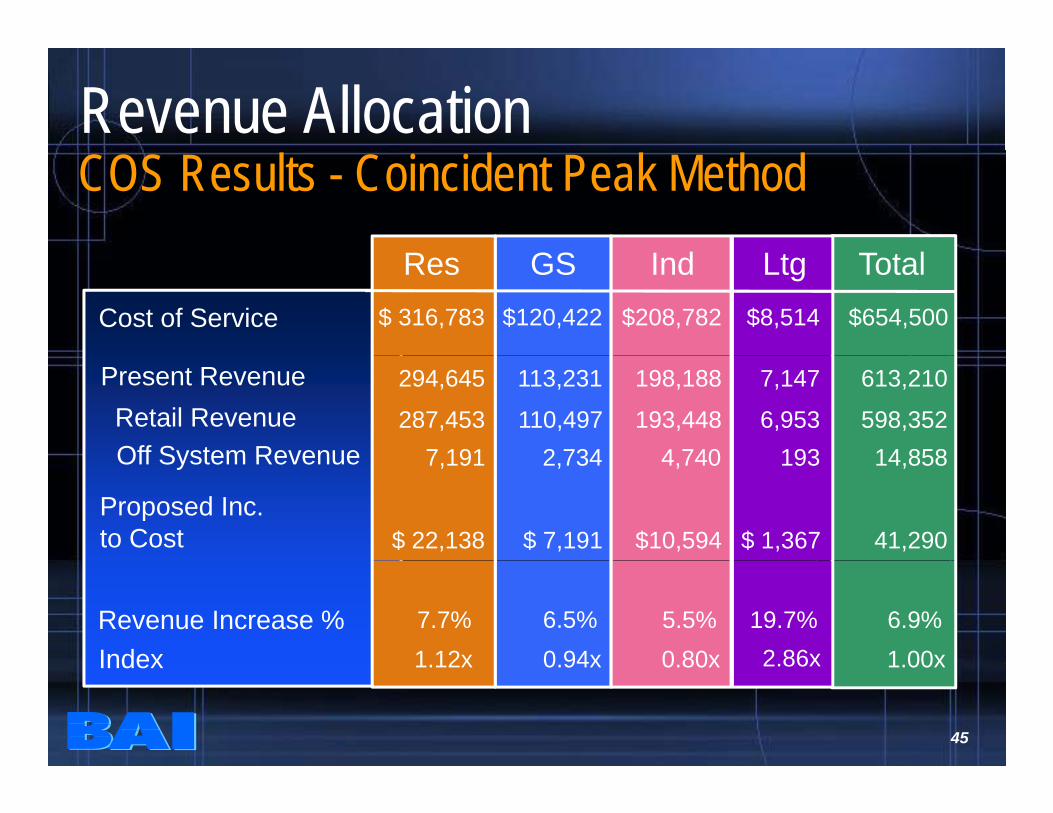
Revenue Allocation
R GS I d Lt T t l
COS Results - Coincident Peak MethodRes GS Ind Ltg Total
Cost of Service $654,500$208,782 $8,514$ 316,783 $120,422
Retail Revenue
Off System Revenue
598,352
14 858
Present Revenue 613,210
193,448
4 740
198,188
6,953
193
7,147
287,453
7 191
294,645
110,497
2 734
113,231
Off System Revenue
Proposed Inc.
to Cost
14,8584,740
$10,594
193
$ 1,367
7,191
$ 22,138 41,290
2,734
$ 7,191
Revenue Increase % 6.9%5.5% 19.7%7.7% 6.5%
Index 1 12x 0 94x 0 80x 2 86x 1 00x
45
Index 1.12x 0.94x 0.80x 2.86x 1.00x

Revenue Allocation
R GS I d Lt T t l
COS Results SummaryRes GS Ind Ltg Total
Coin. Peak Method6 9%6 9%5 5%5 5% 19 7%19 7%7 7%7 7% 6 5%6 5%R I % 6.9%6.9%5.5%5.5% 19.7%19.7%7.7%7.7% 6.5%6.5%Revenue Increase %
Index 1.12x 0.94x 0.80x 2.86x 1.00x
Avg. & Excess Methodg6.9%6.9%7.6%7.6% 19.2%19.2%6.4%6.4% 5.7%5.7%Revenue Increase %
Index 0.93x 0.83x 1.10x 2.78x 1.00x
Avg. & Peak Method6.9%6.9%8.5%8.5% 19.7%19.7%5.7%5.7% 6.4%6.4%Revenue Increase %
Index 0.83x 0.93x 1.23x 2.85x 1.00x
46

R t D iR t D iRate DesignRate Design INDUSTRIAL
47

Rate Design –Sub-Trans Primary Secondary
I. FUNCTIONAL COSTSProduction / Transmission
Capacity $200 $100 $50E $180 $95 $48
Industrial Energy $180 $95 $48
Distribution Subtransmission $50 $20 $10 Primary $20 $15Secondary $5 Secondary $5
II. COSTSTotal Prod/Trans Costs
Capacity $200 $100 $50 Energy $180 $95 $48gy
Total Distribution Costs $50 $40 $30
III. BILLING UNITSCP Demand 40.0 19.4 9.4Non-CP Demand 45.0 29.6 17.1Metered kWh 7.2 3.7 1.8
IV. CAPACITY RATESProd/Trans Demand ($/kW) $5.00 $5.15 $5.32
48
Distribution Demand ($/kW) $1.11 $1.35 $1.75
Energy Rate ($/MWh) $25.00 $25.68 $26.09

49
Section 3 Click to jump back to Table of Contents

1
Tax Relief and the Regulatory Impact
Society of Depreciation Professionals
September 19, 2016
Agenda
Tax terminology
Income taxes on the income statement
Recent trends in tax legislation
Bonus depreciation Tangible property regulations Tax repairs
Five-year growth in deferred tax liability balances
Impact of deferred income taxes on rate regulated business
2

2
Tax Terms: Permanent Differences
3
US GAAP does not define the term permanent difference
APB 11 (superseded by FAS 109 and ASC 740) definedpermanent differences as:
Differences between taxable income and pretax accounting (book) income arising from transactions that, under applicable tax laws and regulations, will not be offset by corresponding differences or “turn around” in other periods
In layperson’s terms, a permanent difference is an item thatappears on the income statement or the tax return, but not onboth
Example: Lobbying costs are “deducted” in GAAP, not for taxes ESOP dividends have no “deduction” in GAAP, but do for taxes
Tax Terms: Temporary Differences
Temporary differences that will result in taxable amounts in futureyears when the related asset or liability is recovered or settled arereferred to as taxable temporary differences
The future tax effect of a taxable temporary difference is recordedon the balance sheet as a deferred tax liability
Example: Depreciation on plant assets
4

3
Tax Terms: Temporary Differences continued… Temporary differences that will result in deductible amounts in
future years are referred to as deductible temporary differences
The future tax effect of a deductible temporary difference isrecorded on the balance sheet as a deferred tax asset
Example:
Accrued pension costs that are tax deductible when paid
5
Income Taxes on the Income Statement
6
Record deferred income taxes for temporary differencesbetween GAAP and tax
No deferred income taxes for permanent differences betweenGAAP and tax
Permanent differences impact the Company’s effective tax rate
Temporary differences have NO IMPACT on effective tax rate

4
Income Taxes on the Income Statement
Matching concept in accounting
Temporary differences between financial statements and tax returns should be accounted for as deferred income taxes
7
Because of higher temporary differences in recent years, CEI has paid minimal federal income taxes since 2009.
Income Taxes on the Income StatementExample
8
GAAP TaxPre-Tax Income 9,000$ 9,000$
Permanent Differences Lobbying Costs 1,000 1,000
Temporary Differences Depreciation (5,000) Pension Accrual 1,000
Taxable Income 10,000$ 6,000$ Tax Rate 40% 40%
Current Tax Expense 2,400 Deferred Tax Expense 1,600 Total Tax Expense 4,000$ 4,000$
Effective Tax Rate
Tax Expense 4,000$ Pre-Tax Income 9,000$
= 44%
Deferred Income Tax Expense
increases Cost of Service
The Deferred Tax Liability reduces
Rate Base

5
Tax legislation: Bonus Depreciation
• Recent trends in extenders
• 2016 – 2019 Phase-Out
– 2016 = 50%
– 2017 = 50%
– 2018 = 40%
– 2019 = 30%
– 2020 = Bonus %’s expire…
• Or do they?
9
Impacts of Bonus Depreciation
• Pros
– Cash Tax Savings
– Lowers requirements to seek external funding for strategicinvestments
• Cons
– Carrying Charges (vs. borrowing rates)
– Renewable Tax Credits (Realization/Monetization)
10

6
Tangible Property Regulations
• Reg. Sec. 1.162-3: Materials and Supplies
• Reg. Sec. 1.263(a)-1: Capital Expenditures in general
• Reg. Sec. 1.263(a)-2: Amounts paid to acquire or producetangible property
• Reg. Sec. 1.263(a)-3: Amounts paid to improve tangibleproperty
• Reg. Sec. 1.168(i)-7: Accounting for MACRS property
• Reg. Sec. 1.168(i)-8: Dispositions of MACRS property
11
Tangible Property Regulations
• Rev. Proc. 2014-16
− Materials and supplies
− Acquisition costs
− Improvements/repairs
• Rev. Proc. 2014-54
− Disposition of MACRS assets
12
In addition, the following revenue procedures provide implementation guidance for taxpayers:

7
Tangible Property Regulations Effective Dates
• Mandatory for tax years beginning on or after1/1/2014
• Accounting Method Changes (Form 3115) will berequired
− Changes are automatic changes
13
Tangible Property –Materials and Supplies• Definition of Materials and Supplies
(Reg. Sec. 1.162-3)− A unit of property < $200, or
− A unit of property used or consumed in 12 months orless, or
− Replacement parts, tools, or other items acquired to maintain or improve tangible property, or
− Fuel, lubricants, water and similar items consumed in 12 months or less, or
− Identified as materials and supplies in other IRS guidance
14

8
Materials and Supplies Types and Timing of Deductions• Incidentals (no record of consumption or physical
inventory) are deducted when acquired (Reg. Sec. 1.162-3(a)(1) and (2))
• Non-incidentals (including emergency spare parts) are deducted when consumed (Reg. Sec. 1.162-3(a)(1))
• Rotable spare parts and temporary spare parts are deducted when disposed (Reg. Sec. 1.162-3(a)(3))
• Taxpayer may elect to capitalize and depreciate rotable and temporary spare parts (Reg. Sec. 1.162-3(d)(3))
15
Materials and Supplies Types and Timing of Deductions
• Con Edison elected to depreciate these parts
• Form 3115 not required
• Con Edison is deducting non-incidental materials and supplies as they are removed from inventory
• Company filed accounting method change to deduct non-incidental parts when removed from inventory and consumed in a project
• Tax deduction for 2014 was approximately $100 million
16

9
De Minimis Safe HarborReg. Sec. 1.263(a)(1)(f)
• Annual election to follow book expense policy
− No more than $5,000 per invoice or item
− Written book policy must be in place at beginning of2014
− Con Edison did not elect to adopt safe harbor
− Book policy is to capitalize all materials and suppliesassigned to capital projects
17
Costs incurred to facilitate acquisitions of real or personal property-Reg. Sec. 1.263(a)-2(f)(2)(ii)• Inherently facilitative costs must be capitalized
a) Transporting the property (for example, shipping fees and movingcosts);
b) Securing an appraisal or determining the value or price of property;
c) Negotiating the terms or structure of the acquisition and obtainingtax advice on the acquisition;
d) Application fees, bidding costs, or similar expenses;
e) Preparing and reviewing the documents that effectuate theacquisition of the property (for example, preparing the bid, offer,sales contract, or purchase agreement);
f) Examining and evaluating the title of property;18

10
Costs incurred to facilitate acquisitions of real or personal property-Reg. Sec. 1.263(a)-2(f)(2)(ii)• Inherently facilitative costs must be capitalized (cont’d)
g) Obtaining regulatory approval of the acquisition or securing permitsrelated to the acquisition, including application fees;
h) Conveying property between the parties, including sales andtransfer taxes, and title registration costs;
i) Finders’ fees or broker’s commissions, including contingency fees(defined in paragraph (f)(3)(iii) of this section);
j) Architectural, geological, survey, engineering, environmental, orinspection services pertaining to particular properties; or
k) Services provided by a qualified intermediary or other facilitator ofan exchange under section 1031
19
Costs incurred to facilitate acquisitions of real or personal property-Reg. Sec. 1.263(a)-2(f)(2)(ii)
• Employee compensation and overhead costs aretreated as non-facilitative costs
− Some costs are capitalized as mixed service costs
− Investigatory costs for real estate are tax deductible
• Con Edison currently compliant with this regulation
20

11
Tangible property – improvementsReg. Sec. 1.263(a)-3• Most capitalize amounts paid to improve a unit of property
− Results in a betterment to the unit of property Corrects a pre-existing material condition or defect Results in a material addition Results in a material increase in capacity, strength, quality or output 23 examples in Reg. Sec. 1.263(a)-3(j)(3)
− Restores a unit of property Replaces a component for which a loss is claimed Repairs damage related to claimed casualty loss Replaces component for which tax basis adjusted in gain or loss
transaction Repairs unit of property to ordinarily efficient operating condition Rebuilds unit of property to “like new” condition at the end of its class life Replaces major component or substantial structural part of a unit of
property 31 examples in Reg. Sec. 1.263(a)-3(k)(7) 21
Tangible property – improvementsReg. Sec. 1.263(a)-3• Most capitalize amounts paid to improve a unit of property (cont’d)
− Adopts a unit of property to a new or different use New use inconsistent with intended use when originally placed in
service 7 examples in Reg. Sec. 1.263(a)-3(l)(3)
• What is a unit of property? - Reg. Sec. 1.263(a)- 3(e)(3)(i)− General rule: All components of property that are functionally
interdependent comprise a single unit of property
− Functional interdependence means the placing in service of onecomponent is dependent on the placing in service of another component
• Unit of property for network assets – Reg. Sec. 1.263(a)-3e(3)(iii)− Refers taxpayer to other guidance− Con Edison follows Rev. Proc. 2011-43 22

12
Tangible property – improvementsReg. Sec. 1.263(a)-3• Improvements to buildings and structural components. Reg. Sec.
1.263(a)- 3(e)(2)− Each of the following structural components of a building is separate from
the building structure, and the improvement rules must be applied separately to each component
• Con Edison filed a Form 3115 to elect application of this Reg. − No Sec. 481 adjustment was required 23
HVACMotors, compressors, boilers, chillers, pipes,
ducts
PlumbingPipes, drains, sinks,
bathtubs, toilets, water/sewer equipment
ElectricalWiring, outlets, junction boxes, lighting fixtures
Fire Protection/Alarm
Sprinklers, computer controls, fire
doors/escapes
SecurityDoor locks, security cameras, security
lighting, alarm system
ElevatorAll building elevators
GasPipes and equipment used to distribute gas
EscalatorAll building escalators
OtherRoof, walls, foundation,
windows, doors
Reg. Sec. 1.263(a)- 3(e)(2)(B)
Tangible property – repairs safe harborsReg. Sec. 1.263(a)-3(i)(l)(i) and (ii)• Routine maintenance safe harbor for plant assets -
Reg. Sec. 1.263(a)- 3(i)(l)(i) and (ii)
− Routine maintenance expenses are deductible if taxpayer can reasonably expect to perform the activity more than once during property’s class life
− Must incur cost to keep asset in its ordinary and efficient operating condition as a result of taxpayer’s use
− Routine maintenance does not apply if expense constitutes a betterment to a unit of property
− Routine maintenance does not apply to most restorations where the taxpayer reported a gain or loss on the sale or exchange of a component part
− Routine maintenance does not apply where the taxpayer claims a casualty loss on a component part
24

13
Tangible property – repairs safe harborsReg. Sec. 1.263(a)-3(i)(l)(i) and (ii)
•Routine maintenance safe harbor for buildings− Same rule as mentioned above except that taxpayer
must reasonably expect to perform the activity more than once during a 10 year period beginning on the date the building is placed in service
•Con Edison filed an accounting method change toadopt routine maintenance rules− No Sec. 481 adjustment was required
25
Tangible property regulations –depreciation and dispositionsReg. Sec. 1.168(i)-8• General Asset Accounts (GAA)
− Establish GAAs with assets of similar depreciation methods,recovery periods, conventions
Depreciated as one asset
No loss recognized upon the disposition of one asset in the accounts
Amounts realized on disposition are recognized as ordinary income
• Con Edison not electing GAA
• Dispositions (not in GAA)− Generally, dispositions do not include partial dispositions (e.g.
structural components of a building)
− May not claim both a repair and a loss on disposition on same asset
26

14
Tangible property regulations –depreciation and dispositionsReg. Sec. 1.168(i)-8
• Dispositions (put in GAA) (cont’d)− For electric transmission and distribution assets, Con Edison claims
repair deductions
− For repaired assets, Con Edison adds back to taxable income bookretirement costs
− Optional election to recognize partial dispositions
For buildings, gas, and steam assets, Con Edison will make partialdisposition gain or loss election
Will capitalize improvements and report gain or loss on retiredcomponent
27
Con Edison 2014 Action Steps needed to comply with Tangible Property Regs.1. Calculate and claim tax deprecation on rotable spare
parts
2. File Form 3115 to change accounting method to deductnon-incidental parts acquired in 2014
− No Sec. 481(a) adjustment required
3. File Form 3115 to adopt units of property for buildingsand structural components
− No Sec. 481(a) adjustment required
4. File Form 3115 to adopt routine maintenance safe harborfor plant assets and for buildings
5. File an annual election to recognize partial dispositionson components of buildings and structural components
28

15
Tax Repairs: Regulations Timeline
• In 2004, Treasury opened a reg project
– Proposed regs 2006
– Re-proposed regs 2008
– Temporary regs 2011
– Final regs 2013
• Effective 2014 (optional early adopt)
– Critical to regs to CEI
• 2011-43 (Electric T&D)
• 2013-24 (Generation)
Tax Repairs: Points of consideration
• UOP
• Establishing thresholds
• Historical books and records and the 481(a)
• FIN 48
• Rate Base

16
Tax Repairs: Network Assets and Industry Guidance
“In the case of network assets, the unit of property isdetermined by the taxpayer’s particular facts andcircumstances except as otherwise provided in publishedguidance. For these purposes, the functionalinterdependence standard is not determinative.”
Tax Repairs: Electric T&D
• Rev. Proc. 2011-43
– August 19, 2011
• Elective safe harbor
• Defined UOPs
– Linear
– Non-linear
• Thresholds
– 10%
– Aggregation rules

17
Tax Repairs: Generation
• Rev. Proc. 2013-24
– April 30, 2013
• Defined UOPs
• Defined major components
– Did not address portion of a major component
• Automatic change
• Permits extrapolation
Tax Repairs: Gas T&D
• UOPs
– Transmission
• Hydraulic subsystem (pipe between compressors)
• Same pressure
– Distribution
• None – simplified procedure
– Non-linear
• Detailed listing
• Major components
• Threshold
– Transmission – 10%
– Distribution - 4 miles

18
Tax Repairs: Gas T&D
• Per se capital
– Customer Expansion
– System Expansion
– Add cathodic protection where none existed
• Aggregation
– Same hydraulic subsystem (T) or zip code (D)
– Document (PUC order or project authorization)
• Identifies UOPs or locations for replacements
• Identifies total cost or amount of pipe and
• Describes replacements w/in 5 years
Five-Year Growth:CEI Accumulated Deferred Tax Summary2009 vs. 2014
36
Dec. 31, 2009 Dec. 31, 2014 Increase
(millions) (millions) (millions)
Accumulated deferred income tax liability $ 4,239 $ 6,676 $ 2,437
Deferred tax liability future income tax 1,317 2,275 958
Accumulated deferred Investment Tax Credits 66 125 59
Total deferred tax liability per Form 10‐K $ 5,622 $ 9,076 $ 3,454
Five‐year increase 61%
Major contributors to the increase is primarily plant-related:• Accelerated tax depreciation (method and life)• Bonus depreciation• Repairs

19
Impact of Deferred Income Taxes on Rate Regulated Business Deferred income taxes decreased the revenue requirement in the
latest rate cases as follows:
37
CECONY* O&R***2015 2016 2016
Rate Base Amounts per Rate Orders Electric Gas Steam Electric** Gas Steam Electric Gas(millions)Net utility plant $ 20,659 $ 4,754 $1,861 $ 21,692 $ 5,155 $ 1,901 $ 957 $ 498 Working capital 816 93 91 890 97 95 46 22Regulatory assets and liabilities 202 47 (34) (90) 61 (18) (32) (22)Accumulated deferred income taxes (3,564) (1,031) (371) (4,211) (1,077) (374) (208) (132)
Total Rate Base $ 18,113 $ 3,863 $1,547 $ 18,281 $ 4,236 $ 1,604 $ 763 $ 366
Pre-tax rate of return 9.98% 10.06% 10.06% 9.70% 10.14% 10.14% 9.89% 9.89%
Accumulated deferred income taxes reduced rate base by: $ (3,564) $ (1,031) $ (371) $ (4,211) $ (1,077) $ (374) $(208) $(132)
Decrease in revenue requirement $ (355) $ (103) $ (37) $ (408) $ (109) $ (38) $ (20) $ (13)
* Per Joint Proposal for cases 13-E-0030, 13-G-0031, and 13-S-0032** Per one-year extension Joint Proposal
*** Per Joint Proposal for cases 14-E-0493 and 14-G-0494

Section 4 Click to jump back to Table of Contents

9/16/2016
1
Cost Segregation Studies, Updates on the Tangible Property Regulations,
Depreciation, & The PATH Act
© MS Consultants, LLC 2016
Cost Segregation Studies & Tangible Property Regulations
David A. FabianDirector, MS Consultants LLC
Office: 716‐633‐9840Cell : 716‐573‐9378Fax : 716‐633‐9469
© MS Consultants, LLC 2016

9/16/2016
2
David A. Fabian• 25+ years’ tax and accounting experience
• Joined MS Consultants in 1999
• Personally involved in over 7,500 Cost Segregation projects in more than 30 states
• Presented on a variety of topics including depreciation & cost segregation, energy modeling, tangible property regs, & more
• Developed comprehensive in-house training and quality control programs
© MS Consultants, LLC 2016
Ashley SullivanManager, MS Consultants LLC
Office: 757‐821‐3020Cell : 757‐705‐6264Fax : 716‐250‐6605
© MS Consultants, LLC 2016

9/16/2016
3
Ashley Sullivan• Over 12 years Cost Segregation experience
• Joined MS Consultants in 2013
• Heads up our Virginia office
• Senior Cost Segregation Professional designation with ASCSP
• Travels extensively nationwide to meet with clients and discuss opportunities
• Quality Control Manager for Cost Segregation Studies
© MS Consultants, LLC 2016
MS Consultants, LLC• We have completed over 12,000 studies nationwide.
• We’re made up of tax, construction, and engineering professionals.
• Years of experience:– Cost Segregation Studies since 1996– §179D certifications since 2006– §45L certification since 2008– Tangible Property Regulation analyses since 2008
© MS Consultants, LLC 2016

9/16/2016
4
What is a Cost Segregation Study?
• IRS approved method to acceleratedepreciation of specific assets
• Allocates a portion of “39 and 27.5 year”property into 5, 7, and 15 year property
• IRS Tax codes §1245 and §1250
Why perform a Cost Segregation Study?
• Taxpayers under‐depreciate their assets, because…
• Rules are very complex• Properly segregating a property is a complex
process, requiring the right combination of know‐how:o Tax expertise and familiarity with prior tax litigationo Engineering and construction knowledge

9/16/2016
5
Cost Segregation Example
Client purchases a building for $5,000,000 in 2013, and has taken depreciation over 39 years.
Example: Medium-Size Office Building

9/16/2016
6
Example:Office Building - Acquisition
100,000500,000750,000
3,650,000
$325,950 $763,369 $437,419$258,710
$258,710
$366,266
$5,000,000
Example:Office Building – New Construction
100,000500,000750,000
3,650,000
$325,950 $1,175,656 $849,706$426,381
$426,381
$446,653
$5,000,000

9/16/2016
7
Real Property: 27.5 or 39 Year(Structural Components)
• HVAC units • Ceramic tile floors• Exterior doors• Windows• Interior plumbing• Siding• Concrete flatwork & foundations• Roof
HVAC Units
Ceramic Tile
Siding
Concrete flatwork& foundations
Exterior Doors & Windows
Roofs
Interior Plumbing
Where does the money come from?

9/16/2016
8
15-year Property(Land Improvements)
• Removable site improvements• Certain Site utilities & drainage• Fencing & gates• Paving & Striping• Landscaping• & More
Where does the money come from?
Paving
Sidewalks, Stepsand Curbing
Retaining Walls
Site Lighting
Trees, Landscapingand Irrigation
Grid Striping andPavement Symbols
Flagpoles
Benches and otherOutdoor equipment
15-year PropertyLand Improvements
& More

9/16/2016
9
Other 5- & 7-year Property(Personal Property)
• Specialty plumbing & electric• Decorative wall coverings• Carpet and other removable flooring• Decorative lighting• Trim, cabinetry & millwork• Window treatments• & More
Where does the money come from?
Decorative Trim
Decorative andaccent lighting
Window Treatments
Decorative wood panels, wallpaperAnd other wallcoverings
Specialty electricand plumbing
Carpet andremovable flooring
5-year Property–Personal Property
& Much, Much More
9/16/2016
10
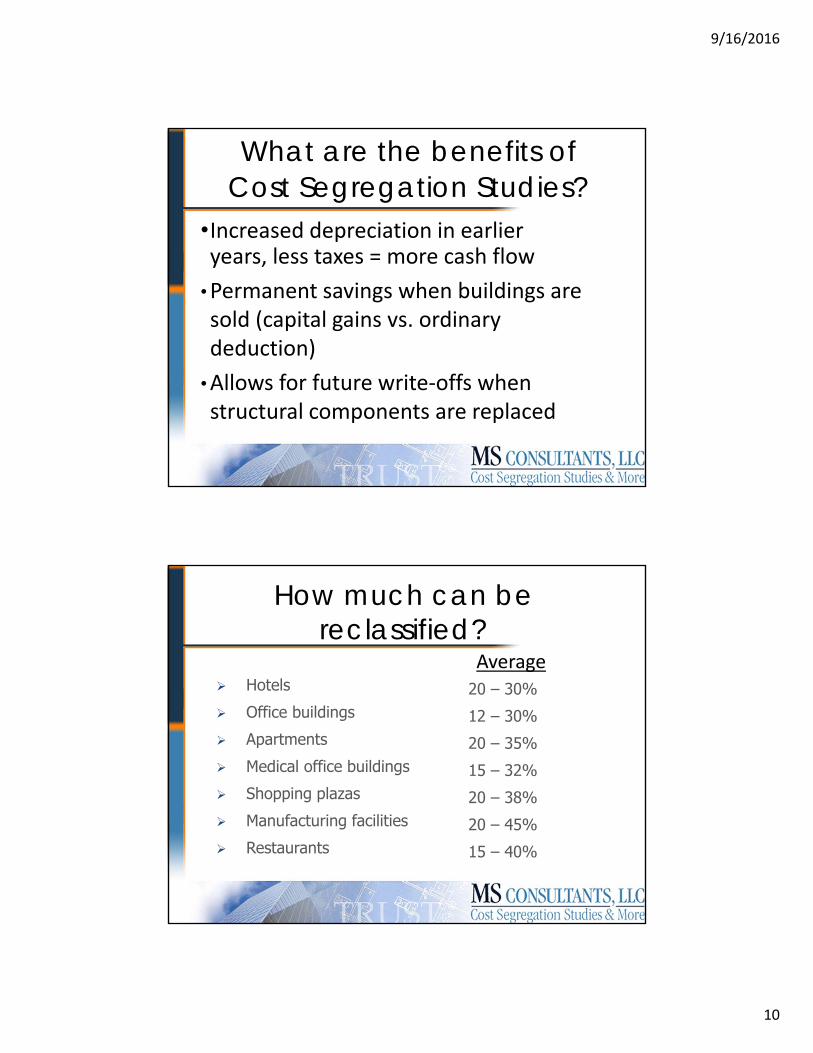
What are the benefits of Cost Segregation Studies?
•Increased depreciation in earlieryears, less taxes = more cash flow
•Permanent savings when buildings aresold (capital gains vs. ordinarydeduction)
•Allows for future write‐offs whenstructural components are replaced
How much can be reclassified?
Average Hotels Office buildings Apartments Medical office buildings Shopping plazas Manufacturing facilities Restaurants
20 – 30%12 – 30%20 – 35%15 – 32%20 – 38%20 – 45%15 – 40%

9/16/2016
11
What buildings are eligible?
• New buildings under construction• Existing buildings undergoing renovations
and/or additions• Purchases of existing properties• Buildings purchased or constructed since
1987• Inherited buildings
Types of Cost Segregation Studies Performed
Airport Hangars Apartment Buildings Automobile Dealerships Automobile Service
Centers Banks Casual & Fine Dining
Restaurants Daycare Centers Department Stores Distribution Centers
Fast Food (QuickService) Restaurants
Fitness Centers Flex Industrial Gas Stations Golf Resorts Grocery Stores Healthcare Centers High Rise Buildings Hospitals Hotels
Laboratory Facilities Manufacturing &
Processing Facilities Marinas Nursing Homes Office Buildings Retail Plazas Senior Assisted
Living Facilities Truck Terminals Warehouses ALL BUILDINGS

9/16/2016
12
Updates on TPRs, Depreciation, & PATH Act
MS Consultants, LLC
Updates – Top 10• TPR Today• Form 3115 Changes• De Minimis• Bonus Depreciation• 15 year Qs• QIP• Section 179 & 179 on Real Estate• Repairs & Dispositions• Recent Rev Procs• Section 179D / 45L

9/16/2016
13
TPR - Updates
• Taxpayers willing to pay for services• Many taxpayers took advantage of opportunities for large tax savings
• But some taxpayers and practitioners ignored the rules (only 500k‐600k 3115’s filed)
• Most of the provisions in the TPR’s can be utilized in 2015 and forward
TPR - Updates
• Rev‐Proc 2015‐56 Safe Harbor for betterment, restoration and adaptation tests (75/25)
• New de minimis amount ‐ Notice 2015‐82• Rev‐Proc 2016‐29 – Automatic Change Updates
• New Form 3115 Application for Change in Accounting method
© MS Consultants, LLC 2016

9/16/2016
14
Common 3115 filings
• They are automatic if assigned a methodnumber – also no filing fee
• Fix bonus election problems (CHANGE #7)• Write‐off prior improperly capitalized repairs(CHANGE #184)
• CHANGE #196 for late PAD – Expired 2014
© MS Consultants, LLC 2016
Common 3115 filings
• Write‐off replaced structural componentscurrently being depreciated (CHANGE #205)
• Write‐off replaced non‐structural componentscurrently being depreciated (CHANGE #206)
• Write‐off current or future removal costsassociated with an improvement (CHANGE #21)
© MS Consultants, LLC 2016

9/16/2016
15
3115 Updates for 2015
• File one signed original with timely filed return• Send one signed original to Kentucky (previouslywas Utah)
• 12 spaces for concurrent designated changenumbers (previously was one line)
• New instructions caution not to rely only on theinstructions, must go to website to determine ifthere has been any newly published guidance
© MS Consultants, LLC 2016
De minimis
• Rules• Updates
© MS Consultants, LLC 2016

9/16/2016
16
De minimis Expensing Rule-1.263(a)-1(f)
– Definition:– Useful life less than 12 months
» OR
– Property costing less than certain dollar amount» AND
– Must be expensed on books/financial statements
© MS Consultants, LLC 2016
De minimis Expensing Rule-1.263(a)-1(f)
• 3 Thresholds:–Applicable Financial Statements‐(AFS)‐$5,000
–No written policy, if consistently applied ‐$2,500 (raised from $500) – Effective01/01/16….or earlier.
–Do nothing ‐$200
© MS Consultants, LLC 2016

9/16/2016
17
De minimis Expensing Rule-1.263(a)-1(f)
• Written Capitalization Policy
• For tax years beginning _________, and forward, (Name of Business) elects to treat as an expense for both book and income tax purposes property with a cost of $____________ or less, including items that have a useful life of 12 months or less. It is (Name of Business’s) intention that this election complies with the IRS Section 1.263(a)‐1(f) de minimis safe harbor election.
© MS Consultants, LLC 2016
De minimis Expensing Rule-1.263(a)-1(f)
• A taxpayer can elect to apply the de minimis rule in one year and not the next
• The de minimis safe harbor is elected annually by including a statement on the taxpayer’s tax return (including extensions) for the year elected
© MS Consultants, LLC 2016

9/16/2016
18
Safe Harbor Election• Statement must be attached annually to a timelyfiled (including extensions) income tax return
• Statement must be titled “Section 1.263(a)‐1(f)de minimis safe harbor election” and contain thefollowing information:– Taxpayer’s name– Taxpayer’s address– Taxpayer identification number– Statement that the taxpayer is making the de minimissafe harbor election under Section 1.263(a)‐1(f)
© MS Consultants, LLC 2016
Tax tips
• Elect de minimis annually• Have all clients set up capitalization policiesand include in permanent tax file
• Obtain separate invoices for shippinginstallation etc. to keep below thresholds
© MS Consultants, LLC 2016

9/16/2016
19
• Bonus Depreciation rules:– 50% deduction (currently)– Must be a new Unit of Property– Original use of the Unit of Property must beginwith the taxpayer
– Must have a depreciable life less than 20 years• Personal property, land improvements• Importance of Cost Segregation Studies
– Can elect out by recovery class© MS Consultants, LLC 2016
• Bonus has been extended thru 2019• 2015 = 50%• 2016 = 50%• 2017 = 50%• 2018 = 40%• 2019 = 30%• This will allow for more effective tax planning
© MS Consultants, LLC 2016

9/16/2016
20
• The Act retroactively extends and makes permanentthe 15 year straight line depreciation option for:
• Qualified Leasehold Improvement Property (QLI)• Qualified Restaurant Property (QRP)• Qualified Retail Improvement Property (QRIP)
© MS Consultants, LLC 2016
Qualified Leasehold Improvement Property
– QLI property includes• Code Sec. 1250 property
– The improvement is made "under or pursuant toa lease”
– The portion of the building is to be occupiedexclusively by the lessee
– The improvement is placed in service more than3 years after the date the building was firstplaced in‐service

9/16/2016
21
Qualified Leasehold Improvement Property
– QLI property DOES include:
• Plumbing and electrical systems• Drywall• Ceramic tile• Lighting fixtures• Acoustic ceiling tiles• & more
Qualified Leasehold Improvement Property
– QLI property DOES NOT include:
• enlargement of the building• any elevator or escalator• any structural component benefiting acommon area
• the internal structural framework of thebuilding

9/16/2016
22
Qualified Leasehold Improvement Property
• Qualified Leasehold Improvements
– 09/11/01 – 10/22/04 – 39 year QLI qualifies for Bonus
– 10/23/04 – 12/31/04 – 15 year QLI qualifies for Bonus– 01/01/05 – 12/31/07 – 15 year QLI – NO Bonus– 01/01/08 – 12/31/13 – 15 year QLI qualifies for Bonus– 01/01/14 – permanent – 15 yr QLI qualifies for Bonus
© MS Consultants, LLC 2016
Qualified Restaurant Property– QRP includes:
–An improvement to a building, if more than50% of the building's square footage isdevoted to preparation of, and seating foron‐premises consumption of, preparedmeals.
–Can be related party

9/16/2016
23
Qualified Restaurant Property– QRP includes:
– Interior Improvements only ‐ 2004‐2008– Interior and exterior, including all 1250property – 2009‐current
–No 3year rule, meaning QRP is applicable fora newly constructed restaurant – 2009‐current
Qualified Restaurant Property
• Qualified Restaurant Property
– 10/23/04 – 12/31/07 – 15 year QRP – NO Bonus– 01/01/08 – 12/31/08 – 15 year QRP qualifies for Bonus– 01/01/09 – 12/31/13 – 15 year QRP – NO Bonus– 01/01/14 – permanent – 15 year QRP – NO Bonus
– Rev Proc. 2011‐26 – QRP is bonus eligible if meets the“dual characteristic” test of QLI
© MS Consultants, LLC 2016

9/16/2016
24
Qualified Retail Improvement Property
– QRIP
–open to the general public and is used in theretail trade or business of selling tangiblepersonal property to the general public,
–placed in service more than 3 years after thedate the building was first placed in service.
–made by the owner of that improvement willbe qualified retail improvement property
Qualified Retail Improvement Property
• Qualified Retail Improvement Property
– 01/01/09 – 12/31/13 – 15 year QRIP – NO Bonus
– 01/01/14 – permanent – 15 year QRIP – NO Bonus
– Rev Proc. 2011‐26 – QRIP is bonus eligible if meets the“dual characteristic” test of QLI
© MS Consultants, LLC 2016

9/16/2016
25
Qualified ImprovementProperty
• New “Q” on the block – effective 01/01/16
– Similar to QLI• Bonus eligible• Can be 15‐yr SL
– Also can be 39‐yr with BONUS– No in service requirement pursuant to a lease
• Eligible for your own building
– No 3 year old requirement• Improvements still have to be done after building is PIS
© MS Consultants, LLC 2016
Qualified ImprovementProperty
• New “Q” on the block
– Example• An internal improvement (structural component) thatbenefits a common area does not qualify for a 15‐yrrecovery period in the case of a leased buildingproperty or a retail building. HOWEVER, QI propertydoes not contain this restriction. Therefore, such aninternal improvement to a common area maynevertheless qualify for bonus depreciation as qualifiedimprovement property.
© MS Consultants, LLC 2016

9/16/2016
26
Qualified ImprovementProperty
• QLI, QRP, QRIP all have been made permanentwith the PATH act
• QIP has been introduced as part of the Bonusdepreciation extensions. Will QIP expire atthe end of 2019?
• Enhanced section 179 deduction was madepermanent
• Maximum deduction set at $500,000• Phase‐out threshold set at $2,000,000• For tax years after 2015, the amounts will beindexed for inflation– 2016 = $500,000 on $2,010,000
© MS Consultants, LLC 2016

9/16/2016
27
• An eligible Unit of Property has to be “New toYou”. So it can be “used” property, unlikeBonus eligible property must be new
• Must be used at least 50% for business in thefirst year it is placed in service
• Tangible personal property• Section 179 cannot create a loss
– Carryforwards are available© MS Consultants, LLC 2016
Section 179 Planning– Taxpayer is allowed $500,000 (total)
• Includes any 179 expense on 1245 personalproperty (up to $500,000)
• Includes any 179 expense on 1250 (QLI, QRP, orQRIP) real property (up to $500,000 for 2016 &forward)
– Overall purchases limited to $2,000,000

9/16/2016
28
Section 179 Planning– Limitations:
• Can elect personal property only• If taxpayer elects both (PP & QP), a proportionate amount must be taken
– Example ahead• Husband and wife are treated as one taxpayer with regard to the maximum dollar limit
• Only available to your aggregate taxable income derived from the active conduct of any trade or business during the taxable year
Section 179 PlanningFor taxable years beginning in 2015, the provision extends the limitation on carryovers and the maximum amount available with respect to qualified real property of $250,000.
The provision removes the limitation related to the amount of section 179 property that may be attributable to qualified real property for taxable years beginning after 2015.
9/16/2016
29
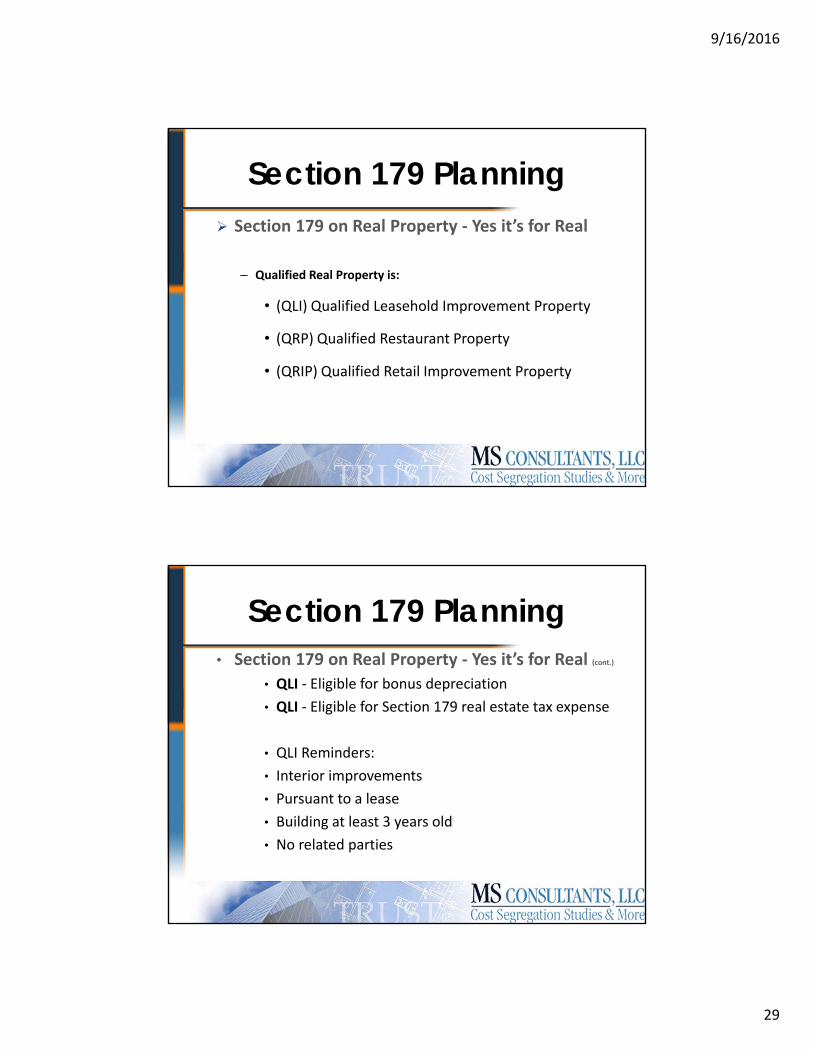
Section 179 Planning Section 179 on Real Property ‐ Yes it’s for Real
– Qualified Real Property is:
• (QLI) Qualified Leasehold Improvement Property
• (QRP) Qualified Restaurant Property
• (QRIP) Qualified Retail Improvement Property
Section 179 Planning• Section 179 on Real Property ‐ Yes it’s for Real (cont.)
• QLI ‐ Eligible for bonus depreciation• QLI ‐ Eligible for Section 179 real estate tax expense
• QLI Reminders:• Interior improvements• Pursuant to a lease• Building at least 3 years old• No related parties

9/16/2016
30
Section 179 Planning• Section 179 on Real Property ‐ Yes it’s for Real (cont.) Example:
• Tenant spends $800,000 on 2016 build‐out and willhave income. Entire amount is QLI 1250 Property.
• Tenant can first take $500,000 179 expense on1250 property and 50% bonus on remaining$300,000 ($800,000 ‐ $500,000)
• First year depreciation on these items would be$650,000 made up of $500,000 section 179 and$150,000 bonus ($300,000 x 50%)
Section 179 Planning• Section 179 on Real Property ‐ Yes it’s for Real (cont.)
– Depreciation on remaining basis of $150,000– ($800,000 ‐ 500,000 – 150,000) x 15 yearS/L amount = $5,000
• Total year one depreciation would be$655,000
• Depreciation if neither bonus or 179 appliedwould be $800,000 x 2.5%(39 years) or$20,000.

9/16/2016
31
Unit of Property
• Determining the Unit of Property is veryimportant when dealing with the new TPR’s
© MS Consultants, LLC 2016
Determining the Unit of Property (UOP)
• Building and its structural components are a single UOP
– The regulations define the building structure asthe building (as defined in §1.48‐1(e)(1)) and itsstructural components (as defined in §1.48‐1(e)(2)) other than the components specificallyenumerated as building systems.
© MS Consultants, LLC 2016

9/16/2016
32
Determining the Unit of Property (UOP)
HVAC SYSTEMHeating Ventilation & Air Conditioning
PLUMBING SYSTEMInterior & exterior, incl. water, storm & sewer
ELECTRICAL SYSTEMInterior & exterior, incl. fixtures, wiring & distribution
ESCALATORS
FIRE PROTECTION SYSTEMIncluding sprinklers & alarms
SECURITY SYSTEMFor protection of building & occupants
ELEVATORS
GAS DISTRIBUTION SYSTEMInterior & exterior
© MS Consultants, LLC 2016
Determining Unit of Property(UOP)
Common Examples of Building System Components
Build
ing
Structure
HVAC
Plumbing
Systems
Electrical
Systems
Elevators
Escalators
Fire Protection
and Alarm
System
s
Security
System
s to
Protect
Build
ing
and Occupan
ts
Gas
Distribution
System
Roof
Walls
Floors
Ceilings
Foundations
Windows
Doors
Motors
Compressors
Boilers
Furnace
Chillers
Pipes
Ducts
Radiators
Pipes
Drains
Valves
Sinks
Toilets
Water and Sanitary equipment
Wiring Outlets
Junctions
Lighting Fixtures and Connectors
Electric Utility Equipment
Elevator boxes
Control equipment
Cables and movement equipment
Rails
Steps
Supporting Equipment
Controls
Sensing & Detectiondevices
Computer controls
Sprinkler headsPiping & plumbing
Alarms
Control Panels
Window & door locks
Security cameras
Recorders
Monitors
Motion detectors
Security lighting
Alarms
Pipes
Gas utility equipment

9/16/2016
33
Determining the Unit of Property(UOP)
• UOP for assets other than buildings. In general, for real orpersonal property that isn't classified as a building by thetemp regs. all the components that are functionallyinterdependent comprise a single UOP. Components ofproperty are functionally interdependent if the placing inservice of one component by the taxpayer is dependent onthe placing in service of the other component by the taxpayer.
© MS Consultants, LLC 2016
Tax tips
• Set up assets on depreciation schedules tocomply with new UOP’s– Easier to identify and write‐off assets as they arereplaced
– Gives basis in determining whether newexpenditure should be capitalized
© MS Consultants, LLC 2016

9/16/2016
34
Dispositions of Property• A disposition occurs when:
– Ownership of an asset is transferred or when theasset is permanently withdrawn from use;
– An asset is sold, exchanged, retired, abandoned,or destroyed
– An asset is transferred to a supplies, scrap orsimilar account, or
– A portion of an asset is disposed of in certainspecified dispositions
© MS Consultants, LLC 2016
Dispositions of Property• Taxpayer may file form 3115 for prior years for fullasset disposition (#205, #206).
• Taxpayer may dispose of partial asset in year ofdisposition (current year) on Form 4797.
• Simplified rules for writing off old assets– Cost Segregation – Specific Identification– PPI computation– Pro‐rata method
• GAA election is no longer necessary or a good thingfor buildings
© MS Consultants, LLC 2016

9/16/2016
35
Disposition Calculation #1• Taxpayer spends $100,000 in current year to replace a
10 year old roof
• PPI rates at acquisition date October 2004 = 152.0 and disposal date April 2015 = 202.0
• Doing the PPI rollback of $100,000 is calculated as follows:– $100,000 times 152.0 divided by 202.0 = $75,248
• Now reduce the accumulated depreciation from the newly recalculated basis:– $75,248 less $17,767 = ($57,481) recorded on Form 4797
Disposition Calculation #2• Taxpayer spends $100,000 in current year to replace a 10 year old roof
• Building was built 10 years ago – Cost Segregation Study in year built
• Original cost of roof was $75,000 on AIA• Starting point for write off is $97,500 (which includes proper allocation of indirect costs)– $97,500 less $23,021 = ($74,479) recorded on Form 4797

9/16/2016
36
Disposition Calculation #3• Taxpayer spends $100,000 in current year toreplace a 10 year old roof
• Building was built 10 years ago for $2M• Taxpayer purchased building 5 yrs ago for $4M• Cost Segregation Study in year of purchaseallocates $195,000 to roof.
• Starting point for write off is $195,000– $195,000 less $22,712 = ($172,288) recorded onForm 4797
Capitalization Standards thru 2013
You are required to capitalize expenditures that:• 1) Materially increase the value of the PROPERTY• 2) Substantially prolong the useful life of the
PROPERTY, or• 3) Adapt the PROPERTY to a new or different useExcerpted from Reg. 1.263(a)‐1(b)

9/16/2016
37
2014 Capitalization Standards
You are required to capitalize expenditures that:• 1) Materially increase the value of the PROPERTYBetterment of the Unit of Property
• 2) Substantially prolong the useful life of thePROPERTY, or
• 3) Adapt the PROPERTY to a new or different use
2014 Capitalization Standards
You are required to capitalize expenditures that:• 1) Betterment of the Unit of Property• 2) Substantially prolong the useful life of the
PROPERTY, Restoration of the Unit of Propertyor
• 3) Adapt the PROPERTY to a new or different use

9/16/2016
38
2014 Capitalization Standards
You are required to capitalize expenditures that:• 1) Betterment of the Unit of Property• 2) Restoration of the Unit of Property or• 3) Adapt the PROPERTY Unit of Property to a newor different use
Applying the Capitalization standards
BETTERMENT of the Unit of Property• 1‐ Ameliorate a material condition or defect that existed
prior to the acquisition of the property or arose during theproduction of the property;
• 2‐ Material addition to the unit of property (including thephysical enlargement, expansion, or extension);
• 3‐ Material increase in the capacity, productivity,efficiency, strength, or quality of the unit of property or itsoutput
© MS Consultants, LLC 2016

9/16/2016
39
Applying the Capitalization standards
RESTORATION of the Unit of Property• A taxpayer must capitalize amounts paid torestore a unit of property, including amountspaid in making good the exhaustion for whichan allowance is or has been made.
© MS Consultants, LLC 2016
Remodeling Expenditures
Building Refresh (ex. B6) – refresh the look and layout. Inorder to display the merchandise better, the Store
– Relocates lighting– Moves one wall to accommodate displays– Cleans and repairs flooring throughout the building– Patches holes in the walls, replaces damaged ceiling tiles– Repaints the interior & exterior for the new color scheme
– RESULT = Costs are expensed

9/16/2016
40
Remodeling ExpendituresBuilding Refresh; Limited Improvement (ex. B7) –refresh the look and layout, along with adding building addition for additional storage space and loading dock. In order to accomplish this, the store:
– All of the above, plus– Add the storage space and loading dock– Expand the electrical system for the new addition
RESULT = – Refresh costs are EXPENSED (not a Betterment)
– Building Addition costs are CAPITALIZED (Structural/Building system)
Remodeling ExpendituresBuilding Remodel (Ex. B8) – upgrade the look and layout to compete for a different type of customer. In order to accomplish this, the store:
– Replace flooring– Replace large parts of exterior walls to insert windows– Add a new all glass elevator– Replace ceiling tiles with acoustic tiles– Repaint the interior and exterior– RESULT = Costs are capitalized

9/16/2016
41
New Cap Standards
RESTORATION of the Unit of Property
EXAMPLE – Taxpayer replaces 3 HVAC Units out of 10 on top of their office building –Do you expense these costs, or capitalize?
Summary of Building Examples from the Final Regulations
REPAIR• 3/10 roof units (Ex. R18)
CAPITALIZE• One chiller HVAC (Ex. R17)

9/16/2016
42
Summary of Building Examples from the Final Regulations
REPAIR• Roof membrane (Ex. B13)• 3/10 roof units (Ex. R18)• 30% electrical wiring (Ex. R21)• 100/300 windows (Ex.R25)• Floors in lobby (10%) (Ex. R28)
CAPITALIZE• Large portion of roof (Ex. R14)• One chiller HVAC (Ex. R17)• 100% electrical wiring (Ex. R20)• 200/300 windows (Ex. R26)• Floors in all public areas (40%) (Ex.R29)
33% seems to be the “unofficial” bright line - everything does not need to be capitalized. May have previously
capitalized items that now can be written off
Parts of a Roofing System

9/16/2016
43
Rev Proc 2015-20
• For “Small Business Taxpayers”• Defined as a business with total assets of lessthan $10 million OR average gross receipts of$10 million or less for the prior 3 taxable years
• Relieved from having to file mandatory Form3115’s to comply with the TPR’s
• May be useful for very small clients
© MS Consultants, LLC 2016
Rev Proc 2015-20
• Small taxpayers who adopt 2015‐20:– Cannot claim repair deductions that were previouslycapitalized
– Cannot claim late partial asset dispositions– Cannot deduct removal costs that have beenpreviously capitalized
– Are not afforded audit protection for prior years
© MS Consultants, LLC 2016

9/16/2016
44
Rev Proc 2015-56
• Safe Harbor provided for remodeling costs forRetail and Restaurant operations
• If Qualified taxpayer chooses this option, Form3115 will be required (Automatic Method Change)
• Write off 75% of remodeling costs as expense• Capitalize 25% of costs• Specifically excludes offices, apartments,automobile dealerships, gas stations, and more
© MS Consultants, LLC 2016
Rev Proc 2015-56
• Only taxpayers with applicable financialstatements can use this Rev. Proc.
• Applies to all costs – cannot choose whichremodeling costs to apply this to
• 30 exceptions written into the Rev. Proc.– i.e. If you elect, you must make a late GAA electionfor the original building, therefore no partial assetdispositions, and may have to reverse prior PADs
© MS Consultants, LLC 2016

9/16/2016
45
Rev Proc 2016-29• A Change #7 is non‐automatic where a prior year tax credit was taken related to the
depreciable property, including a 45L credit.• Also, the waiver of the eligibility rule in Rev. Proc. 2015‐13 is extended one year to any
tax year beginning before January 1, 2016, for the following items:– Relating to depreciation of leasehold improvements under Reg. section 1.167(a)‐4– Relating to a change from a permissible to another permissible method of accounting for
depreciation of MACRS property under Reg. sections 1.168(i)‐1, 1.168(i)‐7, and 1.168(i)‐8– Relating to dispositions of a building or structural component under Reg. section 1.168(i)‐8– Relating to dispositions of tangible depreciable assets (other than a building or its structural
components) under Reg. section 1.168(i)‐8– Relating to dispositions of tangible depreciable assets in a general asset account under Reg.
section 1.168(i)‐1– Relating to changes for tangible property under the final tangible property regulations
• https://www.irs.gov/pub/irs‐drop/rp‐16‐29.pdf
© MS Consultants, LLC 2016
• Section 179D – Energy Efficient Building Tax Deduction– Introduced with EPACT 2005– $1.80 per SF deduction– Three areas analyzed – Lighting, HVAC, Shell– Need to attain 50% efficiency as compared to ASHRAE 2001standard (2007 standard for 2016 projects)
– Commercial Buildings, Residential buildings > 3 stories– 3115 available, can look back to 2006– Government buildings – deduction passes through to architect
© MS Consultants, LLC 2016

9/16/2016
46
• Section 45L – Energy Efficient Building Tax Credit– Introduced with EPACT 2005– $2,000 per unit credit– Need to attain 50% efficiency as compared to IECC 2006standard
– Residential buildings 3 stories or less above grade– Includes apartments– 3115 not available, must amend
© MS Consultants, LLC 2016
Thank you for listening!
Questions?Additionally, please don’t hesitate to contact
with questions later:
© MS Consultants, LLC 2016
David A. FabianDirector, MS Consultants LLC
Office: 716‐633‐9840Cell : 716‐573‐9378Fax : 716‐633‐9469

Section 5 Click to jump back to Table of Contents

9/16/2016
1
Society of Depreciation Professions (SDP)
North American Utility Regulatory Trends
September 19, 2016
PwC │ North American Utility Regulatory Trends
Topics we’ll cover
1
Questions, Contact Information, & Appendix
Addressing Challenges
Introduction
Client Challenges
Macro Utility & Regulatory Trends

9/16/2016
2
PwC │ North American Utility Regulatory Trends
Introduction
2
Derek Manville – PwC – Director, Power & Utilities
• Utilities Experience: 10 years
• Clients Served:
• Duke Energy
• Southern Company
• NiSource
• San Diego Gas & Electric (Sempra Energy)
• Southern California Gas (Sempra Energy)
• El Paso Electric
• Atlanta Gas & Light Resources (Southern Company Gas)
• Project Experience:
• Merger Integration (Pre & Post-Merger)
• Regulatory Strategy & Process Improvement
• Financial Planning, Budgeting, and Forecasting
• Financial Reporting (Internal & External)
• Chart of Accounts Design
PwC │ North American Utility Regulatory Trends
Macro Utility & Regulatory Trends
3
Questions, Contact Information,& Appendix
Addressing Challenges
Introduction
Client Challenges
Macro Utility & Regulatory Trends

9/16/2016
3
PwC │ North American Utility Regulatory Trends
Utility Macro Trends
4
What are some of the trends within the North American Utility sector?
• Utility industry consolidation trends continue – with more than $70b spent on mergers and acquisitionsin the past few years
• US gross electrification is expected to grow by 27m customers between 2013 and 2040 – residential customer growth is trending upward while industrials are trending even
• US electric consumption is expected to increase by ~1% annually from 2013 to 2040
• US electric sales revenue is trending ~1% annual growth
• Industry disrupting factors continue to grow in prevalence and impact, including:
• Customer demand changes and general awareness
• Technology development, availability, and improvement
• Regulatory policies and incentives
• Competition increase from traditional and non-traditional industries
• 19% of the Utilities workforce is retirement eligible now and 33% are retirement eligible withinin thenext 5 years
Source: Edison Electric Institute, Strategy&, PwC
PwC │ North American Utility Regulatory Trends
Regulatory Macro Trends
5
What are some of the regulatory trends that demonstrate a volatile and increasingly complex regulatory environment?
• In the early 2000’s there were an average of less than 5 rate case filings per Quarter in the US – these filings spiked to 25 in Q2 2014 and have averaged 13 per Quarter since 2010
• The average requested Return on Equity (RoE) has steadily declined from 15.26% (Q1 1989) to 10.39%(Q1 2016) – a top 10 lowest quarterly requested RoE in the last 30 years
• The average awarded RoE has steadily declined from 12.85% (Q2 1990) – 10 of the last 16 quarters have recorded average awarded RoE below 10%
• Common rate case disallowances continue to be executive compensation, corporate aircraft expenses, certain affiliate expenses (example: mgmt. fees), corporate lobbying fees, and other capital investment fees not found to be adequately beneficial to the rate payer
• When entering a rate case proceeding Utilities spend +2,000 hours preparing and executing a regulatory rate case – the overall process typically takes between 8 to 14 months to execute
• Utility costs have become more difficult to predict and an increase in the utilization of Rider and Clause recovery mechanisms has been witnessed for most states
Source: Edison Electric Institute (EEI) Rate Case Summary - Q1 2016 Financial Update

9/16/2016
4
PwC │ North American Utility Regulatory Trends
Client Challenges
6
Questions, Contact Information,& Appendix
Addressing Challenges
Introduction
Client Challenges
Macro Utility & Regulatory Trends
PwC │ North American Utility Regulatory Trends
Client Challenges – Business Process Overview
7
Regulatory Strategy• Recovery Strategy• Jurisdiction Strategy• Lag Minimization Strategy• Investment Prioritization• Regulator Engagement
Common Filings• Jurisdictional Requirements• Cost of Service Studies• Riders & Clauses• Informational Postings• Technical Conferences• Intervenor RFIs• Standard / Automated Reporting• Technology Enabled Filing
Process
Regulatory Management• Internal / External Reporting• Executive Review Cycles• Technology Enablement• Peer Monitoring• Forecasting & Planning• Regulatory Roadmap
Knowledge Transfer• Internal Knowledge Capture• Process Documentation• Roles& Responsibilities• Knowledge Repository
Rate Case Development• Data Management• Data Governance• Repeatable Process• Defined Organization• Rate Design & Modeling
Regulatory RFI• Intervenor Management• Internal Decision Support• Information Standardization• Repeatable Process
?
Rate Case Execution• Data Requests & Management• Information Standardization• Legal Compliance• Review of Common Disallowances• Delivery & Execution Standardization• Expert Testimony Preparation
Common & Recurring Processes
Specialized Processes
Below you’ll find many of the common, recurring, and specialized processes managed by the regulatory function.

9/16/2016
5
PwC │ North American Utility Regulatory Trends
Client Challenges – Commonly Witnessed
8
The following regulatory challenges have been witnessed by PwC within the industry:
• Difficulty integrating strategic plans across Risk Management, Operations Planning, Financial Planning, and Regulatory Planning to drive optimal recovery and stronger financial performance
• Increasing engagement in regulatory proceedings is creating a strain and a burden on existing utility resources, processes, and technology
• Difficulty accurately forecasting expenses and customer demand creates challenges achieving allowable return on equity targets
• Increasing complexity and creativity of recovery mechanisms requires additional tracking, monitoring, reporting, and response to regulatory and intervenor inquiries
• Difficulty adapting organizationally to evolving regulatory requirements, including:
• Regulatory functions typically contain specialized, historical knowledge that is difficult to transition and resource rotation introduces regulatory and political risk
• Regulatory processes are typically described as ‘highly-manual, high-risk, and time-consuming’ as resources spend significant time requesting information, consolidating data, reviewing data – but not providing analysis or recommendations
• Regulatory functions typically carry higher costs to operate due to the specialized skillset and often, the tenure of the resources
PwC │ North American Utility Regulatory Trends
Addressing Challenges
9
Questions, Contact Information, & Appendix
Addressing Challenges
Introduction
Client Challenges
Macro Utility & Regulatory Trends

9/16/2016
6
PwC │ North American Utility Regulatory Trends
Addressing Challenges – What are clients doing?
10
Many of our clients have identified regulatory management as an integral part of their business operations – moving away from a ‘blocking & tackling’ moniker to a more strategic focus.
• Clients are actively integrating their Regulatory organizations into the core of their traditional operational functions, including:
• Inclusion in Risk identification and planning activities to identify and define risk reduction strategies
• Inclusion in the Capital planning process to provide a regulatory ‘lens’ to future investments and expenses
• Inclusion in Generation planning discussions to take advantage of regulatory incentives where they exist
• Clients are seeking to transform or enhance their Regulatory organizations to address existingregulatory challenges and expected ‘future state’ requirements, including:
• Organizing the department in a manner that support the enterprise regulatory needs
• Seeking to shift existing resources from ‘lower-value’ manual activities to ‘higher-value’ analysis and recommendation activities
• Looking for ways to reduce the reliance upon key individuals with specialized knowledge and skillsets
• Clients are increasingly installing rigor that traditionally resides within the Controllership, and within the regulatory function
• Clients are pursuing technology solutions to enable their Regulatory organizations to address existing regulatory challenges and expected ‘future state’
PwC │ North American Utility Regulatory Trends
Addressing Challenges – Technology Considerations
11
Our clients are increasingly viewing technology as an enabler in resolving current and future regulatory challenges.
• Microsoft Excel is the most prevalent and rudimentary ‘current state’ technology used in the industry
• This often means hundreds of linked spreadsheet models that are difficult to manage, maintain, contain errors, and require quite a bit of manual intervention
• PowerPlan Regulatory Module has gained some traction in the last 2 years and we are seeing increased utilization of this technology
• This product has tight integration with other PowerPlan Modules (Asset / Tax / etc.) in which the information is a key input to many regulatory processes and filings
• PowerPlan offers a system and application based approach to manage the regulatory environment
• Utilities International (UI) Planner remains within the market with regulatory products
• This product has tight integration with UI Planner’s forecasting module which is a key input in forward test period or stated rate jurisdictions
• UI Planner offers a ‘look and feel’ like Microsoft Excel that users find familiar
• Other technologies such as SAS, PeopleSoft, and SAP’s Business Planning & Consolidation (BPC) have been explored but to our knowledge have not yet been selected to enable the regulatory function in a widespread fashion
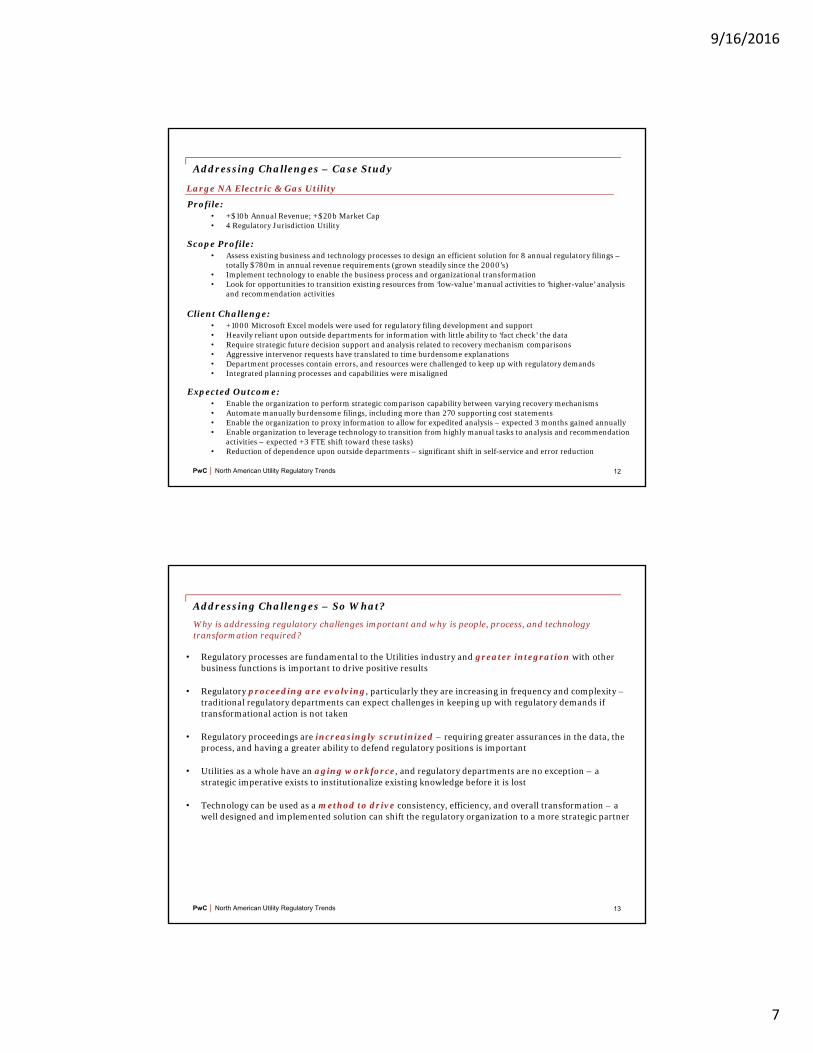
9/16/2016
7
PwC │ North American Utility Regulatory Trends
Addressing Challenges – Case Study
12
Large NA Electric & Gas Utility
Profile: • +$10b Annual Revenue; +$20b Market Cap• 4 Regulatory Jurisdiction Utility
Scope Profile: • Assess existing business and technology processes to design an efficient solution for 8 annual regulatory filings –
totally $780m in annual revenue requirements (grown steadily since the 2000’s)• Implement technology to enable the business process and organizational transformation• Look for opportunities to transition existing resources from ‘low-value’ manual activities to ‘higher-value’ analysis
and recommendation activities
Client Challenge: • +1000 Microsoft Excel models were used for regulatory filing development and support• Heavily reliant upon outside departments for information with little ability to ‘fact check’ the data• Require strategic future decision support and analysis related to recovery mechanism comparisons• Aggressive intervenor requests have translated to time burdensome explanations• Department processes contain errors, and resources were challenged to keep up with regulatory demands• Integrated planning processes and capabilities were misaligned
Expected Outcome: • Enable the organization to perform strategic comparison capability between varying recovery mechanisms• Automate manually burdensome filings, including more than 270 supporting cost statements• Enable the organization to proxy information to allow for expedited analysis – expected 3 months gained annually• Enable organization to leverage technology to transition from highly manual tasks to analysis and recommendation
activities – expected +3 FTE shift toward these tasks)• Reduction of dependence upon outside departments – significant shift in self-service and error reduction
PwC │ North American Utility Regulatory Trends
Addressing Challenges – So What?
13
Why is addressing regulatory challenges important and why is people, process, and technology transformation required?
• Regulatory processes are fundamental to the Utilities industry and greater integration with other business functions is important to drive positive results
• Regulatory proceeding are evolving, particularly they are increasing in frequency and complexity –traditional regulatory departments can expect challenges in keeping up with regulatory demands if transformational action is not taken
• Regulatory proceedings are increasingly scrutinized – requiring greater assurances in the data, the process, and having a greater ability to defend regulatory positions is important
• Utilities as a whole have an aging workforce, and regulatory departments are no exception – astrategic imperative exists to institutionalize existing knowledge before it is lost
• Technology can be used as a method to drive consistency, efficiency, and overall transformation – awell designed and implemented solution can shift the regulatory organization to a more strategic partner

9/16/2016
8
PwC │ North American Utility Regulatory Trends
Questions & Contract Information
14
Questions, Contact Information, & Appendix
Addressing Challenges
Introduction
Client Challenges
Macro Utility & Regulatory Trends
PwC │ North American Utility Regulatory Trends
Contact Information
15
PwC AdvisoryDerek Manville, DirectorPower & Utilities(770) [email protected]
PwC AdvisoryJennifer Koehler, PartnerPower & Utilities – Finance Practice Lead(216) [email protected]
PwC AssuranceAl Felsenthal, Managing DirectorPower & Utilities(312) [email protected]

9/16/2016
9
PwC │ North American Utility Regulatory Trends
Appendix
16
PwC │ North American Utility Regulatory Trends
Industry Consolidation – M&A activity has shown a rise in control premiums
4
Source: CapitalIQ

9/16/2016
10
PwC │ North American Utility Regulatory Trends
Client Challenges – Other Risks
18
In addition to the common regulatory challenges that we’ve witnessed, we’ve also identified many areas of risk within the regulatory function within our Utilities clients:
PwC │ North American Utility Regulatory Trends
Regulatory Processes – What does ‘Good’ look like?
19
Regulatory Maturity Model

Section 6 Click to jump back to Table of Contents

9/19/2016
1
Making and Managing a Depreciation StudySeptember 19, 2016
John Wiedmayer, CDP
Introduction

9/19/2016
2
Depreciation Study
Phases of a Depreciation Study
• Phase 1 – Planning• Phase 2 – Data Collection• Phase 3 – Analyses• Phase 4 – Evaluation and Forecasting• Phase 5 – Calculation• Phase 6 – Report Preparation and Testimony

9/19/2016
3
Phase 1
Planning a Depreciation Study
Phase 1 - Planning
• “By failing to plan, you are planning to fail.” – Mrs. Peg Landis
• This quote is attributable to this famous person:
• Founding Father (US)• 1st US Ambassador to France• Inventor, Scientist, Publisher, Diplomat• Invented lightning rod and bifocals • Discovered electricity (sort of) with kite
and a key experiment• Pseudonym: Silence Dogood• Signer and co-author of the Declaration
of Independence and the Constitution• Persuaded France to join forces with the
Am. colonies in Am. Revolutionary War• Founded America’s first public library and
hospital• Founded UPenn• Picture on $100 bill (USD)• Inventor of the Franklin stove

9/19/2016
4
Phase 1. Planning
Define Study Objectives
Review Accounting Records
Review Engineering &
Operating Records
Discuss Study with Management
Design Data Collection, Review, & Control Systems
Present Study Plan to Management
with Time and Cost Estimates
Phase 1 - Planning
• Define Study Objectives– What are the study goals?– How will these goals be achieved?– Who will be the depreciation expert?
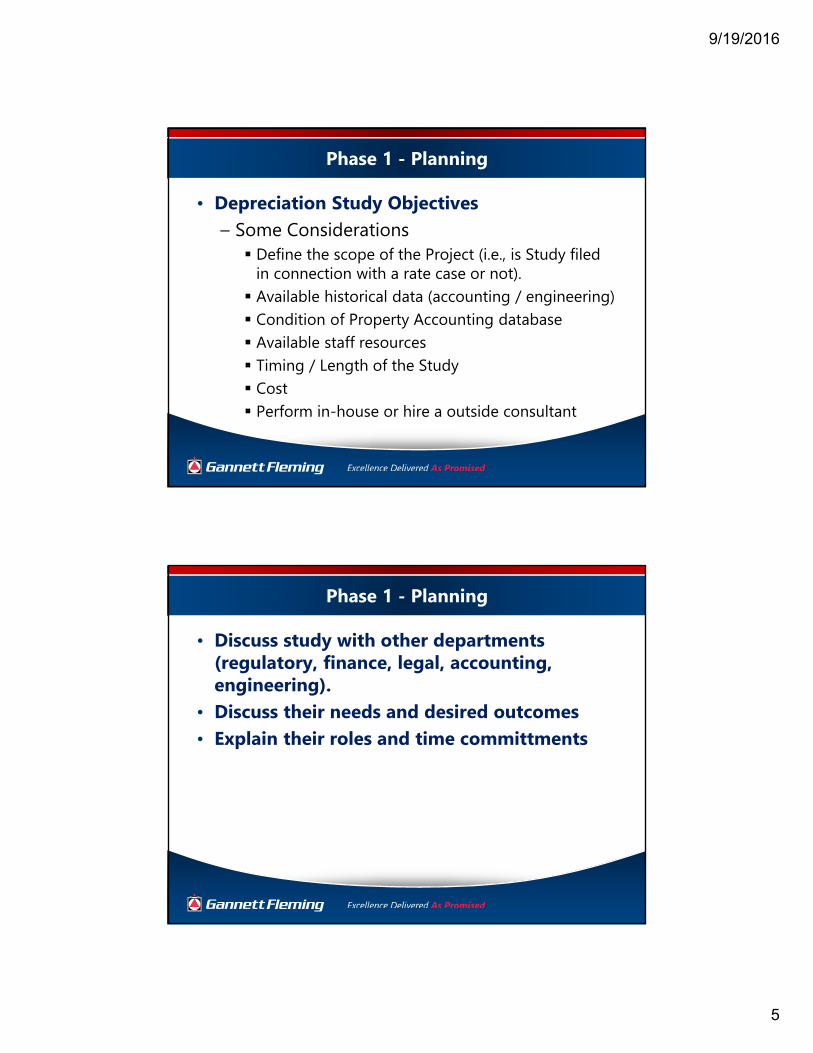
9/19/2016
5
Phase 1 - Planning
• Depreciation Study Objectives– Some Considerations Define the scope of the Project (i.e., is Study filed
in connection with a rate case or not). Available historical data (accounting / engineering) Condition of Property Accounting database Available staff resources Timing / Length of the Study Cost Perform in-house or hire a outside consultant
Phase 1 - Planning
• Discuss study with other departments(regulatory, finance, legal, accounting,engineering).
• Discuss their needs and desired outcomes• Explain their roles and time committments

9/19/2016
6
Phase 1 - Planning
• Design a Detailed Plan for Management• Plan should indicate each task, parties
responsible for its completion and timing• Gantt Chart is a helpful management tool for
accomplishing such as task.• Review the plan with Management• Phase 1 ends with the Approval of the Plan
Sample Gantt Chart – Depreciation Study

9/19/2016
7
Staff Resource Allocation, Hours
Professional - CDP 8 6 4
Professional - Analyst 8 8 8 6 20
Technical 4 8 12 10 28
Clerical 2 4 10 8 8
IT 2 2 2 4
Administrative 2 0 2
Total Hours 26 28 32 24 66
Weeks 1 2 3 4 5 6 7 8 9 10 11 12 13 14 15 16
Sample Staffing Resource Allocation Table
Data Collection
Phase 2

9/19/2016
8
Phase 2 – Data Collection
Approval of Study
Plan
Make Data Requirements
List
Write Instructions for
Data Collection
Assemble Life and Salvage
Data
Review and Correct Data
Audit Life and Salvage Data
Phase 2 – Data Collection
• Create Data Requirements (DR) List• DR List includes the data needed to perform a
depreciation study• DR List should specify estimated completion date and
party responsible for its assembly and the preferreddata format and data layout (e.g., Excel or text file)
• DR List generally includes:– Service Life Data (a.k.a., Plant Accounting Data)– Net Salvage Data– Annual Plant and Reserve Statements

9/19/2016
9
Data Assembly
• Data for Actuarial Analysis– Additions– Retirements– Transfers– Balances– Other Transactions?
• Transactions available by vintage– a.k.a. “Aged” Data
Data Assembly
• Sources:– Plant Accounting / Fixed Asset System– Previous Depreciation Studies
• How much history?– As much as possible– Consider Implications on Life Tables– Consider Life Cycle of Property Studied

9/19/2016
10
Data Review
• Check for Errors– Credit Balances– Debit Retirements
• Look for Unusual Transactions– Large Retirements– Early Retirements– Large Transfers
Data Review
• The historical service life data (a.k.a., plant accounting data) is critical to the service life analyses and ultimately to the results of the study.
• Errors or data inconsistencies can undermine the validity of your study results.
• Review the data frequently, at least annually.• Make corrections to the data as needed but do it in
the current year. Don’t change prior fiscal year data. Document correcting entries.
• Isolate likely non-recurring retirement transactions from the analyses as appropriate

9/19/2016
11
Data Audit
• Ideally, data used in the study should bereconciled to Continuing Property Recordwhich should reconcile to the General Ledger.
• The sum of the plant activity should equal theplant balance.
• If it doesn’t, be prepared to explain thedifference.
Data Audit
• Tips for spotting data anomalies– Average age of retirements, year over year
comparison– Retirements as a % of the BOY balance, year
over year comparison. Trigger points in PA.– No net salvage data in a given year for
accounts that show retirements and typicallyexperience net salvage.

9/19/2016
12
Sources of Info Other Than Property Accounting
• Engineering– Digital Maps of U/G assets (pipelines, mains)– Digital Maps of O/H assets (lines, cable, transformers)– Pole database – Size, type, year installed– Hydrants– Track charts, bridge database, locomotive and freight
car fleet (UMLER)– Streetlights database• Customer Information System (CIS)
Meter information – Size, type, year installedService lines – Size, type, year installed
Field Trip and Management Meetings
• Make arrangements to interview Accounting, Engineering & Operations personnel and other technical subject matter experts (SMEs)
• Prepare interview questions• Make a list of the major facilities to tour• Arrange field trip and inspect the facilities• Interview Engineering & Op Management
staff to discuss plans, outlook and retirement programs (e.g., cast iron mains, non-AMI meters)

9/19/2016
13
Management Meeting Interviews
• Why is it important to perform?– Information of this type helps make a better forecast– Provides helpful information and perspective in
interpreting the historical SL and NS data– Provides information about the future with respect to
company plans and how those plans may affectexisting assets
– Provides insight in company accounting practices andhow they have shaped the historical data.
Accounting Practices and Policies
• Review current and past accounting practices– Capitalization policies– Retirement unit definition– Work crew labor allocation – Install/Remove– Retirement pricing models
• Assess their impact on life and net salvage

9/19/2016
14
Phase 3
Analysis -Life and Net Salvage
Phase 3 - Analysis
• Analyses of Historical Data– Average Service Life and Dispersion Curve
(a.k.a., Survivor Curve)– Gross Salvage– Cost of Removal or Cost of Retiring
– Plug #1 – Life and Net Salvage Analyses are covered extensively at SDP training

9/19/2016
15
Life and Net Salvage (NS) Analysis
Data Review
Preliminary Life & NS Analysis
Management Meeting, Site
Visits
Final Life Analysis
Experience and Placement Band Selection
• Select Preliminary Experience Bands– Rolling, shrinking bands– Bands based on data review– General knowledge of property
• Select Preliminary Placement Bands– Rolling, shrinking bands– Bands based on data review– Review of Multiple Original Group Life Table– General knowledge of property

9/19/2016
16
Bands
• Considerations– Length of Band Trends vs. Sample Size
– Number of Bands– Characteristics of different periods of
experience and placements– Unusual time periods
• Remember, the goal is to estimate future experience
Data Review – 2016 Activity – Aged Data 1Account Vintages BOY Bal Adds Rets Trfs EOY Bal
364- Poles 1956-65 1,000,000 1,000,000
364 1966-75 2,000,000 2,000,000
364 1976-85 3,500,000 3,500,000
364 1986-90 2,500,000 2,500,000
364 1991-95 3,000,000 3,000,000
364 1996-00 3,500,000 3,500,000
364 2001-05 4,000,000 300,000 3,700,000
364 2006-10 6,000,000 300,000 5,700,000
364 2011-15 8,500,000 400,000 -100,000 8,000,000
364 2016 0 2,500,000 100,000 2,400,000
Totals 34,000,000 2,500,000 1,100,000 -100,000 35,300,000

9/19/2016
17
Data Review – 2016 Activity – Aged Data 2Account Vintages BOY Bal Adds Rets Trfs EOY Bal
364 1956-65 1,000,000 300,000 700,000
364 1966-75 2,000,000 200,000 1,800,000
364 1976-85 3,500,000 200,000 3,300,000
364 1986-90 2,500,000 100,000 2,400,000
364 1991-95 3,000,000 100,000 2,900,000
364 1996-00 3,500,000 100,000 3,400,000
364 2001-05 4,000,000 50,000 3,950,000
364 2006-10 6,000,000 50,000 5,950,000
364 2011-15 8,500,000 -100,000 8,400,000
364 2016 0 2,500,000 2,500,000
Totals 34,000,000 2,500,000 1,100,000 -100,000 35,300,000
Annual Statistics, Additions and Balances
.0
10.0
20.0
30.0
40.0
50.0
60.0
70.0
80.0
90.0
.0
2.0
4.0
6.0
8.0
10.0
12.0
14.0
16.0
18.0
Bal
ance
s ($
, mill
ion
s)
Ad
dti
on
s ($
, m
illio
ns)
Additions Balances

9/19/2016
18
Annual Statistics, Retirements
0
10
20
30
40
50
60
70
.0
.5
1.0
1.5
2.0
2.5
3.0
Av
g A
ge
(yrs
)
Ret
irem
ents
($,
mill
ion
s)
Retirements Avg Age
Preliminary Life Analysis
• Run Selected Bands• Fit Curves• Make Preliminary Estimates
• Allocate more analysis time to the larger, more complex accounts

9/19/2016
19
Life Analysis
• Considerations– Data points to include/exclude Significance “middle” of curve
– Type of property studied What does the stub curve mean? Changes in technology, etc. Previous estimates Estimates of others
Life Span Method
The Life Span or Forecast Method• Applicable to group for which concurrent
retirement of all vintages is expected– Large individual units such as power plants and major
buildings– Systems tied to a supply or market such as a pipeline– Systems subject to rapid technological obsolescence
such a metallic cable• Special case of the vintage group model

9/19/2016
20
Life Span Methods
• Final Retirement– Retirement of a power plant, etc.– Life Span estimate specific to each generating
unit or power plant location• Interim Retirements
– Retirements that occur before final retirement– Estimate with Interim Survivor Curve– Analysis should only be for interim retirements
Overview of Group Depreciation Models
0
25
50
75
100
0 5 10 15 20 25 30
Per
cen
t S
urv
ivin
g
Age, years
Typical Truncated Survivor Curve
Interim Retirements
Final Retirements

9/19/2016
21
Preliminary Net Salvage Analysis
• Perform traditional net salvage analysiswhere both gross salvage and cost of removalare expressed as a percent of retirements.
• Gross Salvage % = Gross Salvage ($) / Retirements• Cost of Removal (COR) % = COR ($) / Retirements
• Net Salvage = Gross Salvage less COR• Use alternative analytical methods if needed
Phase 4
EvaluationLife and Net Salvage Estimation

9/19/2016
22
Mgt Mtg with Subject Matter Experts (SMEs)
• Questions for Engineering and other SMEs– Account information and content– Causes of retirements– Changes in management plans– Changes in maintenance– Changes in technology– Unusual transactionsGoal – Are past forces of retirement similar to future forces of retirement. Why / why not?
Example - Account 362 Station Equipment
• Management Meeting– Transformers Retirements normally caused by failure, capacity
upgrades Newer transformers installed after 1975 have less
design tolerance– May not last as long
– Breakers Replacement program early 2000s for oil breakers Oil circuit breakers last installed in 1975 Most are SF6 Gas or Vacuum breakers Similar to transformers, less design tolerance

9/19/2016
23
Example - Account 362 Station Equipment
• Management Meeting– Relays Newer equipment is digital
– Less robust equipment– Higher degree of Obsolescence– Asset won’t be repaired
Final Life and Net Salvage Estimates
• Do you need to analyze additional bands?• Do you need to adjust data?• Does management meeting information lead
to different estimates?• Does the management meeting information
influence your curve type selection?

9/19/2016
24
Phase 4 - Evaluation
• Documentation– Field Trip Notes and Photos– Interview Notes (a.k.a., Management Mtg
Notes)– Data Corrections and Changes– Unique Accounting Practices or changes (e.g.,
change in retirement units, retirement pricingmethod, etc.)
– Documents related to Life and Net SalvageAnalyses
Phase 4 - Evaluation
• Final Assessment – Put on your thinking cap– Synthesize the historical analyses with the
information regarding future conditionsobtained through management meetings,field trips, forecasted data.
– Use professional judgment and make your bestforecast based on available information
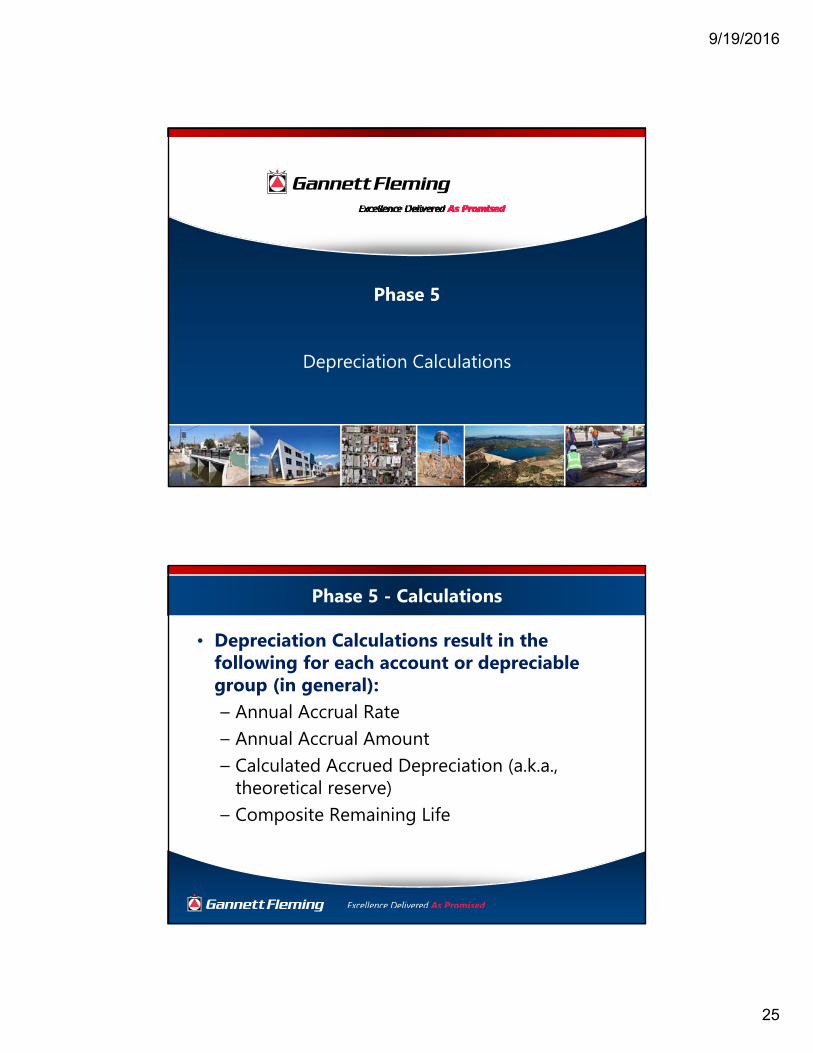
9/19/2016
25
Depreciation Calculations
Phase 5
Phase 5 - Calculations
• Depreciation Calculations result in thefollowing for each account or depreciablegroup (in general):– Annual Accrual Rate– Annual Accrual Amount– Calculated Accrued Depreciation (a.k.a.,
theoretical reserve)– Composite Remaining Life

9/19/2016
26
Phase 5 - Calculations
• Defining a Depreciation System (DS)– Methods of Allocation– Group Procedures– Bases for Allocation or Technique
Management needs to decide which options to choose in order to define their depreciation system.Plug #2 – Defining a DS covered at SDP Training
Defining a Depreciation System
• Methods of Allocation• Straight Line (SL) Method of Depreciation• Accelerated Methods of Depreciation
– Double Declining Balance (DDB)– Sum of the Years Digits (SOYD)
• Decelerated Methods of Depreciation– Sinking Fund– Present Worth
• Note: Most utilities use Straight Line for Book andRatemaking purposes

9/19/2016
27
Defining a Depreciation System
Depreciation Calculation “Procedure”• Average Service Life (ASL), a.k.a., Average
Life Group (ALG)– Broad Group– Vintage Group
• Equal Life Group (ELG), a.k.a., UnitSummation
• Probable Life (not common in ratemaking,used for valuation purposes primarily).
Defining a Depreciation System
Basis for Cost Allocation, i.e.,“Technique”
• Expiration of Time (e.g., Service Life in years)– Whole Life – {(OC less NS) / ASL}– Remaining Life – {(OC-AD-NS) / ARL}
• Expiration of Service Units (e.g., Units ofProduction (UOP))

9/19/2016
28
Defining a Depreciation System
• Application– Unit Depreciation– Group Depreciation
– Most utilities, railroads and pipelines usegroup depreciation. Gains and losses are nottypically recorded under group depreciation.
Defining a Depreciation System
• Cost or Price Level Base– Original Cost– Current Cost– Purchase Price– Other
Note: Original Cost is used in most cases, however the depreciation professional should be aware of the base being used.

9/19/2016
29
Other Depreciation System Options
• Concepts of Depreciation– Physical Condition (Layman’s Concept)– Decrease in Value (previously used in Fair
Value states)– Cost of Operation (i.e., capital recovery). Most
in use today.– Note: There are 432 combinations of
options for defining a depreciation system.Only 6-12 options are of major interesttoday.
FERC Definition – 18 CFR Part 101 - USOA
• Depreciation is the loss in service value not restoredby current maintenance incurred in connection withthe consumption or prospective retirement of utilityplant in the course of service from causes which areknown to be in current operation and against whichthe utility is not protected by insurance. Among thecauses to be given consideration are wear and tear,decay, action of the elements, inadequacy,obsolescence, changes in the art, changes in demandand requirements of public authorities.
• Depreciation as a Decrease in value concept – Notcommon any longer in utility ratemaking.

9/19/2016
30
AICPA – Depreciation Accounting - Definition
• Depreciation Accounting is a system ofaccounting which aims to distribute the costor other basic value of tangible capital assets,less salvage (if any) over the estimated usefullife of the unit (which may be a group ofassets) in a systematic and rational manner. Itis a process of allocation not valuation.
• Cost of Operation concept confirmed aboveand prevalent today.
Phase 6
Report Preparation and Testimony

9/19/2016
31
Report Preparation
• Elements of a Report– Executive Summary– Objective of Study and Report– Statement of Methods and Procedures– Analysis and Explanation– Supporting Schedules and Documentation– Results and Conclusions
Preparation for Testimony
• Anatomy of the court procedure– Direct Case (each party)– Discovery process– Rebuttal testimony– Surrebuttal testimony– Cross-examination– Redirect examination
– Plug #3 – Covered further in SDP Training

9/19/2016
32
Testifying as an Expert Witness
• Are you qualified?• Define “expert” witness
– Person with the requisite education, special oradvanced training and appropriate workexperience
– Opposition may try to attack yourqualifications in order to disqualify yourtestimony
– Expert witness can offer his / her professionalopinion.
Report Preparation and Testimony
• Credibility of study– Who commissioned it? Who performed it?– How long did it take?– Was it a complete and thorough study?– Did you adhere to recognized industry
techniques?– Does author / expert have a broad knowledge
of subject matter and of the industry?

9/19/2016
33
Management Review
• Management should review overall forecastsand estimates of depreciation study to assureconformance to corporate goals
• Consider the following management roles:– Capital Recovery Manager’s role– Legal’s Role– Revenue Requirement– Finance– Engineering & Operations– Marketing
Management Review
• Summary of Manager’s Role– Planning, overseeing, judging, approving– Presenting results
• Manager Defense of the Study– Attending Technical Conferences with various
stakeholders– Responding to questions and data requests– Testifying

9/19/2016
34
Management Review
• Commentary - Management approves the riskof investing in their network usually withcommission review and oversight; therefore,the risk of capital recovery exemplified in thedepreciation rates is also management’sresponsibility.
Sample Gantt Chart – Depreciation Study

9/19/2016
35
Work Task Duration
• Refer to Gantt Chart on prior page• Planning (Task 0) - 5%• Task 1 – 5%• Task 2 – 30%• Task 3 – 15%• Task 4 – 10%• Task 5 – 10%• Task 6 – 5%• Task 7 – 10%• Task 8 – 10%• Task 9 – N/A• Total – 100%

Section 7 Click to jump back to Table of Contents

9/21/2016
1
Results of Operations Modeling& Working Cash
SDP Conference
9/20/2016
2016 SDP Conference
Who is Utility Consulting Group, LLC
• Rate Case Modeling
• Regulatory Compliance and Filing Support
• Business Process Improvement
• Enterprise Risk Management
• Affiliate Transactions and Code of Conduct Compliance
• FERC Standards of Conduct
• Energy Settlements Process Design
• Usage Aggregation and Load Profiling
• Revenue Assurance
• Sarbanes-Oxley (SOX) documentation & testing
• Finance & Accounting
• Budgeting and Forecasting
• Financial Analysis & Modeling
• Business Case Development
• Activity Based Accounting & Unit Economics
• Performance Management & Reporting
• Shared Service Structure, Implementation & Reporting
• Data Warehousing & BI Tools
• Electric Utility Restructuring
• Software Evaluation
• Program & Project Management
• Change Management & Training
Our Solution Expertise
• Utility Consulting Group, LLC is a management consulting firm specializing in providing services to the utility industry.
• We are a team of consultants with Big 4 and global consultancy experience.
• We are certified by the California Public Utilities Commission (CPUC) designated Supplier Clearinghouse as a Women Business Enterprise (WBE).
Our Consulting Experience
• Southern California Edison
• Edison Mission Group
• Sempra Energy
• Southern California Gas
• San Diego Gas & Electric
• Salt River Project
• Xcel Energy
• LADWP
• Entergy
• First Energy
• TXU
• EPCOR
• American Electric Power
• California ISO
• California Power Exchange
• The Southern Company
• Hawaiian Electric
• Portland General Electric
• Commonwealth Edison
• Public Service New Mexico
• BC Hydro
• Southwest Gas
• Sierra Pacific Power
• Nevada Power
• New Power Company
• Southern California Water
• California American Water
DOWNLOAD HERE: www.strasner.com/sdp.pdf
9/21/2016
2
2016 SDP Conference
Topics
1. Results of Operating Modeling• An Integrated Approach to Modeling• Latest Trends
2. Working Cash Study• Importance of Working Cash• Approach and Methodology
Q/A
DOWNLOAD HERE: www.strasner.com/sdp.pdf
Results of Operations Modeling
DOWNLOAD HERE: www.strasner.com/sdp.pdf

9/21/2016
3
2016 SDP Conference
1) Rate Case Preparation – Utility reviews budgets, analyzes sales and construction forecasts and develops the rate case.
2) Filing – Utility files a rate case with the Public Utilities Commission
3) Review ‐ The Commission and interveners examine budget information from the Utility asks them to defend and update figures provided.
4) Hearings ‐ The public has an opportunity to comment. Witnesses that support the figures in the rate case are available for cross examination in a court‐like proceeding.
5) Ruling ‐ The Commission decides any outstanding matters and issues a written order on the rate request.
6) Rates Take Effect ‐ New rates take effect for customers.
Overview of the Rate Case Processfor Investor Owned Utilities
1
1
2
2
3
3
4
4
5
5
6
6
DOWNLOAD HERE: www.strasner.com/sdp.pdf
2016 SDP Conference
Operating Expenses
Recovery of forecast costs
Profit on investment
Revenue Requirement Overview
O
TaxesT
DepreciationD
Return on Rate Base(Rate of Return x Rate Base)
R
Revenue RequirementRR
ResultsOf
OperationsModel

9/21/2016
4
2016 SDP Conference
How rate cases are typically handled
Individual models are created for each area such as:
• Operating Expenses
• Capital/Ratebase
• Taxes
Commissions have a summary file that aggregates outputs from each model to create a revenue requirement
Adjustments to data or assumptions typically requires re‐running individual models
Results of Operations Model
Summary & Revenue Req.
Income &Other Taxes
Capital & Rate Base
O&M
Other
2016 SDP Conference
Meanwhile in California

9/21/2016
5
2016 SDP Conference
How Rate Cases are handled in California
• Calculate revenue requirement and summary of earnings
• Calculate all taxes and tax depreciation
• Ability to make changes in plant adjustments, including adjustments to beginning of year plant
• Ability to make changes in operating expenses
• Ability to make changes in depreciation rates
• Calculate the lead‐lag portion of working cash
With the resurgence of regulation, the Commission ruled to create an Integrated RO Model with the following requirements:
2016 SDP Conference
An integrated model is a single model that allows the commission to make adjustments and perform scenario analysis to utility proposals
All changes flow dynamically to
calculate:
What is an integrated model?
Make adjustments to O&M forecast
Make adjustments to Capital Forecast
Change depreciation rate assumptions
Working cash assumptions
• An integrated model allows users to drill‐down through calculations to see the detailed components of each calculation
Revenue RequirementRatebase
Taxes

9/21/2016
6
2016 SDP Conference
Scenario Example Model
Change forecast dollars and closing date of a large capital project
Individual Models Integrated Models
1. Adjust project dollars and closing date
2. Recalculate capital forecast3. Recalculate depreciation and tax
deprecation expense4. Recalculate ratebase5. Recalculate taxes6. Recreate revenue summary for
commission and calculate revenue requirement
1. Adjust project dollars and closing
2. Re‐run updated model
3‐7 days 5‐10 minutesTiming:
2016 SDP Conference
The Sum of Experts
Capital & Rate Base Department
Expertise
Tax Department Expertise
O&M Department Expertise
Regulatory Department Expertise
Supporting Systems, Data & Calculations

9/21/2016
7
2016 SDP Conference
Unique Approach to RO Modeling
Key
Modules or
Workbooks
Refresh Sequence for Calculating Results of Operations
1. O&M Module2. Capital/Rate
Base Module3. Tax Module Tax Loop
Summary &
Revenue
Requirement
ResultsOf OperationsModel
2016 SDP Conference
Sample RO Model Structure
Revenue RequirementSummary of
EarningsRate of Return
Taxes Other than IncomeO&M Rate Base
DepreciationPlant
Revenues
VBA Code, Refresh
Sequencing & Calc.
Summary & Presentation
Tables/Reports
Assumptions,Reference Files, Admin Files, Etc.
Shared Services
Income Taxes
Tie Out Reports
Working Cash& Lead Lag Study
Typically 25‐50 excel workbooks
Does not include source or internal data not turned over to the commission
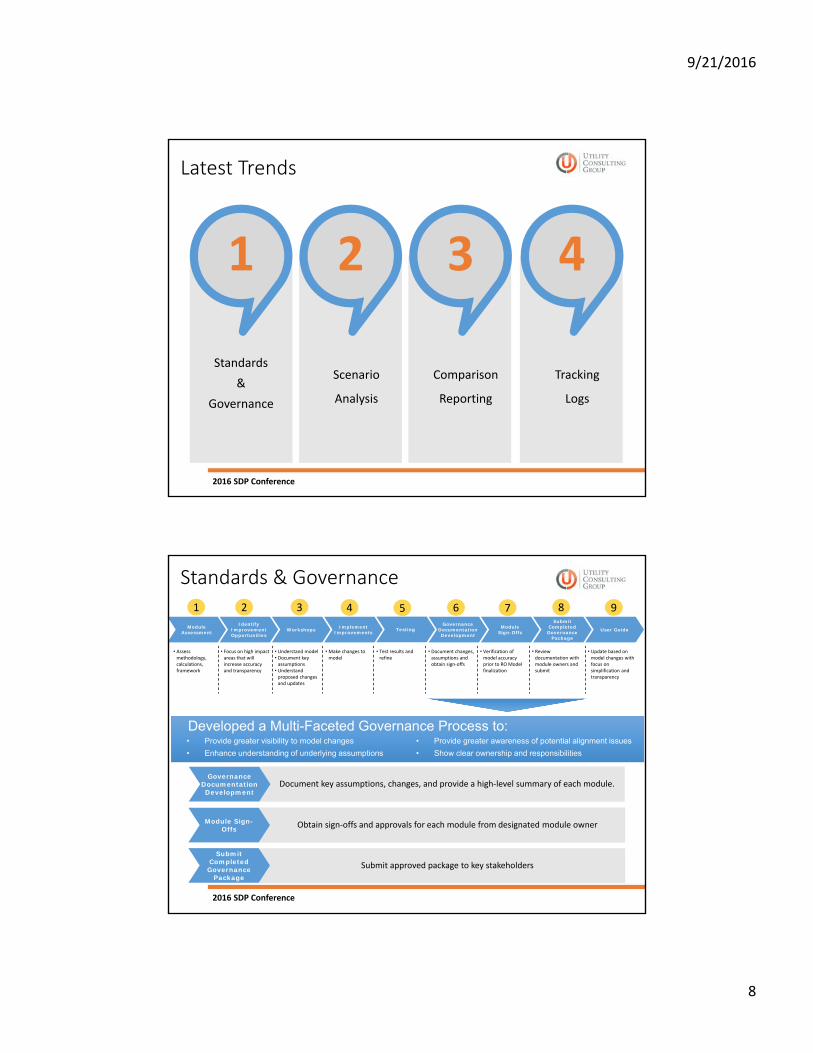
9/21/2016
8
2016 SDP Conference
Latest Trends
Standards &
Governance
1
Scenario
Analysis
Comparison
Reporting
2 3
Tracking
Logs
4
2016 SDP Conference
Submit approved package to key stakeholders
Obtain sign‐offs and approvals for each module from designated module owner
Document key assumptions, changes, and provide a high‐level summary of each module.
Standards & Governance
Developed a Multi-Faceted Governance Process to:
• Assess methodology,calculations, framework
• Focus on high impact areas that will increase accuracy and transparency
• Understand model • Document key assumptions
• Understand proposed changes and updates
• Make changes to model
• Test results and refine
• Document changes,assumptions and obtain sign‐offs
• Verification of model accuracy prior to RO Model finalization
• Review documentation with module owners and submit
• Update based on model changes with focus on simplification and transparency
Module Assessment
Identify Improvement Opportunities
Workshops Implement Improvements Testing
Governance Documentation Development
Module Sign-Offs
Submit Completed Governance
Package
User Guide
1 2 3 4 5 6 7 8 9
Governance Documentation Development
Module Sign-Offs
Submit Completed Governance
Package
• Provide greater visibility to model changes
• Enhance understanding of underlying assumptions
• Provide greater awareness of potential alignment issues
• Show clear ownership and responsibilities

9/21/2016
9
2016 SDP Conference
Scenario Analysis
Base RO Model Files Infinite Number of Scenario's
We typically see a utility run 20‐100 internal scenario’s or variations before filing the RO Model
2016 SDP Conference
Comparison Reporting
Selecting Results of Operations Models to Compare

9/21/2016
10
2016 SDP Conference
Basis of Comparison
Scenario Information
Variance Between Base and Scenario
Comparison Reporting
Comparison Output
2016 SDP Conference
A Tracking tool creates the ability to documentation Excel for both changes made to cells, or by user defined information
Tracking Logs
• Tracks changes made to the model and maintains a log of user changes
• Allows user to comment on changes• Ability to document user defined comments (no changes
required)• Model can be locked down to prevent undocumented
changes
Tool Features

9/21/2016
11
2016 SDP Conference
Tracking LogsDocumenting Changes Sample
Types of Items• Date information for extracted data• Management modifications and approvers• Methodology information• Assumptions• Documentation of calculations or revisions
Tracking & Audit Data Storage• Excel worksheet• MS Access Database
• Changes/Adjustments to an Excel sheet• User defined information for Worksheet, a Range or a Cell
Working Cash Study

9/21/2016
12
2016 SDP Conference
Working Capital Overview Working Capital is the average amount of capital provided by investors, over and above
the investment in plant, to bridge the gap between the time expenditures are incurred and revenues are collected
Working Cash
• Amount of cash needed on hand by a public utility to pay its day to day operating expenses, forthe time period during which the utility has provided electric services but has not been paid
• The FERC instructs that “a fully‐developed and reliable lead/lag study is the most accurate method of determining the working cash needed of a particular utility.“ The elements generally include:
• Revenues, fuel costs, purchased power and gas costs, labor, operation and maintenance costs, income taxes,and property and other taxes
• In addition to lead/lag study, calculations include operational cash requirements (e.g., bank balances) and third party funds (e.g., utility user taxes)
Working Capital
Fuel InventoryMaterials and Supplies
InventoriesWorking Cash
2016 SDP Conference
Importance of Working Cash Analysis
Working cash can change significantly asoperations change
There are multiple methodologies thatcan be used in calculating working cash
It is easy to rely on past methodologiesand to limit efforts to update analysis
Impacts of not updating working cash analysis:1. Reputation and Data Integrity
• Inaccuracy and misrepresentation of actual working capital requirements
2. Revenue Requirement• Loss of potential revenues if working capital increases and is not captured in ratecase

9/21/2016
13
2016 SDP Conference
Calculation Methodology
Lead / Lag Study(Revenue Lag Expense Lag)
ForecastedExpensesX
365 Days
Balance Sheet AccountsOperational
Cash Requirement
3rd PartyFunds+ -
Total Working Cash Requirement
-
2016 SDP Conference
Lead/Lag Study
The study uses historical data to determine the amount of investorfunds used to cover the timing difference between when expensesare paid and revenues are received
• Revenue Lag – The time between when service has beendelivered to when the customer’s cash payment has beenreceived
• Expense Lag– The time between when costs have beenrecorded to the date of payment for the expenses
The difference between the revenue and expense lags are multipliedby the average of daily operating expenses

9/21/2016
14
2016 SDP Conference
Lead Lag Calculation Example
5‐Day Net Lead : ($1B / 365 days) x (+ 5 days) = $13.7 million
5‐Day Net Lag : ($1B / 365 days) x ( ‐ 5 days) = ($13.7 million)
5‐Day Lead: WC Requirement (Positive Rate Base)
Illustrative Purposes Only:
Revenue Lag = 40 days
Expense Lag = 45 days
Expense Lag = 35 days5‐Day Lag: WC Benefit(Negative Rate Base)
Avg Annual Exp = $1B
* Working Cash calculation example does not include additions for working capital requirements and deductions for 3rd party funds
Working Cash* = (Avg. Daily Exp) x (Rev Lag ‐ Exp Lag)
2016 SDP Conference
Operational Cash Requirement
Current Assets – Current Liabilities
• Non‐interest bearing amounts for day to day operations that aresupplied by investors, recoverable from ratepayers, and whosecarrying costs are not recovered elsewhere from ratepayers
• Non‐interest bearing amounts that are not supplied byshareholders, recoverable from ratepayers, where the utility hasaccess to funds as working cash
Add
Subtract

9/21/2016
15
2016 SDP Conference
Revenue Analysis Review
Revenue analysis typically includes:
1. Review and evaluation of previousrevenue lag methodology
2. Definition of alternative approaches
• AR to sales ratio
• AR aging
• Actual billing data
3. Determine method or methods to be used for filing
4. Calculate revenue lag based upon method(s) selected
Revenues ExpensesBalance Sheet Accounts
1. Service Period Lag:
• Refers to the time period that electricity is delivered to customers• It extends from the beginning of the Service Period (i.e. from
previous meter read date) to the end of the Service Period when themeter is again read
2. Billing Lag:
• Represents the avg. number of days from the end of a service periodwhen the meter is read to the time the Customer Bill is generated
• This time period includes the time to post the meter read, calculate the usage, process exceptions, service bill the customer, and the time to consolidate the service bills for customer billing.
3. Collection Lag:
• Represents the avg. number of days from the generation of the Customer Bill to the time the Customer Payment is received
4. Bank Clearing Lag:
• Avg. number of days from receipt of Customer Payment to the availability of the funds in the bank
Lag Components
2016 SDP Conference
Expenses Analysis Review
Expense analysis typically includes:
1.Fuel, purchased power and purchased gas
2.Labor:
• Payroll and payroll taxes
• Incentive compensation
3.Goods and services
4.Pension & PBOPs
5. Income and property taxes
6.Franchise fees
Revenues ExpensesBalance Sheet Accounts
1. Recorded History
• Remove anomalies
2. New Contracting Terms
• Timing of future expenses may be differ
3. Changes in ISO Processes
• Accelerated payment requirements
Expense Considerations

9/21/2016
16
2016 SDP Conference
Balance Sheet Accounts Analysis Review
Balance Sheet Accounts analysis typically includes account by account review to identify:
1.Operational Cash Requirements:
• Minimum cash balance
• Special deposits
• Prepayments
• Balancing accounts and other deferred debits
2.Third Party Funds:
• Paid absence
• Healthcare/dependent care reimbursement (FSA Accounts)
• Utility user taxes
• Injuries, damages and workers compensation reserves
Revenues ExpensesBalance Sheet Accounts
2016 SDP Conference
Working Cash ExampleIllustrative Purposes Only:
Key Contributing Factors:
1. Increase Revenue Lag by 3 days
2. Decrease Expense Lag by 11 days:
• Purchased power
• Labor and bonuses
• Pension & PBOP
• Federal income tax
3. Increase in expenditure levels
9/21/2016
17
Q&A
2016 SDP Conference
Andy Strasner
Utility Consulting Group, LLC23679 Calabasas Rd #263Calabasas, CA 91302 www.ucgsolutions.com
Tel: 310-779-0198Fax: 213.596.0508
Utility Consulting Group, LLC
23679 Calabasas Road #263
Calabasas, California 91302
Website: www.ucgsolutions.com
David White
Utility Consulting Group, LLC23679 Calabasas Rd #263Calabasas, CA 91302 www.ucgsolutions.com
Tel: 818.324.4149Fax: 213.596.0508
Contact Information

Section 8 Click to jump back to Table of Contents

9/21/2016
1
Proprietary InformationSubject to Confidentiality Agreements
Early Plant Retirement Accounting Considerations
SDP ConferenceCharleston, SC
September 19-20, 2016
Proprietary InformationSubject to Confidentiality Agreements
Agenda Welcome and Introduction
Background
Overview of normal retirement accounting
Overview of Abandonment Accounting
Early Plant Retirement Considerations
Mass Asset Account Retirements
2

9/21/2016
2
Proprietary InformationSubject to Confidentiality Agreements
Background Many utilities are evaluating their generation plant in light of new EPA issued and
pending rules Additionally, a regulated utility may decide to abandon construction of plant in service for
varying reasons due to load demand changes, change in resources, increasing cost orother factors
One strategy to comply with EPA mandates are to evaluate early retirements – i.e.earlier than lives/terminal dates utilized in recently approved depreciation studies
Additionally, many utilities are building “the utility of the future” or otherwise knownas Smart Grid, requiring full replacements of mass assets, i.e. meters This generally results in replacements of assets at an accelerated pace, often to achieve
O&M savings, enable new technologies, etc.
In these early retirement scenarios, utility companies must consider whetherabandonment accounting applies to the situation
2
Proprietary InformationSubject to Confidentiality Agreements
Normal Retirement Accounting When regulated utilities retire a regulated plant under a normal retirement,
the original cost plus the cost of retirement, less salvage value, is charged toaccumulated depreciation, consistent with regulated rate-making practices.
Residual amounts are typically recovered via reserveadjustments/reallocations within the depreciation group or capital recoveryschedules
This process “recovers” the asset (brings to zero) and allocates residualdebits or credits to other plant assets in the group
3

9/21/2016
3
Normal Retirement Accounting Example (FERC)
Assumptions: Plant to be retired: Cost $100M Reserve $95M NBV $5M Cost of removal - $15M Salvage - $10M
$10M debit remaining in Account 108 after retirement - will be allocated amongst otherassets in group, or reallocated to other groups
Journal Entries:1. Accumulated Depreciation (108) $100M
EPIS (101) $100MRetire Asset as fully depreciated
2. Accumulated Depreciation (108) $5MCash $5M
Net salvage recorded to 108
5
Proprietary InformationSubject to Confidentiality Agreements
Abandonment AccountingASC 980-360-35 provides guidance on accounting for abandonments by regulated
utilities
35-1 – “When it becomes probable (likely to occur) that an operating asset or an asset under construction will be abandoned, the cost of that asset [and related accumulated depreciation] shall be removed from construction work-in process or plant-in-service.” Typically “likely to occur” is at least 70% probable
35-2 - The entity shall determine whether recovery of any allowed cost is likely to be provided with either of the following:
a. Full return on investment during the period from the time when abandonment becomes probable to the time when recovery is completedb. Partial or no return on investment during that period.
2

9/21/2016
4
Proprietary InformationSubject to Confidentiality Agreements
Abandonment Accounting, contDetermination of recovery
Focus on the facts and circumstances related to the specific abandonment
Consider the past practice and current policies of the applicable regulatory jurisdiction on abandonment situations.
Full return on investment is likely to be provided
Any disallowance of all or part of the cost of the abandoned plant that is both probable and reasonably estimable shall be recognized as a loss
Carrying basis of the recorded asset shall be correspondingly reduced
The remainder of the cost of the abandoned plant shall be reported as a separate new asset.
Assessed on GAAP NBV (excludes COR reserved for dismantlement)
2
Proprietary InformationSubject to Confidentiality Agreements
Abandonment Accounting, cont.Partial or no return on investment is likely to be provided
Any disallowance of all or part of the cost of the abandoned plant that is both probable and reasonably estimable shall be recognized as a loss.
Timing of recognition is important
Loss typically charged to 426.5 Other deductions
The present value of the future revenues expected to be provided to recover the allowable cost of that abandoned plant and return on investment, if any, shall be reported as a separate new asset
Any excess of the remainder of the cost of the abandoned plant over that present value also shall be recognized as a loss.
2
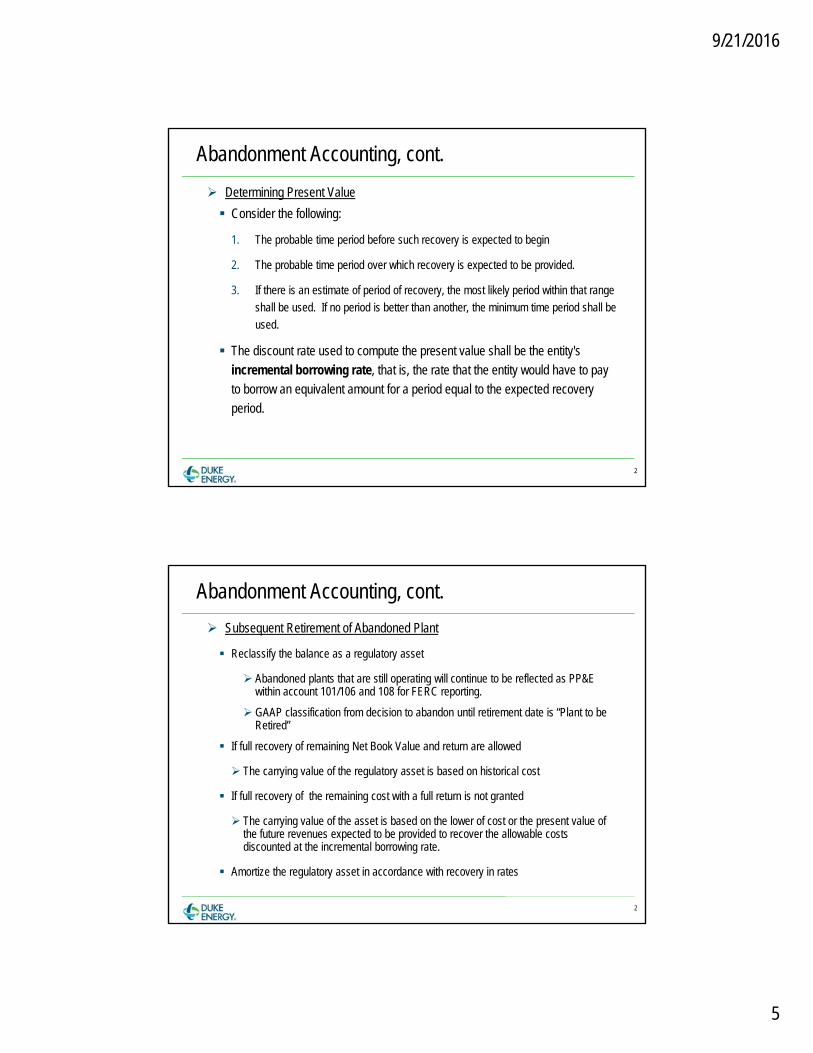
9/21/2016
5
Proprietary InformationSubject to Confidentiality Agreements
Abandonment Accounting, cont. Determining Present Value Consider the following:
1. The probable time period before such recovery is expected to begin
2. The probable time period over which recovery is expected to be provided.
3. If there is an estimate of period of recovery, the most likely period within that rangeshall be used. If no period is better than another, the minimum time period shall beused.
The discount rate used to compute the present value shall be the entity'sincremental borrowing rate, that is, the rate that the entity would have to payto borrow an equivalent amount for a period equal to the expected recoveryperiod.
2
Proprietary InformationSubject to Confidentiality Agreements
Abandonment Accounting, cont. Subsequent Retirement of Abandoned Plant
Reclassify the balance as a regulatory asset
Abandoned plants that are still operating will continue to be reflected as PP&Ewithin account 101/106 and 108 for FERC reporting.
GAAP classification from decision to abandon until retirement date is “Plant to beRetired”
If full recovery of remaining Net Book Value and return are allowed
The carrying value of the regulatory asset is based on historical cost
If full recovery of the remaining cost with a full return is not granted
The carrying value of the asset is based on the lower of cost or the present value ofthe future revenues expected to be provided to recover the allowable costsdiscounted at the incremental borrowing rate.
Amortize the regulatory asset in accordance with recovery in rates
2

9/21/2016
6
Abandonment Accounting Example
Assumptions:At Decision to Abandon: Cost $500M FERC NBV: $150M Life Reserve $300M GAAP NBV:$200M COR Reserve $50M Present Value of Future Revenues $180M
Journal Entries:1. Recognize $20M loss to reduce NBV to $180M2. For GAAP Reporting, reclassify NBV to “Plant to be Retired” until actual retirement
date.3. At retirement date, move remaining balance to Regulatory Asset4. Amortize regulatory asset in accordance with treatment in rates
11
Proprietary InformationSubject to Confidentiality Agreements
Early Plant Retirement Considerations
Determination of whether plant is abandoned
1. Estimated plant retirement dates embedded in the existing depreciationstudies
2. Reduction in estimated remaining depreciable life much earlier thanpreviously expected
3. Number of years of operation remaining prior to retirement
4. Total years of operation of the plant/unit, and number of years being retiredearly relative to this total (i.e. 5 years early of a 60 year total life)
5. Estimated PP&E net book value based on an allocation of the current groupreserve balance using the assumptions embedded in the most recentdepreciation study
2

9/21/2016
7
Proprietary InformationSubject to Confidentiality Agreements
Mass Asset Account Retirements Mass account retirements must be considered under plant abandonment treatment
Retirement dates are spread over period of time as opposed to generation facilitiesthat retire on specific date
Meters – many utilities are replacing electromechanical or AMR meters for AMIinfrastructure
Considerations on applying abandonment accounting on meters: Pace meters will be replaced (i.e. how many years?)
Compare this pace to normal replacement schedule
Consider life in current depreciation study, annual purchases, churn of meters
Same abandonment and recovery issues apply to mass accounts
2
Proprietary InformationSubject to Confidentiality Agreements
Questions?
2

Section 9 Click to jump back to Table of Contents

9/21/2016
1
Society of Depreciation Professional2016
Accounting UpdateJohn M. Lacey
Professor of Accountancy andErnst & Young Research Fellow
California State University, Long [email protected]
© John M. Lacey 2016
Directions of Accounting Standards• Rules-Based Versus Principles-Based Accounting
Standards
• International Accounting Standards
• Move Toward Fair Value Accounting
• Accountants’ Changing Approach to Uncertainty
• XBRL Reporting System
• Different Standards for Non-Public/SME Companies
2

9/21/2016
2
SEC Speech at the USC SEC Conference this Year
• Focus on how management, audit committees, auditors, and other constituents can reinforce the credibility, reliability, and usefulness of financial reporting for investors.
© John M. Lacey 2016 3
SEC Speech at the USC SEC Conference this Year
• Implementation activities for new revenue recognition and leasing standards;
• Continued focus on internal control over financial reporting (ICFR);
• Opportunities to provide input to the PCAOB; and
• Continued vigilance on the responsibilities for maintaining auditor independence.
© John M. Lacey 2016 4

9/21/2016
3
© John M. Lacey 2016
What is happening with small business reporting?
• In May 2012, the FAF Board of Trustees issued a final report, Establishment of the Private Company Council.
• The PCC was created to improve the standard-setting process for private companies.
• PCC first meeting on December 6, 2012
5
What is happening with small business reporting?
• Private Company Council (PCC) is working jointly with FASB, using the newly issued framework, to develop, deliberate, and formally vote on proposed exceptions or modifications to U.S. GAAP for private companies.
© John M. Lacey 2016 6

9/21/2016
4
Private Company Decision-Making Framework
© John M. Lacey 2016 7
How might standards differ?
a. Recognition and measurement
b. Disclosures
c. Display (or presentation)
d. Effective date
e. Transition method.
© John M. Lacey 2016 8

9/21/2016
5
PCC Projects Completed
• 1. Update No. 2014-02, Intangibles—Goodwill and Other (Topic 350): Accounting for Goodwill
• 2. Update No. 2014-03, Derivatives and Hedging (Topic 815): Accounting for Certain Receive-Variable, Pay-Fixed Interest Rate Swaps—Simplified Hedge Accounting Approach
© John M. Lacey 2016 9
PCC Projects Completed
• 3. Update No. 2014-07, Consolidation (Topic 810): Applying Variable Interest Entities Guidance to Common Control Leasing Arrangements
• 4. Update No. 2014-18, Business Combinations (Topic 805): Accounting for Identifiable Intangible Assets in a Business Combination.
• All are now effective immediately and the preferability assessment is dropped for initial adoption.
© John M. Lacey 2016 10

9/21/2016
6
© John M. Lacey 2016
What is happening with small business reporting at IASB?
• IASB
– The IASB has separate standards for Small & Medium Sized Enterprise (SME)
– These standard may be used in the US now by non-public companies if the parties involved in the financial reporting process agree.
– IASB is considering Micro GAAP
11
AICPA OCBOA Project
• Financial Reporting Framework for Small and Medium-Sized Entities
• Alternative to GAAP financial statements for smaller companies that do not need GAAP statements
© John M. Lacey 2016 12

9/21/2016
7
Six Accounting Frameworks?
• US GAAP
• PCC GAAP
• AICPA OCBOA
• IFRS
• IFRS for SMEs
• Accounting for Micro Entities
© John M. Lacey 2016 13
What projects have recently been completed at the
FASB?
© John M. Lacey 2016 14

9/21/2016
8
What projects have recently been completed at the FASB?
© John M. Lacey 2016 15
• Not-for Profit Entities: Presentation of Financial Statements for Not-for-Profit Entities 2016-14
• Financial Instruments – Credit Losses: Measurement of Credit Losses on Financial Instruments 2016-13
• Revenue from Contracts with Customers: Narrow Scope Improvement and Practical Expedients 2016-12
What projects have recently been completed at the FASB?
© John M. Lacey 2016 16
• Revenue from Contracts with Customers: Identifying Performance Obligations and Licensing 2016 - 10
• Compensation – Stock Compensation –Improvements to Employee Share-Based Payment Accounting 2016-09
• Revenue from Contracts with Customers: Principal versus Agent Considerations –2016-08

9/21/2016
9
What projects have recently been completed at the FASB?
© John M. Lacey 2016 17
• Investments – Equity Method and Joint Ventures – Simplifying the Transition to the Equity Method of Accounting 2016-07
• Leases 2016-02
• Accounting for Financial Instruments –Overall 2016-01
What projects have recently been completed at the FASB?
© John M. Lacey 2016 18
• Income Taxes Balance Sheet Classification of Deferred Taxes 2015-17
• Business Combinations: Simplifying the Accounting for Measurement-Period Adjustments 2015-16

9/21/2016
10
What projects have recently been completed at the FASB?
© John M. Lacey 2016 19
• Revenue from Contracts with Customers: Deferral of Effective Date 2015-14
• Inventory: Simplifying the Measurement of Inventory 2015-11
• Compensation – Retirement Benefits: Practical Expedient for the Measurement Date of an Employer’s Defined Benefit Obligation and Plan Assets 2015-04
What projects have recently been completed at the FASB?
© John M. Lacey 2016 20
• Interest – Imputation of Interest: Simplifying Presentation of Debt Issuance Costs 2015-03
• Consolidation: Amendments to Consolidation Analysis 2015-02
• Income Statement – Extraordinary and Unusual Items: Simplifying Income Statement Presentation by Eliminating Extraordinary Items 2015-01

9/21/2016
11
What Projects are on the FASB Agenda?
© John M. Lacey 2016 21
© John M. Lacey 2016 22
What Projects are on the FASB Agenda?
• Framework Projects
• Recognition and Measurement Projects
• Presentation and Disclosure Projects
• Research Projects

9/21/2016
12
FRAMEWORK PROJECTS
© John M. Lacey 2016 23
• Conceptual Framework: Measurement
• Conceptual Framework: Presentation
• Disclosure Framework: Board's Decision Process
RECOGNITION & MEASUREMENT: BROAD PROJECTS
• Accounting for Financial Instruments: Hedging
• Insurance: Targeted Improvements to the Accounting for Long-Duration Contracts
24© John M. Lacey 2016

9/21/2016
13
RECOGNITION & MEASUREMENT: NARROW PROJECTS
© John M. Lacey 2016 25
• Accounting for Goodwill Impairment
• Accounting for Identifiable Intangible Assets in a Business Combination for Public Business Entities and Not-for-Profit Entities
• Accounting for Income Taxes: Intra-Entity Asset Transfers and Balance Sheet
• Accounting for Interest Income Associated with the Purchase of Callable Debt Securities
RECOGNITION & MEASUREMENT: NARROW PROJECTS
© John M. Lacey 2016 26
• Clarifying the Definition of a Business (Phase 1)
• Clarifying the Scope of Subtopic 610-20 and Accounting for Partial Sales of Nonfinancial Assets (Formerly Clarifying the Definition of a Business Phase 2)
• Clarifying When a Not-for-Profit Entity That is a General Partner Should Consolidate a For-profit Limited Partnership (or Similar Entity)

9/21/2016
14
RECOGNITION & MEASUREMENT: NARROW PROJECTS
© John M. Lacey 2016 27
• Consolidation: Interests Held Through Related Parties That Are Under Common Control
• Liabilities & Equity— Targeted Improvements
• Nonemployee Share-Based Payment Accounting Improvements
• Revenue Recognition of Grants and Contracts by Not-For-Profit Entities
• Scope of Modification Accounting in Topic 718
RECOGNITION & MEASUREMENT: NARROW PROJECTS
© John M. Lacey 2016 28
• Subsequent Accounting for Goodwill for Public Business Entities and Not-For-Profit Entities
• Technical Corrections and Improvements
• Technical Corrections And Improvements—Update 2014-09, Revenue From Contracts With Customers

9/21/2016
15
PRESENTATION & DISCLOSURE PROJECTS
© John M. Lacey 2016 29
• Improving the Presentation of Net Periodic Pension Cost and Net Periodic Postretirement Benefit Cost
• Financial Statements of Not-for-Profit Entities (Phase 2)
• Disclosure by Business Entities about Government Assistance
PRESENTATION & DISCLOSURE PROJECTS
© John M. Lacey 2016 30
• Simplifying the Balance Sheet Classification of Debt
• Disclosure Framework: Entity's Decision Process
• Disclosure Framework: Disclosure Review—Defined Benefit Plans, Fair Value Measurement, Income Taxes, Inventory, Interim Reporting

9/21/2016
16
RESEARCH PROJECTS
© John M. Lacey 2016 31
• Accounting for Financial Instruments: Interest Rate Risk Disclosures
• Accounting for Income Taxes: Presentation of Tax Expense/Benefit
• Applying Variable Interest Guidance to Entities under Common Control
• Consolidation
• Distinguishing Liabilities from Equity (including convertible debt)
RESEARCH PROJECTS
© John M. Lacey 2016 32
• Financial Performance Reporting (formerly Financial Statement Presentation)
• Intangible Assets
• Inventory and Cost of Sales
• Pensions and Other Postretirement Employee Benefit Plans

9/21/2016
17
FASB New Pronouncements
© John M. Lacey 2016 33
Disclosure of Uncertainties about an Entity’s Going Concern Presumption
2014-15
© John M. Lacey 2016 34

9/21/2016
18
Isn’t this an auditing standard?
It was, but no more!
Each annual and interim reporting period, an entity’s management should evaluate whether there are conditions or events, considered in the aggregate, that raise substantial doubt about the entity’s ability to continue as a going concern within one year after the date that the financial statements are issued.
© John M. Lacey 2016 35
What should management consider?
Management’s evaluation should be based on relevant conditions and events that are known and reasonably knowable at the date that the financial statements are issued.
Probable that the entity will be unable to meet its obligations as they become due within one year after the date that the financial statements are issued.
© John M. Lacey 2016 36

9/21/2016
19
What if there is substantial doubt, but it does not rise to the level of probable?
If conditions or events raise substantial doubt about an entity’s ability to continue as a going concern, but the substantial doubt is alleviated as a result of consideration of management’s plans, the entity should disclose information that enables users of the financial statements to understand the substantial doubt and management’s plan to mitigate the problem (or not).
© John M. Lacey 2016 37
When does all of this happen?
The amendments in this Update are effective for the annual period ending after December 15, 2016, and for annual periods and interim periods thereafter.
Early application is permitted.
© John M. Lacey 2016 38

9/21/2016
20
Revenue from Contracts With Customers
2014-09
© John M. Lacey 2016 39
Revenue Recognition: What’s the Problem?
• IFRS & US GAAP differ and both are deficient
• Unclear principles
– “Earnings process” in US (around 200 pieces of authoritative guidance)
– “Risks and rewards” in IFRS
• Inconsistent principles
– IASs 11 & 18
– Difficult to interpret
Simple contracts are not the problem!40© John M. Lacey 2016
kbb6

9/21/2016
21
Is this happening soon?
Yes and No.
Public organizations: Effective for annual reporting periods beginning after December 15, 2017, including interim reporting periods. Early application is permitted for annual and interim periods beginning after December 15, 2016.
Nonpublic Effective for annual reporting periods beginning after December 15, 2018, and interims. Same early election dates.
© John M. Lacey 2016 41
What are the general revenue recognition standards now?
© John M. Lacey 2016 42

9/21/2016
22
Revenue Recognition• IASB - Products
– Transfer of significant risks and rewards of ownership
– Retains neither continuing managerial involvement like ownership nor control
– Amount of revenue can be reliably measured
– Probable that economic benefits will flow to seller
– Remaining costs can be estimated© John M. Lacey 2016
Revenue Recognition
• IASB - Services– Stage of completion can be reliably
measured
– Amount of revenue can be reliably measured
– Probable that economic benefits will flow to seller
– Remaining costs can be estimated
© John M. Lacey 2016

9/21/2016
23
Revenue Recognition
• FASB – Evidence of an arrangement between
buyer and seller
– Product delivered or service rendered
– Price is determined or determinable
– Collectability is reasonably assured
© John M. Lacey 2016
How will the new standard change things?
• The new standard applies to revenue recognition for contracts.
• Then new standard will not change revenue recognition for sale of cornflakes at the grocery store!
© John M. Lacey 2016 46

9/21/2016
24
There are five steps in the new revenue recognition standard for contracts.
© John M. Lacey 2016 47
What are the steps?
To apply that principle, an entity would:
(a) Identify the contract(s) with a customer;
(b) identify the separate performance obligations in the contract;
(c) determine the transaction price;
(d) Allocate the transaction price to the performance obligations in the contract.; and
(e) recognize revenue when (or as) the entity satisfies a performance obligation.
© John M. Lacey 2016 48

9/21/2016
25
Step 1: Identify the contract(s) with a customer
• A contract is an agreement between two or more parties that creates enforceable rights and obligations.
– In some cases, an entity should combine contracts and account for them as one contract.
– In addition, there is guidance on the accounting for contract modifications.
© John M. Lacey 2016 49
Step 1: Identify the contract(s) with a customer
Apply the requirements to each contract
that meets the following criteria:
1. Approval and commitment of the parties
2. Identification of the rights of the parties
3. Identification of the payment terms
4. The contract has commercial substance
5. It is probable that the entity will collect the consideration to which it will be entitled in exchange for the goods or services that will be transferred to the customer.
© John M. Lacey 2016 50

9/21/2016
26
Step 2: Identify separate performance obligations in contract• A performance obligation is a promise to transfer
a good or service to the customer.
• If an entity promises in a contract to transfer more than one good or service to the customer, the entity should account for each promised good or service as a performance obligation only if it is (1) distinct or (2) a series of distinct goods or services that are substantially the same and have the same pattern of transfer.
© John M. Lacey 2016 51
Step 2: Identify separate performance obligations in contract• If a promised good or service is not distinct, an entity
would combine that good or service with other promised goods or services until the entity identifies a bundle of goods or services that is distinct.
– In some cases, that would result in an entity accounting for all the goods or services promised in a contract as a single performance obligation.
© John M. Lacey 2016 52

9/21/2016
27
Step 3: Determine the transaction price
• The transaction price is
– the amount of consideration (for example, payment) to which an entity expects to be entitled
– in exchange for transferring promised goods or services to a customer,
– excluding amounts collected on behalf of third parties.
© John M. Lacey 2016 53
Step 3: Determine the transaction price
• When determining the transaction price, an entity would consider the effects of the following:
1) Variable consideration
2) Constraining estimates of variable consideration;
3) The existence of a significant financing component;
4) noncash consideration; and
5) consideration payable to the customer.
© John M. Lacey 2016 54

9/21/2016
28
Step 4: Allocate the transaction price to performance obligations in the Contract
• Allocate in an amount that depicts the amount of consideration to which the entity expects to be entitled in exchange for satisfying each performance obligation.
• Determine standalone selling price at contract inception of good or service underlying each separate performance obligation and allocate on relative price.
• If a standalone selling price is not directly observable, the entity would estimate it.
© John M. Lacey 2016 55
Step 4: Allocate the transaction price to the separate performance obligations
• Allocate changes in the transaction price to separate performance obligations on the same basis as at inception. – Recognize in period when contract
price changes.
© John M. Lacey 2016 56

9/21/2016
29
Step 5: Recognize revenue when (or as) the entity satisfies a performance
obligation• By transferring a promised good or service to a
customer.
– A good or service is transferred when the customer obtains control of that good or service.
– For each separate performance obligation, an entity would determine whether the entity satisfies the performance obligation over time by transferring control of a good or service over time.
– If the entity does not satisfy a performance obligation over time, the performance obligation is satisfied at a point in time.
© John M. Lacey 2016 57
Step 5: Recognize revenue when (or as) the entity satisfies a performance
obligationAn entity transfers control of a good or service over if one of the following criteria is met:
1. The customer simultaneously receives and consumes the benefits provided.
2. The entity’s performance creates or enhances an asset (for example, work in process) that the customer controls.
3. The entity’s performance does not create an asset with an alternative use to the entity, and the entity has an enforceable right to payment for
performance completed to date© John M. Lacey 2016 58
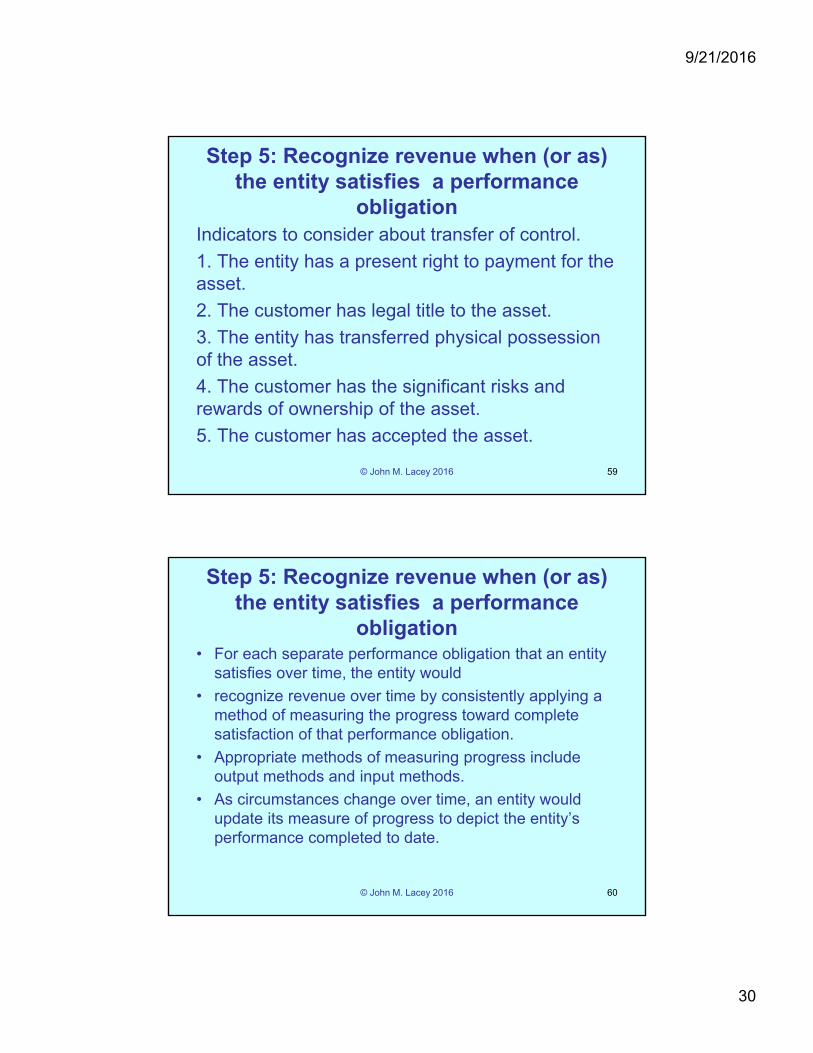
9/21/2016
30
Step 5: Recognize revenue when (or as) the entity satisfies a performance
obligationIndicators to consider about transfer of control.
1. The entity has a present right to payment for the asset.
2. The customer has legal title to the asset.
3. The entity has transferred physical possession of the asset.
4. The customer has the significant risks and rewards of ownership of the asset.
5. The customer has accepted the asset.
© John M. Lacey 2016 59
Step 5: Recognize revenue when (or as) the entity satisfies a performance
obligation• For each separate performance obligation that an entity
satisfies over time, the entity would
• recognize revenue over time by consistently applying a method of measuring the progress toward complete satisfaction of that performance obligation.
• Appropriate methods of measuring progress include output methods and input methods.
• As circumstances change over time, an entity would update its measure of progress to depict the entity’s performance completed to date.
© John M. Lacey 2016 60

9/21/2016
31
What else?
• Also specifies the accounting for some costs.
© John M. Lacey 2016 61
What has to be disclosed?An entity should disclose sufficient information to enable users of financial statements to understand the nature, amount, timing, and uncertainty of revenue and cash flows arising from contracts with customers.
© John M. Lacey 2016 62

9/21/2016
32
What has to be disclosed?
Qualitative and quantitative information about:
1. Contracts with customers—including revenue and impairments recognized, disaggregation of revenue, and information about contract balances and performance obligations
2. Significant judgments and changes determining timing of satisfaction of performance obligations (over time or at a point in time), and determining the transaction price and amounts allocated to performance obligations
3. Assets recognized from the costs to obtain or fulfill a contract.
© John M. Lacey 2016 63
When does all of this happen?
Public and some NFPs and others.
Effective for annual reporting periods beginning after December 15, 2017, including interims.
Earlier application is permitted only as of annual reporting periods beginning after December 15, 2016, including interims.
© John M. Lacey 2016 64

9/21/2016
33
When does all of this happen?
All others.
Effective for annual reporting periods beginning after December 15, 2018, including interims.
Earlier application is permitted only as of annual reporting periods beginning after December 15, 2016, including interims.
© John M. Lacey 2016 65
Much more judgment will be required than before.
© John M. Lacey 2016 66

9/21/2016
34
Simplifying the Measurement of Inventory
2015-11
© John M. Lacey 2014 67
Does this really simplify?
• Yes!
• It eliminates the complexities in lower-of-cost-or-market inventory computations.
• Becomes lower of cost of net realizable value, like IFRS.
© John M. Lacey 2016 68
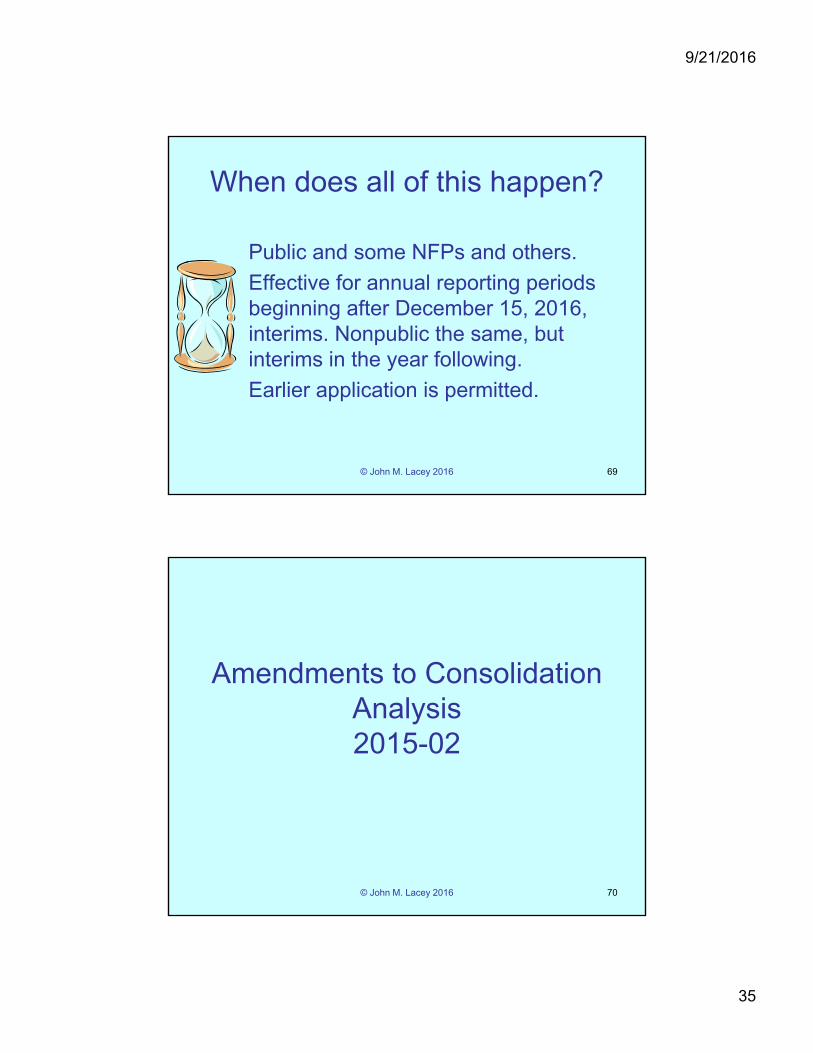
9/21/2016
35
When does all of this happen?
Public and some NFPs and others.
Effective for annual reporting periods beginning after December 15, 2016, interims. Nonpublic the same, but interims in the year following.
Earlier application is permitted.
© John M. Lacey 2016 69
Amendments to Consolidation Analysis2015-02
© John M. Lacey 2016 70

9/21/2016
36
What is this about?
1. Modify the evaluation of whether limited partnerships and similar legal entities are variable interest entities (VIEs) or voting interest entities
2. Eliminate the presumption that a general partner should consolidate a limited partnership
© John M. Lacey 2016 71
What is this about?
3. Affects the consolidation analysis of reporting entities that are involved with VIEs, particularly those that have fee arrangements and related party relationships
4. Provides a scope exception from consolidation guidance for reporting entities with interests in legal entities that are required to comply with or operate in accordance with requirements that are similar to those in Rule 2a-7 of the Investment Company Act of 1940 for registered money market funds.
© John M. Lacey 2016 72

9/21/2016
37
When do I have to worry about this?
• Public businesses for fiscal years, and for interim periods within those fiscal years, beginning after December 15, 2015.
• All others fiscal years beginning after December 15, 2016, and for interim periods the next fiscal year.
• Early adoption is permitted, including adoption in an interim period.
© John M. Lacey 2016 73
Accounting for Leases2016-02
© John M. Lacey 2016 74

9/21/2016
38
What were the objectives of the project?
• Comprehensively reconsider the guidance in FASB Statement No. 13, Accounting for Leases,
• To insure that investors and other users of financial statements are provided useful, transparent, and complete information about leasing transactions in the financial statements.
75© John M. Lacey 2016
How did this project progress?
• Added to agenda July 2006
• Joint project FASB/IASB on MoU
• Exposure Draft – Comments by 12/15/10
• Re-exposure 1st Q 2013
76© John M. Lacey 2016
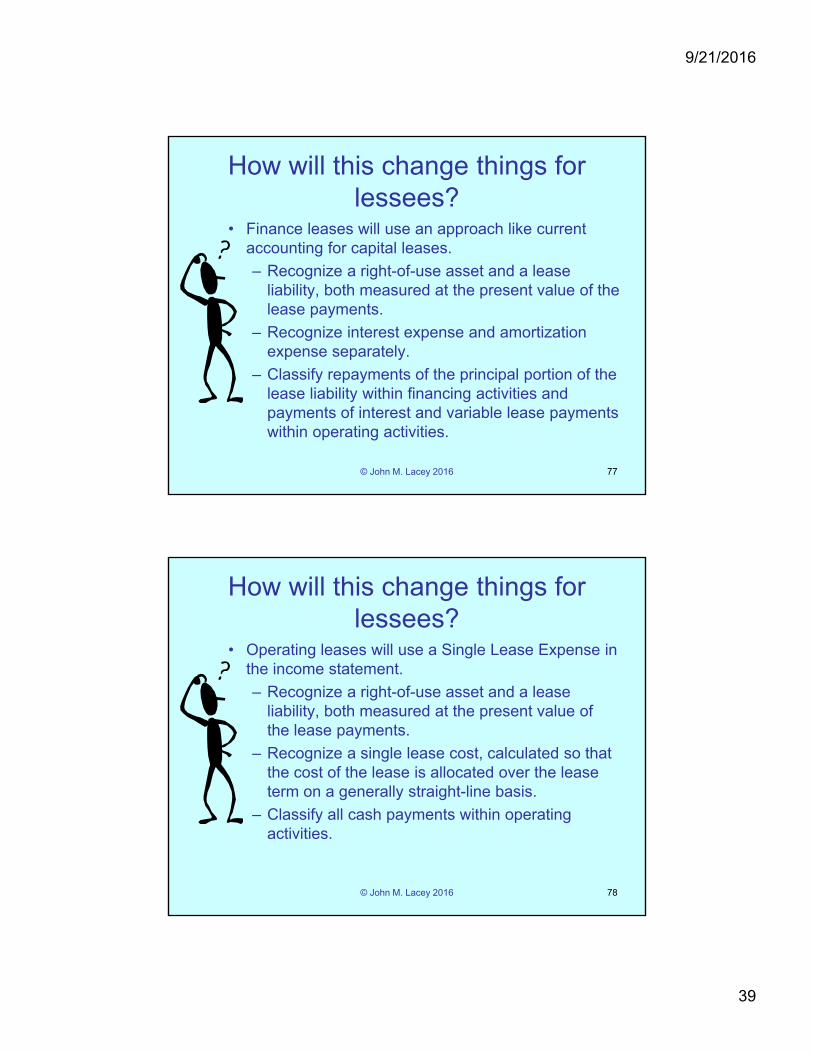
9/21/2016
39
• Finance leases will use an approach like current accounting for capital leases.
– Recognize a right-of-use asset and a lease liability, both measured at the present value of the lease payments.
– Recognize interest expense and amortization expense separately.
– Classify repayments of the principal portion of the lease liability within financing activities and payments of interest and variable lease payments within operating activities.
How will this change things for lessees?
77© John M. Lacey 2016
• Operating leases will use a Single Lease Expense in the income statement.
– Recognize a right-of-use asset and a lease liability, both measured at the present value of the lease payments.
– Recognize a single lease cost, calculated so that the cost of the lease is allocated over the lease term on a generally straight-line basis.
– Classify all cash payments within operating activities.
How will this change things for lessees?
78© John M. Lacey 2016

9/21/2016
40
How you decide which model to use?
• Distinguish between different leases based on whether lessee acquires and consumes more than insignificant portion of the underlying asset over lease term.
• Determination made at lease inception and not reassessed
© John M. Lacey 2016 79
How you decide which model to use?
• Leases of property (land or a building—or part of a building—or both) should be accounted for using the straight-line approach unless:
– The lease term is for the major part of the economic life of the underlying asset; or
– The present value of fixed lease payments accounts for substantially all of the fair value of the underlying asset.
© John M. Lacey 2016 80

9/21/2016
41
How you decide which model to use?
• Leases of assets other than property should be accounted for using an approach similar to that proposed in the 2010 leases Exposure Draft unless:
– The lease term is an insignificant portion of the economic life of the underlying asset; or
– The present value of the fixed lease payments is insignificant relative to the fair value of the underlying asset.
© John M. Lacey 2016 81
How about lessor accounting?
• Lessor accounting will be very similar to current lessor accounting.
© John M. Lacey 2016 82

9/21/2016
42
Are there any exceptions?
• Yes!
• For leases of 12 months or less, lessees and lessors would be able to apply simplified requirements.
• These will be accounted for as operating leases are now.
83© John M. Lacey 2016
When does all of this happen?
Public companies and certain other filers with the SEC - Effective for fiscal years beginning after December 15, 2018, including interims.
Earlier application is permitted.
© John M. Lacey 2016 84

9/21/2016
43
When does all of this happen?
All others.
Effective for fiscal years beginning after December 15, 2019, and interim periods for fiscal years beginning after December 15, 2020.
Earlier application is permitted.
© John M. Lacey 2016 85
Accounting for Financial Instruments – Overall
2016-01
© John M. Lacey 2016 86

9/21/2016
44
© John M. Lacey 2016 87
1. Requires equity investments (except those accounted for under the equity method of accounting or those that result in consolidation of the investee) to be measured at fair value with changes in fair value recognized in net income.
May choose to measure equity investments that do not have readily determinable fair values at cost minus impairment, if any, plus or minus changes resulting from observable price changes in orderly transactions for the identical or a similar investment of the same issuer.
Financial Instruments
© John M. Lacey 2016 88
2. Simplify the impairment assessment of equity investments without readily determinable fair values by requiring a qualitative assessment to identify impairment.
When a qualitative assessment indicates that impairment exists, an entity is required to measure the investment at fair value. 2
Financial Instruments

9/21/2016
45
Financial Instruments
3. Eliminate the requirement to disclose the fair value of financial instruments measured at amortized cost for entities that are not public business entities.
© John M. Lacey 2016 89
© John M. Lacey 2016 90
4. Eliminate the requirement for public business entities to disclose the method(s) and significant assumptions used to estimate the fair value that is required to be disclosed for financial instruments measured at amortized cost on the balance sheet.
Financial Instruments

9/21/2016
46
© John M. Lacey 2016 91
5. Require public business entities to use the exit price notion when measuring the fair value of financial instruments for disclosure purposes.
Financial Instruments
© John M. Lacey 2016 92
6. Require an entity to present separately in other comprehensive income the portion of the total change in the fair value of a liability resulting from a change in the instrument-specific credit risk when the entity has elected to measure the liability at fair value in accordance with the fair value option for financial instruments.
Financial Instruments
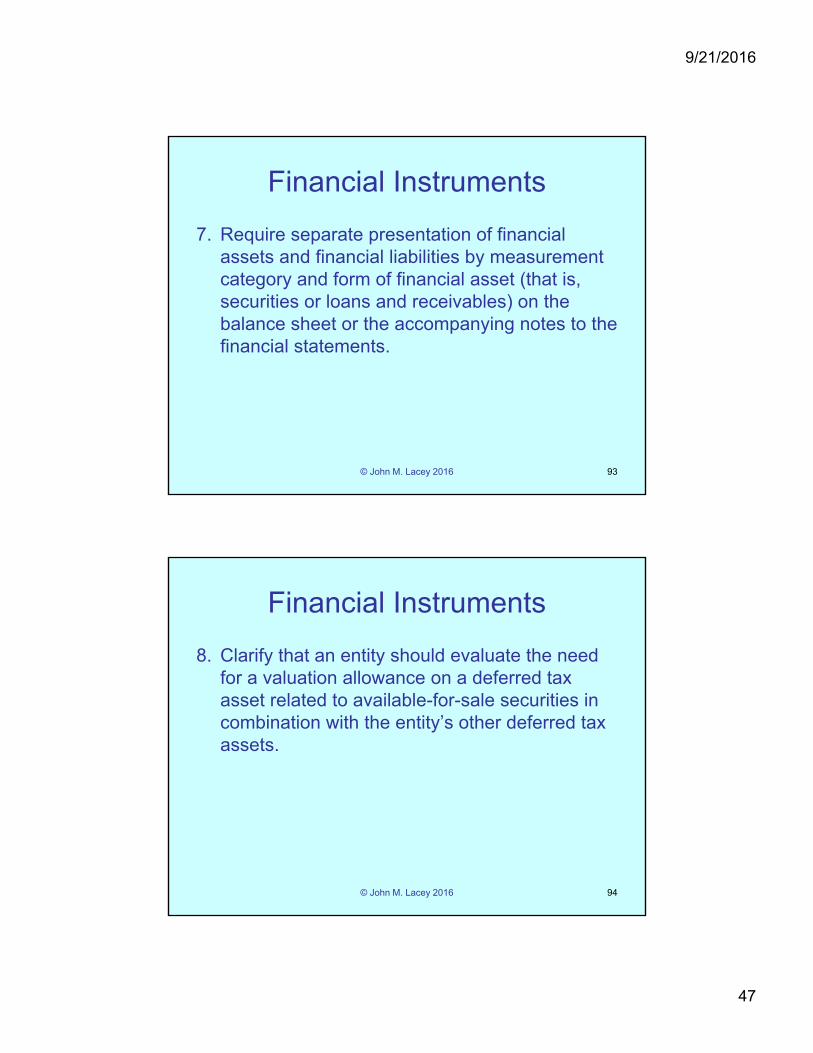
9/21/2016
47
© John M. Lacey 2016 93
7. Require separate presentation of financial assets and financial liabilities by measurement category and form of financial asset (that is, securities or loans and receivables) on the balance sheet or the accompanying notes to the financial statements.
Financial Instruments
© John M. Lacey 2016 94
8. Clarify that an entity should evaluate the need for a valuation allowance on a deferred tax asset related to available-for-sale securities in combination with the entity’s other deferred tax assets.
Financial Instruments