Embed Size (px)
Citation preview

Disclaimer: This report and the information therein is derived from selected public sources. Chain Reaction Research is an unincorporated project of Climate Advisers, Profundo, and Aidenvironment (individually and together, the "Sponsors"). The Sponsors believe the information in this report comes from reliable sources, but they do not guarantee the accuracy or completeness of this information, which is subject to change without notice, and nothing in this document shall be construed as such a guarantee. The statements reflect the current judgment of the authors of the relevant articles or features, and do not necessarily reflect the opinion of the Sponsors. The Sponsors disclaim any liability, joint or severable, arising from use of this document and its contents. Nothing herein shall constitute or be construed as an offering of financial instruments or as investment advice or recommendations by the Sponsors of an investment or other strategy (e.g., whether or not to “buy”, “sell”, or “hold” an investment). Employees of the Sponsors may hold positions in the companies, projects or investments covered by this report. No aspect of this report is based on the consideration of an investor or potential investor's individual circumstances. You should determine on your own whether you agree with the content of this document and any information or data provided by the Sponsors.
SE Asian Palm Oil Sector: Statistics Suggest Equity Overvalued | July 5, 2017
$400
$500
$600
$700
$800
$900
$1,000
$1,100
$1,200
$1,300
Jan
-07
Ap
r-0
8
Jul-
09
Oct
-10
Jan
-12
Ap
r-1
3
Jul-
14
Oct
-15
CPO Price
SE Asian Palm Oil Sector: Statistics Suggest Equity Overvalued July 5, 2017 This report estimates the impact of undeveloped land on the market cap of publicly-traded SE Asian palm oil companies. Our analysis shows that investors and analysts have factored profits not only from acquired developed land, but also potential future cash flows which could be generated from acquired undeveloped land into their estimates. However, under demand-driven No Deforestation, No Peat, No Exploitation (NDPE) commitments – which may influence 60 percent of the global market – supply-side constraints such as the Indonesian moratorium, investors and analysts may need to reduce their current estimates as some land banks become stranded and unlikely to generate future cashflows. These policies put undeveloped forest and peatland at risk of stranding, as shown in the Chain Reaction Research report Indonesian Palm Oil’s Stranded Assets: 10 Million Football Fields of Undevelopable Land. The report stated that 29 percent of Indonesia’s available corporate land bank could be stranded, equaling 6.1 million hectares (ha). This report distinguishes market capitalization changes from acquisition of already developed land versus acquisition of undeveloped land. This was shown by a regression analysis focused on 43 SE Asian palm oil companies’ profitability and market cap from 2010 to 2015. The results are statistically significant and financially material, as many companies have undeveloped land which may become stranded.
Key Findings
From 2010 to 2015, a 10 percent landbank expansion was associated with a 7.2 percent market cap change. Market cap and net profit were closely linked, as a 10 percent increase in net profit was tied to an 8.8 percent increase in market cap. Net profit in turn was related to an increasing landbank. A 10 percent growth in the company’s landbank was associated with a 4 percent increase in profits. Thus, 3.7 percent is the “indirect” impact of developed land-profit-market cap. This implies that less than 50 percent was already developed land.
10 percent undeveloped land relates to 3.5 percent market cap. The model isolated the statistical relationship between landbank and market cap, and eliminated the net profit-market cap relation. As prior to the NDPE, the market considered all land developable, irrespective of whether it was forested, peat land, or contested, now under current market conditions it would have to adjust. This is because forest and peat land are no longer developable under NDPE. Hence, a 10 percent forest/peat land may result in 3.5 percent market cap loss. Companies with 20 percent contested land may experience 7 percent market cap loss. Alternatively put, a 10 percent forested land acquisition, may not be expected to add 3.5 percent to market cap.
Conclusion: Due to stranded land risk, this analysis forecasts that the SE Asian palm oil business strategy where new land acquisition drives equity value will change. Instead, a new SE Asian palm oil business strategy may develop, characterized by more sustainable land-use and labor practices – but only if ‘leakage’ is controlled. Companies may focus instead on growth and yield improvements, cost management, seed efficiency, expansion to new geographies, industry consolidation, NDPE-compliant expansion and smallholder investment. However, the move to geographies which do not care about NDPE entails the risk of “leakage,” i.e. the production and distribution of non-certified palm oil. If leakage is addressed effectively, the end result may be a palm oil industry with both greater sustainability and greater shareholder returns.
Chain Reaction Research is a coalition of: Aidenvironment Climate Advisers Profundo 1320 19th Street NW, Suite 400 Washington, DC 20036 United States www.chainreactionresearch.com [email protected] Primary author: Milena Levicharova, Profundo Contributing authors: Tim Steinweg, Aidenvironment Gabriel Thoumi, CFA, FRM, Climate Advisers
8.7
9.7
10.7
11.7
12.7
13.7
3.5 5.5 7.5 9.5
Significant relationship: Land (vertical) vs Market Cap
(horizontal), in logarithms

SE Asian Palm Oil Sector: Statistics Suggest Equity Overvalued | July 5, 2017 |2
Introduction
This report answers the question of how “stranded land” could impact the market capitalization of the SE Asian palm oil sector. The previous Chain Reaction Research analysis Indonesian Palm Oil’s Stranded Assets: 10 Million Football Fields of Undevelopable Land found that 29 percent of the landbank for palm oil in Indonesia may be stranded due to supply-side government regulations and demand-side NDPE policies. The subsequent report Palm Oil Sector’s Growth Affected by Proposed Moratorium in Indonesia showed that new Government of Indonesia regulations may increase the amount of land considered stranded for further development. This report calculates the effect of landbank expansion on companies’ market cap in SE Asia from 2010 to 2015. The analysis distinguished the impact of land expansion from already-developed palm oil areas versus impact from undeveloped areas. The research faced a challenge in that palm oil companies often do not report separately on acquirement of developed vs. undeveloped land. To overcome this obstacle and estimate the impact of stranded undeveloped land, one must answer these questions:
What is the effect of land on net profit, shown below, route A?
In turn, what is the effect of the landbank-impacted net profit on market cap, shown below as route B?
These two questions distinguish the impact of developed land, as only this type of land contributes to net profit and subsequently to equity valuation. This is described below in Step 1.
What is the direct effect of land on market cap, shown below as route C, apart from impacting net profit?
Eventually, what is the total (direct + indirect) effect of land acquisitions? The third question is needed to distinguish the impact of undeveloped land on equity value. Therefore, we analyze the direct relationship between landbank change and equity value change. This is described in Step 2 below.
Step 1: Net Profit as a Function of Land
To estimate the effect of land on net profit, net profit has to be analyzed as a complex system or a function of various drivers including land. In isolation, land would be a biased estimator of profit. Therefore, this study conducted a regression analysis within a “structural equation model.” In this model, the outcomes of one analysis – Step 1 – become the inputs for a second, deeper analysis – Step 2. Putting multiple regression specifications through varied tests assesses which model fits the data best. These tests included observations of value inflation factors, R-Squared, AIC and BIC information indicators, log-likelihood ratios and others. The analysis showed that net profit is best determined by CPO price, revenue, hectares of land, current assets and leverage.
As shown in Figure 1 (below), with a 95 percent likelihood that the results below are not due to chance, the key variables are CPO price and Land.
𝑁𝑒𝑡 𝑃𝑟𝑜𝑓𝑖𝑡𝑖,𝑡 = 𝑎 + 𝑏1𝐿𝑎𝑛𝑑ℎ𝑎𝑖,𝑡
+ 𝑏2𝑊𝑖,𝑡 + 𝜀𝑖𝑡
𝑀𝑎𝑟𝑘𝑒𝑡 𝐶𝑎𝑝𝑖,𝑡
= 𝑐 + 𝑦1𝐿𝑎𝑛𝑑ℎ𝑎𝑖,𝑡
+ 𝑦2𝑁𝑒𝑡 𝑃𝑟𝑜𝑓𝑖𝑡𝑖,𝑡 +𝑦3𝑊𝑖,𝑡 + 𝑢𝑖𝑡
A simplified regression framework would look like this:
Details are presented in a methodological note available on page 7.
Land
Net Profit
Market Cap
b a
C
SE Asian Palm Oil Sector: Statistics Suggest Equity Overvalued | July 5, 2017 |3
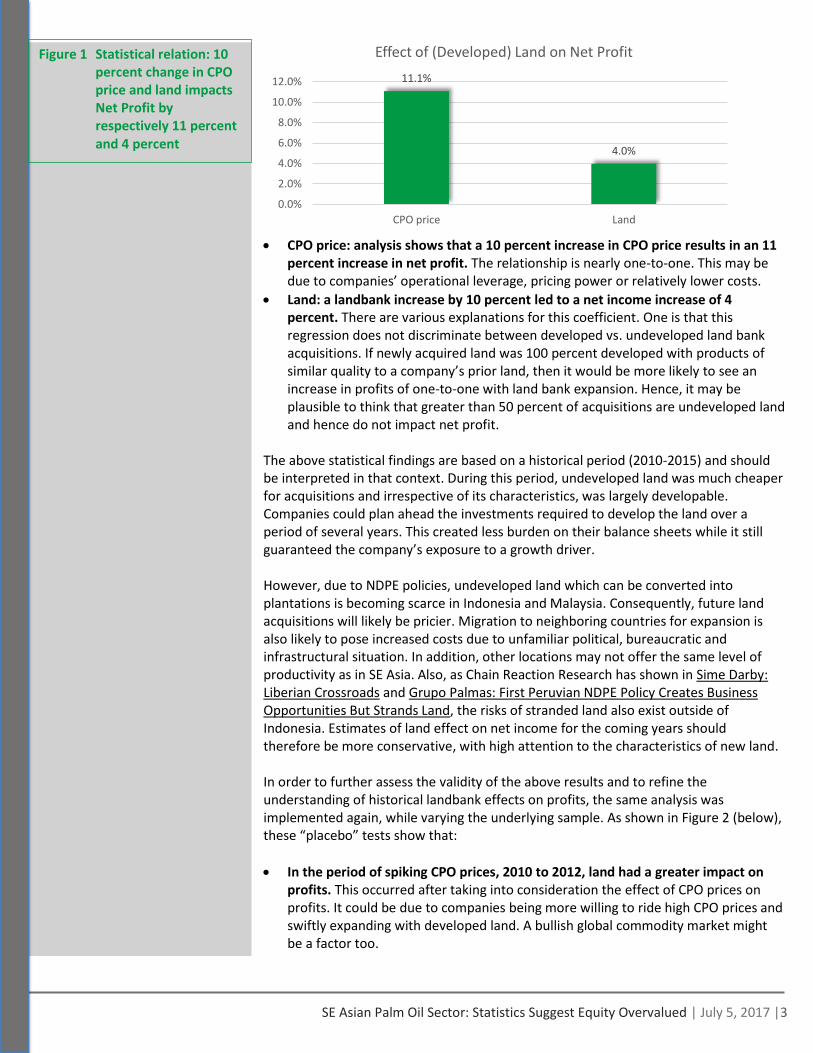
CPO price: analysis shows that a 10 percent increase in CPO price results in an 11
percent increase in net profit. The relationship is nearly one-to-one. This may be due to companies’ operational leverage, pricing power or relatively lower costs.
Land: a landbank increase by 10 percent led to a net income increase of 4 percent. There are various explanations for this coefficient. One is that this regression does not discriminate between developed vs. undeveloped land bank acquisitions. If newly acquired land was 100 percent developed with products of similar quality to a company’s prior land, then it would be more likely to see an increase in profits of one-to-one with land bank expansion. Hence, it may be plausible to think that greater than 50 percent of acquisitions are undeveloped land and hence do not impact net profit.
The above statistical findings are based on a historical period (2010-2015) and should be interpreted in that context. During this period, undeveloped land was much cheaper for acquisitions and irrespective of its characteristics, was largely developable. Companies could plan ahead the investments required to develop the land over a period of several years. This created less burden on their balance sheets while it still guaranteed the company’s exposure to a growth driver. However, due to NDPE policies, undeveloped land which can be converted into plantations is becoming scarce in Indonesia and Malaysia. Consequently, future land acquisitions will likely be pricier. Migration to neighboring countries for expansion is also likely to pose increased costs due to unfamiliar political, bureaucratic and infrastructural situation. In addition, other locations may not offer the same level of productivity as in SE Asia. Also, as Chain Reaction Research has shown in Sime Darby: Liberian Crossroads and Grupo Palmas: First Peruvian NDPE Policy Creates Business Opportunities But Strands Land, the risks of stranded land also exist outside of Indonesia. Estimates of land effect on net income for the coming years should therefore be more conservative, with high attention to the characteristics of new land. In order to further assess the validity of the above results and to refine the understanding of historical landbank effects on profits, the same analysis was implemented again, while varying the underlying sample. As shown in Figure 2 (below), these “placebo” tests show that:
In the period of spiking CPO prices, 2010 to 2012, land had a greater impact on profits. This occurred after taking into consideration the effect of CPO prices on profits. It could be due to companies being more willing to ride high CPO prices and swiftly expanding with developed land. A bullish global commodity market might be a factor too.
11.1%
4.0%
0.0%
2.0%
4.0%
6.0%
8.0%
10.0%
12.0%
CPO price Land
Effect of (Developed) Land on Net Profit Figure 1 Statistical relation: 10 percent change in CPO price and land impacts Net Profit by respectively 11 percent and 4 percent

SE Asian Palm Oil Sector: Statistics Suggest Equity Overvalued | July 5, 2017 |4
4.9%
2.9%
1.2%
3.7%
2.1%
3.4%
0.0%
1.0%
2.0%
3.0%
4.0%
5.0%
6.0%
2010 -2012
2013 -2015
Indonesia Malaysia Small caps Large caps
Effect of (Developed) Land on Net Profit
Tests shows that land impacts were stronger for Malaysian companies than for Indonesian companies. This may indicate differences in the landscape. Maybe more of the Malaysian land acquired was already being developed, while Indonesian acquisitions were focused on undeveloped land. This explanation is plausible, if we consider that any land affecting profits is already profitable and equally developed. Singapore-listed companies are also included in the analysis, and contributed to generalizations for SE Asia. However, there are too few to represent Singapore in isolation.
Firms with larger market cap (than the average in the sample) exhibit greater impact from changes in landbanks. The explanation is probably that larger, more established firms are more skilled in deriving profits from their acquisitions, and capable of spending more on “better land”.
The insights and results from this Step 1 become an input for Step 2, assessing the effect of land on market cap. We observe the effect of the land-impacted net profit on market cap and separately, any additional reaction of market cap to changes in land. In Step 2 we estimate both:
The effects of developed, profitable land on profit and then on equity value
Additional land effect on equity value, which is separate from profits, and can thus be theoretically considered a reaction to undeveloped, unprofitable, land.
Step 2: Market Cap as a Function of Land
Building on the analysis of Step 1, Step 2 applies several regression specifications. It assessed each with various tests including value inflation factors, R-Squared, AIC and BIC information indicators as well as log-likelihood ratios.
The analysis shows that market cap is best determined by net profit, land, leverage and return on common equity/ROE. All factors affecting profitability, as described in Step 1, are also included here in Step 2, but as routed through net profit. In other words, Step 2 uses the already land-impacted net profit as a driver of market cap plus the additional direct effect which land exerts on market cap, unrelated to profitability.
This type of analysis is called generalized structural equation modelling, with a mediating variable. The model is described in greater detail in the methodological note at the end of this paper. As shown in Figure 3 (below), with a 95 percent significance level, the key variables of interest are Net Income and Land:
Figure 2 Percentage change in Net Profit due to a 10 percent change in land, different samples

SE Asian Palm Oil Sector: Statistics Suggest Equity Overvalued | July 5, 2017 |5
Net profit: a 10 percent increase in profit was associated with an 8.8 percent increase in market cap. This is explained by a relatively efficient market responsive to profitability as well as by a company’s ability to pay higher dividends.
Land: a 10 percent increase in land was linked to a 3.5 percent direct increase in market cap. This is an isolated effect, unrelated to concurrent profitability. Thus, theoretically, it may be attributed to the future potential net cash flows which undeveloped land can generate. This effect is likely capturing the market reaction to such potential cash flows, i.e. discounting future cash flows which could stream through this land and therefore increase the value of the company.
The total land effect equals the direct plus the indirect one or 3.5 percent (Figure 3) + 88 percent (Figure 3) x 4.0 percent (Figure 1) = 7.2 percent, or a total of 7.2 percenti.
Acquiring developed land is more profitable, as it can boost share price further than undeveloped land. This is because already profitable land will immediately impact the companies’ bottom lines without delay. Understandably, the market cap is more responsive to this, as investors and analysts are better able to estimate land value, without guessing its characteristics, by directly seeing its profitability. This helps explain why a 10 percent increase in profits is related to a nearly one to one 8.8 percent increase in market cap. However, acquisitions of undeveloped land have a smaller 3.5 percent effect, if we assume that the above presented profitability-unrelated effect of land is indeed discounting future cash flows from yet undeveloped land. The difference in how the equity valuation responds to the two different asset types may be due to the possibility that undeveloped lands will take longer to develop, if at all, postponing the earnings further in time, with lower net present values. To further assess the validity of the above-mentioned results and to refine the understanding of landbank effects on market cap, as shown in Figure 4 (below), the same analysis was implemented again, while varying the underlying sample. The “placebo” tests show the direct effect of land on market cap, excluding the effect routed through net income. The shown effect is likely due to discounting potential future cash flows from undeveloped land.
i Due to rounding in each step of the estimations, there is a negligible rounding error presented above. Exact figures are
presented in the technical appendix.
8.8%
3.5%
0.0%
2.0%
4.0%
6.0%
8.0%
10.0%
Net Income Land
Direct effect of (Undeveloped) Land on Market Cap Figure 3 9 percent and 3.5 percent change in market cap due to a 10 percent change in net income, respectively in land

SE Asian Palm Oil Sector: Statistics Suggest Equity Overvalued | July 5, 2017 |6
From 2010 to 2012, land had a stronger effect on market cap. This was the period
when CPO prices were considerably higher, and the capital market was bullish. This may have been discounted into higher company valuations.
As was the case with the net profit analysis, Malaysian companies do exhibit a higher effect on market cap associated with landbanks, compared to Indonesian companies. It may be that the Malaysian stock market is somewhat more efficient, an effect coupled with the companies’ ability to likely acquire more expensive (already in development) land, or return higher free cash flows. The discrepancy, however, also implies that the Indonesian companies are pulling the average coefficient for the sample downward.
Land bank has a more pronounced effect on larger firms, which may also be due to their higher transparency, wider coverage, and capacity for economies of scale.
The joint effect of landbank increase, as routed through net income (from
developed plantations), and as direct effect on market cap (from discounting future cash flows from undeveloped land), reaffirms previously mentioned trends. Factors that intensify the effect of landbank on market cap/equity value are: a) years of high CPO prices; b) larger firms; and c) firms located in Malaysia.
Analysis in Present and Future Context
The empirical study did confirm the importance and relevance of land bank to palm oil stakeholders, suggesting a strong positive association between landbank, profits and market cap. The results presented are statistically significant (above 95 percent) as well as material. The key finding shows that a 10 percent landbank increase is related to a 3.5 percent increase in market cap, when such land generated no income at that moment, i.e. is undeveloped. This result may have two interpretations: (1) for any 10 percent undeveloped forest or peat land, a 3.5 percent market cap may be lost; (2) acquiring 10
4.6%
2.6%
1.2%
2.9%
2.1%
4.1%
0.0%
1.0%
2.0%
3.0%
4.0%
5.0%
2010 -2012
2013 -2015
Indonesia Malaysia Small caps Large caps
Direct effect of (Undeveloped) Land on Market Cap
8.7%
5.3%
2.2%
6.3%
3.8%
7.2%
0.0%
2.0%
4.0%
6.0%
8.0%
10.0%
2010 -2012
2013 -2015
Indonesia Malaysia Small caps Large caps
Total (direct + indirect) effect of 10% land on Market cap
Figure 4 Percentage change in Market Cap due to a 10 percent change in land
Figure 5 Total percentage change in Market Cap due to a 10 percent change in land

SE Asian Palm Oil Sector: Statistics Suggest Equity Overvalued | July 5, 2017 |7
percent new contested land may not be expected to lead to a 3.5 percent increase in market cap. These interpretations may hold true, as long as the following premises are true.
From 2010 to 2015, most of the forest and peat lands could still be converted to plantations due to less scrutiny, less restrictions and less regulation; The NDPE commitment was firstly established in 2014, and it took considerable time for producers to pick it up. This commitment, together with wider market awareness and regulation in the past 18 months is what renders such lands no longer developable; This is how 3.5 percent market cap may be lost for 10 percent contested land.
The market, represented by equity analysts and the investment community, considered these types of land developable. Especially sell side analysts widely disregarded the nature of newly acquired land, believing that increased landbanks were ultimately a profit driver. Examples include AmBank’s coverage on a KLK expansion in 2012, Genting Plantations expansion back in 2007 and many other. Many analysts communicated only the expected benefits of land expansions, disregarding the quality of the land. Such approach, however, does not appear very viable any longer, as multiple companies have seen their business contingent on high ESG and NDPE performance; this is why the market is likely to adapt and scrutinize the type of land acquired better. Thus, a 10 percent land gain should not be expected to result in market cap gain straightforwardly.
In present terms: forest and peat land is largely not developable, and the market may soon begin to adjust for that. This is a scenario which may play out: a company has “expanded” by 30 percent land, which however, is covered by forest or peat. If the market did discount potential free cash flows into its market cap (as the historical practice was), then this company may face 3 x 3.5 percent, or more than 10 percent market cap loss. Its land may become a stranded asset. The market applied a significant discount to any potential future cash flows which could have streamed from new undeveloped land. This is plausible, as there is some awareness that there are difficulties and hurdles such as securing all necessary permits prior to sourcing profits from new lands. In addition, such profits are also relatively remote in the future, as usually the first harvest can only occur 4 to 5 years after acquiring new undeveloped land. Thus, it is logical that uncertainty about successful land development and about CPO prices is a factor in determining stock prices. However, a simplified discounted cash flow model was juxtaposed to the results of the regression analysis, suggesting that there is no statistically significant difference between the discount placed on developable land vs contested undeveloped land. This supports the observation that the market was not (completely) perceptive of the importance of land characteristics during 2010 to 2015. The SE Asian palm oil sector may be on the verge of an adjustment period for stranded assets and company revaluations/re-ratings. Key is the industry transition to No Deforestation, No Peat, No Exploitation (NDPE) commitments. Sources suggest that up to 60 percent of the market requires palm oil companies to make NDPE commitments to sell their palm oil products. The biggest 25 commodity traders, providing the core market for palm oil, have also committed to NDPE. This makes it difficult for growers to find markets for NDPE non-complaint palm oil outside domestic and regional Asian markets.

SE Asian Palm Oil Sector: Statistics Suggest Equity Overvalued | July 5, 2017 |8
Many palm oil producers have expanded with undeveloped land, covered with forest and peat. Under NDPE, they will not be able to develop it. Historically, the statistical analysis suggests, that shareholders have welcomed and discounted future cash flows streaming from undeveloped land expansions. This is evident from the strong positive relation between land acquisitions and market cap. Presently, however, since this land cannot be developed, valuations may be adjusted downwards. The Chain Reaction Research report Indonesian Palm Oil’s Stranded Assets: 10 Million Football Fields of Undevelopable Land similarly found that 29 percent of the landbank for palm oil in Indonesia might be stranded due to supply-side government policies and demand-side NDPE. Thus, more than 3 x 3.5 percent, of more than 10 percent of the Indonesian palm oil equity value may be lost. It is possible that 7 percent market caps could be lost due to the landbank which cannot be developed given the NDPE environment. In Indonesia, 29 percent of the landbank may be stranded. In other parts of the world potential palm oil land may also be stranded, such as in Peru and Liberia. Assuming 20 percent of the global palm oil land bank may become stranded, statistical analysis shows that for this 20 percent stranded land the equity value impact might be 2 x 3.5 percent = 7 percent. Furthermore, in case of high CPO prices, companies can be penalized more. Malaysian palm oil growers should be even more cautious about stranded land, relative to Indonesian growers, because of higher sensitivity to undeveloped land. Larger growers may exhibit larger impacts.
Limited land availability: the old financial growth model might come to an end. Due to NDPE and also due to the proposed moratorium on palm oil land expansion in Indonesia, the old growth model of palm oil companies where land equals market cap growth might end. Complete transparency on the characteristics of newly acquired land would be necessitated, as expansion with “just land”, may be expansion with undevelopable forest or peat land, which can no longer add equity value. Furthermore, reduction of available land for expansions might lead to higher land prices, leading to pressure on profits after financing costs. The pressure on further growth of free cash flow generation could depress valuation. Growth in the palm oil sector needs to be found not in controversial undeveloped land expansions, but in other measures and areas. This may however lead to ‘leakage’. The Indonesian government is backing up more supportive policies on these issues, apart from the moratorium. Already in 2008, Malaysia prohibited deforestation for palm oil. Migration to other locations, like Liberia, would come at higher costs due to distance, lack of infrastructure, and lower growth and yield due to suboptimal conditions. This can also result in leakage of unsustainable palm oil and community conflicts to locations with less regulation and less sustainable commitments in place. Leakage customers will continue to buy palm oil from growers that deforest, but the size of this market is limited, is shrinking, and likely offers reduced prices. The lack of NDPE will be further subjecting the producers to reputational risks and lower net profit margins. Leakage can also come from redistribution of forested lands to the private, less scrutinized sector. Alternatives for the palm oil companies are: focus more on “produce and protect”, i.e. NDPE-compliant product expansion, smallholder investments, industry consolidation, vertical integration and yield improvements.

SE Asian Palm Oil Sector: Statistics Suggest Equity Overvalued | July 5, 2017 |9
Methodology
1. Model and Equations
The main questions which the paper poses, can be expressed not only as a visual graphic such as the one on page 2, but also in a general equation form. As already mentioned, the main variable of interest in the present empirical study is Hectares of land, while the Net profit and Market cap of a firm are the dependent variables in the models. All variables are taken in the same time period, [t=0], assuming that if during one fiscal year the company experiences changes in land, this will affect the value of the company already in the same time period. Thus, the closing period market value of the firm will absorb the effect of any land acquired, sold or stranded in the months prior to that. The equation model adopted here is “a generalized structural equation model, with a mediating variable”. We assume, test and confirm that Net Profit mediates part of the effect which Land exerts on Market Cap. To reach our final estimates, we follow 3 steps. We can call them hypotheses H1, H2, H3. H1: Land exerts a positive effect on market cap.
𝑀𝑎𝑟𝑘𝑒𝑡 𝐶𝑎𝑝𝑖,𝑡 = 𝑐 + 𝑦1𝐿𝑎𝑛𝑑ℎ𝑎𝑖,𝑡+𝑦2𝑊𝑖,𝑡 + 𝑢𝑖𝑡
The equation expresses 𝑀𝑎𝑟𝑘𝑒𝑡 𝐶𝑎𝑝𝑖,𝑡 for the company i at time t=0, as a function of
𝐿𝑎𝑛𝑑ℎ𝑎𝑖,𝑡. The model also controls for other important drivers of market cap,
summarized in 𝑊𝑖,𝑡; the constant term is denoted by 𝑐 and the error term is 𝑢𝑖𝑡. This equation tests if Land is indeed a good predictor of market cap (now yet how). This preliminary step is informative for the process of analysis, but not towards its conclusion and is hence not reported.
H2: Land exerts a positive impact on Net Profit: 𝑁𝑒𝑡 𝑃𝑟𝑜𝑓𝑖𝑡𝑖,𝑡 = 𝑎 + 𝑏1𝐿𝑎𝑛𝑑ℎ𝑎𝑖,𝑡
+ 𝑏2𝑍𝑖,𝑡 + 𝜀𝑖𝑡
This equation represents 𝑁𝑒𝑡 𝑃𝑟𝑜𝑓𝑖𝑡𝑖,𝑡 again for company i at time t=0, as a function of 𝐿𝑎𝑛𝑑ℎ𝑎𝑖,𝑡
. Other relevant control variables are summarized in 𝑍𝑖,𝑡, a constant is
represented by 𝑎 and the error term is 𝜀𝑖𝑡. This regressions tests whether net profit is positively affected by land. H3: Land affects Market Cap positively, once through Net Profit, and a second time, directly:
𝑀𝑎𝑟𝑘𝑒𝑡 𝐶𝑎𝑝𝑖,𝑡 = 𝑑 + 𝑔1𝐿𝑎𝑛𝑑ℎ𝑎𝑖,𝑡+ 𝑦2𝑁𝑒𝑡 𝑃𝑟𝑜𝑓𝑖𝑡𝑖,𝑡 +𝑦3𝑊𝑖,𝑡 + 𝑚𝑖𝑡
This equation expresses 𝑀𝑎𝑟𝑘𝑒𝑡 𝐶𝑎𝑝𝑖,𝑡 for the company i at time t=0, as a function of 𝐿𝑎𝑛𝑑ℎ𝑎𝑖,𝑡
and the land-impacted 𝑁𝑒𝑡 𝑃𝑟𝑜𝑓𝑖𝑡𝑖,𝑡 from H2. The model also controls for
other important drivers of market cap, summarized in 𝑊𝑖,𝑡; the constant term is
denoted by 𝑑 and the error term is 𝑚𝑖𝑡. The coefficients of H3 are contrasted with the coefficients derived in H1, to see if adding Net Income “abducts” part of the land effect on market cap. Thus, looking at the three hypotheses together reveals a fuller picture of the relationship land-profit-market cap. While these three equations signify the analytical steps, in fact they are implemented with a single algorithm, nesting all steps simultaneously.
Eventually, the core equation is expressed as H3, but to estimate the total effect of land on Market Cap, both the equations H2 and H3 have to be read together:

SE Asian Palm Oil Sector: Statistics Suggest Equity Overvalued | July 5, 2017 |10
The direct effect of land on market cap is expressed in coefficient 𝑔1 reading from H3.
The indirect direct effect of land on market cap is the product of coefficients 𝑏1 x 𝑏2, reading from H1 and H2 respectively.
The total effect of land on market is therefore 𝑔1 + 𝑏1 x 𝑦2
2. Firm-Specific Control Variables
To complement the empirical models focusing on land several significant control variables are included in each regression specification. They were selected on the basis of sound analytical practices, the significance they exhibited when estimating the models and different post-estimation tests. • CPO Price – as the core product of the selected companies is palm oil, both their
profits and market caps should be logically tightly linked with the commodity price. This is why this is included as a driver of net profit.
Revenue – companies’ performance can be closely linked to the amount of sales it generates. High revenue can vouch for potentially high earnings, which in turn can permit dividend pay-out and significant reinvestment back into the company to generate further growth. To factor in these potential effects of revenue, the figures were included in the regression analyses. Revenue is further interacted with a dummy variable identifying country, as the levels considerably differ.
• Net profit – apart from once appearing as an outcome variable, net income is largely an important value driver for share prices are they are likely to perform well if the company is earning well. Hence Net profit found its due inclusion in the models both as a control and as a mediator variable.
• Current Assets – companies’ assets can be very closely related to its value. For the palm oil industry in particular, Total Assets and Fixed Assets, such as land are of high relevance. In the present case, however, companies’ total assets are closely linked to the size of a firm’s landbank. As a consequence, to avoid multicollinearity in the model, the Total Assets are not included, only the share of current assets is and yet only as a control for the mediating variable, net income.
• Liabilities-to-Capital ratio – a firm’s gearing can often be representative of its risk appetite, financial health, cost of capital and it shows its level of indebtedness. Controlling for this variable allows for the liabilities of companies on a relative basis to be accounted for.
• Return on Common Equity – it is included because of its significance and because investors are often interested in the companies’ capacity to generate returns. It also relates with market cap, as part of it is the sum of the equity investments.
• Market Premium - represents the return of the market less the risk-free rate. For a market proxy, the return on the selected sample was taken. This is considered suitable, since the companies which are studied are all equally represented.
As risk free rate, the 10-year government bond yields were selected, corresponding to the country where a company’s primary stock is traded.
• Volatility – volatility is a representation of the price fluctuations of a company’s stock. Thus, it is a measure of risk. The higher the volatility, the less stable the market cap of a firm is. Hence, controlling for volatility allows for the market performance of a company and the downside potential it exhibits as an investment.
All variables were converted to logarithms for the sake of achieving normal distribution, which is a key precondition for the present analysis. Apart from presenting the variables employed in the analysis, the companies which fell in its scope are also described. The next paragraphs present the data and summary statistics concerning the population and sample of the present study.

SE Asian Palm Oil Sector: Statistics Suggest Equity Overvalued | July 5, 2017 |11
3. Data
There were two main sources of data for the current research. The Bloomberg platform was utilized for sourcing financial data, while data on companies’ land concessions was mainly gathered from their annual reports. Minor exceptions are land figures taken from company press releases or from the website of the Roundtable of Sustainable Palm Oil, that many companies are a member of. The research population of the study were the top 100 (by market cap) palm oil companies from Malaysia, Indonesia and Singapore. The actual sample of the study was the cross-section of companies covered by Bloomberg, of land information and predominantly occupied with palm oil. Thus, we were left with a convenience sample, aiming to represent the South East Asian palm oil company, see Figure 15. Since there was no consistent reason (to the best of our rationale) for companies to report or not to report land holdings, a natural randomization occurred within our population, to the benefit of our findings. Another positive aspect of the sampling approach adopted is that we actually analyzed companies which represent substantial interest for investors and financial institutions, as being among the biggest. A limitation is the ability to make generalizations on the basis of our results - extrapolating conclusions for firms outside the scope of our population should still be done with precautions and on the basis of similarity between a selected “external-to-the-present-research” company and the average firm in our sample. Furthermore, as much as the sample was selected to present companies with high exposure to palm oil, three of the companies source less than half of their revenue from the particular commodity. While this has the capacity to skew the results, data outliers were identified and winsorized at 5 percent in each tail (the extreme values are replaced by certain percentiles of values). The final sample of our study consists of 43 companies, data for these was reviewed for the period 2010 to 2015 and our empirical models have a total of 212 firm-year observations.
4. Results
4.1. Effect of Land on Net Income
To assess the effect of landbank on net income, several model specifications were estimated, testing the hypothesis that land has a positive linear effect on profits. Figure 6 therefore gives the results of 3 different variations of the main specification - namely specification (3) - to serve as robustness checks of the structural validity of the main analysis. The specifications have the companies’ net profit as a dependent variable and the firms’ land is the main variable of interest, i.e. the core coefficient to analyze is the one of Land. Specification (1) shows that even when the empirical model is void of many necessary control variables, land is of importance for the company net earnings. The coefficient is relatively similar to the ones in specifications (2) and (3) which thus vouches for the stability of the effect under model variations. Specification (2) shows a regression which already has several core control variables included and exhibits a slight increase in the coefficient of Land. Specification (3) shows the best model fitting the data and in it the coefficient of Land can be considered most representative since controlling for the necessary and most relevant company specific indicators. Specification (3) provides a significant result, which can be interpreted rather straightforwardly following the prescribed interpretation of a log-log model, where both the dependent and independent variables are measured in logarithms. The coefficient of Landi,t can be understood in terms of elasticity. In other words, it shows that a 10 percent increase in the amount of land a company has is likely to cause about

SE Asian Palm Oil Sector: Statistics Suggest Equity Overvalued | July 5, 2017 |12
3.86 percent (1.10^0.397) increase in its net profit, controlling for the firms’ revenue (by country), the current assets it operates, the level of its indebtedness, the CPO price (the graphical results from the former pages are accurate to 10 basis points or 0.1 percent). Our result is significant at the 1 percent level, i.e. there is a 1 percent chance that land does not impact net income, the model is of the lowest AIC, BIC and VIF, as well as the highest log-likelihood.
4.2. Effect of Land on Market Cap
To assess the effect of landbank on marker cap and thus potentially on investors’ returns, three model specifications were estimated, testing the hypothesis that market cap increases linearly in land. Figure 7 therefore gives the results of 3 variations of this main hypothesis, to again serve as robustness checks of the structural validity of the main analysis. The specifications have the companies’ market cap as a dependent variable and the firms’ land is the main variable of interest, i.e. the core coefficient to analyze is the one of Land. Specification (1) shows that even when the model is specified without inclusion of further predictive variables but net income, land exerts a significant and positive effect on market cap. Specification (2) includes several drivers of market cap, which further clarifies the effect land - the main coefficient of interest becomes more expressed, retaining significance but increasing in magnitude. The coefficients of the second and third specifications are proximate, which suggest that the effect of land is relatively stable and independent of other variables.
4.3. Effect of Land on Market Cap, as Mediated by Net Income, Figure 6
The previous two hypotheses were estimated jointly with the help of Stata’s generalized structural equation model (GSEM), whilst the above present interpretation of their coefficients regards the two models (of net profit and market cap) in isolation. However, as we also discerned that Net Profit likely and logically serves as a mediator of indirect landbank effect on market cap, this suggests that the above explanations are only partial. We hypothesized that it is likely that the cumulative effect of land area on market cap can be higher than 3.9 percent. The GSEM allows the computation of this mediated effect, in addition to the direct effect of the 3.9 percent. The results we found confirmed that some additional effect of land bank is mediated by net income, and showed that about 3.5 percent further increase in market cap can be attributed to a 10 percent change in land, only that this is an indirect effect of land routed through net income. Consequently, the total effect of the land area can be expected at about 7 percent, of similarly significance and accuracy as the above presented results. The linear fits are visually presented in Figure 11, by country and jointly.
5. Limitations of the Study
A statistical study can be further assessed in terms of its internal and external validity. Addressing the former concerns the ability to make statistical inferences about causal effects that are valid for the sample which is studied (e.g. is the effect of land really such on market cap, or is there some other impact which is not factored in?). External validity concerns the ability to make generalizations from the results concerning the entire studied population, i.e. whether there are significant reasons to believe that

SE Asian Palm Oil Sector: Statistics Suggest Equity Overvalued | July 5, 2017 |13
something specific impacts the selected sample, but not the entire studied population. Discussion for the present study follows.
5.1. Threats to Internal Validity
Internal validity addresses our discoveries that a 10 percent increase in land can result in 3.9 percent increase in Net Earnings and a 7 percent increase in company’s value and whether these percentages are too high or too low. To ensure that the models produced adequate results, measures were taken to address several concerns mentioned below.
Endogeneity and Omitted Variable Bias A worry for the results of the present study could be that our model might suffer from omitted variable bias. Or in other words, there might be an important value driver which endogenously impacts a company’s market cap and net income and is not included in our specifications. If this is so, then the analysis and interpretation of causal relationships between our key variables could be undermined (the predictive capacity of the models, not). What we did to assure against a potential omitted variable bias, as a main worry for endogeneity, is several fold. On one hand-side, we considered the inclusion of many relevant control variables, which were tested correlation-wise and significance-wise, when included in the regression specifications. We also applied post-estimation tests of value inflation factors and information content to help select the best models. Considering the constraints of the small sample we have, we retained variables which exhibited significance for the model, but parted from some which did not. In addition, several logical for inclusion control variables were left out of the model, because of driving high value inflation factors, as seen on Figure 9. Correlation coefficients were also inspected, and are presented in Figures 13 and 14. In addition, given the vast body of knowledge accumulated over the SE Asian palm oil market over years of experience, the relationships found through this research appear more than plausible, i.e. the research confirms and offers a quantitative aspect to our hypotheses.
Reverse Causality One aspect which could have potentially impacted the results is raising additional capital, coincidental with land increase (be it to fund the latter or not). While this could have skewed the analysis, because it implies that increased market cap results in increased land, the matter was checked. There were 12 rights/share offerings for the period according to Bloomberg, of which 2 may be linked to land bank expansion (IOI Corp. and Eagle High Plantations). These are 2 observations, of a total of 212 firm-year observation, less than 1 percent of the sample. While this is not controlled for in the analysis, the worry for a confounder and reverse causality here is admitted, but accepted as tolerable.
Functional Form Misspecification Bias The study had to allow for the possibility that there were not only linear relationships between the variables, but may be quadratic or some type curvy-linear. Simple visual observation of the data plots, however, as showcased in Figure 11, asserted linearity. Likely to overfit a line through the data, multi-fractional polynomial algorithm did not show expressed curvature either. While not all scatterplots are presented here, they were all inspected – some revealed a few outliers which were individually analyzed and catered for, but the hypothesized linearity found support. • Errors in Variables Bias

SE Asian Palm Oil Sector: Statistics Suggest Equity Overvalued | July 5, 2017 |14
Considering the relatively small sample the study relies on, if there were errors in our variables, this could impact our results, because we would not be estimating the true effects of e.g. land, but we would also be factoring in unneeded noise, capable of skewing our findings. To address that, our variables were carefully defined, measured and calculated, with data sources double and triple checked. However, as the information was taken from Bloomberg and company documents, it can be said that it is as flawless as these sources and their definitions are.
Sample Selection Data Data on companies’ landbanks is generally unavailable since firms are not bound to disclose their land holdings and thus we were left with a convenience sample, i.e. we gathered information for the companies in our population which actually reported on land, yet they did so on random basis. This is hence a source of natural randomization of the data within our population. On the other hand, we studied top companies, and as such, these are likely to be exposed to e.g. better land buying terms, since for example they can afford buying large. Considering that land acquisition prices are usually so low, however, permits to proceed the analysis without much ado. In addition, since the present study is namely interested in the significant players in the palm oil industry, from that perspective the selected sample is satisfactory, as it addresses the interests of larger stakeholders. It should be acknowledged though, that there is not considerable variation of land within the companies. This is a signal that the present study has its sampling limitations, and could benefit from a larger, more diversified sample. Nevertheless, this paper can be a discussion trigger and a stepping stone towards further scientific approaches, which can suffer from less limitations.
5.2. Threads to External Validity It should be scrutinized whether the conclusions arrived at with this study can be applied to the entire palm oil industry, or be constrained only locally or to the largest companies. As already seen, although neighboring countries and affected by similar major impacts, Malaysia considerably differs from Indonesia with respect to the magnitude of land effects exerted on Market cap. Hence, generalizations should be made with caution, and country studies should be considered. Should we extrapolate the present considerations to e.g. Chinese palm oil companies? Likely not. This would not be sound for several reasons – different legislations, different market condition, scale, currency, etc. Hence the conclusions offered here are to extend bound to the actual boundaries of the counties which fell in the sample – i.e. Indonesia and Malaysia, to a lessor extend Singapore. From this perspective, extrapolation to other locations would be inadequate.
5.3. Placebo Tests To further asses the validity of the present analysis, several placebo tests were run, varying the sample in an attempt to catch a potential confounder skewing the results. The analysis shows that indeed the effects of land are not completely harmonious within the sample. Figure 12 shows that Malaysian companies dominate, with observation count twofold to Indonesia. Malaysian companies are also shown to exhibit higher landbank effects, and these are only significant for this country. It is possible thought that the limited observation count of the other two countries reduces the significance when analyzed separately, but is enhanced when assessed jointly. Similarly, the placebo tests suggest that the company size matters, and that larger companies are more prone to exhibit even higher land effects. With these considerations in mind, it can be concluded that a larger sample would enhance such a study. Regression results follow as of next page.

SE Asian Palm Oil Sector: Statistics Suggest Equity Overvalued | July 5, 2017 |15
Regression Results
Dependent Variable Net Profit
Independent Variables (1) (2) (3)
Land 0.139** 0.377*** 0.397***
(2.15) (5.34) (5.12)
Revenue 0.667*** 0.680*** 0.473***
(13.67) (15.15) (5.34)
Liabilities to capital -0.641*** -0.532***
(-6.29) (-4.69)
CPO Price 1.109***
(3.66)
Current Assets 0.173**
(1.98)
Indonesia * Revenue 0.000
(.)
Malaysia * Revenue 0.018
(relative to Indonesia) (0.76)
Singapore * Revenue 0.045
(relative to Indonesia) (1.09)
Constant -1.823*** -2.397*** -10.225***
(-3.29) (-4.63) (-4.73)
Variance (e. Market cap)
Constant 0.465*** 0.249*** 0.254***
(10.30) (10.30) (10.15)
Variance (e. Net Profit)
Constant 0.922*** 0.781*** 0.734***
(10.44) (10.44) (10.30)
The table presents the effect of Log Hectares Land on the firms’ Log Net Profit in all specifications. The models are fitted within the first stage of a generalized structural equation model (GSEM), due to the hypothesized mediation effect of net income (some of the landbanks’ influence being mediated through net income). Key variable of interest is Log Hectares Land and it is the natural logarithm of the companies’ total landbank, measured originally in hectares. Each next specification adds a necessary control variable which aims to show the stability of the key coefficient and serves as a robustness check. The reported results are from OLS regressions, ran for the top 100 palm oil companies in Malaysia, Indonesia and Singapore in the cross-section of land and financial data. There are 212 observations in each, and they cover the period 2010 -2015. The exact list of companies in the sample is appended at the end of the document. The analysis is performed on annual basis: land information is gathered from company annual reports and RSPO ACOP reports, whilst the remaining variables are taken from Bloomberg. T-statistics are reported in parentheses and they are consistent with heteroscedasticity robust standard errors. Information content indicators are presented on the next page and are jointly valid for the first and second stage of the GSEM model. ***, **, * indicate significance levels of 1 percent, 5 percent, 10 percent, respectively.
Figure 6A Percentage change in Net profit due to a 1 percent change in each variable

SE Asian Palm Oil Sector: Statistics Suggest Equity Overvalued | July 5, 2017 |16
Dependent Variable Market Cap
Independent Variables (1) (2) (3)
Net Income 0.665*** 0.877*** 0.875***
(18.61) (23.27) (21.16)
Land 0.326*** 0.355*** 0.354***
(7.74) (8.06) (7.50)
ROCE -0.568*** -0.562***
(-10.31) (-9.61)
Risk free rate -0.038 -0.050
(-0.54) (-0.66)
Market Return 0.538* 0.489
(1.84) (1.59)
Liabilities to Capital -0.217*** -0.216***
(-3.50) (-3.31)
CPO price -0.065
(-0.34)
Constant 0.416 1.259*** 1.720
(1.04) (3.71) (1.27)
The table presents the effect of Log Hectares Land on the firms’ Log Market Cap in all specifications. The models are fitted within the first stage of a generalized structural equation model (GSEM), due to the hypothesized mediation effect of net income (some of the landbanks influence being mediated through net income). Key variable of interest is Log Hectares Land and it is the natural logarithm of the companies’ total landbank, measured originally in hectares. Each next specification adds a necessary control variable which aims to show the stability of the key coefficient and serves as a robustness check. The reported results are from OLS regressions, ran for the top 100 palm oil companies in Malaysia, Indonesia and Singapore in the cross-section of land and financial data. There are 212 observations in each, and cover the period 2010 -2015. The exact list of companies is appended at the end of the document. The analysis is performed on annual basis: land information is gathered from company annual reports and RSPO ACOP reports, whilst the remaining variables are taken from Bloomberg. T-statistics are reported in parentheses and they are consistent with heteroscedasticity robust standard errors. Information content indicators are presented on the next page and are jointly valid for the first and second stage of the GSEM model. ***, **, * indicate significance levels of 1 percent, 5 percent, 10 percent, respectively.
The table presents three different goodness of fit tests, which serve the purpose of assessing the models specified in each regression. For the BIC and AIC indicators, the lower value is the better, with no absolute cut off point applicable. Similarly, the log-likelihood is the highest. R-statistics were observed on each individual regression, being the highest for specification 3. Yet, these are not reported under GSEM.
(1) (2) (3)
Log-likelihood -520 -435 -419
BIC 1083 941 935
AIC 1056 897 874
Figure 6B Percentage change in Market cap due to a 1 percent change in each variable
Figure 7 Goodness of fit post estimation for each of the 3 specifications

SE Asian Palm Oil Sector: Statistics Suggest Equity Overvalued | July 5, 2017 |17
Specification Extended Medium Chosen
Net Income 12.78 11.2 3.66
Land 3.71 3.71 3.7
ROCE 4.27 4.13 2.48
Risk Free Rate 1.45 1.44 1.44
Market Return 1.05 1.05 1.04
Liabilities to capital 3.1 2.29 2.23
CPO price 1.16 1.15 1.15
Current Assets 8.56 5.97
Revenue 9.98
The table presents value inflation factors (VIF) of three different models in which market cap is the outcome variable, and the listed variables are its main determinants. It shows that an extended analysis, including Current Assets and Revenue as controls inflates the results and is therefore not advisable. As the threshold of the VIFs is 10 or below, the last specification dominates the former in accuracy.
Quantiles
Variable Obs. Mean Standard Deviation
Minimum 0.25 Median 0.75 Maximum
Land 218 150,000 190,000 1,086 24,134 83,296 200,000 1,000,000
Market Cap 212 2,311 4,577 44 172 464 1,786 28,060
Current Assets 245 1,041 3,019 4 54 151 459 22,247
Revenue 244 1,925 5,390 2 105 277 761 36,374
Net Income 221 149 304 0 13 28 120 1,601
CPO price 221 834 159 565 734 860 939 1,077
ROCE 220 12.0% 9.5% 0.1% 5.3% 10.5% 15.7% 74.4%
Risk Free Rate 221 4.2% 1.9% 0.5% 3.4% 3.5% 5.3% 8.1%
Market Return 221 0.6% 1.2% -1.9% -0.2% 0.4% 0.9% 3.9%
Liabilities to Capital
221 37.2% 19.5% 0.7% 20.9% 39.2% 53.1% 82.6%
Volatility 212 28 17 3 16 24 34 133
The table provides summary statistics of firm characteristics. The variables are reported for the period 2010 – 2015. The table presents means, medians, standard deviations, 25th and 75th percentiles and the number of observations. The natural logarithms of the variables were adopted in the analysis for the sake of normalizing the data distribution. Convenience sampling was applied due to scarcity of landbank information, with the population of the study being the top 100 palm oil producers from Malaysia, Indonesia and Singapore, the sample being the companies in the cross-section of land, financial data. Land data was gathered from the annual reports and RSPO ACOP reports, while the remaining variables are taken from Bloomberg.
Figure 9 Summary statistics of all data, in million USD, except CPO price, percentages and hectares
Figure 8 Value Inflation factors for selection of model
SE Asian Palm Oil Sector: Statistics Suggest Equity Overvalued | July 5, 2017 |18
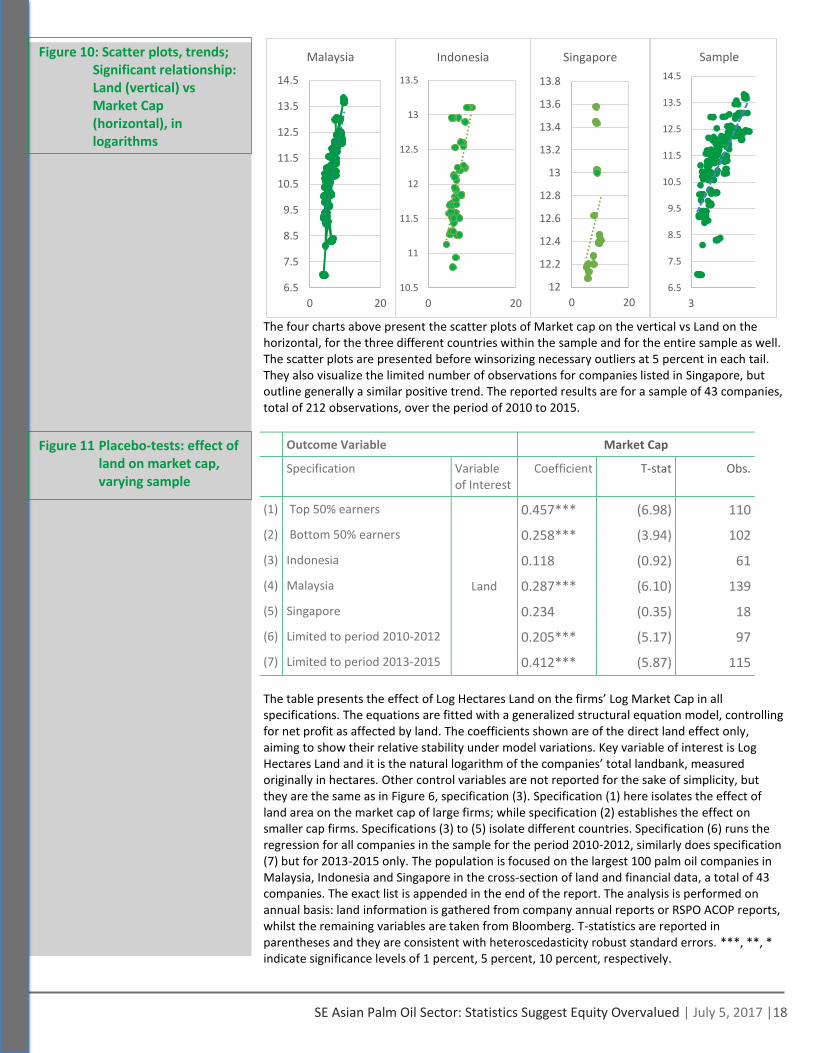
The four charts above present the scatter plots of Market cap on the vertical vs Land on the horizontal, for the three different countries within the sample and for the entire sample as well. The scatter plots are presented before winsorizing necessary outliers at 5 percent in each tail. They also visualize the limited number of observations for companies listed in Singapore, but outline generally a similar positive trend. The reported results are for a sample of 43 companies, total of 212 observations, over the period of 2010 to 2015.
Outcome Variable Market Cap
Specification Variable of Interest
Coefficient T-stat Obs.
(1) Top 50% earners
Land
0.457*** (6.98) 110
(2) Bottom 50% earners 0.258*** (3.94) 102
(3) Indonesia 0.118 (0.92) 61
(4) Malaysia 0.287*** (6.10) 139
(5) Singapore 0.234 (0.35) 18
(6) Limited to period 2010-2012 0.205*** (5.17) 97
(7) Limited to period 2013-2015 0.412*** (5.87) 115
The table presents the effect of Log Hectares Land on the firms’ Log Market Cap in all specifications. The equations are fitted with a generalized structural equation model, controlling for net profit as affected by land. The coefficients shown are of the direct land effect only, aiming to show their relative stability under model variations. Key variable of interest is Log Hectares Land and it is the natural logarithm of the companies’ total landbank, measured originally in hectares. Other control variables are not reported for the sake of simplicity, but they are the same as in Figure 6, specification (3). Specification (1) here isolates the effect of land area on the market cap of large firms; while specification (2) establishes the effect on smaller cap firms. Specifications (3) to (5) isolate different countries. Specification (6) runs the regression for all companies in the sample for the period 2010-2012, similarly does specification (7) but for 2013-2015 only. The population is focused on the largest 100 palm oil companies in Malaysia, Indonesia and Singapore in the cross-section of land and financial data, a total of 43 companies. The exact list is appended in the end of the report. The analysis is performed on annual basis: land information is gathered from company annual reports or RSPO ACOP reports, whilst the remaining variables are taken from Bloomberg. T-statistics are reported in parentheses and they are consistent with heteroscedasticity robust standard errors. ***, **, * indicate significance levels of 1 percent, 5 percent, 10 percent, respectively.
Figure 11 Placebo-tests: effect of land on market cap, varying sample
10.5
11
11.5
12
12.5
13
13.5
0 20
Indonesia
6.5
7.5
8.5
9.5
10.5
11.5
12.5
13.5
14.5
0 20
Malaysia
12
12.2
12.4
12.6
12.8
13
13.2
13.4
13.6
13.8
0 20
Singapore
6.5
7.5
8.5
9.5
10.5
11.5
12.5
13.5
14.5
3
Sample Figure 10: Scatter plots, trends; Significant relationship: Land (vertical) vs Market Cap (horizontal), in logarithms

SE Asian Palm Oil Sector: Statistics Suggest Equity Overvalued | July 5, 2017 |19
Market Cap
Net Income
Land ROCE Risk-Free Rate
Market Return
Market Cap 1
Net Income 0.8867* 1
Land 0.7026* 0.6627* 1
ROCE 0.3314* 0.6132* 0.3079* 1
Risk Free Rate
-0.3212* -0.2139* -0.1355* 0.2640* 1
Market Return
0.0253 -0.0083 -0.0471 -0.0189 -0.0928 1
Liabilities to capital
0.2845* 0.3179* 0.6939* 0.2503* 0.0769 -0.0438
CPO price 0.0656 0.1155* -0.0618 0.2988* 0.0602 -0.1379*
Current Assets
0.8818* 0.8067* 0.6017* 0.1681* -0.3513* 0.0057
Revenue 0.8694* 0.8307* 0.7182* 0.2891* -0.2996* -0.0003
EBITDA 0.3376* 0.3080* 0.5664* 0.3831* 0.4053* -0.1316*
Volatility -0.1581* -0.1535* -0.0078 -0.0608 0.1145* 0.0287
Liabilities to capital
CPO price Current Assets
Revenue EBITDA Volatility
Liabilities to capital
1
CPO price -0.058 1
Current Assets
0.2624* 0.0033 1
Revenue 0.4896* 0.0319 0.8903* 1
EBITDA 0.5787* -0.0089 0.2682* 0.4166* 1
Volatility 0.1174* -0.1890* -0.1552* -0.1071 0.1895* 1
The table reports pairwise correlations of the variables, calculated at year ends. The period is 2010-2015 and the data is for the top 100 palm oil companies in Malaysia, Indonesia and Singapore for which landbank data was found and revenue from the palm oil segment was considerable. Variable descriptions are provided at the end of the paper in appendix. Statistical significance is reported at the 1 percent level and is denoted with an asterisk.
Figure 12 A) Pairwise correlations between dependent and independent variables
Figure 12 B) Pairwise correlations between dependent and independent variables

SE Asian Palm Oil Sector: Statistics Suggest Equity Overvalued | July 5, 2017 |20
A-K K-Z
Astra Agro Lestari Kuala Lumpur Kepong
Bakrie Sumatera Plantations Kulim (Malaysia)
BLD Plantation Kumpulan Fima
Boustead Holdings* Kwantas Corporation
Bumitama Agri Negri Sembilan Oil Palms
Cepatwawasan Group NPC Resources
Dharma Satya Nusantara Provident Agro
DutaLand Sampoerna Agro
Eagle High Plantations Sarawak Plantation
Felda Global Ventures Sawit Sumbermas Sarana
First Resources Sime Darby*
Genting Plantations Sinar Mas Agro Resources and Technology
Golden Agri-Resources Southern Acids Malaysia
Golden Land Sungei Bagan Rubber
Gozco Plantations TH Plantations
Indofood Agri Resources Tiga Pilar Sejahtera Food*
Innoprise Plantations Tradewinds Plantation
IOI Corporation Tunas Baru Lampung
Keck Seng Malaysia United Malacca
Kencana Agri United Plantations
Kim Loong Resources Wilmar International
Kretam Holdings
The table reports all companies which fell within the sample of the present study. The population was the top 100 palm oil companies in Malaysia, Singapore and Indonesia, over the period of 2010 to 2015.The sample is the cross- section of available financial (Bloomberg) and land (annual and ACOP RSPO reports) data for all the companies. The eventual count of companies in the sample is 43, chosen with significant exposure to palm oil and resulting in 212 firm-year observations in the analysis. * Three companies are imperfect peers, which was however, considerably offset by winsorization of extreme values.
Figure 13 Companies in sample
Disclaimer: This report and the information therein is derived from selected public sources. Chain Reaction Research is an unincorporated project of Aidenvironment, Climate Advisers, and Profundo (individually and together, the "Sponsors"). The Sponsors believe the information in this report comes from reliable sources, but they do not guarantee the accuracy or completeness of this information, which is subject to change without notice, and nothing in this document shall be construed as such a guarantee. The statements reflect the current judgment of the authors of the relevant articles or features, and do not necessarily reflect the opinion of the Sponsors. The Sponsors disclaim any liability, joint or severable, arising from use of this document and its contents. Nothing herein shall constitute or be construed as an offering of financial instruments or as investment advice or recommendations by the Sponsors of an investment or other strategy (e.g., whether or not to “buy”, “sell”, or “hold” an investment). Employees of the Sponsors may hold positions in the companies, projects or investments covered by this report. No aspect of this report is based on the consideration of an investor or potential investor's individual circumstances. You should determine on your own whether you agree with the content of this document and any information or data provided by the Sponsors.