Embed Size (px)
Citation preview
My NASA Data
Student Name: Date: Period:
Sea Ice and the Earth System Story Map
Link to Story Map: https://nasa.maps.arcgis.com/apps/MapSeries/index.html?appid=2adb302f548945d08f9aed5e41352255
Part A: Engage A.1 What patterns do you see?
A.2 Why do you think this is happening?
A.3 What do you think causes these patterns? A.4 What does this animation make you wonder?
A.5 What is the difference in minimum sea ice extent between 1979 and 2018? (Click on the ice to see the extent value.)
2
A.6 Why do you think these changes in sea ice extent are happening? A.7 As a class, you will work to create your own concept map for the topic Changes in Sea Ice Extent. NOTE: you will continue to develop this concept map and edit it as you learn more about this phenomenon. Instructions:
1. Brainstorm main ideas and terms related to Changes in Sea Ice Extent. Think of ways in which Changes in Sea Ice Extent relate to other spheres of the earth system (atmosphere, biosphere, geosphere, hydrosphere).
2. Organize these ideas. Create groupings based on how similar they are to one another or their relation to the main topic.
3. Map out the ideas by putting them into boxes and rearranging them around the main topic.
4. Connect the ideas through phrases that describe their relationship. See the chart below for sample connecting phrases.
3
Part B: Explore B.1 Which month in 2018 had the greatest sea ice extent?
B.2 Which month had the least?
B.3 How does sea ice extent change over the course of a year?
B.4 How has Arctic sea ice minimum extent changed between 1979 and 2018?
B.5 After seeing this data, what questions do you have that you would like to investigate? B.6 What year had the least amount of arctic sea ice minimum coverage?
B.7 What other variables within the Earth System do you think have affected sea ice extent over time?
4
B.8 What colors do you see on the map?
B.9 What do these colors mean? B.10 How does surface air temperature change between March and September? B.11 What patterns do you notice between the extent of sea ice and surface air temperature? B.12 How have global temperatures changed over time? B.13 How have certain locations been affected more than others? Explain. B.14 What are some different ways in which Arctic animals interact with sea ice?
5
B.15 Do you think some of these animals rely on sea ice more than others? Explain your reasoning. B.16 Is Arctic sea ice generally growing or melting during the summer months when polar bears are active? B.17 How does sea ice melt affect polar bear migration? Explain your reasoning.
6
Part C: Explain
C.1 Where does most of the Earth's energy come from?
C.2 What types of materials are affected by Earth's Energy Budget?
C.3 How does Earth's energy stay in balance?
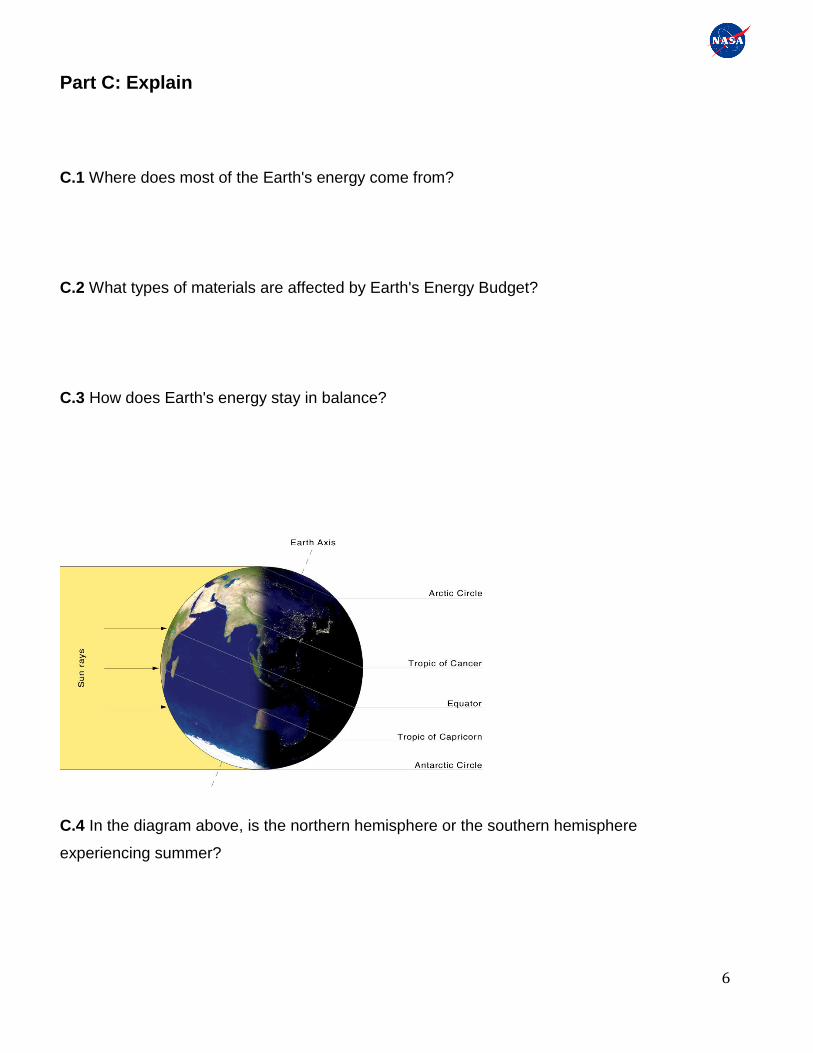
C.4 In the diagram above, is the northern hemisphere or the southern hemisphere
experiencing summer?
7
C.5 During which month does the Arctic receive the most direct energy from the Sun?
C.6 Does the South Pole experience these same day and night cycles? Explain.
C.7 In the animation, what is happening to the solar radiation as the ice continues to melt?
C.8 What does it mean when we say sea ice has a high albedo?
C.9 What is the ice-albedo feedback?
C.10 In what seasons do you expect a change in albedo in the Arctic to have the greatest
impact in the amount of sunlight absorbed and reflected at the surface?
8
C.11 Write a paragraph explaining how the flow of energy into the Arctic impacts sea ice
extent. Refer to the concepts covered earlier in this section.
___________________________________________________________________________
___________________________________________________________________________
___________________________________________________________________________
___________________________________________________________________________
___________________________________________________________________________
___________________________________________________________________________
___________________________________________________________________________
C.12 What are the processes that contribute to sea ice melt?
C.13 All of these groups collected these data independently, yet obtained similar results. What
does this tell us about the reliability of the data?
C.14 What is the overall trend in this data?
C.15 Why is the Arctic more sensitive to warming then other regions on Earth?
9
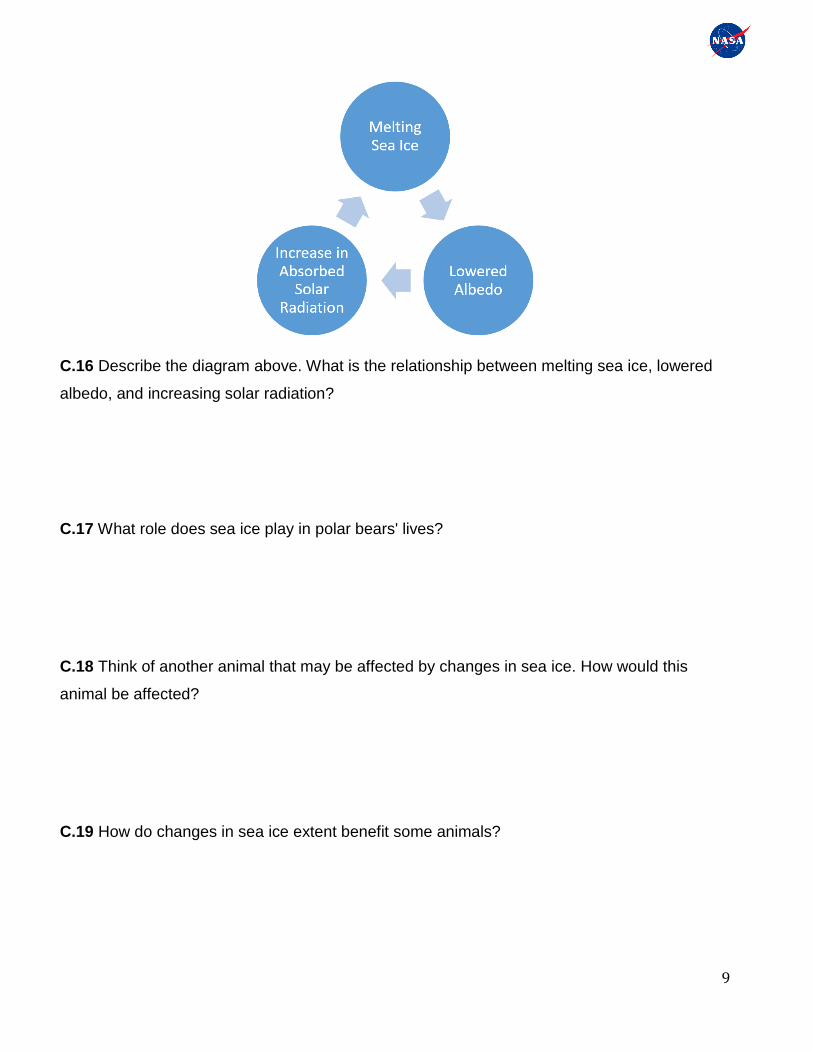
C.16 Describe the diagram above. What is the relationship between melting sea ice, lowered
albedo, and increasing solar radiation?
C.17 What role does sea ice play in polar bears' lives?
C.18 Think of another animal that may be affected by changes in sea ice. How would this
animal be affected?
C.19 How do changes in sea ice extent benefit some animals?

10
C.20 Can you think of another animal that may benefit from changes in sea ice extent? How
would this animal benefit from the changes?
11
Part D: Elaborate
D.1 As a class, watch the animation and discuss ways in which you think sea ice could
influence changes in ocean density that drive the conveyor belt system.
D.2 Based on the animation of global temperature anomalies, do you think polar ocean waters
have been increasing or decreasing in density during the past several years? Explain.
D.3 What patterns do you notice about sea salinity across location?
D.4 Describe the relationship between the amount of sea ice and amount of salinity in the
Arctic?
D.5 Write a paragraph describing the importance of sea ice in the ocean conveyor belt system.
Explain how sea ice influences temperature and salinity. Include how temperature and salinity
drive changes in ocean circulation.
___________________________________________________________________________
___________________________________________________________________________
___________________________________________________________________________
___________________________________________________________________________
___________________________________________________________________________
___________________________________________________________________________
___________________________________________________________________________
12
Part E: Evaluate
E.1 Why is an one-degree increase in average global temperature significant to climate?
E.2 Based on the trend in this graph, do you think temperatures will increase, decrease, or
stay the same? Why?
E.3 Use the graphic organizer to provide an example of how changing air temperatures will
impact the other spheres of the Earth System (atmosphere, biosphere, cryosphere, geosphere,
hydrosphere). Provide lines of evidence to support each of your examples.
When you are finished, discuss your results as a class.

![Snowball Earth: A thin-ice solution with flowing sea glaciers · sea-glacier flow, and with various values of single-scattering albedo. [8] Sections 2 and 3 present results for our](https://img.pdfslide.net/doc/110x75/600d5ebfa2c35b479c2c8ad0/snowball-earth-a-thin-ice-solution-with-flowing-sea-sea-glacier-flow-and-with.jpg)