Embed Size (px)
Citation preview

SEAFLOOR OBSERVATORIES A new vision of the Earthfrom the Abyss
Paolo FavaliLaura BeranzoliAngelo De Santis

Paolo Favali Istituto Nazionale di
Rome Italy
Editors
Angelo De Santis Istituto Nazionale di
Rome Italy
Laura Beranzoli Istituto Nazionale di
Rome Italy
SPRINGER-PRAXIS BOOKS IN GEOPHYSICAL SCIENCES SUBJECT ADVISORY EDITOR: Philippe Blondel, C.Geol., FGS., Ph.D., M.Sc., Senior Scientist, Department of Physics, University of Bath, UK
ISBN 978-3-642-11373-4 ISBN 978-3-642-11374-1DOI 10.1007/978-3-642-11374-1
Springer Heidelberg New York Dordrecht London
Library of Congress Control Number: 2014942448
© Springer-Verlag Berlin Heidelberg 2015
Cover design: Jim WilkieProject copy editor: Rachael WilkieTypesetting: David Peduzzi
Cover imagesFront cover clockwise from the top: Mooring deployment; Tempo-mini multi-instrument platform developed by IFREMER; MODUS underwater vehicle for GEOSTAR-class observatory management developed by Beuth University of Applied Sciences, Berlin.Back cover: Engineer at work on the MODUS vehicle.
Printed on acid-free paper
Springer-Verlag GmbH Berlin Heidelberg is part of Springer Science+Business Media (www.springer.com)
This work is subject to copyright. All rights are reserved by the Publisher, whether the whole or part of the material is concerned, specifically the rights of translation, reprinting, reuse of illustrations, recitation, broadcasting, reproduction on microfilms or in any other physical way, and transmission or information storage and retrieval, electronic adaptation, computer software, or by similar or dissimilar methodology now known or hereafter developed. The use of general descriptive names, registered names, trademarks, service marks, etc. in this publication does not imply, even in the absence of a specific statement, that such names are exempt from the relevant protective laws and regulations and therefore free for general use. The publisher, the authors and the editors are safe to assume that the advice and information in this book are believed to be true and accurate at the date of publication. Neither the publisher nor the authors or the editors give a warranty, express or implied, with respect to the material contained herein or for any errors or omissions that may have been made.
(eBook )

439
B. M. Howe, F. K. Duennebier and R. Lukas1
ways to observe the ocean, each with its own strengths and weaknesses, in order to advance our understanding and lay the foundations for predictive models and their applications.
and AUVs), satellite transmission and acoustic data links, are providing new data acqui-sition methods, but sensors, instruments and platforms requiring high power, high data
technologies. Cabled observatories – such as the ALOHA Cabled Observatory (ACO) – provide remote interactive instrument control, continuous real-time data streams and large amounts of electric power. Cabled and autonomous technologies are complementary in that the cable systems can provide the power and communications interface to subsurface
-
Submarine cable systems have been used for science since the 1960s, with much work in Japan since the 1970s. In the 1990s, scientists in the United States began using cables to support their instrumentation and several systems were installed, e.g., LEO-15, ATOC, HUGO, and H2O (Forrester et al., 1997; ATOC et al., 1995; Duennebier et al., 2002; Petit et al., 2002; an historical account is given by Howe et al., 2012). Two technologies opened the door for these observatories: remotely operated vehicles (ROVs) with power, high-res-olution video, manual dexterity, heavy lift capability, long continuous work time at the
1 School of Ocean and Earth Science and Technology, University of Hawaii, Honolulu, Hawaii, USA
pringer Praxis Books, Springer-Verlag Berlin Heidelberg 2015
S S©P. Favali et al., eaflo Observatoriesor , DOI 10.1007/978-3-642-11374-1_17
Howe, B. M., F. K. Duennebier, R. Lukas, The ALOHA Cabled Observatory, in Seafloor Observatories: A new vision of the Earth from the Abyss, Eds. P. Favali, L. Beranzoli and A. De Santis, Springer-Praxis Publishing, pp. 439-463, DOI: I10.1007/978-3-642-11374-1, 2015.

440 The ALOHA cabled observatory
attached to the observatory by the ROVs. These developments and projects, and the asso-ciated planning efforts, have led to many of the ocean- and Earth-observing systems that are described in this volume.
As the design of new cable systems progress (Favali and Beranzoli, 2006) and experi-ence with test bed systems accumulates, the realities of the design, cost, and complexities – as well as advantages and disadvantages of such cable systems are becoming clearer. The full-scale new cable systems coming on line, NEPTUNE Canada, RSN (Regional-scale Nodes of the NSF Ocean Observatories Initiative), and the Japanese DONET, will provide important contributions to cabled observatory efforts. At the same time, the re-use of ex-isting cables provides a cost-effective complementary path to the deep ocean with minimal compromise in capability.
communications cable. The ACO architecture uses highly reliable existing transoceanic cable systems to provide power and communications bandwidth. The cables are terminated on land at existing cable stations that contain the infrastructure required to power and con-trol the observatories and transmit commands and data. Since the cable is already in place and is designed to operate for well beyond its commercial lifetime, costs of converting re-
of new systems. In the following section the background of the ACO is presented. This is followed by a
description of the ACO infrastructure. Section 4 discusses current and future science and engineering topics that the ACO has or can address. Concluding remarks follow, including
operating status.
north of Oahu, Hawaii. Since October 1988, the Hawaii Ocean Time-series (HOT) program has investigated temporal dynamics in biology, physics, and chemistry at Station ALOHA,
T conducts near monthly ship-based sampling and makes continuous observations from moored instruments to document and study NPSG climate and ecosystem variability over semi-diurnal to decadal time scales (Karl and Lukas, 1996; Karl et al., 2001). The recent
out. Understanding the impacts of climate forcing on the ecosystem (Bidigare et al., 2009) is only possible by having long time-series observations coupled with constantly evolving and improving ocean models.
Long-term change in parameters such as salinity and rare and episodic temperature events at Station ALOHA (Lukas et al., 2001; Lukas and Santiago-Mandujano, 2001; Al-ford et al., 2011) can be better observed with the new capabilities of the ACO because

44117.2 Background
sustained real-time detection of events will support adaptive sampling within and around the observatory.
In 2002, the ACO had been funded as a Major Research Instrumentation project by the US National Science Foundation (NSF) and was in the process of obtaining permission to use the retired ANZCAN coaxial cable that ran near Station ALOHA. Teleglobe, Inc., the
-tion optical cable system, was then retired and made available for the ACO by AT&T. A
(Tremblay and Duennebier, 2006). A test of the production hardware in 2006 demonstrated the capabilities by sending 100 Mb/s data from the Makaha Cable Station on Oahu to a cable station in California where it was looped-back to Oahu and recorded error-free, a round-trip path of more than 8000km.
Station ALOHA and the ALOHA Cabled Observatory installation. The blue line shows the original cable route, and the red shows the re-laid cable path. The background is EM-120 side-scan swaths taken during site surveys for this project and processed by the Hawaii Mapping Research
4726m water depth.

442 The ALOHA cabled observatory
4 cable was cut, both ends terminated, and 20km of cable was relaid to Station ALOHA. This operation was accomplished in February 2007 using the cable ship USNS Zeus (Fig-
a hydrophone, and pressure sensor (the “Proof Module”) to provide proof of concept and
to Oahu shortly after the sensors were in the water and ran continuously (except for brief, planned outages) until the package was recovered in October 2008.
During Phase 2, a cruise to install the ACO general-purpose observatory node planned for October 2007, had to be canceled because of late delivery of faulty (i.e., obviously cracked) titanium pressure cases for the observatory electronics. A rescheduled cruise in October 2008 recovered the proof module and deployed the ACO node (Figure 17.3), but failure of optical dry-mate connectors between the junction box and the observatory mod-ule forced its immediate recovery. The plan had been to install the main ACO infrastruc-
(ADCPs), a vertical thermistor string, two temperature/conductivity sensors (CTDs), and an acoustic modem supplied by Woods Hole Oceanographic Institution (WHOI). The therm-
The ACO sea cable termination and proof module. The proof module with hydrophone and pressure sensor and the seawater ground are on the short mooring that was deployed in February 2007. ROV took this composite image in October 2008

44317.3 Infrastructure
istor string was deployed in an autonomous mode, to record temperatures with sampling for up to three years, but the other systems could not be installed.
Phase 3 consisted of observatory upgrades, testing and deployment. Upgrades were based on lessons learned (e.g., connectors) and new technology (e.g., precise timing). Test-ing was extensive, facilitated by special test connectors and system modularity. Deploy-ment used the RV Kilo Moana and the ROV , with several new instruments including
-gen sensors.
The ACO uses technology from the HUGO and H2O observatories, with improvements based on lessons learned from both (Duennebier et al., 2008), as well as from the Octo-ber 2008 attempted Phase 2 deployment. In the following subsections we describe the Phase 3 system elements (Figure 17.4), making brief reference to changes relative to Phase
The ACO observatory module. ROV took this composite photograph in October2008, just after the module was set on the bottom.

444 The ALOHA cabled observatory
At the AT&T Makaha shore station, the shore power system supplies the single conductor sea cable with a constant 1.6 A at a (negative) voltage that varies depending on load, up
-tor, the sea water is used as the second electrical conductor, with a cathode (positive) just offshore of the shore station and an anode (negative) at the most seaward end of the elec-trical system. AT&T communications equipment provides the interface between the cable system and the Internet through the University of Hawaii (UH) via a dedicated 3 Mb/s line. The interface includes access to the supervisory functions, such as repeater status. A grandmaster clock synchronized to GPS time provides system time at the sub-microsecond level using the precision time protocol (described below). At the seaward end of the cable
hybrid electro-optical wet mateable connector.
In the junction box, an AT&T SL560 regenerator is used to interface to the cable optical
board is used to interface these electrical signals with 100 Mb/s optical Ethernet. In es-sence, the muldex samples the lower data rate Ethernet signal at a higher data rate suitable for the SL560, and vice versa. Details are presented in Tremblay and Duennebier (2006). In Phase 3, the optical Ethernet is connected to a managed industrial Ethernet switch with electrical ports connected to the observatory module and a local time server.
The ACO block diagram for Phase 3, deployed in June 2011.

44517.3 Infrastructure
Precise and accurate time is obtained using the IEEE-1588v2-2008 precise time pro- tocol (PTP) that provides sub-microsecond accuracy and precision over Ethernet. Switches following this protocol append packets to the Ethernet stream that contain the measured time-varying latency within the switch. Further, the drifts of all clocks in the system are monitored and delays through the system are measured many times a second. A PTP client connected to the Ethernet switch provides 1-PPS and IRIG-B signals.
The Ethernet, 1-PPS, and IRIG-B are provided on a 12-pin ROV wet mate connector. Normally, this is connected to the observatory module (as shown in Figure 17.4), but it can also be connected, for example, to the hydrophone experiment module (HEM) so the combination becomes a “proof module” as in Phase 1.
Three power modules based on Zener diodes supply local power for the regenerator/muldex, the Ethernet switch/PTP, and 20 W at 48 V. The high voltage is passed through, provided on a 4-pin ROV wet mate connector. Normally, this is connected to the obser-vatory power supply followed by the anode (seawater electrode) to complete the series circuit. If the junction box is operated by itself or with the HEM, then this is connected to the seawater electrode. The 48 V is supplied on the 12-pin connector, which then has the
Submarine commercial telecommunications cables, such as HAW-4, are single conductor, use the low resistance seawater as the return path, and are double-end powered by shore stations on each end. They operate in constant current, constant power mode for several reasons: robust immunity to single electrical ground faults, and power supplies are simple because loads (the repeaters) are constant.
and voltages vary depending on the requirements of the observatory. To deliver power to an experiment at the ocean-end of such a cable as for ACO, the power available from the cable needs to be converted in two ways: (1) the power delivered to the experiment must be isolated from the voltages on the cable; and (2) the power delivered to the experiment must match the amount required. Such conversions are very common in electronic design. The
and current).
from the source, up to the power handling limits of the converter and delivery capability of the source. Such converters operate as constant power devices. They are designed to handle a relatively wide range of input voltages (2:1 or more) and a much wider range of output currents up to a maximum amount of power. These convertors are quite stable when supplied from a voltage source.
But this constant power mode produces a stability problem when the input power is sup-plied in the form of a constant current. Assume that the convertor is operating at an input voltage and current and thus power that supplies the needed output power, and are within the limits of the convertor. If the needed power increases slightly, the input power must

446 The ALOHA cabled observatory
also increase. So the input current tries to increase. The current increase can be supplied for a short period by discharging the capacitance but this soon results in a drop in the input voltage to the converter. This in turn causes the converter to try to draw even more current from the cable and the voltage rapidly collapses to a low voltage at the constant current.
This instability can be managed by using active current shunts that consume the excess power if the load power decreases. Sensing the input voltage to the converter controls the amount of power consumed by the shunts. If the voltage is higher than desired, the current to the shunts is increased to return the voltage to the correct level. The power consumed by the shunts is converted into heat and passed into the ocean water around the observatory.
series. The observatory hotel and user load is in parallel with the active shunt. The FET can be (relatively) instantaneously controlled so the total current going through the observatory load and through the active shunt (FET + resistor load) is the required constant amount. ACO uses several of these shunts in parallel to distribute the heat and provide redundancy. The active shunts must be designed to be able to consume all the power that can be deliv-ered by the converter when the experiment is turned off or not connected (FET “open” fully
The ACO power supply block diagram. The observatory uses a stack of relatively low-
44717.3 Infrastructure
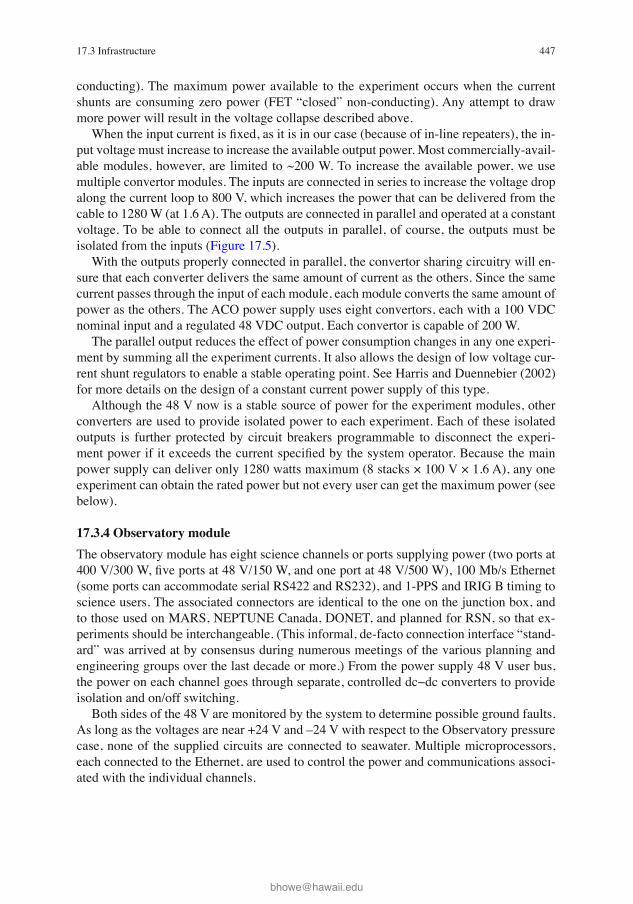
conducting). The maximum power available to the experiment occurs when the current shunts are consuming zero power (FET “closed” non-conducting). Any attempt to draw more power will result in the voltage collapse described above.
-put voltage must increase to increase the available output power. Most commercially-avail-able modules, however, are limited to ~200 W. To increase the available power, we use multiple convertor modules. The inputs are connected in series to increase the voltage drop along the current loop to 800 V, which increases the power that can be delivered from the cable to 1280 W (at 1.6 A). The outputs are connected in parallel and operated at a constant voltage. To be able to connect all the outputs in parallel, of course, the outputs must be isolated from the inputs (Figure 17.5).
With the outputs properly connected in parallel, the convertor sharing circuitry will en-sure that each converter delivers the same amount of current as the others. Since the same current passes through the input of each module, each module converts the same amount of power as the others. The ACO power supply uses eight convertors, each with a 100 VDC nominal input and a regulated 48 VDC output. Each convertor is capable of 200 W.
The parallel output reduces the effect of power consumption changes in any one experi-ment by summing all the experiment currents. It also allows the design of low voltage cur-rent shunt regulators to enable a stable operating point. See Harris and Duennebier (2002) for more details on the design of a constant current power supply of this type.
Although the 48 V now is a stable source of power for the experiment modules, other converters are used to provide isolated power to each experiment. Each of these isolated outputs is further protected by circuit breakers programmable to disconnect the experi-
power supply can deliver only 1280 watts maximum (8 stacks × 100 V × 1.6 A), any one experiment can obtain the rated power but not every user can get the maximum power (see below).
The observatory module has eight science channels or ports supplying power (two ports at
(some ports can accommodate serial RS422 and RS232), and 1-PPS and IRIG B timing to science users. The associated connectors are identical to the one on the junction box, and to those used on MARS, NEPTUNE Canada, DONET, and planned for RSN, so that ex-periments should be interchangeable. (This informal, de-facto connection interface “stand-ard” was arrived at by consensus during numerous meetings of the various planning and engineering groups over the last decade or more.) From the power supply 48 V user bus,
isolation and on/off switching. Both sides of the 48 V are monitored by the system to determine possible ground faults.
As long as the voltages are near +24 V and –24 V with respect to the Observatory pressure case, none of the supplied circuits are connected to seawater. Multiple microprocessors, each connected to the Ethernet, are used to control the power and communications associ-ated with the individual channels.

448 The ALOHA cabled observatory
-ration, the highly reliable junction box can remain in place with the proof module (or any other low power experiment) if the observatory node needs to be recovered. If expansion of the system is required, a new observatory/power supply module can be inserted between the current junction box and the observatory frame without recovery of any in-place mod-
Secondly, by converting the optical Ethernet (the output of the muldex) immediately to electrical form in the junction box, the need for downstream optical connectors is elimin- ated. The third change makes use of the new PTP capability (mentioned above) that greatly
Lastly, several other problems associated with cable and connector assemblies were
The manufacturer has now provided alignment guides to mitigate this problem. Once the connection is made between the junction box and the sea cable, the connection should (ideally) never need to be broken again, thereby reducing future risk. Further, since 2005 when the original cable/connector assemblies were made, the manufacturer has instituted new practices and testing procedures that will reduce overall risk associated with cable and connector assemblies.
All exposed metal components of the observatory are titanium. In most cases, bulkhead
-nectors, as well as between wet mate connectors on the observatory frame, the junction box frame, and the sea cable termination. This modularity permits parallel independent testing of the various components.
Data management and archiving, along with interactive control to facilitate adaptive sampling, are essential elements of an ocean observatory and will be developed for ACO during Phase 3. Our experience to date indicates that the efforts associated with data man-
should not be underestimated.
The motivation for deploying the ACO infrastructure is to conduct research that cannot -
search questions have been posed that only measurements from the ACO can uniquely and cost-effectively address. There are also engineering research and development issues that can be addressed within the framework of the ACO, some related to observatory infra-
will be raised by the exploratory measurements made via the ACO are equally important.

44917.4 Research
essential that there be initial research returns from that effort. Given the long lead time for designing, proposing, obtaining funding, and the ship and ROV scheduling needed to add experiments to the ACO, a “core” set of measurements will be made as part of the ACO deployment. These core measurements will serve the multiple purposes as outlined above, and will also provide a long time-series context for subsequent observatory-based experi-ments. The core measurements are summarized in Table 17.1. An example of what might be expected for the basic core measurement of salinity and temperature is given in Figures 17.6 and 17.7 (updated from Lukas and Santiago-Mandujano, 1996). In Figure 17.6, the in-creasing trend in abyssal salinity as measured by the HOT program is shown along with the high frequency variations around the trend. The relatively recent freshening of this water mass (Nosse et al., 2012) may be related to Rossby waves associated with the 2007–2009
-
Maui Deep over the shallower ridge of the Nuuanu Seamounts into the Kauai Deep, where Station ALOHA is located. The long recovery time from cold events is due to relatively slow vertical turbulent diffusion of heat. Note there is no obvious correspondence of salin-
record that can not be resolved by the sparse shipboard sampling.
Observed deep salinity variation and trend. The inverted triangles near the time axis indicate the start of cold events shown in Figure 17.7.

450 The ALOHA cabled observatory
The ACO node frame is deployed with two upward looking ADCPs and a MicroCAT
nected to the main observatory node pressure case. There are two co-joined 200m-high cabled components (on separate experiment ports) integrated into the thermistor array/acoustic modem (TAAM) mooring system. One cabled component is a 10-element ther-
communicating in both directions through the ACO via an inductive modem; the second provides power to and two-way communications with a 10 kHz WHOI micro-modem sys-tem. The acoustic micro-modem will communicate with nearby autonomous systems such
12-pin connector, so it can connect either to the junction box as a proof module or to an ex-periment port on the observatory node (the hydrophone experiment module, HEM). It now has two hydrophones separated by 1.2m with combined effective bandwidth of 0.01 Hz to 40,000 Hz; sampling rate can be remotely selected up to 192 kHz. A secondary node with
Sensors Comments
Thermistor array/acoustic modem (TAAM) mooring from
Seabird SBE37 thermistors 10 equally spaced (2 w/pressure)
(chlorophyll) and backscatter (turbidity)WHOI 10 kHz micro-modem
A physically coupled dual mooring. Battery-operated thermistor array and
the ACO using Seabird inductive modem. The thermistors also record internally. The modem is directly connected to the observatory.
Camera frame CAM AXIS 214 PZT color video camera2 LED Multi SeaLites lightsHydrophone
Internet surveillance camera in 17in polished glass sphere.
Observatory node OBS Conductivity/temperature CT Seabird 37 (un-pumped) 2 Sontek 250 kHz ADCP
On top of node frame; CTD swings outboard for some horizontal separation from the electronics.
Hydrophone experiment module (HEM)
Two hydrophones, bandwidth
HzDigiquartz pressure, 16 Hz
On separate sled, can work directly off junction box (as proof module during deployment), or standard science connector on node (switched over after node deployment).
AMM secondary node 2 Seabird 52/43MP CTDO2
Wetlabs FLNTU Primary sensorsConnected to a SIIM, AMM node and then to the OBS.
ACO core measurements.

45117.4 Research
video camera with lights and another hydrophone also sits on a tripod nearby. An example of an engineering issue to be addressed is the utility of acoustic Doppler
concentration climatology of the backscattering particles needed to obtain reasonably
obtained. The two ADCPs will allow us to conduct exploratory measurements for the de-sign of future abyssal current measurements. Optical measurements will help quantify the backscattering particle density, which may be variably related to near-surface productivity events and to strong near-bottom current events that suspend sedimentary materials.
Another engineering issue concerns the calibration stability of conductivity sensors de-ployed near the bottom. Can the relatively small, but important, salinity signals that are
Will the accumulation of sediments be an important factor?An important engineering unknown for future observatory design that needs to be ex-
given by color bar on right side) at Station ALOHA in the depth-time domain (bottom panel) from
one month apart, are indicated along the time axis. The sill depth of the Nuuanu Seamounts ridge is indicated by a horizontal line; the ocean bottom is indicated by the solid black area. Potential
panel.

452 The ALOHA cabled observatory
listened to with the dual hydrophones that are proposed as part of the core sensor suite, while the micro-modem can receive direct signals from other sources, such as ships, gliders
-tions.
The ACO core measurements should be of broad interest, not just related to a current
hypotheses that may motivate new experimental proposals. Given the need to site an -
cating temperature sensors to the riser cable will provide the vertical structure of tempera-ture variations around the ACO increasing the spatial footprint of measurements. The cold
are likely important (e.g., Figure 17.7; Lukas et al., 2001; see more recently Alford et al.,
require commanding hibernation and awakening adaptively for event sampling, a compel-ling topic of research in itself.
Bio-optical sensors on the riser cable and on the ACO itself will help to quantify the scattering particle density, which will aid the interpretation of ADCP return intensity var-iations, and will help understand the CTD calibration changes due either to particle fall events that may be associated with near-surface productivity blooms, or to resuspension of
-tion of particles and enable estimation of currents as the particles are advected within the
near-surface productivity blooms will be studied (see Figure 17.8).The dual hydrophones will provide redundancy and some level of directionality to the
acoustic measurements that have already been shown to be of interest to widely separated
level will be measured directly, and the acoustic spectrum will provide useful constraints on the sea surface elevation spectrum. Signals from earthquakes, tsunamis, and human ac-tivities will provide information about the solid earth that will be exploited. Marine mam-mal acoustic signatures are already the focus of several research groups using the data obtained from the proof module deployment (Oswald et al., 2009, and Ou et al., 2012).
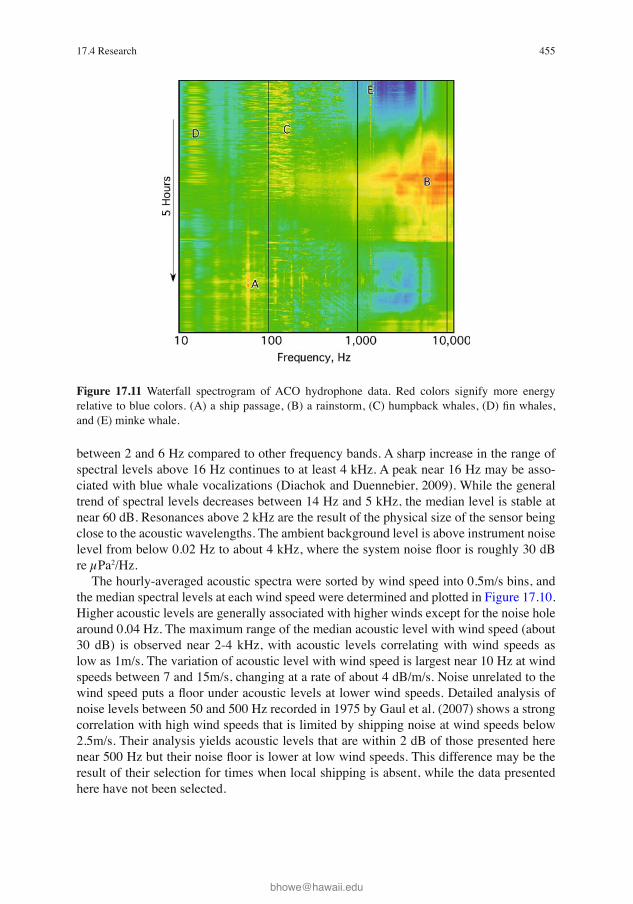
Because the acoustic data collected during Phase 1 has proven to be exceptionally rich, we provide some detail here. Data were collected for ~20 months from February 2007 to October 2008. 1.5-minute time samples of 24 kHz were sampled from the data every 5 minutes to provide power spectral densities of the acoustic data from 0.0114 Hz to 10 kHz (6 decades in frequency, 20 octaves). The 12 spectra obtained each hour were averaged to provide hourly spectra. The statistics of the ambient sound and the dependence on wind speed using these spectra are given in Figures 17.9 and 17.10, respectively.
The acoustic data span more than 150 dB in energy level. The log of the number of samples at each frequency with a particular energy level (“sample density”) is contoured in Figure 17.9, allowing visualization of measurements from a single hourly observation in the 20-month period to over a thousand observations. The highest energy levels are ob-served at the microseism peak near 0.2 Hz. Note the relatively low range of spectral values

45317.4 Research
Deep export events. A composite of key environmental variables observed at Station
Hawaii Ocean time-series cruises (closed blue circles) and the red trend lines are 3-point mean values for each parameter. The data in [C] and [D] were collected in bottom-moored time-series sediment traps. The lightly shaded period in [C] and [D] corresponds to the period 15 July–15 August when

454 The ALOHA cabled observatory
ACO acoustic level and wind speed. Sorted spectra are plotted by color in 0.5m/s steps from zero to 15m/s with heavy lines for even wind speeds from zero (dark blue) to 14m/s (red). (From Duennebier et al., 2012.)
ACO acoustic spectrum. Histogram of occurrences of all hourly acoustic data from 0.0145 Hz to 10 kHz. Colors represent the log of the number of hours where each level was observed at each frequency. (From Duennebier et al., 2012.)
45517.4 Research
between 2 and 6 Hz compared to other frequency bands. A sharp increase in the range of spectral levels above 16 Hz continues to at least 4 kHz. A peak near 16 Hz may be asso-ciated with blue whale vocalizations (Diachok and Duennebier, 2009). While the general trend of spectral levels decreases between 14 Hz and 5 kHz, the median level is stable at near 60 dB. Resonances above 2 kHz are the result of the physical size of the sensor being close to the acoustic wavelengths. The ambient background level is above instrument noise
re μPa2/Hz.The hourly-averaged acoustic spectra were sorted by wind speed into 0.5m/s bins, and
the median spectral levels at each wind speed were determined and plotted in Figure 17.10. Higher acoustic levels are generally associated with higher winds except for the noise hole around 0.04 Hz. The maximum range of the median acoustic level with wind speed (about 30 dB) is observed near 2-4 kHz, with acoustic levels correlating with wind speeds as low as 1m/s. The variation of acoustic level with wind speed is largest near 10 Hz at wind speeds between 7 and 15m/s, changing at a rate of about 4 dB/m/s. Noise unrelated to the
noise levels between 50 and 500 Hz recorded in 1975 by Gaul et al. (2007) shows a strong correlation with high wind speeds that is limited by shipping noise at wind speeds below 2.5m/s. Their analysis yields acoustic levels that are within 2 dB of those presented here
result of their selection for times when local shipping is absent, while the data presented here have not been selected.
Waterfall spectrogram of ACO hydrophone data. Red colors signify more energy
and (E) minke whale.

456 The ALOHA cabled observatory
Figure 17.11 shows a representative sample of ambient sound, including various whales,
that are observed in the hydrophone data (Farrell and Munk, 2008; Duennebier et al., 2012), as well as seismic signals from various sources (Figure 17.12).
While we do not know the full variety of innovative ideas that will be proposed to take advantage of the ACO infrastructure, we provide some examples of viable future experi-mental research activities that have been extensively discussed. They illustrate the trans-formative nature of the observatory approach to deep ocean research.
.tested in shallow water (ALOHA-MARS mooring (AMM); Howe et al., 2010). A similar if not identical mooring system will be proposed for installation at ACO to address numerous
installed an autonomous battery powered (two 0.8m steel spheres with alkaline batteries)
AMM. This mooring was deployed in June 2012 with enough on-board energy to run -
municate. First is an acoustic modem that can “talk” with the ACO acoustic modem and hydrophones as well as with the ship during routine ALOHA-HOT visits. The second is via a small, slack tethered surface buoy with GPS, Iridium and FreeWave radio. Ultimately,
physical, chemical, and biological quantities over the entire water column. This will even-tually allow shifting some of the burden of the routine HOT sampling to this automated system (with much improved sampling), freeing the human and ship resources to focus
. The absolute pressure sensor in the Phase-1 system had a resolution of better than 5mm of equivalent sea level, enough to detect a small tsunami, although none were

45717.4 Research
The ALOHA mooring sensor network. The lightly shaded area indicates the 2003 proposed moored sensor network. A similar mooring system has been developed as part of the ALOHA-MARS mooring project.

458 The ALOHA cabled observatory
observed during the recording period. A potential problem of using pressure sensors for tsunami detection is that the pressure signal from seismic Rayleigh waves generated by tsu-
ocean depth in amplitude at the expected time of arrival of a tsunami. Obscuration of the
Tsunami detection might be improved with near-bottom current measurements, since the horizontal motion of the water column (above the benthic boundary layer) is expected to be far larger than the vertical motion during a tsunami. This hypothesis is one of the moti-vations for installing both a pressure sensor and ADCP at the ACO.
. One of the most useful and robust sensor systems that can be installed at the ACO is a hydrophone array. In addition to surface environmental studies discussed above, it would be used for tracking whales, ships, and moving acoustic sources near the ACO. Although the bottom is below the critical depth of the SOFAR channel (varies sea-sonally between 0 and 200m off the bottom), we are able to hear ships from as far away
but, in the meantime, the two hydrophones that are already installed can provide crude directionality information.
Since writing the main body of this paper in 2010, the ACO node was successfully installed in June 2011 and is currently operating. Details of the installation can be found in Howe et al., 2011. The comprehensive website provides a complete description of the system and real-time data and plots (aloha.manoa.hawaii.edu).
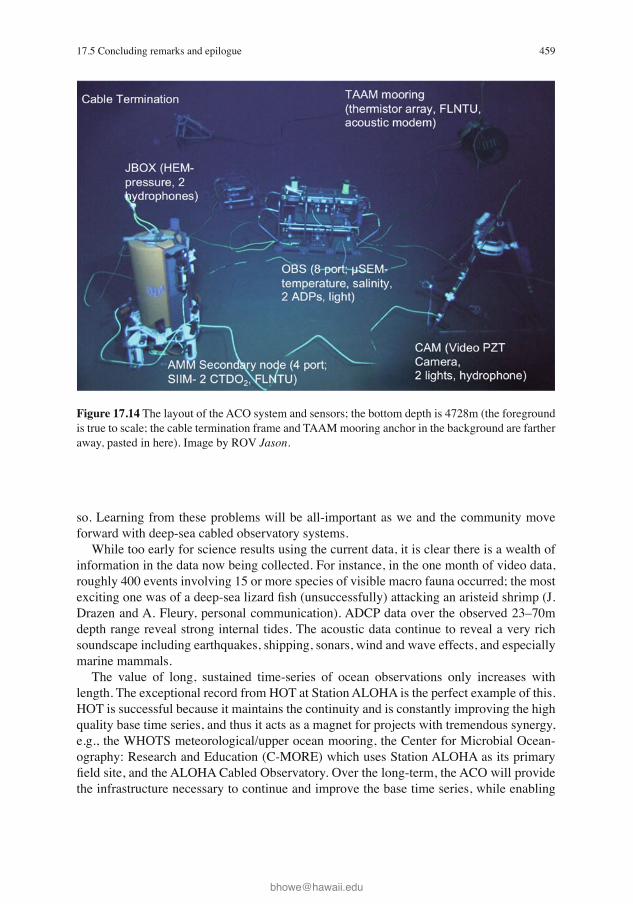
Figure 17.14 is a composite image of the installed system on the bottom as observed by ROV . Shown are the various components that have been described above. The
the sensors and sensor network infrastructure. Sensors delivering data in real time are:
hydrophone experiment module) on the JBOX frame. The temperature and conductivity sensors on the OBS are (as expected) occasionally contaminated by heat from the elec-tronics beneath. The pressure sensor after a year began to exhibit large step changes and drift. One ADCP is exhibiting excessive noise. The video camera is working, but the lights failed after a few weeks (we suspect a control circuit and a power supply) and the associ-ated hydrophone is not functioning. The 10-element thermistor array extending 200m into the water column is recording data internally but with no connection to the observatory because a dry-mate connector failed during deployment. Ground faults have disabled the WHOI acoustic micro-modem and the AMM secondary node, and thus the science instru-
replacement/repair of the non-functional instruments will take place over the next year or
45917.5 Concluding remarks and epilogue
so. Learning from these problems will be all-important as we and the community move forward with deep-sea cabled observatory systems.
While too early for science results using the current data, it is clear there is a wealth of information in the data now being collected. For instance, in the one month of video data, roughly 400 events involving 15 or more species of visible macro fauna occurred; the most
Drazen and A. Fleury, personal communication). ADCP data over the observed 23–70m depth range reveal strong internal tides. The acoustic data continue to reveal a very rich soundscape including earthquakes, shipping, sonars, wind and wave effects, and especially marine mammals.
The value of long, sustained time-series of ocean observations only increases with length. The exceptional record from HOT at Station ALOHA is the perfect example of this. HOT is successful because it maintains the continuity and is constantly improving the high quality base time series, and thus it acts as a magnet for projects with tremendous synergy, e.g., the WHOTS meteorological/upper ocean mooring, the Center for Microbial Ocean-ography: Research and Education (C-MORE) which uses Station ALOHA as its primary
the infrastructure necessary to continue and improve the base time series, while enabling
The layout of the ACO system and sensors; the bottom depth is 4728m (the foreground is true to scale; the cable termination frame and TAAM mooring anchor in the background are farther away, pasted in here). Image by ROV .
460 The ALOHA cabled observatory
questions. With the successful deployment of the ACO node, the community is expected to re-
spond with new designs for experiments to use the system. A benthic monitoring system to
(MBARI). The authors and colleagues will be proposing to extend the spatial footprint of
velocity), pressure, and inverted echosounder) and gliders; the latter will not only sample the ocean directly, but provide “data mule” service for the HPIES and other autonomous instruments in the area. Active and passive acoustics will also be proposed to extend the footprint to basin scale á la the Acoustic Thermometry of Ocean Climate (ATOC) project (Dushaw et al., 2009).
In the longer timeframe we envision the AUV docking stations mentioned in the in-troduction, with vehicles performing maintenance tasks as well as science missions. For acoustics, the precise and accurate timing will be essential in simultaneously serving navi-gation, communications, and science needs. Further, the observatory will be used in educa-tion and outreach to the public; the real-time data including video and audio are expected to be very useful in this regard.
The ACO will be one of the few sites in the global ocean that can provide sustained low-maintenance observations, and the only one at such water depth, 4728m. As already
-
science use but also as an engineering test bed for deep-sea operations, is essential. The ACO is a proof-of-concept system for cable re-use. The existence of 10s of thou-
other commercial cable systems are a potential resource for marine science. Several of these cables go through regions of interest, such as south of the Aleutian Islands, and across the equator to New Zealand, where they could be effectively utilized in place. In many cas-es, the precise location is less important than the supply of reliable power and communica-tions. These systems offer potentially lower operational costs and far more data bandwidth and electrical power than autonomous buoy observatories and should be considered by the research and operational oceanography communities.
The ALOHA Cabled Observatory project has been and is funded by the National Science Foundation, awards OCE-0652430, OCE-0939570 and OCE-1239637. This project would not have been possible without the cooperation and assistance of Mark Tremblay, AT&T retired, and the team at the University of Hawaii: James Babinec, Grant Blackinton, Bri-an Chee, Michael Cole, William Doi, Joseph Gum, David Harris, Zensho Heshiki, James Jolly, Fernando Santiago-Mandujano, Kimball Millikan, Jefrey Snyder, and Mario Wil-liamson. The Monterey Bay Aquarium Research Institute (MBARI) provided invaluable assistance with data management software (SSDS and SIAM) and general advice about
Steve Etchemendy, Kevin Gomes, Robert Herlion, and Tom O’Reilly. The support of the
461References
University of Hawaii, the Research Corporation of the University of Hawaii, AT&T (in-cluding Wayne Yamamoto and team at the Makaha Cable Station), Tyco Telecommunica-tions, Joint Oceanographic Institutions, Inc., the U.S. Navy, the technical team from the MSC SMS Detachment at NWSY, Cheatham Annex, Williamsburg VA, the captains and crews of the R/V Thompson and R/V Kilo Moana and Matt Heintz and the ROV team, and the advice and encouragement of many others is greatly appreciated.
ATOC Instrumentation Group: Howe B.M., Anderson S.G., Baggeroer A., Colosi J.A., Hardy K.R., Horwitt D., Karig F., Leach S., Mercer J.A., Metzger K., Jr., Olson L.O., Peckham D.A., Reddaway D.A., Ryan R.R., Stein R.P., von der Heydt K., Watson J.D., Weslander S.L. and Worcester, P.F. (1995) Instrumentation for the Acoustic Thermometry
Proceedings, Oceans ‘95, MTS/IEEE, October 9–12, San Diego, CA, 1483–1500.
Alford M.H., Lukas R., Howe B.M., Pickering A. and Santiago-Mandujano F. (2011)
Res. Lett. 38, L15606, doi: 10.1029/2011GL048075.
Bidigare R.R., Chai F., Landry M.R., Lukas R., Hannides C.C.S., Christensen S.J., Karl D.M., Shi L. and Chao Y. (2009) Subtropical ocean ecosystem structure changes forced
Diachok O. and Duennebier F. (2010) Blue whale vocalizations and the seasonal variability of ambient noise levels at the Aloha Observatory. J. Acoust. Soc. Am. 127, 1784.
Dore J.E., Lukas R., Sadler D.W., Church M.J. and Karl D.M. (2009) Physical and
Nat. Acad. Sci. USA, 10.1073/pnas.0906044106.
Duennebier F.K., Harris D., Jolly J., Caplan-Auerbach J., Jordan R., Copson D., Stiffel K., Babinec J. and Bosel J. (2002) HUGO: The Hawaii Undersea Geo-Observatory. IEEE J.
Duennebier F., Harris D. and Jolly J. (2008) ALOHA cabled observatory will monitor
Duennebier F.K., Lukas R., Nosal E.-M., Aucan J. and Weller R. A. (2012) Wind, waves, and acoustic background levels at Station ALOHA. J. Geophys. Res. 117, C03017, 21pp., doi:10.1029/2011JC007267.
Dushaw B.D., Worcester P.F., Munk W.H., Spindel R.C., Mercer J.A., Howe B.M., Metzger K., Jr., Birdsall T.G., Andrew R.K., Dzieciuch M.A., Cornuelle B.D. and Menemenlis
Res. 114, C07021, 24pp., doi:10.1029/2008JC005124.

462 The ALOHA cabled observatory
surface waves? Geophys. Res. Letts. 35, L19605.
Forrester N.C., Stokey R.P., von Alt C., Allen B.G., Goldsborough R.G., Purcell M.J. and Austin T.C. (1997) The LEO-15 long-term ecosystem observatory: Design and installation. Proc. IEEE Oceans’97 2, 1082–1088.
Harris D.W. and Duennebier F.K. (2002) Powering cabled ocean-bottom observatories.
Howe B.M., Kirkham H. and Vorpérian V. (2002) Power system considerations for undersea observatories. IEEE J. Oceanic Engr. 27, 267–274.
Howe B.M., Chao Y., Arabshahi P., Roy S., McGinnis T., Gray A. (2010) A smart sensor web for ocean observation: Fixed and mobile platforms, integrated acoustics, satellites and predictive modeling. IEEE J. of Selected Topics in Applied Earth Observations and Remote Sensing, doi: 10.1109/JSTARS.2010.2052022.
Howe B.M., Lukas R., Duennebier F. and Karl D. (2011) ALOHA cabled observatory installation. OCEANS 2011, Kona, Hawaii, 19–22 Sept. 2011.
cables: Evolutionary development leading to the ALOHA Cabled Observatory. Mains’l
Karl D.M. and Lukas R. (1996) The Hawaii Ocean Time-series (HOT) program:
Karl D.M., Dore J.E., Lukas R., Michaels A.F., Bates N.R. and Knap A. (2001) Building
Lukas R. and Santiago-Mandujano F. (2001) Extreme water mass anomaly observed in the
Lukas R., Santiago-Mandujano F., Bingham F. and Mantyla A. (2001) Cold bottom water events observed in the Hawaii Ocean time-series: Implications for vertical mixing.
Nosse C.T., Santiago-Mandujano F., Lukas R.B., Dore J.E., Weller R.A. and Plueddemann A.J. (2012) Recent strong interannual variation disrupted pycnocline and abyssal salinity trends at Station ALOHA. Eos Trans. AGU, Ocean Sci. Meet. Suppl., PosterID: A0189.
Oswald J.N., Au W.W.L. and Duennebier F. (2011) Minke whale (Balaenoptera acutorostrata) boings detected at the Station ALOHA Cabled Observatory. J. Acoust.
Ou H., Au W.W.L. and Oswald J. (2012) A non-spectrogram-correlation method of automatically detecting minke whale boings. J. Acoust. Soc. Am. 132, 4, EL317-EL322, doi:10.1121/1.4747816.

463References
Petitt R., Harris D., Wooding B., Bailey J., Jolly J., Hobart E., Chave A., Duennebier F., Butler R., Bowen A.D. and Yoerger D.R. (2002) The Hawaii-2 Observatory. IEEE J.
Tremblay M.D. and Duennebier F.K. (2006) Format and bit rate independent Proceedings of
, Marine Institute, Dublin, Ireland,pp.182–185.